Drugs, Health Technologies, Health Systems
Health Technology Review
Trends in CT Exam Volumes Between 2007 and 2022–2023 in Canada
Key Messages
What Is the Issue?
Canada’s Drug Agency (CDA-AMC) received a request to analyze CT exam volume trends over a 16-year period to inform policy decisions related to diagnostic imaging capacity and access. Because CT scans play a key role in diagnostics, growing demand may impact imaging services, wait times, and access.
With the number of CT units growing from 419 in 2007 to 560 in 2022–2023, there is a need for analysis to better understand how this growth aligns with current demand and evolving clinical needs.
Demand may be influenced by emerging clinical applications, such as biopsies, drainages, and other interventional uses of CT as well as changing population needs, available health care resources, and advancements in medical practices.
Analyzing trends in overall and per capita exam volumes will provide insights to guide strategic decisions regarding resource allocation, workforce development, and potential expansion of diagnostic imaging capacity.
What Did We Do?
We examined trends in both total (absolute) and per capita (relative) CT exams using data from the Canadian Institute for Health Information (CIHI) and the Canadian Medical Imaging Inventory (CMII) — collected at 7 intervals between 2007 and 2022–2023. This also included reviewing the total number of CT units and CT units per capita.
The analysis focused on 11 jurisdictions that maintained consistent CT capacity throughout the entire period. The results show how the use of CT machines has evolved nationwide.
What Did We Find?
Between 2007 and 2022–2023, there was growth in CT exam volumes across Canada, although this growth was not consistent every year:
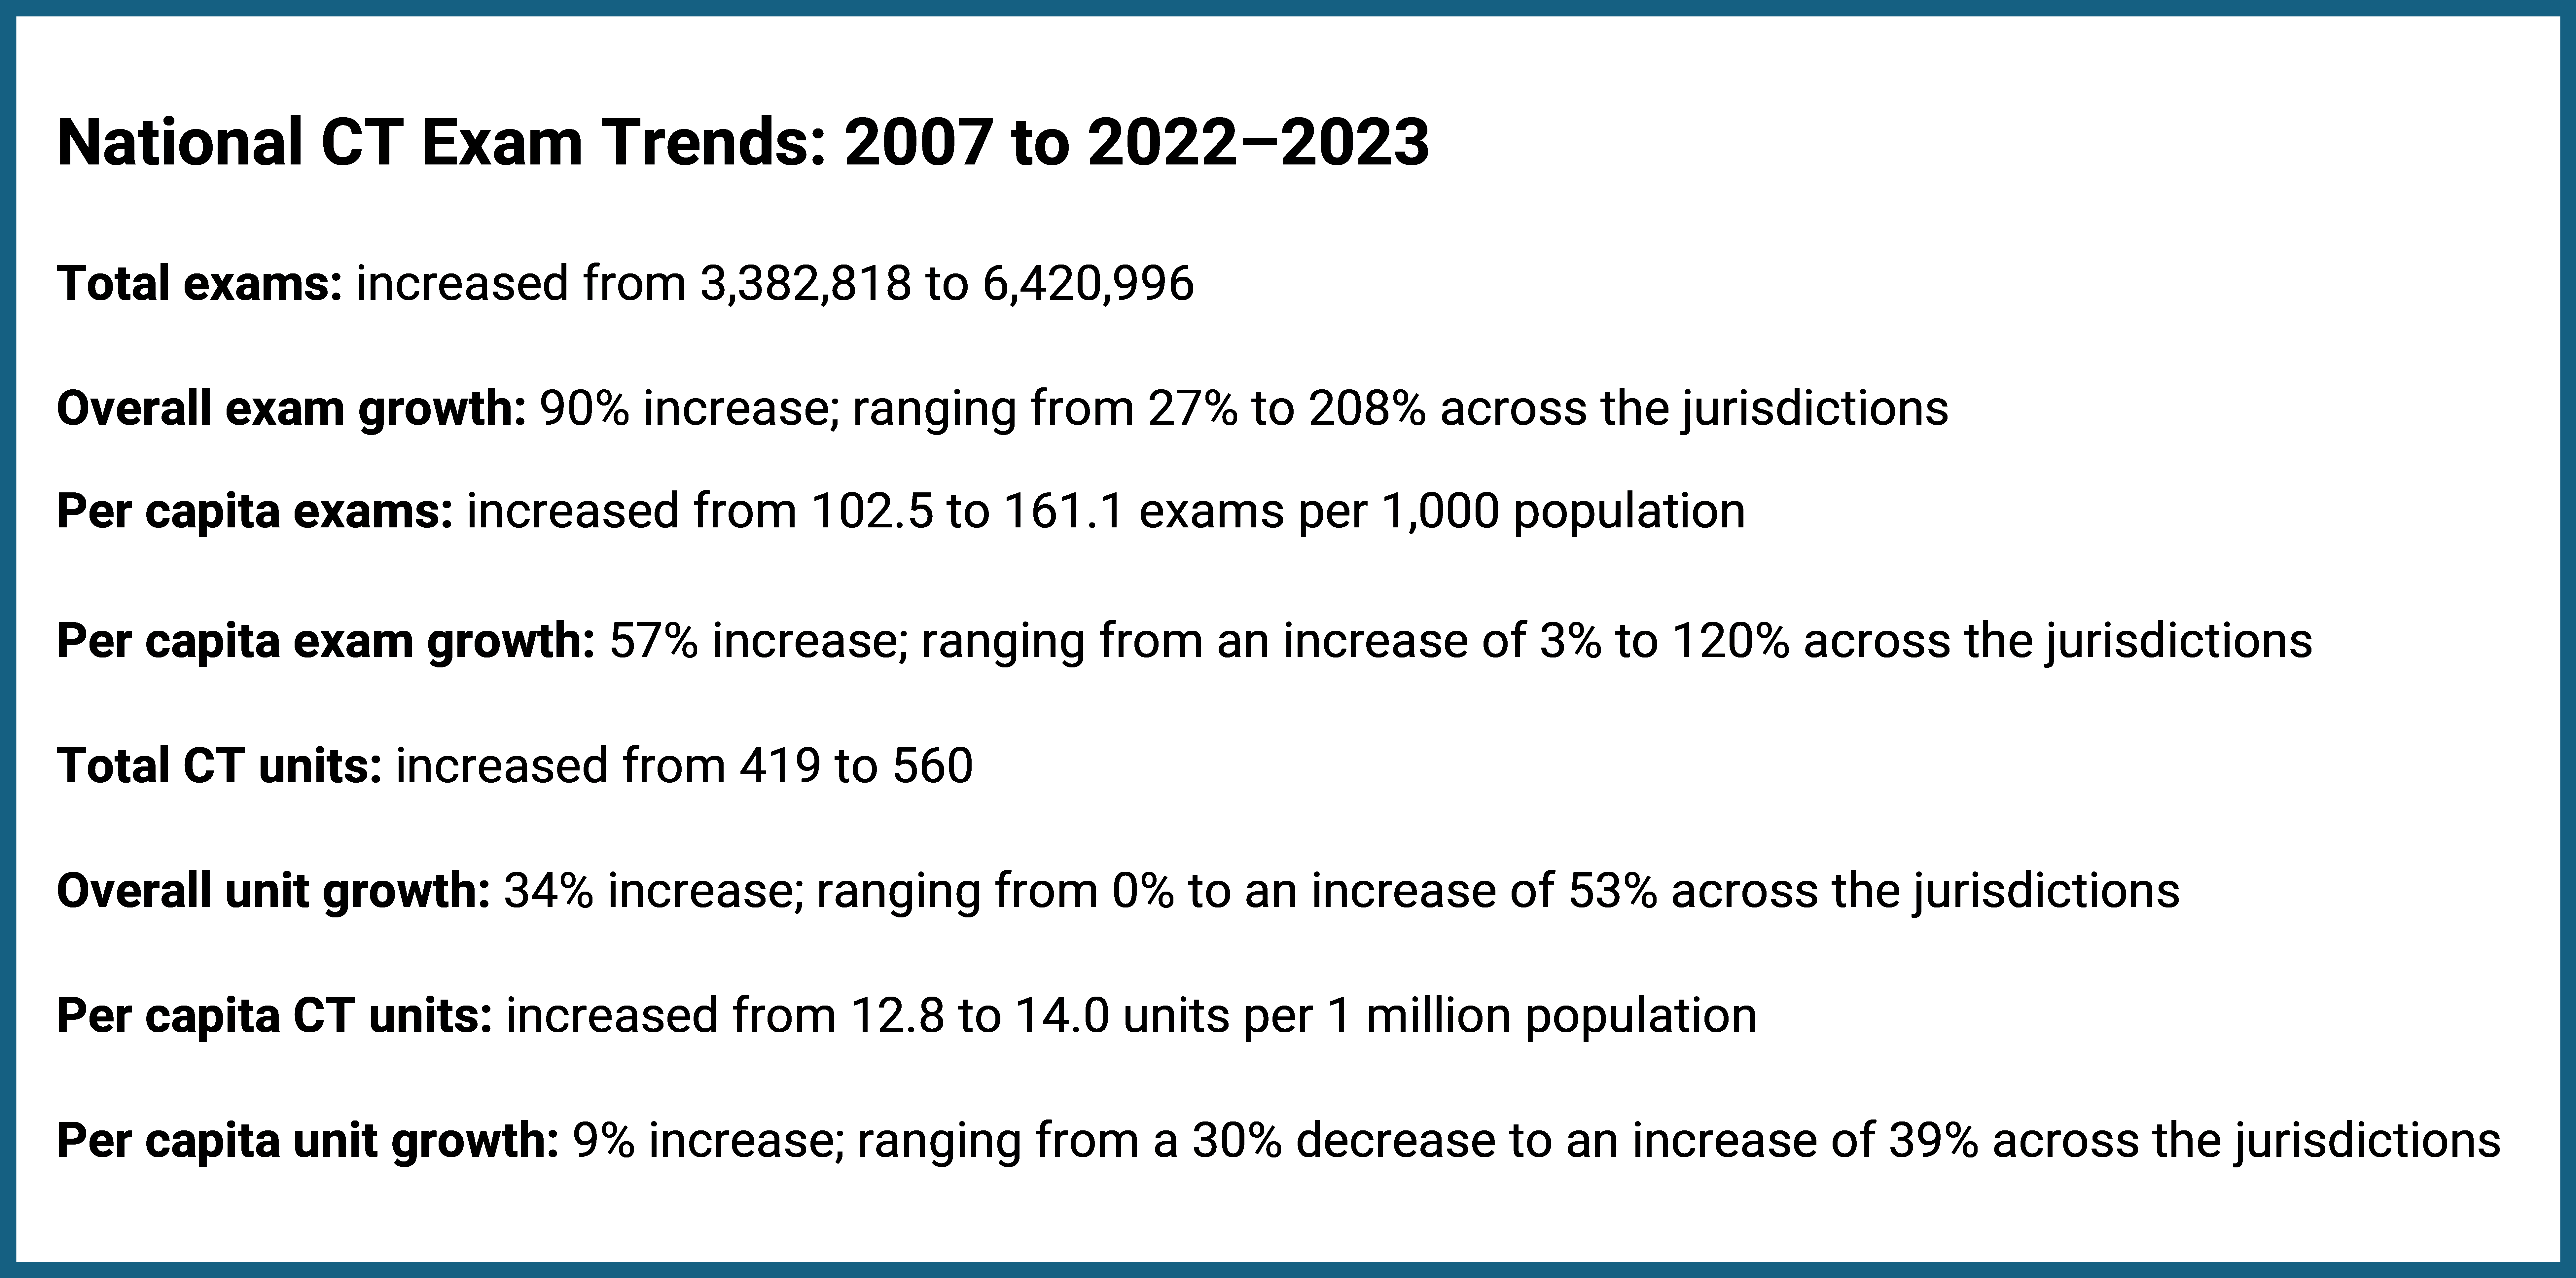
Total CT exam volumes increased from 3.38 million to 6.42 million, reflecting a national growth of 90%.
Total CT exam volumes per thousand people increased from 102.5 to 160.2, representing a national increase in volume of 57%.
CT exam growth varied across jurisdictions, with total exam increases ranging from 27% to 208%, and per capita volumes experiencing an increase of 10% to 120%.
When comparing the growth in the jurisdictions to the national average between 2007 and 2022–2023, most jurisdictions saw their overall and per capita CT exam volumes rise above the national average.
What Does This Mean?
This report suggests that CT is being used more often, and the role of CT continues to evolve.
Given the increasing use of CT, decision-makers may wish to consider capacity challenges and ensure that existing CT and supporting technologies, workflows, and processes are used with more efficiency.
Addressing these areas may help reduce wait times, support recruitment and retention efforts, and ensure sufficient capacity to meet future demand. The variation in exam rates across jurisdictions highlights the importance of tailoring solutions to local needs and contexts.
The insights gained from this report can inform strategic decisions related to resource allocation, workforce development, and alignment of diagnostic imaging capacity with evolving health care needs.
Context
CT is among the most widely used advanced imaging modalities in Canada and plays a crucial role in diagnosing a broad spectrum of medical conditions, from cancers to traumatic injuries.1,2 Over the past 16 years, the demand for CT has steadily increased, highlighting its growing importance in modern health care. This trend is driven by advances in medical technology, an increased reliance on imaging for accurate and timely diagnoses, and the expanding needs of an aging population with greater health care needs.3
This report examines both absolute (overall) and relative (per capita) growth in CT exam volumes. Absolute values represent the total number of exams performed, whereas relative values show how usage is changing, after adjusting for population size and other variables. Both absolute and relative values change in relation to various influencing factors. These may include:
population changes
shifts in health care use
technological advances
equitable resource distribution across jurisdictions
policy changes.
However, caution is needed when interpreting per capita figures in Canada. The country's vast geography and uneven population distribution mean that access to health care can vary greatly between rural, urban, and remote areas. As a result, per capita numbers may not fully capture regional differences in service availability or demand.4 Additionally, this report does not analyze CT exam volumes by geographic setting, and therefore does not reflect the differing service demands across these regions.5
This analysis reports on the trends in CT exam volumes across jurisdictions in Canada over a 16-year period. As of 2022–2023, Canada had a total of 560 CT units, with at least 1 unit in each jurisdiction — an increase from 419 units in 2007.6,7 Historically, CT technology has been used in traditional imaging, such as for the diagnosis of stroke, vascular disease, cancer, trauma, acute abdominal pain, and diffuse lung diseases.8 However, it is now also being used in cancer care for CT simulation, and in interventional radiology for procedures like biopsies and drainages, underscoring the expanding role of CT in both diagnostic and therapeutic applications.9 Therefore, expanding imaging capacity in areas where it most improves patient outcomes can help meet growing demand while preserving efficient care.
Objective
The purpose of this report is to summarize information on CT exam volume trends (overall and per capita) at a national, provincial, and territorial level between 2007 and 2022–2023.
About This Document
This document summarizes information gathered through the CMII, a national survey on advanced medical imaging equipment. Between 2007 and 2012, CIHI conducted this national survey.10,11 Since 2015, CDA-AMC (previously the Canadian Agency for Drugs and Technologies in Health) has continued to conduct the CMII national survey approximately once every 2 years.7,12-16
This report analyzes the trends in CT exam numbers in Canada from 2007 to 2022–2023, focusing on both absolute (i.e., overall exam volumes) and relative metrics (i.e., per capita) to provide insights into the evolving health care landscape.17
Exams are reported per thousand population, and units are reported per million population, both standardized on a per capita basis to account for population size differences across jurisdictions.
Statistics Canada’s population estimates7 were used to calculate the number of exams per 1,000 population (per capita) and units per million population (per capita).
The overall average growth was calculated using the mean, which helps identify general trends of the CT exams, whereas median growth was calculated to better represent the data and maintain consistency if there are a few very high or very low values.
An imaging exam refers to a single medical imaging session using an imaging modality to study 1 (or more than 1) body structure, body system, or anatomic area that yields 1 or more views for diagnostic and/or therapeutic purposes.18
Results
CT Exam Growth in Canada (2007 to 2022–2023)
This report documents the growth trends of CT exams in Canada from 2007 to 2022–2023, using both overall and per capita values, at national and jurisdictional levels. Figures 1 through 24 and Table 1 and Table 2 (in Appendix 1) summarize the number of overall and per capita CT exams in Canada and its jurisdictions, capturing only those with capacity throughout the entire period. Table 3 and Table 4 (in Appendix 1) show the total number of CT units for each jurisdiction and the CT units per million population.
National Growth Trends
Between 2007 and 2022–2023, the volume of CT exams experienced substantial growth, likely driven by broader access, rising demand, and the evolving role of CT across Canada.
Over the 16-year period, Canada’s total CT exam volume increased by 90%, whereas there was a slower increase in the average per capita growth, at 57%.
The median growth in overall CT exam volume was 98%, indicating that half of the jurisdictions nearly doubled their exam volume, with increases ranging from 98% to 208%, whereas the other half experienced increases below the median, ranging from 27% to 54%.
Similarly, the median growth of per capita exams was 62%, meaning that half of the jurisdictions experienced growth at or above this level, ranging from 62% to 120%, whereas the other half experienced growth lower than the median, ranging from 3% to 47%.
During this period, the total number of CT units grew from 419 to 560 (34% increase), whereas the unit per capita increased from 12.8 to 14.0 (9% increase) (Appendix 1, Table 4).
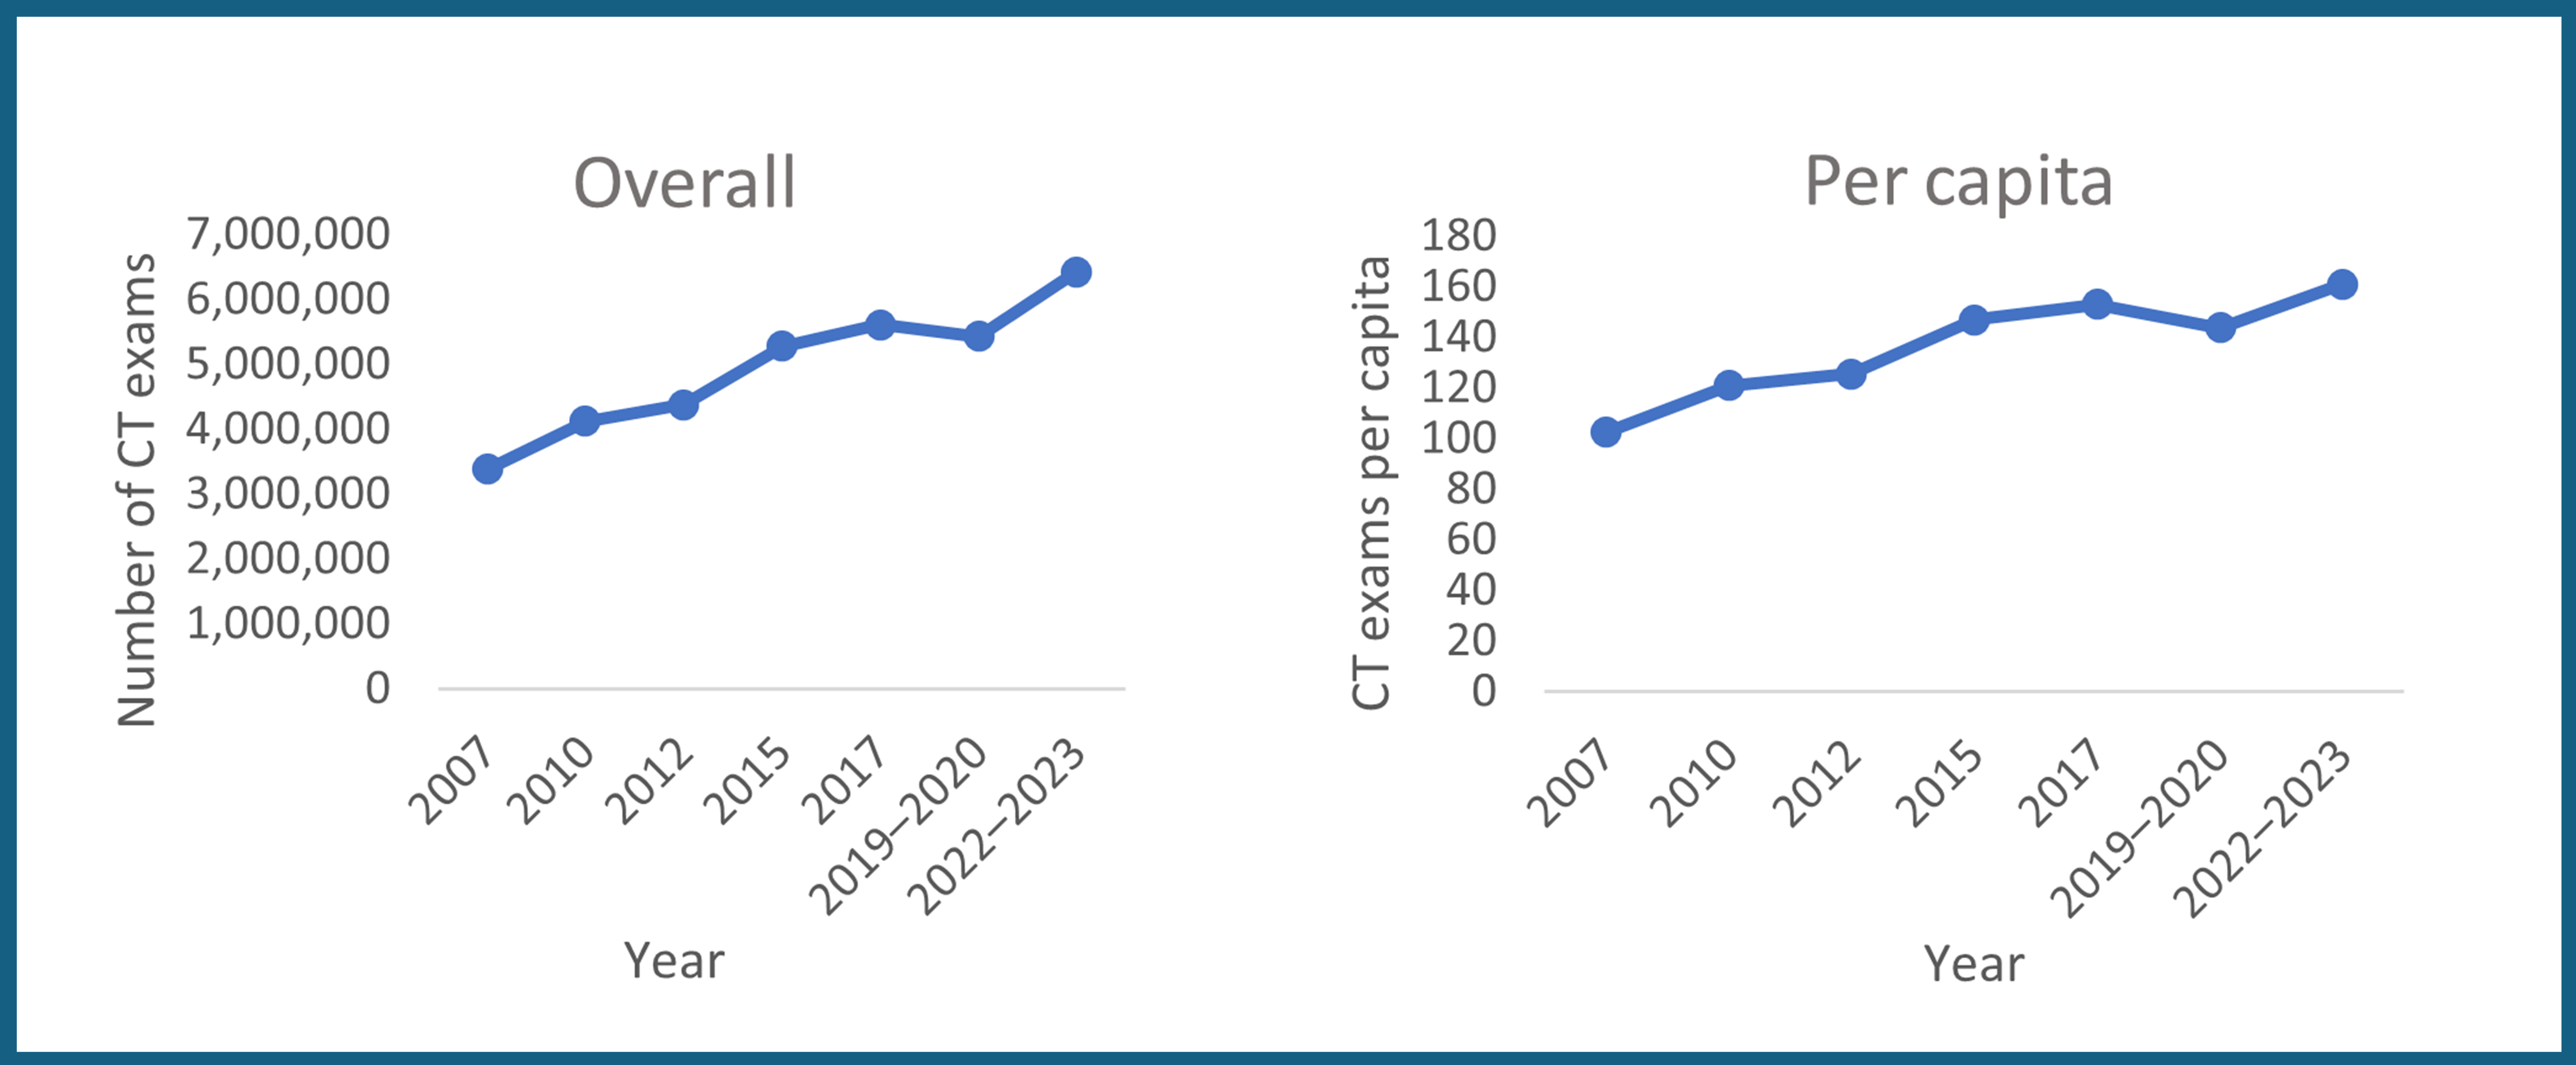
Canada experienced overall and per capita exam growth throughout the 16-year period. For both, CT exams growth was gradual for a 10-year period, between 2007 and 2017, followed by a period of decline in 2019–2020, which may be related to the temporary closure of some imaging departments during the pandemic. There was a subsequent increase through to 2022–2023 (Figure 2). During this period, the number of CT units grew from 419 to 560, whereas the units per capita increased from 12.8 to 14.0 per million population in Canada (Figure 2 and Appendix 1, Table 3 and Table 4).
Provincial and Territorial Growth Trends
Across Canada’s 11 jurisdictions with CT capacity throughout the period of 2007 to 2022–2023, there were variations in growth trends for both overall and per capita exams (Figure 3 and Figure 4 and Appendix 1, Table 1 and Table 2):
All jurisdictions saw increases in both overall and per capita exams.
Six out of 11 jurisdictions surpassed the national average percentage increase for both overall (90%) and per capita (57%) exams.
Five out of 11 jurisdictions were below the national average percentage for both overall (90%) and per capita (57%) exams.
Per capita CT exams in this report refer to the average number of exams performed per 1,000 people each year. In most jurisdictions, the total number of CT exams has increased more quickly than the per capita figures. This suggests that, although overall usage is rising, the number of exams available to each individual may not be increasing at the same pace. This pattern may highlight ongoing challenges in distributing CT resources equitably, contributing to regional differences in access across Canada’s large and unevenly populated geography.
Newfoundland and Labrador Growth Trends
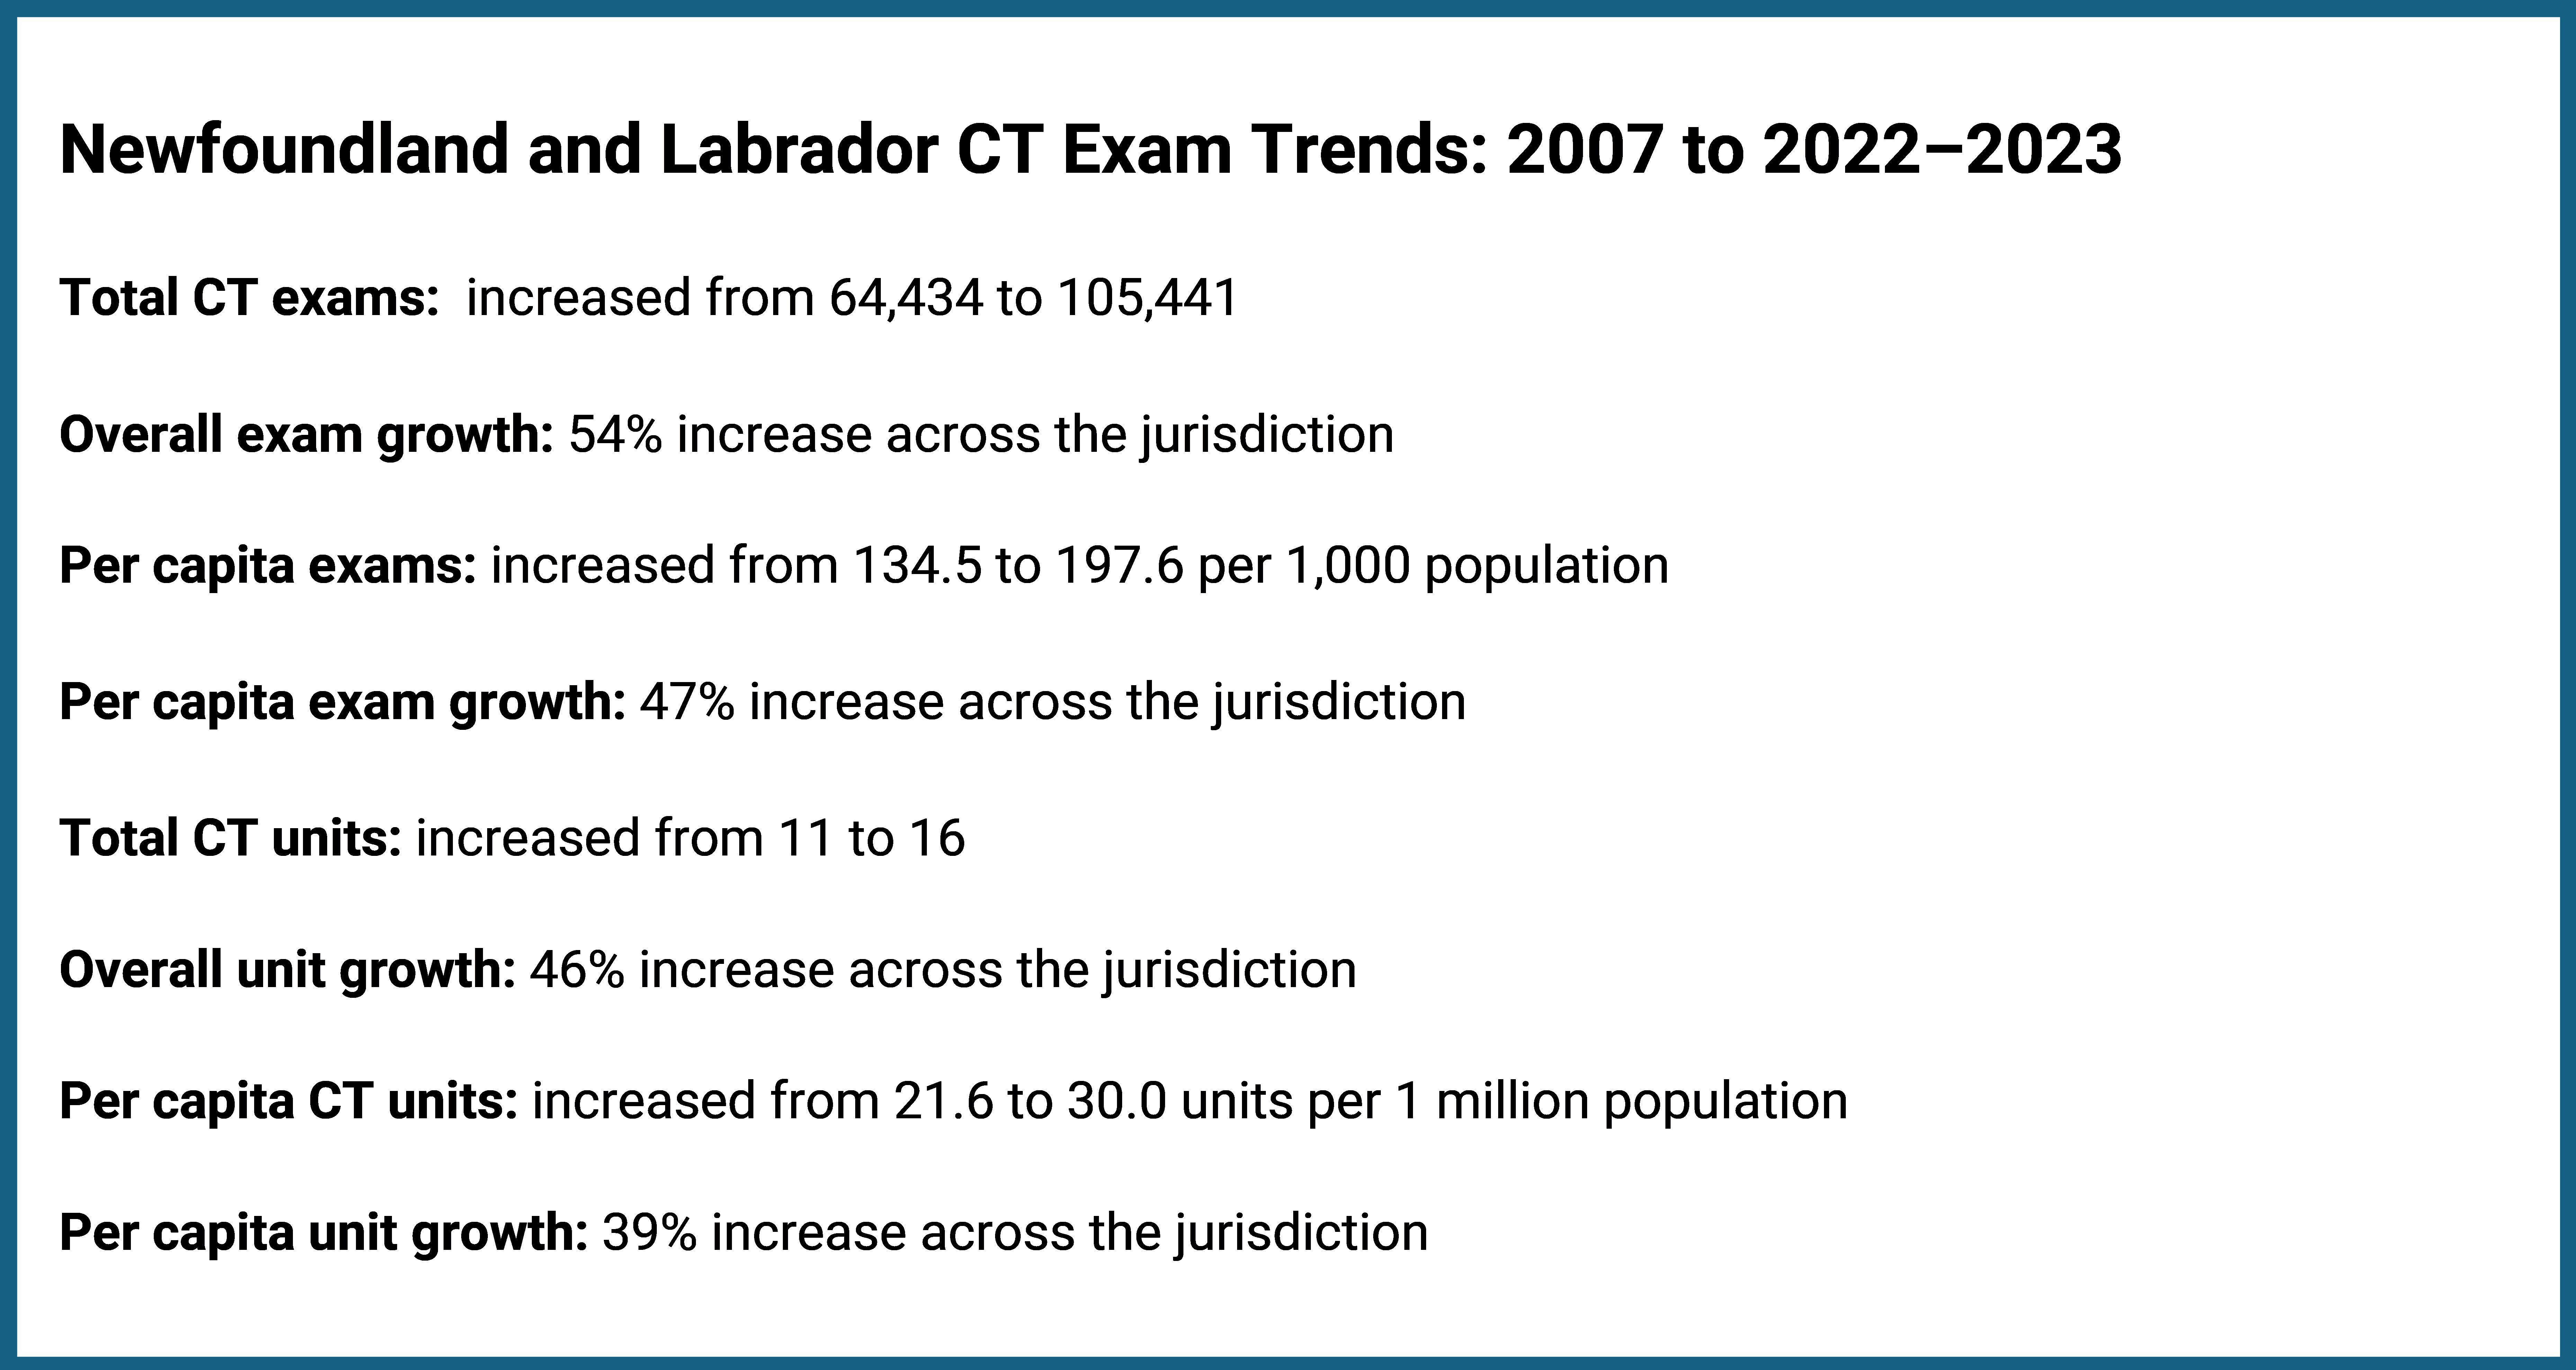
Newfoundland and Labrador’s total CT exam volume increased by 54%, whereas per capita growth was 47% (Figure 3 and Appendix 1, Table 1 and Table 2). Both figures were below the national averages of 90% and 57%, respectively. During this period, the number of CT units rose from 11 to 16, representing a 46% increase, whereas units per capita grew from 21.6 to 30.0, representing a 39% increase (Figure 3 and Appendix 1, Table 3 and Table 4).
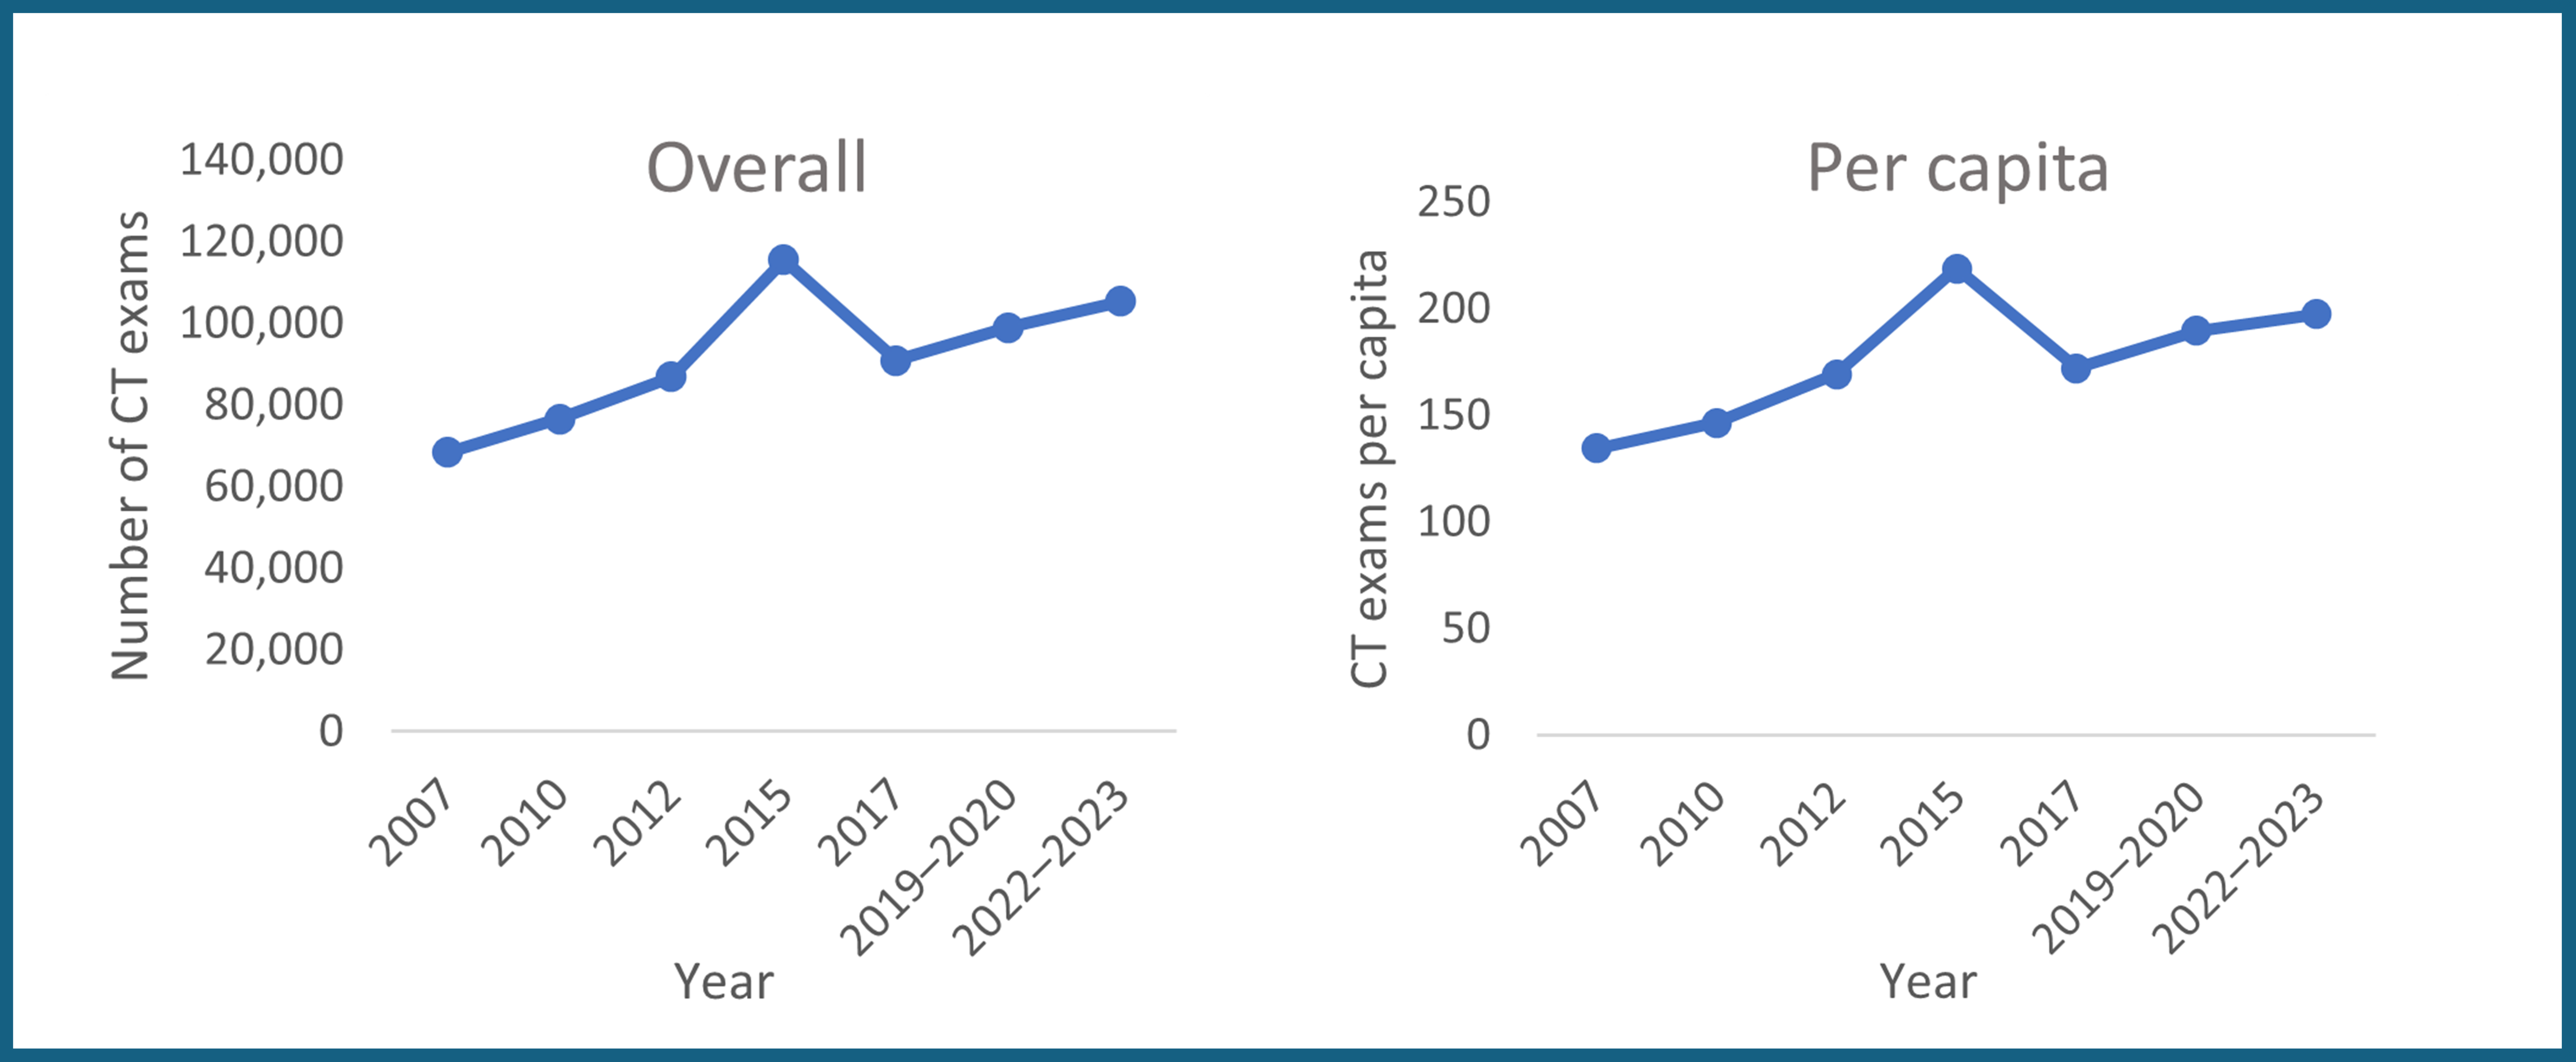
Newfoundland and Labrador experienced overall and per capita growth during the 16-year period, with continual growth from 2007 through 2015, when exam volumes reached their peak. This spike may be attributed to the use of imputed data for that year, rather than actual numbers. It is likely that had actual numbers been used, the trajectory may have been more linear (Figure 4).
Prince Edward Island Growth Trends
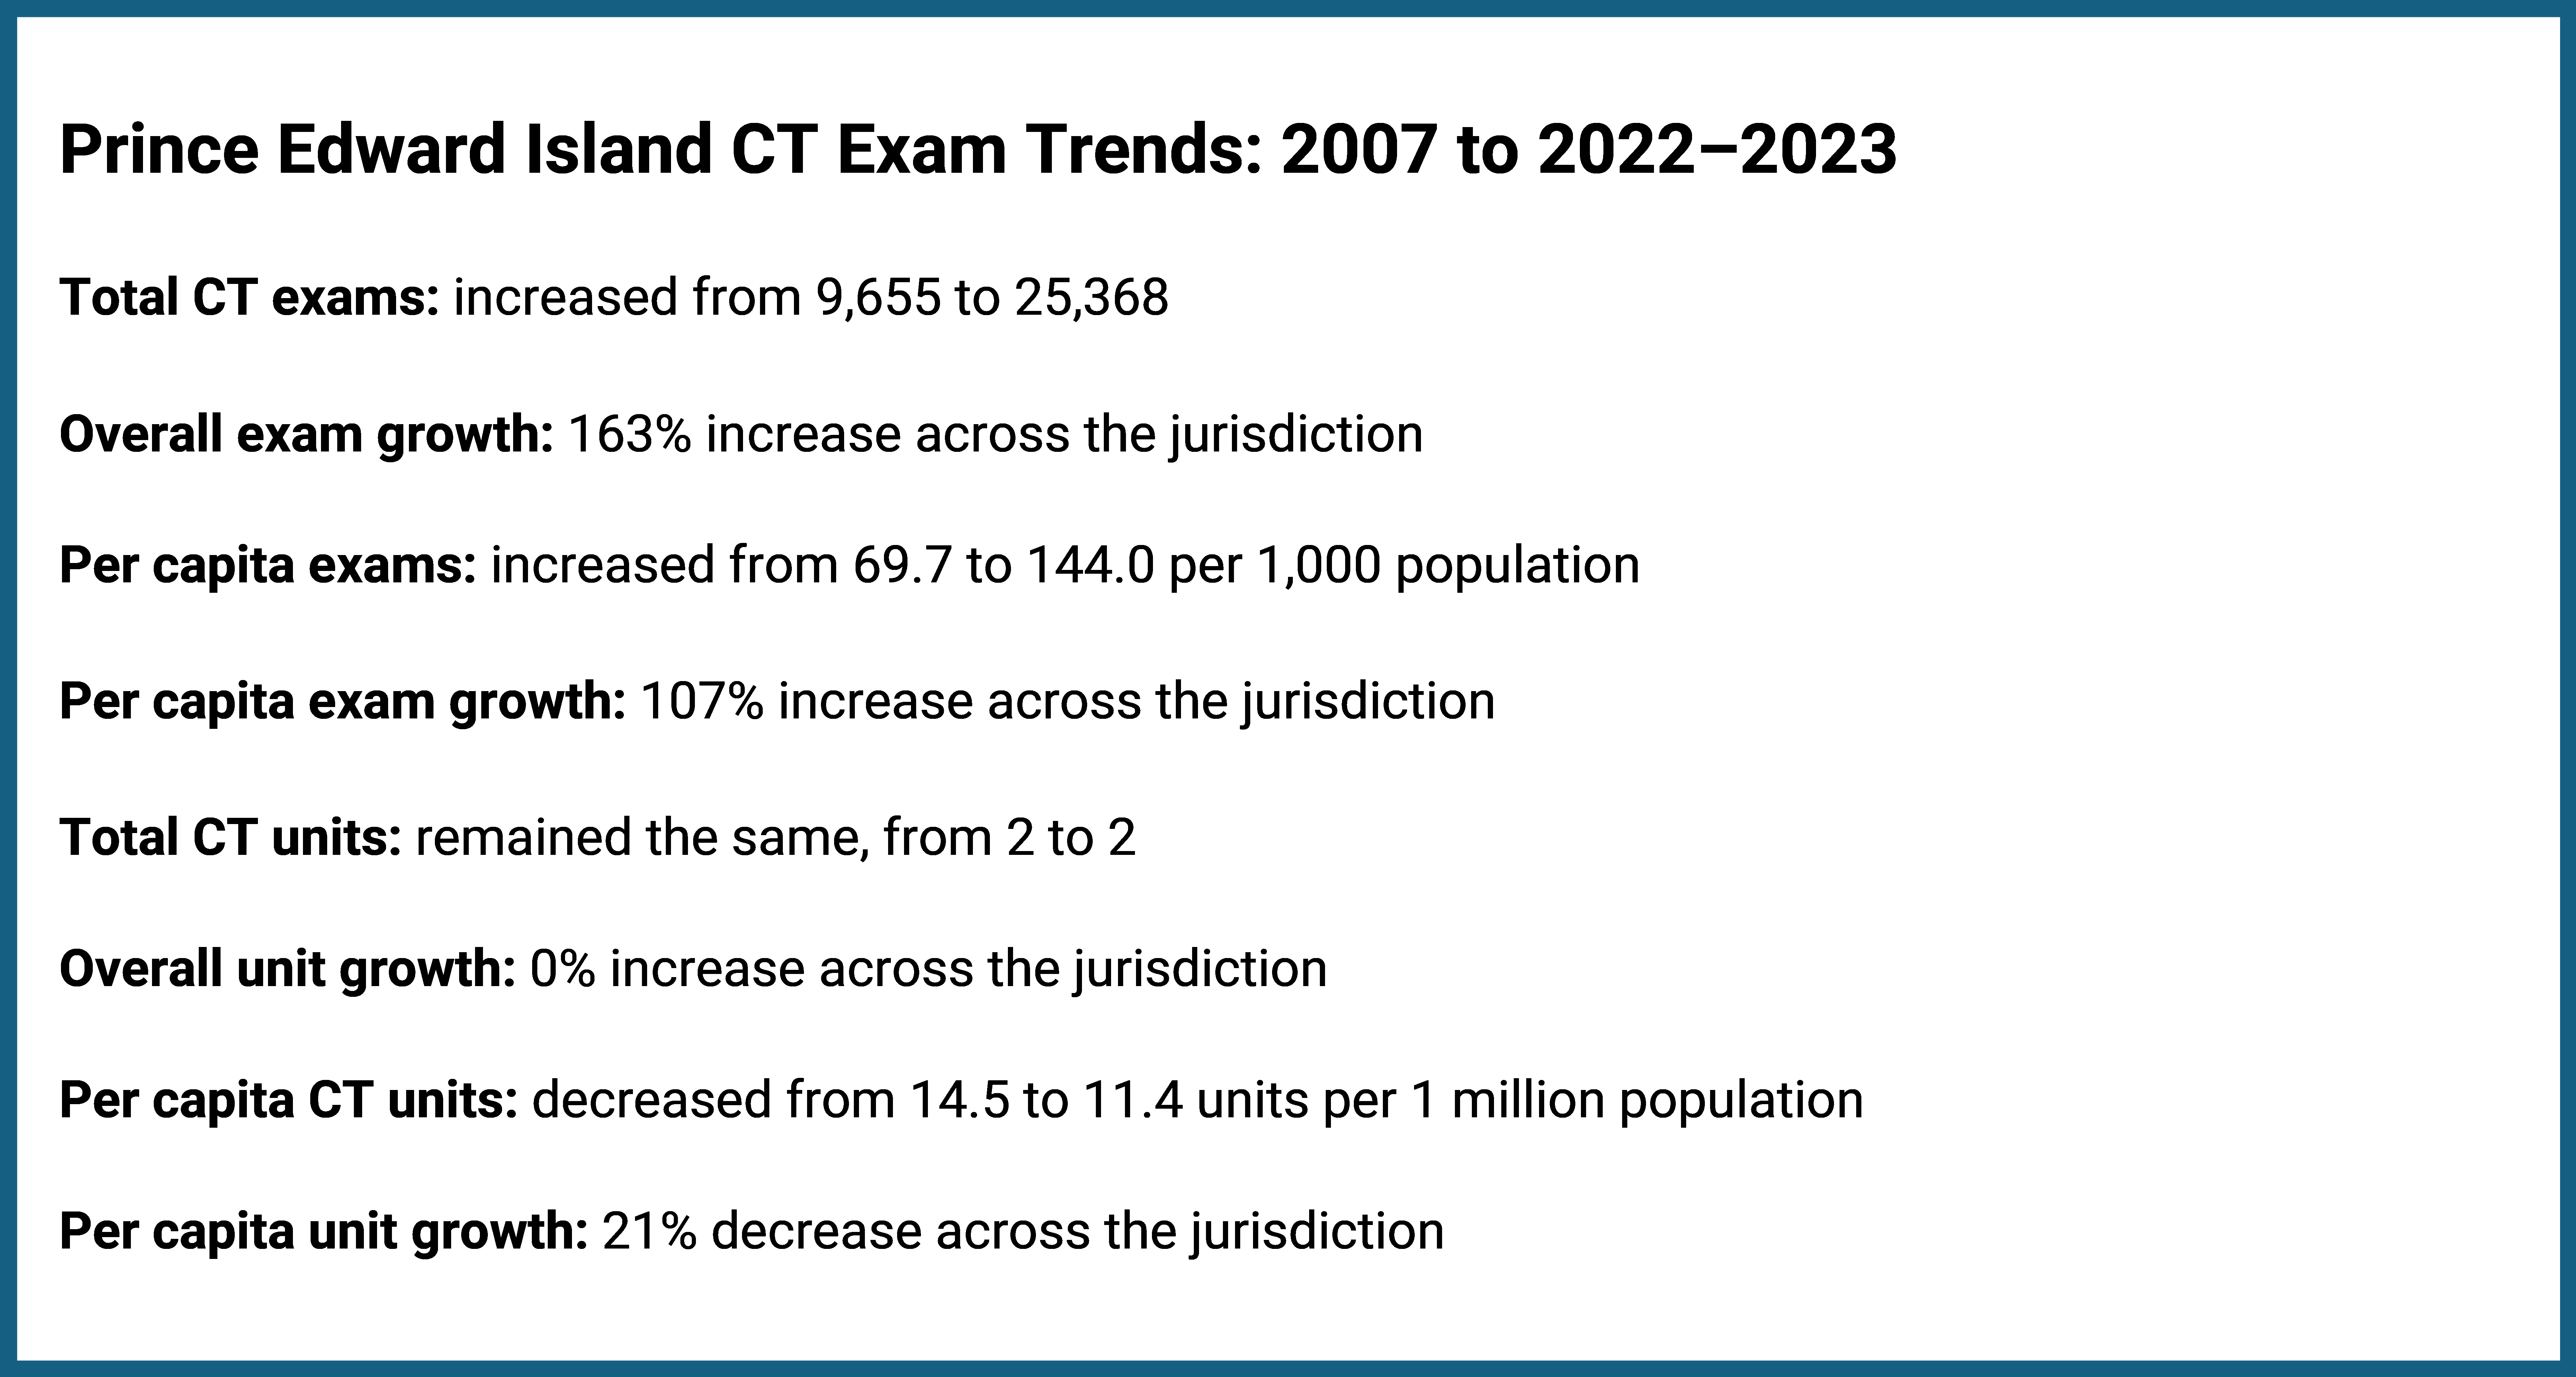
Prince Edward Island’s total CT exam volume rose by 163%, whereas per capita growth was 107% (Figure 5 and Appendix 1, Table 1 and Table 2). Both figures were well above the national averages of 90% and 57%, respectively. During this period, the number of CT units remained unchanged at 2, representing a 21% decrease in units per capita, from 14.5 to 11.4 (Figure 5 and Appendix 1, Table 3 and Table 4).
The overall and per capita exam volume increase places Prince Edward Island among the top 3 jurisdictions for percentage exam growth over the time period. However, it is noted that its share of overall CT exam volumes remained below 0.5% of the national total in each reporting year.
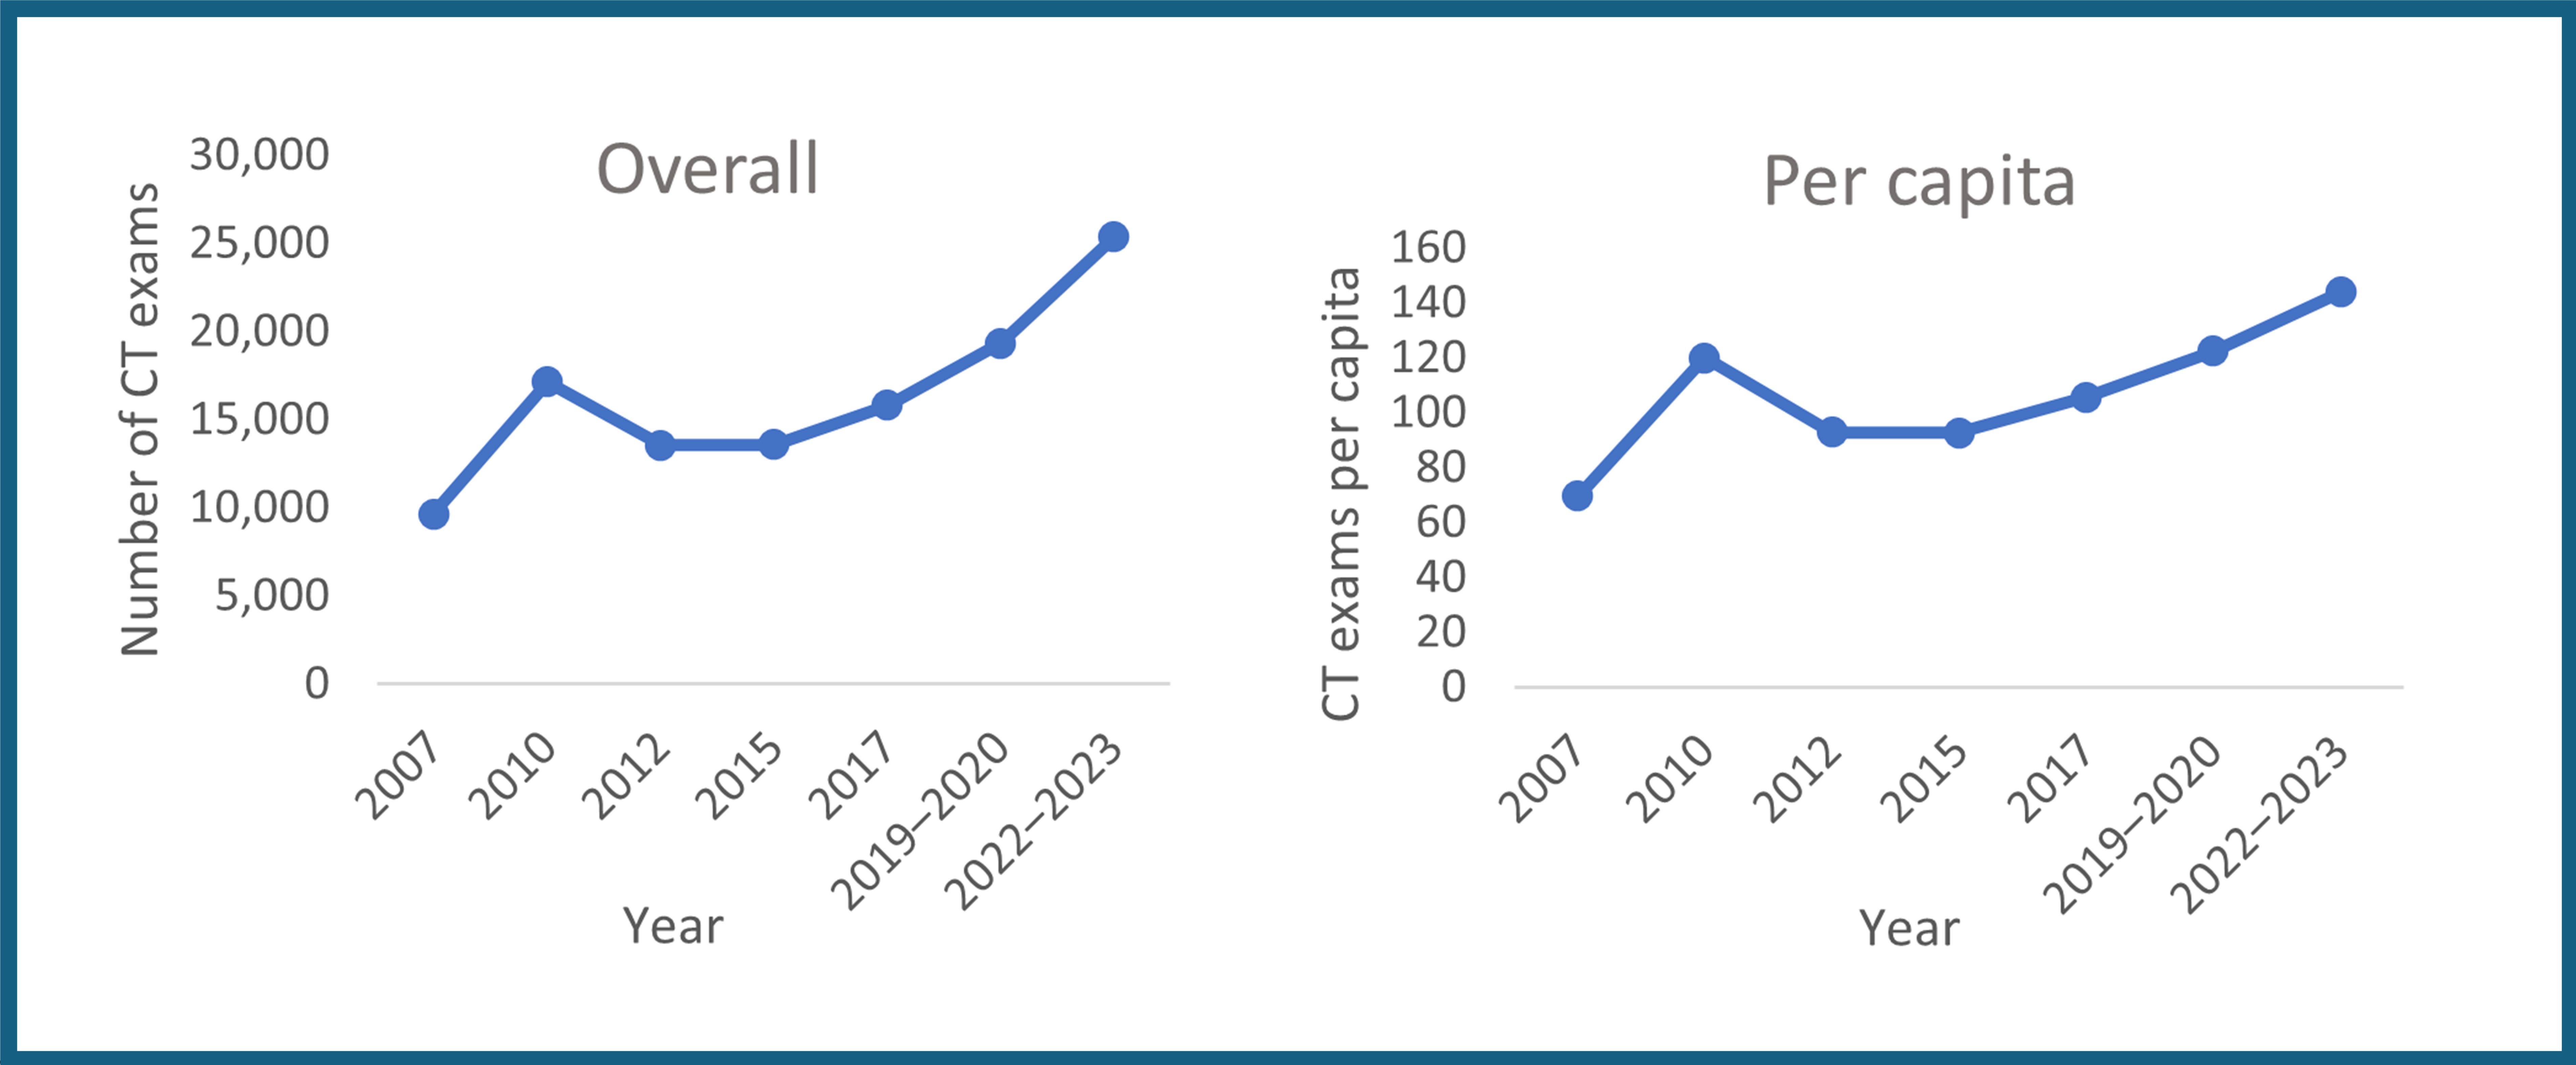
Prince Edward Island experienced overall and per capita growth during the 16-year period. The greatest period of growth for both was between 2007 and 2010, when exam growth reached a peak that was not surpassed again for a 10-year period, until 2019–2020. Upward growth continued after then, through to 2022–2023 (Figure 6).
Nova Scotia Growth Trends
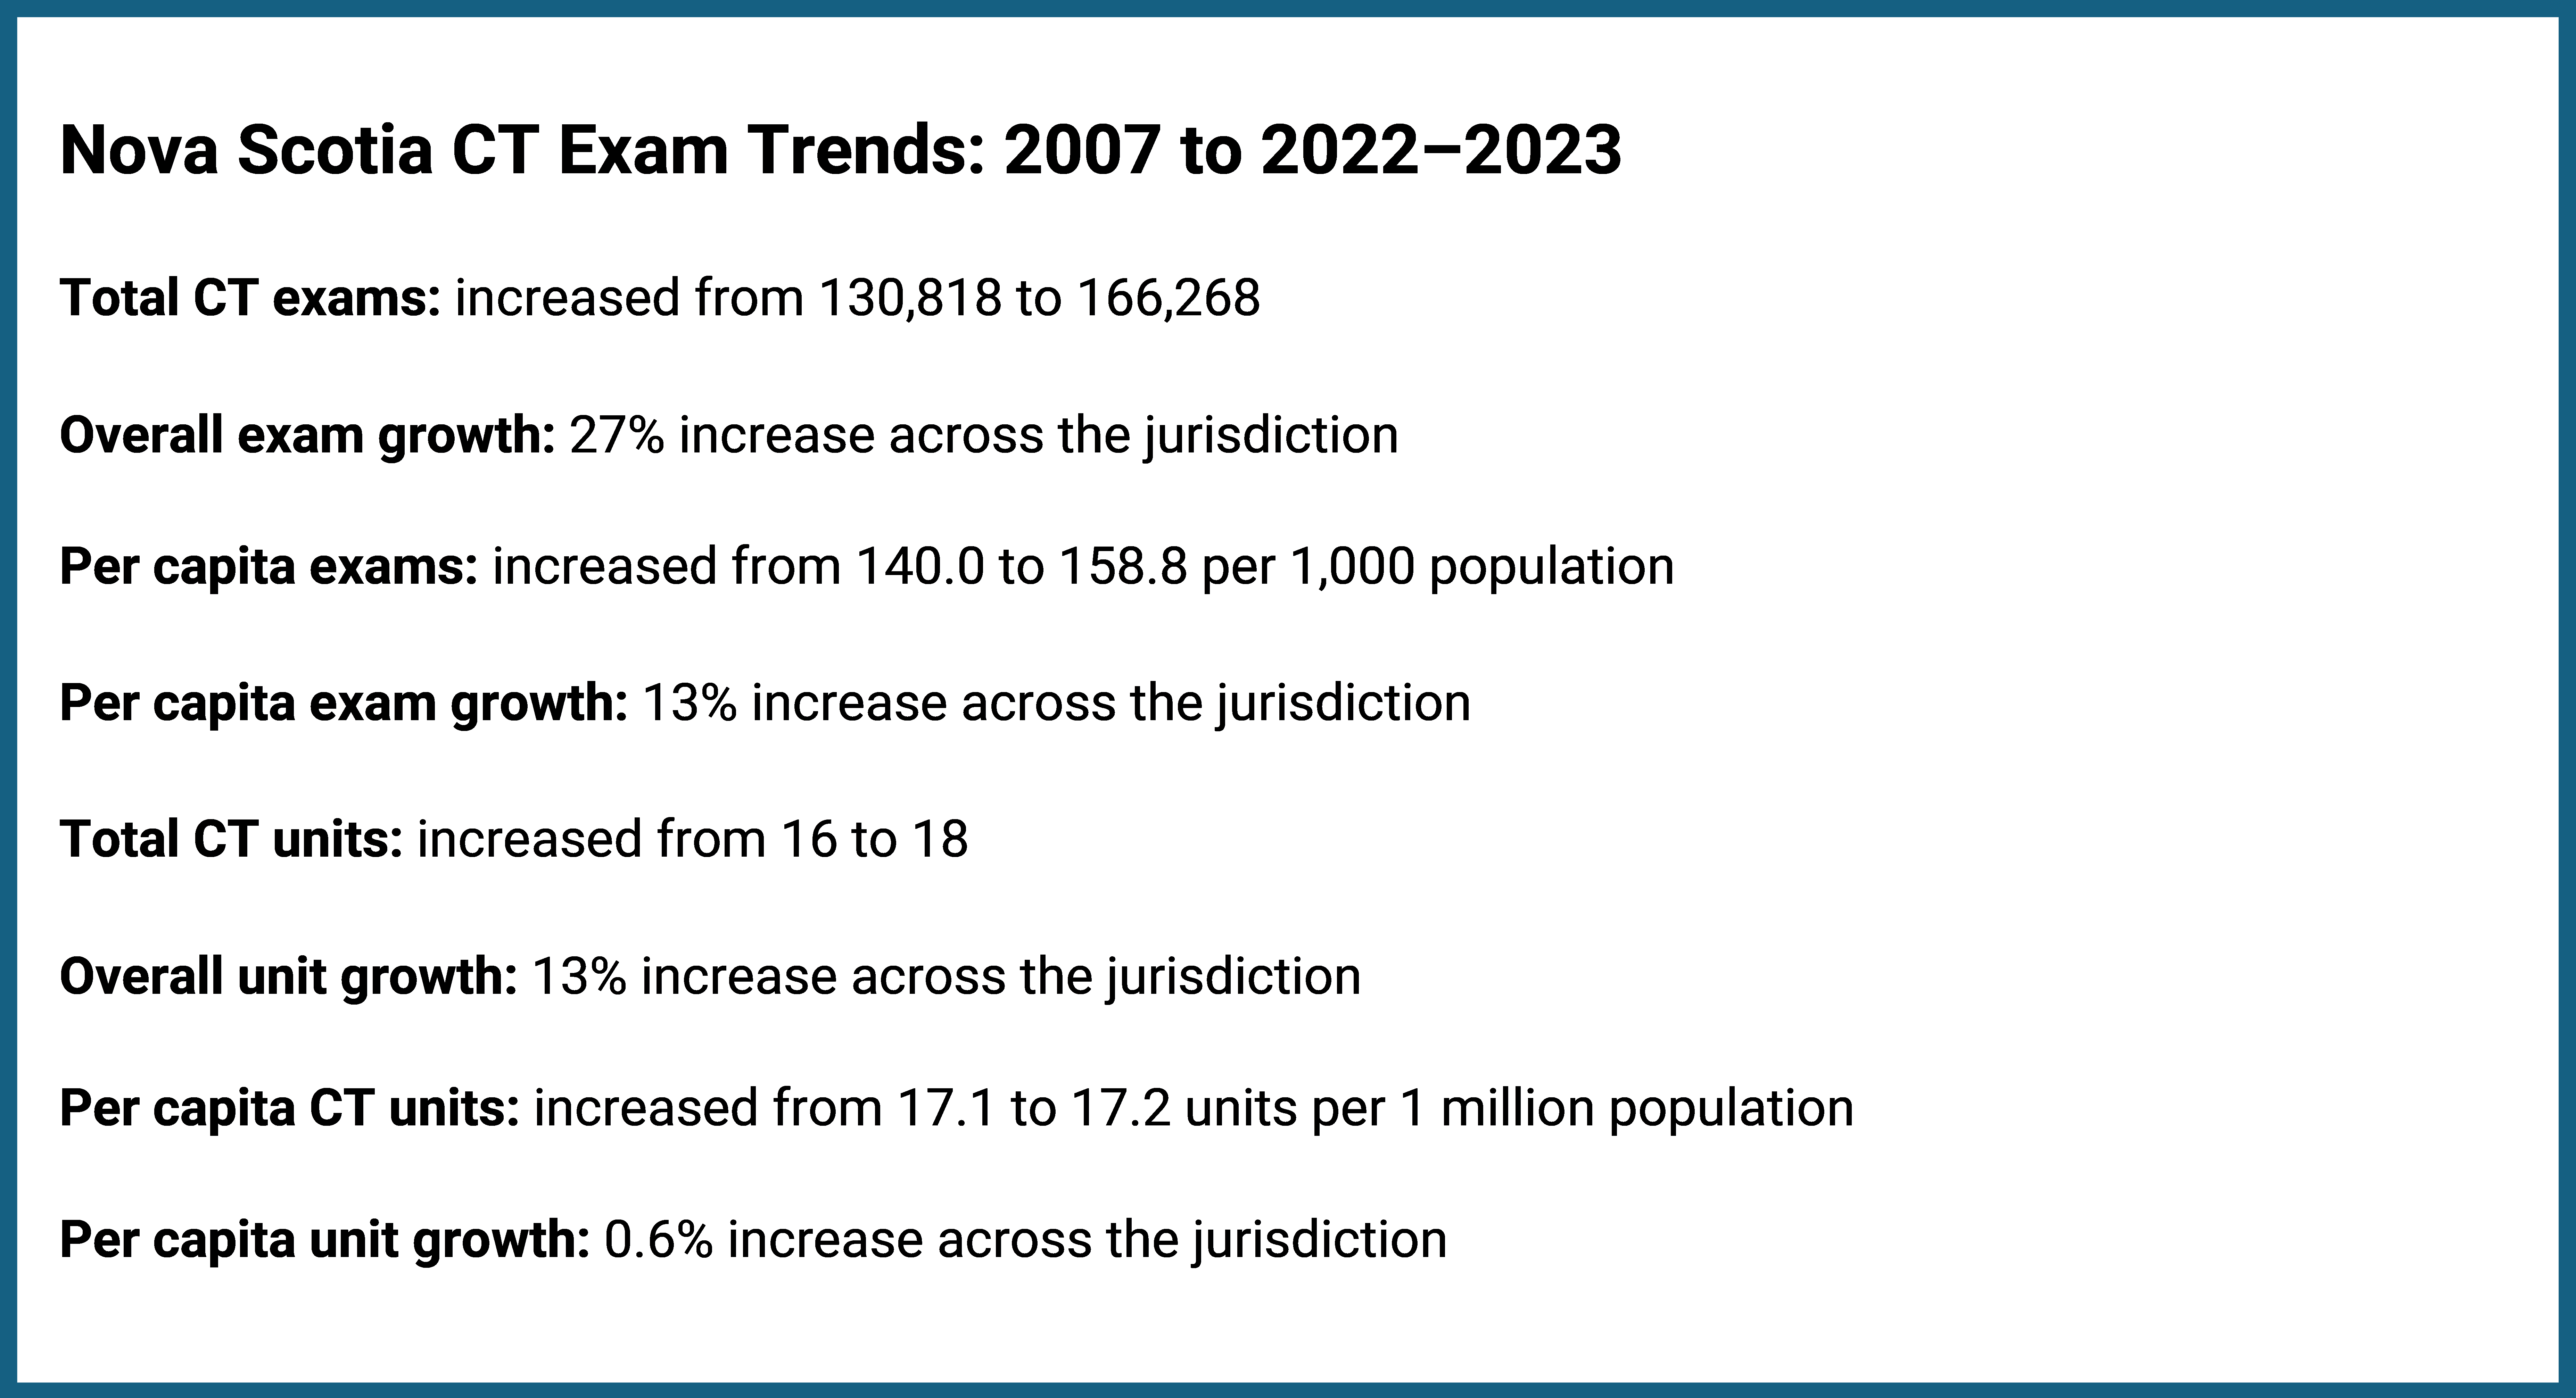
Nova Scotia’s total CT exam volume increased by 27%, whereas per capita growth was 13% (Figure 7 and Appendix 1, Table 1 and Table 2). Both figures were below the national averages of 90% and 57%, respectively. During this period, the number of CT units rose from 16 to 18, representing a 13% increase, whereas units per capita remained virtually unchanged, increasing slightly from 17.1 to 17.2 (0.6%) (Figure 7 and Appendix 1, Table 3 and Table 4).
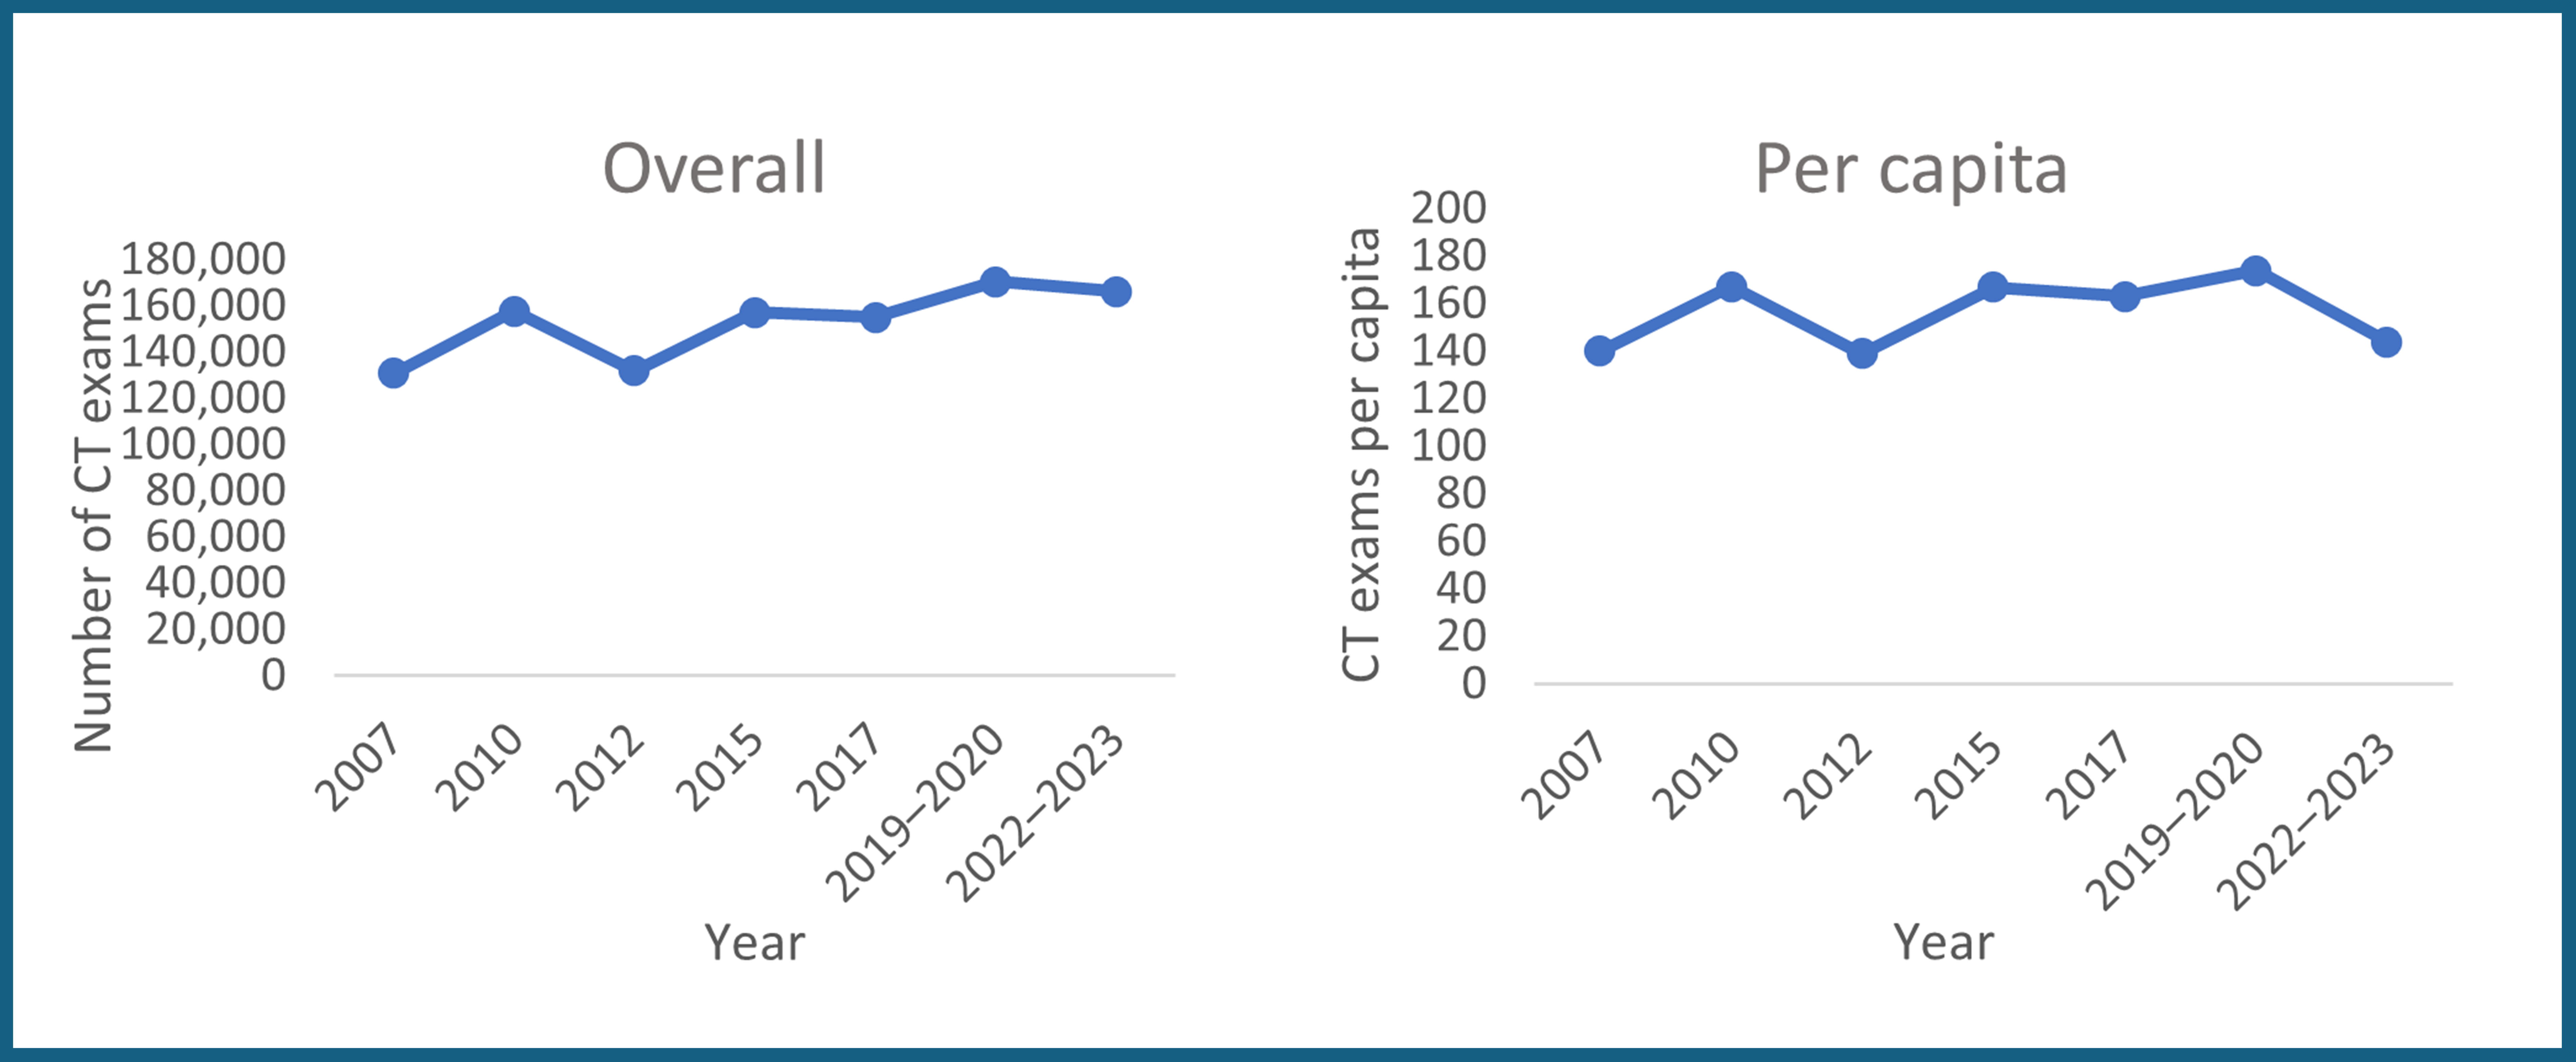
Nova Scotia experienced overall and per capita growth during the 16-year period. The greatest period of growth for both was between 2007 and 2010. This was followed by a period of decline through 2012, then another phase of growth leading up to 2019–2020, before a slight decrease thereafter (Figure 8).
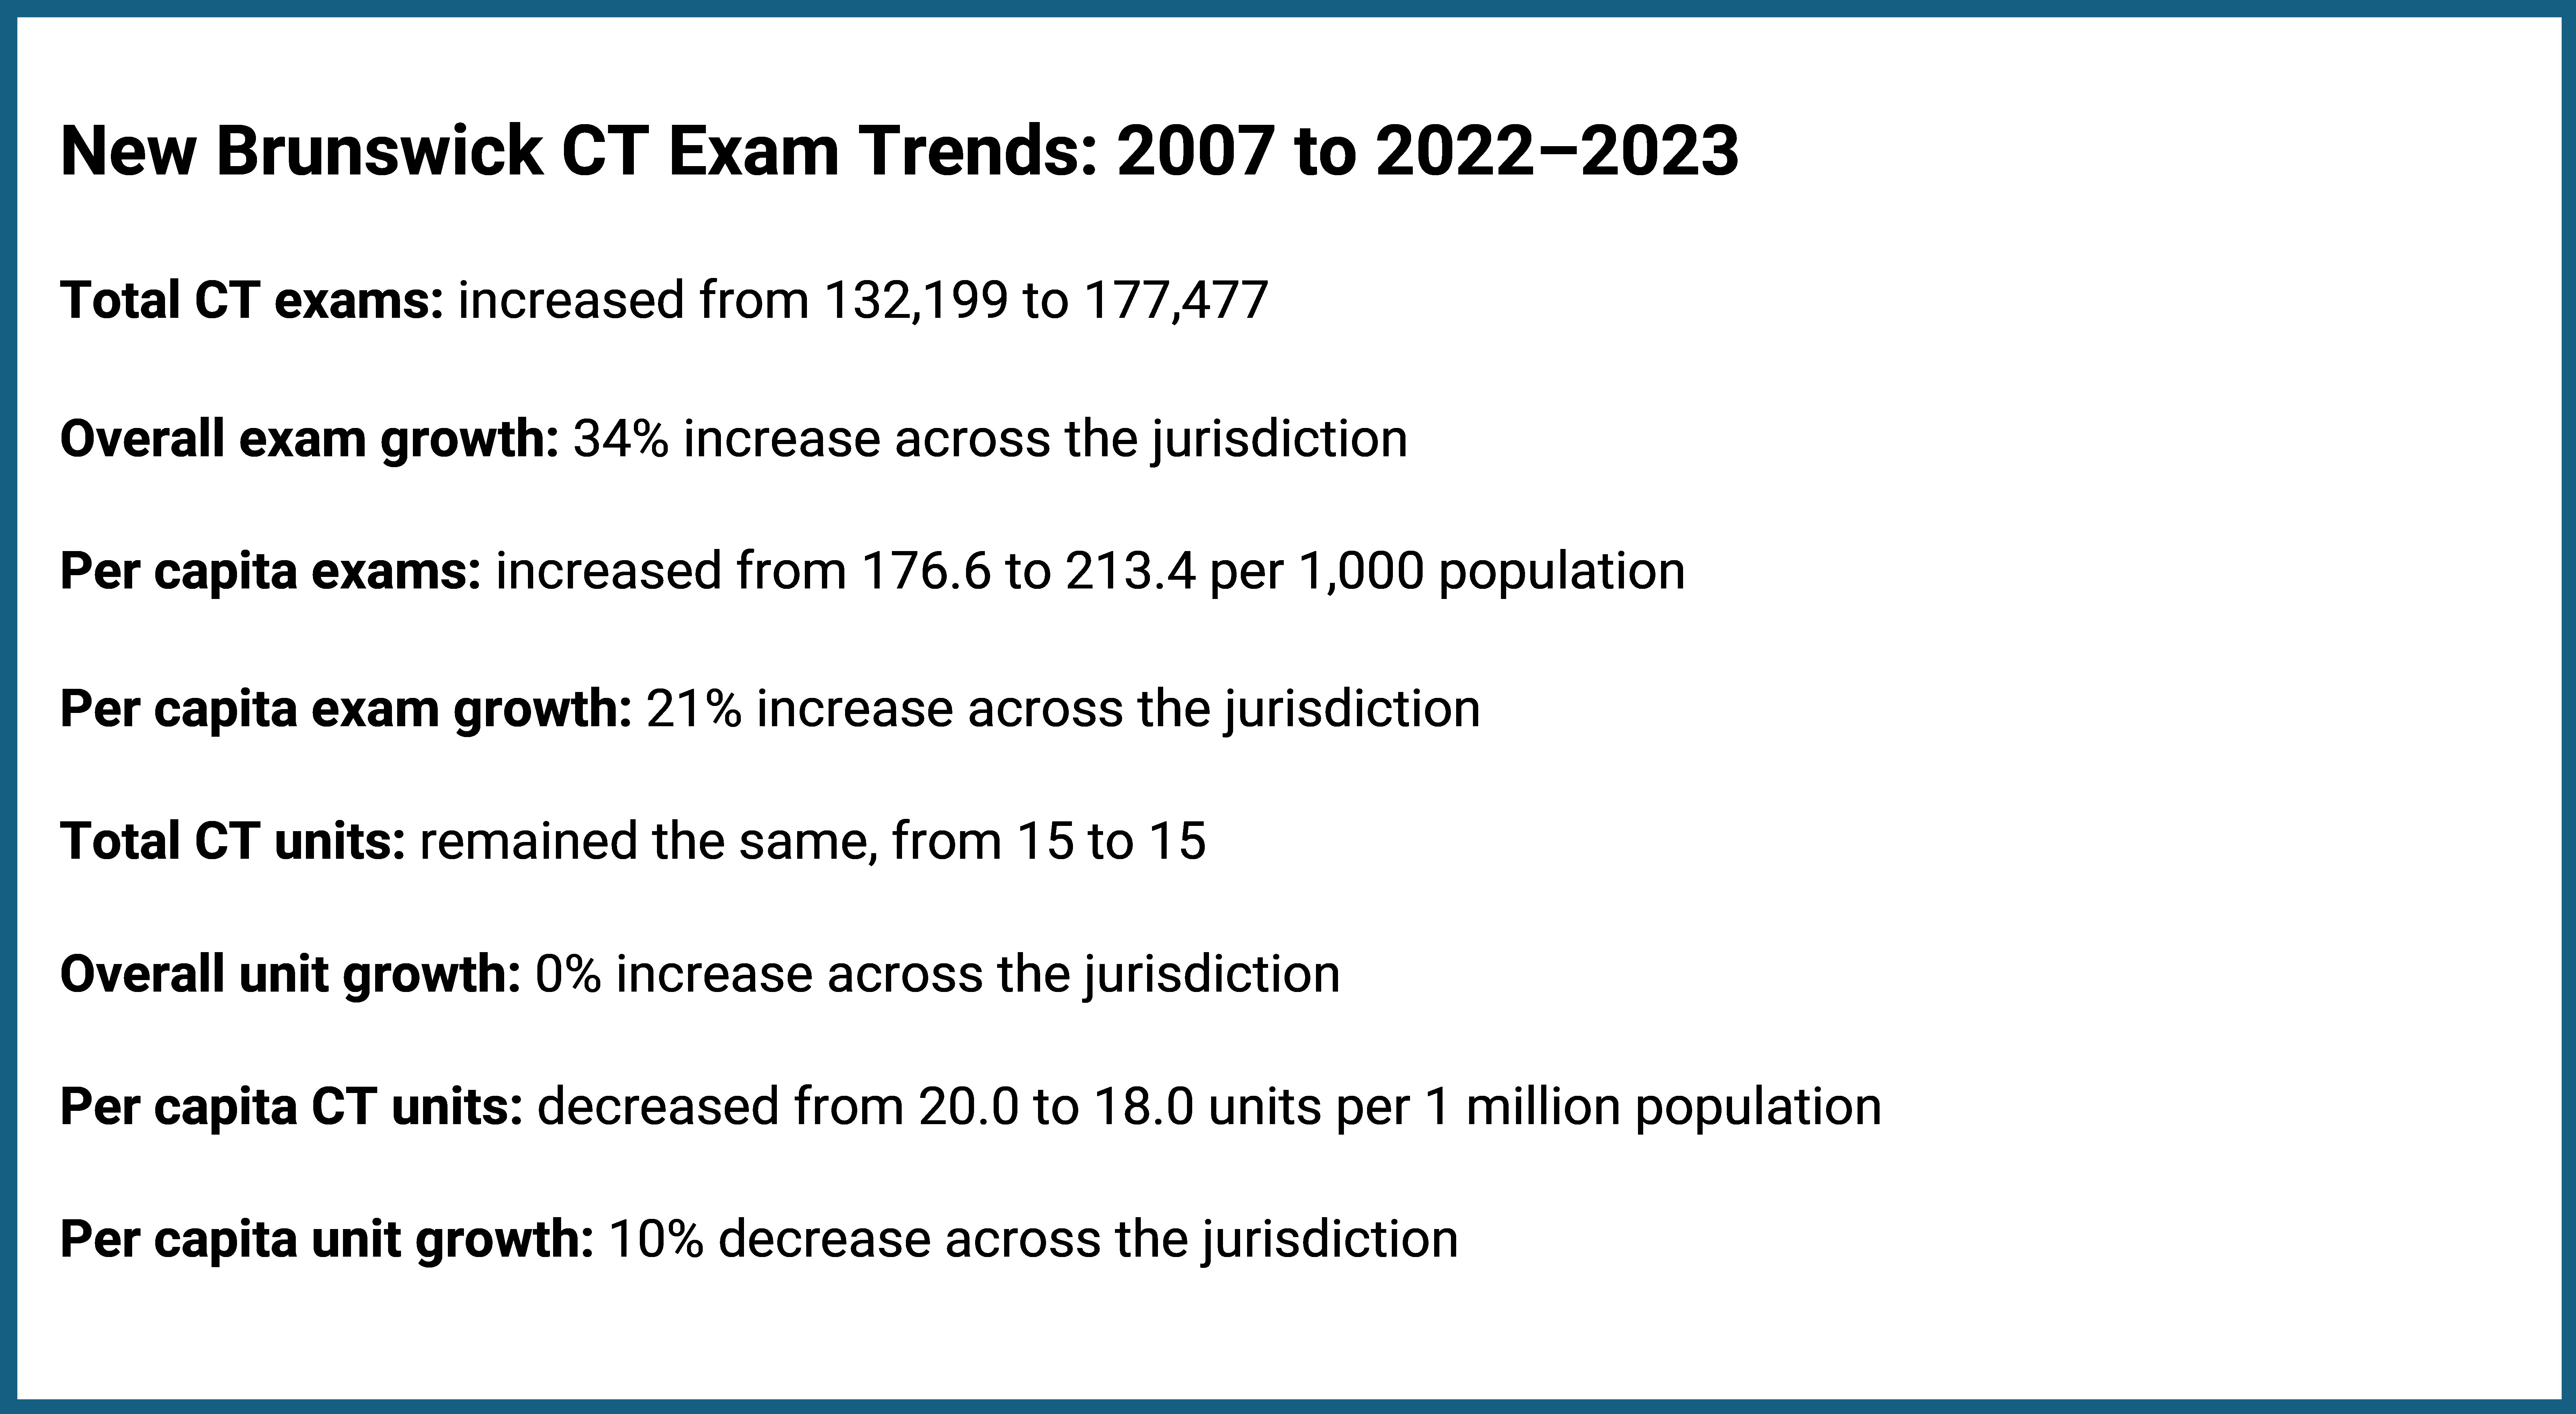
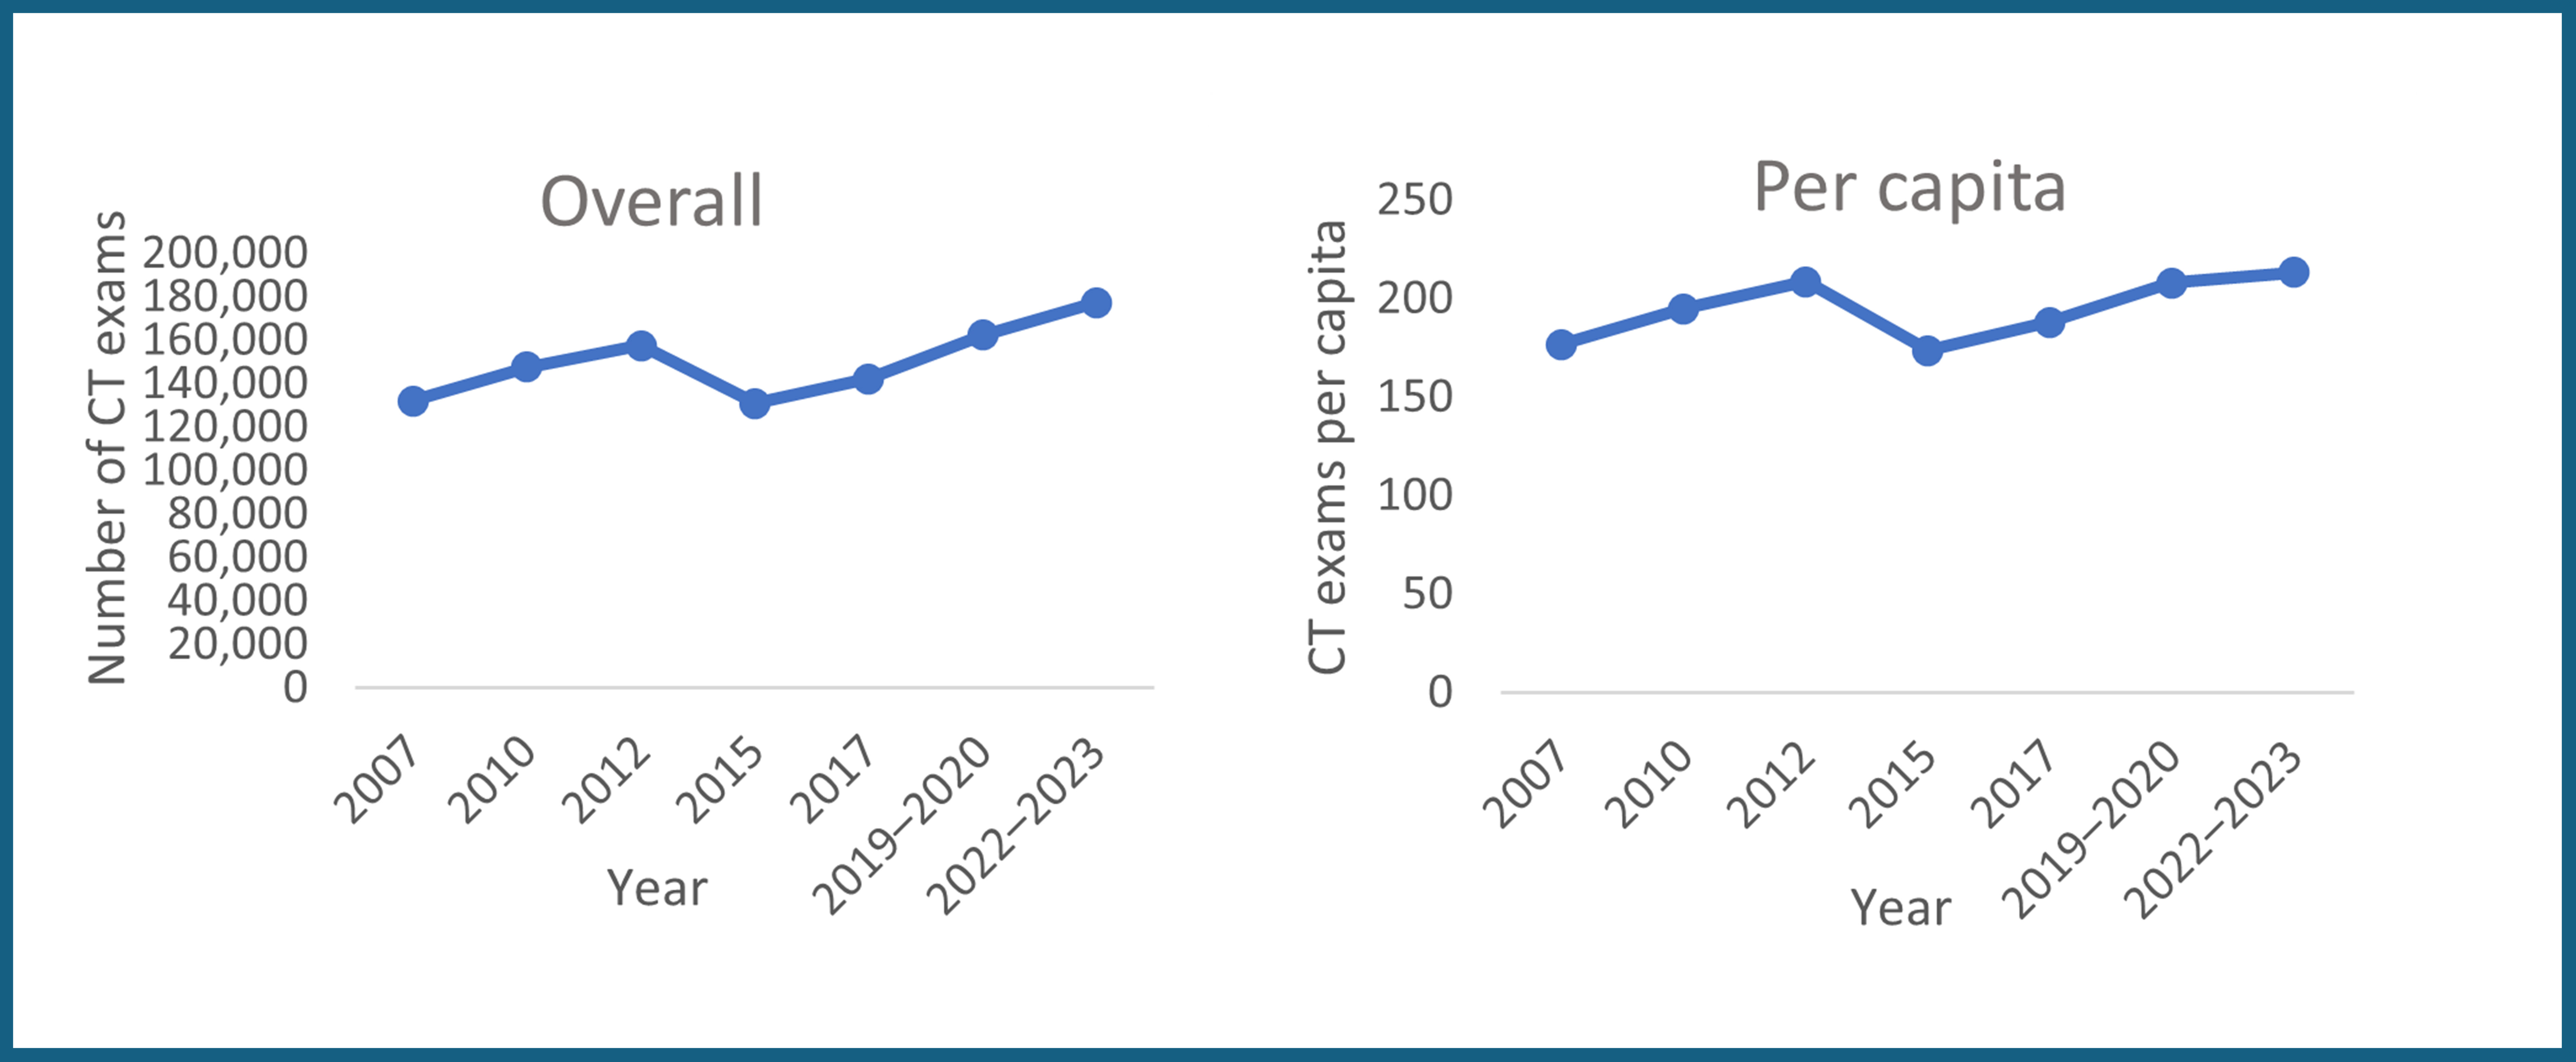
New Brunswick Growth Trends
New Brunswick’s total CT exam volume increased by 34%, whereas per capita growth was 21% (Figure 9 and Appendix 1, Table 1 and Table 2). Both figures were below the national averages of 90% and 57%, respectively. During this period, the number of CT units remained unchanged at 15, resulting in a 10% decrease in units per capita, from 20.0 to 18.0 (Figure 9 and Appendix 1, Table 3 and Table 4).
Although New Brunswick saw overall and per capita growth over the 16-year period, there were fluctuations in the exam numbers for both. Specifically, CT exams increased from 2007 to 2012, followed by a decline in 2015, then steady growth leading up to 2019–2020, before plateauing with a slower growth at the 2022–2023 levels. The sharp drop in 2015 may be attributed to the use of imputed data rather than actual figures for that year. Had the data been based on actual exam numbers, the decline experienced in 2015 — which did not return to 2012 levels until 2019–2020 — may have been less pronounced (Figure 10).
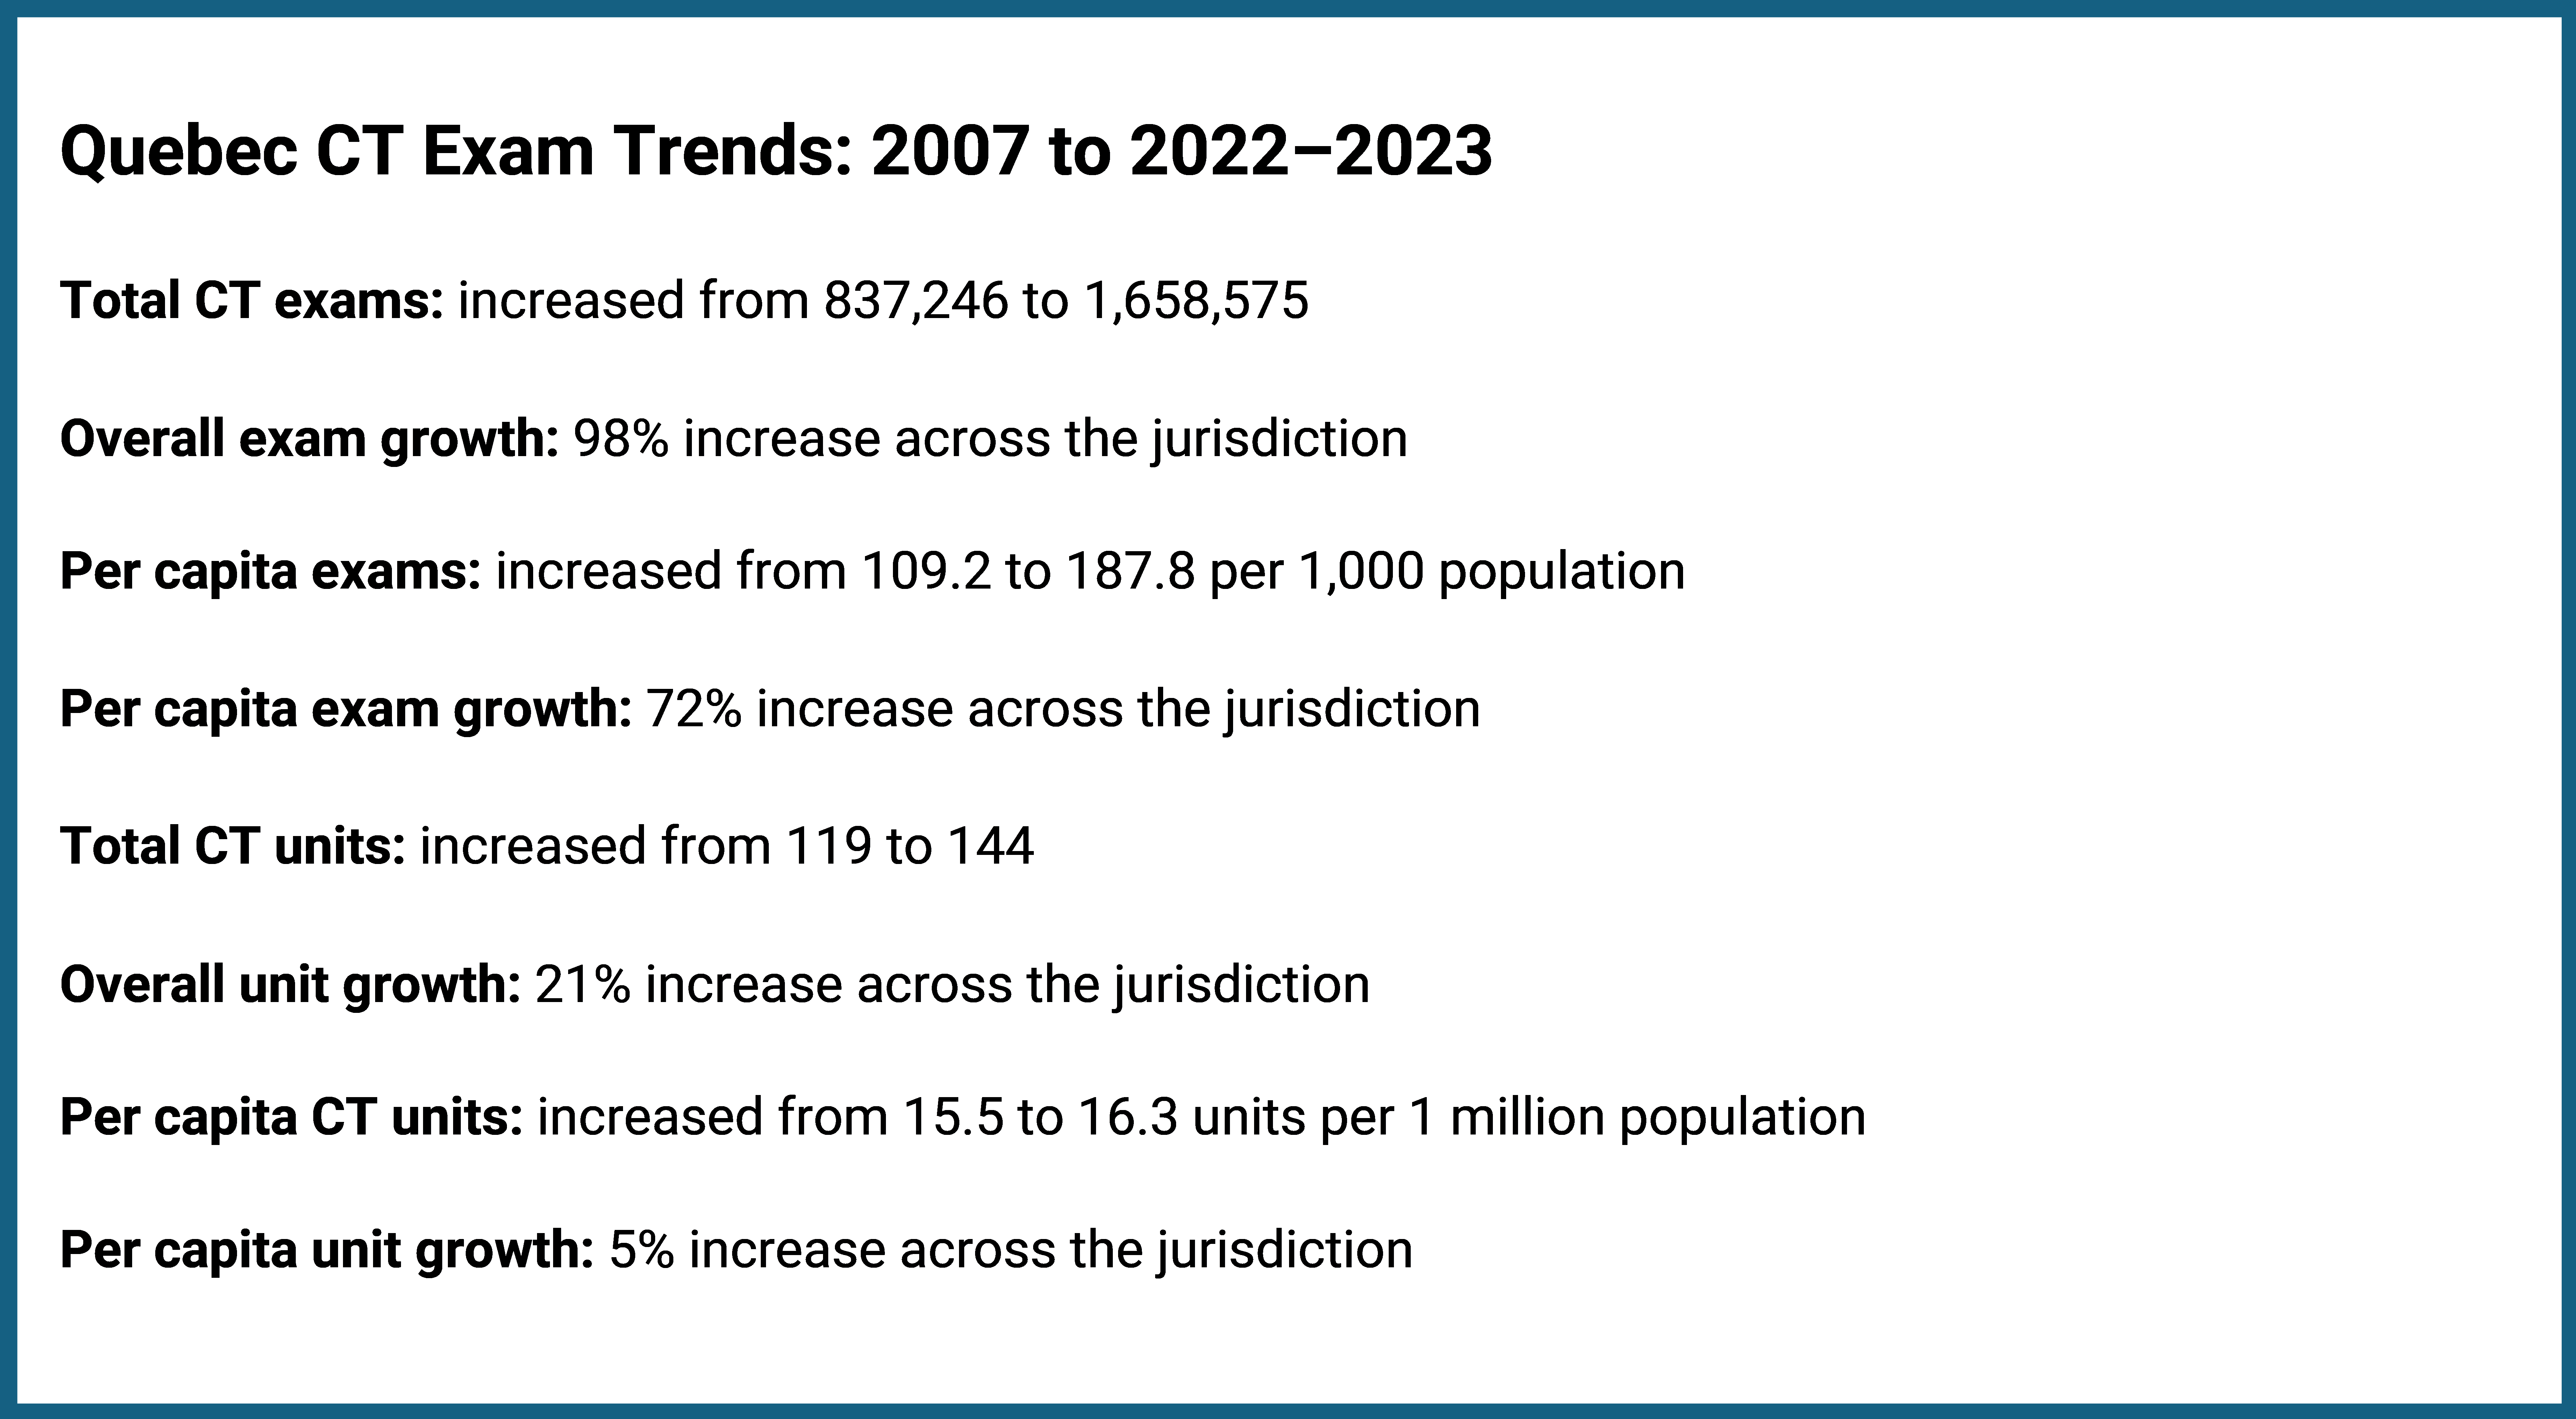
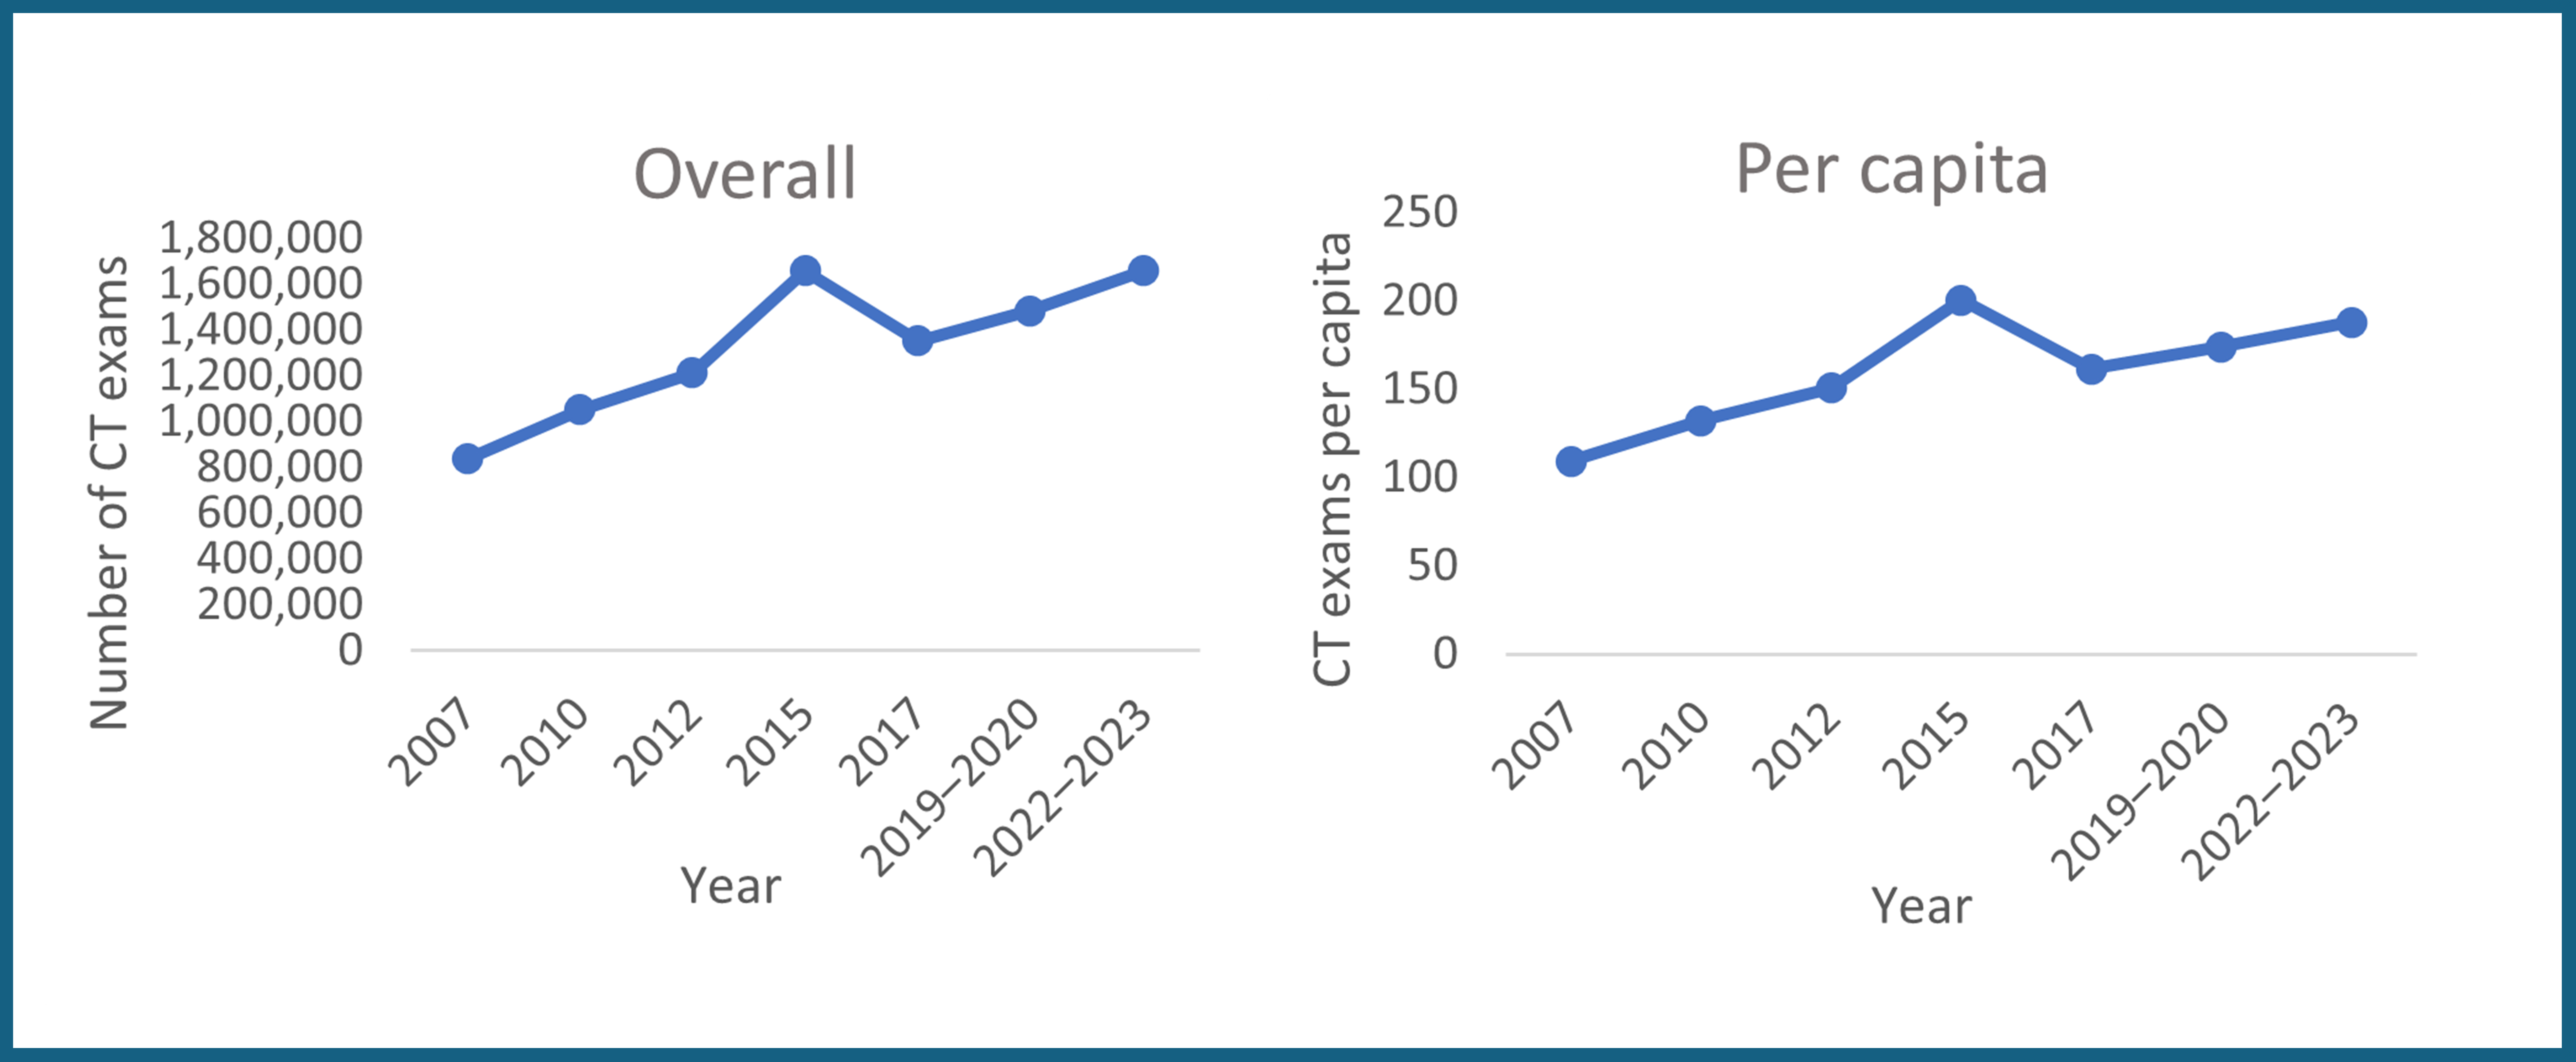
Quebec Growth Trends
Quebec’s total CT exam volume increased by 98%, whereas per capita growth was 72% (Figure 11 and Appendix 1, Table 1 and Table 2). Both figures were above the national averages of 90% and 57%, respectively. During this period, the number of CT units rose from 119 to 144, representing a 21% increase, whereas units per capita grew modestly from 15.5 to 16.3, representing a 5% increase (Figure 11 and Appendix 1, Table 3 and Table 4).
Quebec experienced overall and per capita growth during the 16-year period. For both, growth in CT exams showed a gradual upward trend with a possible spike in 2015, followed by a decline in 2017 and a steady increase leading up to 2022–2023. The 2015 spike may reflect the use of imputed data instead of actual numbers for that year. If actual numbers had been used, the growth trajectory may have been more linear (Figure 12).
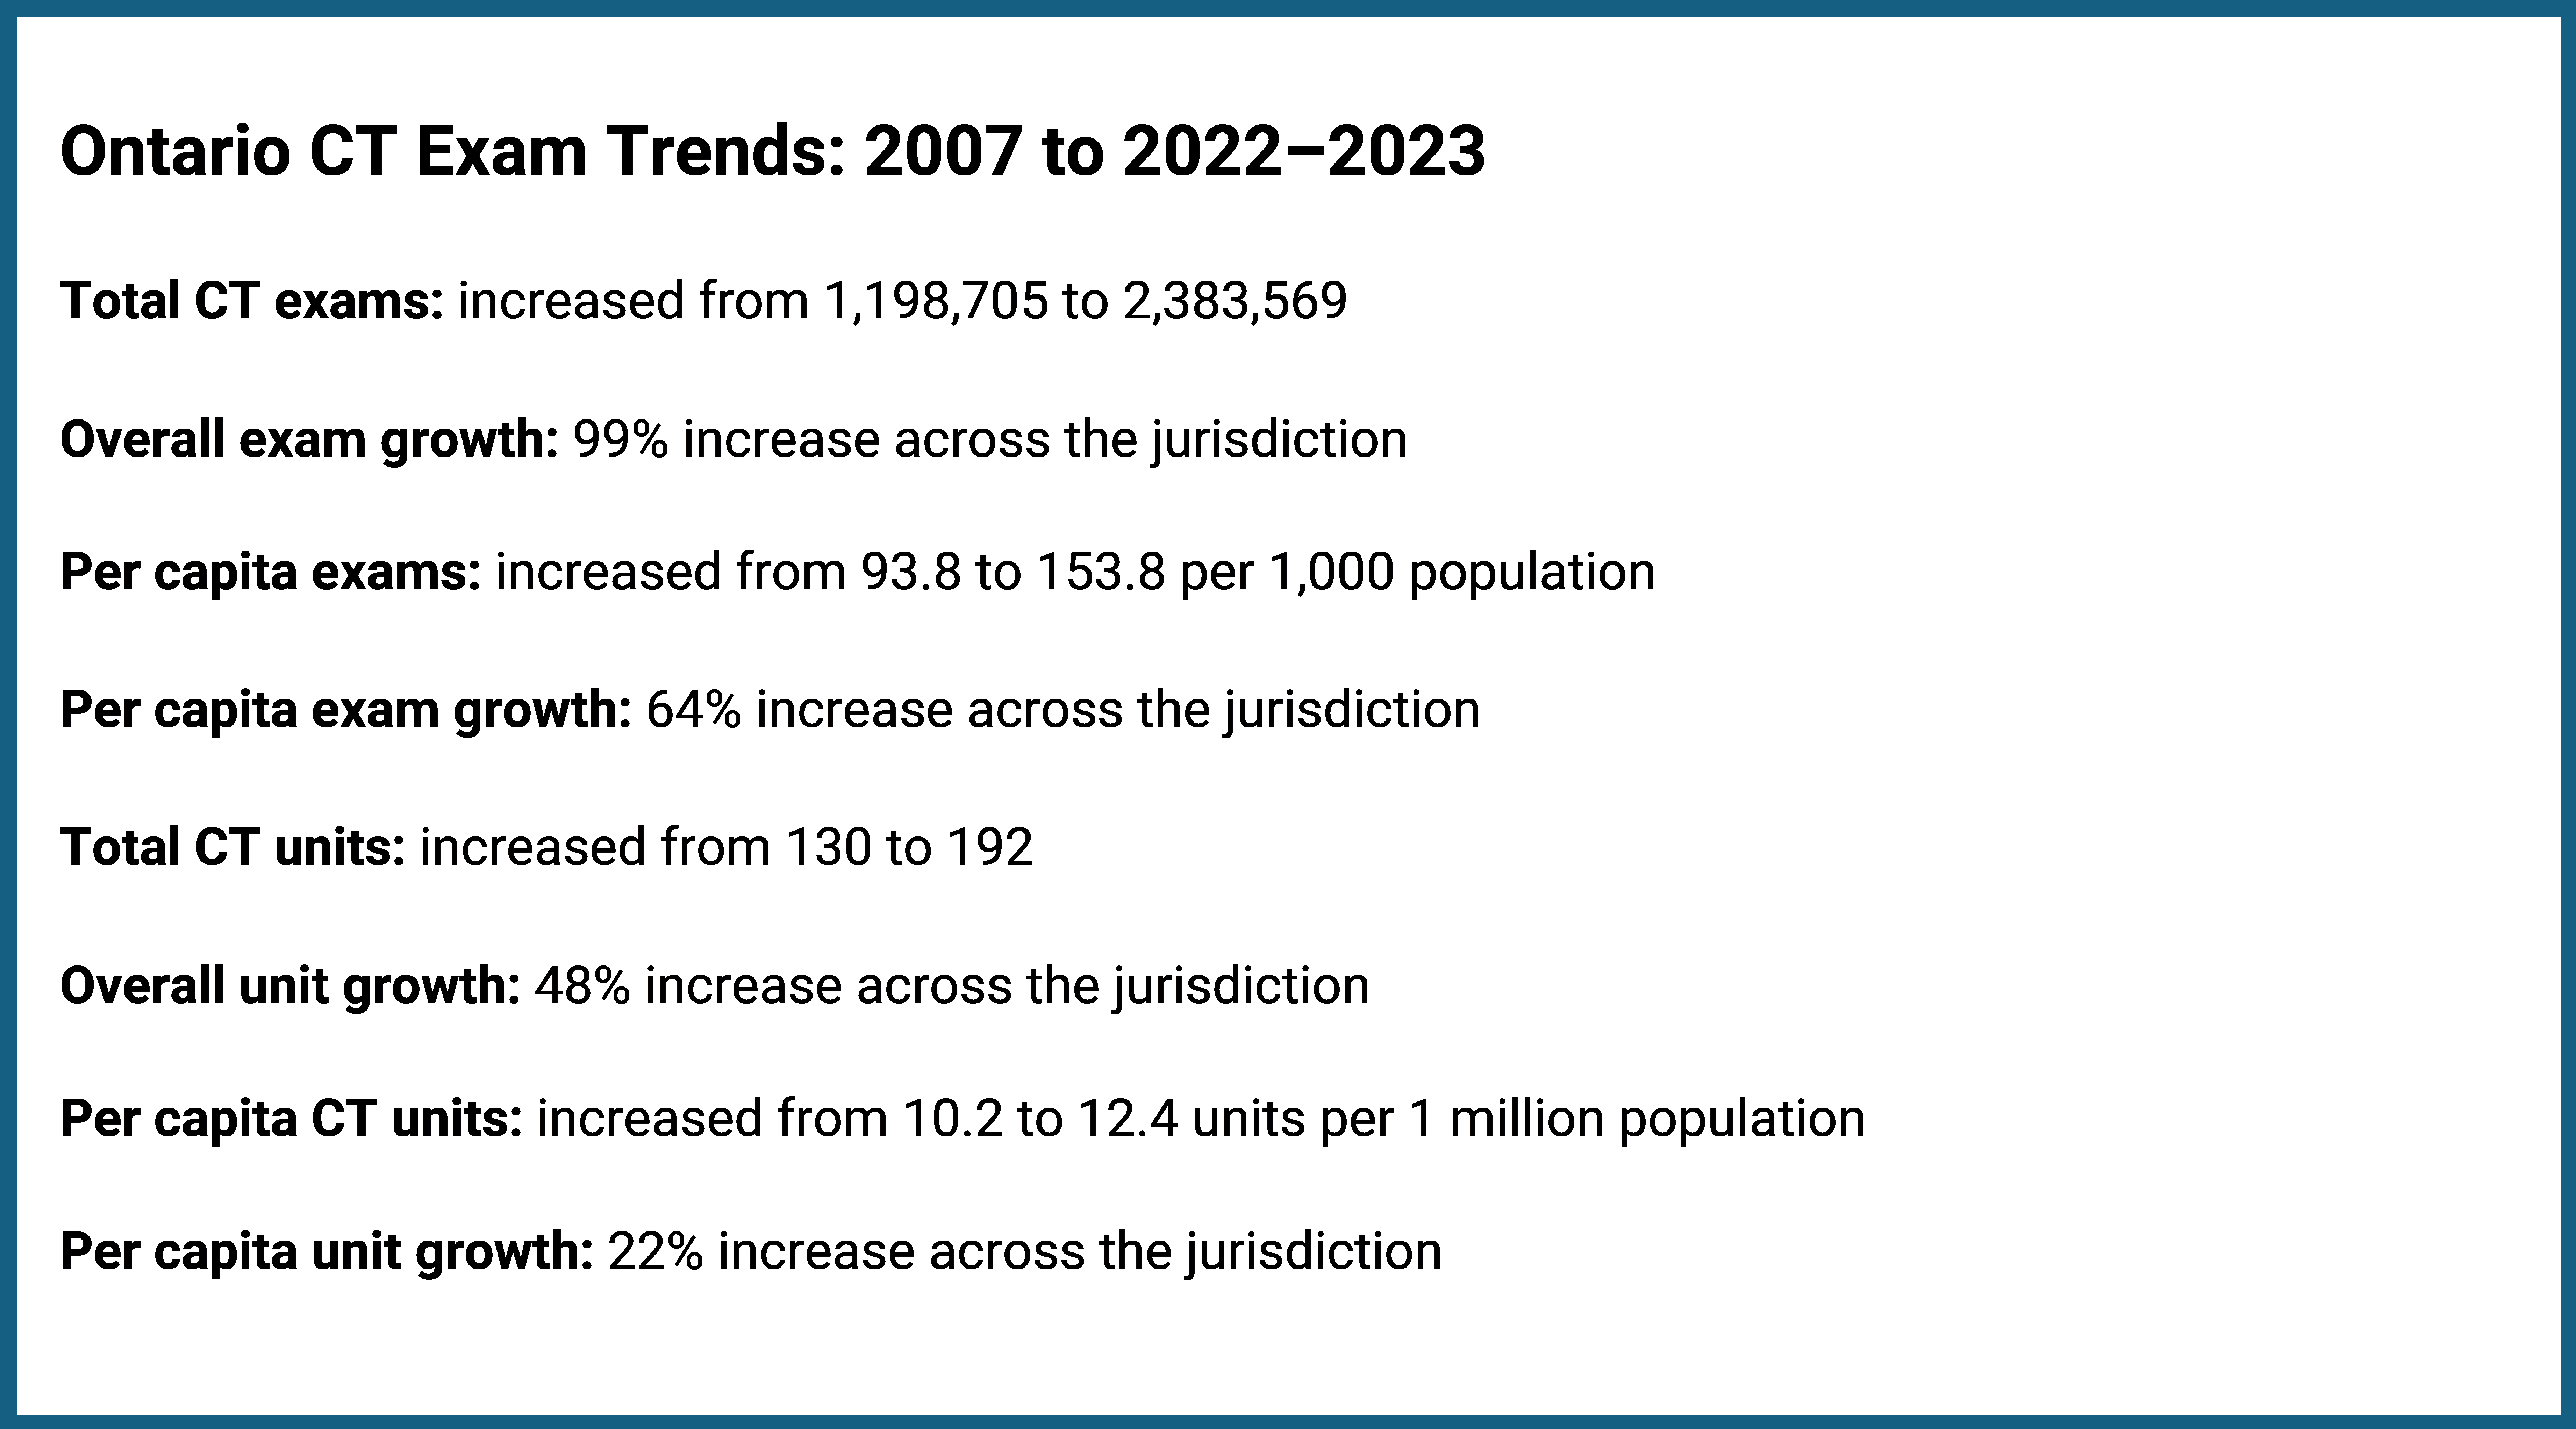
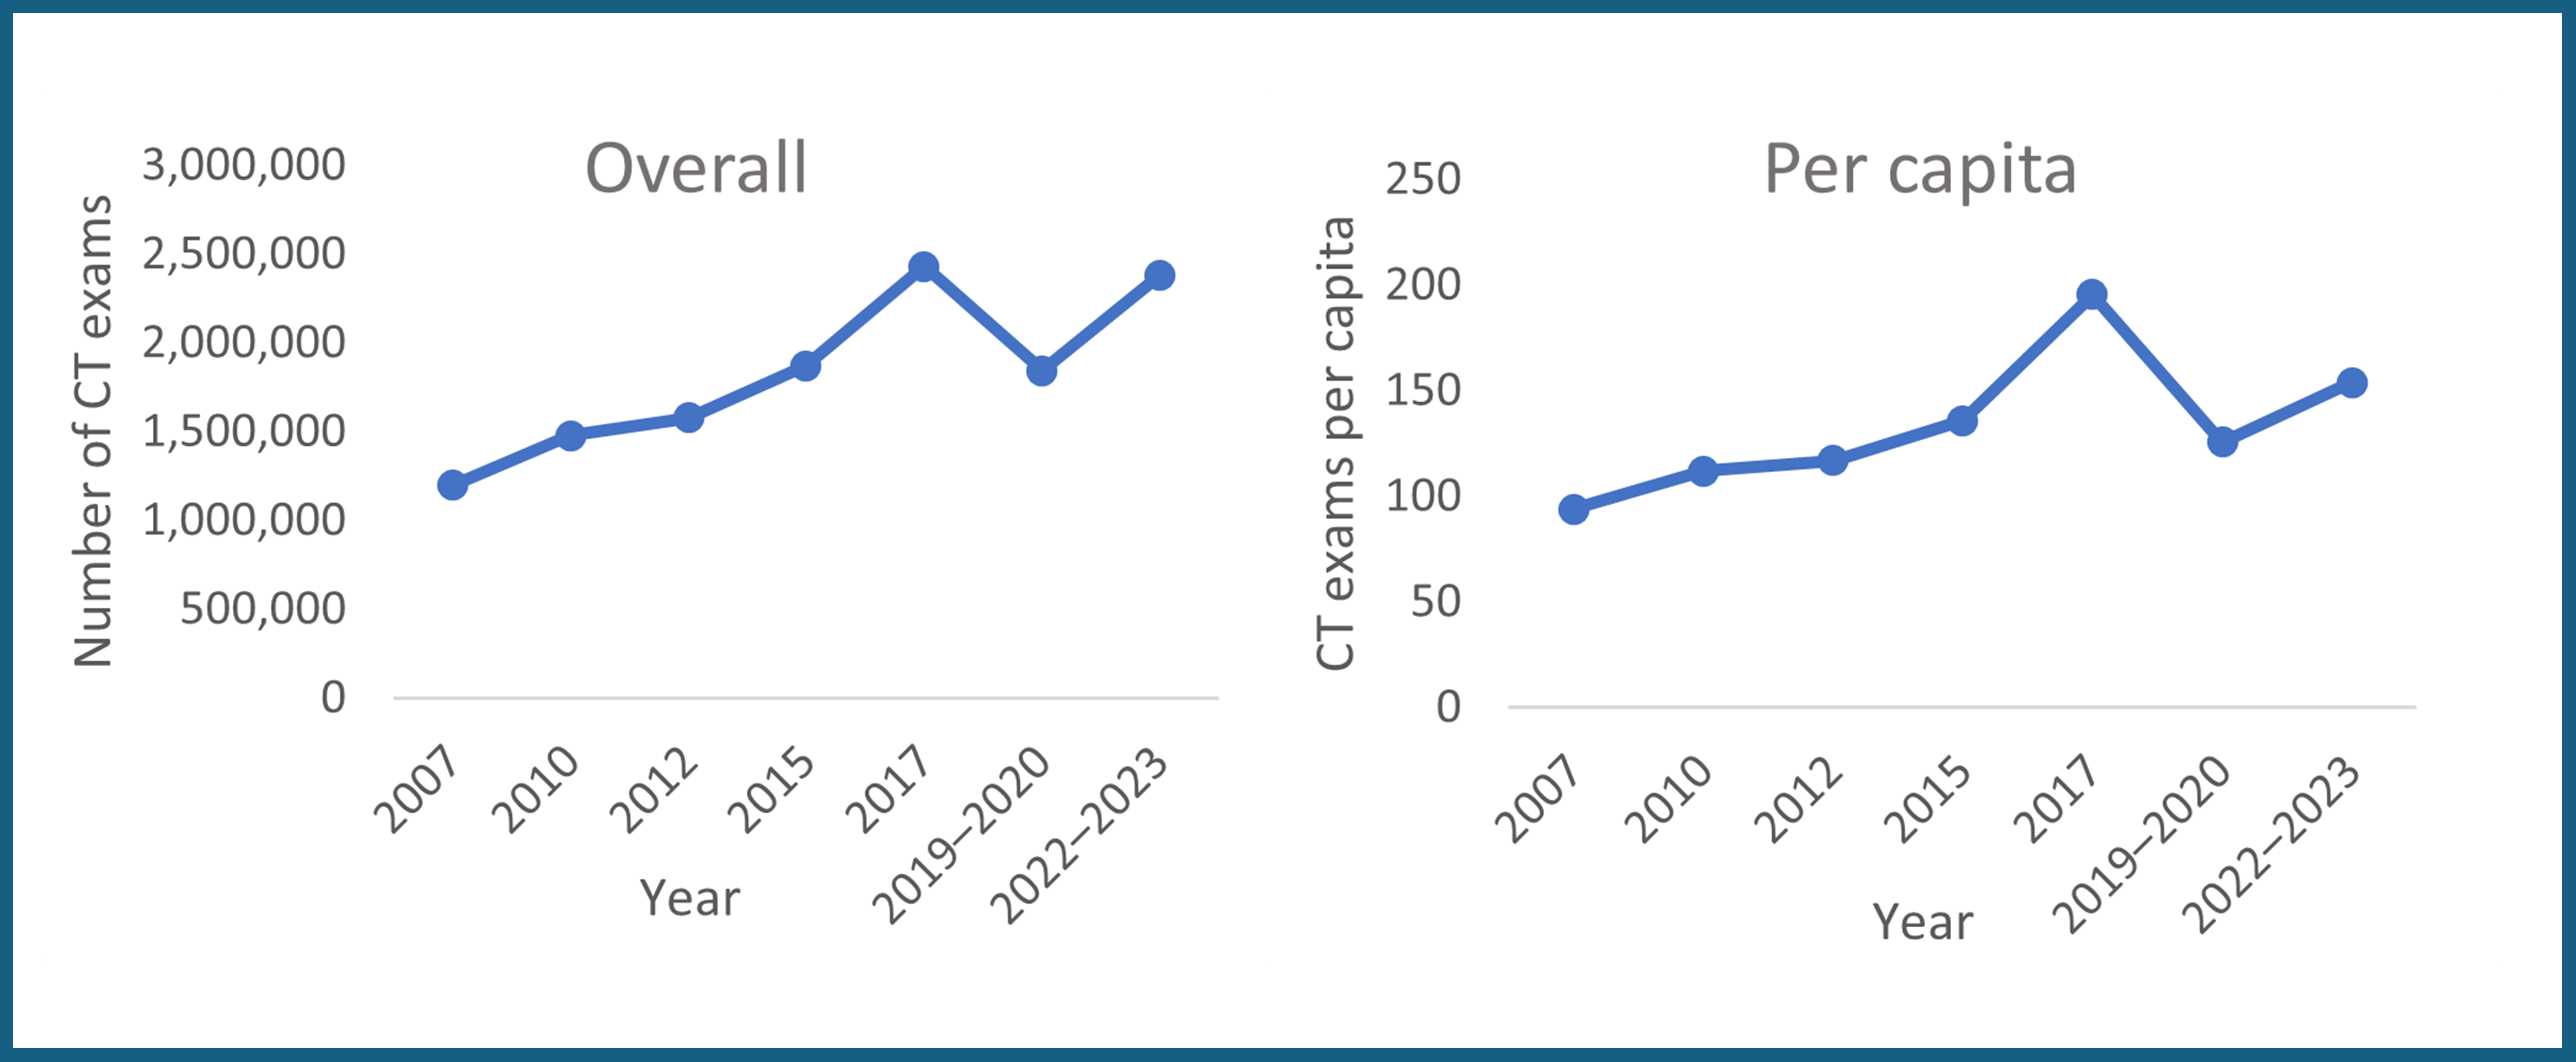
Ontario Growth Trends
Ontario’s total CT exam volume increased by 99%, whereas per capita growth was 64% (Figure 13 and Appendix 1, Table 1 and Table 2). Both figures were above the national averages of 90% and 57%, respectively. During this period, the number of CT units rose from 130 to 192, representing a 48% increase, whereas units per capita increased from 10.2 to 12.4, representing a 22% rise (Figure 13 and Appendix 1, Table 3 and Table 4).
Ontario experienced overall and per capita growth during the 16-year period. Growth in CT exams for both was gradual for 10 years, between 2007 and 2017. Exam volumes peaked in 2017, followed by a period of decline in 2019–2020 and a subsequent increase through to 2022–2023 (Figure 14).
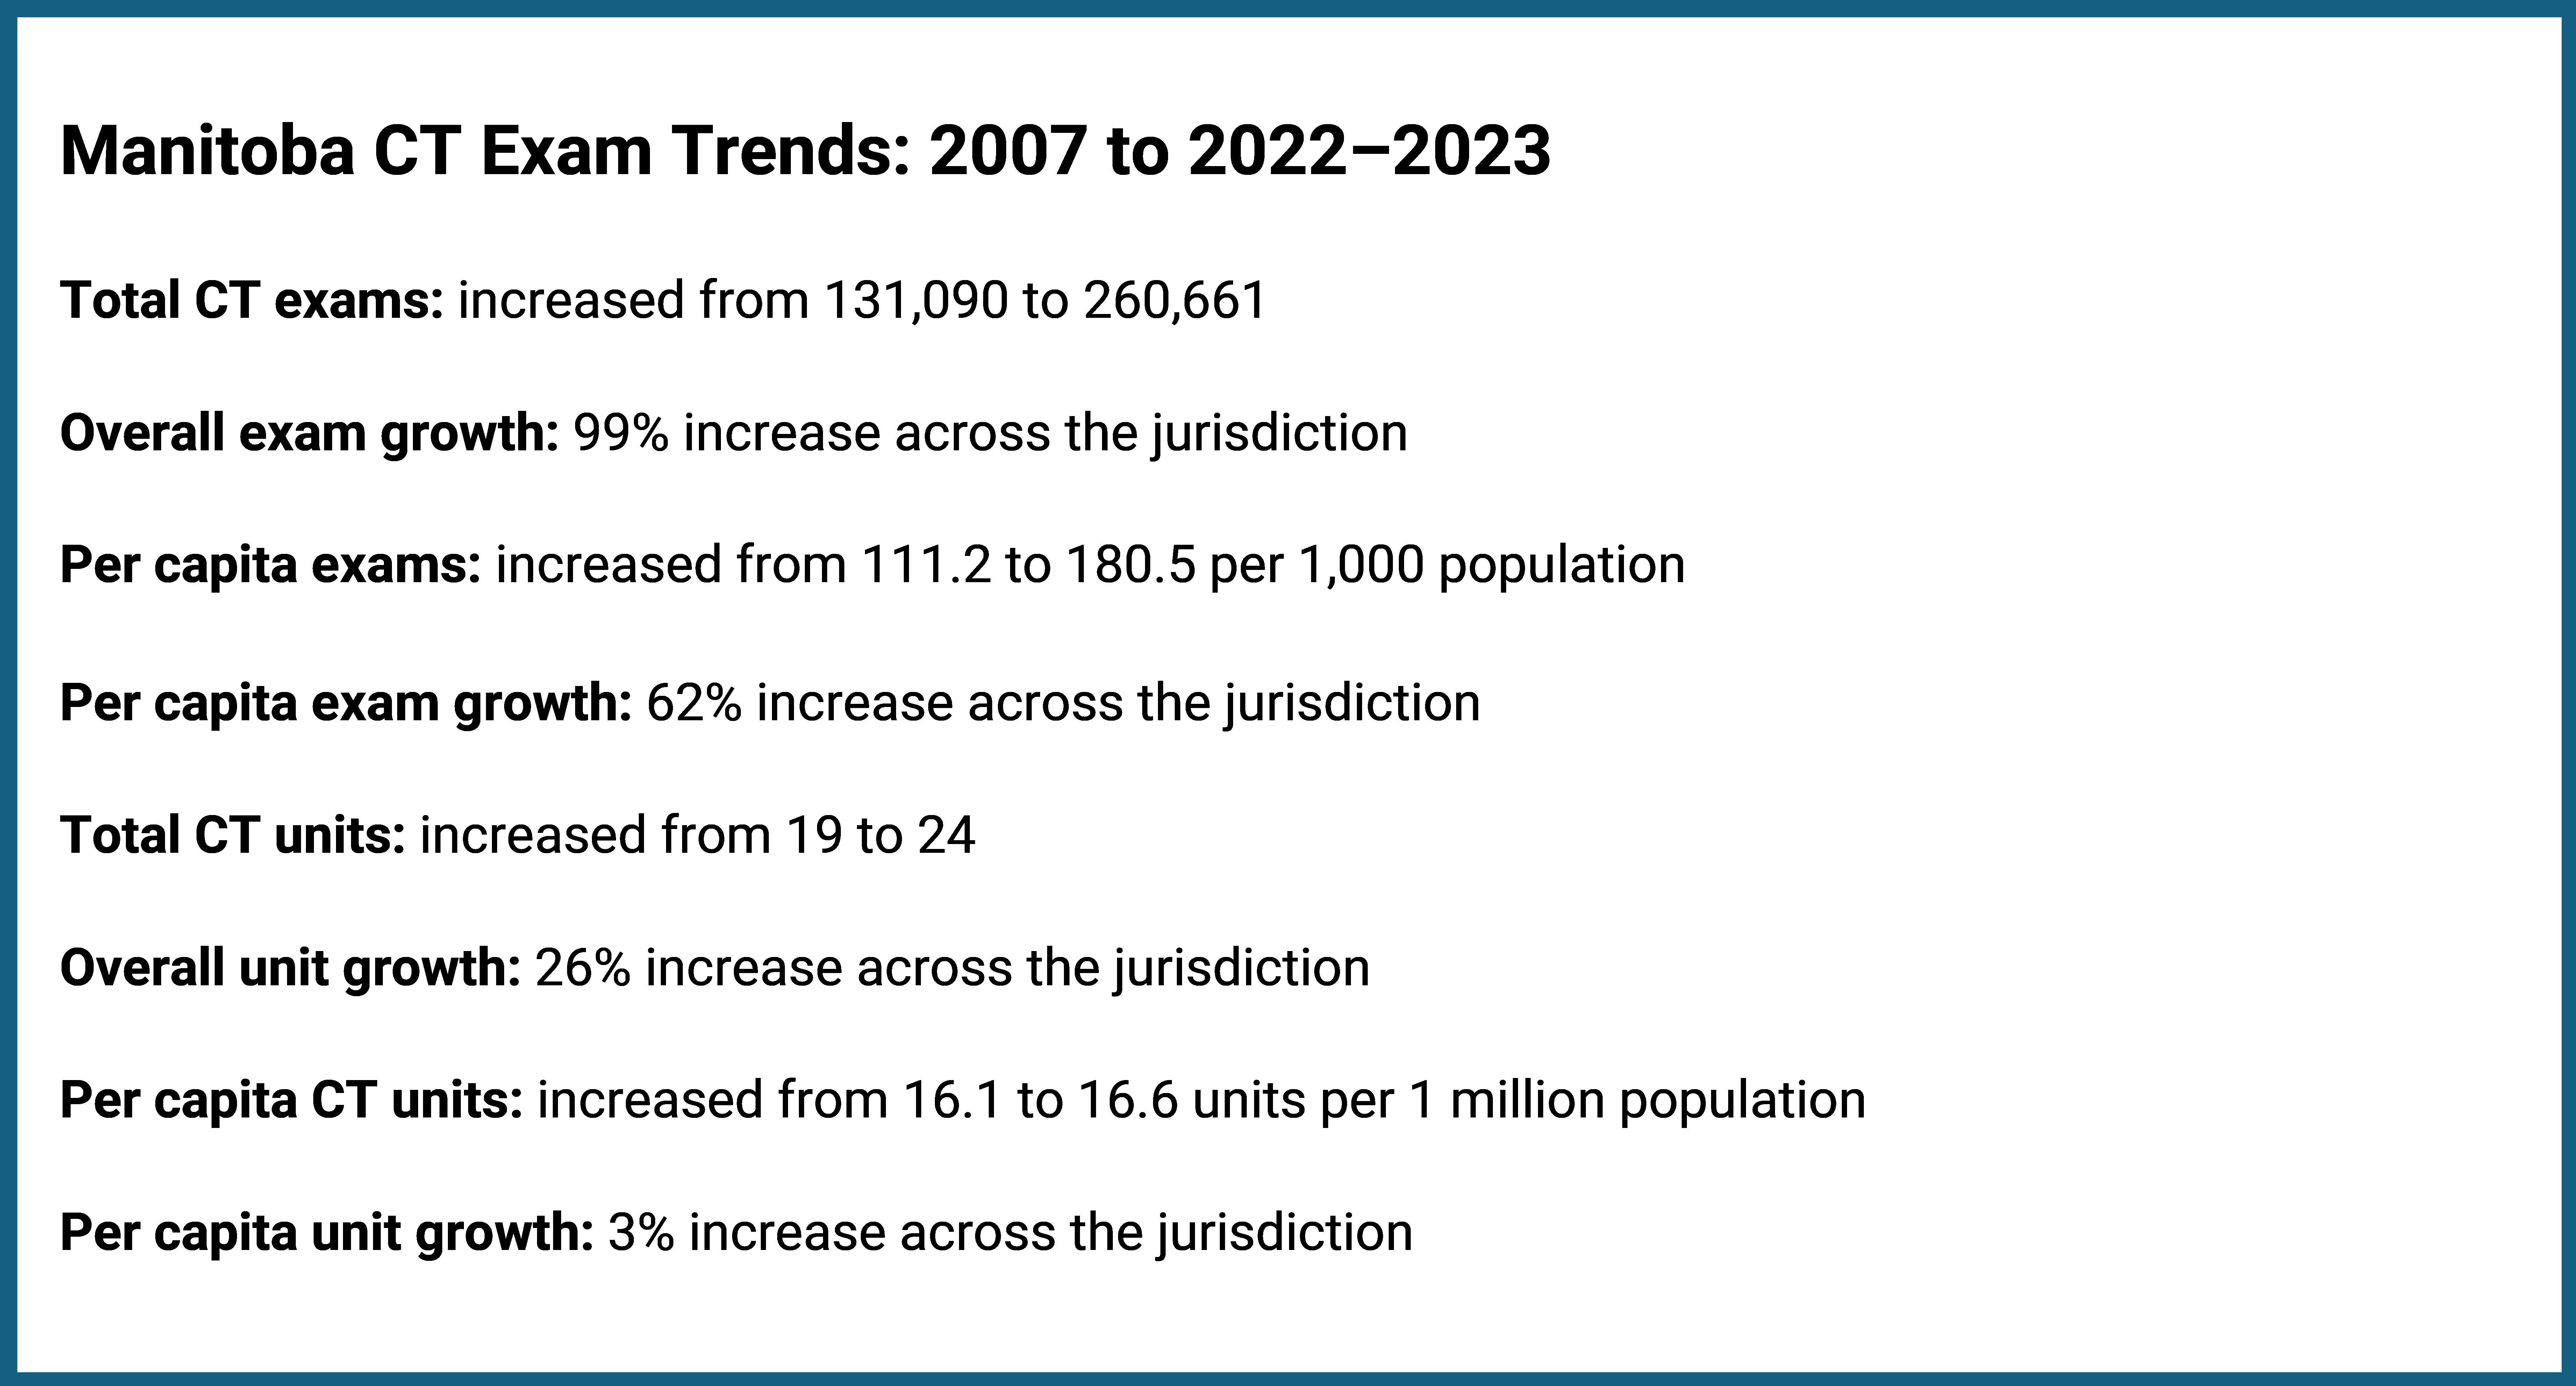
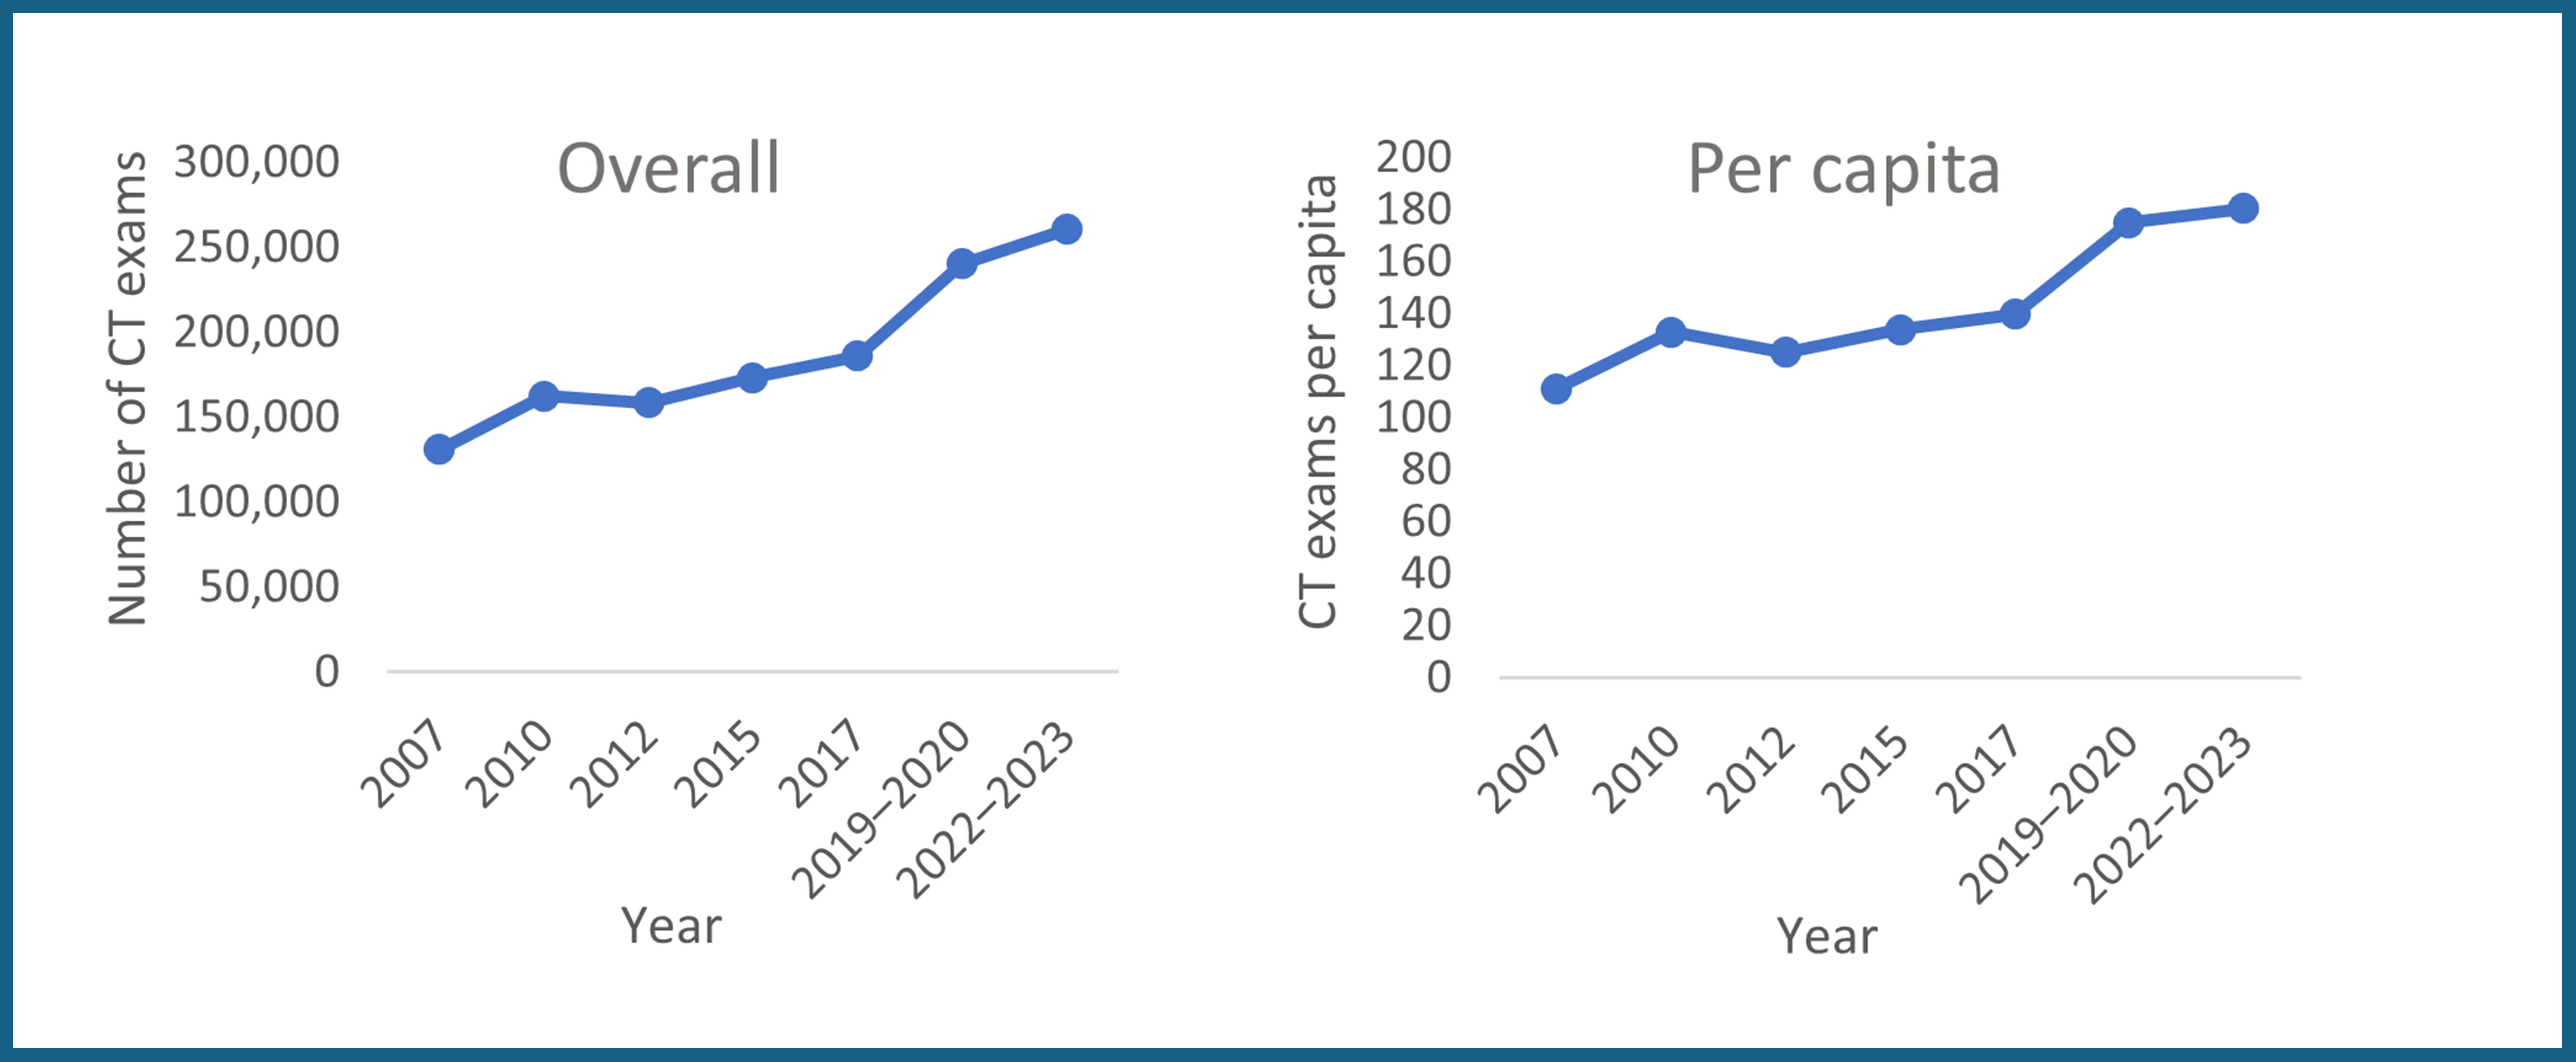
Manitoba Growth Trends
Manitoba’s total CT exam volume increased by 99%, whereas per capita growth was 62% (Figure 15 and Appendix 1, Table 1 and Table 2). Both figures were above the national averages of 90% and 57%, respectively. During this period, the number of CT units rose from 19 to 24, representing a 26% increase, whereas units per capita increased slightly from 16.1 to 16.6, representing a 3% rise (Figure 15 and Appendix 1, Table 3 and Table 4).
Manitoba experienced a gradual increase in overall and per capita exams over the 16 years, with a slight decrease in 2012 compared to 2010 for both. The period of greatest increase was between 2017 and 2019–2020 for both overall and per capita exams (Figure 16).
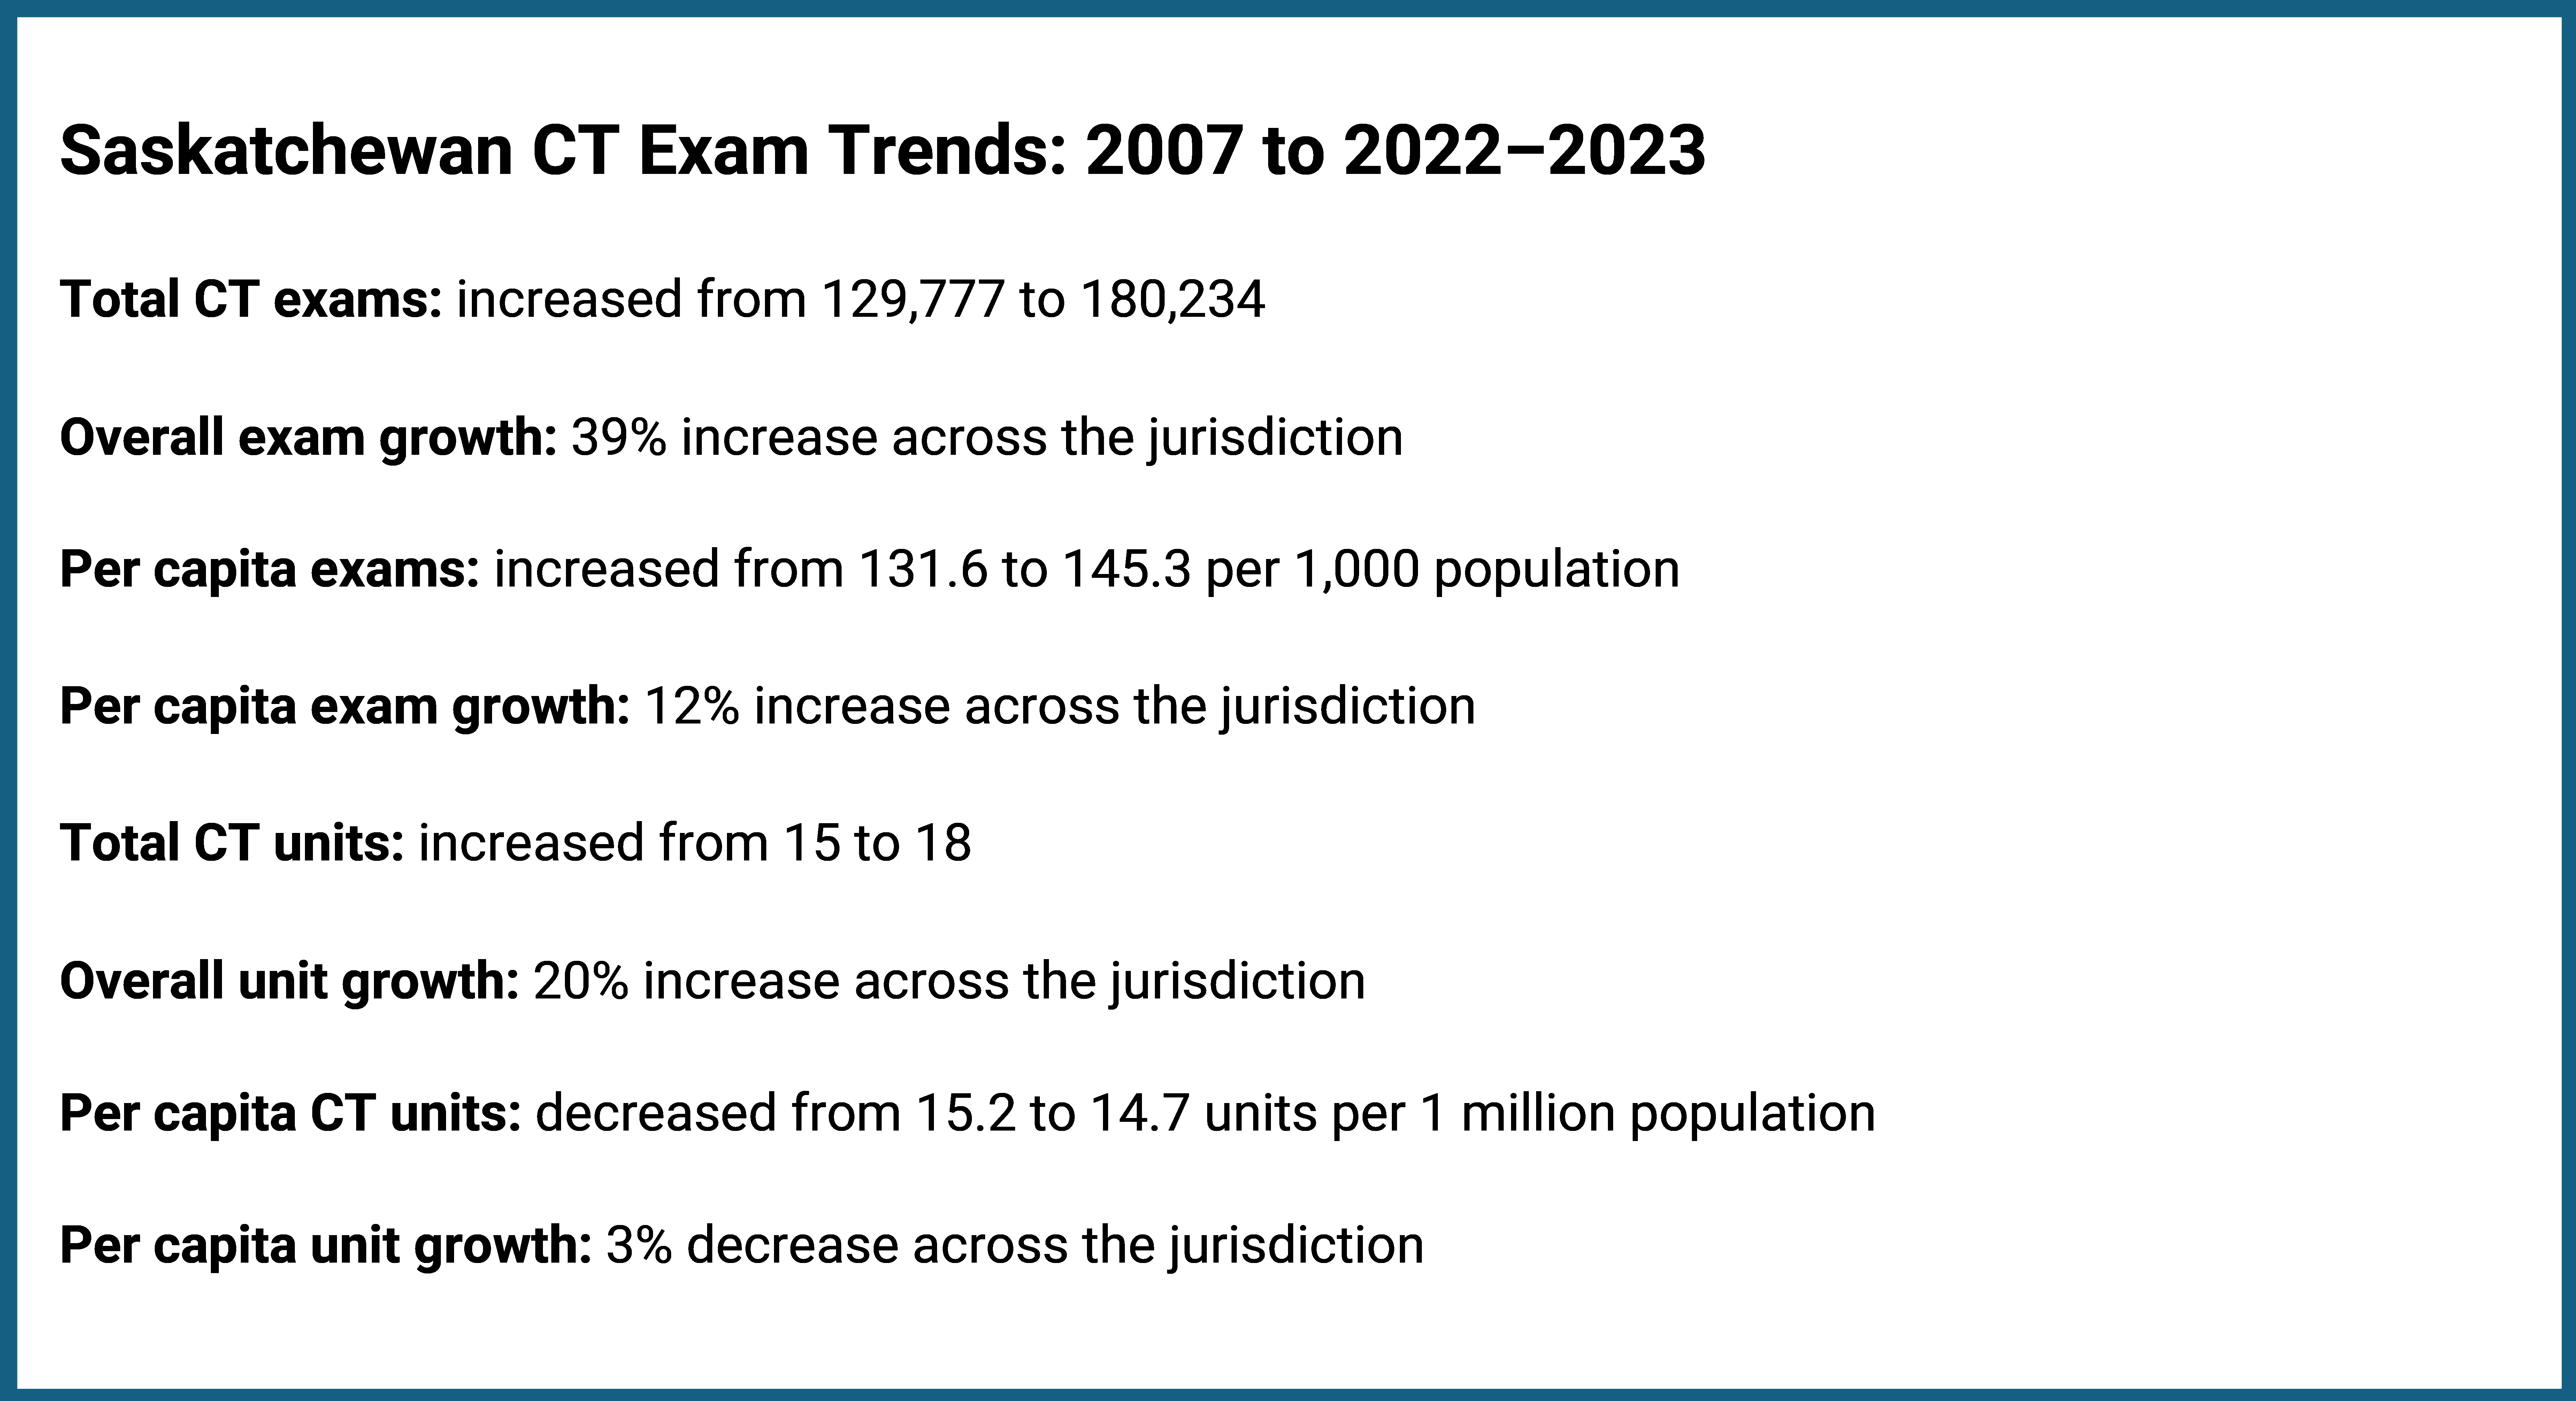
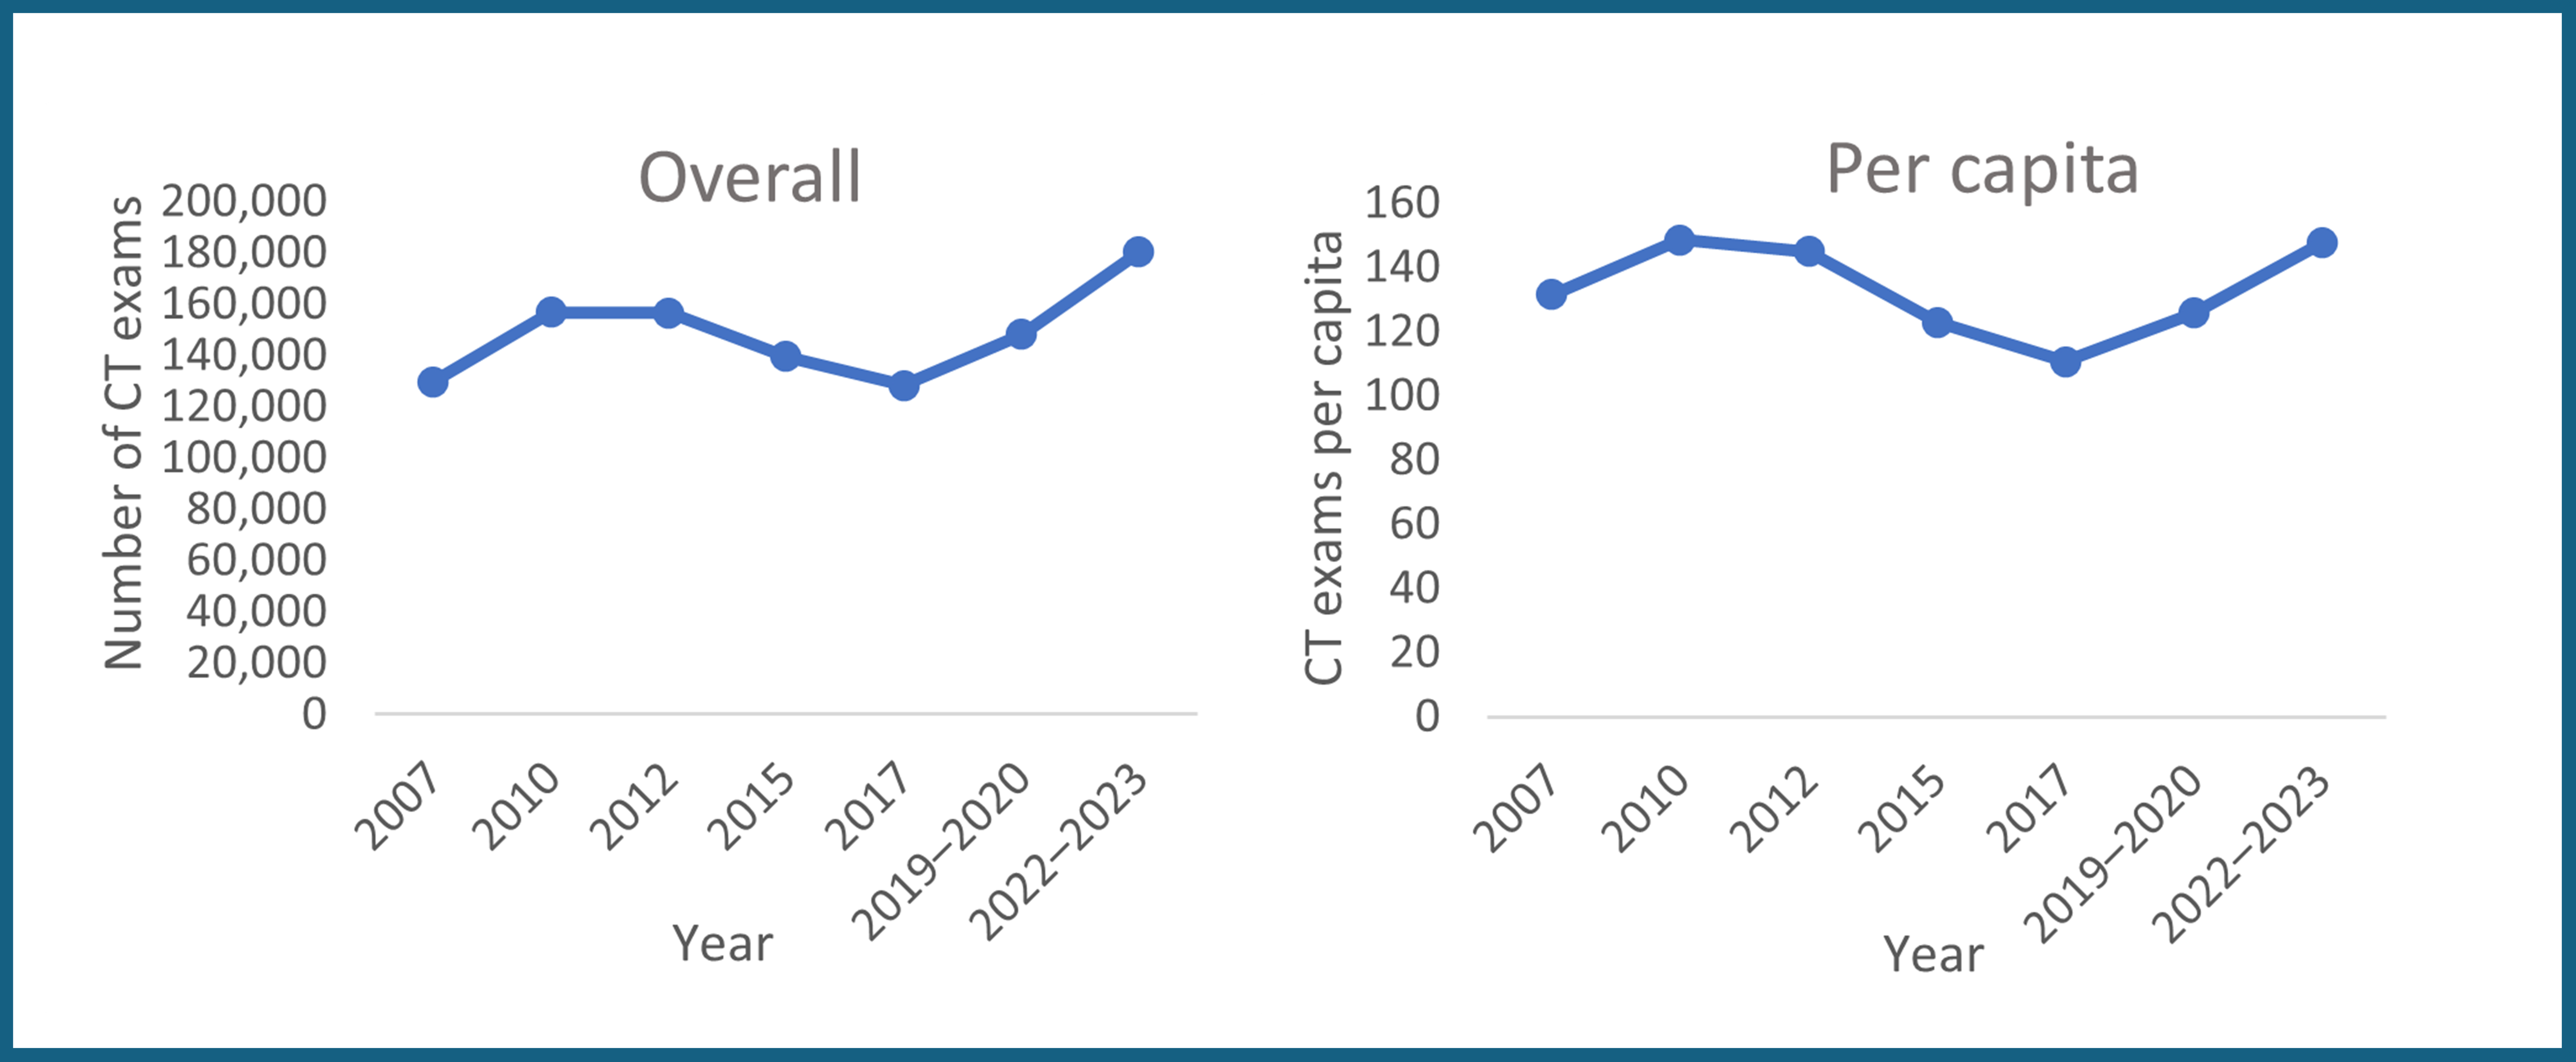
Saskatchewan Growth Trends
Saskatchewan’s total CT exam volume increased by 39%, whereas per capita growth was 12% (Figure 17 and Appendix 1, Table 1 and Table 2). Both figures were below the national averages of 90% and 57%, respectively. During this period, the number of CT units grew from 15 to 18, representing a 20% increase, whereas units per capita decreased slightly from 15.2 to 14.7, representing a 3% decrease (Figure 17 and Appendix 1, Table 3 and Table 4).
Saskatchewan's growth in overall and per capita CT exams slowed after 2010, continuing this downward trend until 2017, when exam numbers dropped to their lowest point, falling below the 2007 baseline. Between 2019–2020 and 2022–2023, exam numbers began to rise again, with overall exams and per capita exams surpassing the 2007 baseline by 2022–2023 (Figure 18).
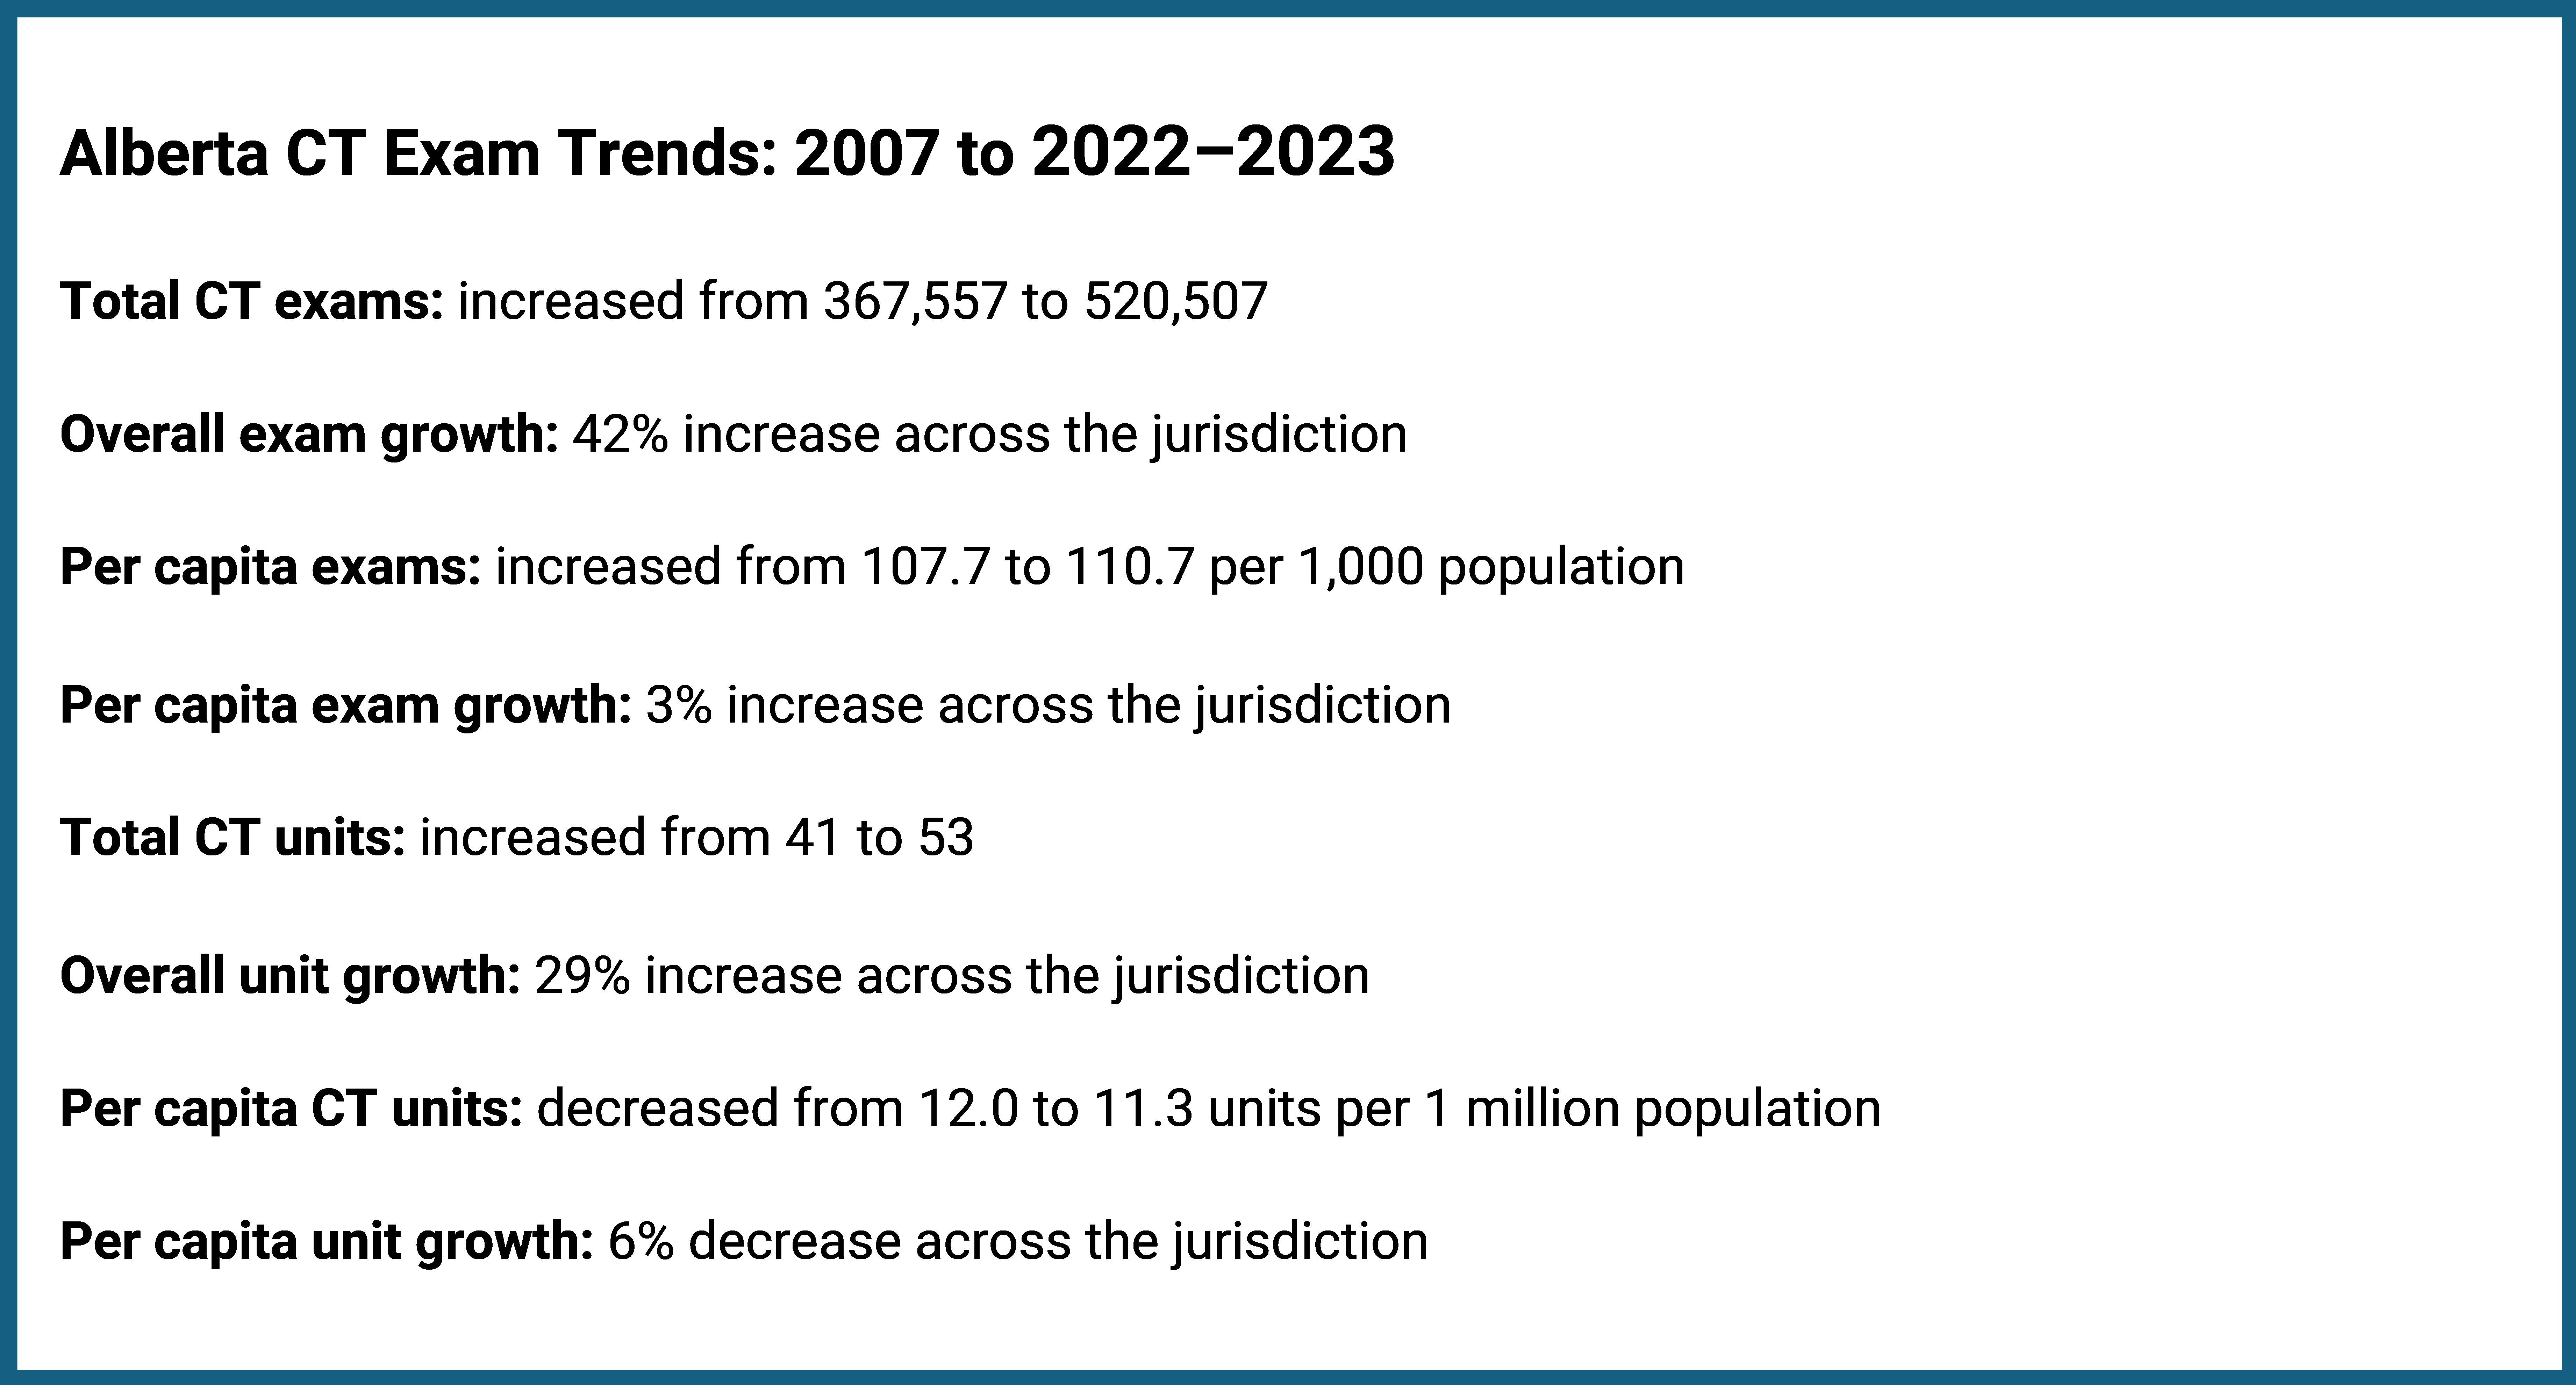
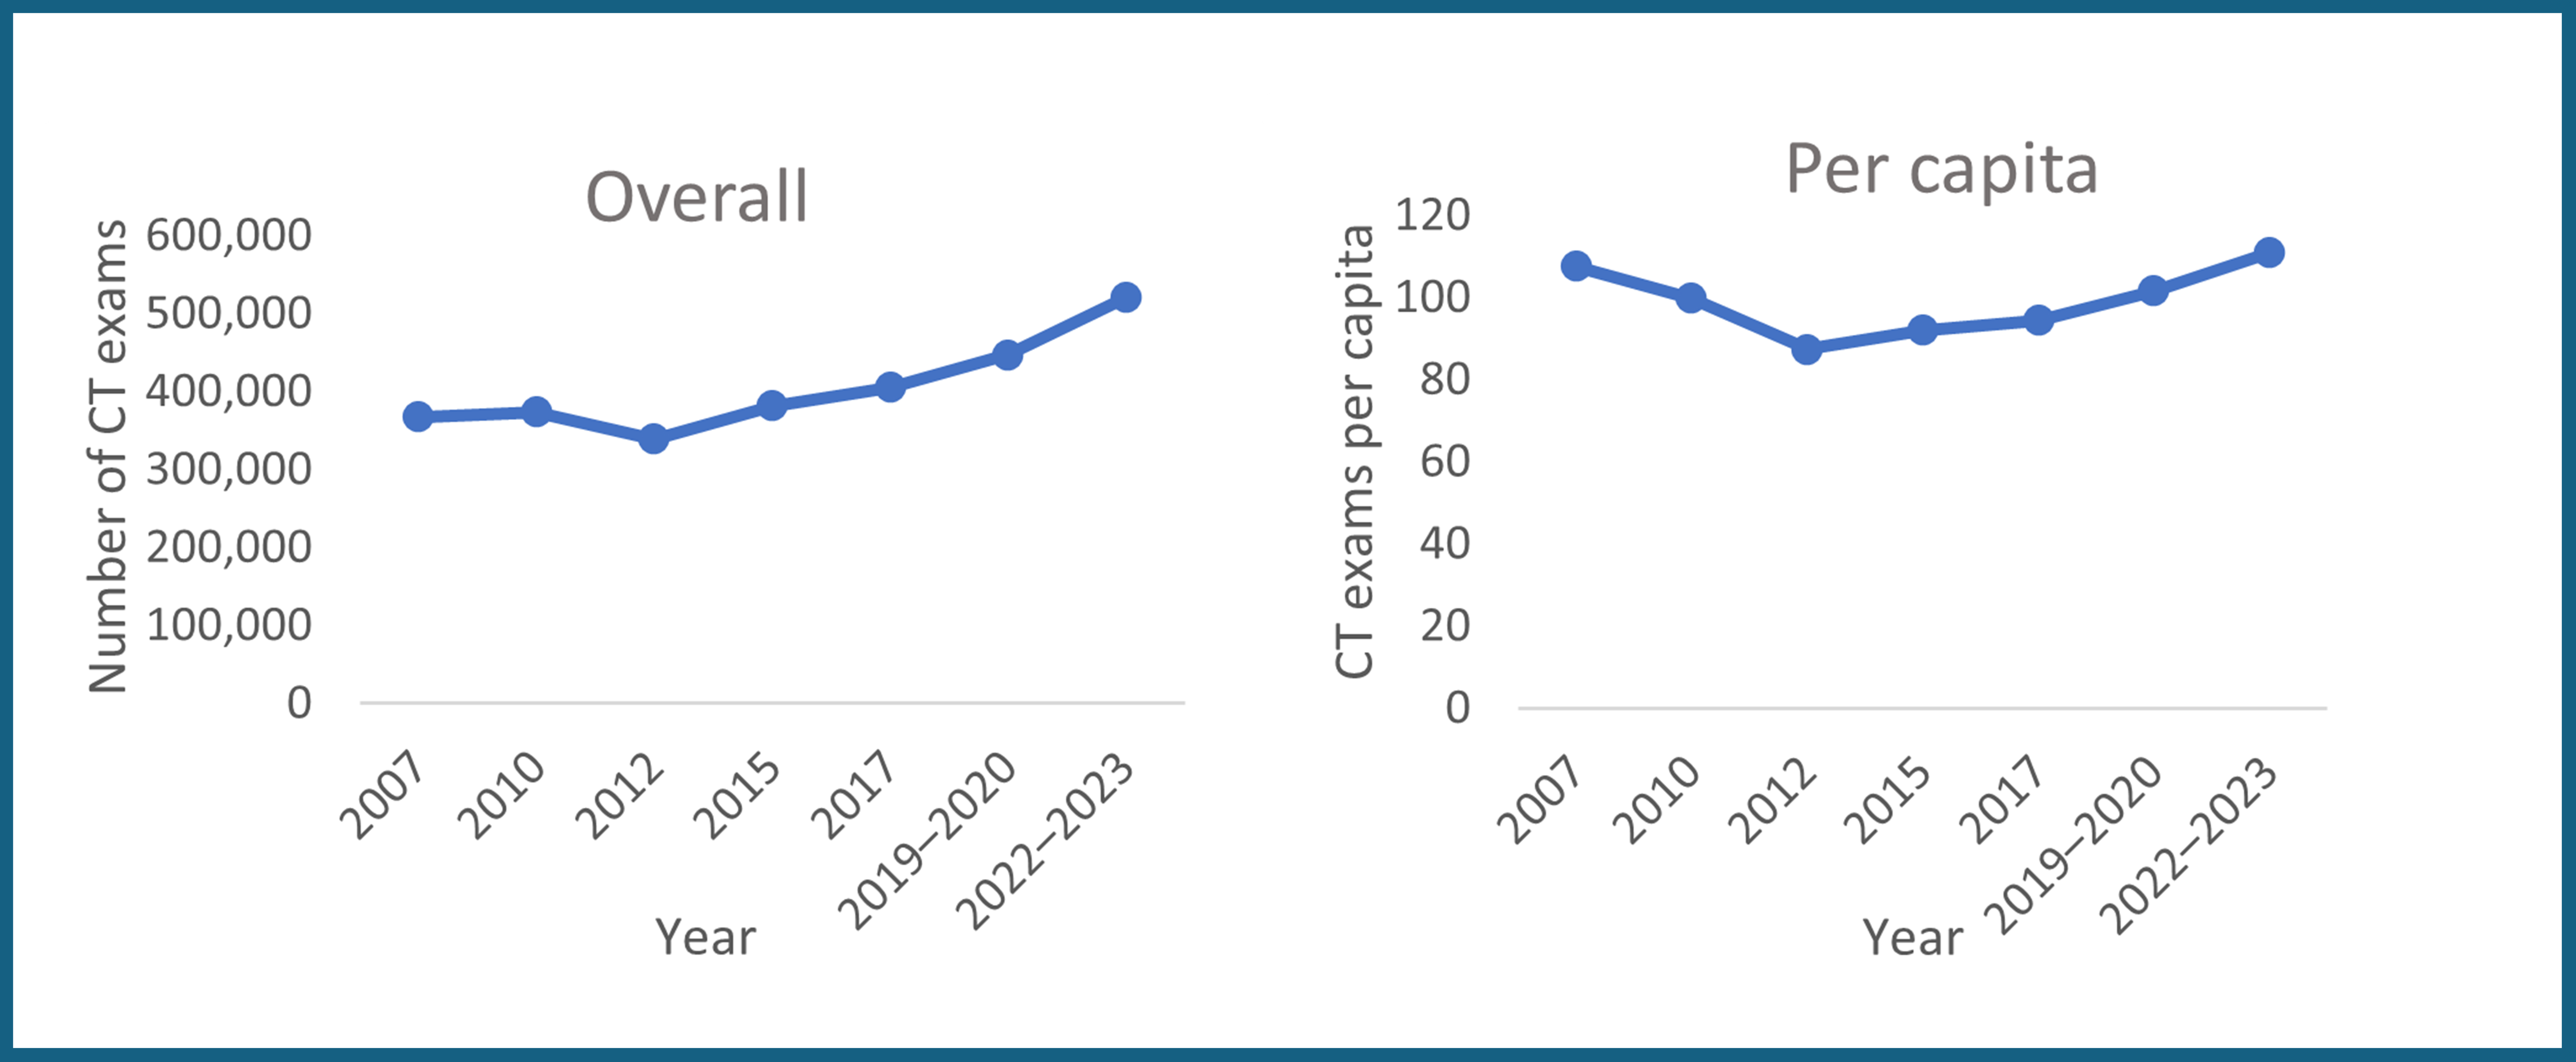
Alberta Growth Trends
Alberta’s total CT exam volume increased by 42%, whereas per capita growth was 3% (Figure 19 and Appendix 1, Table 1 and Table 2). Both figures were below the national averages of 90% and 57%, respectively. During this period, the number of CT units rose from 41 to 53, representing a 29% increase, whereas units per capita decreased from 12.0 to 11.3, representing a 6% decrease (Figure 19 and Appendix 1, Table 3 and Table 4).
Alberta experienced overall and per capita growth over the 16-year period. CT exam volumes gradually increased for both between 2007 and 2010, followed by a slight dip in 2012. After 2015, exam volumes rose again, forming a steady upward trajectory through to 2022–2023 (Figure 20).
British Columbia Growth Trends
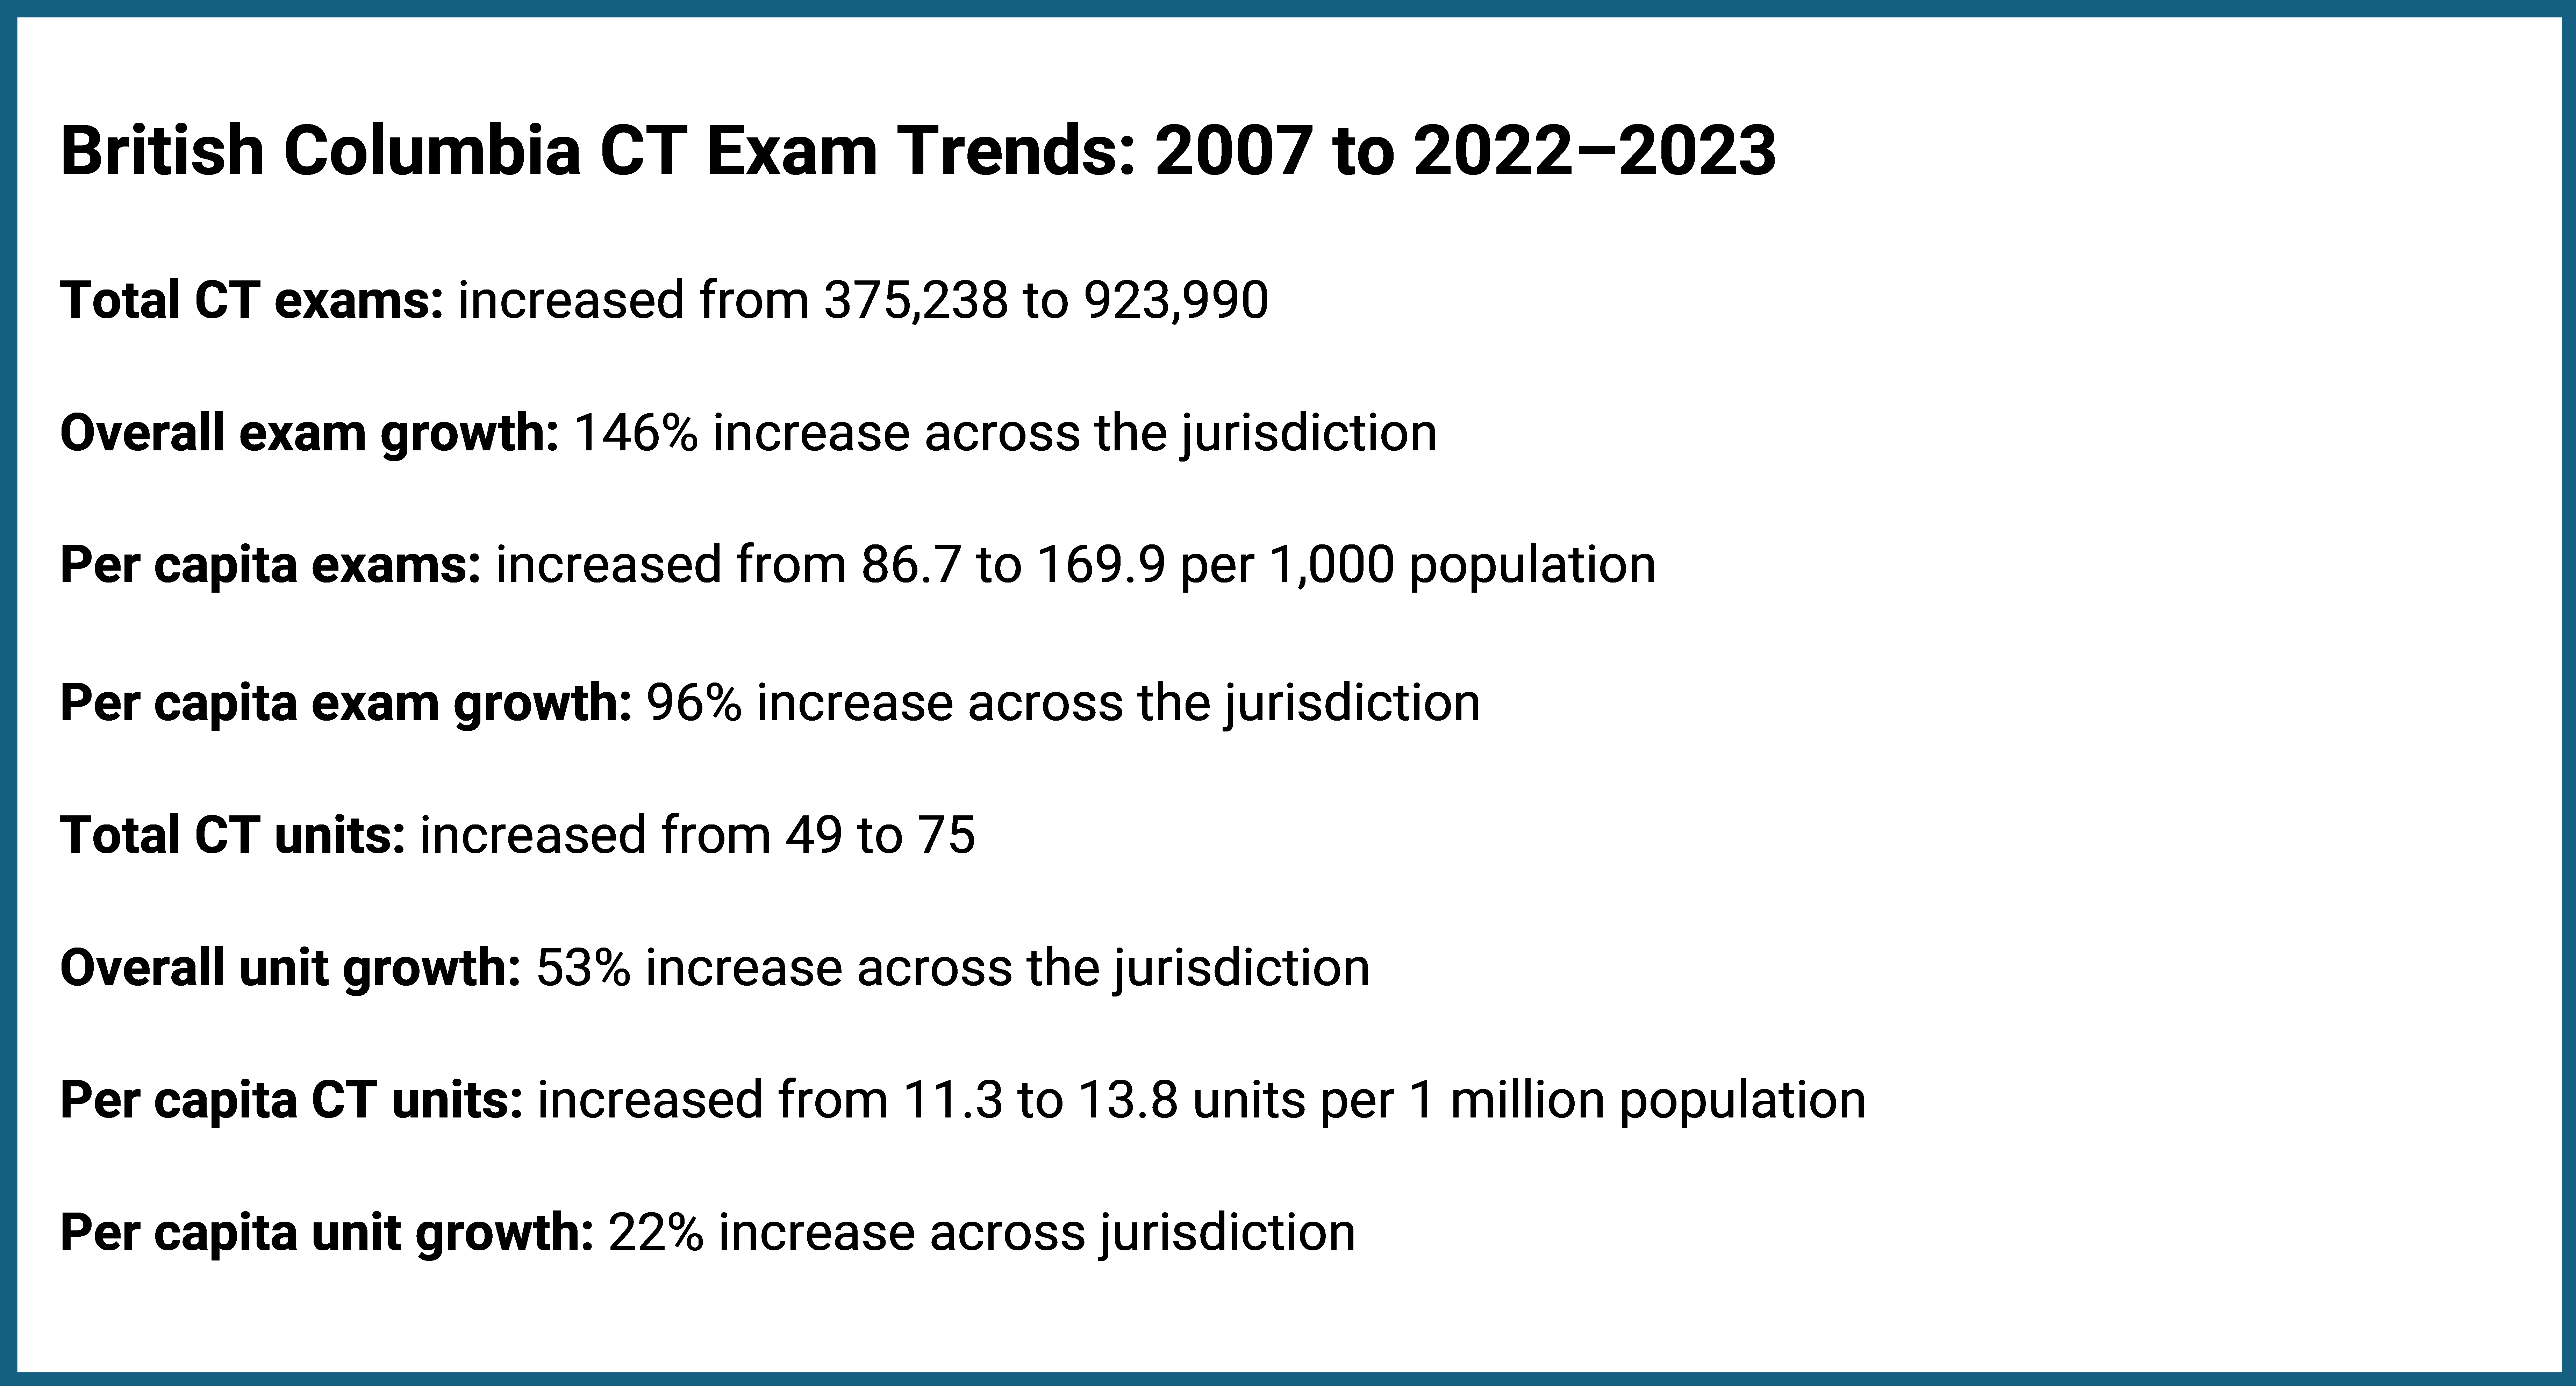
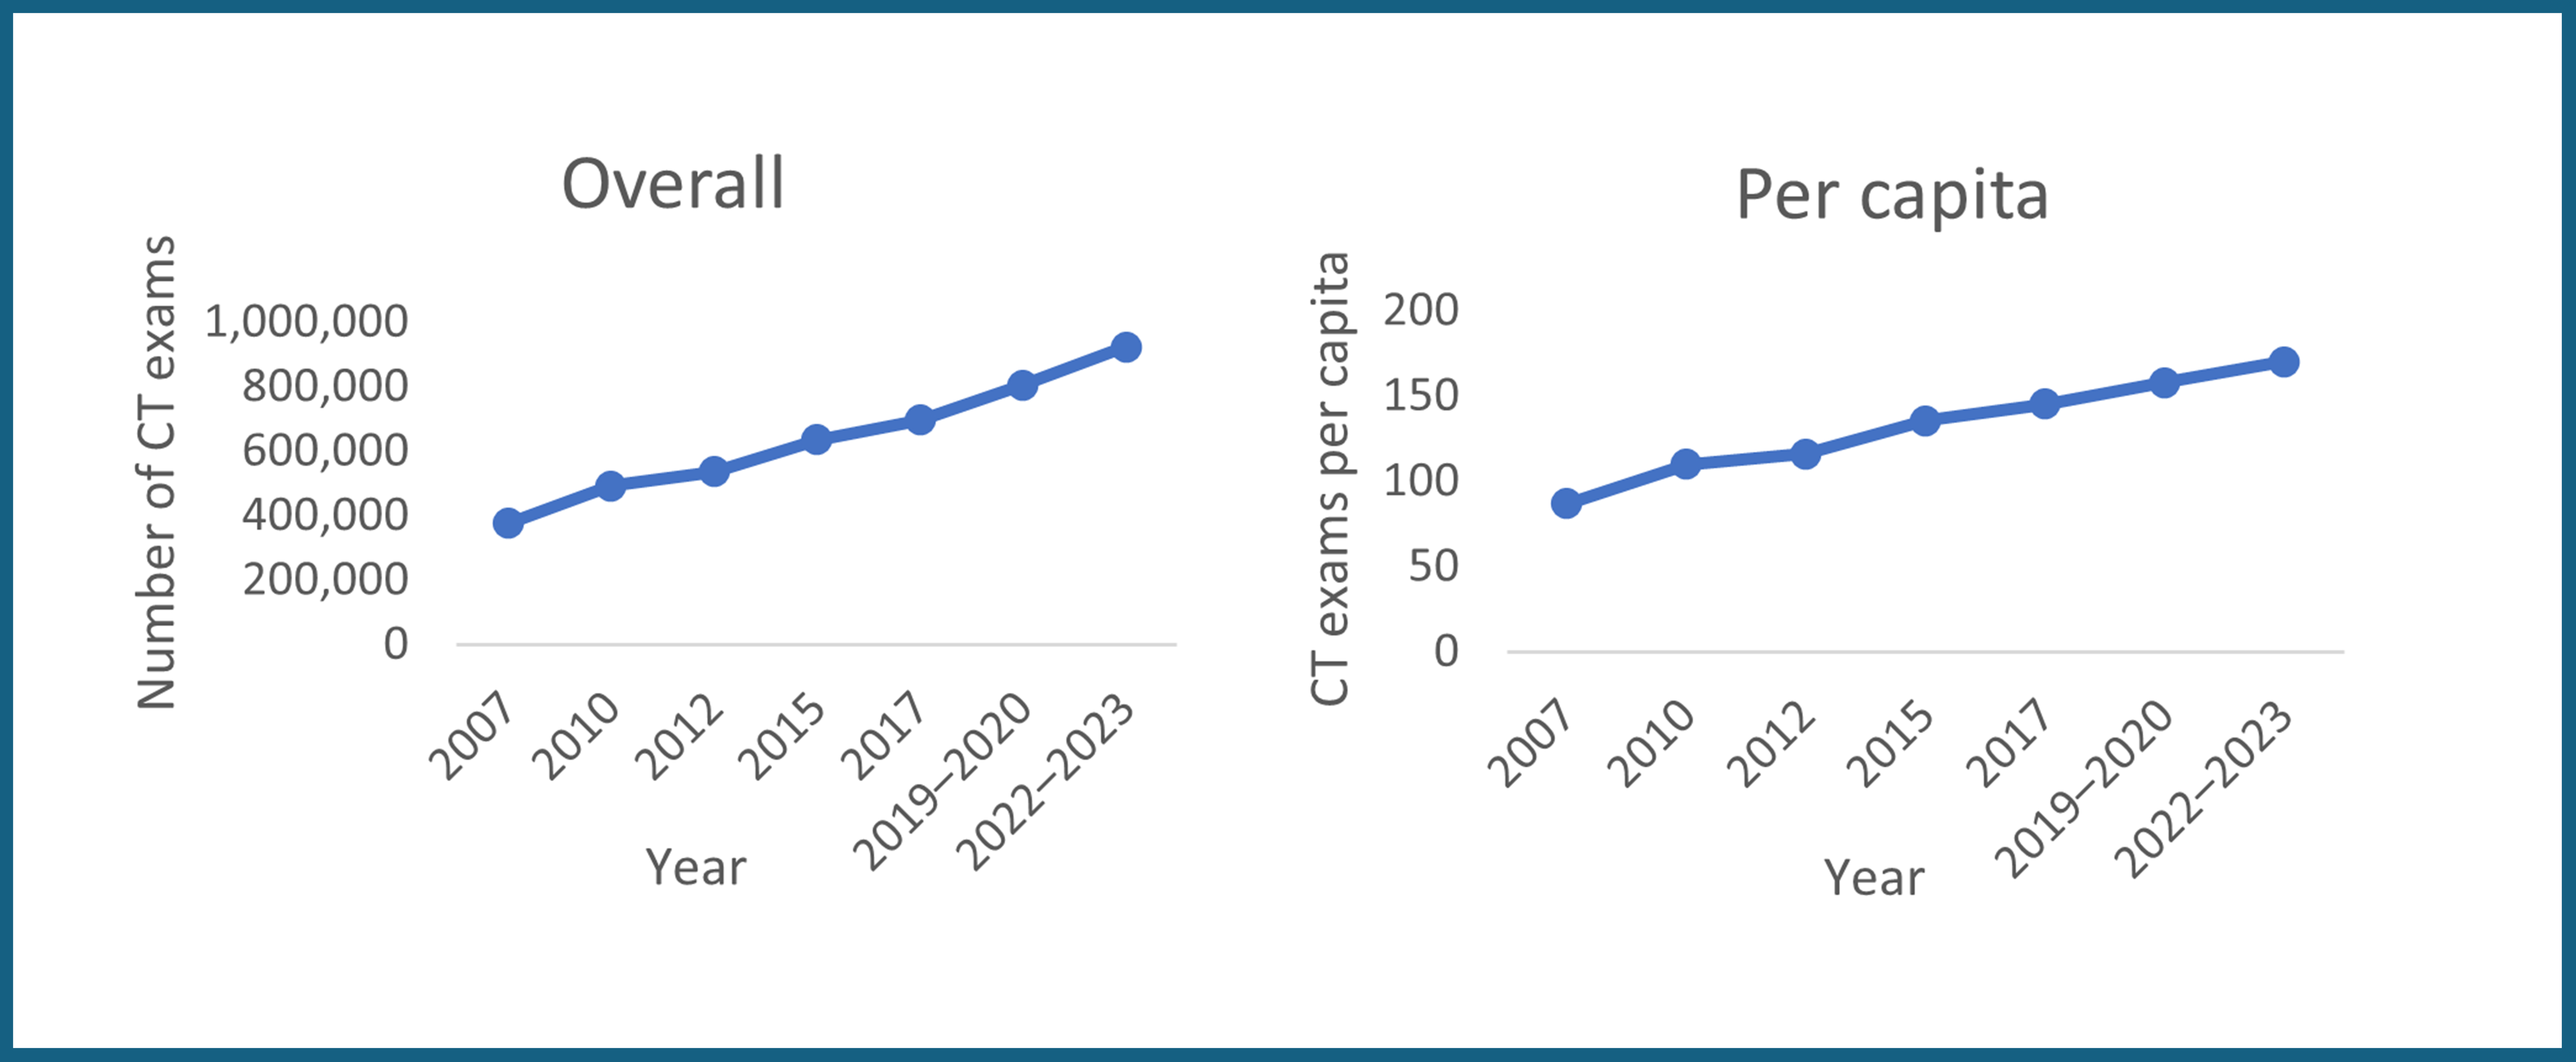
British Columbia’s total CT exam volume increased by 146%, whereas per capita growth was 96% (Figure 21 and Appendix 1, Table 1 and Table 2). Both figures were well above the national averages of 90% and 57%, respectively. During this period, the number of CT units rose from 49 to 75, representing a 53% increase, whereas units per capita increased from 11.3 to 13.8, representing a 22% rise (Figure 21 and Appendix 1, Table 3 and Table 4).
These figures positioned British Columbia among the top 3 jurisdictions for total and per capita percentage CT exam growth over the time period. However, it is noted that its share of overall CT exam volumes remained between 11% and 15% of the national total for each reporting year.
British Columbia experienced consistent year-over-year increases in overall and per capita CT exam growth throughout the 16-year period, reflecting a steady upward trajectory for each reporting year between 2007 and 2022–2023 (Figure 22).
Yukon Growth Trends
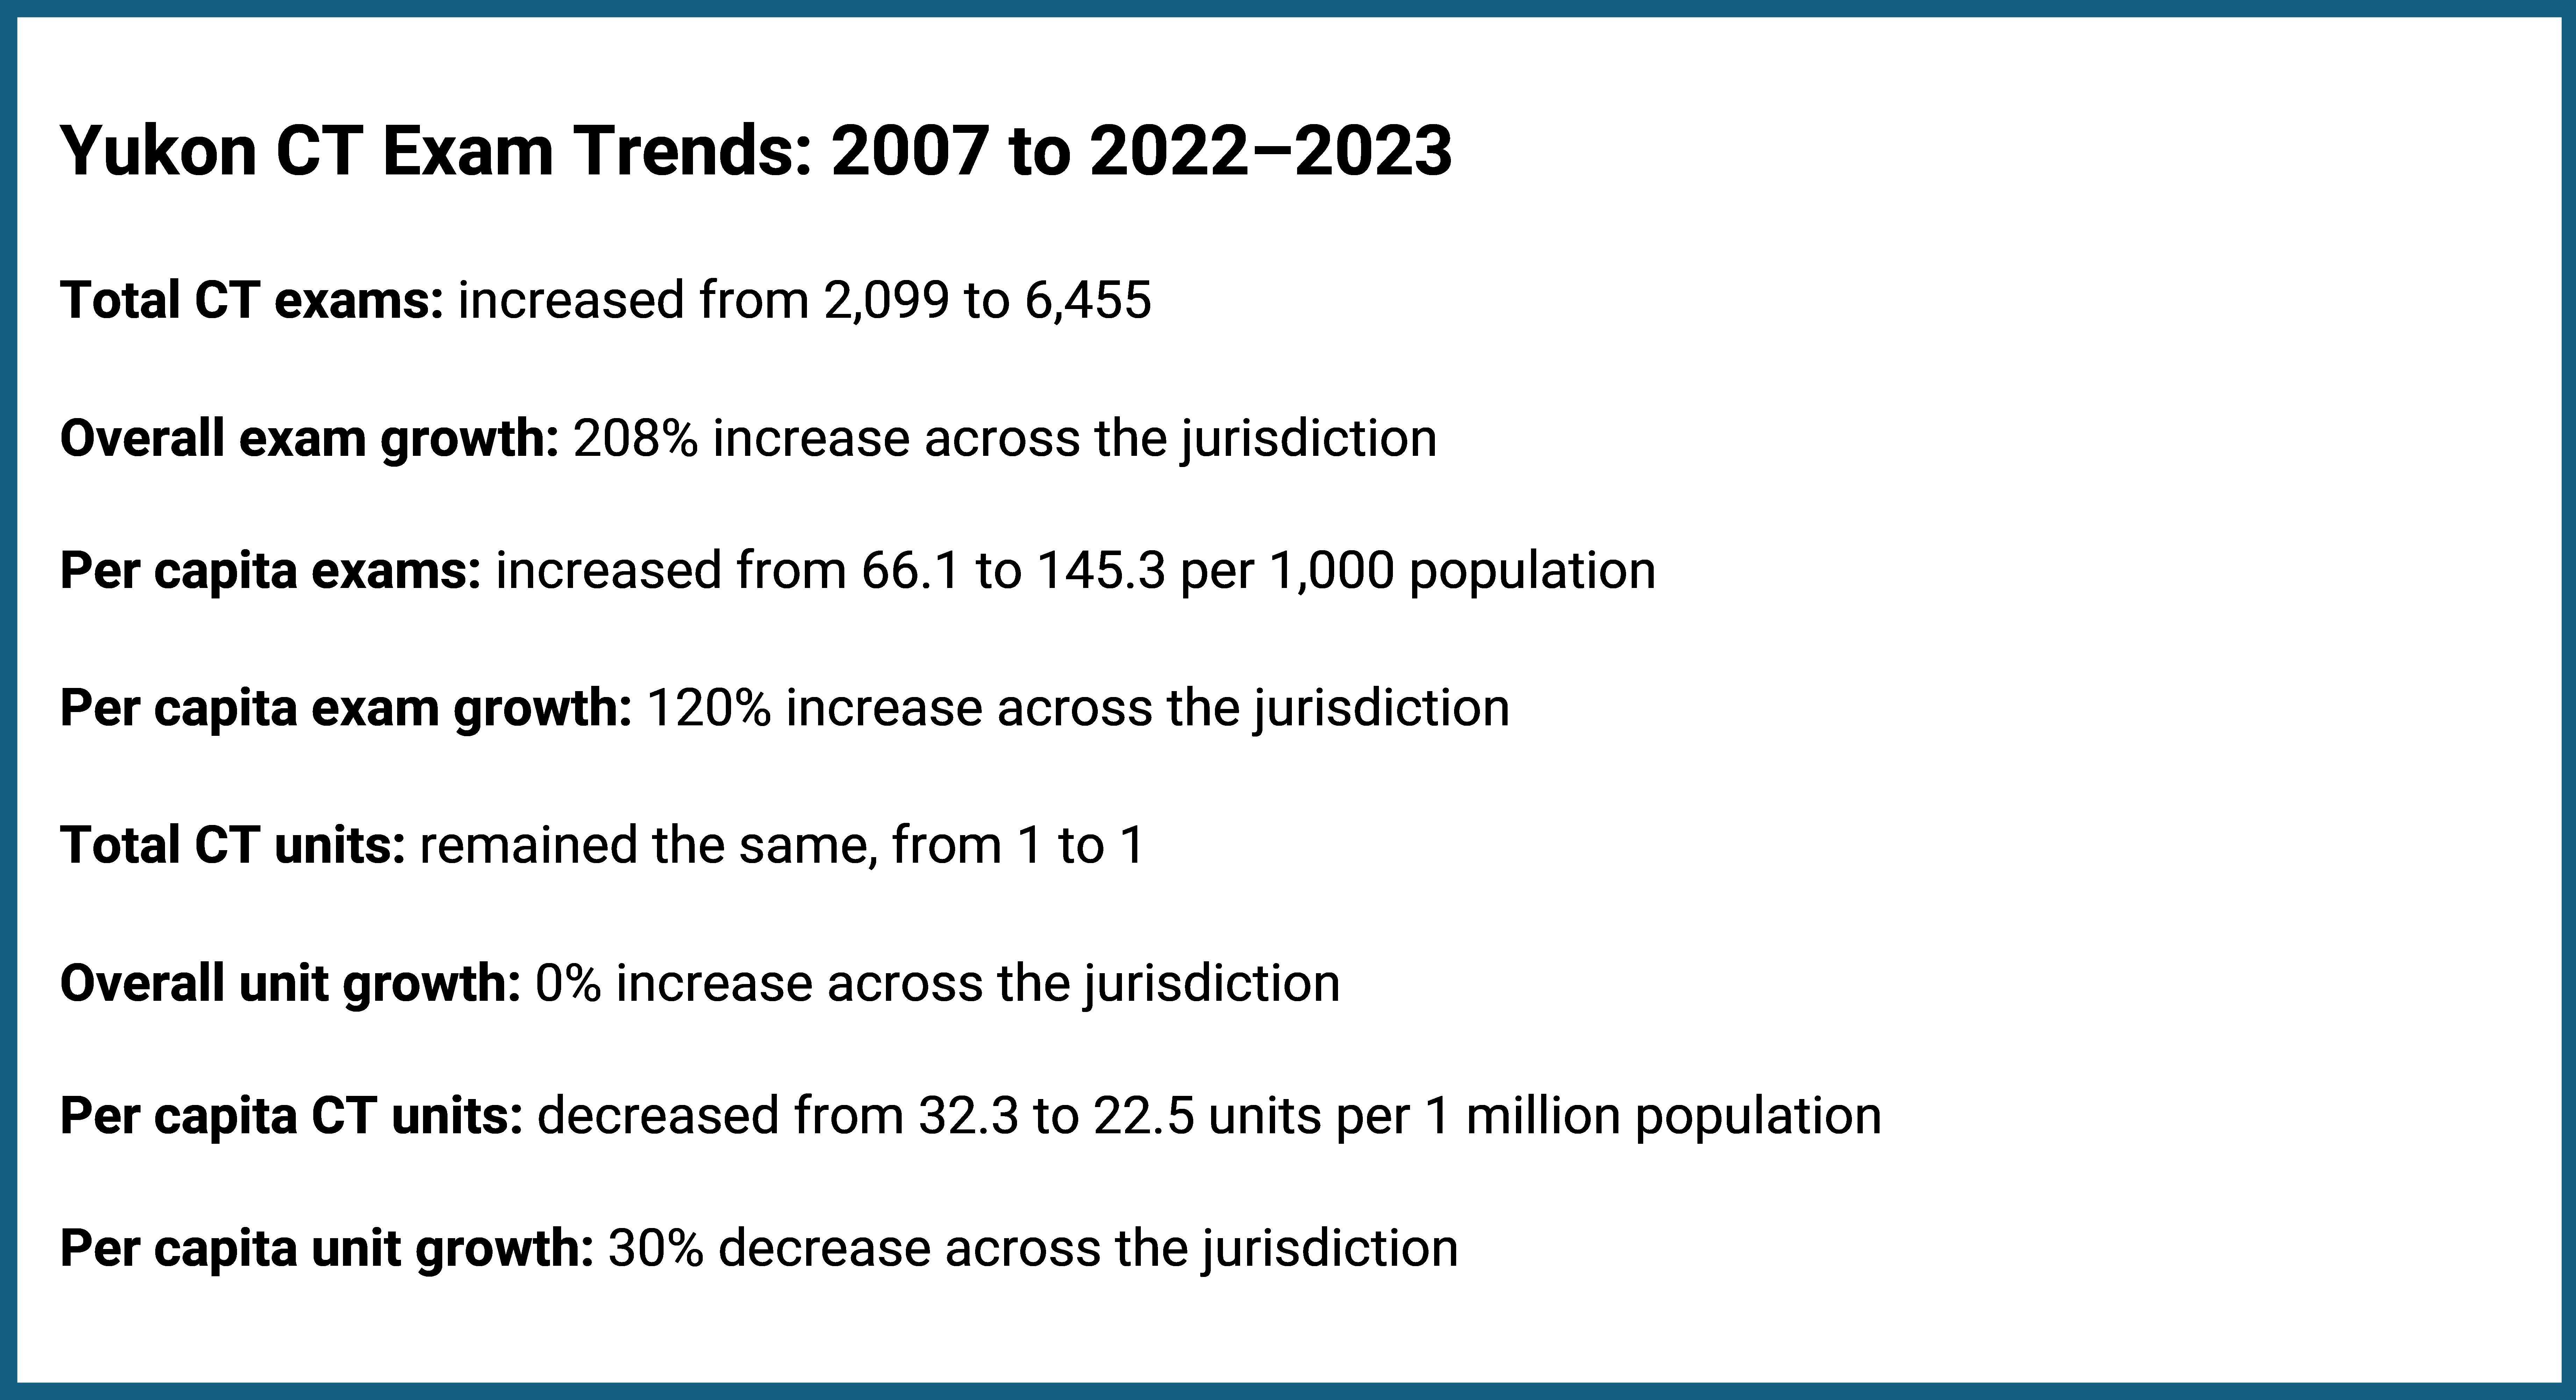
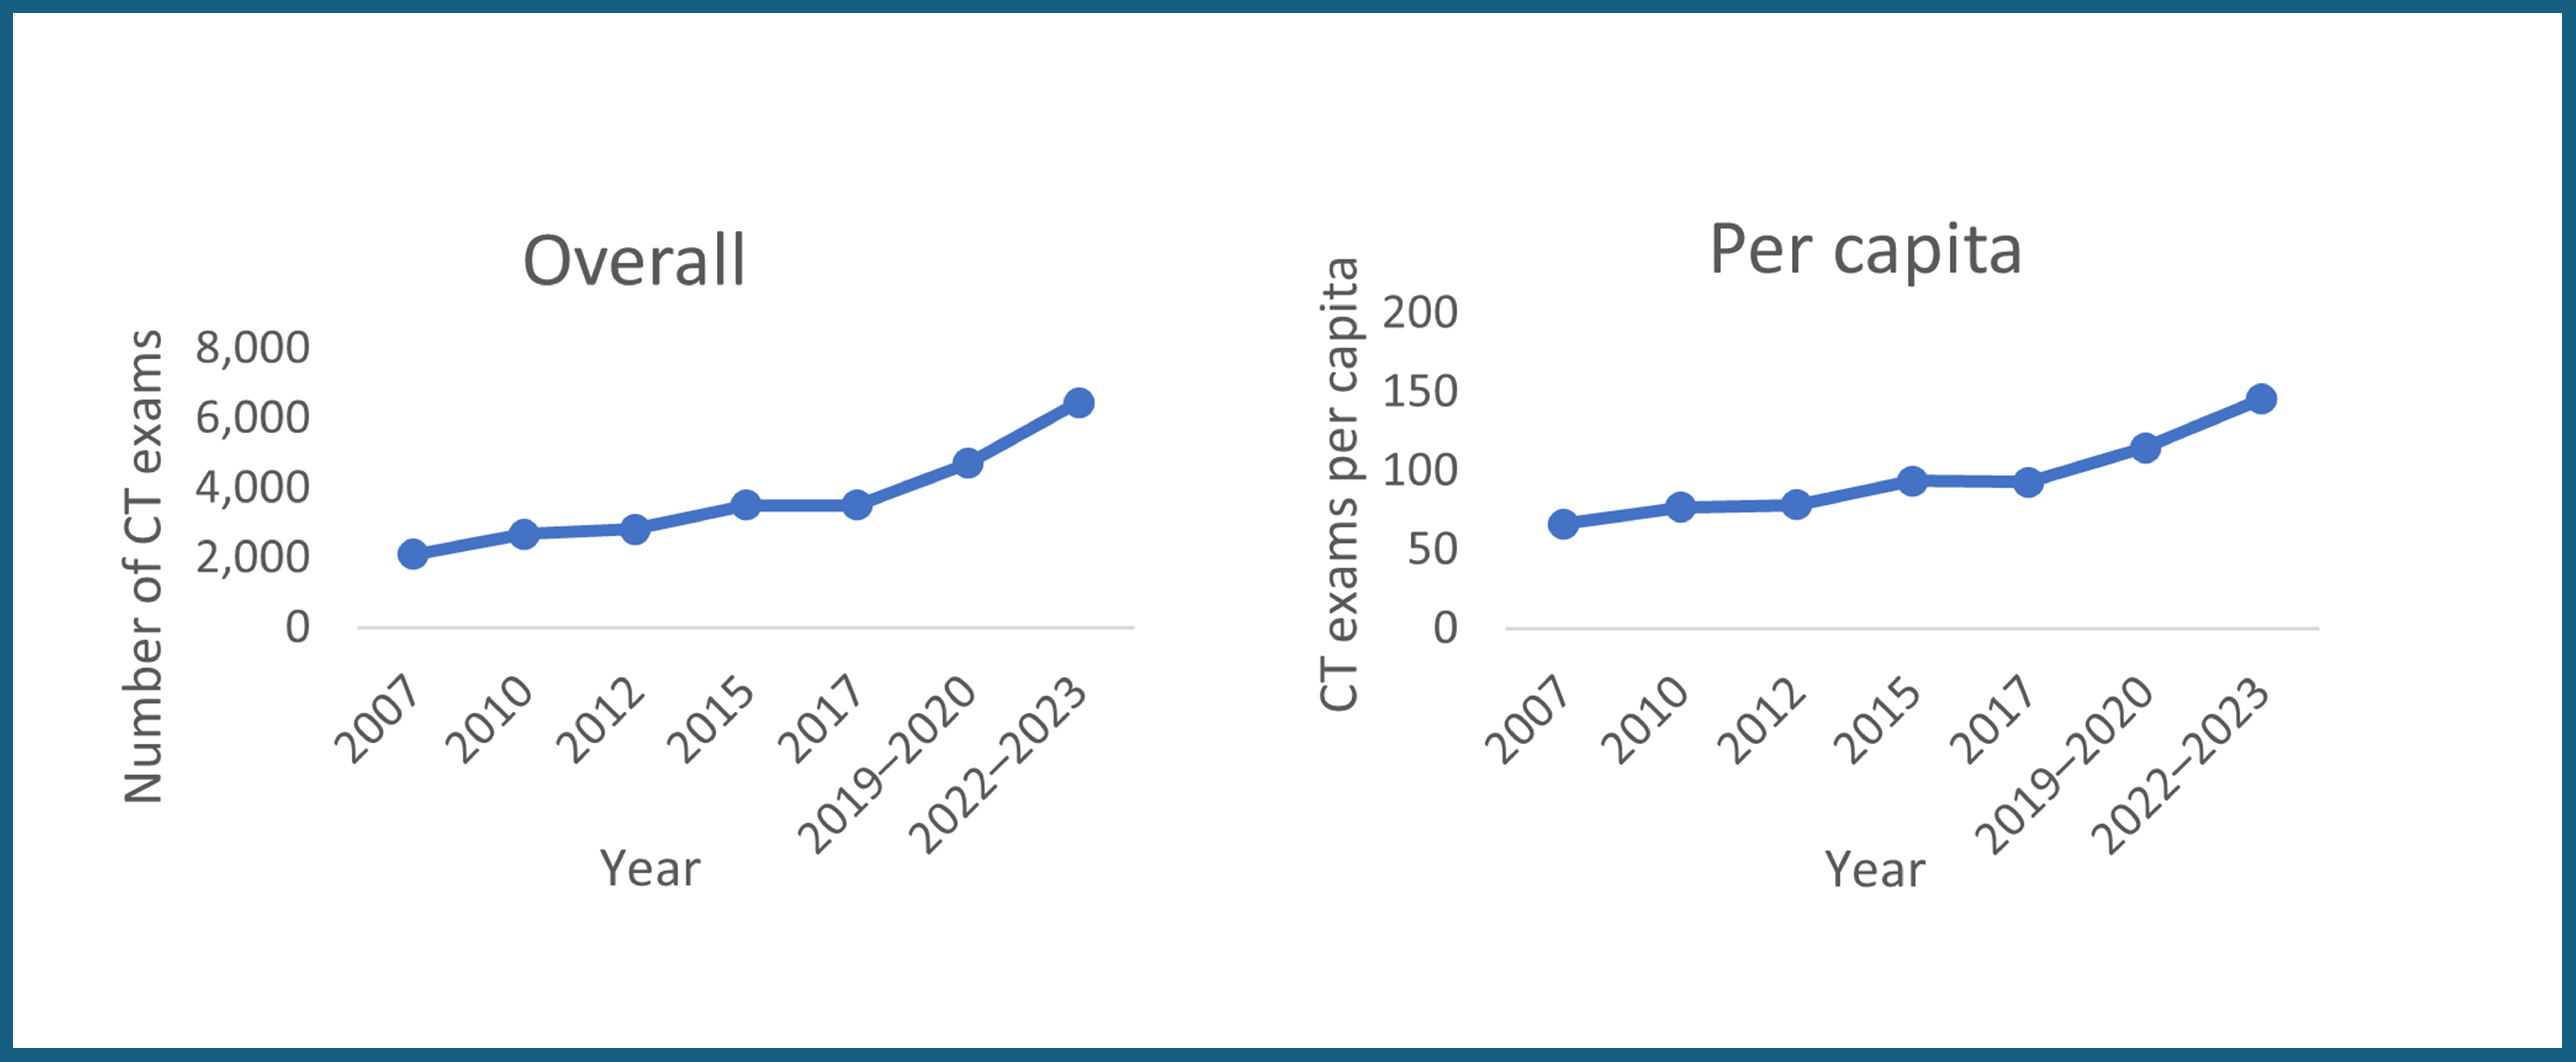
Yukon’s total CT exam volume increased by 208%, whereas per capita growth was 120% (Figure 23 and Appendix 1, Table 1 and Table 2). Both figures were well above the national averages of 90% and 57%, respectively. During this period, the number of CT units remained constant at 1, resulting in a 30% decrease in units per capita, from 32.3 to 22.5 (Figure 23 and Appendix 1, Table 3 and Table 4).
Yukon had the highest total and per capita percentage increase among all the jurisdictions over this time period; however, it is noted that its total CT exam volumes remained below 0.5% of the national total for each reporting year.
Yukon showed gradual growth for overall and per capita exams over the 16-year period, albeit with some minor fluctuations. The greatest period of growth was between 2019–2020 to 2022–2023 (Figure 24).
The Northwest Territories started CT services in 2010, and Nunavut followed in 2017. Each jurisdiction operated with 1 CT unit through to 2022–2023. The total number of CT exams in the Northwest Territories grew from 4,175 in 2010 to 8,115 in 2022–2023 (Appendix 1, Table 1), representing a 94% increase. On a per capita basis, CT exams increased from 96.4 per 1,000 people in 2010 to 177.7 per 1,000 people in 2022–2023, an 84% increase (Appendix 1, Table 2).
The total number of CT exams in Nunavut grew from 2,000 in 2017 to 4,336 in 2022–2023 (Appendix 1, Table 1), representing a 117% increase. On a per capita basis, CT exams increased from 53.4 per 1,000 people in 2017 to 106.5 per 1,000 people in 2022–2023, representing a 99% increase (Appendix 1, Table 2).
Limitations
The results of this report are based on data collected over more than a decade. Over this time period, the organizations responsible for data collection changed, and there were differences in the data collection methods, validation procedures, and reporting compliance. The data collection changed as CIHI conducted the survey between 2007 and 201210,11,19 and CDA-AMC took over from 2015 onward.6,15,20,21 Data from 2015 were partially imputed due to incomplete submissions from some jurisdictions for this year. Although this approach ensured a more comprehensive baseline for analysis, it introduced variability that may affect trend interpretation for that year. Imputation of missing data was primarily achieved through proportional scaling, assuming that nonreporting sites had exam volumes similar to those that reported. This assumption, if incorrect, may have led to overestimation — especially in jurisdictions where the imputed values represented a large portion of the total. These methodological choices influenced the quality of the data and might contribute to the differences in the number of exams performed during that year.
Using per capita values can be misleading in a country like Canada, which has the second-largest landmass in the world. These measurements do not account for the disparities in population distribution — many people live along the southern border, and remote areas, although they are vast, remain sparsely populated.4 Additionally, Canada's geographic size means that providing services and infrastructure over such a large area comes with challenges that per capita figures often overlook. As a result, per capita measures do not reflect the true complexities of the geographic distribution of population across the country.
Another limitation of this report is that it did not consider jurisdictions that did not have CT capacity for the entire period from 2007 to 2022–2023. This report focuses on those jurisdictions that had data for the entire period from 2007 to 2022—2023. As a result, jurisdictions such as the Northwest Territories and Nunavut — where CT services were introduced only in 2010 and 2017, respectively — are not included in the national trend analysis, despite ongoing efforts to expand CT capacity among the territories. Moreover, variations in regional health care infrastructures, such as access to CT facilities and health care policies, could have contributed to regional disparities. The evolution of CT technology, including improvements in imaging quality and machine efficiency, may also have impacted the comparability of data across different time points.
There were a few contextual factors that influenced the use of imaging modalities over time, such as the COVID-19 pandemic,22 population growth,7 changing standard of care, and population aging, but the impact of these factors could not be assessed with the available data.
Implications for Decision-Making
The demand for CT exams is shaped by various factors, including population growth and aging, health care, and evolving medical practices. Understanding trends in exam volumes is essential for planning imaging capacity and ensuring timely access to diagnostic services.
Despite the increase in both overall and per capita exam volumes, the rising number of CT exams may pose potential challenges, underscoring key considerations that can support health care decision-making, such as the following:
Extended wait times for imaging may delay diagnoses and treatment, potentially affecting patient outcomes.23,24
Extending operating hours can help reduce wait times and manage exam volumes more effectively.25 However, challenges in resourcing may make it difficult to extend the hours of operation of the equipment.26
Longer wait times can also lead to increased health care costs and reduced productivity, with imaging delays estimated to cost the economy $3.54 billion in 2018.27
Limited imaging availability may result in patients seeking private diagnostic services, increasing out-of-pocket health care expenses.3
Variations in exam trends suggest that regions may face unique health care challenges and requirements. Decision-makers may consider tailored strategies —such as optimizing existing imaging infrastructures, refining workforce planning, and aligning resource allocation — that could help support timely and equitable CT access across all regions.
Conclusion
The analysis of CT exam growth across Canada's 11 jurisdictions with CT capacity from 2007 to 2022–2023 shows distinct patterns in both overall and per capita exam volumes. All jurisdictions experienced increases in both overall and per capita exam volumes.
The wide variation in both overall and per capita exam growth across jurisdictions suggests that resource allocation and access to CT services may not be consistent nationwide. Canada's vast geography and the low population density in certain regions likely contribute to these disparities. Furthermore, comparing urban, rural, and remote areas is challenging due to differences in population density and local conditions. Disparities in access to CT services — driven by factors such as travel time, distance, and population size — may result in lower per capita exam volumes in some jurisdictions or local regions, highlighting potential inequities in access. These patterns underscore the need for region-specific health care planning to address the unique challenges each area faces.
The growing demand for CT exams is influenced by a range of factors, including emerging clinical applications of CT, such as biopsies, drainages, and interventional use; population needs; health care resources; and advancements in medical practices. As demand continues to outpace imaging capacity, there is a risk of extended wait times, which can delay diagnoses and treatment, ultimately affecting patient outcomes.
This analysis underscores the importance of strategic health care planning that includes targeted strategies to optimize imaging infrastructures, resource allocation, and continuous monitoring of capacity and demand. Decision-makers may consider local contextual factors when interpreting these trends and making decisions about future diagnostic imaging services.
References
1.National Institute of Biomedical Imaging and Bioengineering. Computed Tomography (CT). 2023.
2.Neurologica. Recent Advances in CT Scan Technology. 2021. Accessed April 4, 2025, https://www.neurologica.com/blog/advances-ct-scan-technology
3.Kjelle, E., Brandsæter, I.Ø., Andersen, E.R. et al. Cost of Low-Value Imaging Worldwide: A Systematic Review. Appl Health Econ Health Policy 22, 485–501 (2024). https://doi.org/10.1007/s40258-024-00876-2
4.Statistics Canada. Population and demography statistics. 2024. Accessed February 26, 2025. https://www.statcan.gc.ca/en/subjects-start/population_and_demography
5.Blair N. Health Care System Statistics in Canada. Accessed March 25, 2025. https://madeinca.ca/health-care-system-statistics-canada/.
6.Canadian Medical Imaging Inventory 2022–2023: CT. Can J Health Technol. 2024;4(8). Accessed January 16, 2025. https://www.cda-amc.ca/sites/default/files/hta-he/HC0024-05-CMII4-CT-Report.pdf .
7.Canadian Medical Imaging Inventory 2022–2023: Provincial and Territorial Overview. Can J Health Technol.2024; 4(8). Accessed Jan 16, 2025. https://www.cda-amc.ca/sites/default/files/hta-he/HC0024_Overview.pdf .
8.Rubin GD. Computed tomography: revolutionizing the practice of medicine for 40 years. Radiology. 2014;273(2 Suppl):S45-74. doi: 10.1148/radiol.14141356. PubMed
9.Liguori C, Frauenfelder G, Massaroni C, et al. Emerging clinical applications of computed tomography. Med Devices (Auckl). 2015;8:265-78. doi: 10.2147/mder.S70630. Accessed Apr 12, 2025. PubMed
10.Canadian Institute for Health Information. Medical Imaging in Canada, 2007. Canadian Institute for Health Information; 2008. Accessed October 30, 2024. https://publications.gc.ca/collections/collection_2008/cihi-icis/H118-13-2007E.pdf
11.Canadian Institute for Health Information. Medical Imaging in Canada, 2012. Canadian Institute for Health Information; 2013. Accessed October 30, 2024. https://publications.gc.ca/collections/collection_2008/cihi-icis/H118-13-2007E.pdf
12.Sinclair A, Quay T, Pyke L, Morrison A. CADTH Optimal Use Report: The Canadian Medical Imaging Inventory, 2015. CADTH; 2016. Accessed January 20, 2025. https://www.cda-amc.ca/sites/default/files/pdf/canadian_medical_imaging_inventory_2015_e.pdf
13.Chao YS, Sinclair A, Morrison A, Hafizi D, Pyke L. CADTH Health Technology Review: The Canadian Medical Imaging Inventory 2019–2020. Can J Health Technol. 2021;1(1). Accessed January 20, 2025. https://www.cda-amc.ca/sites/default/files/ou-tr/op0546-cmii3-final-report.pdf .
14.Sinclair A, Morrison A, Young C, Pyke L. CADTH Optimal Use Report: The Canadian medical imaging inventory, 2017. CADTH; 2018. Accessed January 20, 2025. https://www.cda-amc.ca/sites/default/files/pdf/canadian_medical_imaging_inventory_2017.pdf
15.Chao YS, Sinclair A, Morrison A, Hafizi D, Pyke L. CADTH Health Technology Review: The Canadian Medical Imaging Inventory 2019–2020. Can J Health Technol. 2021;1(1). Accessed March 25, 2025. https://www.cda-amc.ca/sites/default/files/ou-tr/op0546-cmii3-final-report.pdf
16.CADTH Health Technology Review: Canadian Medical Imaging Inventory 2022–2023: CT. Can J Health Technol. 2024;4(8). Accessed Jan 16, 2025. https://www.cda-amc.ca/sites/default/files/hta-he/HC0024-05-CMII4-CT-Report.pdf
17.Weisstanner D. Income growth and preferences for redistribution: The role of absolute and relative economic experiences. LIS Working Paper Series;2020.
18.CADTH Health Technology Review. CADTH: Canadian Medical Imaging Inventory Service Report. Average Volume of MRI Exams Conducted per Hour Across Canada. Can J Health Technol. 2024;4(1). Accessed October 30, 2024 https://www.cda-amc.ca/sites/default/files/attachments/2024-01/cm0008-average-mri-exams-per-equipment.pdf
19.Canadian Institute for Health Information. Medical Imaging in Canada, 2010. Ottawa, Ont.: Canadian Institute for Health Information; 2011.
20.Sinclair A, Quay T, Pyke L, Morrison A. CADTH Optimal Use Report: The Canadian Medical Imaging Inventory, 2015. CADTH; 2016. Accessed April 18, 2025. https://www.cda-amc.ca/sites/default/files/pdf/canadian_medical_imaging_inventory_2015_e.pdf.
21.Sinclair A, Morrison A, Young C, Pyke L. CADTH Optimal Use Report: The Canadian medical imaging inventory, 2017. CADTH; 2018. Accessed January 20, 2025. https://www.cda-amc.ca/sites/default/files/pdf/canadian_medical_imaging_inventory_2017.pdf.
22.Chao Y-S, Vu T, McGill SC, Gates M. CADTH Health Technology Review: Clinical Classification and Interventions for Post–COVID-19 Condition: A Scoping Review. Can J Health Technol. 2022;2(5). Accessed February 25, 2025. https://www.cda-amc.ca/sites/default/files/pdf/htis/2022/RE0040-Post-COVID-19-Scoping-Review.pdf .
23.Bartsch E, Shin S, Roberts S, MacMillan TE, Fralick M, Liu JJ, Tang T, Kwan JL, Weinerman A, Verma AA, Razak F, Lapointe-Shaw L. Imaging delays among medical inpatients in Toronto, Ontario: A cohort study. PLOS ONE. 2023. PubMed
24.Wait List Strategies for CT and MRI Scans. Can J Health Technol. 2023;3(1).
25.Rohatgi S, Hanna TN, Sliker CW, Abbott RM, Nicola R. After-hours radiology: challenges and strategies for the radiologist. American Journal of Roentgenology. 2015;205(5):956-961. PubMed
26.CADTH Health Technology Review: Medical Imaging Inventory 2022–2023: The Medical Imaging Team. Can J Health Technol. 2024;4(8). Accessed January 16, 2025. https://www.cda-amc.ca/sites/default/files/hta-he/HC0024-08-Medical-Imaging-Team.pdf
27.Sutherland G, Russell N, Gibbard R, Dobrescu A. The Value of Radiology, Part II. Ottawa: The Conference Board of Canada;2019.
Appendix 1: Summary Tables
Table 1: Overall Number of CT Exams Nationally and by Jurisdiction Between 2007 and 2022–2023
Year | NL | PE | NS | NB | QC | ON | MB | SK | AB | BC | YT | NT | NU | Canada |
|---|---|---|---|---|---|---|---|---|---|---|---|---|---|---|
2007 | 68,434 | 9,655 | 130,818 | 132,199 | 837,246 | 1,198,705 | 131,090 | 129,777 | 367,557 | 375,238 | 2,099 | 0 | 0 | 3,382,818 |
2010 | 76,680 | 17,124 | 157,844 | 147,765 | 1,051,569 | 1,478,056 | 162,720 | 156,854 | 374,279 | 492,420 | 2,675 | 4,175 | 0 | 4,122,161 |
2012 | 86,881 | 13,559 | 131,881 | 157,683 | 1,212,437 | 1,578,694 | 158,643 | 156,509 | 339,451 | 535,591 | 2,828 | 3,761 | 0 | 4,377,919 |
2015 | 115,552 | 13,576 | 157,290 | 130,984 | 1,656,662 | 1,871,160 | 173,299 | 139,488 | 382,300 | 634,530 | 3,500 | NA | NA | 5,278,341 |
2017 | 90,985 | 15,811 | 155,099 | 142,294 | 1,350,792 | 2,430,739 | 186,197 | 128,415 | 405,332 | 695,248 | 3,500 | 4,695 | 2,000 | 5,611,107 |
2019–2020 | 98,967 | 19,349 | 170,603 | 162,322 | 1,483,373 | 1,842,982 | 240,269 | 148,202 | 447,069 | 805,584 | 4,700 | 5,335 | 3,081 | 5,431,836 |
2022–2023 | 105,441 | 25,368 | 166,268 | 177,477 | 1,658,575 | 2,383,569 | 260,661 | 180,234 | 520,507 | 923,990 | 6,455 | 8,115 | 4,336 | 6,420,996 |
AB = Alberta; BC = British Columbia; MB = Manitoba; NA = not applicable; NB = New Brunswick; NL = Newfoundland and Labrador; NS = Nova Scotia; NT = Northwest Territories; NU = Nunavut; ON = Ontario; PE = Prince Edward Island; QC = Quebec; SK = Saskatchewan; YT = Yukon.
Note: This table has not been copy-edited.
Table 2: Number of CT Exams per 1,000 Population Nationally and by Jurisdiction Between 2007 and 2022–2023
Year | NL | PE | NS | NB | QC | ON | MB | SK | AB | BC | YT | NT | NU | Canada |
|---|---|---|---|---|---|---|---|---|---|---|---|---|---|---|
2007 | 134.5 | 69.7 | 140 | 176.6 | 109.2 | 93.8 | 111.2 | 131.6 | 107.7 | 86.7 | 66.1 | 0 | 0 | 102.5 |
2010 | 146.7 | 120 | 167.2 | 195.9 | 132.2 | 112.1 | 132.9 | 148.5 | 99.9 | 109.8 | 76.9 | 96.4 | 0 | 120.8 |
2012 | 169.5 | 92.8 | 139 | 208.6 | 150.5 | 116.9 | 125.2 | 144.9 | 87.6 | 115.9 | 78.3 | 86.8 | 0 | 125.5 |
2015 | 218.9 | 92.7 | 166.8 | 173.7 | 200.5 | 135.7 | 134 | 123 | 91.1 | 135.5 | 93.6 | NA | NA | 147 |
2017 | 172.1 | 105.6 | 163.1 | 187.8 | 161.4 | 195.6 | 139.7 | 110.6 | 94.4 | 145.2 | 92.6 | 105.8 | 53.4 | 153 |
2019–2020 | 189.6 | 122.5 | 174.7 | 208.1 | 174 | 125.7 | 174.9 | 125.7 | 101.7 | 157.8 | 114.6 | 118.8 | 79.3 | 143.7 |
2022–2023 | 197.6 | 144 | 158.8 | 213.4 | 187.8 | 153.8 | 180.5 | 147.6 | 110.7 | 169.9 | 145.3 | 177.7 | 106.5 | 161.1 |
AB = Alberta; BC = British Columbia; MB = Manitoba; NA = not applicable; NB = New Brunswick; NL = Newfoundland and Labrador; NS = Nova Scotia; NT = Northwest Territories; NU = Nunavut; ON = Ontario; PE = Prince Edward Island; QC = Quebec; SK = Saskatchewan; YT = Yukon.
Note: This table has not been copy-edited.
Table 3: Number of CT Units Across Jurisdictions Between 2007 and 2022–2023
Year | NL | PE | NS | NB | QC | ON | MB | SK | AB | BC | YT | NT | NU | Canada |
|---|---|---|---|---|---|---|---|---|---|---|---|---|---|---|
2007 | 11 | 2 | 16 | 15 | 119 | 130 | 19 | 15 | 41 | 49 | 1 | 1 | 0 | 419 |
2010 | 13 | 2 | 16 | 16 | 123 | 165 | 20 | 15 | 47 | 65 | 1 | 1 | 0 | 484 |
2012 | 14 | 2 | 16 | 17 | 132 | 168 | 21 | 16 | 50 | 72 | 1 | 1 | 0 | 510 |
2015 | 16 | 2 | 21 | 14 | 146 | 186 | 19 | 16 | 50 | 65 | 1 | 1 | 1 | 538 |
2017 | 16 | 2 | 18 | 15 | 163 | 184 | 23 | 15 | 56 | 66 | 1 | 1 | 1 | 561 |
2019–2020 | 15 | 2 | 17 | 17 | 164 | 169 | 22 | 16 | 55 | 69 | 1 | 1 | 1 | 549 |
2022–2023 | 16 | 2 | 18 | 15 | 144 | 192 | 24 | 18 | 53 | 75 | 1 | 1 | 1 | 560 |
AB = Alberta; BC = British Columbia; MB = Manitoba; NB = New Brunswick; NL = Newfoundland and Labrador; NS = Nova Scotia; NT = Northwest Territories; NU = Nunavut; ON = Ontario; PE = Prince Edward Island; QC = Quebec; SK = Saskatchewan; YT = Yukon.
Note: This table has not been copy-edited.
Table 4: CT Units per Million Population Across Jurisdictions Between 2007 and 2022–2023
Year | NL | PE | NS | NB | QC | ON | MB | SK | AB | BC | YT | NT | NU | Canada |
|---|---|---|---|---|---|---|---|---|---|---|---|---|---|---|
2007 | 21.6 | 14.5 | 17.1 | 20.0 | 15.5 | 10.2 | 16.1 | 15.2 | 12.0 | 11.3 | 32.3 | 23.6 | 0 | 12.8 |
2010 | 25.44 | 14.16 | 17.01 | 21.31 | 15.63 | 12.56 | 16.27 | 14.45 | 12.66 | 14.46 | 29.42 | 23.1 | 0 | 14.26 |
2012 | 27.3 | 13.7 | 16.9 | 22.5 | 16.5 | 12.5 | 16.7 | 15.0 | 13.1 | 15.6 | 28.1 | 22.9 | 0 | 14.7 |
2015 | 30.3 | 13.7 | 22.3 | 18.6 | 17.7 | 13.5 | 14.7 | 14.1 | 11.9 | 13.9 | 27.0 | 22.7 | 27.0 | 15.0 |
2017 | 30.3 | 13.4 | 18.9 | 19.8 | 19.5 | 13.0 | 17.3 | 12.9 | 13.1 | 13.8 | 26.5 | 22.5 | 26.7 | 15.3 |
2019–2020 | 28.7 | 12.7 | 17.4 | 21.8 | 19.2 | 11.5 | 16.0 | 13.6 | 12.5 | 13.5 | 24.4 | 22.3 | 25.7 | 14.5 |
2022–2023 | 30.0 | 11.4 | 17.2 | 18.0 | 16.3 | 12.4 | 16.6 | 14.7 | 11.3 | 13.8 | 22.5 | 21.9 | 26.6 | 14.0 |
AB = Alberta; BC = British Columbia; MB = Manitoba; NB = New Brunswick; NL = Newfoundland and Labrador; NS = Nova Scotia; NT = Northwest Territories; NU = Nunavut; ON = Ontario; PE = Prince Edward Island; QC = Quebec; SK = Saskatchewan; YT = Yukon.
Note: This table has not been copy-edited.
ISSN: 2563-6596
Canada’s Drug Agency (CDA-AMC) is a pan-Canadian health organization. Created and funded by Canada’s federal, provincial, and territorial governments, we’re responsible for driving better coordination, alignment, and public value within Canada’s drug and health technology landscape. We provide Canada’s health system leaders with independent evidence and advice so they can make informed drug, health technology, and health system decisions, and we collaborate with national and international partners to enhance our collective impact.
Disclaimer: CDA-AMC has taken care to ensure that the information in this document was accurate, complete, and up to date when it was published, but does not make any guarantee to that effect. Your use of this information is subject to this disclaimer and the Terms of Use at cda-amc.ca.
The information in this document is made available for informational and educational purposes only and should not be used as a substitute for professional medical advice, the application of clinical judgment in respect of the care of a particular patient, or other professional judgments in any decision-making process. You assume full responsibility for the use of the information and rely on it at your own risk.
CDA-AMC does not endorse any information, drugs, therapies, treatments, products, processes, or services. The views and opinions of third parties published in this document do not necessarily reflect those of CDA-AMC. The copyright and other intellectual property rights in this document are owned by the Canadian Agency for Drugs and Technologies in Health (operating as CDA-AMC) and its licensors.
Questions or requests for information about this report can be directed to Requests@CDA-AMC.ca.