Drugs, Health Technologies, Health Systems
Health Technology Review
Hourly CT Exam Volumes Across Canada in 2022–2023
Key Messages
What Is the Issue?
Canada’s Drug Agency (CDA-AMC) received a request regarding the number of CT exams that can be performed per scanner per hour across the country.
The most recent estimates for CT exam rates are outdated and based on aggregated data and older CT technology, making direct current comparisons challenging. This limits the ability to assess current exam throughput and operational efficiencies, which are essential for addressing wait times and optimizing resource utilization.
What Did We Do?
CDA-AMC leveraged data from the 2022–2023 Canadian Medical Imaging Inventory (CMII) National Survey.
Of the 394 sites with CT units across Canada, 173 sites provided sufficient data to estimate hourly CT exam throughput and examine how factors such as unit specifications (including equipment age and CT slice count), staffing levels, and the number of CT units per site influence throughput.
What Did We Find?
The national average CT exam throughput in 2022–2023 was 2.34 exams per scanner per hour, with rates ranging from 1.89 to 3.43 across jurisdictions.
Sites with newer CT units (less than 5 years old) and higher staffing levels (measured by full-time medical radiation technologist positions) generally had higher throughputs, indicating that technological advances and sufficient staffing support better operational efficiency.
Sites with 3 or more CT units tended to have lower per-unit exam throughputs, possibly due to coordination challenges or allocation of units for specialized use.
Higher-slice CT units (e.g., 256 or more slices) had higher throughputs, but this was based on a smaller sample. This indicates that advanced slice technology may enhance throughput, but exam complexity could also reduce the overall number of exams per hour.
What Does This Mean?
These findings provide insights into how CT exam throughput can be optimized and help guide decision-making in several ways:
The data confirm that operational efficiency is not solely dependent on the number of CT units, but also on how well resources are utilized, including equipment maintenance, staffing, and scheduling. Addressing inefficient workflows, optimizing staffing levels, and ensuring CT units are used effectively can increase the number of hourly exams.
The analysis of CT unit age and exam throughput suggests that updating technology or properly maintaining older units may improve productivity.
Given the limitations on resources and staffing, benchmark values for CT exam throughput can assist with adopting different workflow management strategies and identifying technology adaptations that can reduce wait times.
Variations in exam throughput across jurisdictions and sites indicates that solutions must be tailored to local contexts. Decision-makers may wish to consider jurisdiction-specific or site-specific challenges when considering strategies to reduce wait times and enhance efficiency.
Increasing exam throughput should be balanced with ensuring exams are of high quality and meet patients’ clinical needs.
Context
Canada’s Drug Agency (CDA-AMC) received a request related to the number of CT exams that are performed per scanner per hour across the country. Currently, there are no recent, publicly available estimates for CT exam throughput at the national or jurisdictional level.
Previous estimates from the Canadian Institute of Health Information (CIHI), in 2005, reported an average hourly exam throughput of 3.0 CT exams per scanner per hour.1,2 At that time, Canada had 361 CT units, compared to the 560 CT units reported in the most recent Canadian Medical Imaging Inventory (CMII) National Survey conducted in 2022–2023.2,3 The Canadian medical imaging landscape has changed during this time period, with technological advancements like faster scan speeds and improved image quality in newer CT units leading to an increased potential in the number of exams per hour.4,5 Given these technological and capacity changes, an understanding of the current average CT exam rate is warranted.
Decision-makers can use information on the average CT exam throughput per unit to signal operational bottlenecks and initiate the identification of potential workflow efficiencies. This could help increase the number of patients examined and contribute to reducing wait times for medical imaging in Canada.6 However, the average overall exam throughput does not account for the various factors that can influence exam volumes. Exam throughputs can vary by site, depending on factors such as the equipment’s age and other confounding variables.7-9 This report explores how some of these factors impact hourly exam throughput.
With data collected from the 2022–2023 CMII National Survey, CDA-AMC is uniquely positioned to provide insights into the average hourly volume of CT exams performed across Canada.3 Decision-makers can use this information to measure unit performance and identify potential areas for improvement in efficiencies.
Objectives
This report summarizes data from the 2022–2023 CMII National Survey and calculates the average volume of CT exams performed per scanner per hour at the national and jurisdictional level. It also explores the impact of other factors that may influence the average throughput rate, including:
CT unit age
staffing (as measured by full-time equivalent [FTE] medical radiation technologists [MRTs] per unit)
CT slice counts
number of units per site.
Methods
This report summarizes information gathered by CDA-AMC through the 2022–2023 CMII National Survey, with each province and territory represented where applicable. Sites reported the number of operational CT units, their technical specifications, and the initial year of equipment operation. Sites also reported the average annual number of CT exams performed, hours of operation, and budgeted FTEs for MRTs. It should be noted that the CMII National Survey relies on self-reported data, which may contain errors or biases and are limited by the number of sites providing complete information. In some cases, small sample sizes may affect the reliability of results.
For the purposes of this report, an imaging exam is considered a single medical imaging session to study 1 (or more than 1) body structure, body system, or anatomic area that yields 1 or more views for diagnostic and/or therapeutic purposes.
The average hourly CT exam throughput for an individual unit was calculated by dividing the reported number of average annual CT exams by the number of units at a site. The resulting values were then divided by 52 weeks and then divided by the reported average weekly operating hours.
The average hourly CT exam throughput for a site was calculated by dividing the reported average annual CT exams by 52 weeks and dividing the resulting value by the reported average weekly operating hours.
The results are based on data from 173 sites that reported data on both annual exam volume and weekly hours of operation to calculate an average hourly CT exam throughput from the 2022–2023 CMII National Survey.
An analysis was also conducted to identify whether and how certain factors influence the average hourly exam throughput. These factors include:
the age of the CT unit
staffing levels, as measured by budgeted FTE MRTs per unit
the number of slices per CT unit
the number of CT units at a site.
These factors are not the only determinants that influence hourly exam throughput. The CMII survey does not capture all variables affecting CT exam throughput, as each site’s unique circumstances may be influenced by factors such as administrative and operational processes; workflow processes; scheduling practices; staff experience; the use of CT contrast agents; patient demographics and their clinical needs; population density; operating funds; whether exams were done in an ambulatory, inpatient, or emergency department setting; and availability of supportive tools and technologies.7-10 Furthermore, government health policies can shape the availability and use of CT imaging across the country through reimbursement programs, health care budgets, wait-time management, and radiation safety regulations, which are beyond the scope of the CMII survey and not included in the analysis.6,11-13 Figure 1 shows the complex interplay of some of the mentioned factors that affect exam throughput.
Figure 1: Factors Affecting Hourly CT Exam Throughput
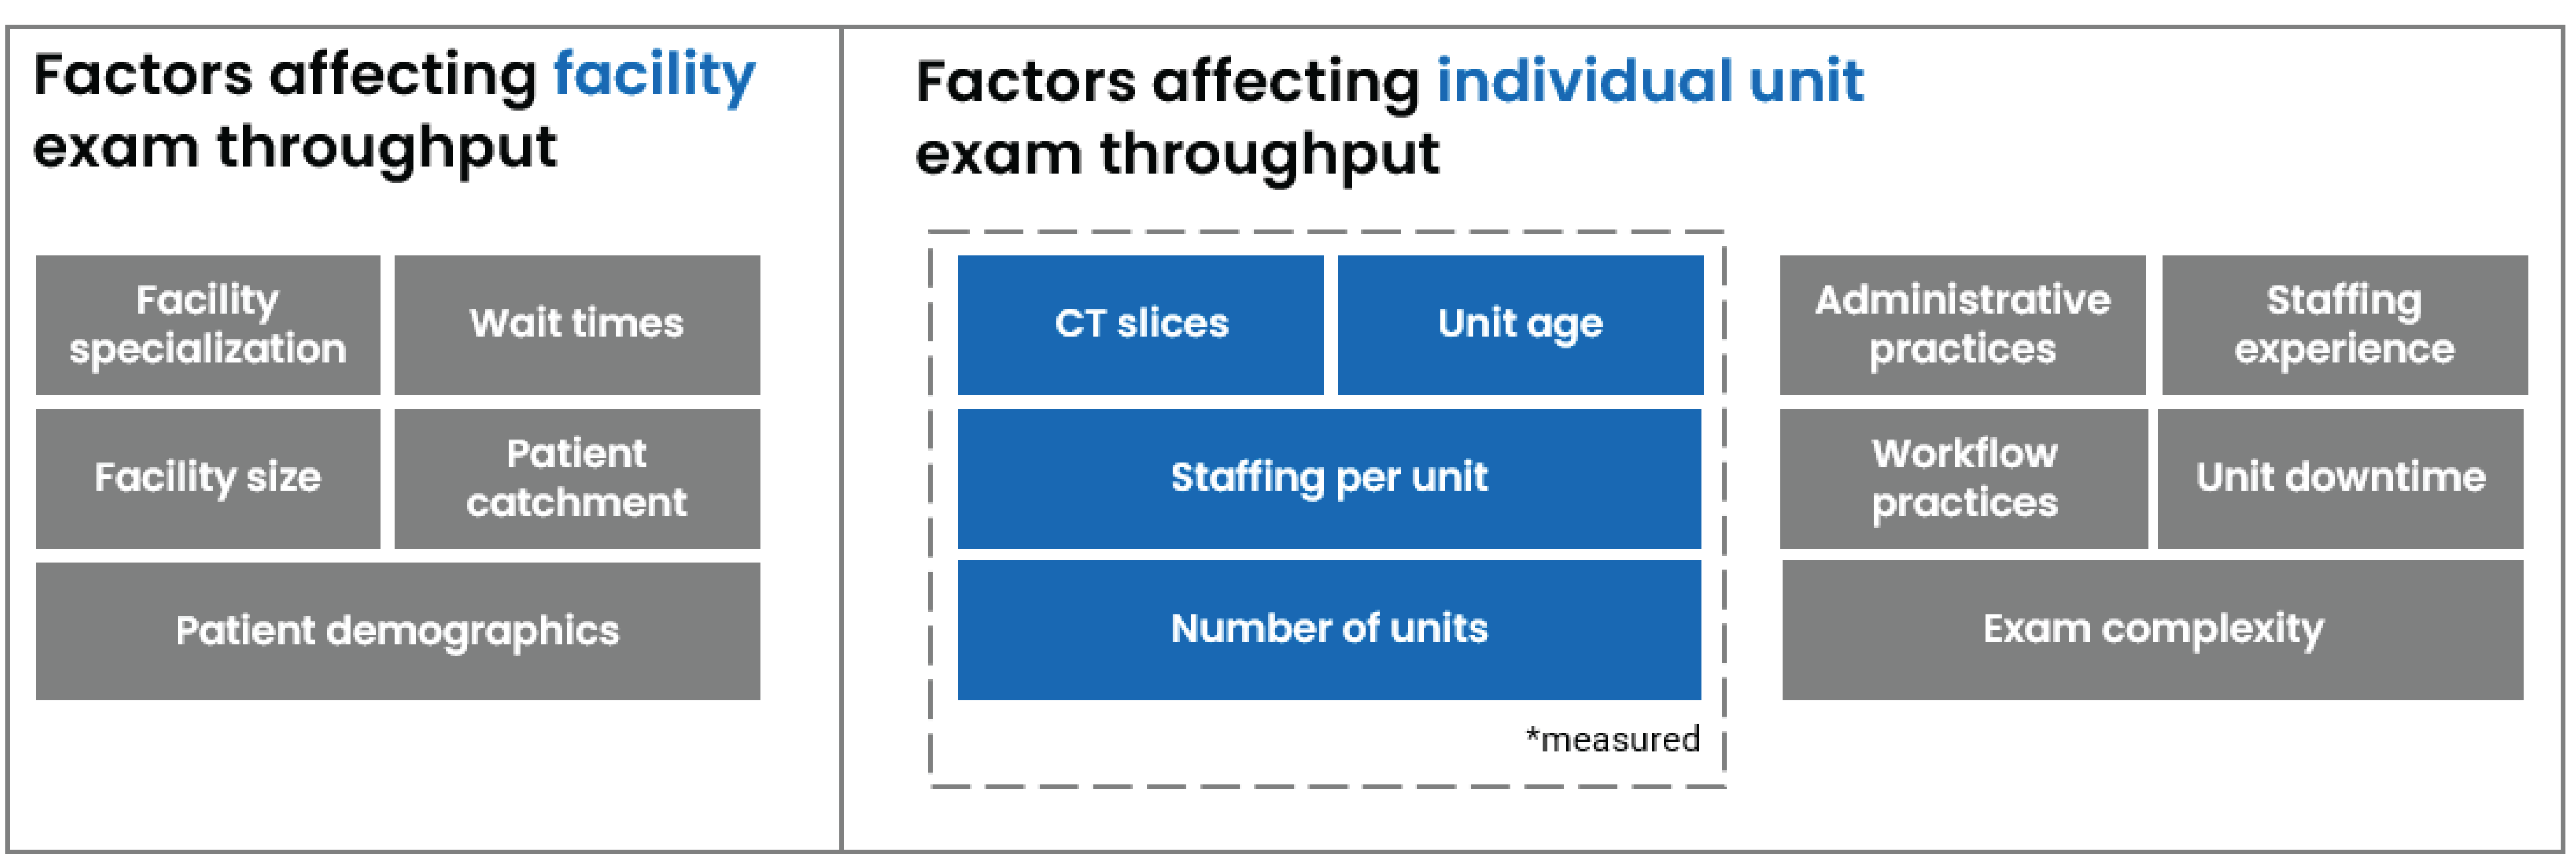
Note: Not all factors affecting hourly CT exam throughput are depicted.
Results
Hourly exam throughput is primarily presented at an individual unit level, based on an aggregated national average. All jurisdictional-level data are available in Tables 1 to 6 in Appendix 1. Individual unit-level hourly exam throughput represents the average number of CT exams produced per CT scanner per hour.
Average Hourly CT Exam Throughput
In 2022–2023, the national average throughput per CT scanner per hour was 2.34 exams, with a range from 1.89 to 3.43 exams per scanner per hour across different jurisdictions (refer to Table 1 in Appendix 1).
In some instances, while a jurisdiction may fall below the national average, individual sites within that jurisdiction could still exceed the national average for exam throughput.
Average Hourly CT Exams by Age of Unit
The age of imaging equipment may have an impact on exam throughput. Older CT machines may require more maintenance compared to newer equipment, leading to unexpected downtime and, as a result, a reduction in the number of exams that can be completed.8,9,14 In addition, newer CT machines benefit from advancements in multislice technology, faster rotation times, improved detector technology, dual-energy data acquisition methods, and faster iterative reconstruction techniques, all of which contribute to increased imaging speed that can improve throughput.15
Using data from sites that tracked the age of CT units, the average hourly exam throughput was calculated with units divided into 4 age groups in 5-year intervals. At the national level, the relationship between CT unit age and average hourly exam throughput was as follows (refer to Table 2 in Appendix 1 for the jurisdictional breakdown):
CT units that were less than 5 years old (which accounted for 27% of total CT units) had an average throughput of 2.52 exams per scanner per hour, ranging from 1.53 to 3.43 exams per unit per hour.
CT units that were 5 to 9 years old (which accounted for 41% of total CT units) had an average throughput of 2.95 exams per scanner per hour, ranging from 2.02 to 5.99 exams per unit per hour.
CT units that were 10 to 14 years old (which accounted for 27% of total CT units) had an average throughput of 2.52 exams per scanner per hour, ranging from 1.32 to 2.86 exams per unit per hour.
CT units that were 15 years old or older (which accounted for 5% of total CT units) had an average throughput of 2.81 exams per scanner per hour, ranging from 1.81 to 5.68 exams per unit per hour.
Generally, across most jurisdictions, higher exam outputs tended to be associated with newer CT units (those that were 9 years old or newer).
The high average exam throughput for CT units that were 15 years old or older is partly due to the small number of units in that age group. The high throughputs reported in this category raised the overall average for the entire group. This doesn't necessarily indicate that older units perform faster than newer ones, but rather that these older units may be reserved for simpler, quicker exams, thereby increasing their hourly throughput. Additionally, older CT units are often well maintained and operated by experienced staff. In some cases, these units may be located at sites that also have newer units that handle most exams. The way exam throughput is calculated — by attributing exams equally across all units at a site — could further inflate the exam volume for the older units.
Newer machines may be reserved for more complex exams that take longer to complete, which limits the number of exams that can be performed per hour on these units. Additionally, some newer machines require performance testing, adjustments, and calibrations to ensure optimal performance and image quality, reducing their availability for patient exams until they are fully optimized.
Average Hourly CT Exams by FTE MRTs per Unit
The staffing complement of an imaging department has been found to affect CT exam throughput via increases in efficient workflow, resulting in greater unit productivity.16 Using data from sites reporting MRT staffing levels (as measured by FTE MRTs per unit), the national average hourly exam throughput of individual units was as follows (refer to Table 3 in Appendix 1 for the jurisdictional breakdown):
One to 2 FTE MRTs per unit had an average throughput of 2.10 exams per scanner per hour, ranging from 1.32 to 3.25 exams per unit per hour.
Three to 5 FTE MRTs per unit had an average throughput of 2.44 exams per scanner per hour, ranging from 1.61 to 3.43 exams per unit per hour.
Six or more FTE MRTs per unit had an average throughput of 2.51 exams per scanner per hour, ranging from 1.78 to 3.01 exams per unit per hour.
In general, at a national level, sites with more FTE MRTs per unit had a higher exam throughput compared to those with fewer FTE MRTs per unit. The increase in exam throughput for sites with 6 or more FTE MRTs per unit may have been moderated by workflow inefficiencies that may be limiting the number of exams completed per hour. Additionally, at sites with multiple units, coordinating staff across these units could add to the workload, potentially reducing hourly exam throughput.
Average Hourly CT Exams by CT Unit Slice Counts
CT slices refer to the number of cross-sectional images captured by rows of detectors of a CT with each rotation of the gantry. Higher slice counts result in more data being captured, which typically shortens scan times.17,18 Using data from sites reporting the CT slice counts, the national average hourly exam throughput of individual units was as follows (refer to Table 4 in Appendix 1 for the jurisdictional breakdown):
Units with 64 slices (which account for 39% of total CT units) had an average throughput of 2.61 exams per scanner per hour, ranging from 1.07 to 3.07 exams per unit per hour.
Units with 128 slices (which account for 43% of total CT units) had an average throughput of 2.86 exams per scanner per hour, ranging from 2.48 to 5.33 exams per unit per hour.
Units with 256 slices (which account for 8% of total CT units) had an average throughput of 2.20 exams per scanner per hour, ranging from 1.32 to 2.72 exams per unit per hour.
Units with more than 256 slices (which account for 10% of total CT units) had an average throughput of 3.20 exams per scanner per hour, ranging from 1.93 to 3.90 exams per unit per hour.
In general, at the national level, CT units with more slices had higher exam throughputs. However, there were relatively few sites reporting CT units with 256 slices or more (14) compared to CTs with other slice counts (136). This small sample size may have skewed the overall hourly exam throughput. It is also possible that higher-slice units are used for more time-intensive exams, further reducing their hourly exam volumes.
Average Hourly CT Exams by Number of Units on Site
Many sites with CT capacity operate more than 1 unit, which can impact overall exam volumes. When assessing exam throughput at a national level, it should be noted that sites with multiple CT units tended to experience a decrease in hourly exam throughput, reported as follows (refer to Table 5 in Appendix 1 for the jurisdictional breakdown):
Sites with 1 CT unit had an average throughput of 2.42 exams per scanner per hour, ranging from 1.81 to 3.83 exams per unit per hour.
Sites with 2 CT units had an average throughput of 2.35 exams per scanner per hour, ranging from 1.32 to 3.05 exams per unit per hour.
Sites with 3 CT units had an average throughput of 1.59 exams per scanner per hour, ranging from 0.89 to 2.72 exams per unit per hour.
Sites with 4 or more CT units had an average throughput of 1.74 exams per scanner per hour, ranging from 1.31 to 2.46 exams per unit per hour.
While collectively these units raise the average hourly exam throughput of the overall site (refer to Table 6 in Appendix 1), it is possible that sites with multiple CT units reserve some units for research purposes or specific clinical uses like interventional procedures, or operate their older units less intensively. This can lead to a comparatively lower exam throughput for individual units compared to sites with only 1 CT unit. It is also possible that patient bottlenecks or other operational inefficiencies may occur when coordinating multiple units, further lowering individual unit exam throughput.
Limitations
As some of the data collected from the CMII National Survey were aggregated, it is not possible to determine whether specific CT units were tasked with certain types of complex or time-intensive exams (e.g., if newer units performed more intensive exams or older units performed simpler exams). The reported average annual exams from a given site were equally split across all applicable CT units. This assumes each unit took an equal share of exams, regardless of age, type, or designated purpose, which may not reflect what occurred at a particular site.
Additionally, the use of FTE data as a proxy for MRT staffing levels may not be a fully accurate representation of how well staffed a medical imaging department is, as these are budgeted positions and not necessarily filled positions. Given the capacity challenges with MRTs in Canada, this may affect the accuracy of our findings.19 Additionally, reporting FTE positions does not account for staff scheduling, as not all MRTs will work simultaneously (e.g., some staff may rotate weekend or night shifts). As a result, the number of FTE MRTs per unit may not reflect how staff are assigned across medical imaging departments.
Furthermore, while weekly hours of operation were used to calculate the average hourly exam throughput, it assumes that CT units are used the entire time, which may not necessarily be reflective of what occurs during day-to-day operations in a medical imaging department. CT units require warm-up cycles before use, especially if they have been idle, and cannot produce exams during this time.20
This report is also reliant on self-reported data from sites, which may include errors, misinterpretations, or other data issues leading to potential biases in the report. Additionally, this report is limited by the number of sites that reported the necessary information required for this analysis. Sometimes, limited sample sizes may have been unable to provide a reliably accurate result.
Implications for Decision-Making
While it appears that the 2022–2023 hourly exam throughput per scanner (2.34 exams per scanner per hour) has decreased compared to 2005 (3.0 exams per scanner per hour), this could be due to a variety of factors, such as throughput issues stemming from medical imaging staff shortages as well as the expansion of CT clinical applications.19,21 Since 2005, the usage of CTs has greatly expanded to include therapeutic procedures, biopsies, and other complex procedures, which can affect exam throughput.21
However, the discrepancy in exam throughput could also be due to methodological differences in how exam throughputs were calculated, making direct comparisons between estimates difficult. The 2005 estimate relied on aggregated jurisdictional averages of annual exams and CT units, as well as broad assumptions on hours of operation that may not reflect actual hours and processes at individual sites.2 The 2022–2023 estimates were calculated at the site level, using more granular data collected from the sites themselves.3 This data granularity from more recent versions of the CMII survey allows for a more detailed analysis that is more reflective of what sites are producing. Additionally, the 2022–2023 exam throughputs were based on data from 173 sites, whereas the 2005 analysis used aggregated jurisdictional data, which theoretically captured all sites in a jurisdiction but relied on broad assumptions. These differences in data sources and response rates may also contribute to the variation in exam throughput between the 2 periods.2 This difference in terms of response rates could also be driving the difference in exam throughput.
Additionally, exam throughput can be influenced by various factors, often depending on the specific context in which each site operates. Optimizing workflows, adopting novel technological innovations like artificial intelligence, adjusting scheduling practices, and standardizing protocols can assist in increasing exam throughput and CT turnaround times.16,22-25
While increasing hourly CT exam throughput is an important objective, it is equally crucial to ensure that exams are of high value and that wait times prioritize patients with the most urgent medical imaging needs.
Conclusions
The findings from the 2022–2023 CMII National Survey provide insight into the current state of CT exam throughput across Canada. With a national average hourly CT exam throughput of 2.34 exams per scanner per hour, the data shows variability across jurisdictions, revealing that complex factors influence throughput. Although the 2022–2023 exam throughput was lower than what was observed in 2005, this is likely due to differences in calculation methods, challenges with resourcing capacity for medical imaging teams, and advances in technology allowing for expanded CT applications, rather than a decline in productivity over time.
When exam data were examined with equipment age, CT units that were 5 to 9 years old had a higher average hourly exam throughput compared to other CT units in other age categories, likely due to factors such as the complexity of scans conducted on these units, the use of these CT units for other clinical and research purposes, and the relatively young age of the units. Similarly, sites with 3 or more FTE MRTs per unit or more units on site had higher average hourly CT exam throughput. CT units with more slices generally had higher hourly exam throughput, although they are also more likely to be used for complex, time-intensive procedures.
The analysis shows that while technological advancements such as newer CT units with faster scan speeds and improved image quality can enhance throughput, they must be balanced with considerations like staffing adequacy and site-specific challenges.
The results suggest that addressing inefficiencies in workflow, optimizing resource utilization, standardizing protocols and practices, and leveraging technological innovations are essential steps in improving the overall performance and throughput of CT units. However, this must be done while ensuring that quality of care remains a top priority. Faster exam throughput must not come at the expense of accurate diagnosis or patient safety.
Ultimately, these findings provide decision-makers with a valuable tool to assess the performance of CT units and identify potential bottlenecks. Tailored solutions at the site level and jurisdictional level that consider the unique circumstances of each will be crucial in advancing the efficiency and accessibility of medical imaging across Canada.
References
1.Ariste R. FG. Could MRI and CT Scanners Be Operated More Intensively in Canada? Healthc Policy. 2007;3(1):e113-e120. PubMed
2.Information CIfH. Medical Imaging in Canada 2005. Ottawa (ON): Canadian Institute for Health Information;2005.
3.Agency CsD. Canadian Medical Imaging Inventory 2022–2023: CT. Canadian Journal of Health Technologies. 2024;4(8):1-69.
4.Booij R. BRPJ, Dijkshoorn M.L., van Straten M. Technological developments of X-ray computed tomography over half a century: User’s influence on protocol optimization. Eur J Radiol. 2020;131.
5.N.J. P. Recent and Future Directions in CT Imaging. Ann Biomed Eng. 2014;42(2):260-268. PubMed
6.Agency CsD. Wait List Strategies for CT and MRI Scans. Canadian Journal of Health Technologies. 2023;3(1):1-68.
7.Chao Y.S. SA, Morrison A., Hafizi D., Pyke L. The Canadian Medical Imaging Inventory 2019-2020. Canadian Journal of Health Technologies. 2021;1(1):1-215. PubMed
8.Radiology ESo. Renewal of radiological equipment. Insights Imaging. 2014;5(5):543-546. PubMed
9.Radiologists CAo. Improving Access to Lifesaving Imaging Care for Canadians. Ottawa (ON): Canadian Association of Radiologists;2022.
10.Aderhold T. BS, Nataraja S. Imaging Productivity and Turnaround Time Benchmarks Preview. 2016; https://www.advisory.com/content/dam/advisory/en/public/shared/Research/IPP/success-pages/Imaging-Productivity-and-Turnaround-Time-Benchmarks-Report.pdf. Accessed Mar 12, 2025.
11.Fine B. SSE, White L., Henry D. Impact of restricting diagnostic imaging reimbursement for uncomplicated low back pain in Ontario: a population-based interrupted time series analysis. CMAJ Open. 2017;5(4):E760-E767. PubMed
12.Radiologists CAo. National Practice Guidelines. Practice Guidelines 2025; https://car.ca/patient-care/practice-guidelines/. Accessed Mar 12, 2025.
13.Commission CNS. Radiation Protection. In: Commission CNS, ed. Ottawa (ON): Government of Canada; 2021:1-75.
14.Sutherland G. RN, Gibbard R., Dobrescu A. The Value of Radiology, Part II. Ottawa (ON): The Conference Board of Canada;2019.
15.Hsieh J. FT. Computed tomography recent history and future perspectives. Journal of Medical Imaging. 2021;8(5):052109. PubMed
16.Boland G.W.L. HMP, Marchione D.G., McCormick W. Maximizing outpatient computed tomography productivity using multiple technologists. J Am Coll Radiol. 2008;5(2):119-125. PubMed
17.Corp. N. Slice of CT Scanners. 2021; https://www.neurologica.com/blog/slice-of-ct-scanners. Accessed Feb 11, 2025.
18.Bioengineering NIoBIa. Computed Tomography (CT). Science Topics 2022; https://www.nibib.nih.gov/science-education/science-topics/computed-tomography-ct. Accessed Mar 11, 2025.
19.Agency CsD. Canadian Medical Imaging Inventory 2022–2023: The Medical Imaging Team. Canadian Journal of Health Technologies. 2024;4(8):1-40.
20.R L. Why Allowing Your CT Scanner to Warm Up Before Use is Beyond Critical. CT News https://mxrimaging.com/Blogs/Why-Allow-Your-CT-Scanner-to-Warm-Up. Accessed Feb 24, 2025.
21.Liguori C. FG, Massaroni C., Saccomandi P., Giurazza F., Pitocco P., Marano R., Schena E. Emerging clinical applications of computed tomography. Medical Devices: Evidence and Research. 2015;8:265-278. PubMed
22.Bhayana R. WCD, Menezes R.J., Bartlett E.S., Choi J. Optimising after-hours workflow of computed tomography orders in the emergency department. BMJ Open Qual. 2020;9(3). PubMed
23.Almanaa M. JA, Matabi M., Alahmad H., Alhulail A., Alshuhri M., Alotaibi A., Alarifi M. Evaluating MRI and CT scan scheduling workflows: A retrospective analysis. Journal of Radiation Research and Applied Sciences. 2024;17(4).
24.Wenderott K. KJ, Zaruchas F., Weigl M. Effects of artificial intelligence implementation on efficiency in medical imaging—a systematic literature review and meta-analysis. NPJ Digital Medicine. 2024;7(265). PubMed
25.Maass K.L. HE, Huschka T.R., Sir M.Y., Nordland M.R., Pasupathy K.S. A discrete event simulation to evaluate impact of radiology process changes on emergency department computed tomography access. J Eval Clin Pract. 2021;28(1):120-128. PubMed
Appendix 1: Supplementary Data
Please note that this appendix has not been copy-edited.
Table 1: Average CT Hourly Exam Throughput of Individual Units by Jurisdiction
Jurisdiction | Number of CT units | Number of sites with CTs | Number of sites with sufficient data to calculate average hourly CT exams | Average hourly CT throughput per individual unit |
|---|---|---|---|---|
Newfoundland and Labrador | 16 | 14 | 8 | 1.89 |
Prince Edward Island | 2 | 2 | 2 | 3.43 |
Nova Scotia | 18 | 14 | 6 | 3.07 |
New Brunswick | 15 | 11 | 7 | 2.82 |
Quebec | 144 | 105 | 15 | 2.40 |
Ontario | 192 | 124 | 44 | 2.35 |
Manitoba | 24 | 17 | 8 | 1.98 |
Saskatchewan | 18 | 15 | 13 | 2.31 |
Alberta | 53 | 39 | 35 | 2.25 |
British Columbia | 75 | 50 | 32 | 2.26 |
Yukon | 1 | 1 | 1 | 2.48 |
Northwest Territories | 1 | 1 | 1 | 3.25 |
Nunavut | 1 | 1 | 1 | 2.19 |
Canada | 560 | 394 | 173 | 2.34 |
Table 2: Average CT Hourly Exam Throughput of Individual Units by Age Categories Across Jurisdictions
Jurisdiction | Average hourly CT exam throughput of individual units aged less than 5 years (number of units) | Average hourly CT exam throughput of individual units aged 5 to 9 years (number of units) | Average hourly CT exam throughput of individual units aged 10 to 14 years (number of units) | Average hourly CT exam throughput of individual units aged 15 years or older (number of units) |
|---|---|---|---|---|
Newfoundland and Labrador | 2.58 (3) | NR | 2.80 (2) | NR |
Prince Edward Island | 2.84 (1) | 4.02 (1) | NR | NR |
Nova Scotia | 2.85 (4) | NR | 1.79 (2) | 2.06 (1) |
New Brunswick | 2.23 (1) | 3.14 (4) | NR | 5.68 (2) |
Quebec | 3.43 (2) | 5.99 (12) | 1.93 (2) | 2.59 (2) |
Ontario | 3.07 (18) | 2.72 (25) | 2.51 (14) | NR |
Manitoba | 1.65 (3) | 2.02 (2) | 1.32 (1) | 2.94 (2) |
Saskatchewan | 1.83 (4) | 2.29 (6) | 2.46 (4) | 1.93 (1) |
Alberta | 1.53 (7) | 2.38 (21) | 2.86 (20) | 3.83 (1) |
British Columbia | 2.68 (12) | 3.06 (13) | 2.31 (12) | 1.81 (2) |
Yukon | 2.48 (1) | NR | NR | NR |
Northwest Territories | NR | 3.25 (1) | NR | NR |
Nunavut | NR | NR | NR | NR |
Canada | 2.52 (56) | 2.95 (85) | 2.52 (57) | 2.81 (11) |
NR = not reported.
Table 3: Average CT Hourly Exam Throughput of Individual Units by Staffing Categories Across Jurisdictions
Jurisdiction | Average hourly CT exam throughput for individual units with 1 to 2 FTE MRTs per unit (number of sites) | Average hourly CT exam throughput for individual units with 3 to 5 FTE MRTs per unit (number of sites) | Average hourly CT exam throughput for individual units with 6 or more FTE MRTs per unit (number of sites) |
|---|---|---|---|
Newfoundland and Labrador | 1.43 (6) | 3.25 (2) | NR |
Prince Edward Island | NR | 3.43 (2) | NR |
Nova Scotia | NR | 3.12 (4) | 2.98 (2) |
New Brunswick | 2.84 (1) | 3.01 (5) | 1.87 (1) |
Quebec | 2.30 (5) | 2.13 (4) | 2.65 (16) |
Ontario | 2.68 (8) | 2.15 (23) | 2.51 (13) |
Manitoba | 1.32 (1) | 2.20 (5) | 1.78 (2) |
Saskatchewan | 2.48 (6) | 1.61 (3) | 2.57 (4) |
Alberta | 1.73 (16) | 2.79 (15) | 3.01 (3) |
British Columbia | 2.16 (9) | 2.26 (14) | 2.34 (9) |
Yukon | NR | 2.48 (1) | NR |
Northwest Territories | 3.25 (1) | NR | NR |
Nunavut | NR | 2.19 (1) | NR |
Canada | 2.10 (53) | 2.44 (79) | 2.51 (40) |
FTE = full-time equivalent; MRT = medical radiation technologist; NR = not reported.
Table 4: Average CT Hourly Exam Throughput of Individual Units by CT Slice Categories Across Jurisdictions
Jurisdiction | Average hourly CT exam throughput for individual units with 64 slices (number of sites) | Average hourly CT exam throughput for individual units with 128 slices (number of sites) | Average hourly CT exam throughput for individual units with 256 slices (number of sites) | Average hourly CT exam throughput for individual units with more than 256 slices (number of sites) |
|---|---|---|---|---|
Newfoundland and Labrador | 1.96 (3) | NR | NR | 2.88 (2) |
Prince Edward Island | 2.84 (1) | NR | NR | NR |
Nova Scotia | 1.07 (1) | 2.50 (4) | 2.06 (1) | NR |
New Brunswick | 2.77 (3) | NR | 2.23 (1) | 3.56 (2) |
Quebec | 2.55 (7) | 5.33 (4) | 2.72 (1) | NR |
Ontario | 2.99 (11) | 2.56 (25) | 1.53 (3) | 3.90 (6) |
Manitoba | 3.07 (3) | 2.56 (1) | 1.32 (1) | NR |
Saskatchewan | 2.31 (8) | 2.49 (5) | NR | 1.93 (1) |
Alberta | 2.69 (15) | 2.78 (22) | NR | 3.11 (3) |
British Columbia | 2.51 (13) | 3.26 (9) | 2.56 (7) | 2.29 (3) |
Yukon | NR | 2.48 (1) | NR | NR |
Northwest Territories | NR | NR | NR | NR |
Nunavut | NR | NR | NR | NR |
Canada | 2.61 (65) | 2.86 (71) | 2.20 (14) | 3.20 (17) |
NR = not reported.
Table 5: Average CT Hourly Exam Throughput of Individual Units by Number of CT Units on Site Across Jurisdictions
Jurisdiction | Average hourly CT exam throughput of individual units at sites with 1 CT (number of sites) | Average hourly CT exam throughput of individual Units at Sites with 2 CTs (number of sites) | Average hourly CT exam throughput of individual units at sites with 3 CTs (number of sites) | Average hourly CT exam throughput of individual units at sites with 4 or more CTs (number of sites) |
|---|---|---|---|---|
Newfoundland and Labrador | 1.81 (7) | 2.42 (1) | NR | NR |
Prince Edward Island | 3.43 (2) | NR | NR | NR |
Nova Scotia | 3.83 (4) | 1.56 (2) | NR | NR |
New Brunswick | 3.14 (4) | 2.40 (3) | NR | NR |
Quebec | 2.31 (12) | 2.99 (1) | 2.72 (1) | 2.46 (1) |
Ontario | 2.47 (29) | 2.31 (12) | 1.49 (2) | 1.31 (1) |
Manitoba | 2.18 (6) | 1.32 (1) | 1.47 (1) | NR |
Saskatchewan | 2.47 (11) | 1.93 (1) | 0.89 (1) | NR |
Alberta | 2.12 (25) | 3.05 (7) | 1.56 (2) | 1.46 (1) |
British Columbia | 2.47 (20) | 2.07 (8) | 1.58 (4) | NR |
Yukon | 2.48 (1) | NR | NR | NR |
Northwest Territories | 3.25 (1) | NR | NR | NR |
Nunavut | 2.19 (1) | NR | NR | NR |
Canada | 2.42 (123) | 2.35 (36) | 1.59 (11) | 1.74 (3) |
NR = not reported.
Table 6: Site Average CT Hourly Exam Throughput by Number of CT Units on Site Across Jurisdictions
Jurisdiction | Site average hourly CT exam throughput at sites with 1 CT (number of sites) | Site average hourly CT exam throughput at sites with 2 CTs (number of sites) | Site average hourly CT exam throughput at sites with 3 CTs (number of sites) | Site average hourly CT exam throughput at sites with 4 or more CTs (number of sites) |
|---|---|---|---|---|
Newfoundland and Labrador | 1.81 (7) | 4.85 (1) | NR | NR |
Prince Edward Island | 3.43 (2) | NR | NR | NR |
Nova Scotia | 3.83 (4) | 3.12 (2) | NR | NR |
New Brunswick | 3.14 (4) | 4.79 (3) | NR | NR |
Quebec | 2.31 (12) | 5.99 (1) | 8.16 (1) | 14.79 (1) |
Ontario | 2.47 (29) | 4.62 (12) | 4.48 (2) | 5.24 (1) |
Manitoba | 2.18 (6) | 2.63 (1) | 4.42 (1) | NR |
Saskatchewan | 2.47 (11) | 3.87 (1) | 2.66 (1) | NR |
Alberta | 2.12 (25) | 6.10 (7) | 4.68 (2) | 5.83 (1) |
British Columbia | 2.47 (20) | 4.13 (8) | 4.75 (4) | NR |
Yukon | 2.48 (1) | NR | NR | NR |
Northwest Territories | 3.25 (1) | NR | NR | NR |
Nunavut | 2.19 (1) | NR | NR | NR |
Canada | 2.42 (123) | 4.70 (36) | 4.78 (11) | 8.62 (3) |
NR = not reported.
ISSN: 2563-6596
Canada’s Drug Agency (CDA-AMC) is a pan-Canadian health organization. Created and funded by Canada’s federal, provincial, and territorial governments, we’re responsible for driving better coordination, alignment, and public value within Canada’s drug and health technology landscape. We provide Canada’s health system leaders with independent evidence and advice so they can make informed drug, health technology, and health system decisions, and we collaborate with national and international partners to enhance our collective impact.
Disclaimer: CDA-AMC has taken care to ensure that the information in this document was accurate, complete, and up to date when it was published, but does not make any guarantee to that effect. Your use of this information is subject to this disclaimer and the Terms of Use at cda-amc.ca.
The information in this document is made available for informational and educational purposes only and should not be used as a substitute for professional medical advice, the application of clinical judgment in respect of the care of a particular patient, or other professional judgments in any decision-making process. You assume full responsibility for the use of the information and rely on it at your own risk.
CDA-AMC does not endorse any information, drugs, therapies, treatments, products, processes, or services. The views and opinions of third parties published in this document do not necessarily reflect those of CDA-AMC. The copyright and other intellectual property rights in this document are owned by the Canadian Agency for Drugs and Technologies in Health (operating as CDA-AMC) and its licensors.
Questions or requests for information about this report can be directed to Requests@CDA-AMC.ca.