Drugs, Health Technologies, Health Systems
Health Technology Review
CT and MRI Examination Volumes in Canada: National Performance Insights
This report leverages the 2022–2023 Canadian Medical Imaging Inventory (CMII) data to provide a detailed analysis of average annual imaging volumes by site and unit, highlighting that CT sites perform nearly twice as many examinations annually as MRI sites nationwide — insights that are critical for informed resource allocation, workforce planning, and equitable service delivery across diverse health care settings.
Key Messages
What Is the Issue?
Canada’s Drug Agency (CDA-AMC) received a request related to the average annual number of CT and MRI examinations performed per site and per unit across the country.
CT and MRI use in Canada has nearly doubled since 2007, yet there is limited recent publicly available information at the national and jurisdictional levels that reports examination volumes by geographic setting (urban, rural, and remote) or facility type (academic versus community).
Detailed data can support informed resource planning, efficient workload management, and equitable service delivery — and CDA-AMC is uniquely positioned to fill this gap by collecting and analyzing national imaging data across geographic settings and facility types.
What Did We Do?
CDA-AMC leveraged data from the 2022–2023 Canadian Medical Imaging Inventory (CMII) National Survey, including site-level and unit-level examination volumes.
In total, 178 of 394 CT sites and 115 of 239 MRI sites provided sufficient data to estimate average annual examination volumes per site and per unit.
What Did We Find?
Nationally, CT sites operated an average of 1.40 units and performed 16,350 annual examinations per site (12,900 examinations performed per unit), while MRI sites averaged 1.49 units with 9,033 annual examinations performed per site (5,850 examinations performed per unit).
Urban facilities had higher capacity and annual examination volumes, with urban CT sites averaging 1.69 units and 23,036 examinations performed per site, and urban MRI sites averaging 1.64 units and 10,501 annual examinations performed per site.
Rural and remote sites had fewer units and lower examination volumes: rural CT sites averaged 1.04 units with 8,303 examinations performed; remote CT sites averaged 1 unit with 5,999 examinations performed; rural MRI sites averaged 1 unit with 4,522 examinations performed; and remote MRI sites averaged 1 unit with 3,198 examinations performed.
Academic sites operated more units and performed significantly more examinations than community sites. Academic CT sites averaged 2.14 units and 29,024 annual examinations performed per site, compared to 1.21 units and 13,024 annual examinations performed at community sites. Academic MRI sites averaged 2 units and 12,500 annual examinations performed, versus 1.23 units and 7,323 annual examinations performed for community sites.
What Does This Mean?
Understanding the differences across urban, rural, remote, academic, and community settings can inform appropriate distribution of imaging resources.
These findings may help decision-makers understand site-level workloads and where additional scanners or staffing would be most beneficial.
Highlighting sites with higher annual scan volumes can guide efforts to support technologist capacity through targeted recruitment, training, or optimized scheduling.
Context
Canada’s Drug Agency (CDA-AMC) received a request related to the average annual number of CT and MRI examinations performed per site and per unit across Canada. CT and MRI are vital diagnostic tools in medical imaging, and their use has increased substantially over the past decade in Canada. Between 2007 and 2022–2023, annual CT examinations rose from 3.38 million to 6.42 million (a 90% increase),1 while MRI examinations grew from 1.02 million to 2.21 million (a 117% increase).2 Over the same period, the number of CT units expanded from 419 to 560, and MRI units from 222 to 432.3,4
Currently, there are no recent, publicly available national or jurisdiction-level estimates detailing annual CT and MRI examination volumes categorized by geographic location (urban, rural, and remote) or by facility type (academic versus community). This information is helpful to inform:
Resource allocation: Facilities with higher examination volumes may need additional equipment or staffing,5 while facilities with lower volumes may require less advanced technology but still need other resources to ensure operational infrastructure and staff.6
Budgeting and capacity planning: Providing a clear picture of operating workloads to help human resource planning and help control associated costs.7
Regional imaging needs: Providing insight to ensure medical imaging infrastructure meets the diverse needs of patients across different settings in Canada.8
With data collected from the 2022–2023 Canadian Medical Imaging Inventory (CMII) National Survey, CDA-AMC is uniquely positioned to report on the average annual volume of CT and MRI examinations performed across Canada.3,4 These site-level examination volumes can also inform surge-capacity planning and help decision-makers to tailor imaging resources to urban, rural, remote, academic, and community settings during public health emergencies.
Objective
This report aims to estimate and summarize average annual CT and MRI examination volumes at the site and unit levels, and to estimate the average number of imaging units per site by geographic setting (urban, rural, and remote) and facility type (academic versus community). These insights will be leveraged to highlight variations in imaging capacity across Canada.
About This Document
This document summarizes information gathered from the 2022–2023 CMII National Survey. To estimate the average annual examinations performed per site and per unit, data were extracted from all CT or MRI sites that responded to the relevant survey questions. Our analysis included:
average units per site, indicating how many CT and MRI units each facility operates
average annual examinations performed per site, reflecting overall workload
average annual examinations performed per unit, showing how intensively machines are used.
Responses are based on data from 178 CT sites, representing 45% of all CT sites (394) across Canada, and 115 MRI sites, representing 48% of all MRI sites (239) across the country.
The analysis is stratified by province and territory (also referred to as jurisdiction), as well as by site characteristics including geographic setting (urban, rural, and remote) and facility type (academic versus community).
Results
The following sections present estimates of the average annual CT and MRI examinations performed per site and per unit across all jurisdictions in Canada. Respondents provided information on facility location (urban, rural, and remote) and facility type (academic versus community) as well as information on the total number of examinations performed. Total number of annual examinations as well as the number of responding CT and MRI sites are first presented at the national level, followed by a jurisdictional summary. Calculations of average examinations performed per site, per unit, and the number of units per site are based solely on those facilities that responded to the survey. Summaries of the total number of annual examinations performed and the total number of responding CT and MRI sites and units are provided in Table 1, Table 2, Table 3, Table 4, Table 5, and Table 6 of Appendix 1 and Figure 1 and Figure 2.
Average Annual CT and MRI Examinations Performed in Canada
This section provides a national overview of the estimated average annual CT and MRI examination volumes based on survey responses. The results represent aggregated averages across all responding sites. Survey responses suggest that average annual CT examination volumes are higher compared to MRI examination volumes across Canada, possibly because there are more CT units than MRI units available across jurisdictions. The data from responding sites provide details on average annual examinations performed by facility setting (i.e., urban, rural, and remote) as well as academic versus community facilities. Average annual examinations performed per site, per unit, and number of units per site across jurisdictions are calculated based on the sites that responded to the survey questions.
Average Annual CT Examinations Performed
Based on responses from 178 CT sites, representing 45% of all CT sites (394) and 249 CT units, and representing 44% of all CT units (560) in Canada in 2022–2023 (refer to Table 1, Appendix 1):
The average annual CT examinations performed per site was 16,350.
The average annual CT examinations performed per unit was 12,900.
The average number of CT units per site was 1.40.
Average Annual CT Examinations Performed by Setting
In 2022–2023 across Canada, CT sites had an estimated average of 1.69 units per site in urban settings, 1.04 units per site in rural settings, and 1.00 unit per site in remote settings (refer to Table 2, Appendix 1). Average annual examinations performed by setting were:
Urban: 23,036 per site and 13,600 per unit.
Rural: 8,303 per site and 7,984 per unit.
Remote: 5,999 per site and 5,999 per unit.
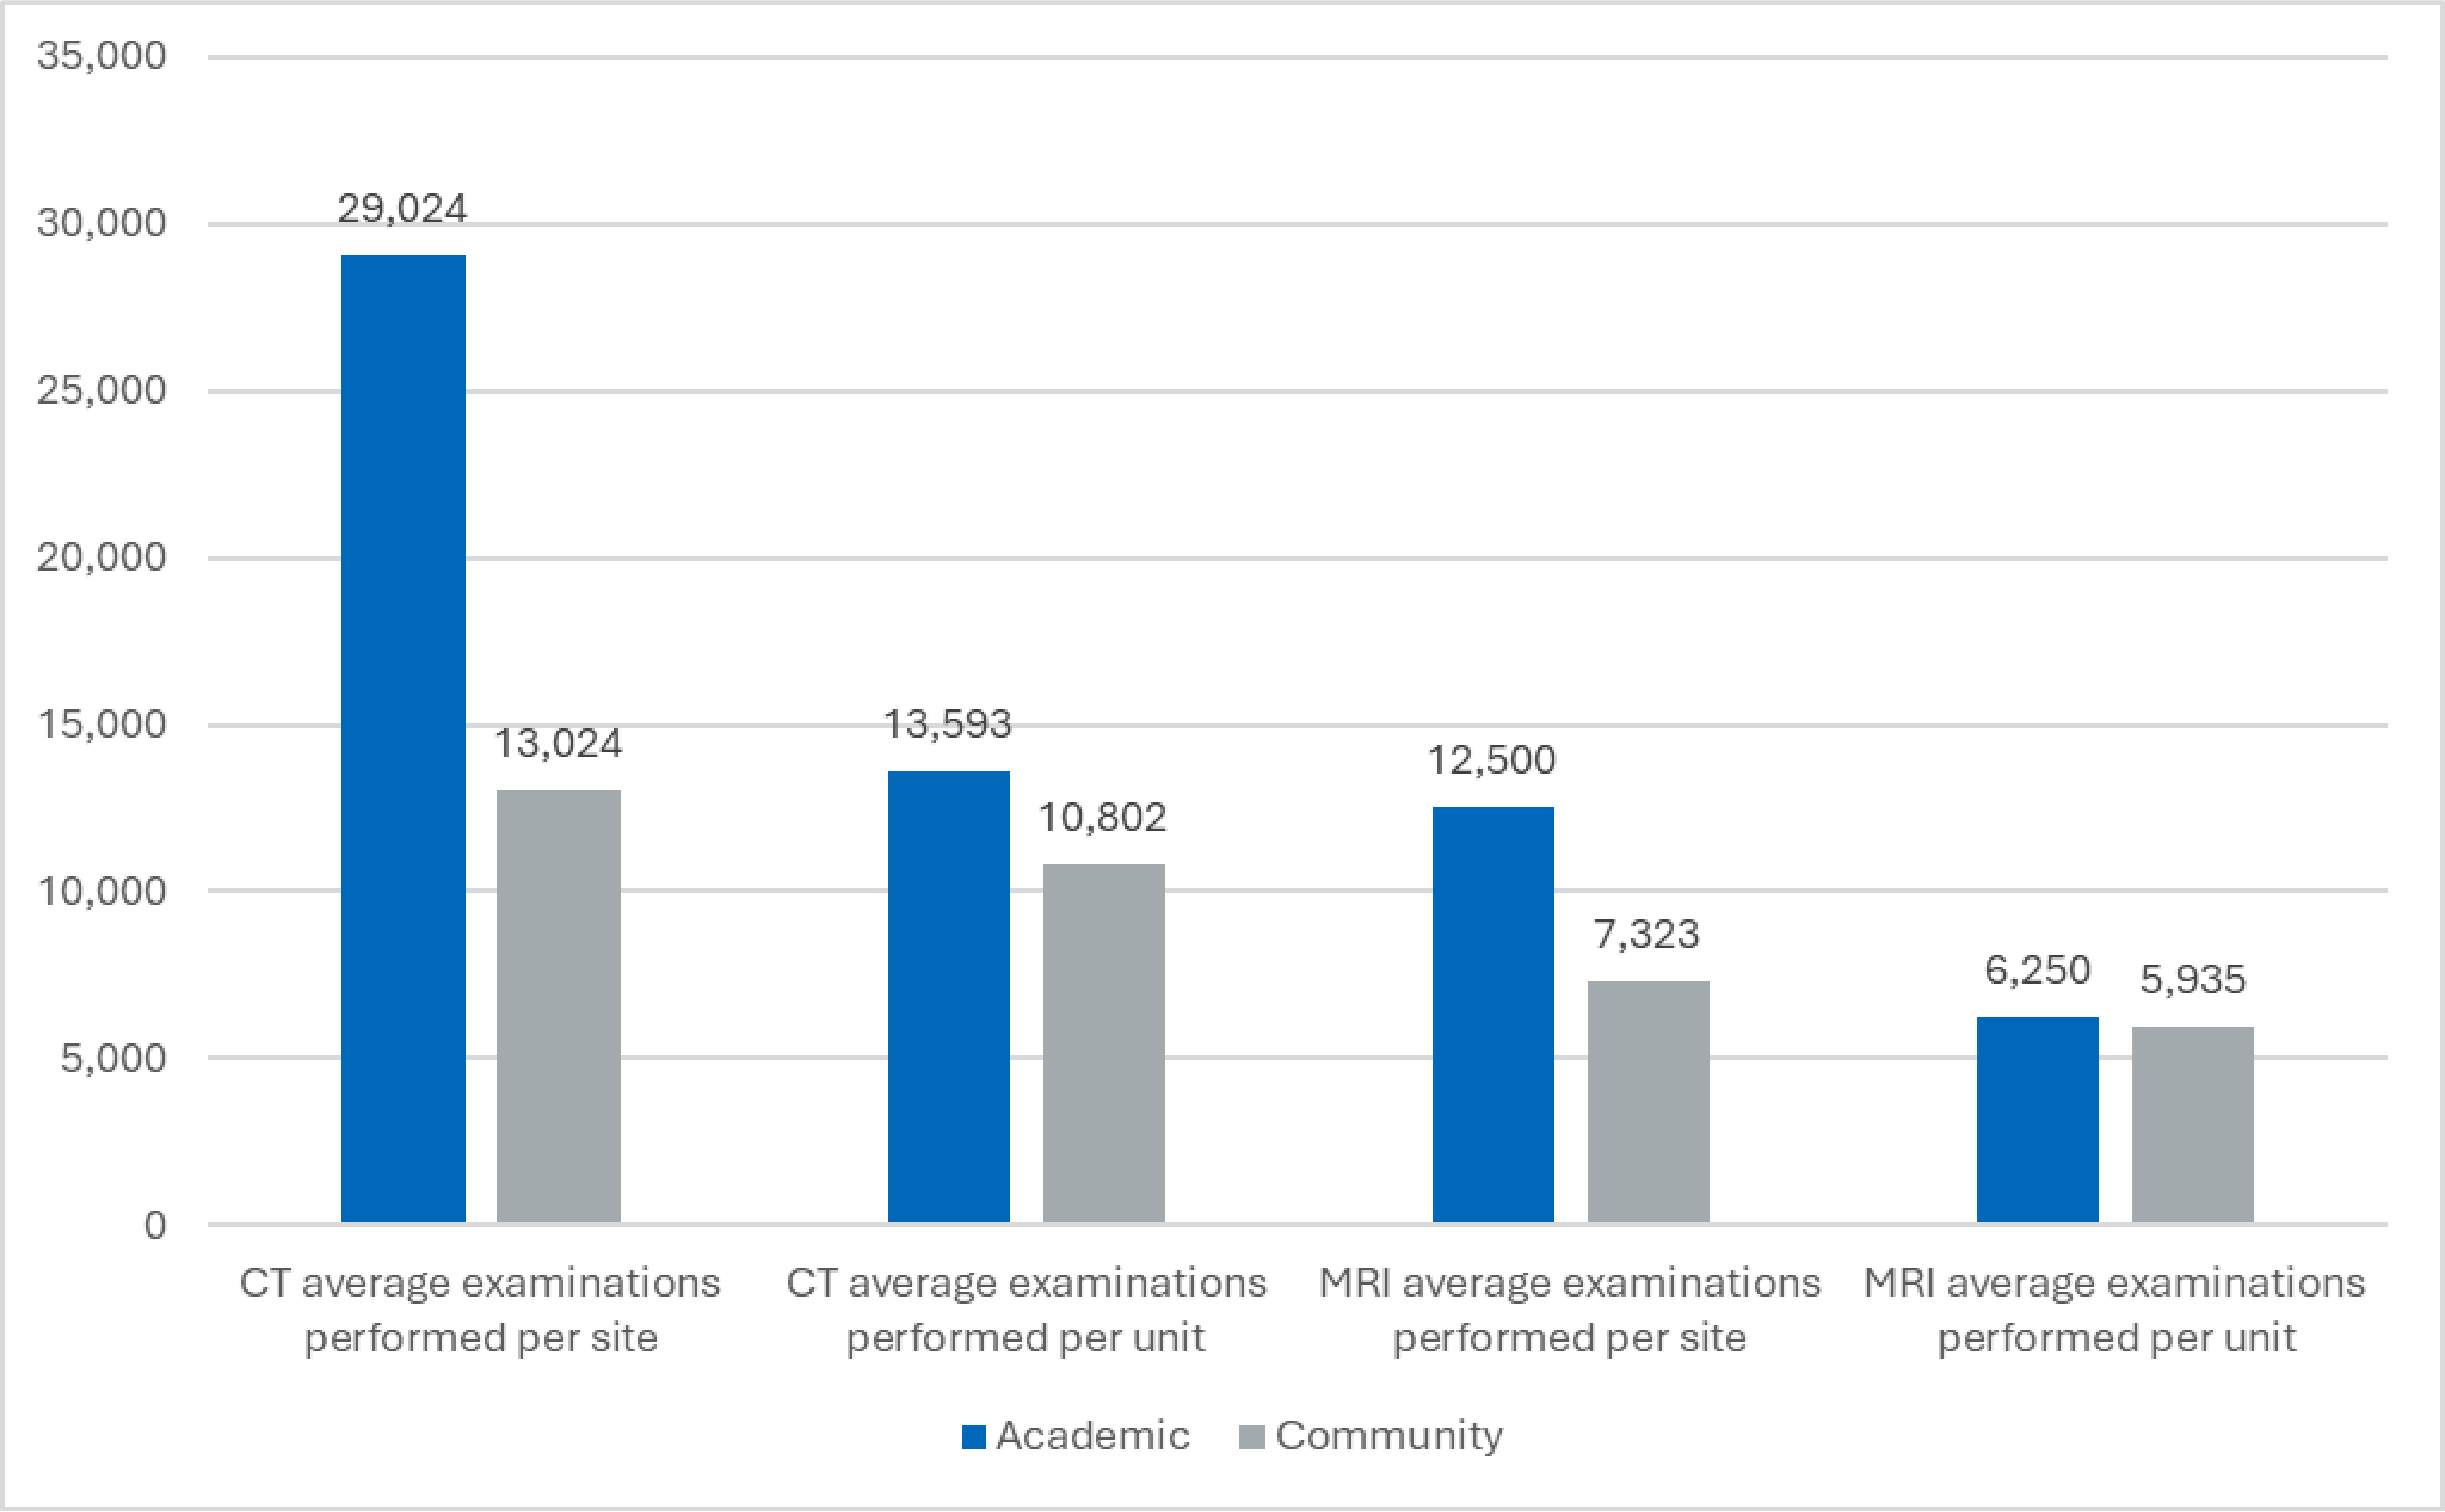
Average Annual CT Examinations Performed by Academic Facility
In 2022–2023 across Canada, CT sites had an average of 2.14 units per site in academic settings and 1.21 units per site in community settings (refer to Table 3, Appendix 1). Average annual examinations performed by academic status were:
Academic: 29,024 per site and 13,593 per unit.
Community: 13,024 per site and 10,802 per unit.
Average Annual MRI Examinations Performed
Based on responses from 115 MRI sites, representing 48% of all MRI sites (239) and 171 MRI units, and representing 46% of all MRI units (373) in Canada in 2022–2023 (refer to Table 4, Appendix 1):
The average annual MRI examinations performed per site was 9,033.
The average annual MRI examinations performed per unit was 5,850.
The average number of MRI units per site was 1.49.
Average Annual MRI Examinations Performed by Setting
In 2022–2023 across Canada, MRI sites had an estimated average of 1.64 units per site in urban settings, 1.00 unit per site in rural settings, and 1.00 unit per site in remote settings (refer to Table 5, Appendix 1). Average annual examinations performed by setting were:
Urban: 10,501 per site and 6,389 per unit.
Rural: 4,522 per site and 4,522 per unit.
Remote: 3,198 per site and 3,198 per unit.
Average Annual MRI Examinations Performed by Academic Facility
In 2022–2023 across Canada, MRI sites had an estimated average of 2.00 units per site in academic settings and 1.23 units per site in community settings (refer to Table 6, Appendix 1). Average annual examinations performed by academic status were:
Academic: 12,500 per site and 6,250 per unit.
Community: 7,323 per site and 5,935 per unit.
Figure 1: Average Annual CT and MRI Examinations Performed in Urban, Rural, and Remote Settings Across Canada in 2022–2023
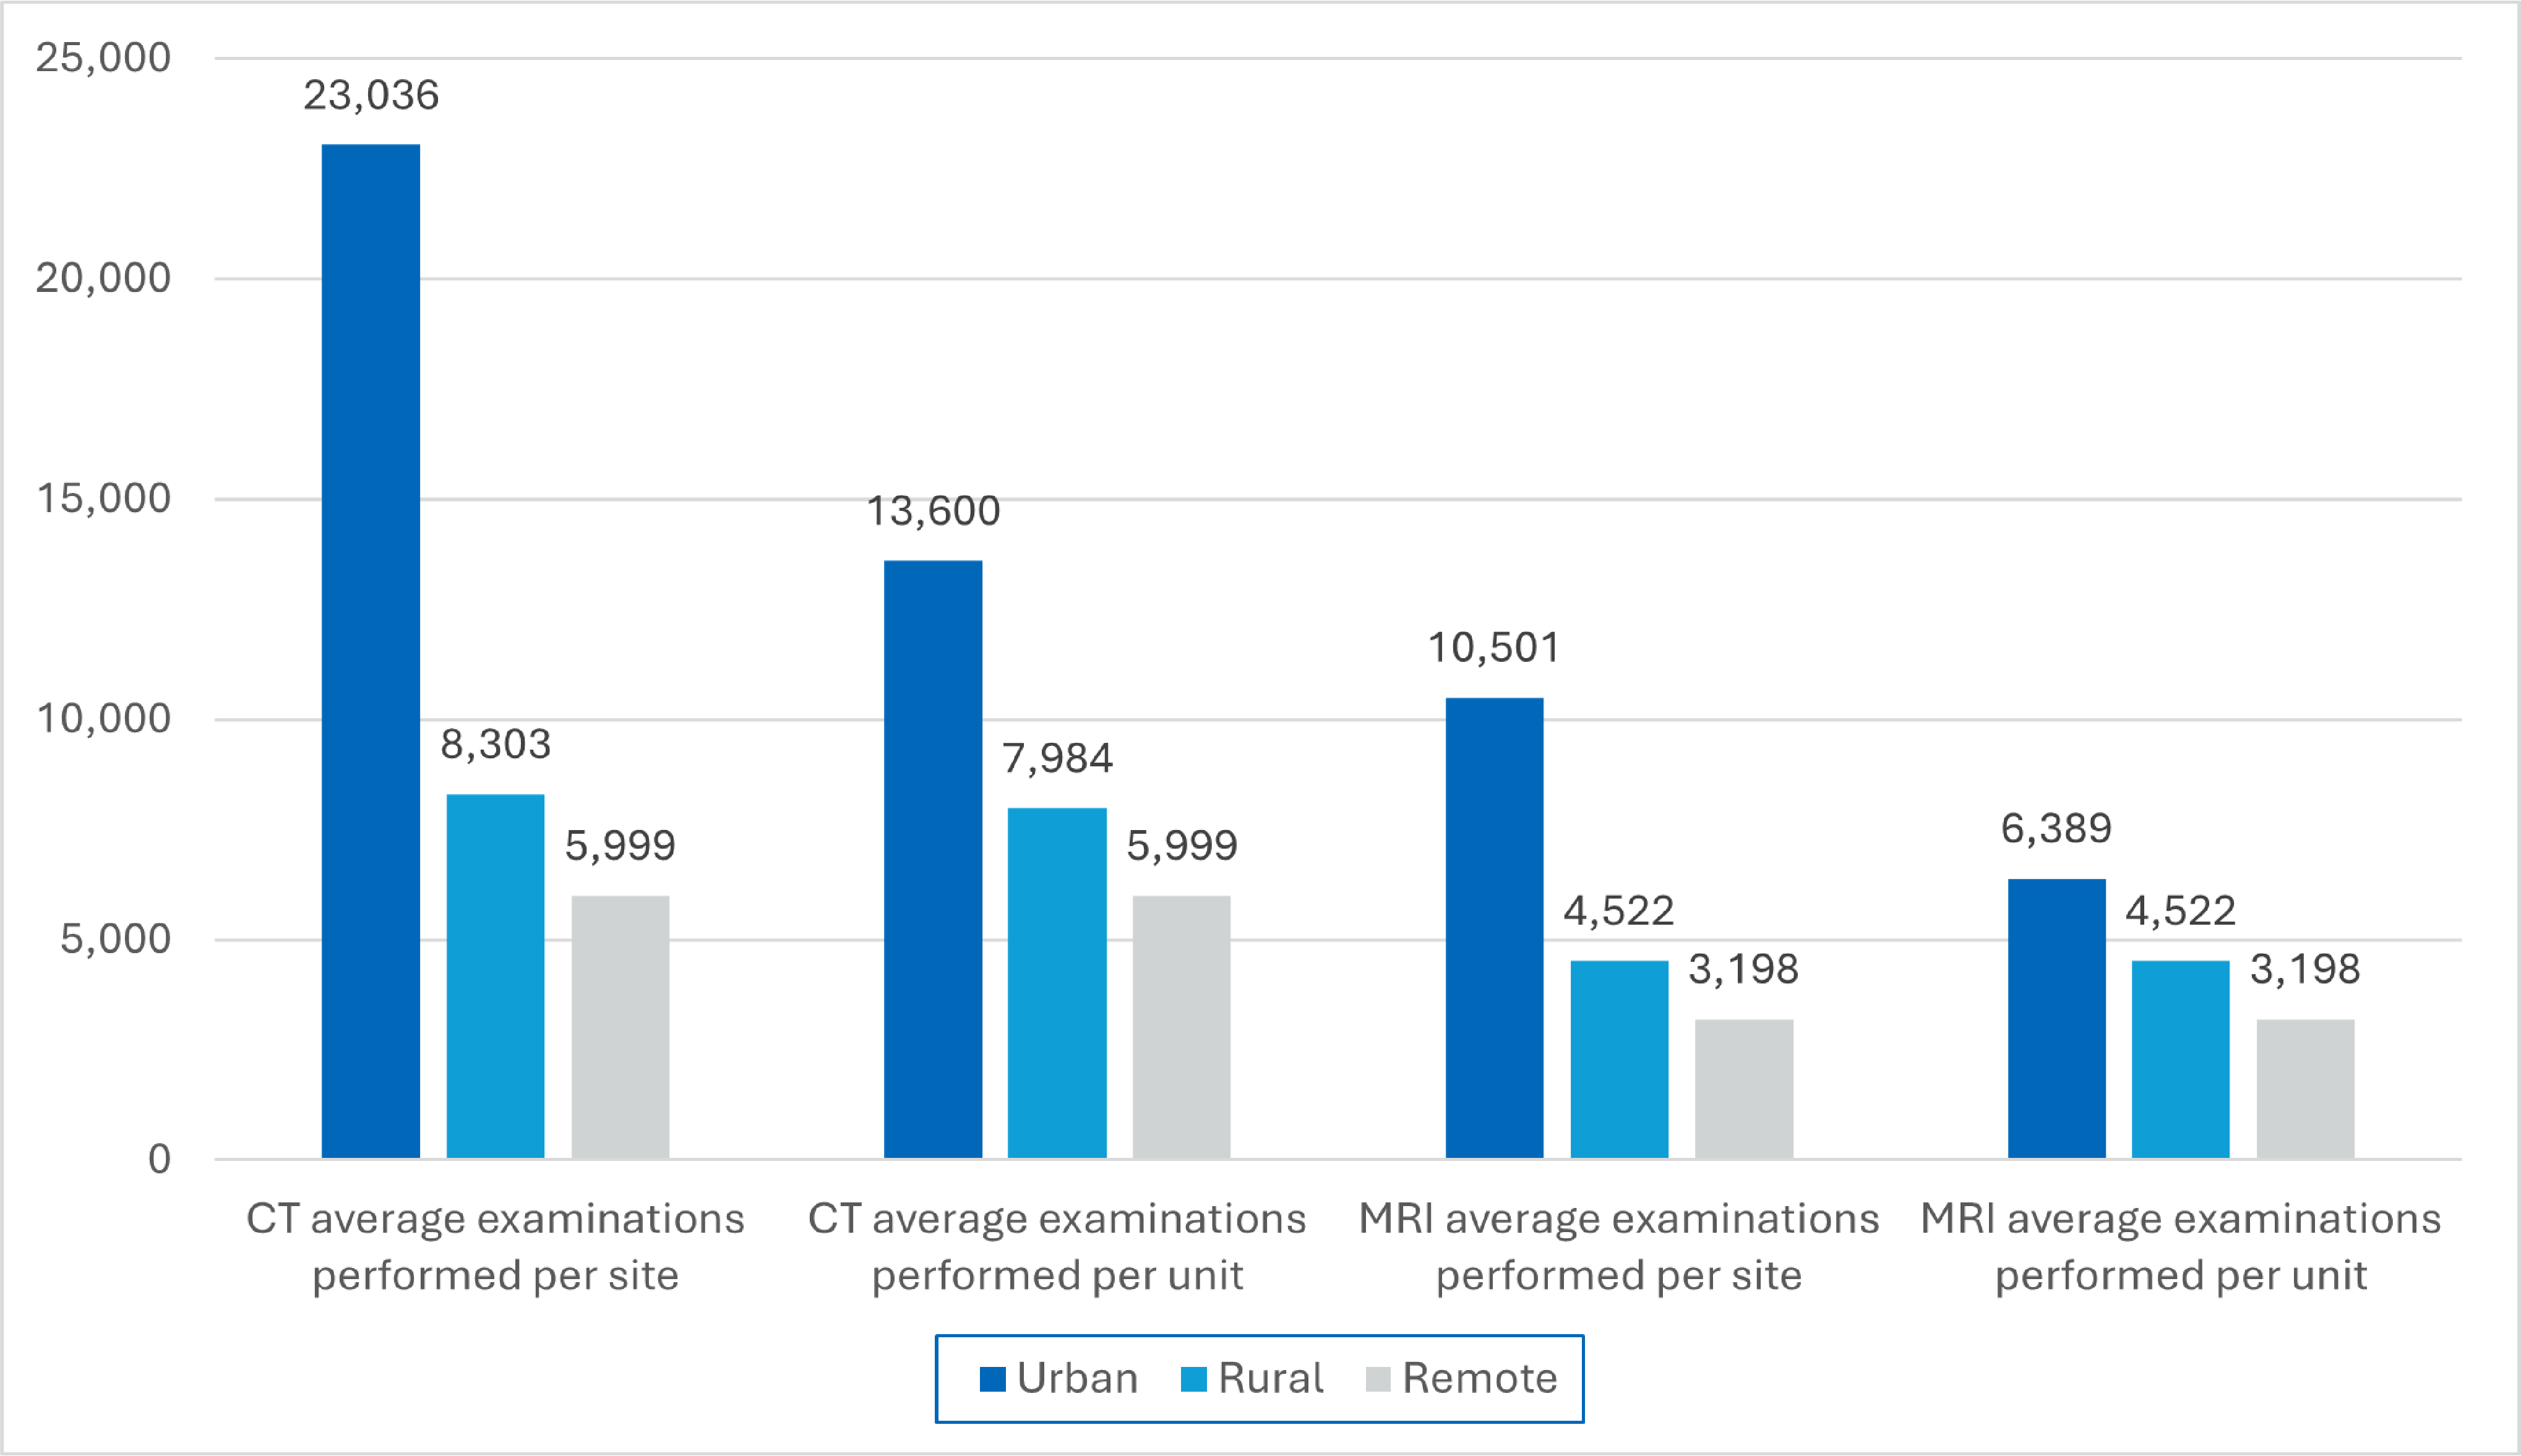
Figure 2: Average Annual CT and MRI Examinations Performed in Academic and Community Settings Across Canada in 2022–2023
Jurisdictional Variations
While national averages provide an overall picture, imaging activity in Canada varies widely across jurisdictions. This section summarizes the range of average examination volumes reported across jurisdictions, highlighting how these volumes differ by geographic setting and facility type. These jurisdictional differences may reflect the variation in population characteristics, demand for imaging services, and the availability of equipment and workforce infrastructure.
When comparing CT and MRI, CT facilities reported higher average annual examinations performed per site and per unit across jurisdictions, regardless of setting or academic status. For both modalities, urban and academic facilities reported the highest examination volumes, while rural, remote, and community facilities reported lower averages.
Detailed jurisdiction-level results, including per site, per unit, and units per site data, are presented in Appendix 1 (Table 1, Table 2, Table 3, Table 4, Table 5, and Table 6).
CT Examinations Performed
Across all jurisdictions, the estimated average annual CT examinations performed per site ranged from 4,336 to 23,566 examinations, while the estimated average annual CT examinations per unit ranged from 4,336 to 15,526. These variations reflect differences not only by jurisdiction, but also by geographic setting (urban, rural, and remote) and facility type (academic versus community). Higher site-level averages may reflect the presence of multiple CT units at some facilities (refer to Table 1, Table 2, and Table 3, Appendix 1):
Setting Differences
Urban sites reported the highest average annual CT examination volumes, ranging from 12,094 to 27,647 per site, and from 6,047 to 15,526 per unit. Rural sites reported lower average annual CT examination volumes, ranging from 4,832 to 16,347 per site, with the same values per unit.
Remote sites reported the lowest average annual CT examination volumes, ranging from 4,336 to 8,115 per site, with the same values per unit.
Academic Status Differences
Academic facilities reported average annual CT examinations performed ranging from 19,842 to 52,378 per site, and from 11,620 to 22,555 per unit.
Community facilities reported average annual CT examinations performed ranging from 4,336 to 18,641 per site, and from 4,336 to 12,855 per unit.
Units per Site
Jurisdictions reported between 1.00 and 2.75 CT units per site.
MRI Examinations Performed
Across all jurisdictions with capacity, the estimated average annual MRI examinations performed per site ranged from 3,132 to 10,709 examinations, while the estimated average annual MRI examinations performed per unit ranged from 3,132 to 8,655. These variations reflect differences not only by jurisdiction, but also by geographic setting (urban, rural, and remote) and facility type (academic versus community).
Higher site-level averages may reflect the presence of multiple MRI units at some facilities (refer to Table 4, Table 5, and Table 6, Appendix 1):
Setting Differences
Urban sites reported average annual MRI examinations performed ranging from 3,432 to 13,411 per site, and from 3,432 to 7,778 per unit.
Rural sites reported average annual MRI examinations performed ranging from 2,643 to 9,389 per site, and from 2,643 to 9,389 per unit.
Remote sites reported average annual MRI examinations performed ranging from 3,198 to 8,115 per site, with the same values per unit.
Academic Status Differences
Academic facilities reported average annual MRI examinations performed ranging from 7,295 to 23,290 per site, and from 4,904 to 7,763 per unit.
Community facilities reported average annual MRI examinations performed ranging from 3,132 to 11,275 per site, and from 3,132 to 8,063 per unit.
Units per Site
Jurisdictions reported between 1.00 and 3.00 MRI units per site.
Limitations
This report provides an overview of performance for CT and MRI imaging across Canada. However, several limitations should be considered when interpreting these findings.
First, these findings are based on data from 2022–2023 CMII National Survey and therefore may not capture more recent changes in CT and MRI performance across jurisdictions. The findings are based on self-reported survey responses from imaging sites which may be subject to reporting errors, misinterpretations of questions, or other data issues leading to potential biases in the report. Additionally, this report is limited by the number of sites that reported the necessary information required for this analysis in the CMII survey.3 Small sample sizes for some jurisdictions may have led to less reliable and accurate results – limiting the generalizability of jurisdiction-level estimates. There is potential for nonresponse bias and overgeneralization, as response rates varied between CT and MRI, across geographic settings (urban, rural, and remote), and between academic and nonacademic facilities.
Second, examination volume data were collected in aggregate at the site level, with average annual volumes assumed to be evenly distributed across all CT and MRI units. This may not reflect actual practice, as certain units may be dedicated to specific functions (e.g., research, pediatric, or complex examinations). The analysis does not account for variation in case mix, which can influence examination duration and throughput. Sites performing more specialized or time-intensive scans may report lower examination volumes despite operating efficiently and at full capacity.
Facilities also differ in ways that cannot be fully captured in this report. For example, some high-volume academic centres may operate 24 hours a day, 7 days a week, and on weekends, while smaller imaging sites may run shorter schedules. Sites also differ in the patient populations they serve. These operational differences, along with unit age, scanner make and model, and logistical factors can all influence annual examination volumes but are not directly accounted for in this analysis.
Finally, regional health care policies, infrastructures, and patient demographics vary across Canada and may drive differences in examination volumes as a result of local practice and demand rather than capacity constraints. This report presents an estimate of average annual examination volumes per site and per unit for CT and MRI, and it should be interpreted with these contextual factors and data limitations in mind.
Implications for Decision-Making
Although overall CT and MRI examination volumes have risen substantially in past years, the site-level and unit-level findings in this report highlight important variations in annual workloads. These differences are shaped by a range of factors — including facility capacity, infrastructure, health policy, and local operational conditions. Urban, rural, and remote settings, as well as academic and community institutions, face distinct circumstances that influence access to and delivery of imaging services. These findings reveal implications that can guide decision-making:
Tailored resource allocation: Facilities with higher annual examination volumes may achieve greater throughput when equipped with newer scanners, dedicated maintenance teams, and staffing models that align technologist shifts with peak demand.9-11 Understanding average examinations performed per site and per unit supports more accurate forecasting of staffing needs, equipment life cycle planning, and maintenance considerations — that may help improve the alignment between resources and service workloads.12
Strengthen workforce support and stability: Identifying sites with higher workloads can help guide targeted recruitment, training, and shift-scheduling strategies to support staff capacity, maintain performance, and promote long-term workforce sustainability.13
Equitable distribution of imaging capacity: Stratification by urban, rural, remote, and academic and community settings presents regional differences in imaging capacity. These data can help inform equitable resource distribution, which may ensure that all communities have appropriate access to imaging services.14,15
Scalability and emergency preparedness: Baseline data on average annual imaging volumes may enable rapid scaling of imaging services during public health emergencies or sudden demand spikes, by identifying sites with spare capacity and those requiring reinforcement through mobile units or interfacility support.16
These insights can inform evidence-based strategies to optimize imaging capacity, that may help ensure equitable resource distribution, and support workforce sustainability in the diverse health care settings across Canada.
Conclusion
This report provides a detailed national and jurisdictional overview of estimated average annual CT and MRI examination volumes at both the site and unit levels in Canada. Across modalities, results varied by region, facility type, and academic affiliation.
On average, CT sites operated 1.40 units and performed 16,350 examinations annually, with much higher volumes reported in urban (23,036 examinations performed per site) and academic (29,024 examinations performed per site) facilities. MRI sites operated an average of 1.49 units and conducted 9,033 examinations performed per year, with urban (10,501 examinations performed per site) and academic (12,500 examinations performed per site) facilities reporting higher averages than rural, remote, and community sites.
The variability in imaging examination volumes across facility types and jurisdictions offers valuable insight into the capacities of the diagnostic imaging system in Canada. Recognizing these differences allows for targeted and responsive planning — whether to improve staffing models, guide equipment investments, or support access in underserved areas. Leveraging this data can help health system leaders align resources, adapt to changing demands, and strengthen the delivery of imaging services across all settings. Finally, these estimated annual average summaries provide a foundation for surge-capacity planning, which may help the decision-makers to identify where imaging services can be scaled rapidly during public health emergencies or sudden increases in imaging demand.
References
1.Canada’s Drug Agency. Trends in CT Exam Volumes Between 2007 and 2022–2023 in Canada. Canada’s Drug Agency; 2025. Accessed July 12, 2025. https://www.cda-amc.ca/sites/default/files/pdf/htis/2025/CM0016-Benchmarking_CT_exams.pdf
2.Canada’s Drug Agency. Trends in MRI Exam Volumes Between 2007 and 2022–2023 in Canada. Canada’s Drug Agency; 2025. Accessed July 12, 2025. https://www.cda-amc.ca/sites/default/files/pdf/htis/2025/CM0038-Benchmarking_MRI_exams.pdf
3.Canada's Drug Agency. Canadian Medical Imaging Inventory 2022–2023: CT. Canada's Drug Agency; 2024. Accessed July 12, 2025. https://www.cda-amc.ca/sites/default/files/hta-he/HC0024-05-CMII4-CT-Report.pdf
4.Canada's Drug Agency. Canadian Medical Imaging Inventory 2022–2023: MRI. Canada's Drug Agency; 2024. Accessed July 12, 2025. https://www.cda-amc.ca/sites/default/files/hta-he/HC0024-006-CMII4-MRI.pdf?utm_source=chatgpt.com
5.Dowhanik SPD, Schieda N, Patlas MN, Salehi F, van der Pol CB. Doing More With Less: CT and MRI Utilization in Canada 2003–2019. Can Assoc Radiol J. 2022;73(3):592-594. doi: 10.1177/08465371211052012 PubMed
6.Al-Naser Y, Alshadeedi F. Bringing imaging to the people: Enhancing access and equity in healthcare through mobile imaging. Journal of Medical Imaging and Radiation Sciences. 2024;55(4):101715. doi: https://doi.org/10.1016/j.jmir.2024.101715 PubMed
7.Zha N, Patlas MN, Neuheimer N, Duszak R, Jr. Prevalence of Burnout Among Canadian Radiologists and Radiology Trainees. Can Assoc Radiol J. 2018;69(4):367-372. doi: 10.1016/j.carj.2018.05.005 PubMed
8.Davidson M, Kielar A, Tonseth RP, Seland K, Harvie S, Hanneman K. The Landscape of Rural and Remote Radiology in Canada: Opportunities and Challenges. Can Assoc Radiol J. 2024;75(2):304-312. doi: 10.1177/08465371231197953 PubMed
9.Boland GWL. Enhancing CT Productivity: Strategies for Increasing Capacity. American Journal of Roentgenology. 2008;191(1):3-10. doi: 10.2214/AJR.07.3208 PubMed
10.Fedulo M. RIS and Resource Allocation: Optimizing Radiology Department Staffing. October 3, 2024. https://www.abbadox.com/blog/optimizing-radiology-department-staffing
11.Norbash A, Yucel K, Yuh W, et al. Effect of team training on improving MRI study completion rates and no-show rates. J Magn Reson Imaging. 2016;44(4):1040-7. doi: 10.1002/jmri.25219 PubMed
12.Kempter F, Heye T, Vosshenrich J, Ceresa B, Jäschke D. Trends in CT examination utilization in the emergency department during and after the COVID-19 pandemic. BMC Med Imaging. 2024;24(1):283. doi: 10.1186/s12880-024-01457-4 PubMed
13.Fawzy NA, Tahir MJ, Saeed A, et al. Incidence and factors associated with burnout in radiologists: A systematic review. Eur J Radiol Open. 2023;11:100530. doi: 10.1016/j.ejro.2023.100530 PubMed
14.Canada's Drug Agency. MRI Usage Patterns by Clinical Specialty Across Canada: Geographic and Temporal Trends. Canada's Drug Agency; 2025. Accessed July 12, 2025. https://canjhealthtechnol.ca/index.php/cjht/article/view/CM0033/CM0033
15.Gillespie J. Health Disparities for Canada's Remote and Northern Residents: Can COVID-19 Help Level the Field? J Bioeth Inq. 2023;20(2):207-213. doi: 10.1007/s11673-023-10245-8 PubMed
16.Luxenburg O, Saban M, Myers V, Vaknin S, Boldor N, Wilf-Miron R. National and regional trends in MRI utilization in the face of the ongoing COVID-19 pandemic. Isr J Health Policy Res. 2021;10(1):40. doi: 10.1186/s13584-021-00472-y PubMed
Appendix 1: Supplementary Data
Table 1: Summary of Average Annual CT Examinations and Annual Examinations Performed Per Unit Across Jurisdictions in 2022–2023
Jurisdiction | Total number of sites with CT | Number of sites with sufficient data to calculate average annual CT examinations | Average annual CT examinations per site | Total number of CT units | Number of units with sufficient data to calculate average annual CT examinations per unit | Average annual CT examinations per unit | Average CT units per site |
|---|---|---|---|---|---|---|---|
Newfoundland and Labrador | 14 | 8 | 5,740 | 16 | 9 | 4,984 | 1.13 |
Prince Edward Island | 2 | 2 | 12,690 | 2 | 2 | 12,690 | 1.00 |
Nova Scotia | 14 | 11 | 15,298 | 18 | 15 | 11,533 | 1.29 |
New Brunswick | 11 | 7 | 17,835 | 15 | 10 | 11,956 | 1.43 |
Quebec | 105 | 15 | 23,566 | 144 | 23 | 13,869 | 1.53 |
Ontario | 124 | 44 | 19,244 | 192 | 63 | 12,687 | 1.43 |
Manitoba | 17 | 8 | 18,133 | 24 | 11 | 13,481 | 1.38 |
Saskatchewan | 15 | 13 | 11,502 | 18 | 16 | 9,392 | 1.23 |
Alberta | 39 | 35 | 13,451 | 53 | 49 | 8,105 | 1.40 |
British Columbia | 50 | 32 | 17,541 | 75 | 48 | 11,283 | 1.50 |
Yukon | 1 | 1 | 6,455 | 1 | 1 | 6,455 | 1.00 |
Northwest Territories | 1 | 1 | 8,115 | 1 | 1 | 8,115 | 1.00 |
Nunavut | 1 | 1 | 4,336 | 1 | 1 | 4,336 | 1.00 |
Canada | 394 | 178 | 16,350 | 560 | 249 | 128,886 | 1.40 |
Note: This table has not been copy-edited.
Table 2: Summary of Average Annual CT Examinations and Annual Examinations Performed Per Unit in Urban, Rural, and Remote Settings Across Jurisdictions in 2022–2023
Jurisdiction | Setting | Average annual CT examinations (number of responding sites with CT) | Average annual examinations per unit (number of CT units in the responding sites) | Average CT urban, rural, and remote units per site |
|---|---|---|---|---|
Newfoundland and Labrador | Urban | 12,094 (1) | 6,047 (2) | 2.00 |
Rural | 4,832 (7) | 4,832 (7) | 1.00 | |
Remote | NA | NA | NA | |
Prince Edward Island | Urban | 12,690 (2) | 12,690 (2) | 1.00 |
Rural | NA | NA | NA | |
Remote | NA | NA | NA | |
Nova Scotia | Urban | 20,093 (6) | 13,192 (10) | 1.67 |
Rural | 9,544 (5) | 9,544 (5) | 1.00 | |
Remote | NA | NA | NA | |
New Brunswick | Urban | 18,083 (6) | 11,225 (9) | 1.50 |
Rural | 16,347 (1) | 16,347 (1) | 1.00 | |
Remote | NA | NA | NA | |
Quebec | Urban | 27,647 (12) | 15,526 (20) | 1.67 |
Rural | 7,117 (2) | 7,117 (2) | 1.00 | |
Remote | 7,489 (1) | 7,489 (1) | 1.00 | |
Ontario | Urban | 26,290 (26) | 15,193 (45) | 1.73 |
Rural | 9,389 (17) | 9,389 (17) | 1.00 | |
Remote | 3,600 (1) | 3,600 (1) | 1.00 | |
Manitoba | Urban | 20,686 (6) | 14,483 (9) | 1.50 |
Rural | 10,474 (2) | 10,474 (2) | 1.00 | |
Remote | NA | NA | NA | |
Saskatchewan | Urban | 15,960 (7) | 12,042 (10) | 1.43 |
Rural | 6,301 (6) | 6,301 (6) | 1.00 | |
Remote | NA | NA | NA | |
Alberta | Urban | 23,452 (13) | 11,271 (25) | 1.92 |
Rural | 7,540 (22) | 6,234 (24) | 1.09 | |
Remote | NA | NA | NA | |
British Columbia | Urban | 22,895 (19) | 12,933 (34) | 1.79 |
Rural | 9,717 (13) | 8,871 (14) | 1.08 | |
Remote | NA | NA | NA | |
Yukon | Urban | NA | NA | NA |
Rural | NA | NA | NA | |
Remote | 6,455 (1) | 6,455 (1) | 1.00 | |
Northwest Territories | Urban | NA | NA | NA |
Rural | NA | NA | NA | |
Remote | 8,115 (1) | 8,115 (1) | 1.00 | |
Nunavut | Urban | NA | NA | NA |
Rural | NA | NA | NA | |
Remote | 4,336 (1) | 4,336 (1) | 1.00 | |
Canada | Urban | 23,036 (98) | 13,600 (166) | 1.69 |
Rural | 8,303 (75) | 7,984 (78) | 1.04 | |
Remote | 5,999 (5) | 5,999 (5) | 1.00 |
NA = not applicable.
Note: This table has not been copy-edited.
Table 3: Summary of Average Annual CT Examinations and Annual Examinations Performed Per Unit in Academic and Community Settings Across Jurisdictions in 2022–2023
Jurisdiction | Academic status | Average CT annual examinations (number of sites with CT) | Average CT examinations per unit (number of CT units) | Average academic CT units per site |
|---|---|---|---|---|
Newfoundland and Labrador | Academic | NA | NA | NA |
Community | 5,740 (8) | 4,984 (9) | 1.13 | |
Prince Edward Island | Academic | NA | NA | NA |
Community | 12,690 (2) | 12,690 (2) | 1.00 | |
Nova Scotia | Academic | 23,434 (2) | 11,717 (4) | 2.00 |
Community | 13,490 (9) | 11,493 (11) | 1.22 | |
New Brunswick | Academic | 25,818 (1) | 12,909 (2) | 2.00 |
Community | 16,504 (6) | 11,798 (8) | 1.33 | |
Quebec | Academic | 52,378 (4) | 22,555 (11) | 2.75 |
Community | 13,089 (11) | 10,711 (12) | 1.09 | |
Ontario | Academic | 23,068 (6) | 11,620 (11) | 1.83 |
Community | 18,641 (38) | 12,855 (52) | 1.37 | |
Manitoba | Academic | 28,390 (2) | 15,530 (4) | 2.00 |
Community | 14,714 (6) | 12,798 (7) | 1.17 | |
Saskatchewan | Academic | 19,842 (4) | 12,986 (7) | 1.75 |
Community | 7,796 (9) | 7,796 (9) | 1.00 | |
Alberta | Academic | 29,223 (8) | 12,306 (18) | 1.92 |
Community | 8,777 (27) | 6,860 (31) | 1.09 | |
British Columbia | Academic | 28,334 (10) | 13,265 (22) | 1.79 |
Community | 12,636 (22) | 10,382 (26) | 1.08 | |
Yukon | Academic | NA | NA | NA |
Community | 6,455 (1) | 6,455 (1) | 1.00 | |
Northwest Territories | Academic | NA | NA | NA |
Community | 8,115 (1) | 8,115 (1) | 1.00 | |
Nunavut | Academic | NA | NA | NA |
Community | 4,336 (1) | 4,336 (1) | 1.00 | |
Canada | Academic | 29,024 (37) | 13,593 (79) | 2.14 |
Community | 13,024 (141) | 10,802 (170) | 1.21 |
NA = not applicable.
Note: This table has not been copy-edited.
Table 4: Summary of Average Annual MRI Examinations and Annual Examinations Performed Per Unit Across Jurisdictions in 2022–2023
Jurisdiction | Total number of sites with MRI | Number of sites with sufficient data to calculate average annual MRI examinations | Average annual MRI examinations | Total number of MRI units | Number of units with sufficient data to calculate average annual MRI examinations per unit | Average MRI annual examinations per unit | Average MRI units per site |
|---|---|---|---|---|---|---|---|
Newfoundland and Labrador | 5 | 2 | 3,132 | 5 | 2 | 3,132 | 1.00 |
Prince Edward Island | 1 | 1 | 5,823 | 1 | 1 | 5,823 | 1.00 |
Nova Scotia | 10 | 8 | 4,529 | 11 | 9 | 3,932 | 1.13 |
New Brunswick | 9 | 7 | 5,686 | 11 | 8 | 4,881 | 1.14 |
Quebec | 60 | 10 | 10,588 | 91 | 20 | 4,945 | 2.00 |
Ontario | 83 | 31 | 10,709 | 151 | 50 | 7,189 | 1.61 |
Manitoba | 8 | 4 | 10,680 | 14 | 6 | 6,798 | 1.50 |
Saskatchewan | 6 | 5 | 7,569 | 8 | 7 | 5,871 | 1.40 |
Alberta | 23 | 22 | 10,081 | 36 | 35 | 6,496 | 1.59 |
British Columbia | 33 | 24 | 8,638 | 44 | 32 | 6,277 | 1.33 |
Yukon | 1 | 1 | 3,198 | 1 | 1 | 3,198 | 1.00 |
Northwest Territories | NA | NA | NA | NA | NA | NA | NA |
Nunavut | NA | NA | NA | NA | NA | NA | NA |
Canada | 239 | 115 | 9,033 | 373 | 171 | 58,542 | 1.49 |
NA = not applicable.
Note: This table has not been copy-edited.
Table 5: Summary of Average Annual MRI Examinations and Annual Examinations Performed Per Unit in Urban, Rural, and Remote Settings Across Jurisdictions in 2022–2023
Jurisdiction | Setting | Average annual MRI examinations (number of sites with MRI) | Average annual examinations per unit (number of MRI units) | Average urban, rural, and remote MRI units per site |
|---|---|---|---|---|
Newfoundland and Labrador | Urban | 3,432 (1) | 3,432 (1) | 1.00 |
Rural | 2,831 (1) | 2,831 (1) | 1.00 | |
Remote | NA | NA | NA | |
Prince Edward Island | Urban | 5,823 (1) | 5,823 (1) | 1.00 |
Rural | NA | NA | NA | |
Remote | NA | NA | NA | |
Nova Scotia | Urban | 5,982 (4) | 4,786 (5) | 1.25 |
Rural | 3,077 (4) | 3,077 (4) | 1.00 | |
Remote | NA | NA | NA | |
New Brunswick | Urban | 6,903 (5) | 5,776 (6) | 1.20 |
Rural | 2,643 (2) | 2,643 (2) | 1.00 | |
Remote | NA | NA | NA | |
Quebec | Urban | 10,588 (10) | 4,945 (20) | 2.00 |
Rural | NA | NA | NA | |
Remote | NA | NA | NA | |
Ontario | Urban | 11,096 (27) | 7,055 (46) | 1.52 |
Rural | 8,098 (4) | 8,098 (4) | 1.00 | |
Remote | NA | NA | NA | |
Manitoba | Urban | 13,305 (3) | 8,129 (5) | 1.67 |
Rural | 2,803 (1) | 2,803 (1) | 1.00 | |
Remote | NA | NA | NA | |
Saskatchewan | Urban | 7,569 (5) | 5,871 (7) | 1.40 |
Rural | NA | NA | NA | |
Remote | NA | NA | NA | |
Alberta | Urban | 13,411 (14) | 7,778 (27) | 1.93 |
Rural | 4,253 (8) | 4,253 (8) | 1.00 | |
Remote | NA | NA | NA | |
British Columbia | Urban | 10,287 (17) | 6,953 (25) | 1.47 |
Rural | 4,635 (7) | 4,635 (7) | 1.00 | |
Remote | NA | NA | NA | |
Yukon | Urban | NA | NA | NA |
Rural | NA | NA | NA | |
Remote | 3,198 (1) | 3,198 (1) | 1.00 | |
Northwest Territories | Urban | NA | NA | NA |
Rural | NA | NA | NA | |
Remote | NA | NA | NA | |
Nunavut | Urban | NA | NA | NA |
Rural | NA | NA | NA | |
Remote | NA | NA | NA | |
Canada | Urban | 10,501 (87) | 6,389 (143) | 1.64 |
Rural | 4,522 (27) | 4,522 (27) | 1.00 | |
Remote | 3,198 (1) | 3,198 (1) | 1.00 |
NA = not applicable.
Note: This table has not been copy-edited.
Table 6: Summary of Average Annual MRI Examinations and Annual Examinations Performed Per Unit in Academic and Community Settings Across Jurisdictions in 2022–2023
Jurisdiction | Academic status | Average MRI annual examinations (number of sites with MRI) | Average MRI examinations per unit (number of MRI units) | Average academic and community MRI units per site |
|---|---|---|---|---|
Newfoundland and Labrador | Academic | NA | NA | NA |
Community | 3,132 (2) | 3,132 (2) | 1.00 | |
Prince Edward Island | Academic | NA | NA | NA |
Community | 5,823 (1) | 5,823 (1) | 1.00 | |
Nova Scotia | Academic | 7,295 (2) | 4,904 (3) | 1.50 |
Community | 3,608 (6) | 3,608 (6) | 1.00 | |
New Brunswick | Academic | 11,268 (1) | 5,634 (2) | 2.00 |
Community | 4,755 (6) | 4,755 (6) | 1.00 | |
Quebec | Academic | 16,394 (5) | 6,295 (14) | 2.80 |
Community | 4,781 (5) | 3,595 (6) | 1.20 | |
Ontario | Academic | 9,083 (8) | 4,677 (15) | 1.88 |
Community | 11,275 (23) | 8,063 (35) | 1.52 | |
Manitoba | Academic | 23,290 (1) | 7,763 (3) | 3.00 |
Community | 6,476 (3) | 6,476 (3) | 1.00 | |
Saskatchewan | Academic | 8,294 (3) | 5,464 (5) | 1.67 |
Community | 6,482 (2) | 6,482 (2) | 1.00 | |
Alberta | Academic | 15,064 (9) | 8,655 (19) | 2.11 |
Community | 6,631 (13) | 5,002 (16) | 1.23 | |
British Columbia | Academic | 12,308 (9) | 7,548 (15) | 1.67 |
Community | 6,437 (15) | 5,515 (17) | 1.13 | |
Yukon | Academic | NA | NA | NA |
Community | 3,198 (1) | 3,198 (1) | 1.00 | |
Northwest Territories | Academic | NA | NA | NA |
Community | NA | NA | NA | |
Nunavut | Academic | NA | NA | NA |
Community | NA | NA | NA | |
Canada | Academic | 12,500 (38) | 6,250 (76) | 2.00 |
Community | 7,323 (77) | 5,935 (95) | 1.23 |
NA = not applicable.
Note: This table has not been copy-edited.
ISSN: 2563-6596
Canada’s Drug Agency (CDA-AMC) is a pan-Canadian health organization. Created and funded by Canada’s federal, provincial, and territorial governments, we’re responsible for driving better coordination, alignment, and public value within Canada’s drug and health technology landscape. We provide Canada’s health system leaders with independent evidence and advice so they can make informed drug, health technology, and health system decisions, and we collaborate with national and international partners to enhance our collective impact.
Disclaimer: CDA-AMC has taken care to ensure that the information in this document was accurate, complete, and up to date when it was published, but does not make any guarantee to that effect. Your use of this information is subject to this disclaimer and the Terms of Use at cda-amc.ca.
The information in this document is made available for informational and educational purposes only and should not be used as a substitute for professional medical advice, the application of clinical judgment in respect of the care of a particular patient, or other professional judgments in any decision-making process. You assume full responsibility for the use of the information and rely on it at your own risk.
CDA-AMC does not endorse any information, drugs, therapies, treatments, products, processes, or services. The views and opinions of third parties published in this document do not necessarily reflect those of CDA-AMC. The copyright and other intellectual property rights in this document are owned by the Canadian Agency for Drugs and Technologies in Health (operating as CDA-AMC) and its licensors.
Questions or requests for information about this report can be directed to Requests@CDA-AMC.ca.