Drugs, Health Technologies, Health Systems
Health Technology Review
MRI Usage Patterns by Clinical Specialty Across Canada: Geographic and Temporal Trends
Key Messages
What Is the Issue?
Canada’s Drug Agency received a request related to the use of MRI by clinical specialty at medical imaging sites across Canada and how they compare between urban and rural settings.
There are limited data on MRI use by clinical specialty across Canada, particularly when comparing urban and rural settings1,2 This presents a challenge for health system leaders seeking to make evidence-informed decisions around MRI resource allocation, infrastructure investment, workforce planning, and service delivery.
These insights can guide funding, staffing, and equipment allocation decisions. They can also support targeted training programs and promote equitable and effective planning across jurisdictions.
What Did We Do?
In response, Canada’s Drug Agency leveraged data from the 2022–2023 Canadian Medical Imaging Inventory (CMII) National Survey3 to conduct an analysis on the uses of MRI by broad clinical specialty.
Data were drawn from 56 medical imaging facilities with MRI capacity across 9 provinces.
Comparisons were made across provinces, over time, and between rural and urban imaging sites to examine trends in use.
Data from previous iterations of the CMII national survey (20174 and 2019–20205) were included for historical comparisons.
What Did We Find?
Our analysis revealed the following key findings:
Neurologic exams accounted for the highest proportion of MRI use nationally, followed by musculoskeletal exams and oncologic exams.
Differences were seen in MRI usage patterns by clinical specialty, both between provinces and between sites located in urban and rural settings.
Little change was noted in MRI usage rates over 3 iterations of the CMII survey. However, a 6% increase was observed for inflammatory and infectious disease exams in the 2022–20233 survey compared to the 20174 and 2019–20205 surveys.
It is important to note that the sample’s size and distribution may limit the generalizability of these findings across all regions and practice settings in Canada.
What Does This Mean?
These findings highlight key differences in MRI use across jurisdictions and urban versus rural imaging centres. Establishing baseline use proportions can help identify trends in MRI use and support resource planning.
Understanding how MRI is being used can influence wait time strategies, can help improve resource utilization efficiency and support cost-effective health care technology deployment, and may help improve patient outcomes.
Establishing baseline MRI usage rates may also inform the optimal allocation of resources such as funding, staffing, equipment, and training programs.
Comparisons between urban and rural areas highlight the differences in regional imaging demands and clinical practices.
Tracking usage over time can reveal emerging clinical needs and shifts in demand, enabling more proactive and responsive health care planning.
Context
MRI plays a vital role in modern diagnostics, offering high-resolution, radiation-free imaging that is particularly useful for conditions involving the brain, the spine, the musculoskeletal system, and cancer.6 It is often preferred for patients requiring frequent imaging, such as those with chronic conditions that require monitoring, and for minimizing radiation exposure in children and pregnant individuals.6,7
Between 2012 and 2023, MRI exam volumes in Canada increased by 28.8%, with per capita use rising by 12.8%.3 This growth reflects expanding clinical need, population aging, and a broader push toward safer imaging practices.7 However, increased use brings system-level challenges relating to costs, wait times, and demand for trained specialists.2 Studies also suggest that a portion of MRI exams may yield limited clinical value, contributing to unnecessary spending.1,2
This report addresses a gap in national data by analyzing MRI use by clinical specialty and geographic setting, particularly the differences between urban and rural areas. The aim of these insights is to support policy development, guide equitable resource allocation, and strengthen long-term planning for sustainable imaging services across Canada.
Objectives
The purpose of this report is to provide information on the types of MRI use at medical imaging sites across Canada for the following 9 broad clinical specialties: neurologic, musculoskeletal, oncologic, hepatobiliary or gastrointestinal, inflammatory or infectious diseases, cardiac, respiratory, trauma, and other exams.
The objectives include the following:
to assess the distribution of MRI exams by clinical specialty at a national level, with comparisons across the 9 provinces for which data are available
to examine differences in MRI use by clinical specialty between urban and rural medical imaging sites across the country
to include data from previous iterations of the CMII to measure national changes in MRI use distribution over time.
About This Document
This document summarizes information gathered through the Canadian Medical Imaging Inventory (CMII), a national survey from 2022–2023 that collects data on advanced medical imaging equipment.
Data used in this report were drawn from responses to the clinical indication section of the CMII national survey (refer to CMII Survey Questions).
Urban or rural status of participating sites was determined based on site-level responses to the question “In which of the following settings are you located? Urban, Rural, Remote.”
For comparative analysis, data from the 20174 and 2019–20205 iterations of the CMII national surveys were also included to examine changes in MRI usage rates by clinical specialty over time.
Inclusion Criteria
Overall, 225 public medical imaging facilities reported having MRI capacity and responded to some portion of the 2022–20233 CMII survey. Of these 225 sites, all sites that responded to the clinical indication section of the CMII national survey were included in the analysis for this report (56 sites total). Table 11, Appendix 2, provides the total number of respondents for each province and the number of sites that are urban, rural, or remote, as indicated by the respondents.
Exclusion Criteria
No sites that responded to the clinical specialty question of the survey were excluded. One site reported that they operate in a remote setting, and that site was not included in the urban versus rural comparisons. Data on MRI use by clinical specialty were not available for sites in the territories.
Results
Overall, 56 sites with MRI capacity across 9 provinces responded to the clinical specialty portion of the CMII survey. Of these, 46 were located in urban areas, 9 in rural settings, and 1 in a remote community. This represents a 24.6% response rate among the 225 public MRI sites surveyed. The data provides insights into how MRI resources are allocated and used across jurisdictions and facility types.
Data are first summarized nationally, then presented at the provincial and regional (urban and rural) levels. Finally, we examine variations in MRI use distribution over time (2017 to 2023). This data highlights shared trends and regional variation in MRI utilization across the following clinical specialties:
respiratory
trauma
cardiac
musculoskeletal
neurologic
oncologic
hepatobiliary or gastrointestinal
inflammatory or infectious disease
exams of any clinical specialty not listed (defined as “other”).
Pagebreak
National Summary
The top 3 MRI uses by clinical specialty in Canada are neurologic imaging at 29%, musculoskeletal imaging at 26%, and oncologic imaging at 17% (refer to Figure 1). (Refer to Table 1, Appendix 2, for the ranges of reported MRI use by clinical specialty.)
Respiratory exams were the clinical specialty reported the least (or tied for lowest) in 5 out of 9 provinces, while neurologic exams accounted for the highest proportion of MRI use in 6 out of 9 provinces.
Figure 1: Average MRI Usage Rates by Clinical Specialty, All Sites
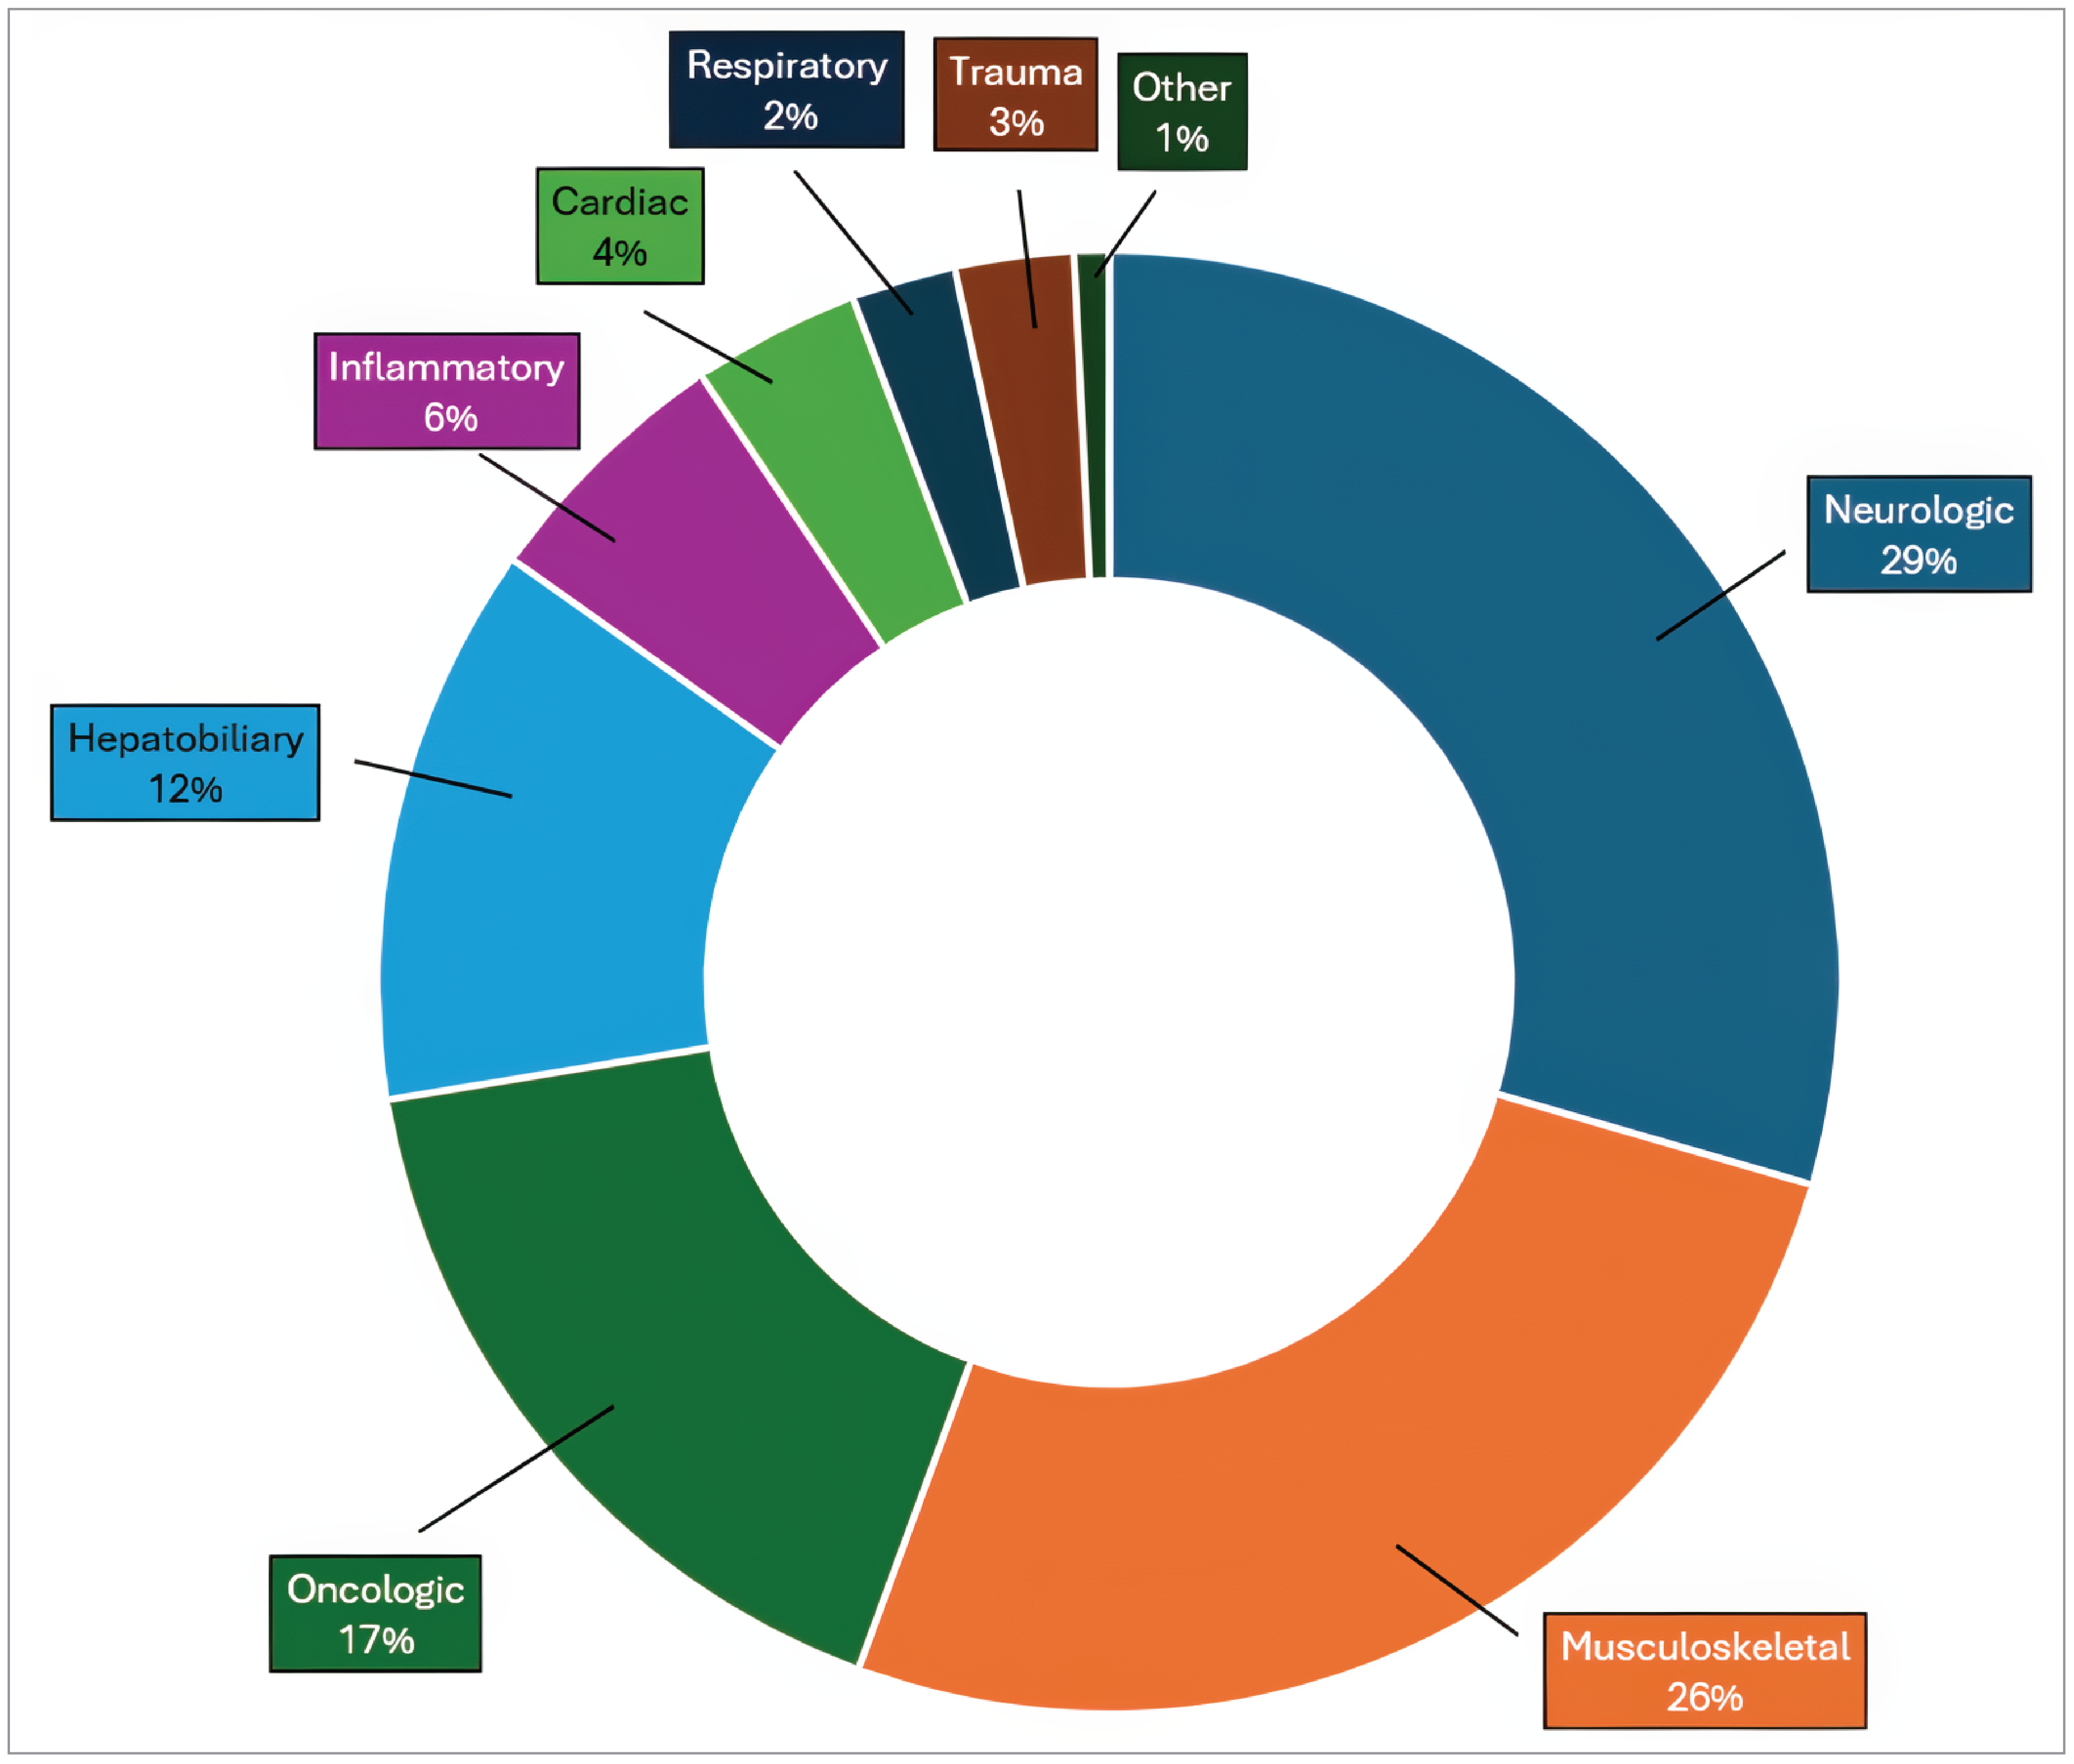
Notes: N = 56.
Data were derived from the following survey question: “On average, what percentage of these exams fall into the following categories? The total percentage, expressed as a number, must add up to 100.”
Provincial Summaries
The following section presents a comparative overview of MRI usage by clinical specialty across the provinces for which data are available. These summaries highlight trends and regional variation in how MRI resources are used, reflecting differences in clinical demand, referral patterns, and local health system priorities. The data help to illustrate the distribution of MRI use across key clinical areas and underscore the importance of context-specific planning and resource allocation.
Neurology was the specialty that accounted for the largest proportion of MRI exams, relative to all other specialties, in 6 out of 9 provinces.
Quebec and Manitoba were the only provinces to report musculoskeletal conditions as the specialty accounting for the most MRI exams (28% and 40%, respectively).
Newfoundland and Labrador was the only province for which oncologic exams were the dominant specialty (35%).
Exams of other clinical specialties were generally reported to be low, with the highest reported proportion of MRI use being 4% (Alberta).
Note: Average MRI usage rates for the top 3 clinical indications are presented in the summaries for each jurisdiction, and the percentage breakdown for all reported clinical specialties is available in the figures that directly follow each summary. The associated ranges of MRI usage rates for each specialty are listed by jurisdiction in Tables 1 to 10, Appendix 2.
Pagebreak
Newfoundland and Labrador
Oncologic exams account for the province's highest proportion of MRI use by clinical specialty at 35%. This distinction makes Newfoundland and Labrador the only province where oncology leads all clinical specialties in MRI utilization. This was followed by neurologic imaging at 20%, and musculoskeletal imaging at 12% (refer to Figure 2). (The ranges of MRI use reported for each clinical specialty are shown in Table 2, Appendix 2.)
Newfoundland and Labrador reported the highest trauma-related MRI use among the reporting provinces, at 8%, while musculoskeletal imaging represented the lowest proportion among reporting provinces, at 12%.
Responses were received from 2 sites — 1 located in an urban setting and 1 in a rural setting — and may not be representative of practices across the entire province.
Figure 2: Average MRI Usage Rates by Clinical Specialty, Newfoundland and Labrador
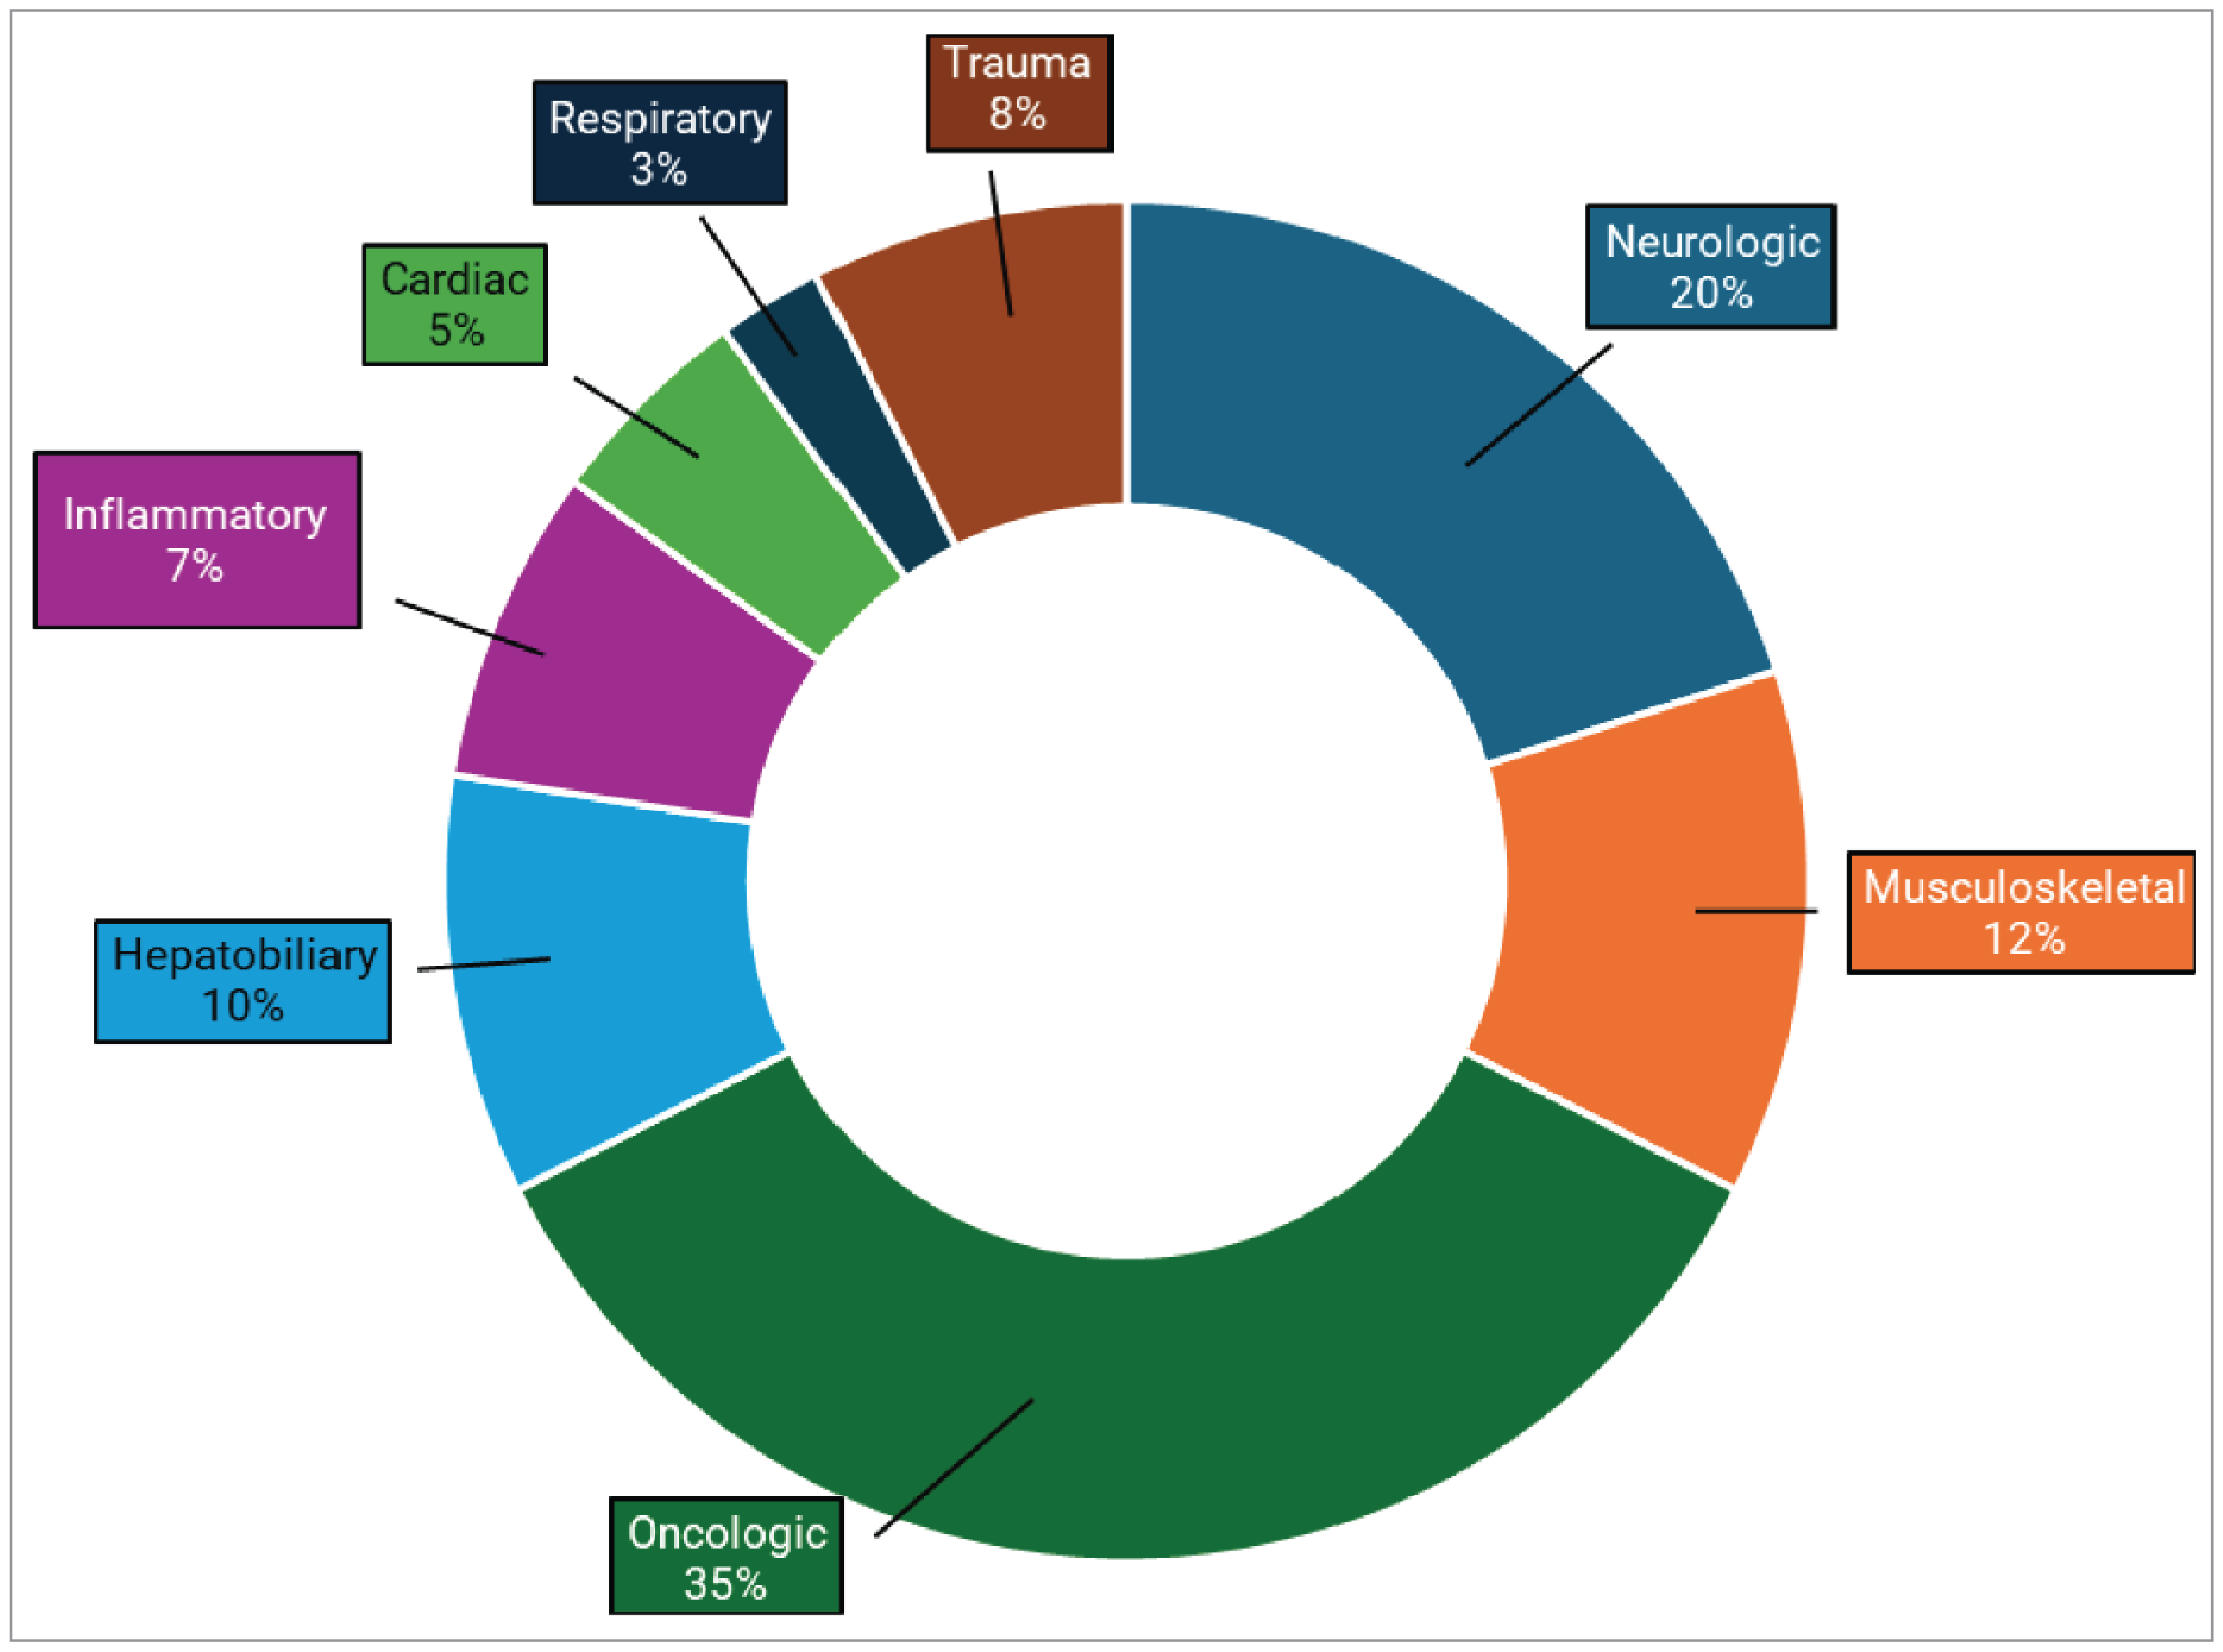
Notes: N = 2.
Data were derived from the following survey question: “On average, what percentage of these exams fall into the following categories? The total percentage, expressed as a number, must add up to 100.”
Nova Scotia
Neurologic exams account for the highest proportion of MRI use by clinical specialty for the province at 27%, followed by musculoskeletal and oncologic imaging, both at 20%, (refer to Figure 3). (The ranges of MRI use reported for each clinical specialty are shown in Table 3, Appendix 2.)
Nova Scotia reported the lowest proportion of MRI use for trauma-related exams (1%) among reporting provinces.
Responses were received from 3 sites — 2 located in an urban setting and 1 in a rural setting — and may not be representative of practices across the entire province.
Figure 3: Average MRI Usage Rates by Clinical Specialty, Nova Scotia
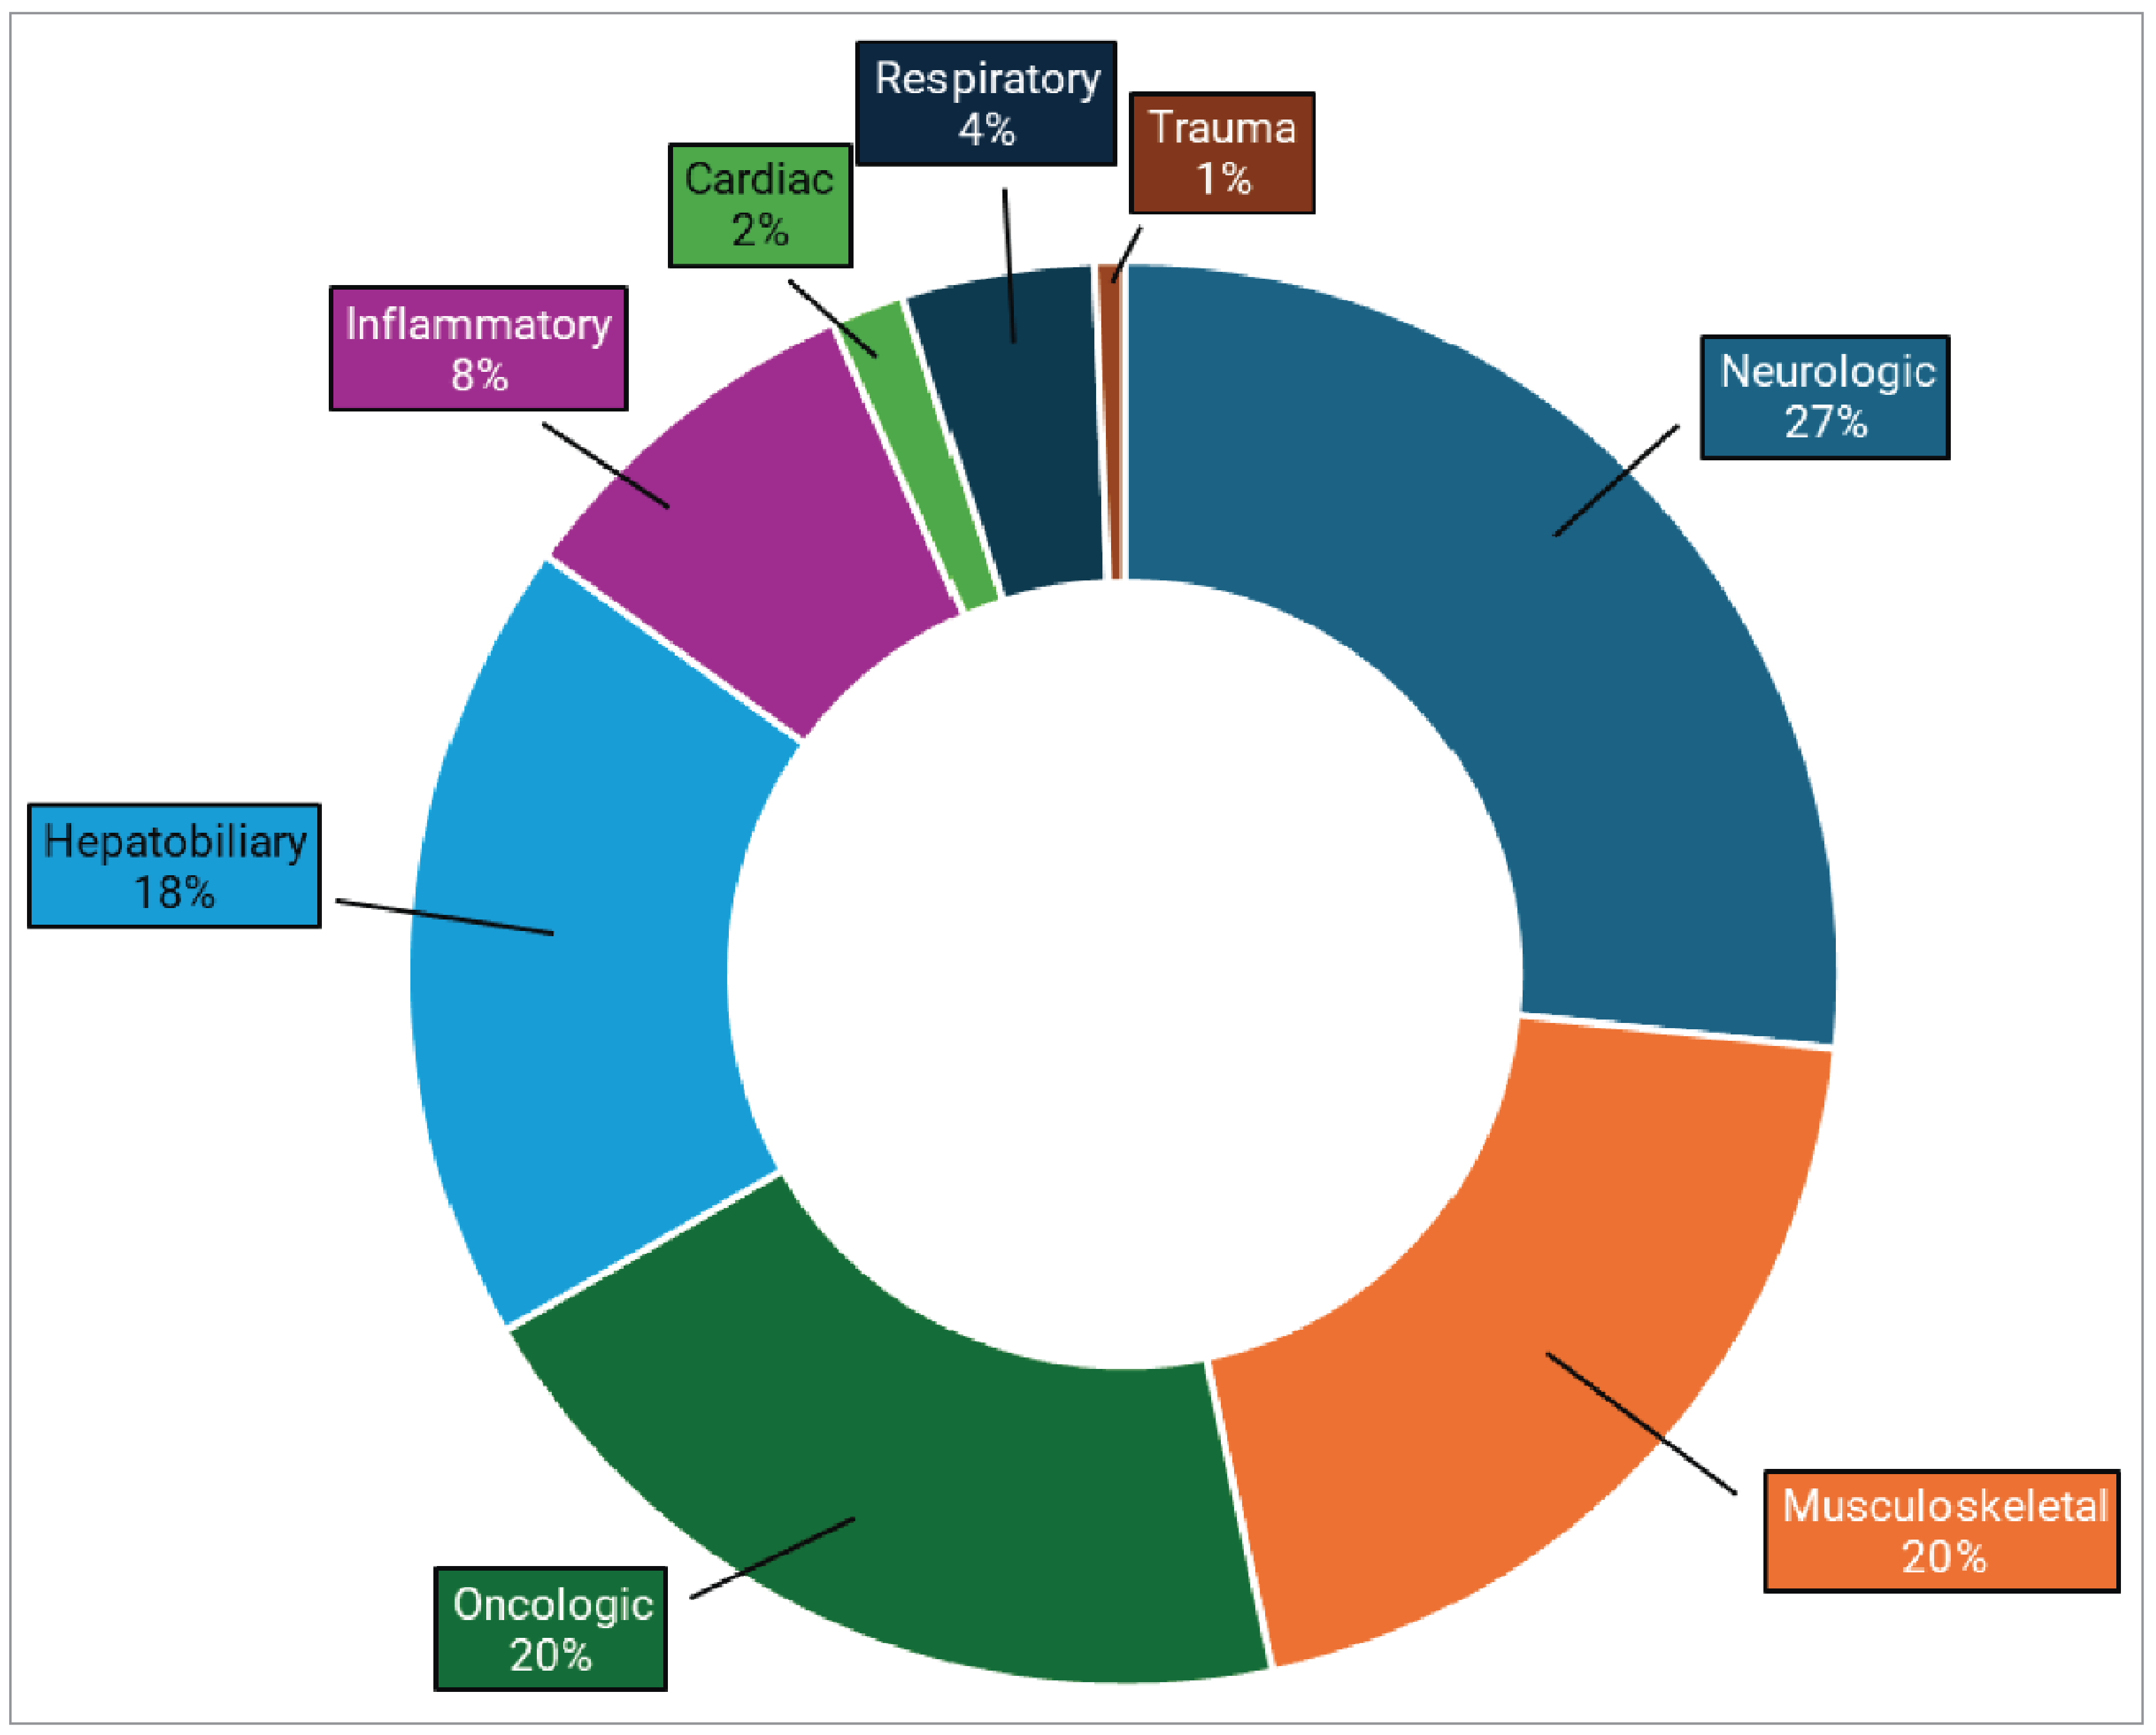
Notes: N = 3.
Data were derived from the following survey question: “On average, what percentage of these exams fall into the following categories? The total percentage, expressed as a number, must add up to 100.”
Pagebreak
New Brunswick
Neurologic exams account for the highest proportion of MRI use by clinical specialty for the province at 25%, followed by musculoskeletal imaging at 22%, and hepatobiliary imaging at 20% (refer to Figure 4). (The ranges of MRI use reported for each clinical specialty are shown in Table 4, Appendix 2.)
New Brunswick reported the highest hepatobiliary use for MRI in Canada at 20%.
Responses were received from 3 sites — 2 located in an urban setting and 1 in a rural setting — and may not be representative of practices across the entire province.
Figure 4: Average MRI Usage Rates by Clinical Specialty, New Brunswick
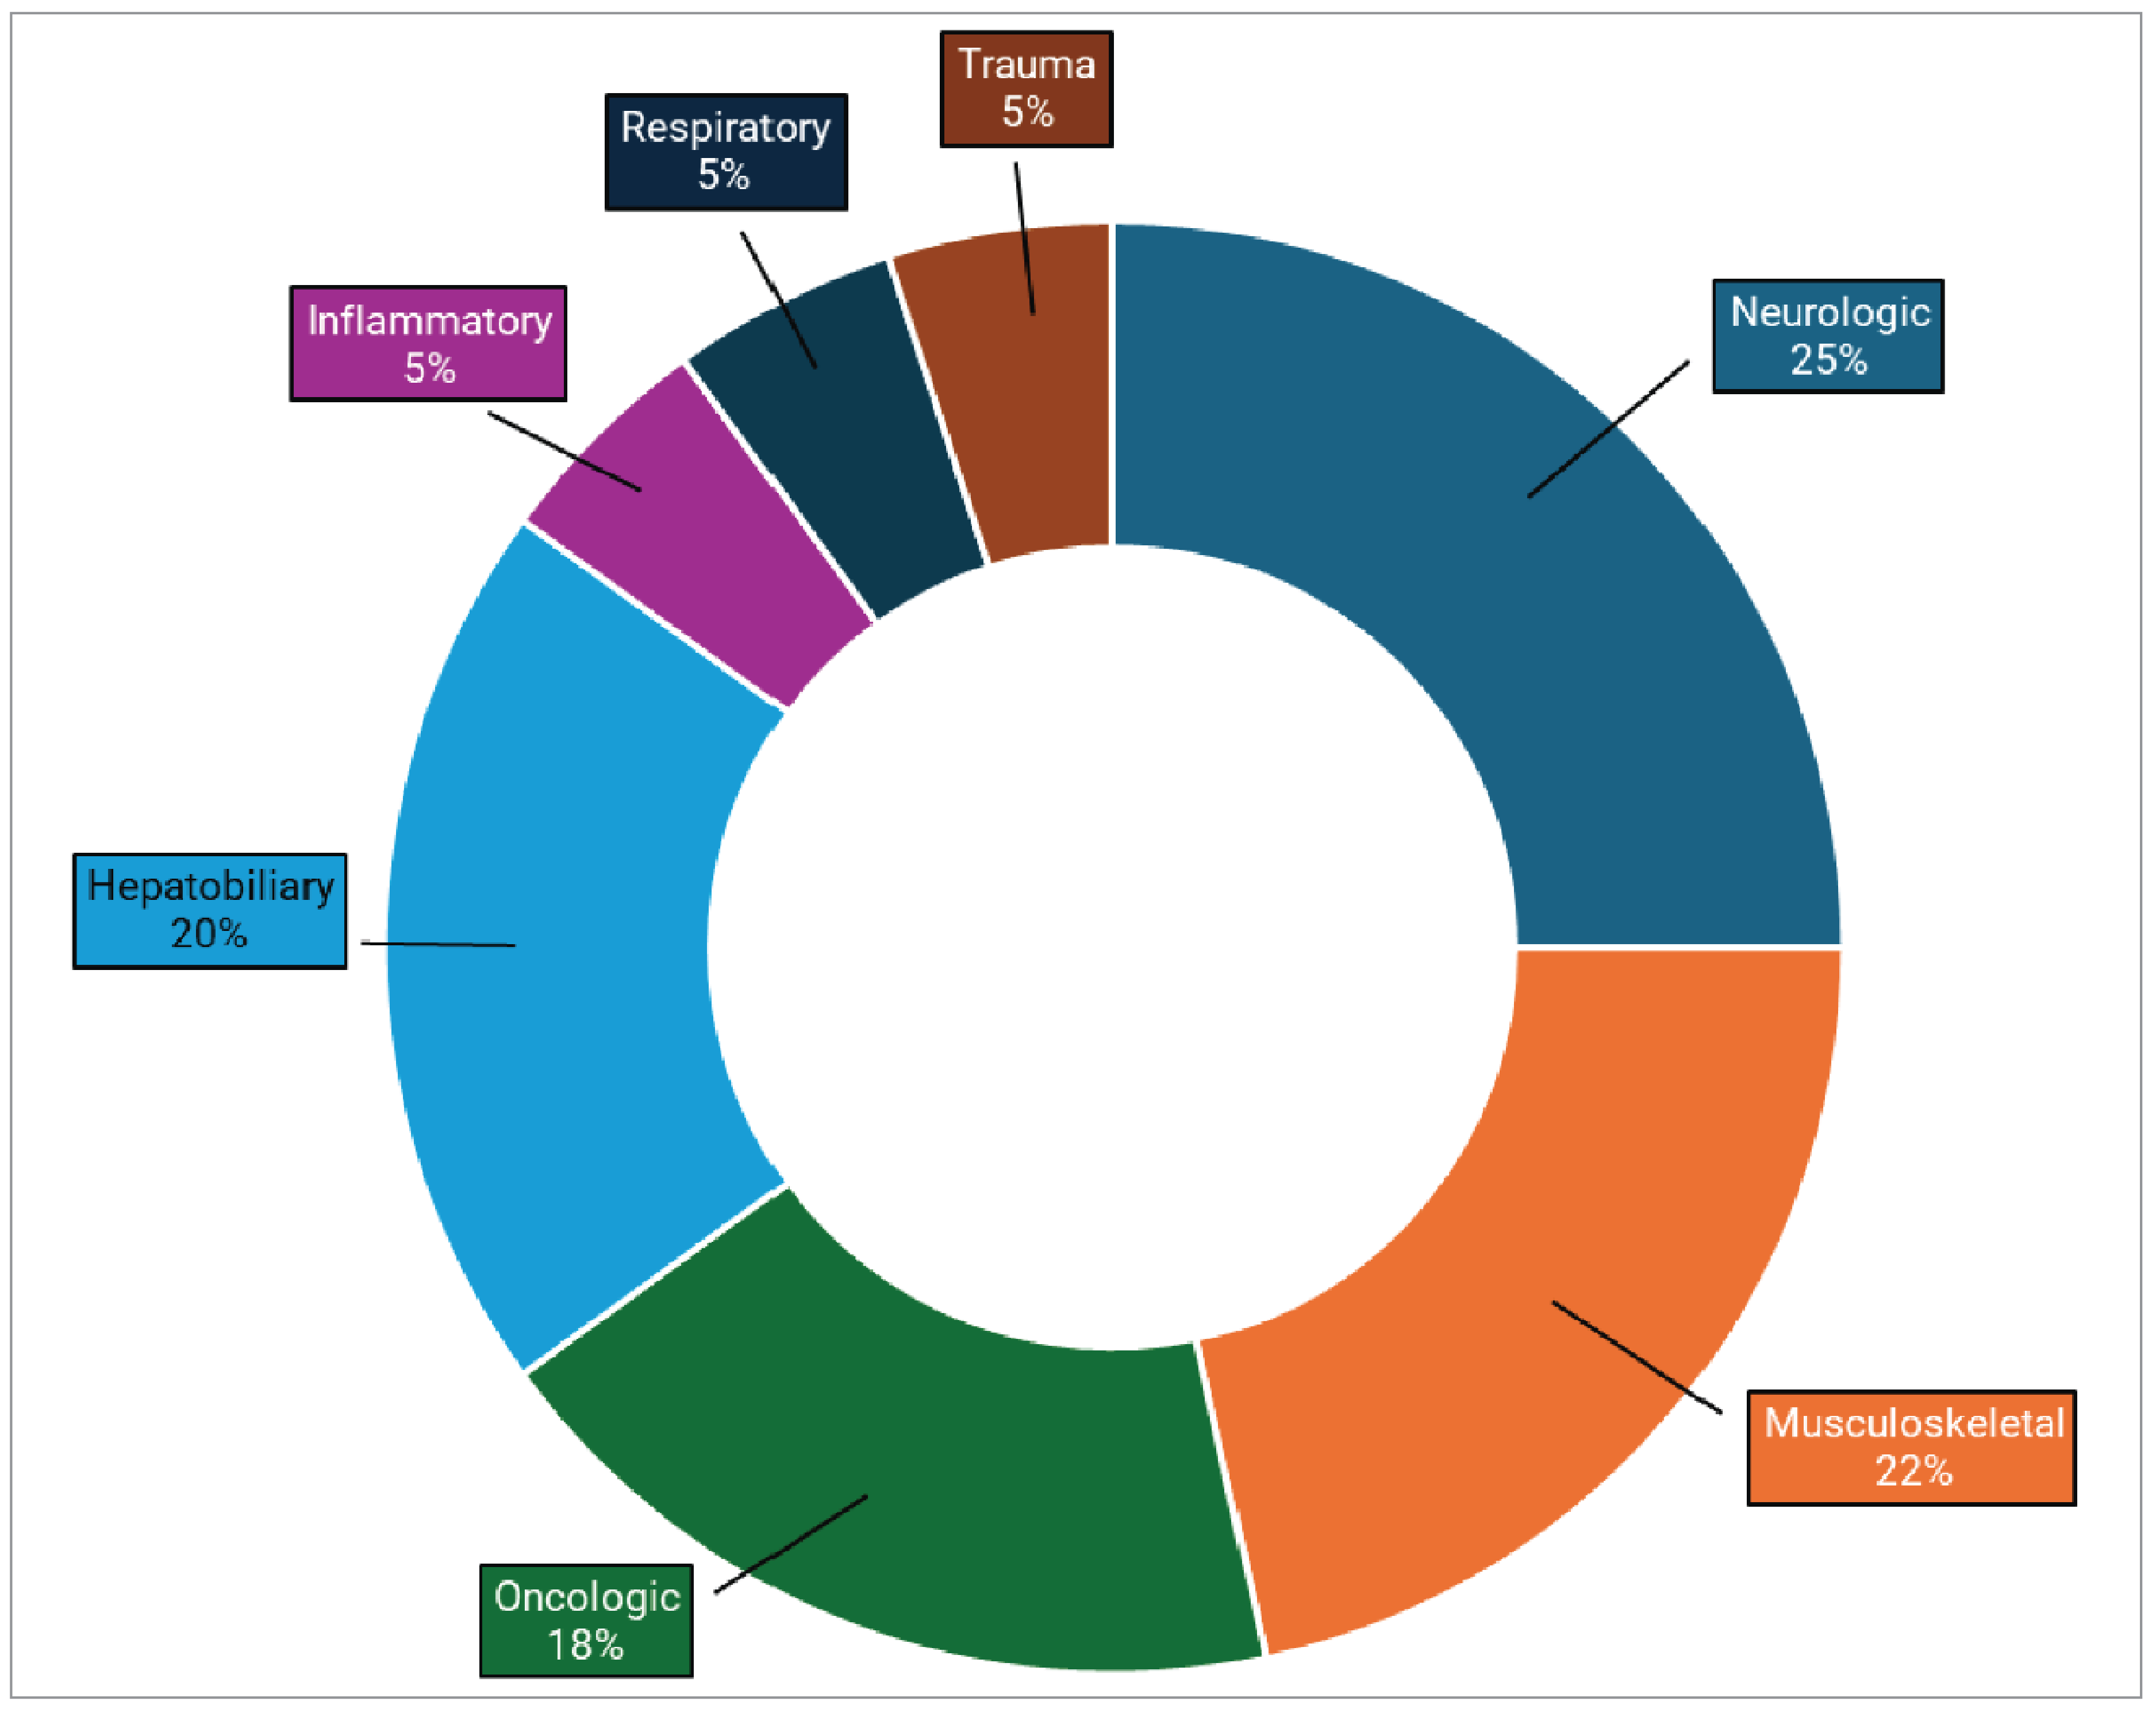
Notes: N = 3.
Data were derived from the following survey question: “On average, what percentage of these exams fall into the following categories? The total percentage, expressed as a number, must add up to 100.”
Pagebreak
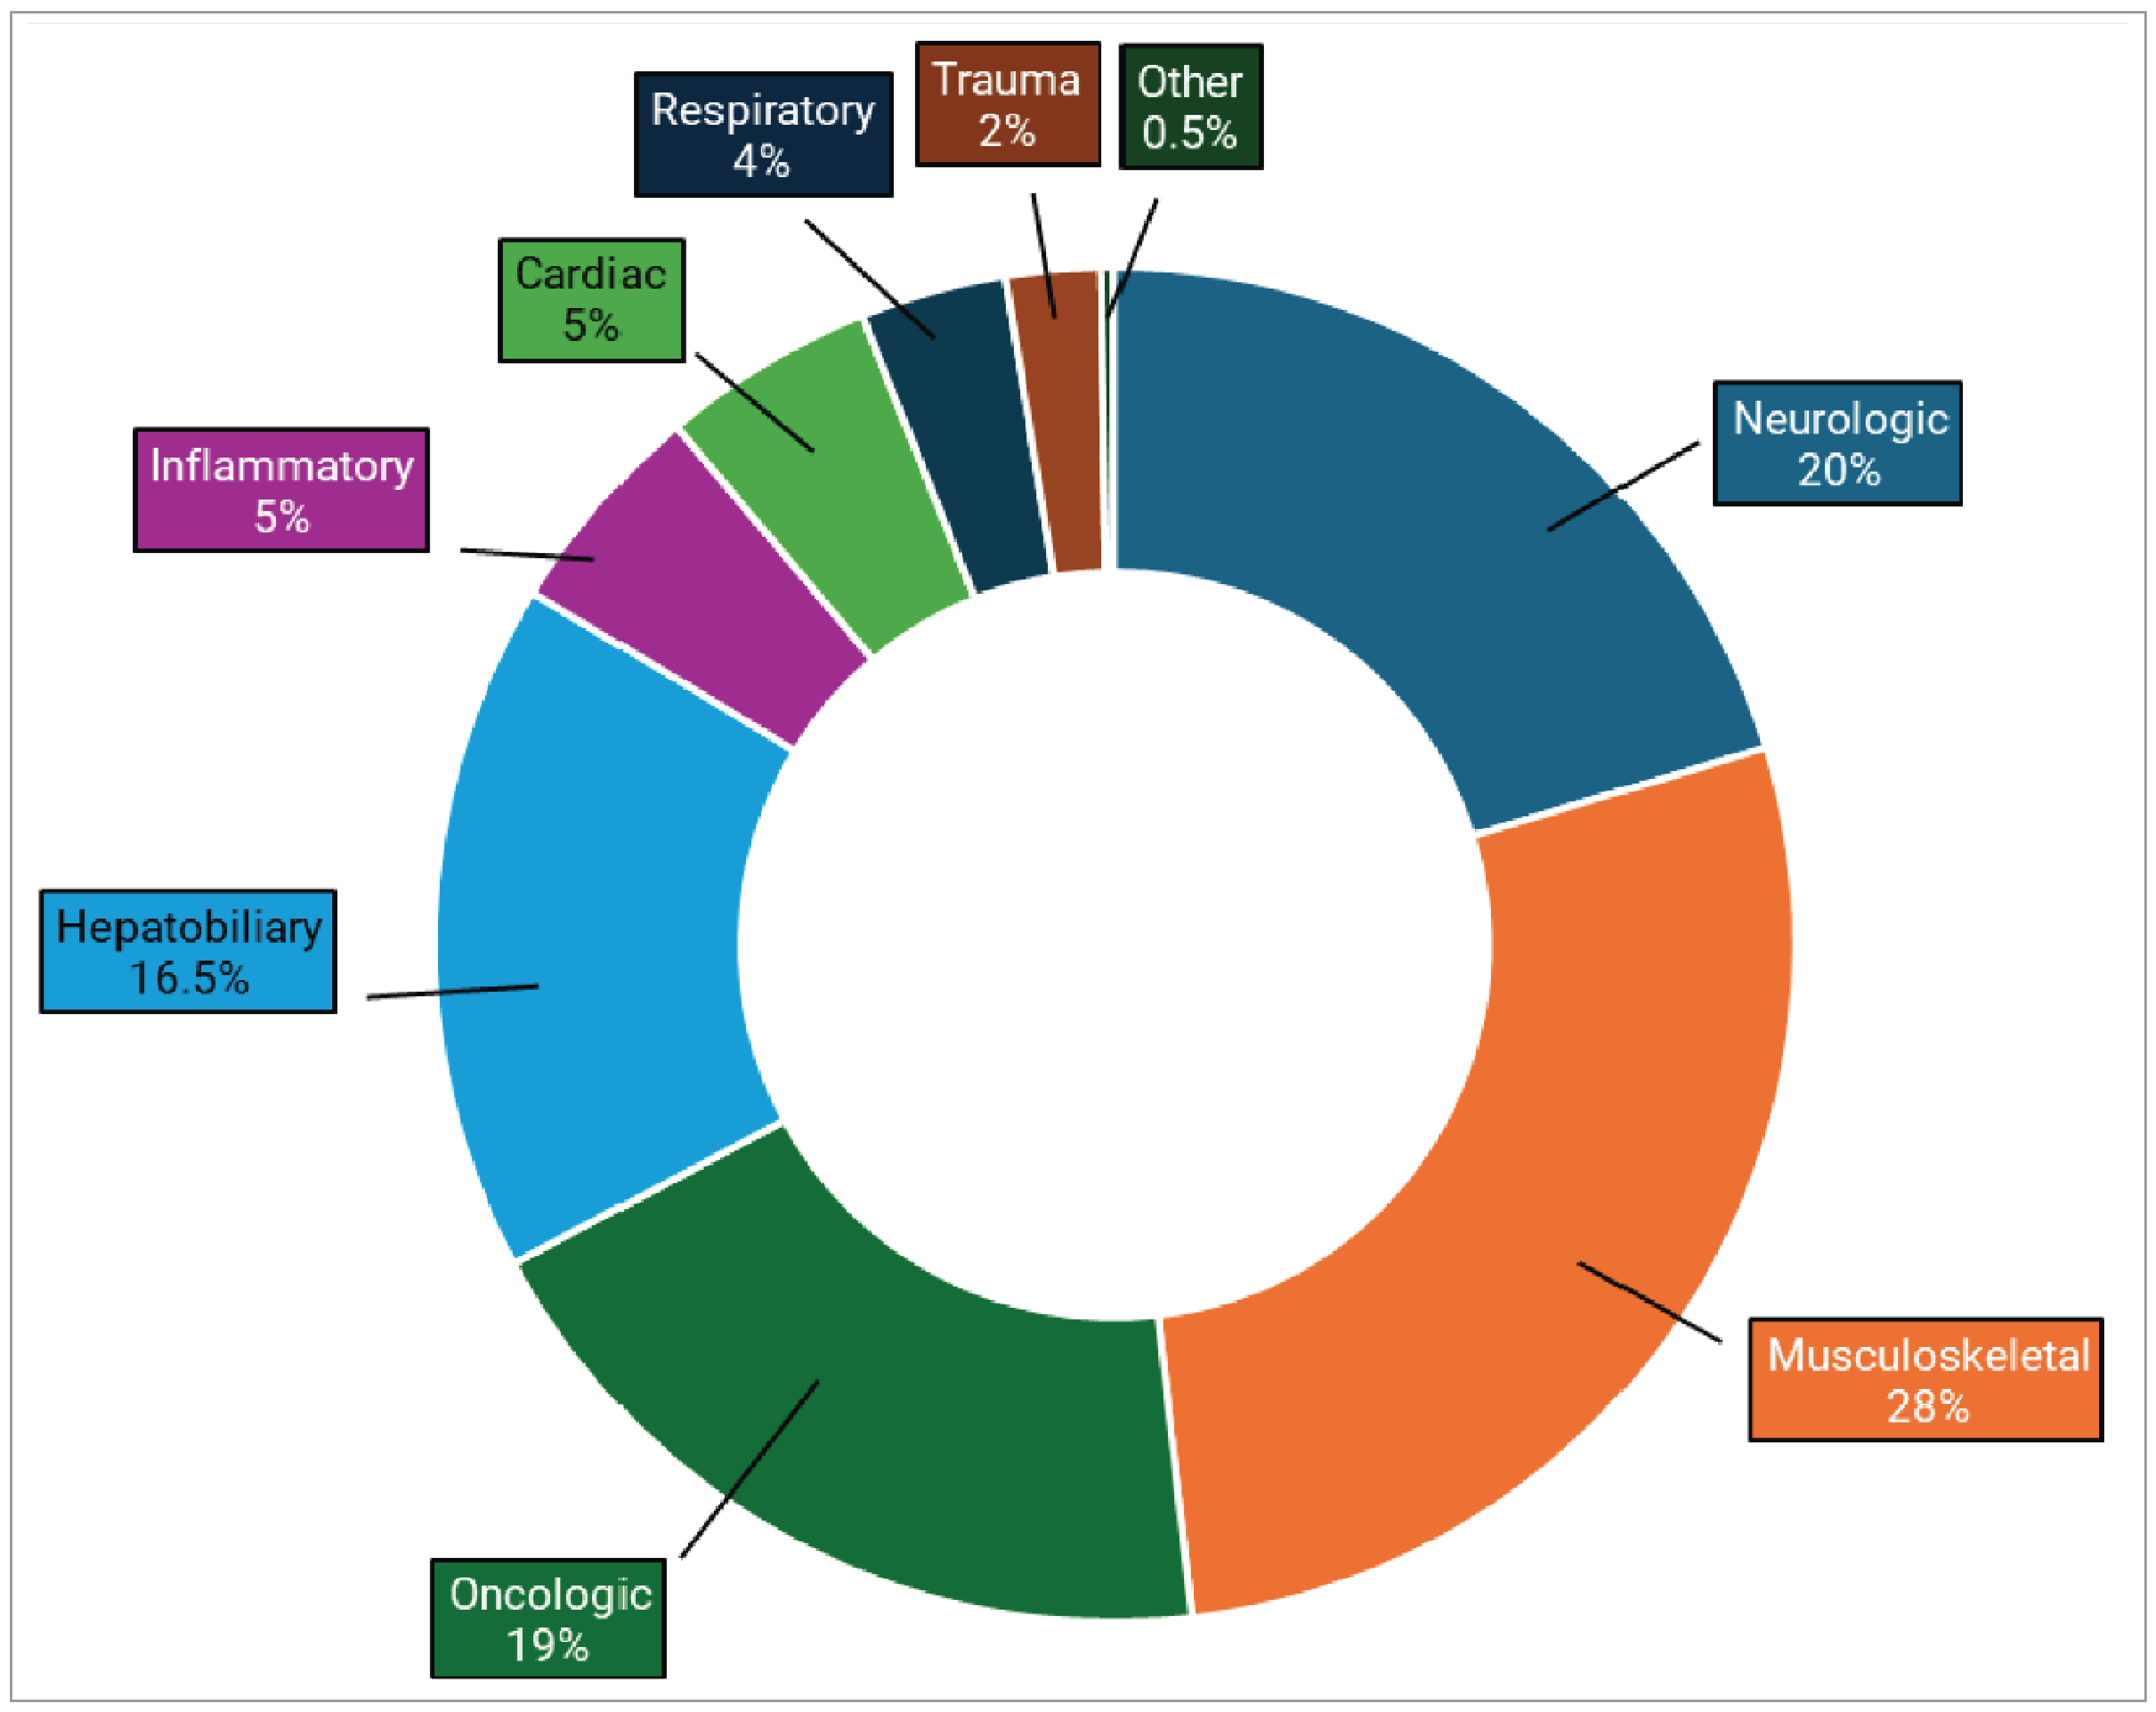
Quebec
Musculoskeletal exams account for the highest proportion of MRI use by clinical specialty for the province at 28% (1 of 2 provinces where this specialty ranked first), followed by neurologic imaging at 20%, and oncologic imaging at 19% (refer to Figure 5). (The ranges of MRI use reported for each clinical specialty are shown in Table 5, Appendix 2.)
Quebec reported the lowest proportion of neurology-related MRI use among reporting provinces, at 20%.
Responses were received from 10 sites — 8 located in an urban setting, 1 in a rural setting, and 1 in a remote setting — and may not be representative of practices across the entire province.
Quebec reported data on MRI use for all 9 clinical specialties.
Figure 5: Average MRI Usage Rates by Clinical Specialty, Quebec
Notes: N = 10.
Data were derived from the following survey question: “On average, what percentage of these exams fall into the following categories? The total percentage, expressed as a number, must add up to 100.”
Pagebreak
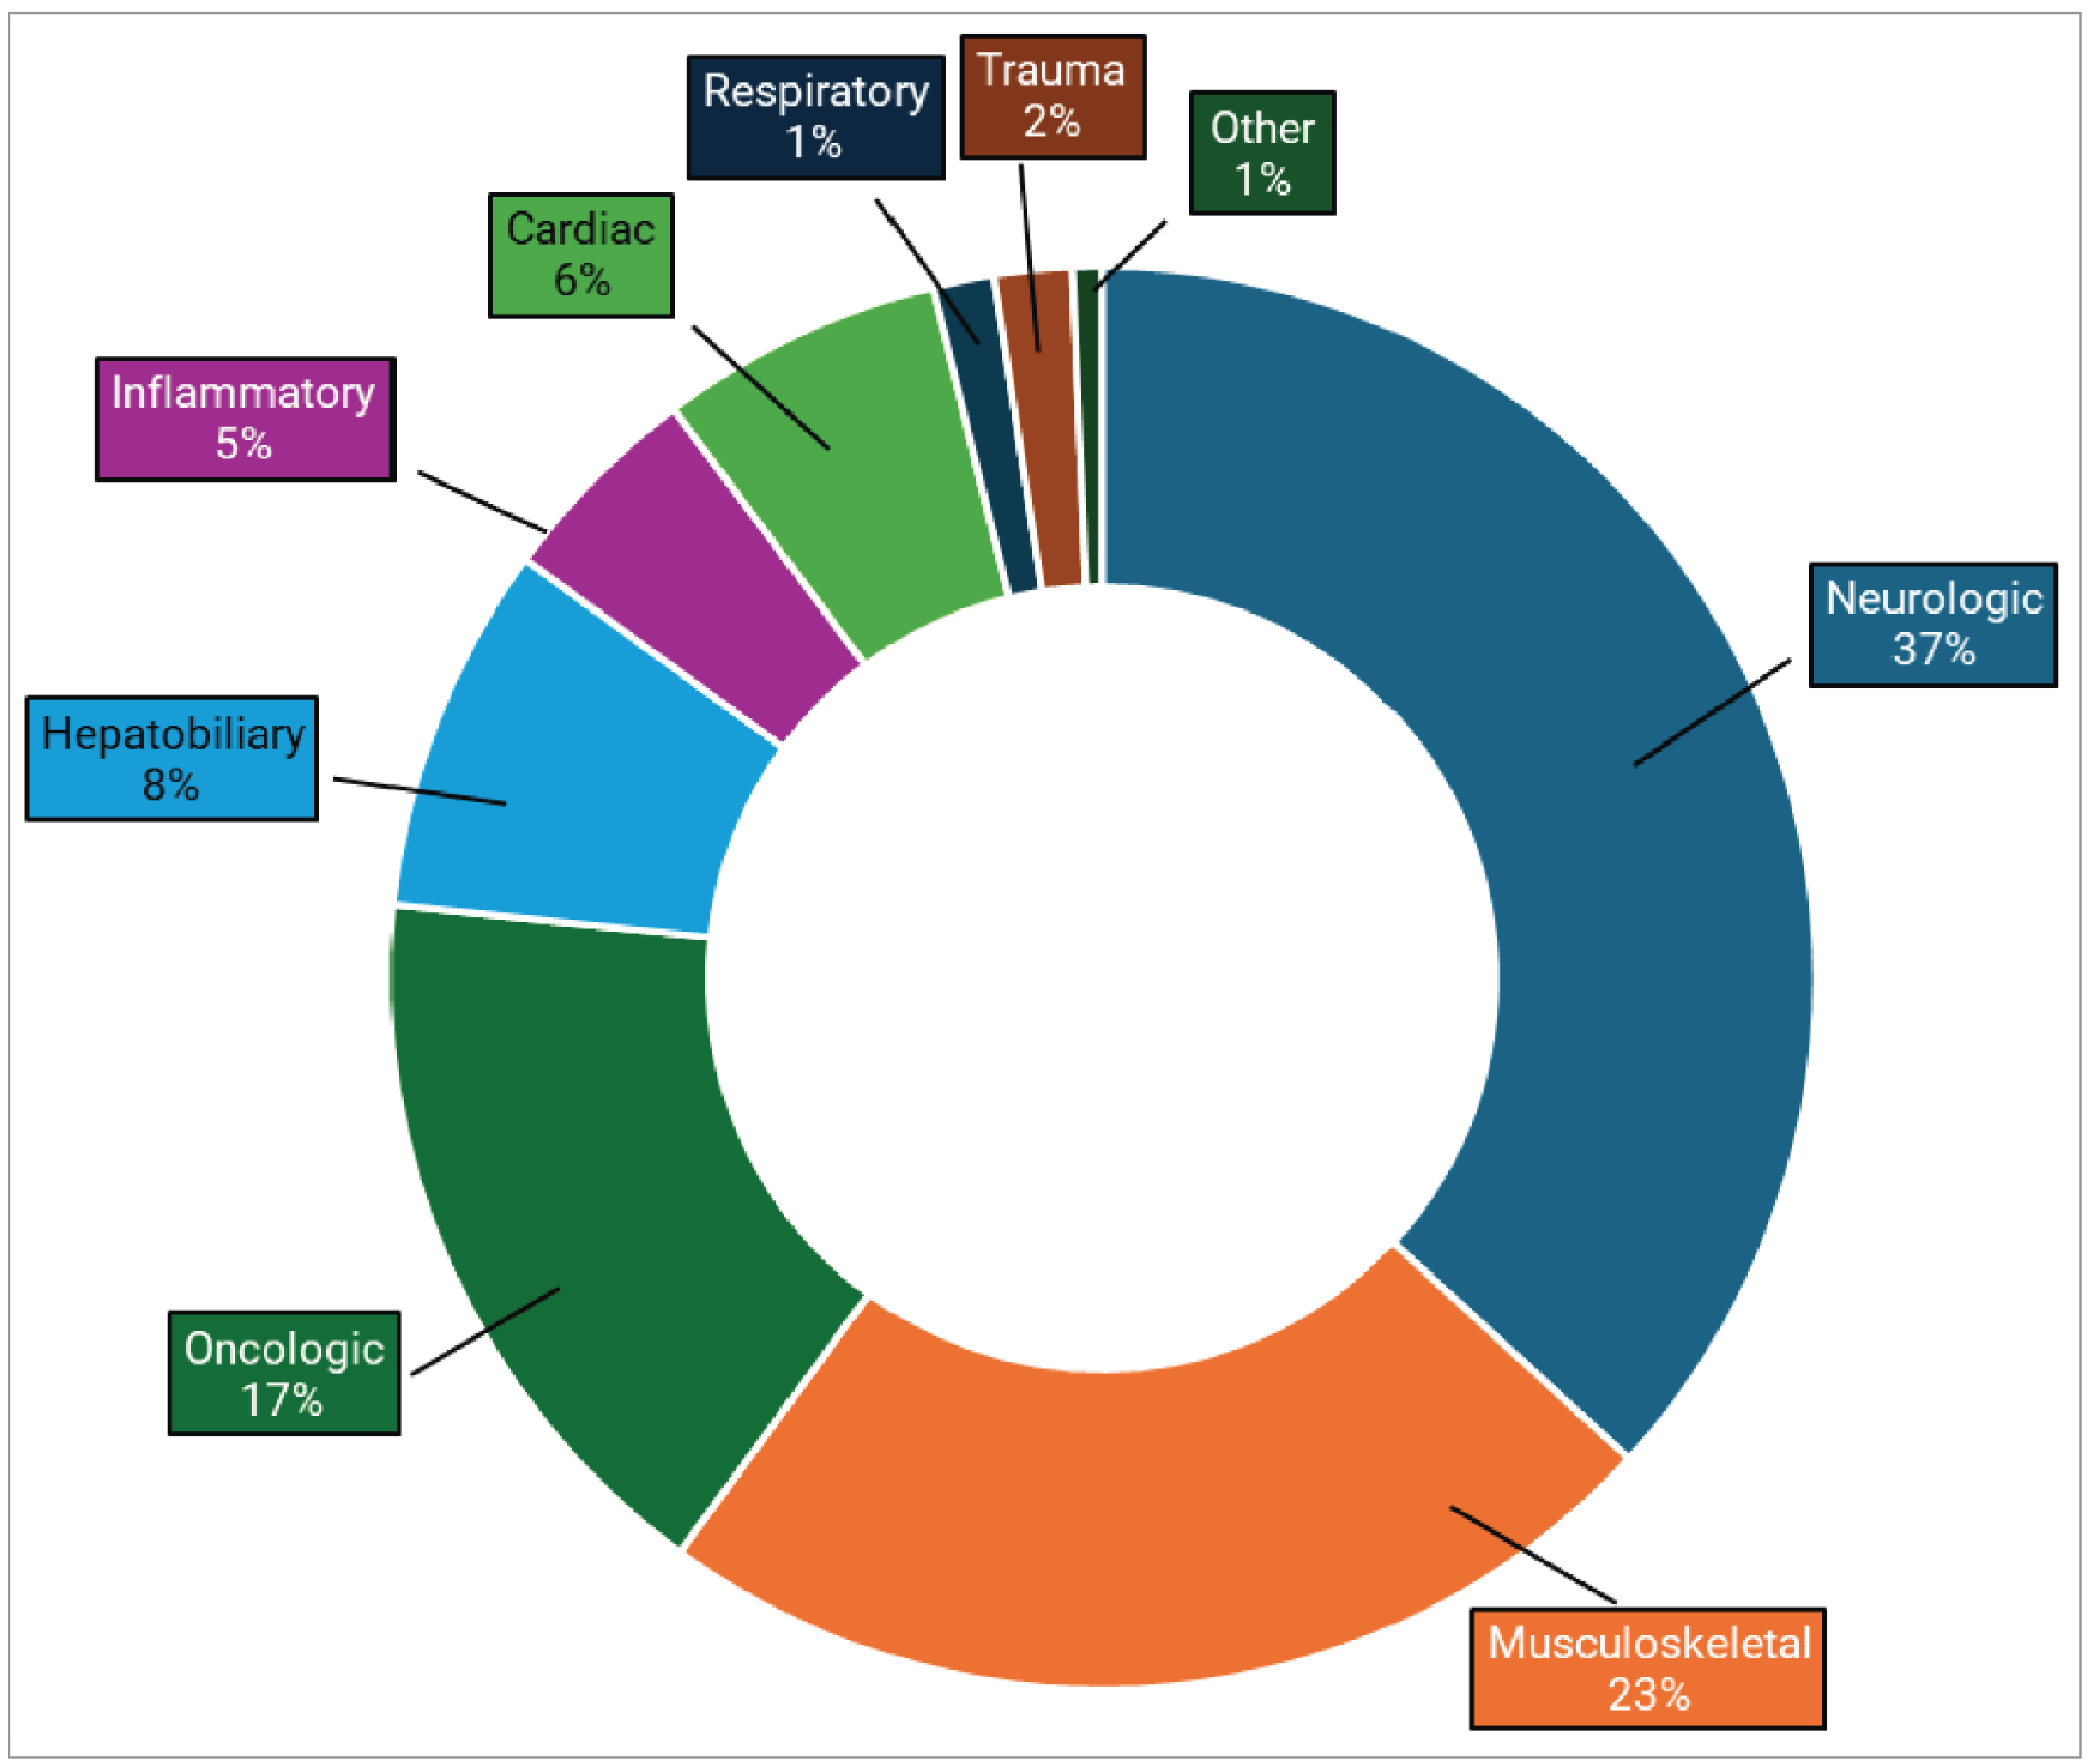
Ontario
Neurologic exams account for the highest proportion of MRI use by clinical specialty for the province at 37%, followed by musculoskeletal imaging at 23%, and oncologic imaging at 17% (refer to Figure 6). (The ranges of MRI use reported for each clinical specialty are shown in Table 6, Appendix 2.)
Ontario reported the highest neurology-related MRI use among the reporting provinces, at 37%, while hepatobiliary exams were the lowest, at 8%.
Responses were received from 18 sites — 14 located in an urban setting and 4 in a rural setting — and may not be representative of practices across the entire province.
Ontario reported data on MRI use for all 9 clinical specialties.
Figure 6: Average MRI Usage Rates by Clinical Specialty, Ontario
Notes: N = 18.
Data were derived from the following survey question: “On average, what percentage of these exams fall into the following categories? The total percentage, expressed as a number, must add up to 100.”
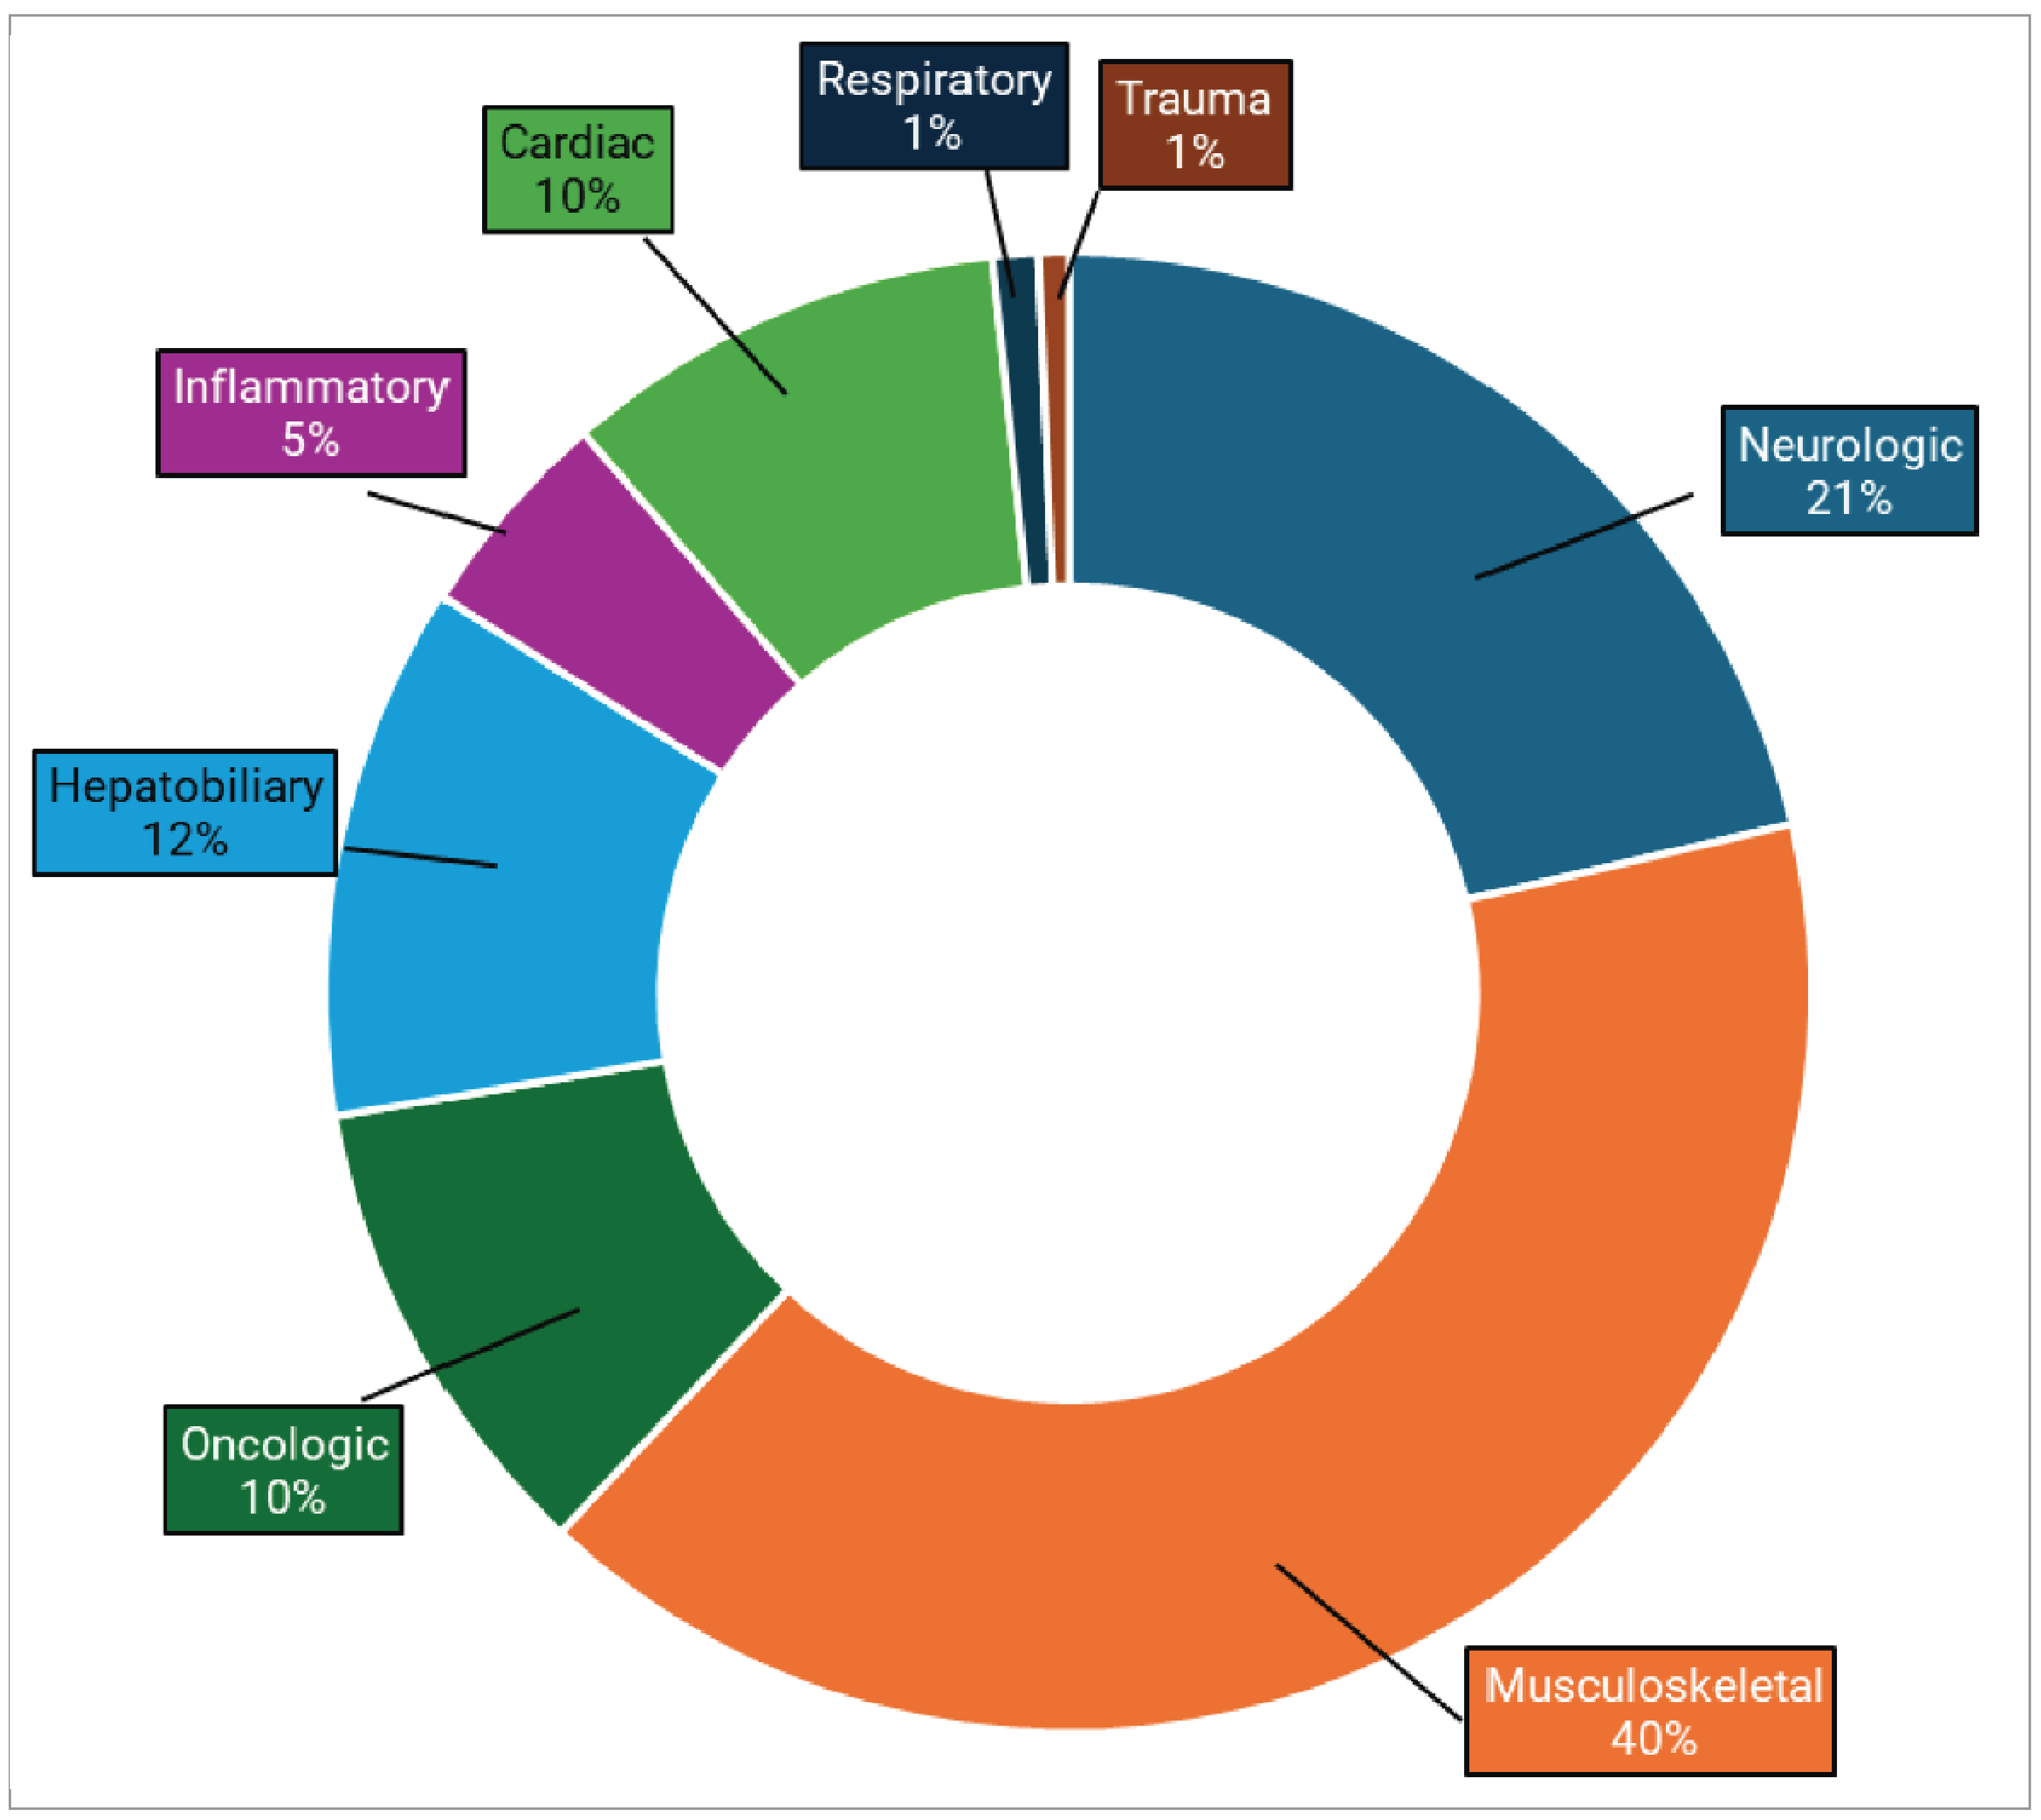
Manitoba
Musculoskeletal exams account for the highest proportion of MRI use by clinical specialty in the province at 40% (1 out of 2 provinces where this specialty ranked first), followed by neurologic imaging at 21%, and hepatobiliary imaging at 12% (refer to Figure 7). (The ranges of MRI use reported for each clinical specialty are shown in Table 7, Appendix 2.)
Manitoba reported the highest rate of MRI exams for cardiac conditions at 10%.
Oncologic exams were the lowest among reporting provinces at 10%.
Responses were received from 3 sites, all located in the urban setting, and may not be representative of practices across the entire province.
Figure 7: Average MRI Usage Rates by Clinical Specialty, Manitoba
Notes: N = 3.
Data were derived from the following survey question: “On average, what percentage of these exams fall into the following categories? The total percentage, expressed as a number, must add up to 100.”
Saskatchewan
Neurologic exams account for the highest proportion of MRI use by clinical specialty in the province at 32%, followed by musculoskeletal imaging at 21%, and both oncologic and hepatobiliary imaging at 15% (refer to Figure 8). (The ranges of MRI use reported for each clinical specialty are shown in Table 8, Appendix 2.)
Saskatchewan reported the highest inflammatory and infectious disease–related MRI use among reporting provinces, at 9%.
Responses were received from 5 sites, all located in the urban setting, and may not be representative of practices across the entire province.
Figure 8: Average MRI Usage Rates by Clinical Specialty, Saskatchewan
Notes: N = 5.
Data were derived from the following survey question: “On average, what percentage of these exams fall into the following categories? The total percentage, expressed as a number, must add up to 100.”
Alberta
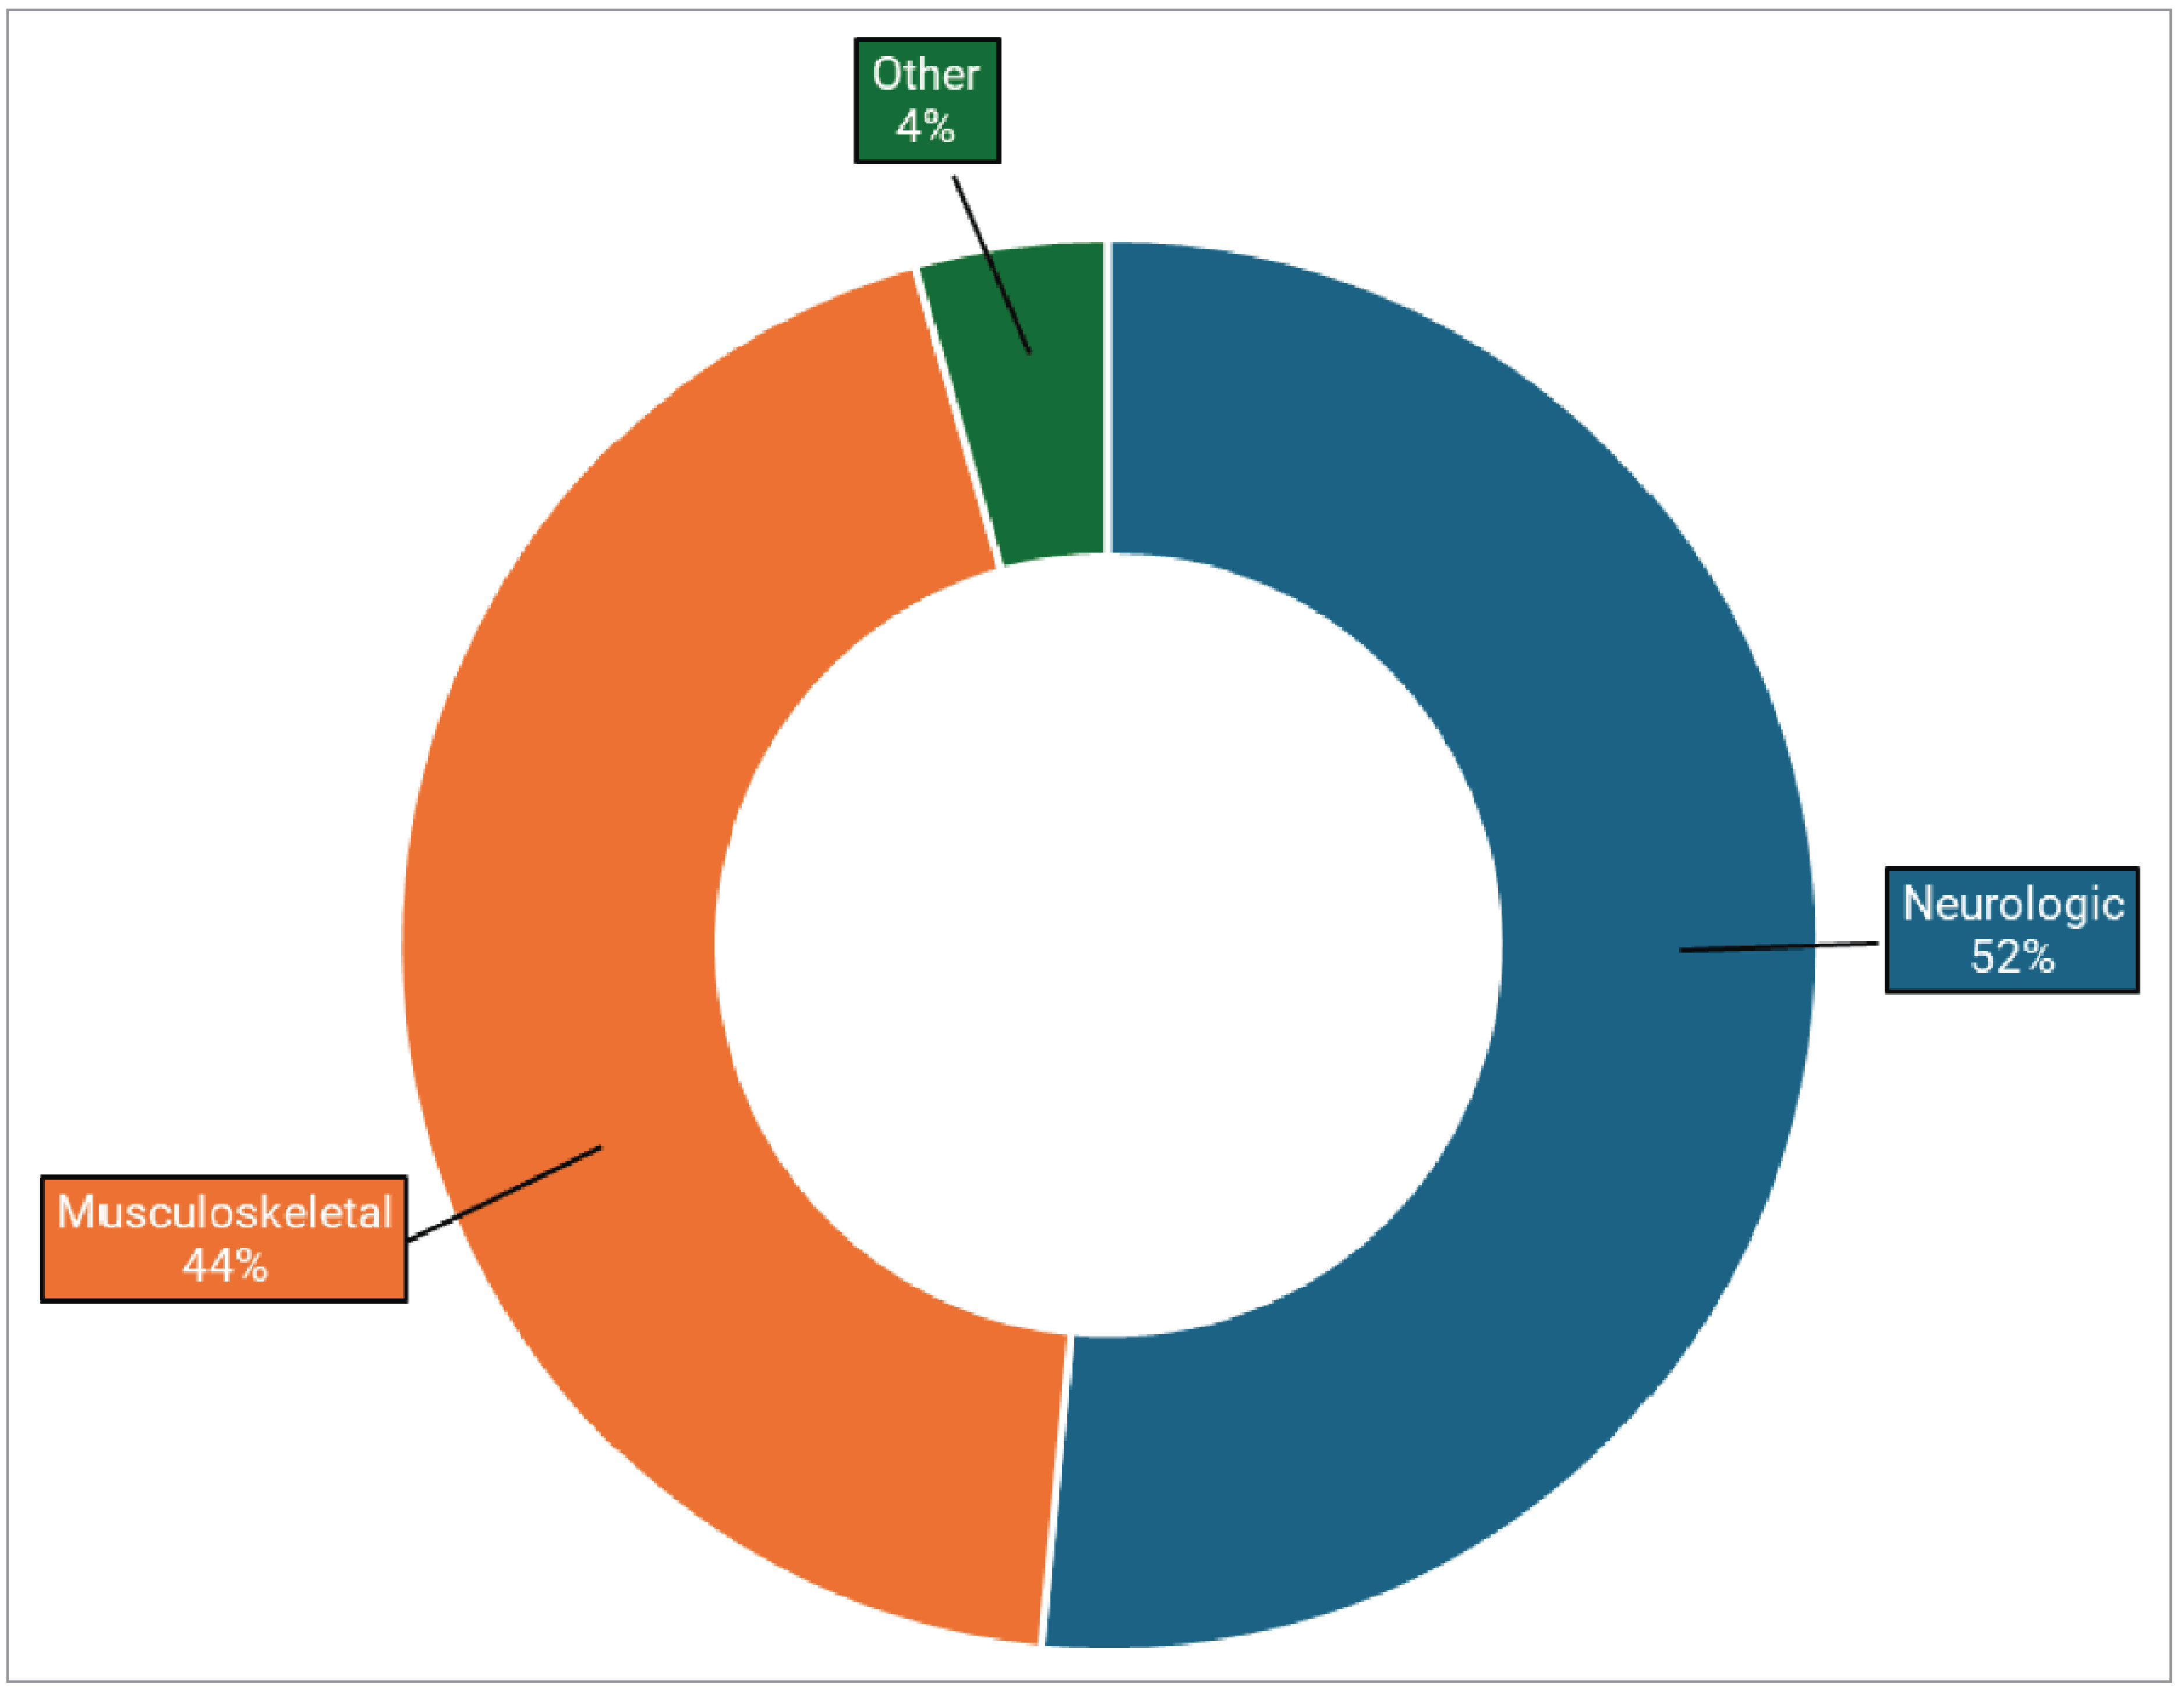
Neurologic exams account for the highest proportion of MRI use by clinical specialty for the province at 52%, followed by musculoskeletal imaging at 44%, and other exams at 4% (refer to Figure 9). (The ranges of MRI use reported for each clinical specialty are shown in Table 9, Appendix 2.)
Alberta reported the highest musculoskeletal-related MRI use at 44% and neurology-related MRI use at 52%.
Responses were received from 1 site, located in an urban setting, and may not be representative of practices across the entire province.
Alberta did not report any MRI exam allocation to the hepatobiliary, inflammatory or infectious disease, cardiac, respiratory, trauma, or oncologic clinical specialties.
Figure 9: Average MRI Usage Rates by Clinical Specialty, Alberta
Notes: N = 1.
Data were derived from the following survey question: “On average, what percentage of these exams fall into the following categories? The total percentage, expressed as a number, must add up to 100.”
Pagebreak
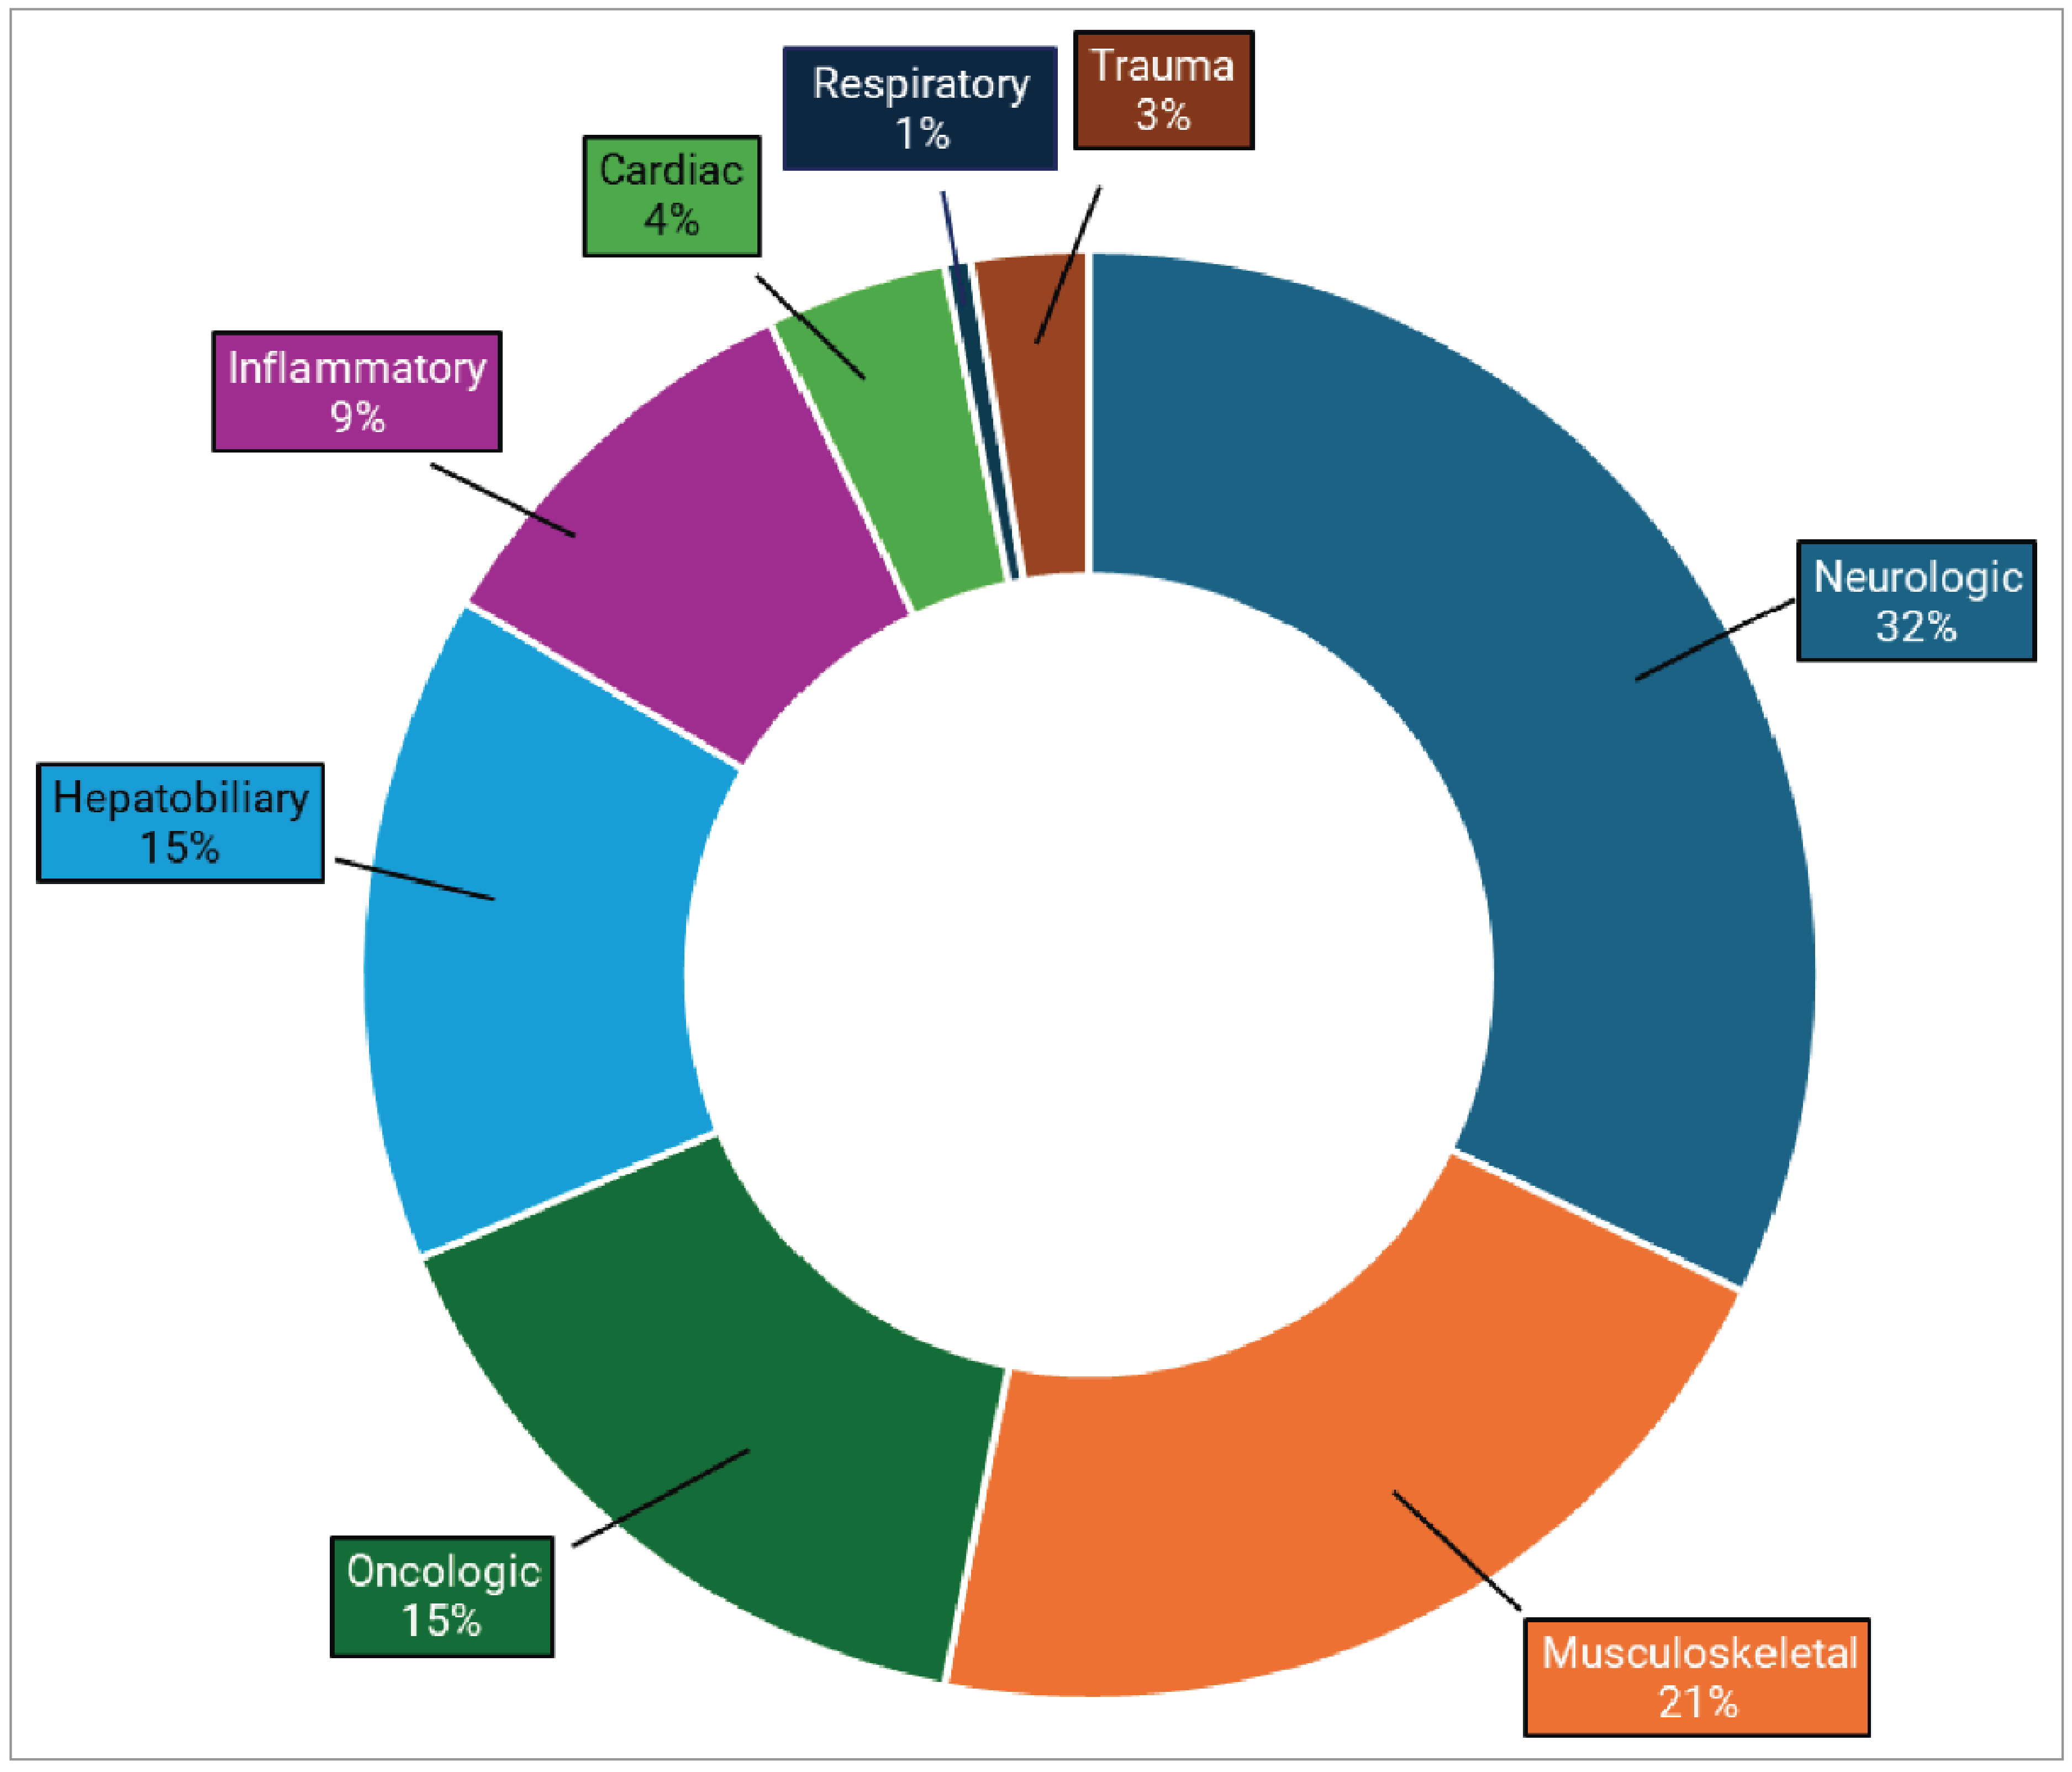
British Columbia
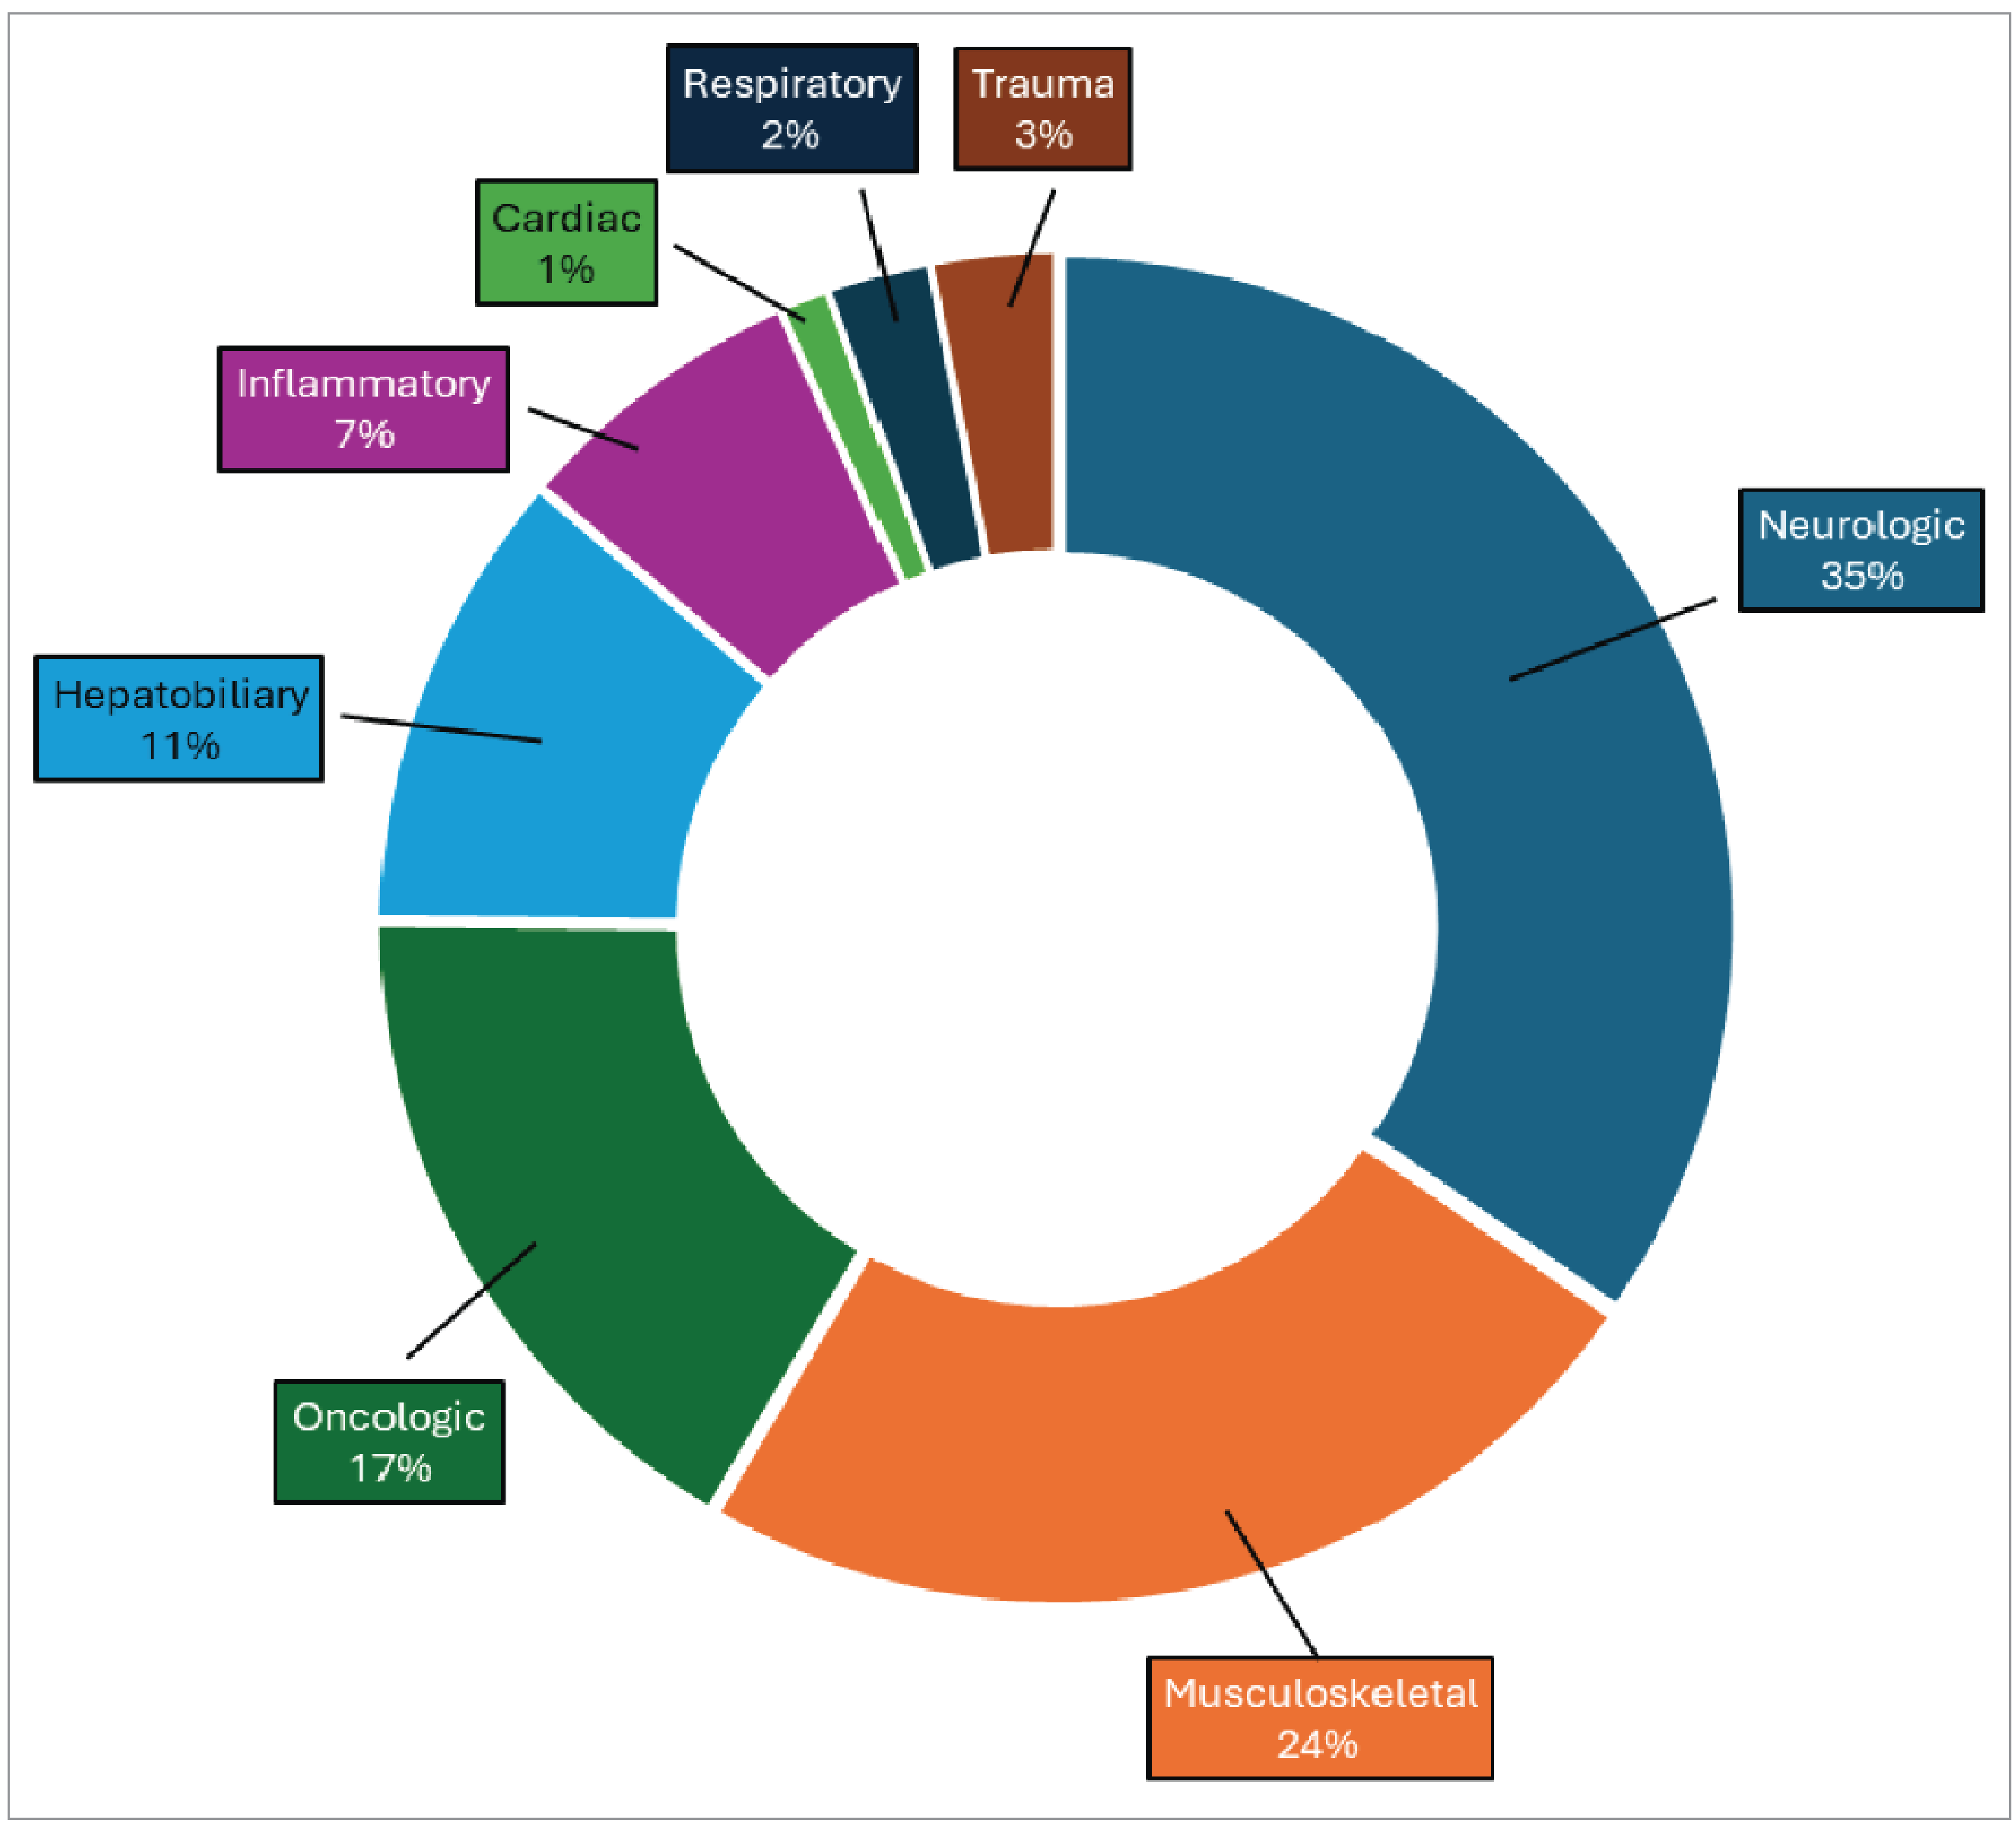
Neurologic exams account for the highest proportion of MRI use by clinical specialty for the province at 35%, followed by musculoskeletal imaging at 24%, and oncologic exams at 17% (refer to Figure 10). (The ranges of MRI use reported for each clinical specialty are shown in Table 10, Appendix 2.)
British Columbia reported the lowest use of MRI among reporting provinces for cardiac exams (1%).
Responses were received from 11 sites — 10 located in an urban setting and 1 in a rural setting — and may not be representative of practices across the entire province.
Figure 10: Average MRI Usage Rates by Clinical Specialty, British Columbia
Notes: N = 11.
Data were derived from the following survey question: “On average, what percentage of these exams fall into the following categories? The total percentage, expressed as a number, must add up to 100.”
MRI Use by Clinical Specialty Across Provinces
MRI use by clinical specialty varies by province, reflecting local population needs and clinical priorities (refer to Figure 11). Neurologic imaging is the most common overall, with notable differences for each specialty between the provinces:
Neurologic: Highest in Alberta (52%) and lowest in both Quebec and Newfoundland and Labrador (20%).
Hepatobiliary or gastrointestinal: Highest in New Brunswick (20%) and lowest in Ontario (8%).
Oncologic: Highest in Newfoundland and Labrador (35%) and lowest in Manitoba (10%).
Inflammatory or infectious diseases: Highest in Saskatchewan (9%) and lowest in both Manitoba and Ontario (5%).
Musculoskeletal: Highest in Alberta (44%) and lowest in Newfoundland and Labrador (12%).
Cardiac: Highest in Manitoba (10%) and lowest in British Columbia (1%).
Respiratory: Highest in New Brunswick (5%) and lowest in Saskatchewan (1%).
Trauma: Highest in Newfoundland and Labrador (8%) and lowest in Nova Scotia and Manitoba (1%).
Other clinical specialties: Highest in Alberta (4%) and lowest in Quebec (0.5%).
Across provinces, neurologic, musculoskeletal, and oncologic imaging consistently rank among the top 3 clinical areas for MRI use. In contrast, MRI use related to trauma, respiratory, cardiac, and infectious or inflammatory conditions tends to be lower, typically representing less than 10% of MRI use across jurisdictions.
Urban and Rural Usage Trends
A comparison of relative MRI use by clinical specialty between urban and rural imaging sites reveals several notable differences (refer to Figure 12):
Neurologic exams account for a greater share of MRI use at urban sites, averaging 32%, compared to 22% at rural sites.
Musculoskeletal imaging shows the opposite trend, with rural sites averaging 34% compared to 23% at urban sites.
Cardiac exams are also noteworthy, accounting for 5% of MRI use at urban sites and 1% at rural sites.
Inflammatory or infectious disease exams are relatively uncommon overall but appear more frequently at rural sites (9%) than at urban sites (5%).
For the 5 other clinical specialties reported, MRI usage rates are relatively consistent between urban and rural locations. For example:
hepatobiliary imaging: 12% (urban) versus 11% (rural)
oncologic imaging: 17% (urban) versus 18% (rural)
respiratory imaging: 2% (urban) versus 1% (rural)
trauma imaging: 2% (urban) versus 3% (rural)
other clinical specialties: 1% (urban) versus 0% (rural).
Percentage breakdown for urban and rural sites by province is available in Table 1, Appendix 2.
Figure 11: Percentage of MRI Usage Proportion by Clinical Specialty, by Province
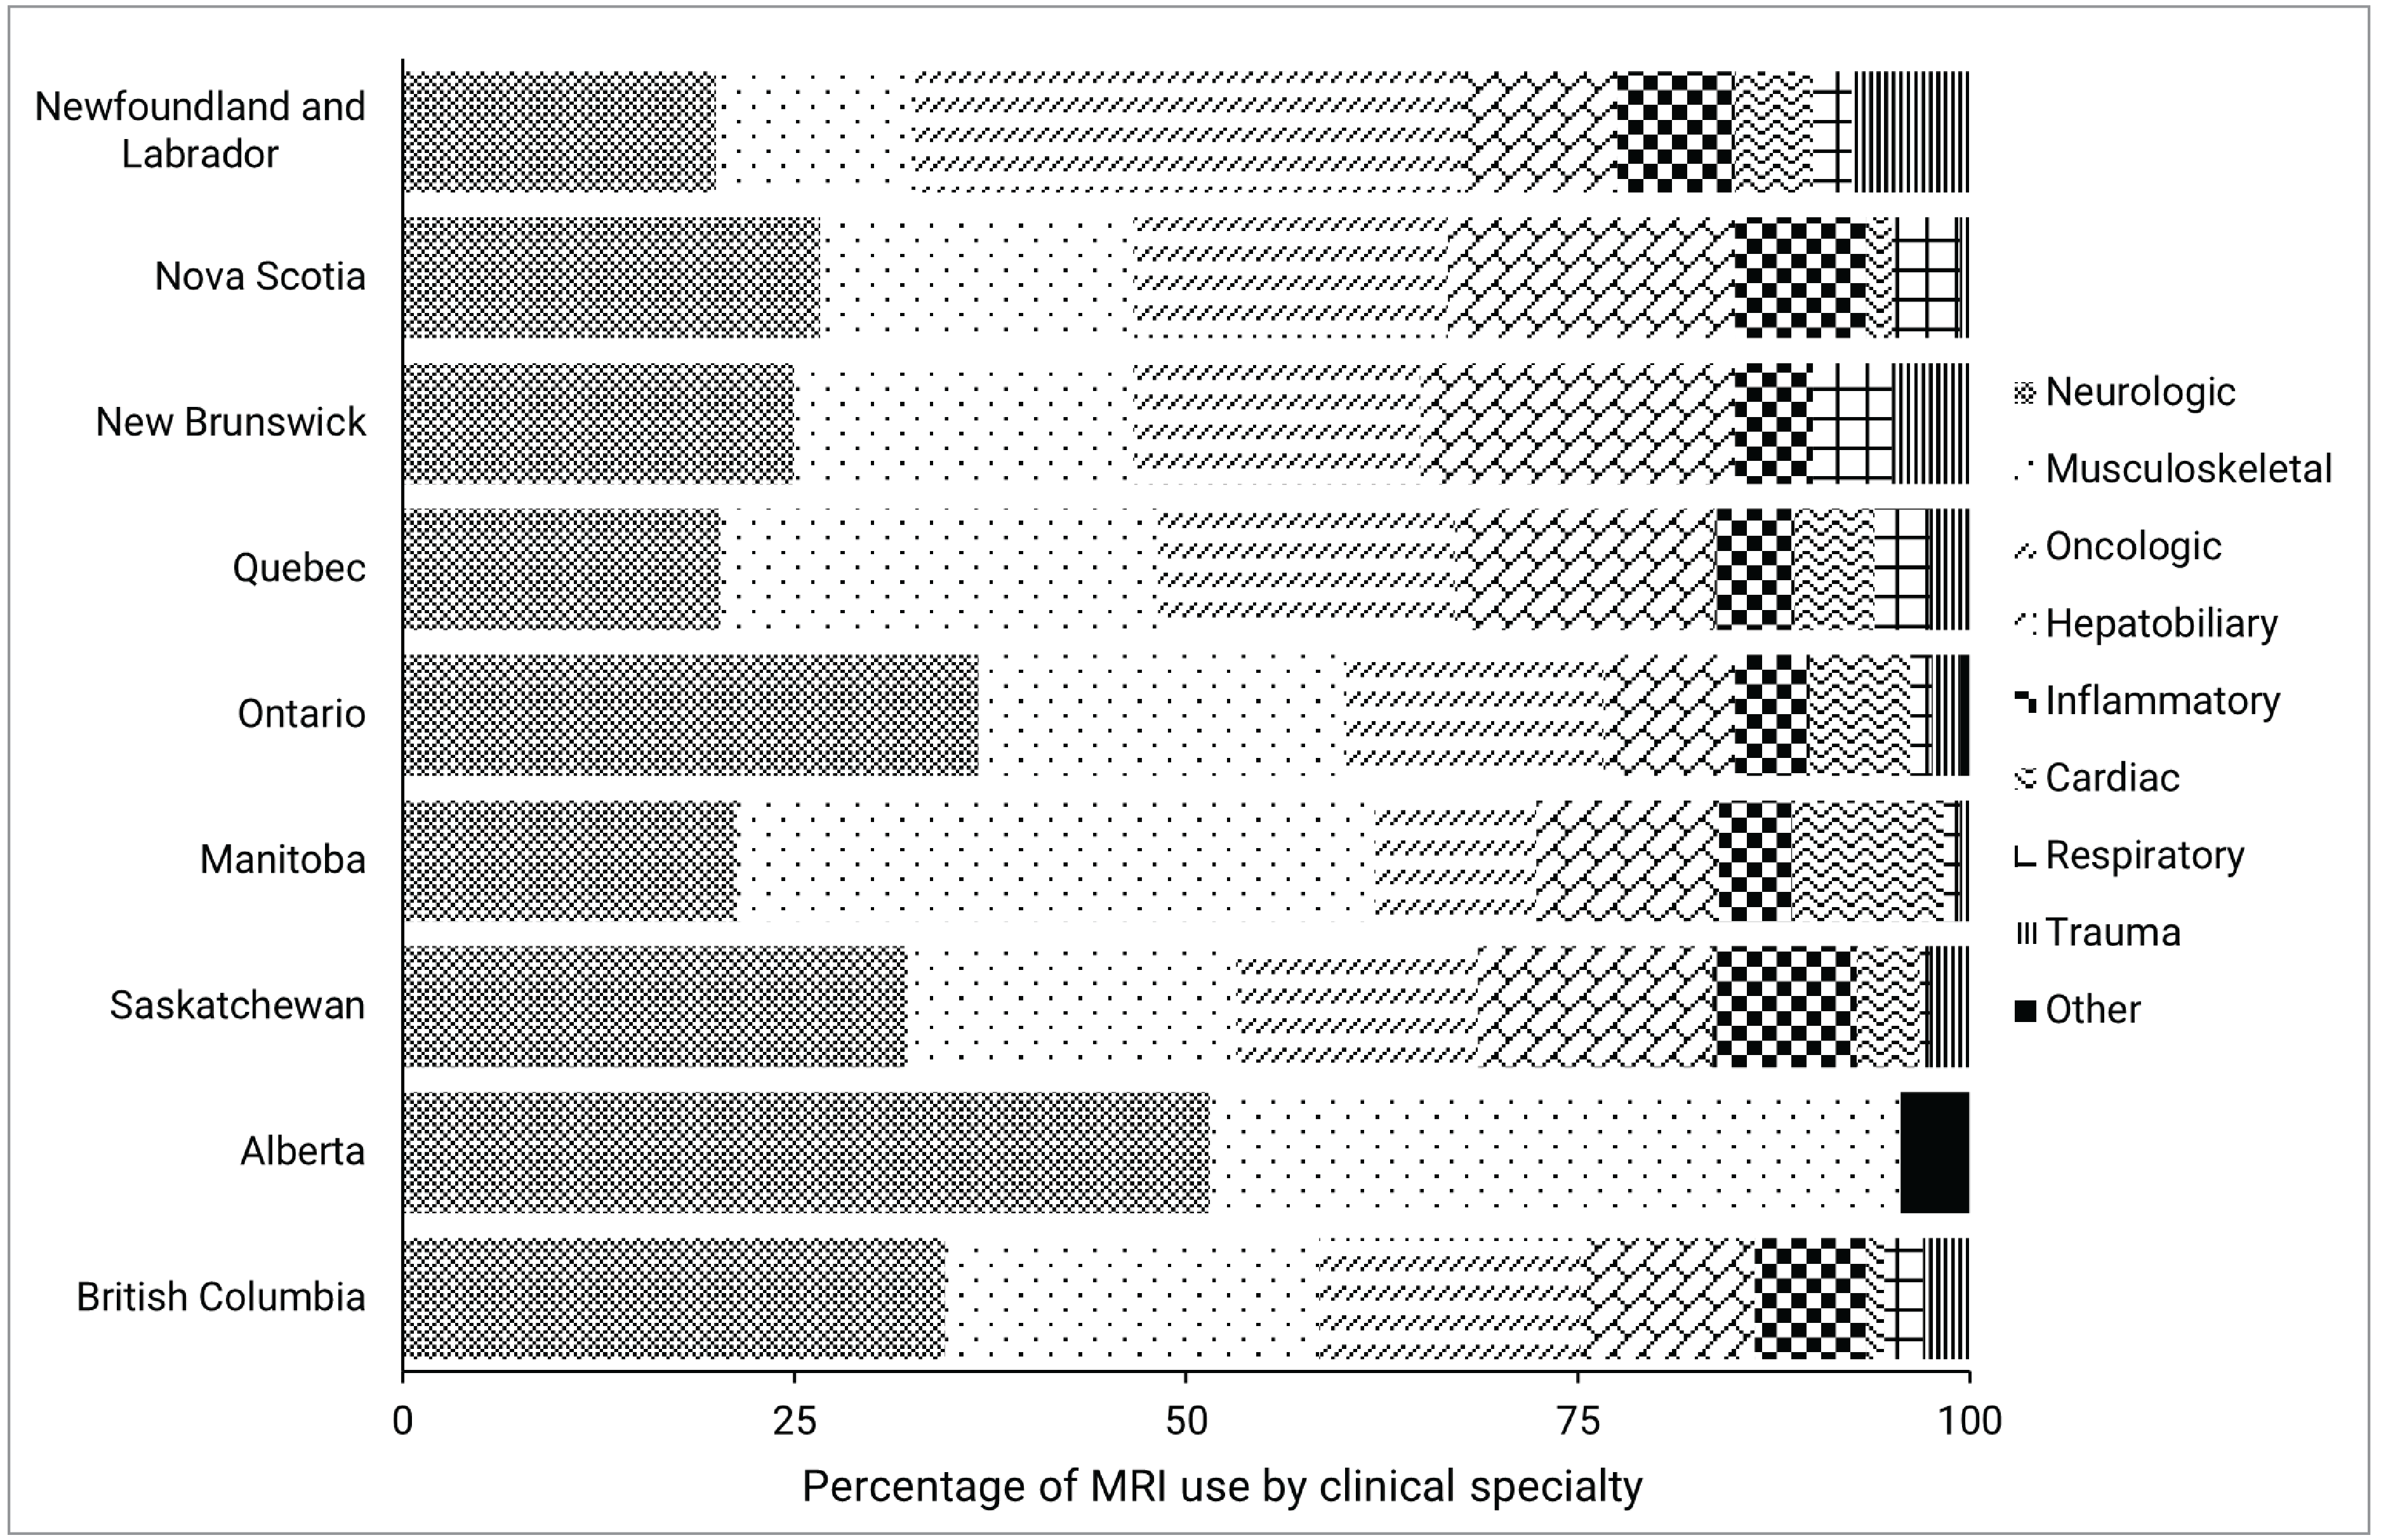
Notes: Survey response data on the average percentage of MRI use by clinical specialty were available for 56 out of 296 sites across 9 of the 13 jurisdictions with MRI capacity. No data were available for Prince Edward Island, the Yukon, the Northwest Territories, or Nunavut.
Data were derived from the following survey question: “On average, what percentage of these exams fall into the following categories? The total percentage, expressed as a number, must add up to 100.” The following categories were offered: oncology, respiratory, hepatobiliary, musculoskeletal, inflammatory or infectious disease, neurologic, cardiac, trauma, and other.
Figure 12: MRI Usage Rates by Clinical Specialty, by Urban and Rural Sites
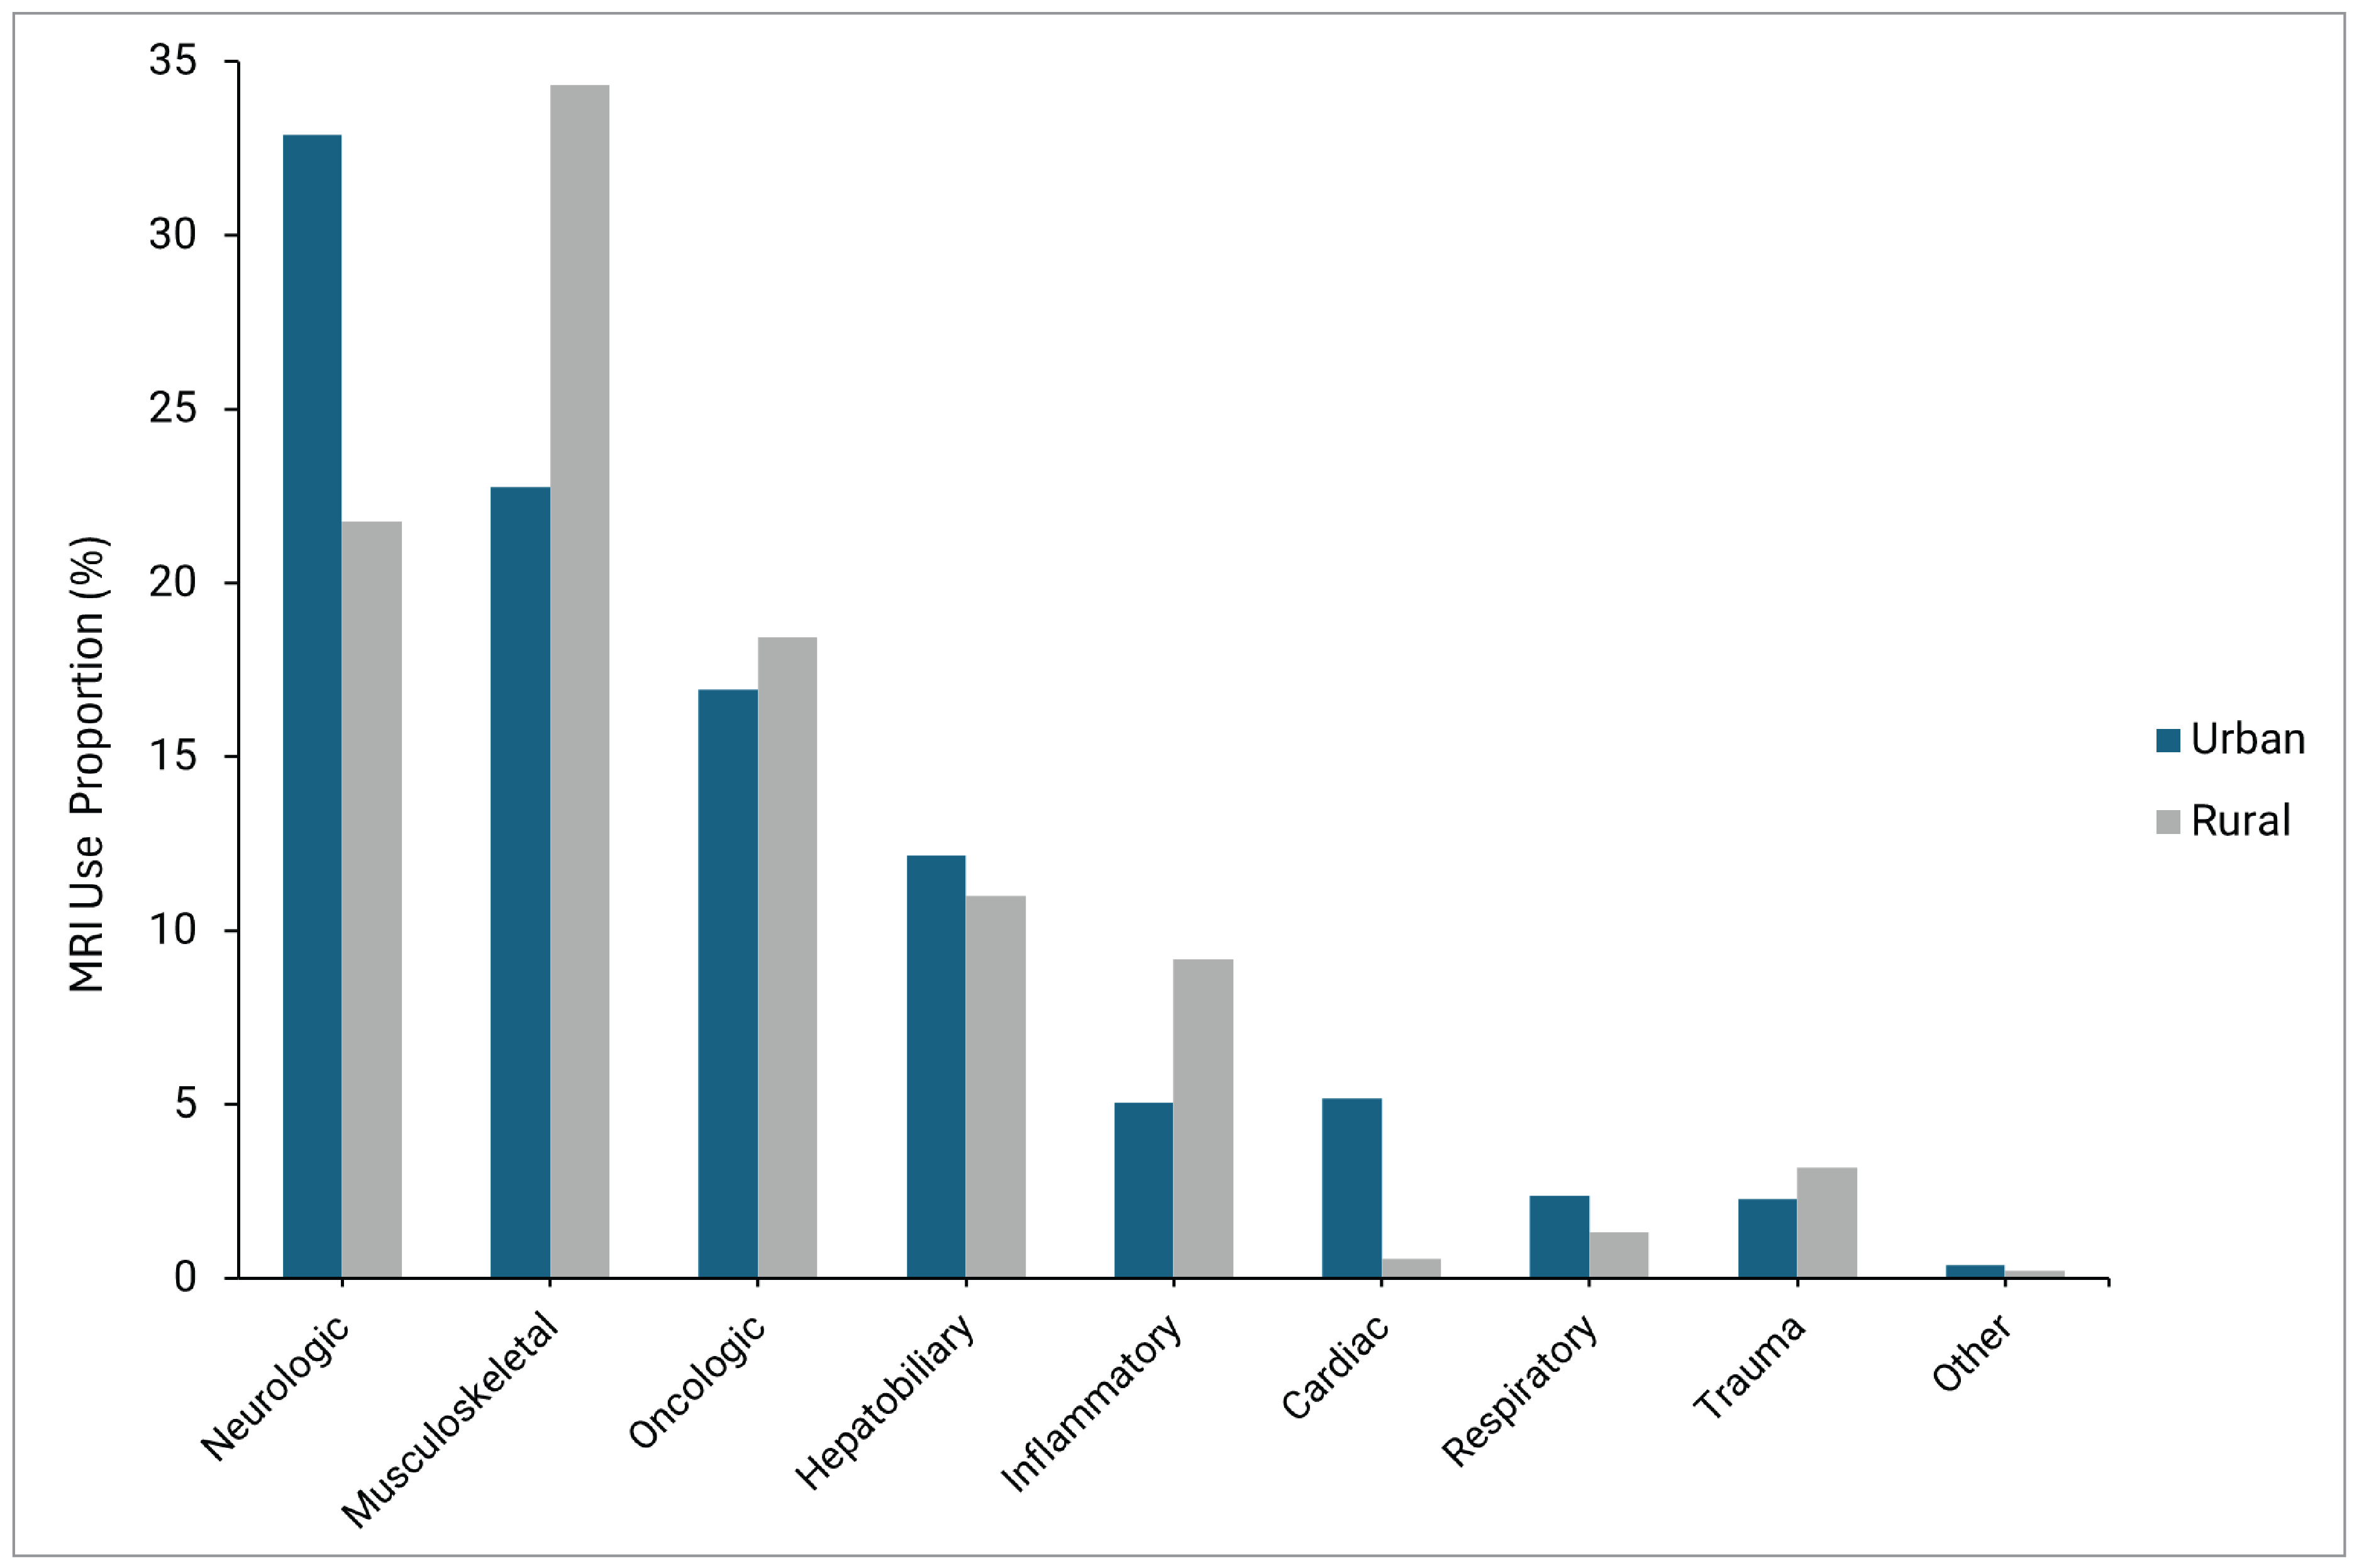
Notes: Survey response data on the average percentage of MRI use by discipline were available for 56 out of 296 sites across 9 of the 13 jurisdictions with MRI capacity. No data were available for Prince Edward Island, the Yukon, Nunavut, or the Northwest Territories. Urban = 46, rural = 9, remote = 1 (not included).
Clinical Specialties Over Time
Proportions of MRI use by clinical specialty have remained relatively stable across the 3 previous CMII survey cycles for cardiac, hepatobiliary or gastrointestinal, musculoskeletal, neurologic, oncologic, and respiratory exams (refer to Figure 13). However, differences were observed for the following clinical specialties:
MRI use for inflammatory or infectious disease exams increased to 6% in the 2022–20233 survey, compared to 0% in both the 2019–20205 and 20174 iterations.
Trauma-related MRI exams were not reported in 20174 but have shown consistent use in subsequent years, accounting for 1% in 2019–20205 and 2% in 2022–2023.3
Exams for other clinical specialties decreased from 7% nationally in 20174 to 3% in 2019–20205 and 1% in the 2022–20233 survey iteration.
Figure 13: MRI Use by Clinical Specialty Reported Over Time (2017 to 2023)
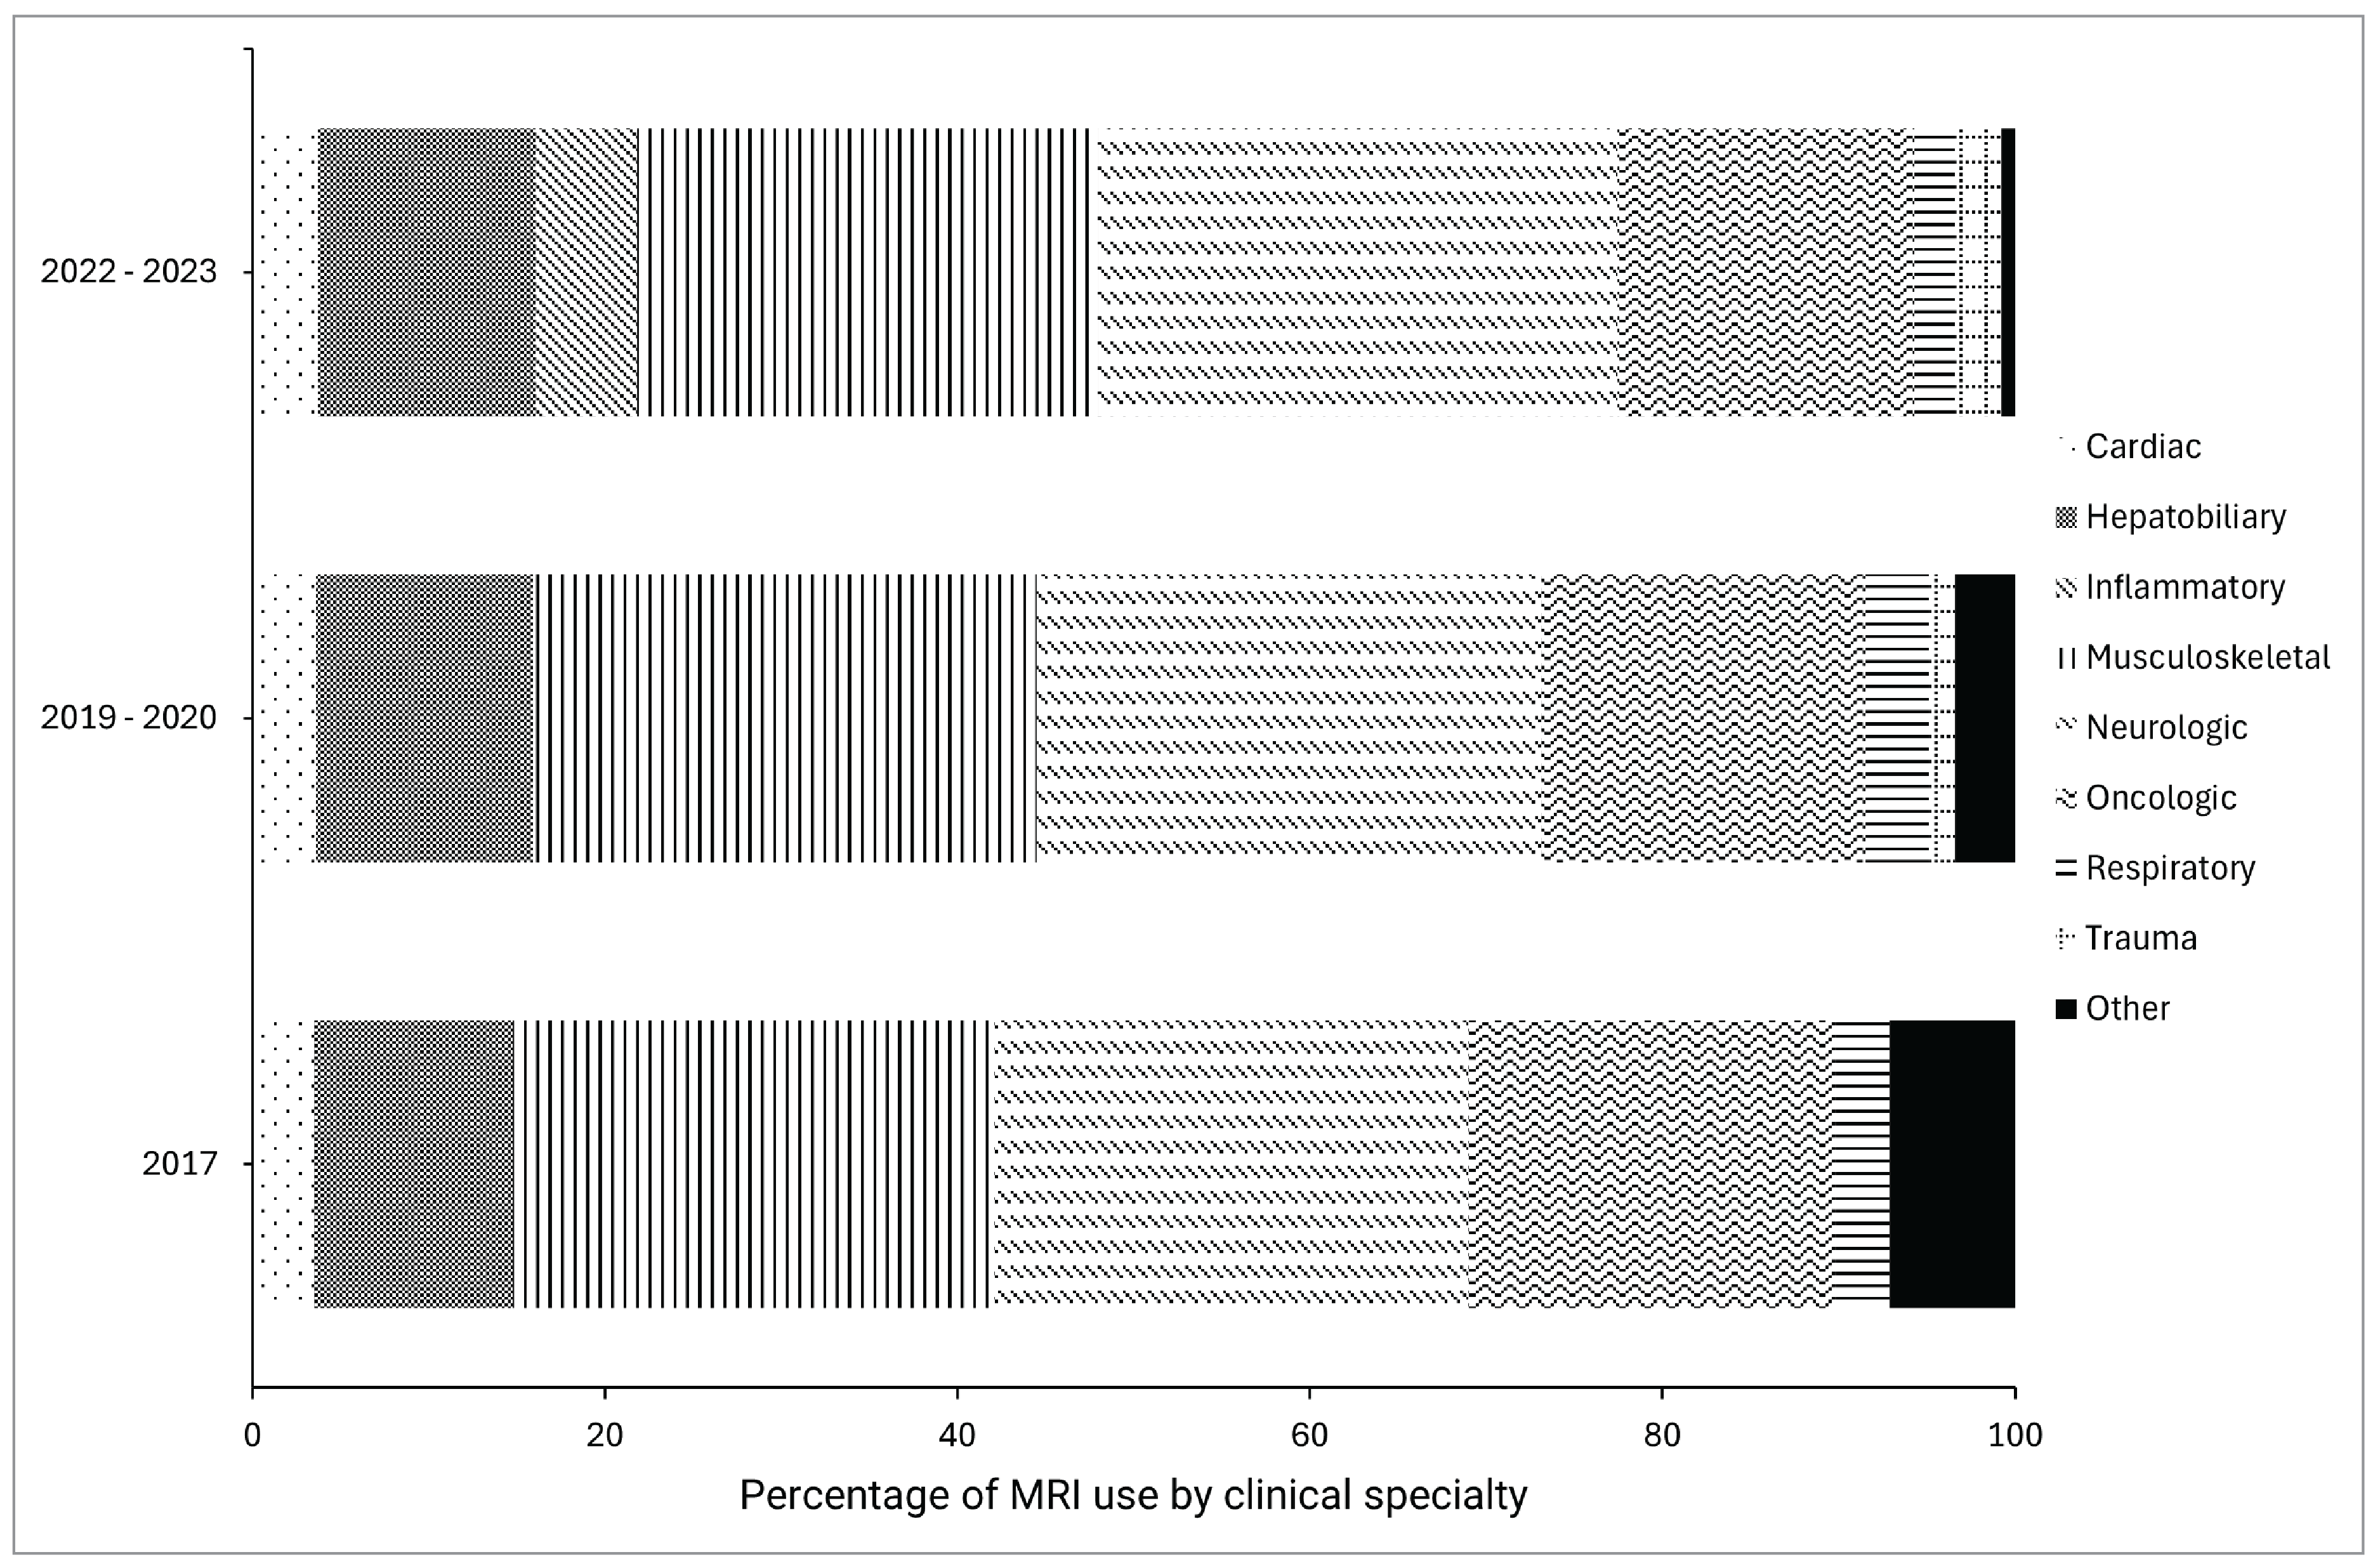
Notes: Survey response data on the average percentage of MRI use by discipline were available for 56 out of 296 sites across 9 of the 13 jurisdictions with MRI capacity in 2022, 71 out of 296 in 2019, and 34 out of 296 in 2017. No data were available for Prince Edward Island, the Yukon, the Northwest Territories, or Nunavut.
Limitations
While this report provides valuable insights into MRI usage trends across Canada, several limitations should be considered when interpreting the findings.
A total of 56 sites across 9 provinces responded to the clinical specialty portion of the 2022–2023 CMII national survey, representing 24.6% of the 225 public MRI sites surveyed. Response rates varied by jurisdiction, with some provinces having high participation and others providing responses from a single site. Uneven response rates may introduce nonresponse bias, especially if the responding sites differ largely from nonresponding ones. Additionally, most responses came from urban sites, limiting the ability to draw conclusions about MRI use in rural or remote areas.
MRI usage data were reported as approximate estimates, which may vary in accuracy depending on each site’s tracking methods. Some sites may use structured tracking systems, while others may rely on informal estimates, introducing potential inconsistencies. Also, Canada lacks a nationally standardized coding system for classifying MRI scans by clinical indication.8 While Canadian Classification of Health Interventions codes are used to group exams by modality and anatomical area, their application varies across provinces and health care facilities.8 Some regions rely heavily on these codes for billing purposes, while others apply them inconsistently.
Therefore, rather than analyze billing codes, the CMII survey classified MRI use by clinical specialty, which provides more reliable insights into clinical demand. However, this approach has its own limitations. Broad clinical categories may overlook complex cases, and variations in how specialties are defined could introduce inconsistencies and result in reporter bias. Many sites reported a portion of their MRI exams under the “other” category, but most were unable to provide further detail. This limits the ability to interpret or act on data from these sites and jurisdictions.
The COVID-19 pandemic may have affected MRI exam patterns during the reporting period, with delays or cancellations potentially shifting use toward more urgent exams and influencing specialty-based reporting.
Finally, because survey participation was voluntary and response rates varied, findings may not fully represent MRI use across Canada. Higher response rates from some jurisdictions may inadvertently emphasize practices in specific regions or centres.
Implications for Decision-Making
As MRI exam volumes grow — and with the high cost of operating MRI equipment — baseline clinical usage data serve as a valuable tool for informing decisions around resource planning and service delivery. Identifying high-use clinical specialties supports efficient allocation of equipment, staffing, and training while also allowing decision-makers to monitor trends and assess the impact of policies or clinical guidelines.8
Understanding how MRI is used can inform wait time strategies, support patient outcomes, and guide cost-effective deployment of imaging resources. Differences in usage patterns across provinces likely reflect variation in population needs, clinical practice, and access to certain imaging specialties. For example, high neurologic and musculoskeletal use is seen nationwide, while lower rates for trauma and respiratory imaging may suggest alternate diagnostic pathways for conditions within those specialties. Regional differences — such as the prominence of oncologic imaging in Newfoundland and Labrador — highlight the importance of the local context when considering MRI usage patterns.
These findings reinforce the value of regionally tailored planning and regular benchmarking to ensure equitable and efficient MRI service delivery. Differences between urban and rural use also point to regional differences in the demand for various exam specialties, helping to inform targeted strategies that address local health care needs and support adaptive planning over time.
Pagebreak
Conclusion
This report provides insights into MRI usage trends across Canada, showing key differences in how MRI is utilized by clinical specialty and setting. Regional variations in MRI use, particularly between urban and rural areas as well as across different provinces, were observed. The data shows that neurologic and musculoskeletal exams dominate MRI use nationwide, with neurologic exams accounting for the largest proportion of MRI use in 6 out of 9 provinces. Certain exams also consistently rank lower, such as respiratory exams, which account for the least MRI use in 5 out of 9 provinces. There are also notable differences between provinces, such as the prominence of oncologic exams in Newfoundland and Labrador and higher proportion of hepatobiliary exams in New Brunswick.
This work highlights the importance of establishing baseline usage data to support informed decision-making in health system planning. Understanding MRI usage trends can guide more effective resource allocation, including staffing, equipment, and training, while also addressing differences in demand and access to care, particularly in rural areas. These insights may help decision-makers ensure equitable access to diagnostic imaging across Canada while optimizing resource utilization and improving patient outcomes.
Tracking MRI use over time and across regions can help identify changing needs of the population, improve service delivery, and optimize health care resources. As demand for MRI services grows, particularly with an aging population and evolving clinical needs, having reliable data can support efficient and equitable access to this critical diagnostic tool.
Pagebreak
References
1.Scheinfeld MH, Moon JY, Fagan MJ, Davoudzadeh R, Wang D, Benjamin HT. MRI usage in a pediatric emergency department: an analysis of usage and usage trends over 5 years. Pediatric Radiology. 2017;47(3):327-332. doi: 10.1007/s00247-016-3764-y PubMed
2.Smith-Bindman R, Kwan ML, Marlow EC, et al. Trends in Use of Medical Imaging in US Health Care Systems and in Ontario, Canada, 2000-2016. JAMA. 2019;9:843-856. doi: 10.1001/jama.2019.11456 PubMed
3.Agency CsD. The Canadian Medical Imaging Inventory 2022-2023: Provincial and Territorial Overview. Canadian Journal of Health Technologies. 2023;4(8). chrome-extension://efaidnbmnnnibpcajpcglclefindmkaj/https://www.cda-amc.ca/sites/default/files/hta-he/HC0024_Overview.pdf
4.CADTH. The Canadian Medical Imaging Inventory. CADTH. 2017;1.0. chrome-extension://efaidnbmnnnibpcajpcglclefindmkaj/https://www.cda-amc.ca/sites/default/files/pdf/canadian_medical_imaging_inventory_2017.pdf
5.CADTH. The Canadian Medical Imaging Inventory 2019-2020. Canadian Journal of Health Technologies. 2019-2020;1(1). chromeextension://efaidnbmnnnibpcajpcglclefindmkaj/https://www.cda-amc.ca/sites/default/files/ou-tr/op0546-cmii3-final-report.pdf
6.Ashby K, Adams BN, Shetty M. Appropriate Magnetic Resonance Imaging Ordering. StatPearls. 2022. https://www.ncbi.nlm.nih.gov/books/NBK565857/
7.Huang CC, Effendi FF, Kosik RO, Lee WJ, Wang LJ, Juan CJ, Chan WP. Utilization of CT and MRI scanning in Taiwan, 2000-2017. Insights Imaging. 2023;14(23). doi: 10.1186/s13244-023-01364-2 PubMed
8.Foerster V, Murtagh J, Lentle BC, Wood RJ, Reed MH, Husereau D, Mensinkai S. CT and MRI for Selected Clinical Disorders: A Systematic Review of Clinical Systematic Reviews Canadian Coordinating Office for Health Technology Assessment. 2005(59). https://www.cda-amc.ca/sites/default/files/pdf/322_ctmri_tr_e.pdf
Appendix 1: CMII Survey Question
Please note that this appendix has not been copy-edited.
The following is an excerpt from the CMII questionnaire, the data from which was used to inform this report.
On average, what percentage of these exams fall into the following categories? The total percentage, expressed as a number, must add up to 100.
Oncology
Respiratory disease
Hepatobiliary or gastrointestinal
Musculoskeletal disorders
Inflammatory or infectious diseases
Neurologic
Cardiac
Trauma
Other (specify).
Appendix 2: Supplementary Data
Please note that this appendix has not been copy-edited.
Table 1: National MRI Usage Rates (Average) and Ranges by Clinical Specialty
Clinical specialty | Average usage rate | Minimum | Maximum | Urban | Rural |
|---|---|---|---|---|---|
Cardiac | 4% | 0% | 10% | 5% | 1% |
Hepatobiliary or gastrointestinal | 12% | 0% | 20% | 12% | 11% |
Inflammatory or infectious diseases | 6% | 0% | 9% | 5% | 9% |
Musculoskeletal | 26% | 12% | 44% | 23% | 34% |
Neurologic | 29% | 20% | 52% | 33% | 22% |
Oncologic | 17% | 0% | 35% | 17% | 18% |
Respiratory | 2% | 0% | 5% | 2% | 1% |
Trauma | 3% | 0% | 8% | 2% | 3% |
Other | 1% | 0% | 4% | 1% | 0% |
Note: Data derived from survey question: “Based on your experience in the last fiscal year, what is the average percentage of overall time [modality] units are used for?”
Urban: n = 46.
Rural: n = 9.
Table 2: Newfoundland and Labrador MRI Usage Rates and Ranges by Clinical Specialty
Clinical specialty | Average usage rate | Minimum | Maximum |
|---|---|---|---|
Cardiac | 5% | 0% | 10% |
Hepatobiliary or gastrointestinal | 10% | 5% | 15% |
Inflammatory or infectious diseases | 7% | 5% | 10% |
Musculoskeletal | 12% | 10% | 15% |
Neurologic | 20% | 15% | 25% |
Oncologic | 35% | 30% | 40% |
Respiratory | 3% | 0% | 5% |
Trauma | 8% | 5% | 10% |
Other | 0% | 0% | 0% |
Table 3: Nova Scotia MRI Usage Rates and Ranges by Clinical Specialty
Clinical specialty | Average usage rate | Minimum | Maximum |
|---|---|---|---|
Cardiac | 2% | 0% | 5% |
Hepatobiliary or gastrointestinal | 18% | 10% | 30% |
Inflammatory or infectious diseases | 8% | 5% | 10% |
Musculoskeletal | 20% | 10% | 30% |
Neurologic | 27% | 15% | 35% |
Oncologic | 20% | 15% | 25% |
Respiratory | 4% | 0% | 10% |
Trauma | 1% | 0% | 2% |
Other | 0% | 0% | 0% |
Table 4: New Brunswick MRI Usage Rates and Ranges by Clinical Specialty
Clinical specialty | Average usage rate | Minimum | Maximum |
|---|---|---|---|
Cardiac | 0% | 0% | 0% |
Hepatobiliary or gastrointestinal | 20% | 20% | 20% |
Inflammatory or infectious diseases | 5% | 0% | 10% |
Musculoskeletal | 22% | 20% | 25% |
Neurologic | 25% | 20% | 30% |
Oncologic | 18% | 15% | 20% |
Respiratory | 5% | 0% | 10% |
Trauma | 5% | 5% | 5% |
Other | 0% | 0% | 0% |
Table 5: Quebec MRI Usage Rates and Ranges by Clinical Specialty
Indication | Average usage rate | Minimum | Maximum |
|---|---|---|---|
Cardiac | 5% | 0% | 40% |
Hepatobiliary or gastrointestinal | 16.5% | 1% | 30% |
Inflammatory or infectious diseases | 5% | 0% | 15% |
Musculoskeletal | 28% | 10% | 50% |
Neurologic | 20% | 10% | 40% |
Oncologic | 19% | 10% | 30% |
Respiratory | 4% | 0% | 20% |
Trauma | 2% | 0% | 10% |
Other | 0.5% | 0% | 5% |
Table 6: Ontario MRI Usage Rates and Ranges by Clinical Specialty
Indication | Average usage rate | Minimum | Maximum |
|---|---|---|---|
Cardiac | 6% | 0% | 90% |
Hepatobiliary or gastrointestinal | 8% | 0% | 20% |
Inflammatory or infectious diseases | 5% | 0% | 25% |
Musculoskeletal | 23% | 0% | 60% |
Neurologic | 37% | 3% | 100% |
Oncologic | 17% | 0% | 50% |
Respiratory | 1% | 0% | 10% |
Trauma | 2% | 0% | 14% |
Other | 1% | 0% | 10% |
Table 7: Manitoba MRI Usage Rates and Ranges by Clinical Specialty
Indication | Average usage rate | Minimum | Maximum |
|---|---|---|---|
Cardiac | 10% | 0% | 19% |
Hepatobiliary or gastrointestinal | 12% | 0% | 25% |
Inflammatory or infectious diseases | 5% | 1% | 10% |
Musculoskeletal | 40% | 14% | 78% |
Neurologic | 21% | 19% | 25% |
Oncologic | 10% | 1% | 20% |
Respiratory | 1% | 0% | 3% |
Trauma | 1% | 0% | 1% |
Other | 0% | 0% | 0% |
Table 8: Saskatchewan MRI Usage Rates and Ranges by Clinical Specialty
Indication | Average usage rate | Minimum | Maximum |
|---|---|---|---|
Cardiac | 4% | 0% | 15% |
Hepatobiliary or gastrointestinal | 15% | 10% | 20% |
Inflammatory or infectious diseases | 9% | 2% | 19% |
Musculoskeletal | 21% | 15% | 30% |
Neurologic | 32% | 19% | 52% |
Oncologic | 15% | 10% | 20% |
Respiratory | 1% | 0% | 2% |
Trauma | 3% | 0% | 5% |
Other | 0% | 0% | 0% |
Table 9: Alberta MRI Usage Rates and Ranges by Clinical Specialty
Indication | Average usage rate | Minimum | Maximum |
|---|---|---|---|
Cardiac | 0% | 0% | 0% |
Hepatobiliary or gastrointestinal | 0% | 0% | 0% |
Inflammatory or infectious diseases | 0% | 0% | 0% |
Musculoskeletal | 44% | 44% | 44% |
Neurologic | 52% | 52% | 52% |
Oncologic | 0% | 0% | 0% |
Respiratory | 0% | 0% | 0% |
Trauma | 0% | 0% | 0% |
Other | 4% | 4% | 4% |
Table 10: British Columbia MRI Usage Rates and Ranges by Clinical Specialty
Indication | Average usage rate | Minimum | Maximum |
|---|---|---|---|
Cardiac | 1% | 0% | 3% |
Hepatobiliary or gastrointestinal | 11% | 0% | 15% |
Inflammatory or infectious diseases | 7% | 0% | 15% |
Musculoskeletal | 24% | 10% | 50% |
Neurologic | 35% | 15% | 60% |
Oncologic | 17% | 0% | 25% |
Respiratory | 2% | 0% | 10% |
Trauma | 3% | 0% | 10% |
Other | 0% | 0% | 0% |
Table 11: Clinical Specialty Survey Respondent Characteristics
Province | Public sites with MRIs | Total Respondents | Urban | Rural | Remote |
|---|---|---|---|---|---|
Newfoundland and Labrador | 5 | 2 | 1 | 1 | 0 |
Nova Scotia | 9 | 3 | 2 | 1 | 0 |
New Brunswick | 8 | 3 | 2 | 1 | 0 |
Quebec | 60 | 10 | 8 | 1 | 1 |
Ontario | 79 | 18 | 14 | 4 | 0 |
Manitoba | 8 | 3 | 3 | 0 | 0 |
Saskatchewan | 6 | 5 | 5 | 0 | 0 |
Alberta | 18 | 1 | 1 | 0 | 0 |
British Columbia | 32 | 11 | 10 | 1 | 0 |
Total | 225 | 56 | 46 | 9 | 1 |
Notes: Survey response data on the average percentage of MRI use by discipline were available for 56 out of 225 sites across 9 of the 13 jurisdictions with MRI capacity. No data were available for Prince Edward Island, the Yukon, the Northwest Territories, or Nunavut.
Data were derived from the following survey question: “On average, what percentage of these exams fall into the following categories? The total percentage, expressed as a number, must add up to 100.” The following categories were offered: oncology, respiratory, hepatobiliary, musculoskeletal, inflammatory or infectious disease, neurologic, cardiac, trauma, and other.
Table 12: 2017 Clinical Indication MRI Survey Response Data
Indication | N | Mean | Minimum to Maximum |
|---|---|---|---|
Cardiac | 34 | 3.5 | 0 to 35 |
Hepatobiliary | 34 | 11.3 | 0 to 25 |
Inflammatory or infectious diseases | 34 | 0 | 0 to 0 |
Lymphatic | 34 | 0 | 0 to 0 |
Musculoskeletal | 34 | 27.3 | 0 to 70 |
Neurologic | 34 | 25.4 | 0 to 45 |
Oncologic | 34 | 20.8 | 0 to 100 |
Respiratory | 34 | 3.1 | 0 to 24 |
Thyroid | 34 | 0 | 0 to 0 |
Trauma | 34 | NA | NA |
Other | 34 | 7.1 | 0 to 100 |
Note: Data derived from survey question: “Based on your experience in the last fiscal year, what is the average percentage of overall time [modality] units are used for?”
NA = not available.
Table 13: 2019–2020 Clinical Indication MRI Survey Response Data
Indication | N | Mean | Minimum to Maximum |
|---|---|---|---|
Cardiac | 71 | 3.6 | 0 to 98 |
Hepatobiliary | 71 | 12.3 | 0 to 30 |
Inflammatory or infectious diseases | 71 | 0 | 0 to 0 |
Lymphatic | 71 | 0 | 0 to 0 |
Musculoskeletal | 71 | 28.6 | 0 to 70 |
Neurologic | 71 | 28.6 | 0 to 55 |
Oncologic | 71 | 18.4 | 0 to 100 |
Respiratory | 71 | 3.6 | 0 to 24 |
Thyroid | 71 | 0 | 0 to 0 |
Trauma | 71 | 1.4 | 0 to 15 |
Other | 71 | 3.4 | 0 to 31 |
Note: Data derived from survey question: “Based on your experience in the last fiscal year, what is the average percentage of overall time [modality] units are used for?”
Table 14: 2022–2023 Clinical Indication MRI Survey Response Data
Indication | N | Mean | Minimum to Maximum |
|---|---|---|---|
Cardiac | 56 | 3.7 | 0 to 90 |
Hepatobiliary | 56 | 12.3 | 0 to 30 |
Inflammatory or infectious diseases | 56 | 5.7 | 0 to 25 |
Lymphatic | 56 | NA | NA |
Musculoskeletal | 56 | 26.1 | 0 to 78 |
Neurologic | 56 | 29.5 | 0 to 100 |
Oncologic | 56 | 16.8 | 0 to 50 |
Respiratory | 56 | 2.3 | 0 to 20 |
Thyroid | 56 | NA | NA |
Trauma | 56 | 2.6 | 0 to 25 |
Other | 56 | 1.0 | 0 to 16 |
NA = not available.
ISSN: 2563-6596
Canada’s Drug Agency (CDA-AMC) is a pan-Canadian health organization. Created and funded by Canada’s federal, provincial, and territorial governments, we’re responsible for driving better coordination, alignment, and public value within Canada’s drug and health technology landscape. We provide Canada’s health system leaders with independent evidence and advice so they can make informed drug, health technology, and health system decisions, and we collaborate with national and international partners to enhance our collective impact.
Disclaimer: CDA-AMC has taken care to ensure that the information in this document was accurate, complete, and up to date when it was published, but does not make any guarantee to that effect. Your use of this information is subject to this disclaimer and the Terms of Use at cda-amc.ca.
The information in this document is made available for informational and educational purposes only and should not be used as a substitute for professional medical advice, the application of clinical judgment in respect of the care of a particular patient, or other professional judgments in any decision-making process. You assume full responsibility for the use of the information and rely on it at your own risk.
CDA-AMC does not endorse any information, drugs, therapies, treatments, products, processes, or services. The views and opinions of third parties published in this document do not necessarily reflect those of CDA-AMC. The copyright and other intellectual property rights in this document are owned by the Canadian Agency for Drugs and Technologies in Health (operating as CDA-AMC) and its licensors.
Questions or requests for information about this report can be directed to Requests@cda-amc.ca.