Drugs, Health Technologies, Health Systems
Health Technology Review
MRI Service Delivery in Canada: Units, Exam Volumes, and Medical Radiation Technologist Staffing
Key Messages
What Is the Issue?
Canada’s Drug Agency (CDA-AMC) received a request to explore the relationship between full-time equivalent (FTE) medical radiation technologists (MRTs) and MRI exam volumes nationwide.
Workforce availability — particularly the number of MRTs — has been identified as a key factor that may impact the delivery of MRI services.
Although a recent study examined this relationship within a single province, no national-level research has explored how MRT staffing relates to MRI exam volumes across Canada.
Understanding this relationship could help inform operational planning for jurisdictions and health care facilities, particularly in aligning workforce capacity with service demand.
What Did We Do?
CDA-AMC analyzed site and unit-level data gathered through the 2022–2023 Canadian Medical Imaging Inventory (CMII) National Survey.
The goal was to examine the relationship between the number of FTE MRTs per MRI unit and the average annual volume of MRI exams.
To ensure comparability across facilities, sites were grouped based on the number of MRI units onsite.
What Did We Find?
At a national level, most sites (69%) reported 4 or more FTE MRTs per MRI unit.
This trend was consistent across sites with 1 to 3 MRI units.
Among the 3 sites with 4 or more MRI units, 2 reported having 3 FTE MRTs per unit.
On average, sites with higher numbers of FTE MRTs per MRI unit tended to perform more exams annually.
Although higher staffing levels are associated with greater exam volumes, throughput is also influenced by a range of other factors, including exam complexity, research and teaching use, scheduling models, and broader policy and funding decisions, that shape how MRI services are delivered.
What Does This Mean?
This report provides the first national-level evidence-based analysis to support workforce planning for MRI service delivery. These findings can help decision-makers in the following ways:
to estimate appropriate staffing levels by showing how staffing needs change based on factors such as site size and exam volume
to demonstrate the operational impact of adequate staffing, with higher staffing levels correlated with increased annual exam performance, suggesting that well-staffed medical imaging departments are better positioned to meet demand
to guide more informed planning at both individual facility and health system levels, especially when considering expansion or resource reallocation.
Context
Canada’s Drug Agency (CDA-AMC) received a request to explore the relationship between full-time equivalent (FTE) medical radiation technologists (MRTs) and MRI units and exam volumes nationwide. There have been no recent studies examining the relationship between these factors at a national level, but there was a study that examined the relationship between these factors within an individual province.1
MRTs play an integral role in ensuring MRI exams are completed in a safe and efficient manner.1-5 They perform critical technical tasks, such as patient positioning and equipment operation, while also ensuring patient comfort, reassurance, and safety throughout the procedure.6,7 Workforce constraints, particularly shortages of qualified MRTs, have frequently been cited as a barrier to improving MRI access across Canada.8,9
A 2024 study examined MRT trends with respect to MRI exam volumes from 2003 to 2020 in Ontario. This study found that although the approximate number of MRTs per MRI unit did not change over that time, the number of exams completed per MRI unit had greatly increased.1 The authors suggest this increase is due to an expansion of after-hours examinations and it is possible overall efficiency may have also improved over time, but it also reinforces the continued need for adequate staffing to maintain the higher exam volumes. However, the study aggregated per capita volumes without a detailed examination of site characteristics, such as the average annual exams completed at a site or the number of MRI units onsite, which limits its generalizability beyond the provincial context.1
With access to site and unit-level data collected from the 2022–2023 Canadian Medical Imaging Inventory (CMII) National Survey, CDA-AMC is uniquely positioned to provide a broader, national perspective.5,10 This report aims to fill an evidence gap by analyzing how MRT staffing levels relate to MRI exam volumes and unit capacity across jurisdictions. These findings can support more tailored and data-driven decisions about workforce planning and operational resourcing for the specific needs and scale of individual imaging sites.
Objectives
This report examines the relationship between the average annual volume of MRI exams per unit and the number of FTE MRTs per unit.
Data are presented at both the national and jurisdictional levels.
Findings are grouped according to the number of MRI units per site to ensure comparability across different facility sizes.
Methods
This report is based on data gathered through the 2022–2023 CMII National Survey conducted by CDA-AMC, with each province and territory represented where applicable. Participating sites provided information on:
the number of operational MRI units per facility
the average number of MRI exams completed annually
the number of budgeted FTEs for MRTs.
An imaging exam in this report is considered to be a single medical imaging session using an MRI unit to study 1 (or more) body structure or system or anatomic area, resulting in 1 or more images for diagnostic or therapeutic purposes.
The analysis includes data from 107 of 296 sites that submitted complete information on both average annual MRI exams and budgeted FTE MRTs (refer to Table 1 in Appendix 1).
Results were divided by the number of MRI units onsite to allow for greater comparability between similar-sized sites.
Average annual exams per unit were then analyzed across different numbers of FTE MRTs per unit.
Results
National patterns in the relationship between FTE MRTs per MRI unit and average annual exams per unit are presented, with results grouped by the number of MRI units per site to support meaningful comparisons across facilities of varying sizes. At a national level, most sites (74 of 107; 69%) reported 4 or more FTE MRTs per MRI units, and this trend was consistent across sites with 1 to 3 MRIs. Jurisdictional and national findings are detailed in Tables 1 to 5 in Appendix 1.
Overall, the data indicate that higher MRT staffing levels may be associated with greater exam throughput. However, throughput can also be influenced by a range of other factors, including exam complexity, research activity, local demand, available infrastructure, and broader policy and funding decisions, that shape how MRI services are organized and delivered.
It is possible that sites with multiple MRI units are predominantly located in urban centres where more complex or time-intensive exams are performed or where specific units are designated for research or instructional use. These factors may contribute to lower average exam volumes per unit despite a facility operating a larger number of scanners.
Pagebreak
Summary of MRI Exam Volumes and Staffing Levels: Sites With 1 MRI Unit
Sites with a single MRI unit represent the largest group in this analysis, accounting for 66% of the included facilities (71 of 107 sites). This reflects the broader landscape of MRI service delivery in Canada, where most health care facilities operate a single MRI unit. This is largely due to the significant capital and maintenance costs associated with MRI technology, along with space limitations, local demand, and available workforce.11,12
Using data from sites reporting annual average exams and budgeted FTE MRTs, the following key observations were made:
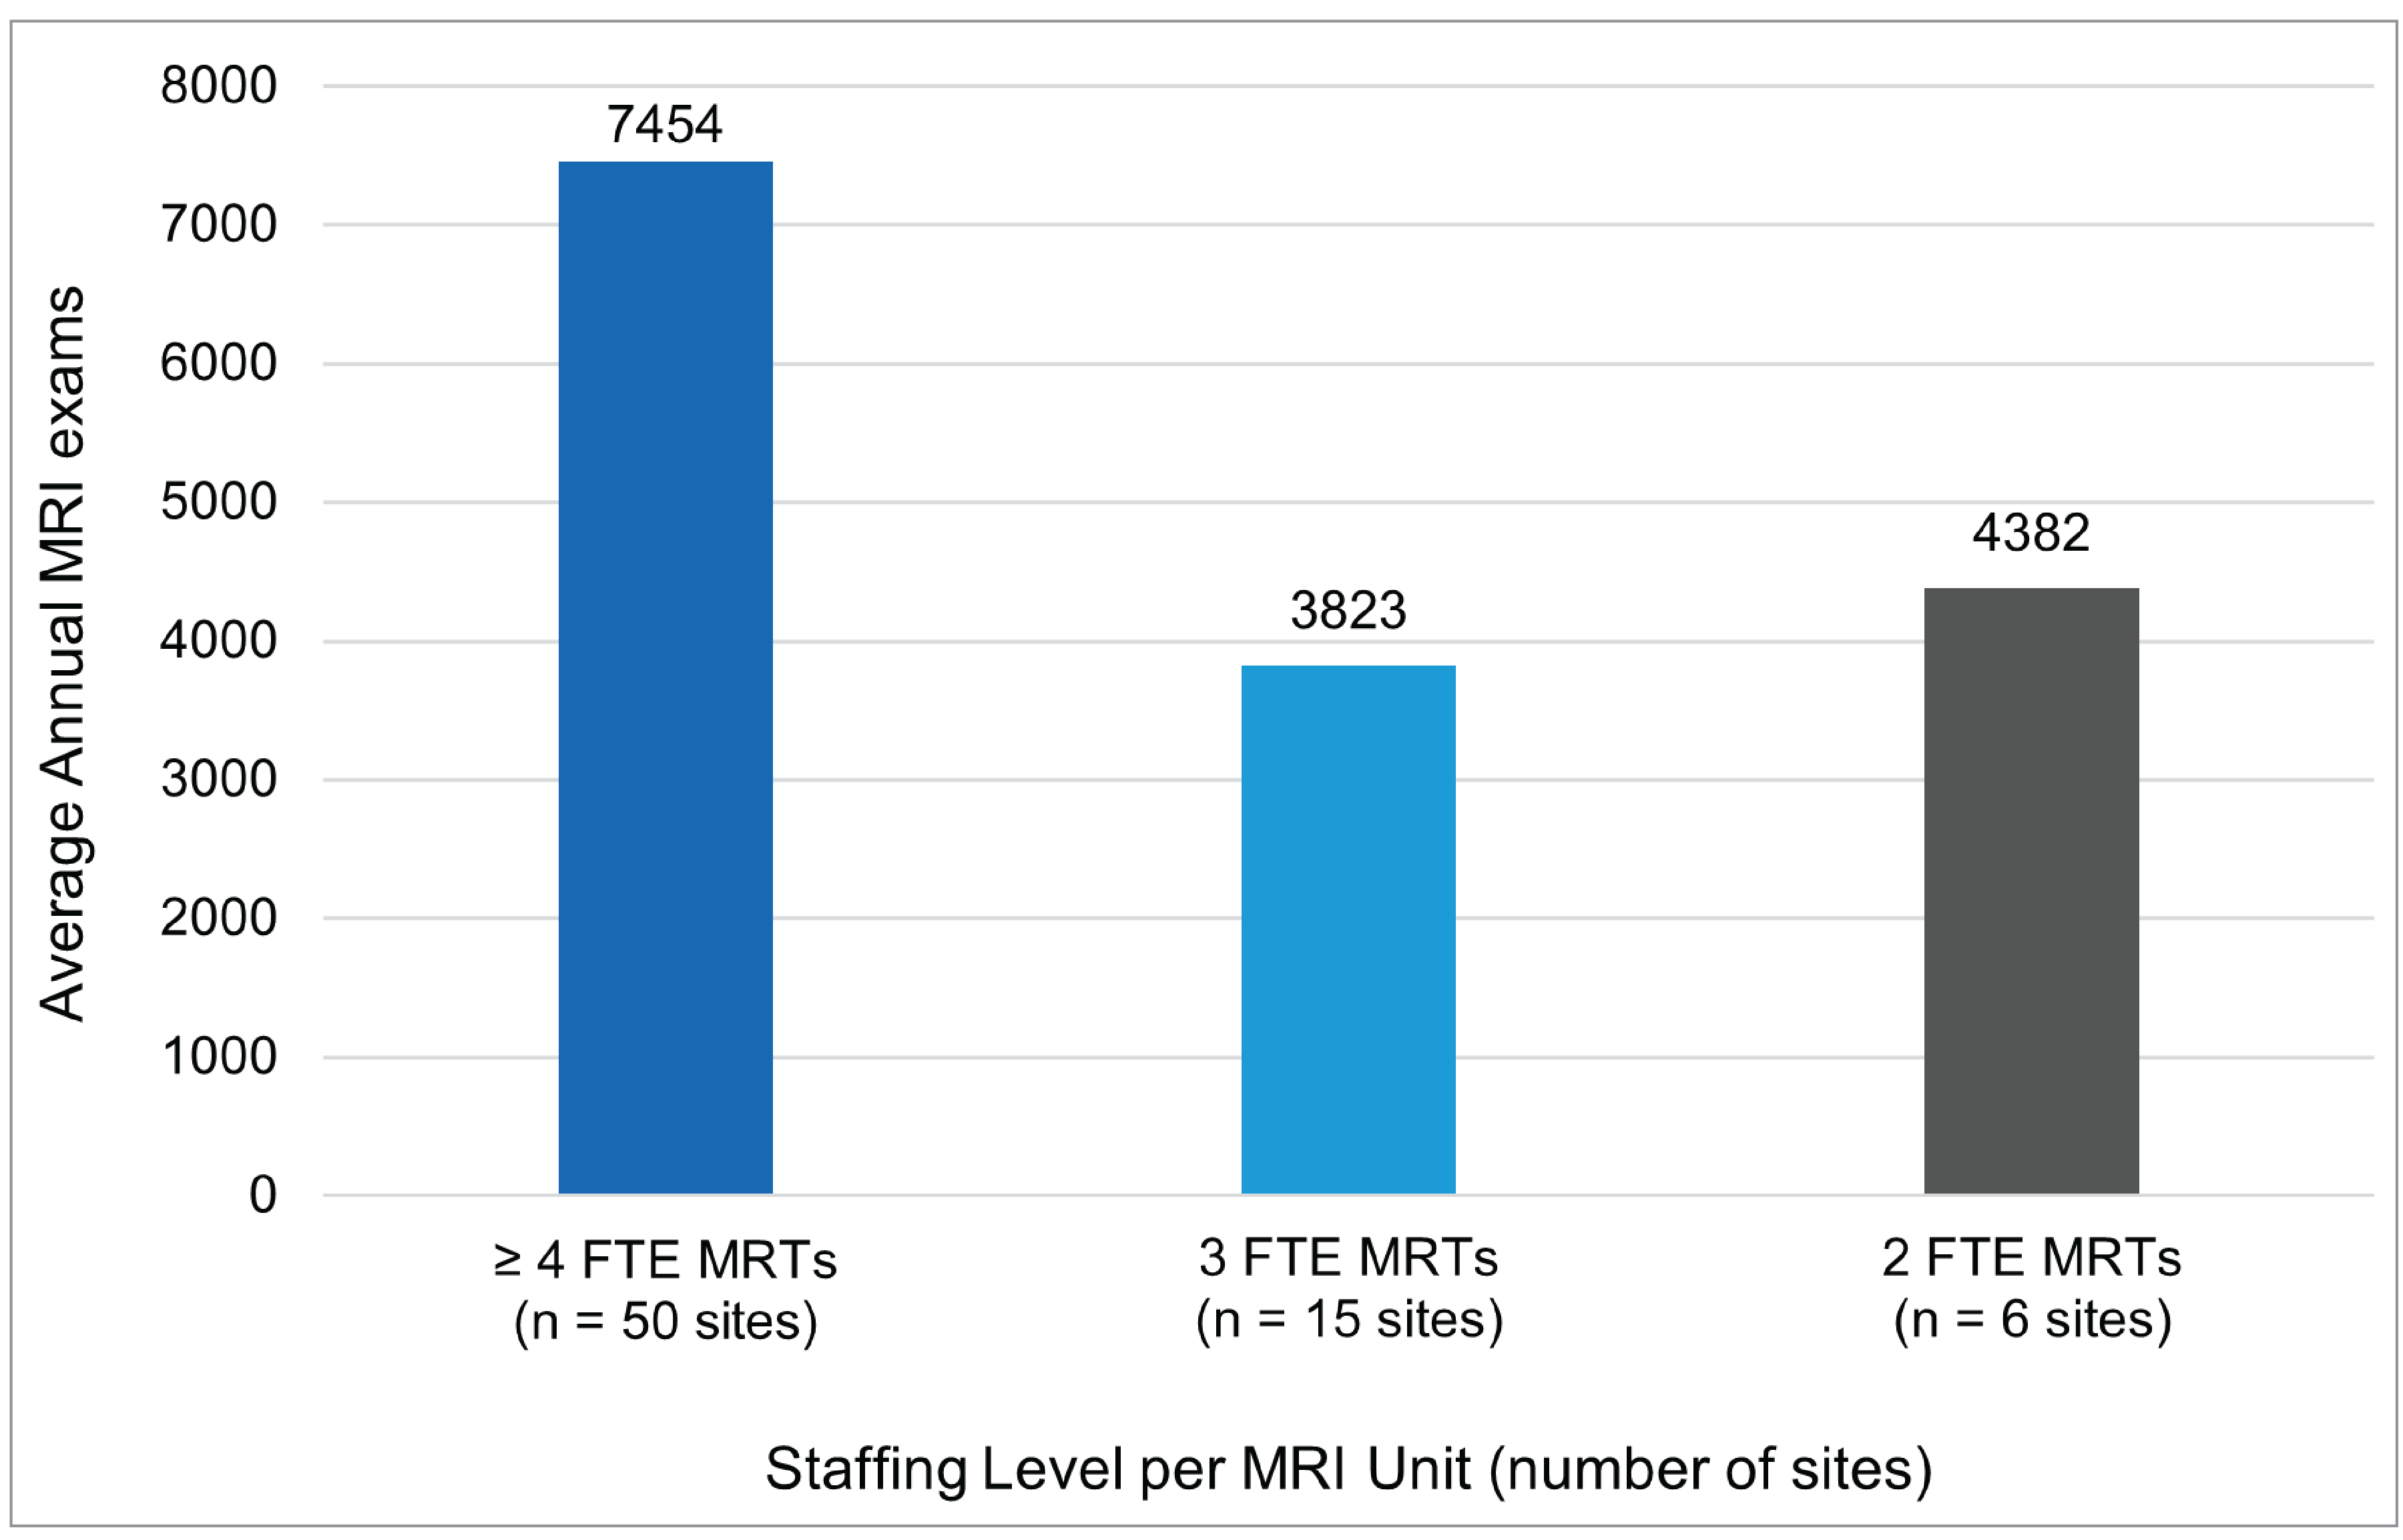
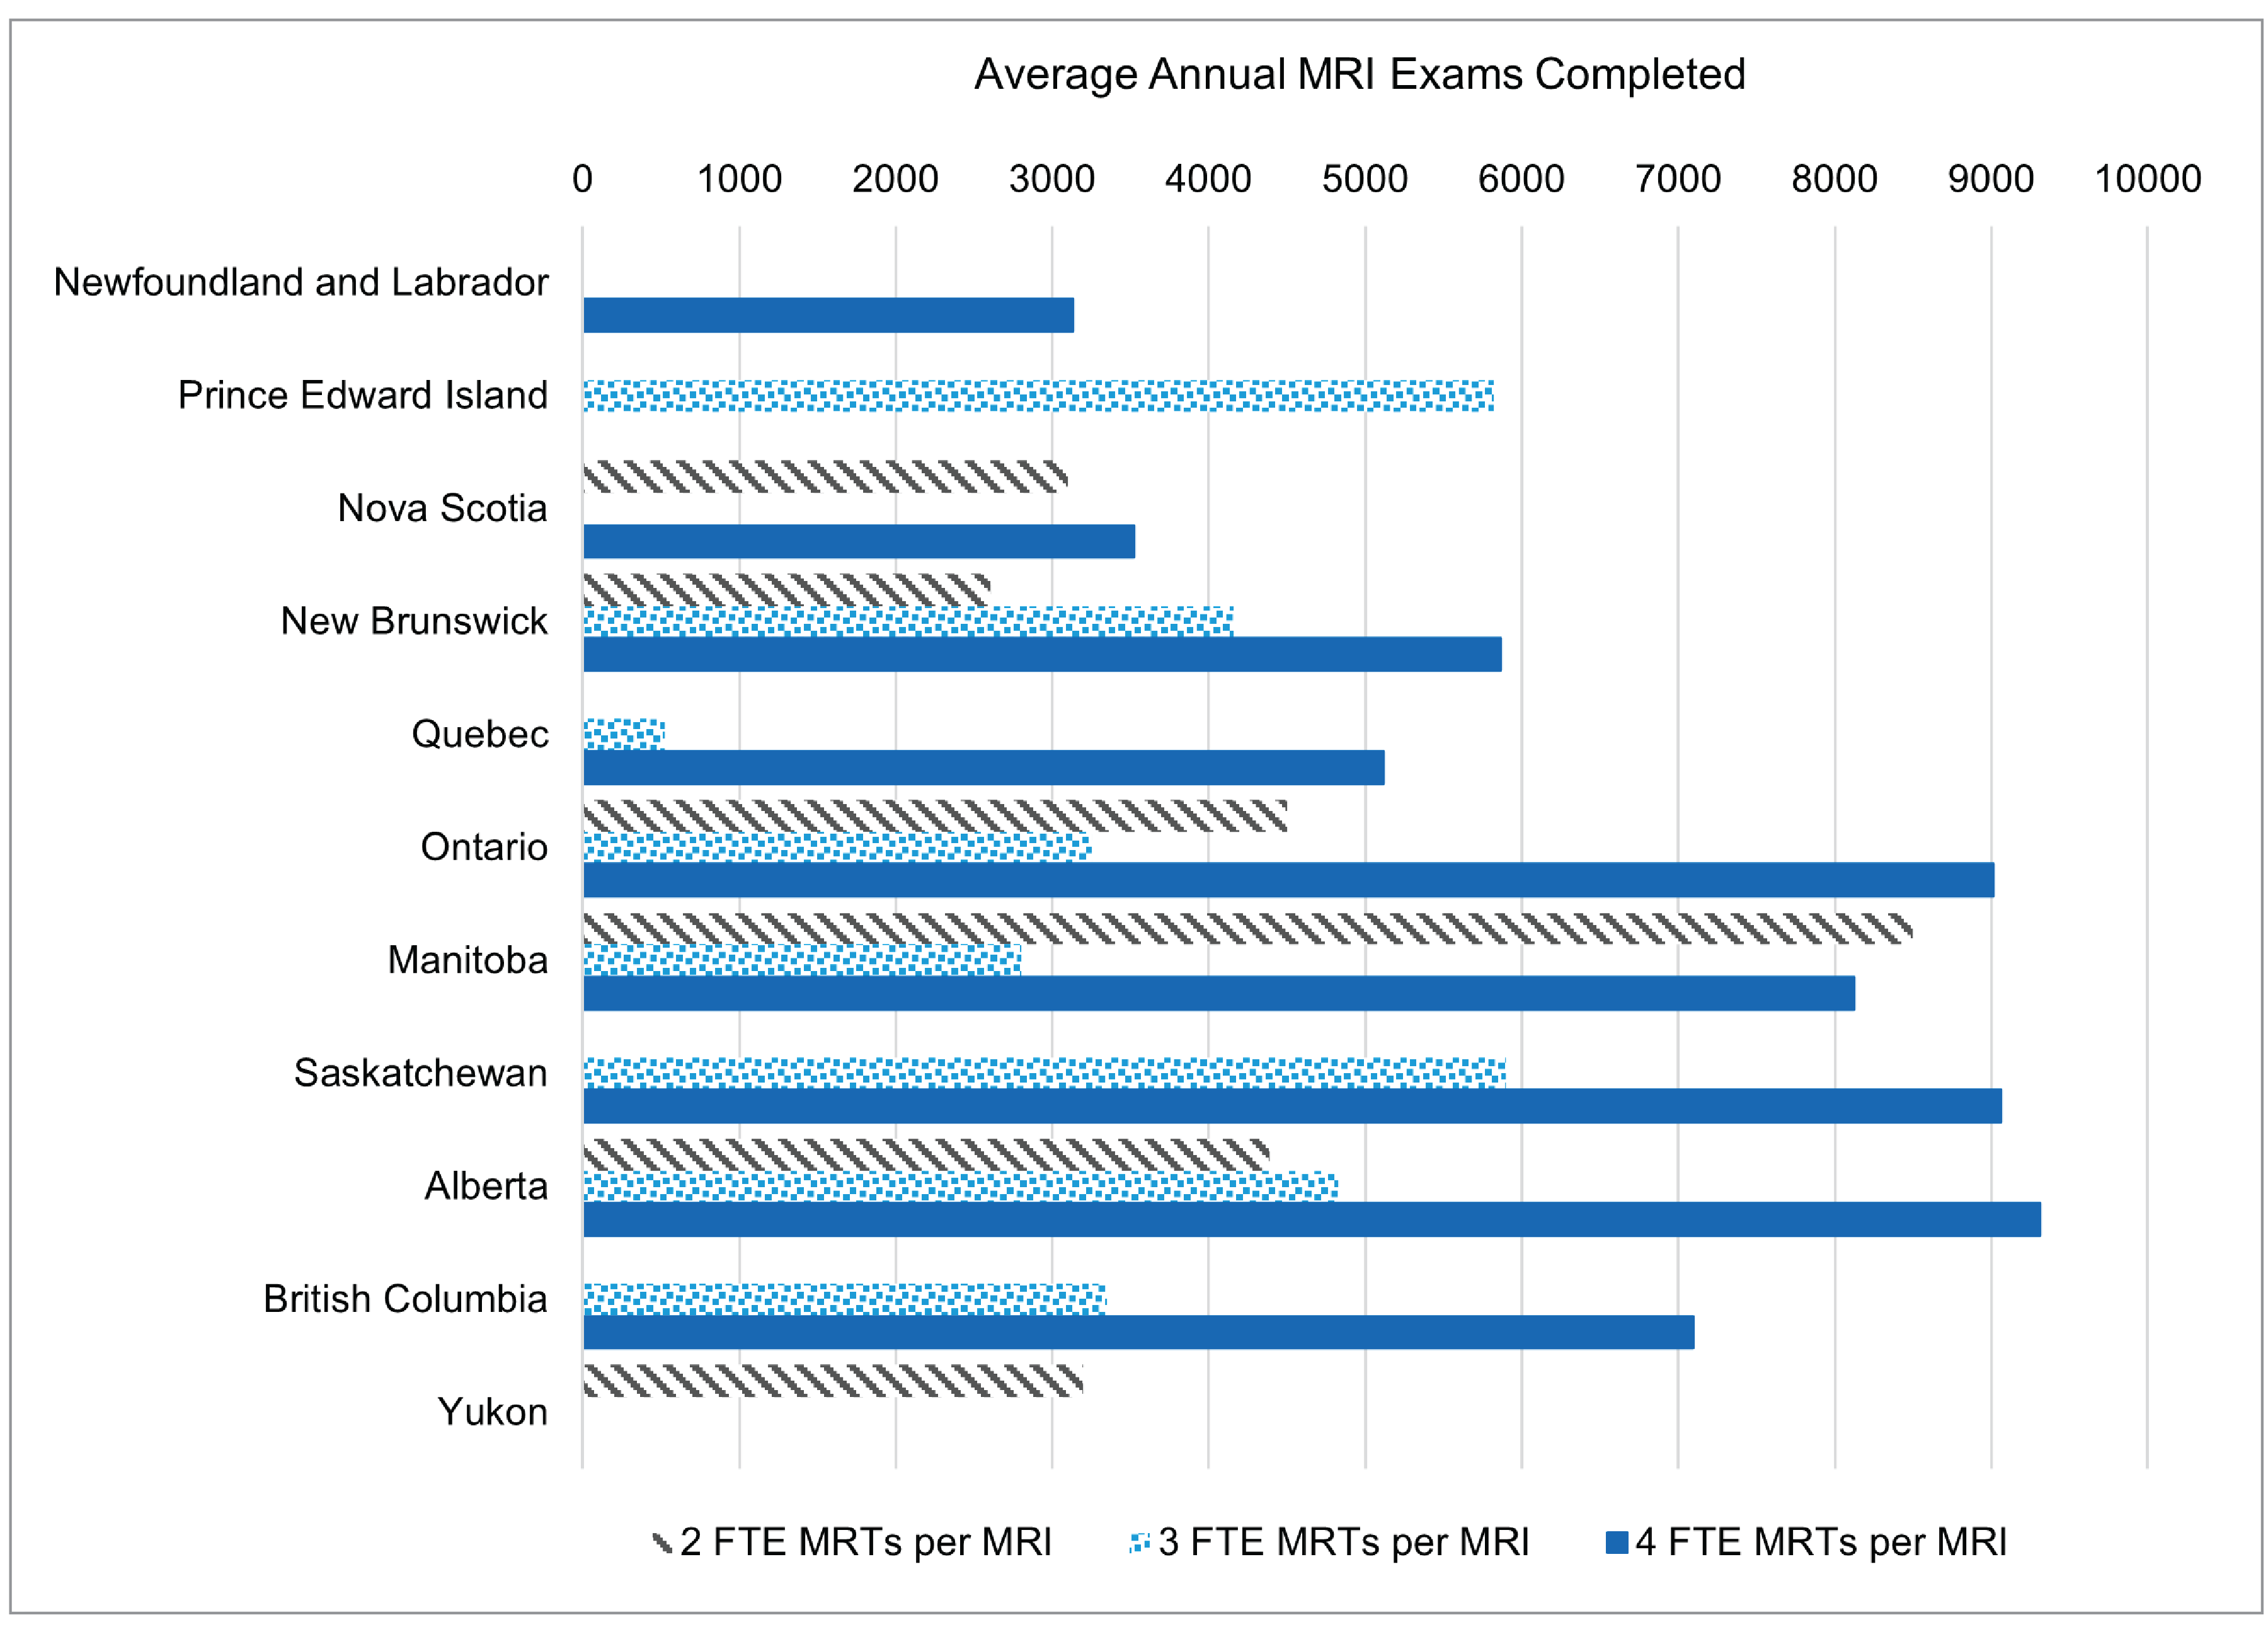
At a national level, 70% of sites (50 of 71 sites) with 1 MRI unit reported 4 or more FTE MRTs per MRI unit (refer to Figure 1 and Table 2 in Appendix 1).
On average, sites with 1 MRI unit reported the following exam volumes at a national level
4 or more FTE MRTs per unit = 7,454 exams
3 FTE MRTs per unit = 3,823 exams
2 FTE MRTs per unit = 4,382 exams
Among single-unit sites across jurisdictions, sites in Alberta with 4 or more FTE MRTs per MRI unit reported the highest average annual exam volume, at 9,312 exams.
Among sites with 1 MRI unit, sites with 4 or more FTE MRTs per unit performed substantially more annual exams than sites with fewer FTE MRTs per unit. A high outlier value for average annual exams at 1 site with 2 FTE MRTs per unit (out of 6 such sites) resulted in the national average of annual exams for these sites being higher than the national average annual exams at sites with 3 FTE MRTs per unit.
Figure 1: National Summary of MRI Exam Volumes and Staffing Levels for Sites With 1 MRI Unit
FTE = full-time equivalent; MRT = medical radiation technologist.
Summary of MRI Exam Volumes and Staffing Levels: Sites With 2 MRI Units
Sites with 2 MRI units represent 23% of those included in this report (25 of 107 sites). These sites are mostly concentrated in urban areas.10
Using data from sites reporting annual average exams and budgeted FTE MRTs, the following observations were made:
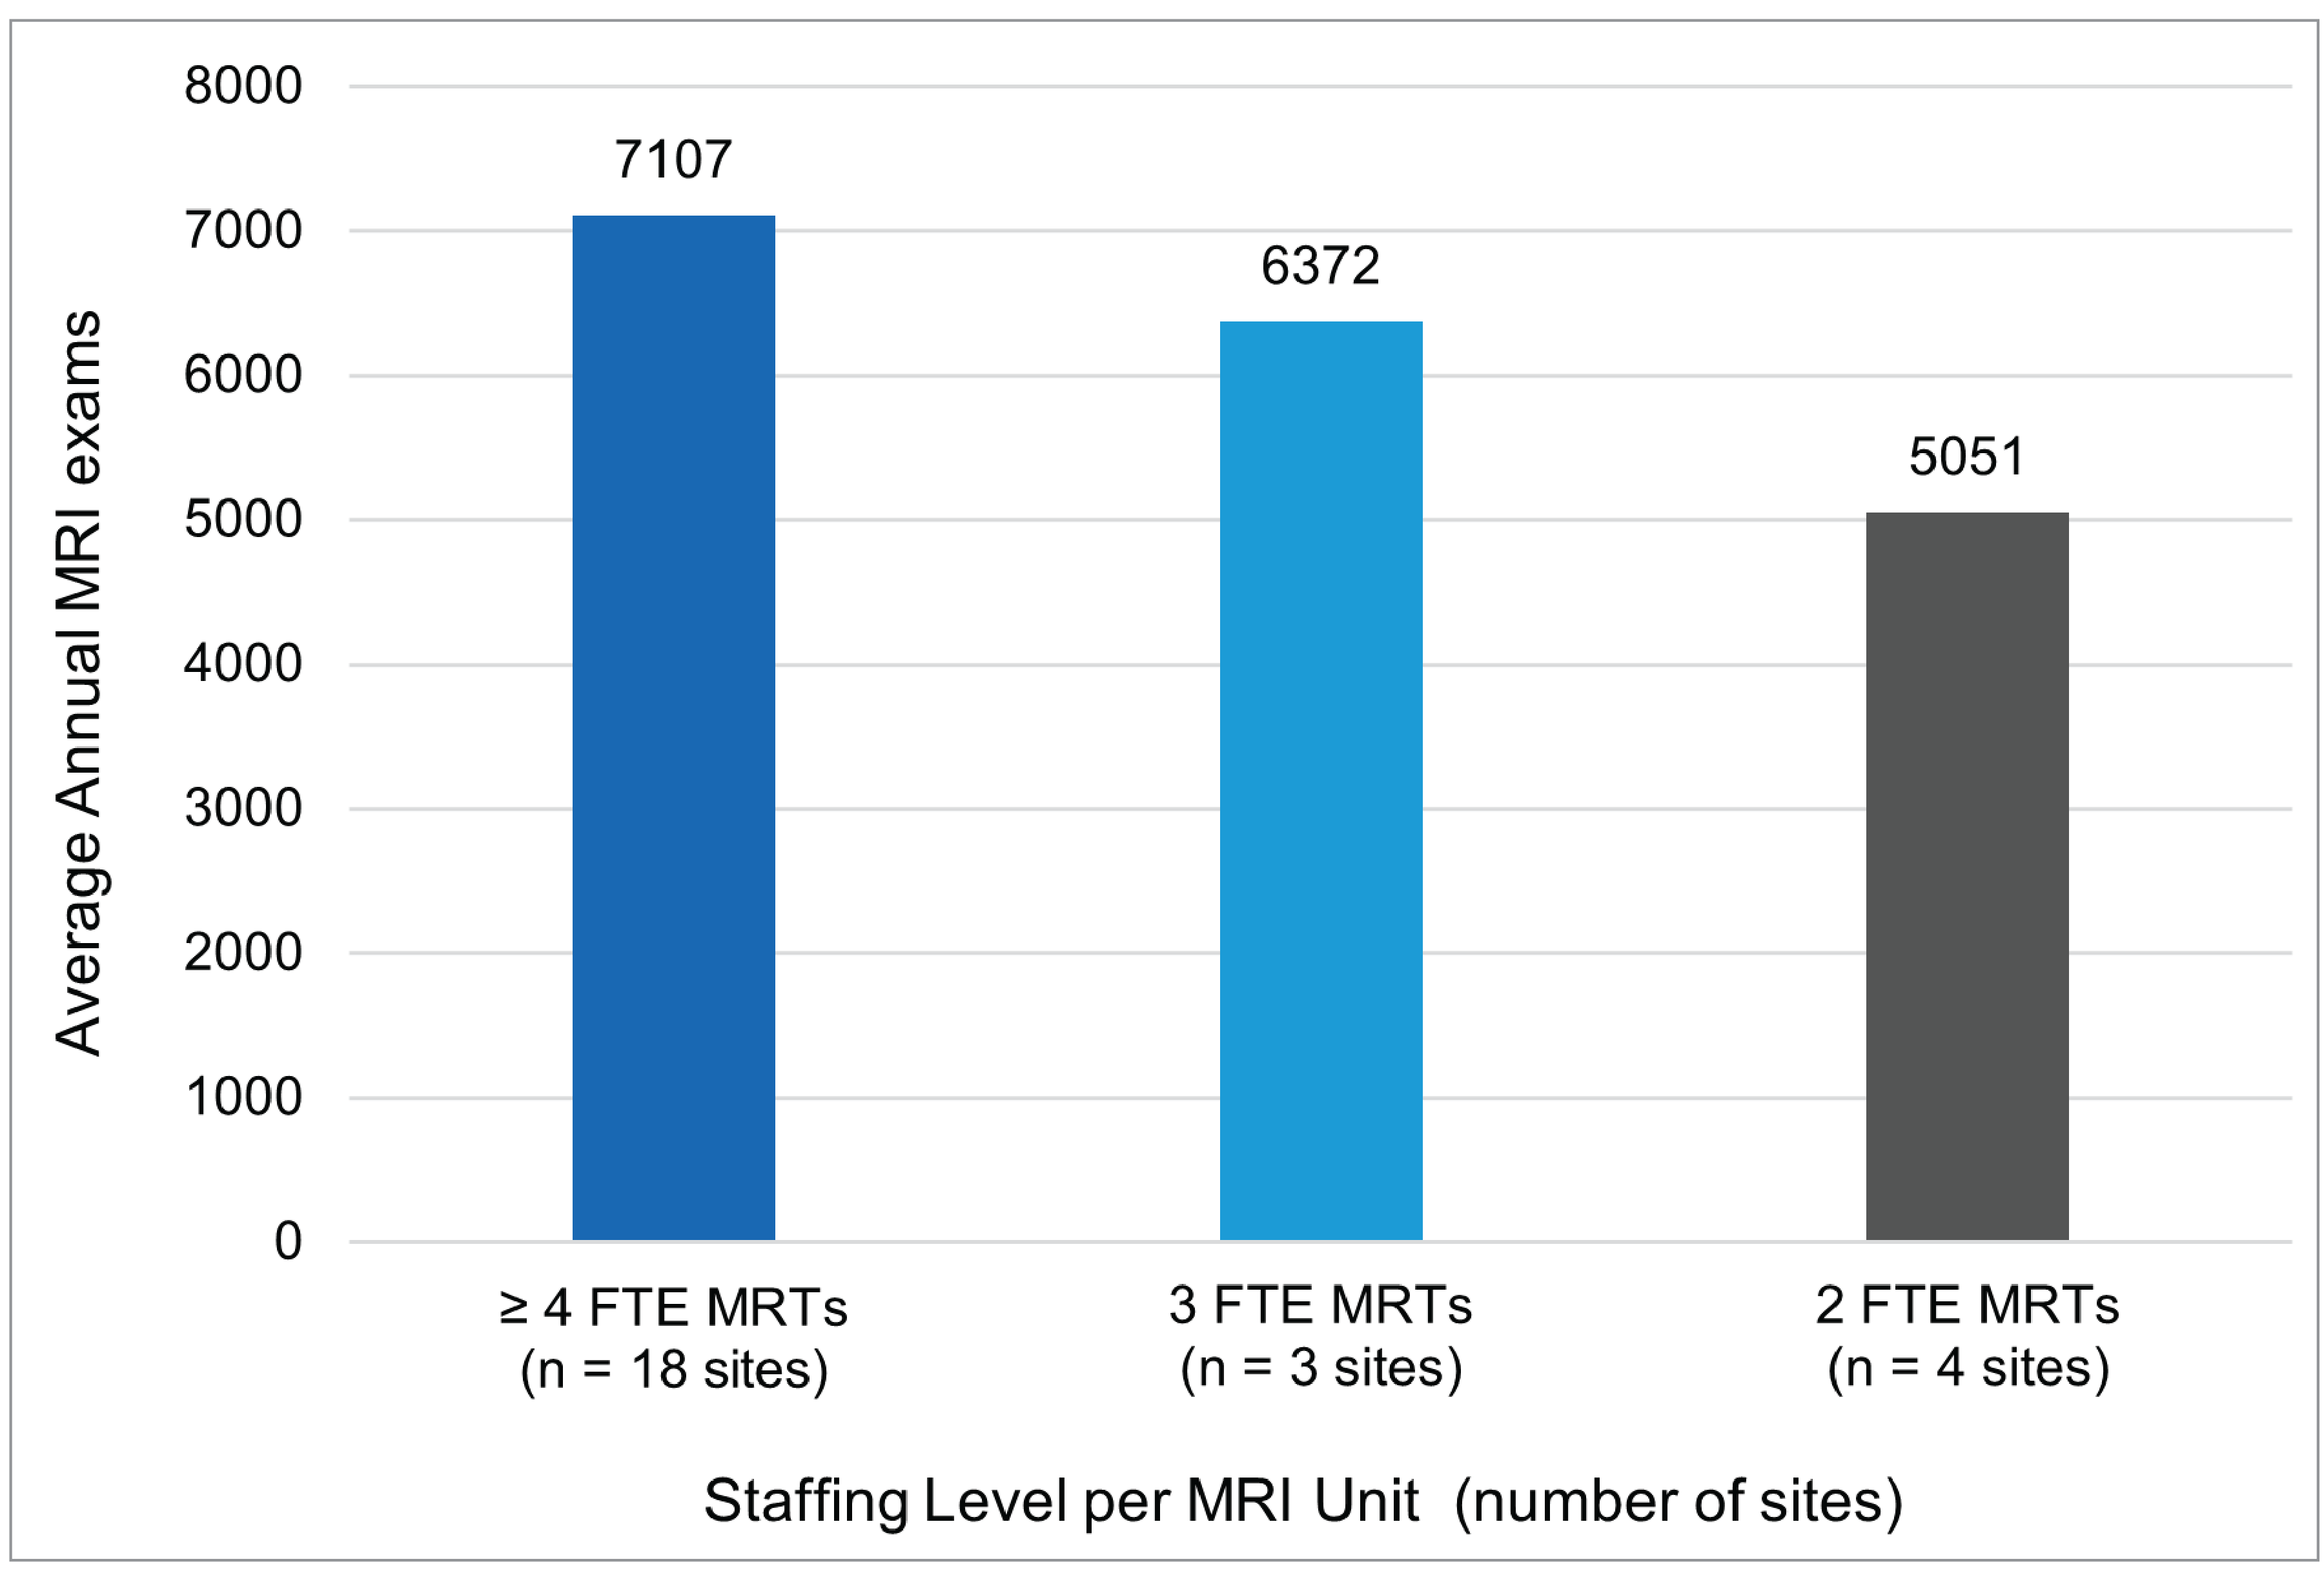
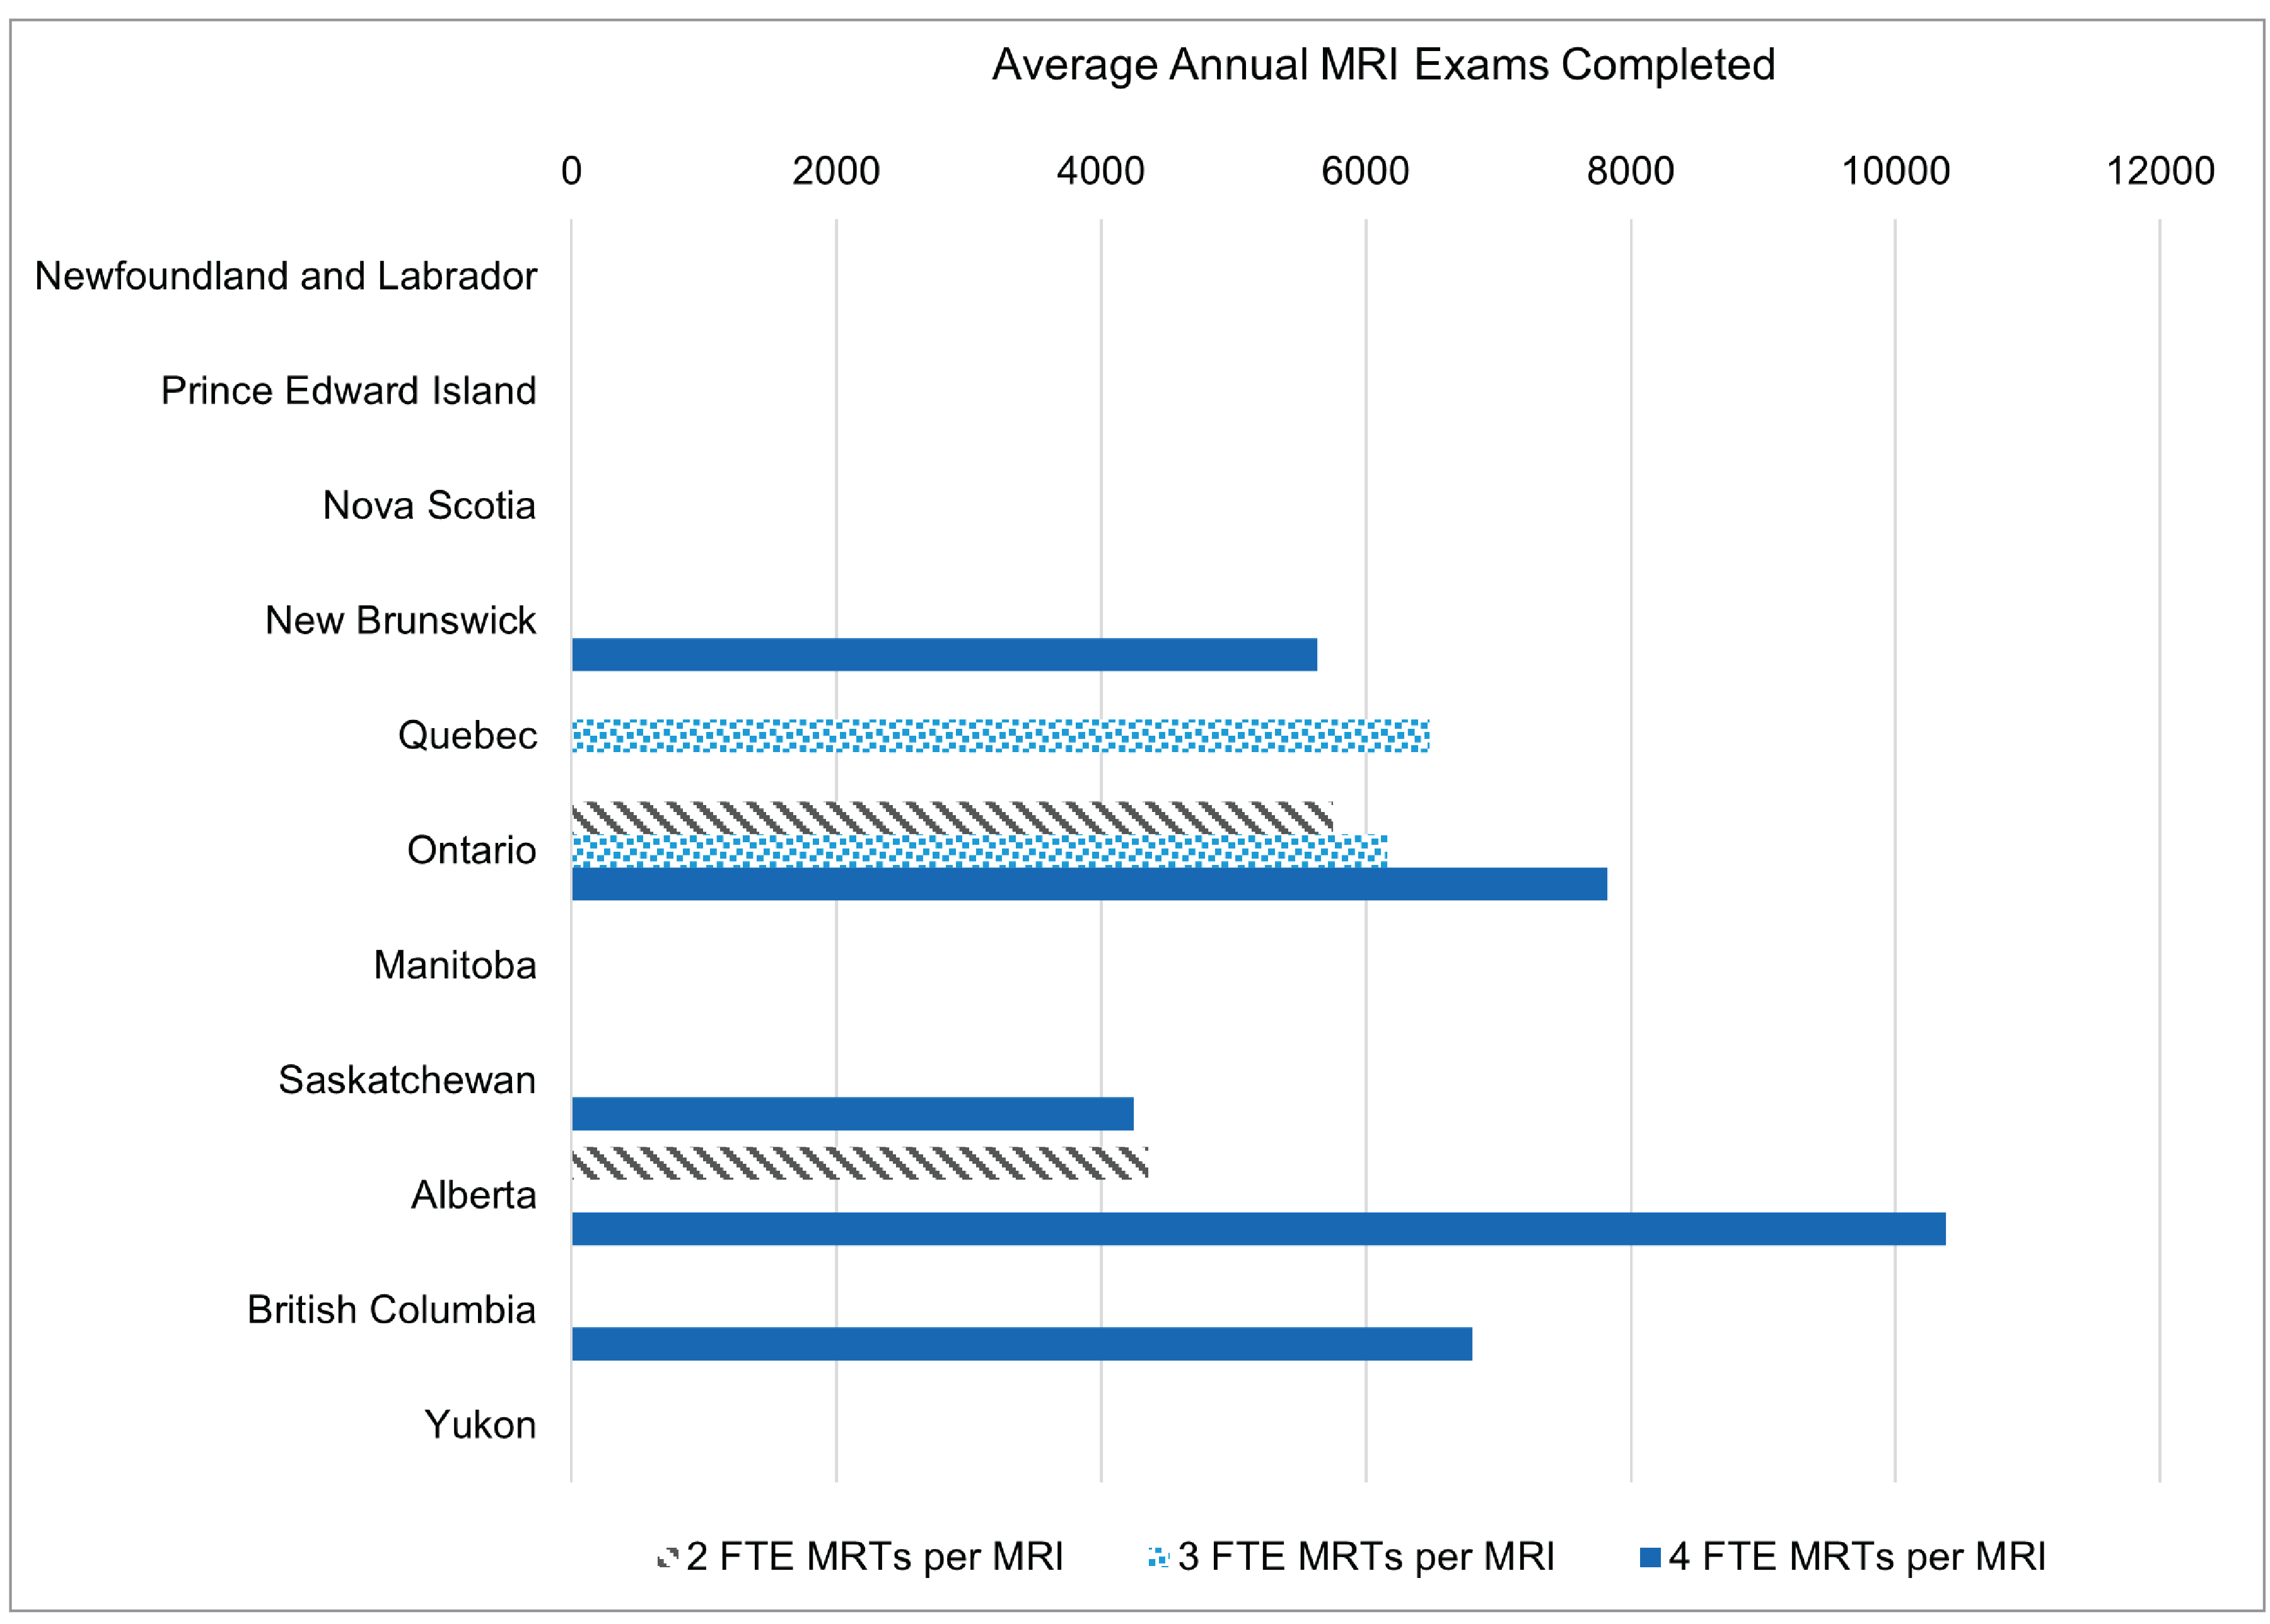
At a national level, 72% of sites (18 of 25 sites) with 2 MRI units reported 4 or more FTE MRTs per MRI unit (refer to Figure 2 and Table 3 in Appendix 1).
On average, sites with 2 MRI units reported the following exam volumes at the national level
4 or more FTE MRTs per unit = 7,107 exams
3 FTE MRTs per unit = 6,372 exams
2 FTE MRTs per unit = 5,051 exams
Among 2-unit sites across jurisdictions, a site in Alberta with 4 or more FTE MRTs per MRI unit reported the highest annual exam volume, at 10,379 exams.
There was a general association of higher MRT staffing levels per MRI unit and an increase in average annual exams completed across Canada. Although sites with 2 MRI units and 4 or more FTE MRTs per unit reported lower annual exam volumes than single MRI sites with 4 or more FTE MRTs per unit, this may reflect the greater complexity of exams at multiunit sites.
Figure 2: National Summary of MRI Exam Volumes and Staffing Levels for Sites With 2 MRI Units
FTE = full-time equivalent; MRT = medical radiation technologist.
Summary of MRI Exam Volumes and Staffing Levels: Sites With 3 MRI Units
Sites with 3 MRI units represent 7% of those included in this report (8 of 107 sites). These sites are mostly concentrated in large urban areas or regional hubs.10 Sites in these areas often serve as referral centres, managing complex exams for broader catchment areas while also meeting the clinical demands of their local metropolitan populations.
Using data from sites reporting annual average exams and budgeted FTE MRTs, the following observations were made:
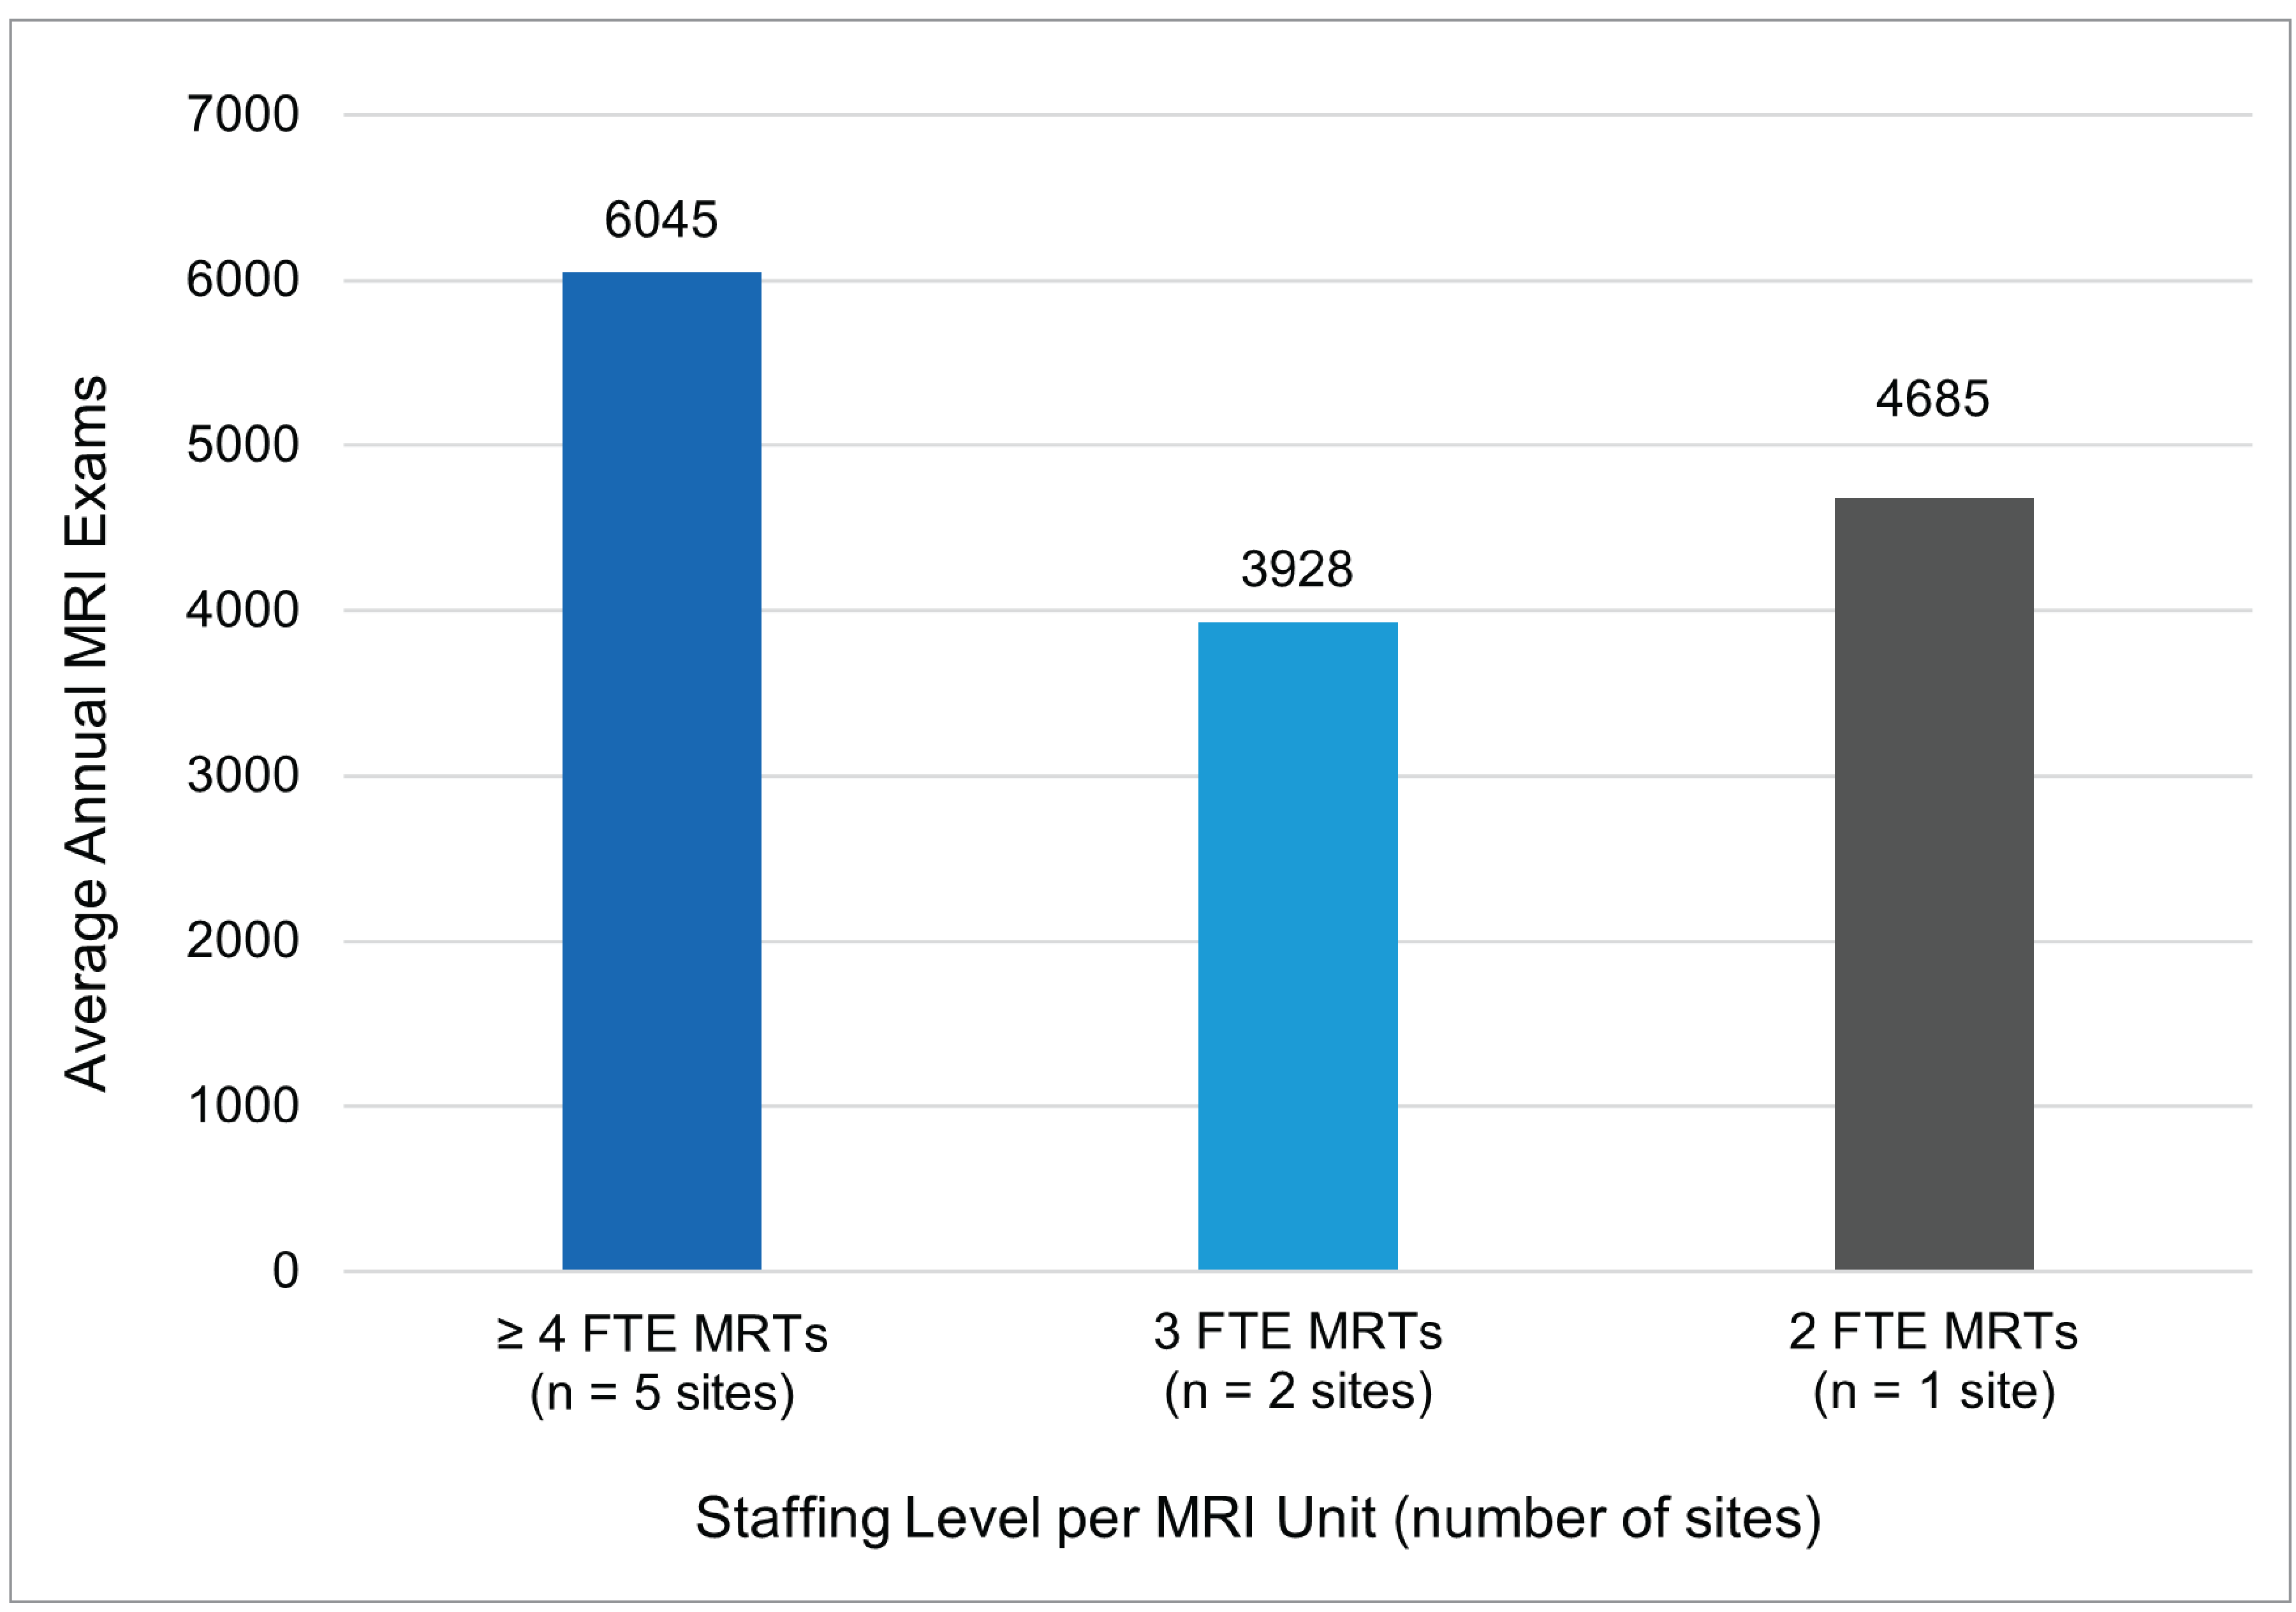
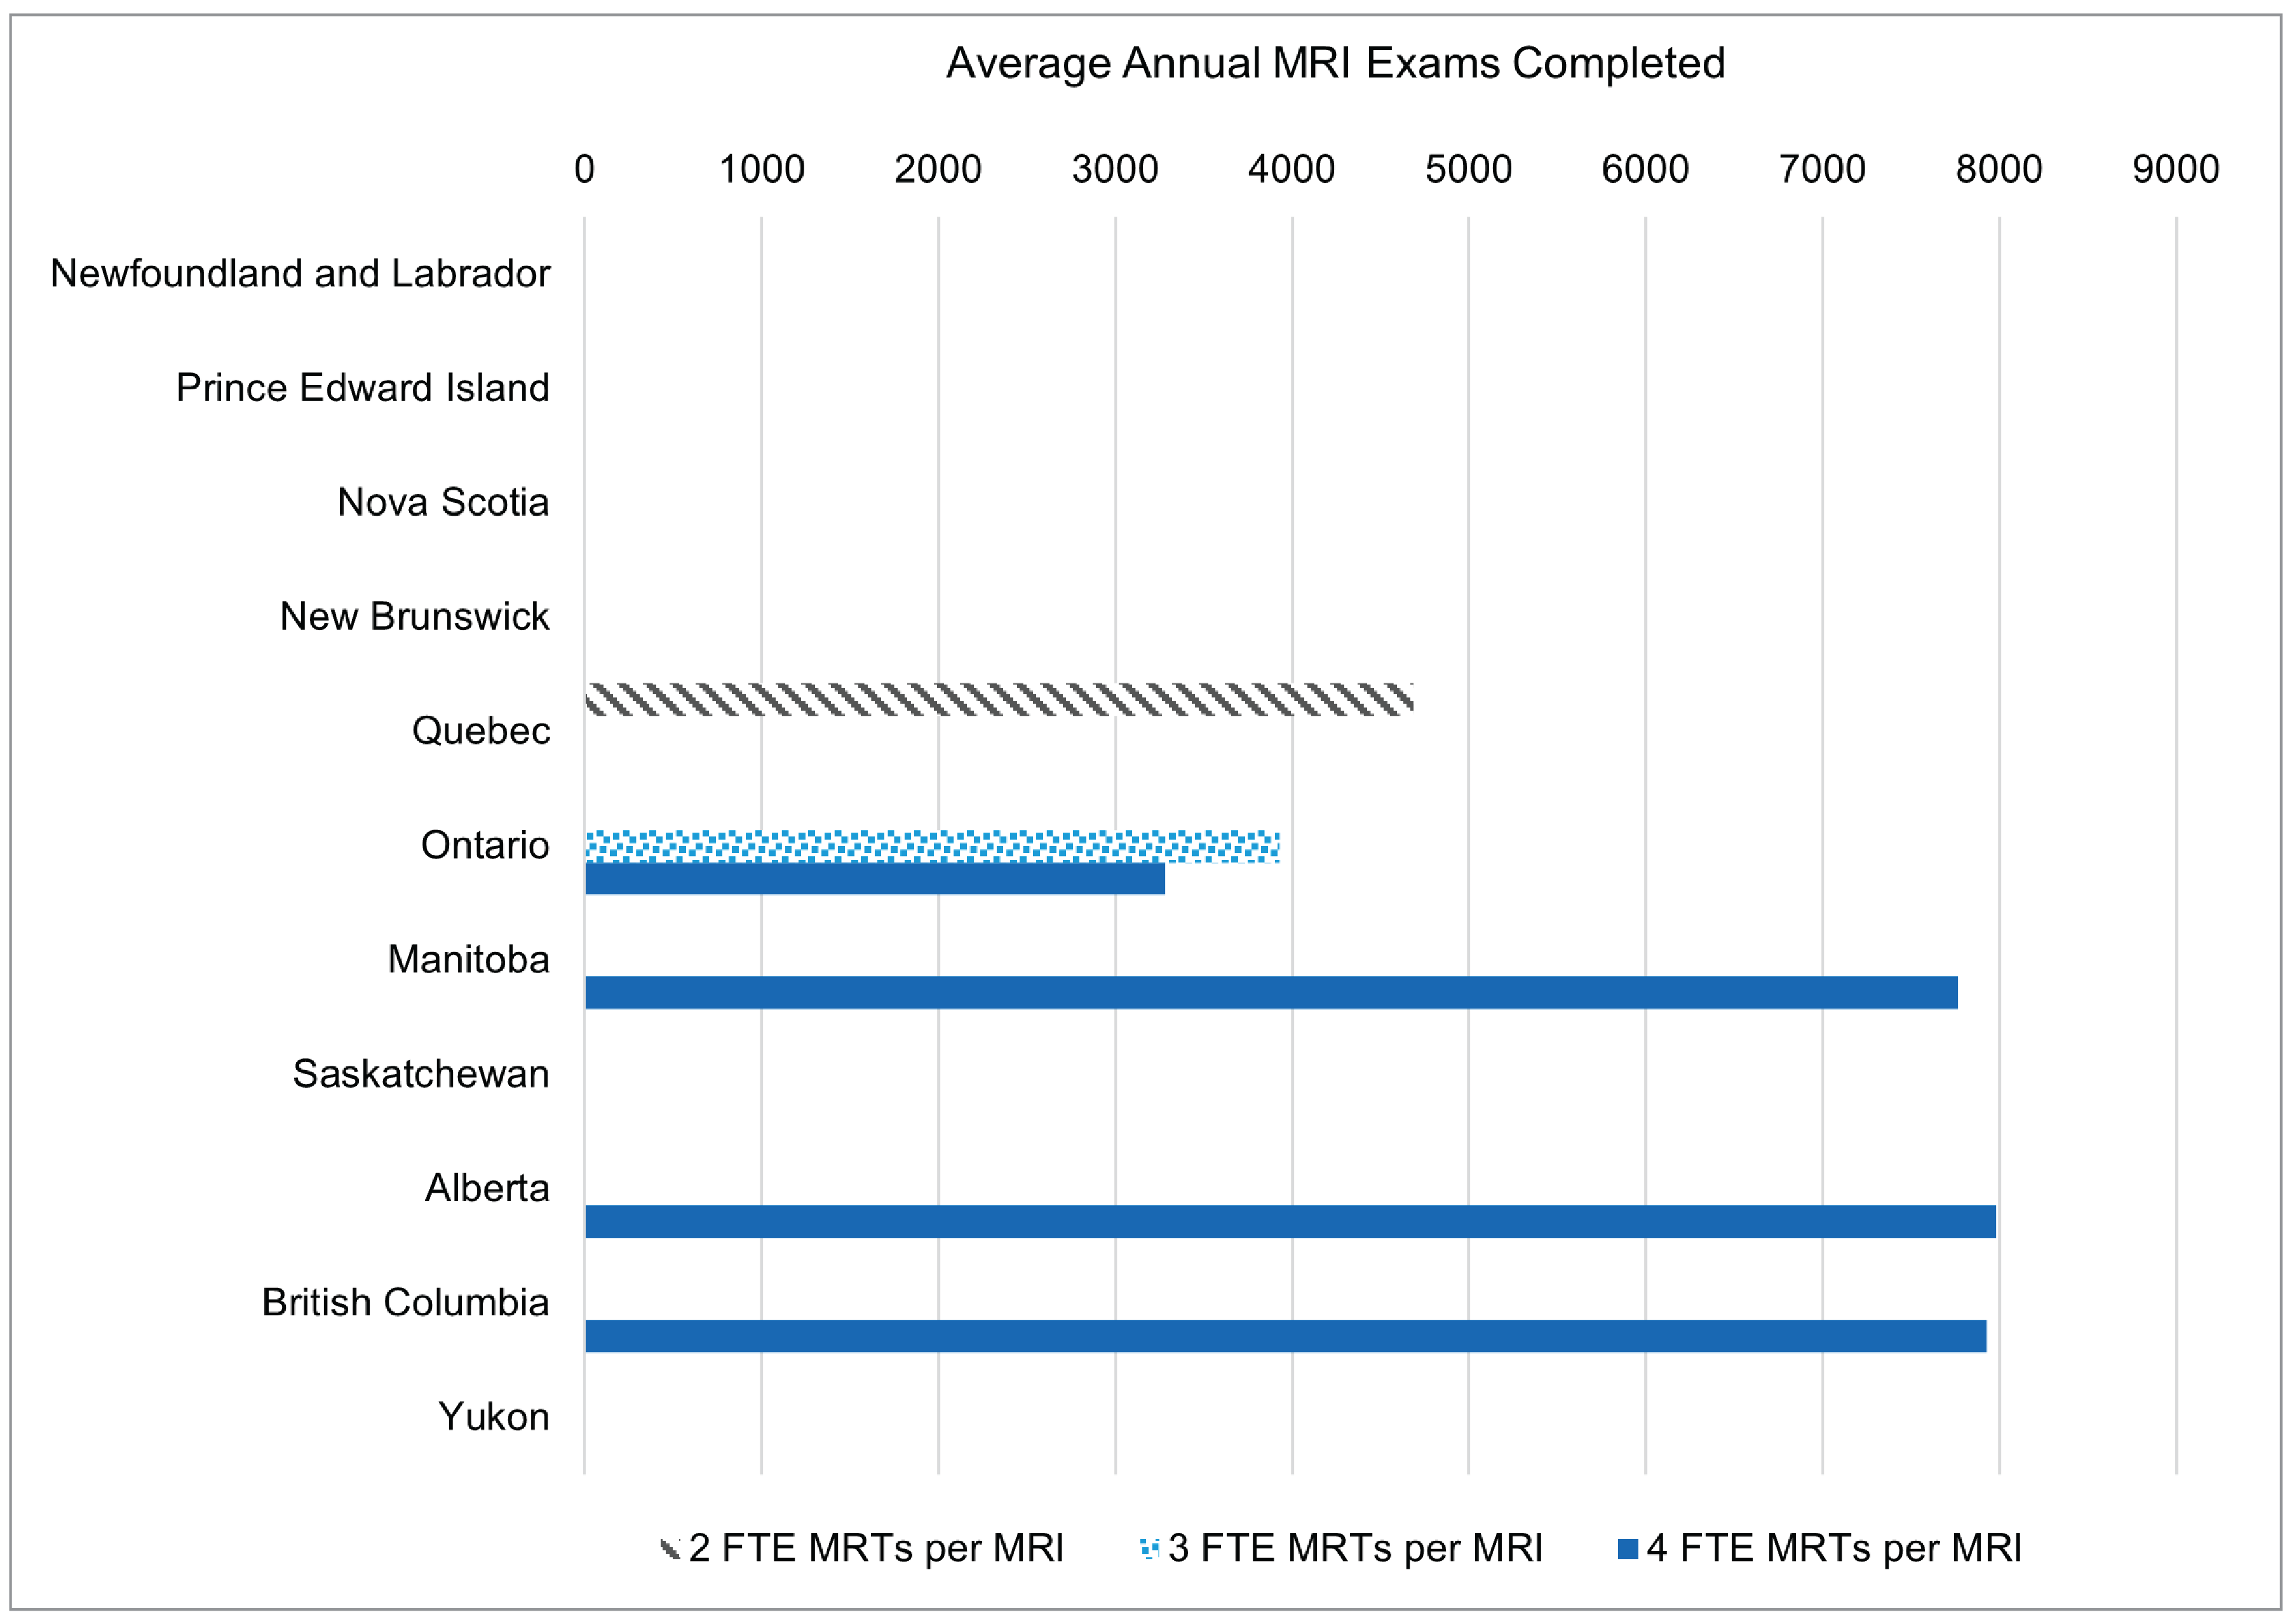
At a national level, 63% of sites (5 of 8) with 3 MRI units reported 4 or more FTE MRTs per MRI unit (refer to Figure 3 and Table 4 in Appendix 1).
On average, sites with 3 MRI units reported the following exam volumes at the national level
4 or more FTE MRTs per unit = 6,045 exams
3 FTE MRTs per unit = 3,928 exams
2 FTE MRTs per unit = 4,685 exams
Among 3-unit sites across jurisdictions, a site in Alberta with 4 or more FTE MRTs per unit reported the highest annual exam volume, at 7,980 exams.
Among sites with 3 MRI units, those staffed with 4 or more FTE MRTs per unit reported the highest average annual exam volumes, at 6,045 exams. Notably, sites with 3 MRTs per unit showed lower average volumes than the single site with 2 MRTs per unit, likely due to small sample size of sites with 3 MRI units. Additionally, different sites can vary based on factors such as exam complexity, machine availability, or operational constraints.
Figure 3: National Summary of MRI Exam Volumes and Staffing Levels for Sites With 3 MRI Units
FTE = full-time equivalent; MRT = medical radiation technologist.
Summary of MRI Exam Volumes and Staffing Levels: Sites With 4 or More MRI Units
Sites with 4 or more MRI units represent 3% of those included in this report (3 of 107 sites). These sites comprise some of the largest hospitals in Canada.
Using data from sites reporting annual average exams and budgeted FTE MRTs, the following observations were made:
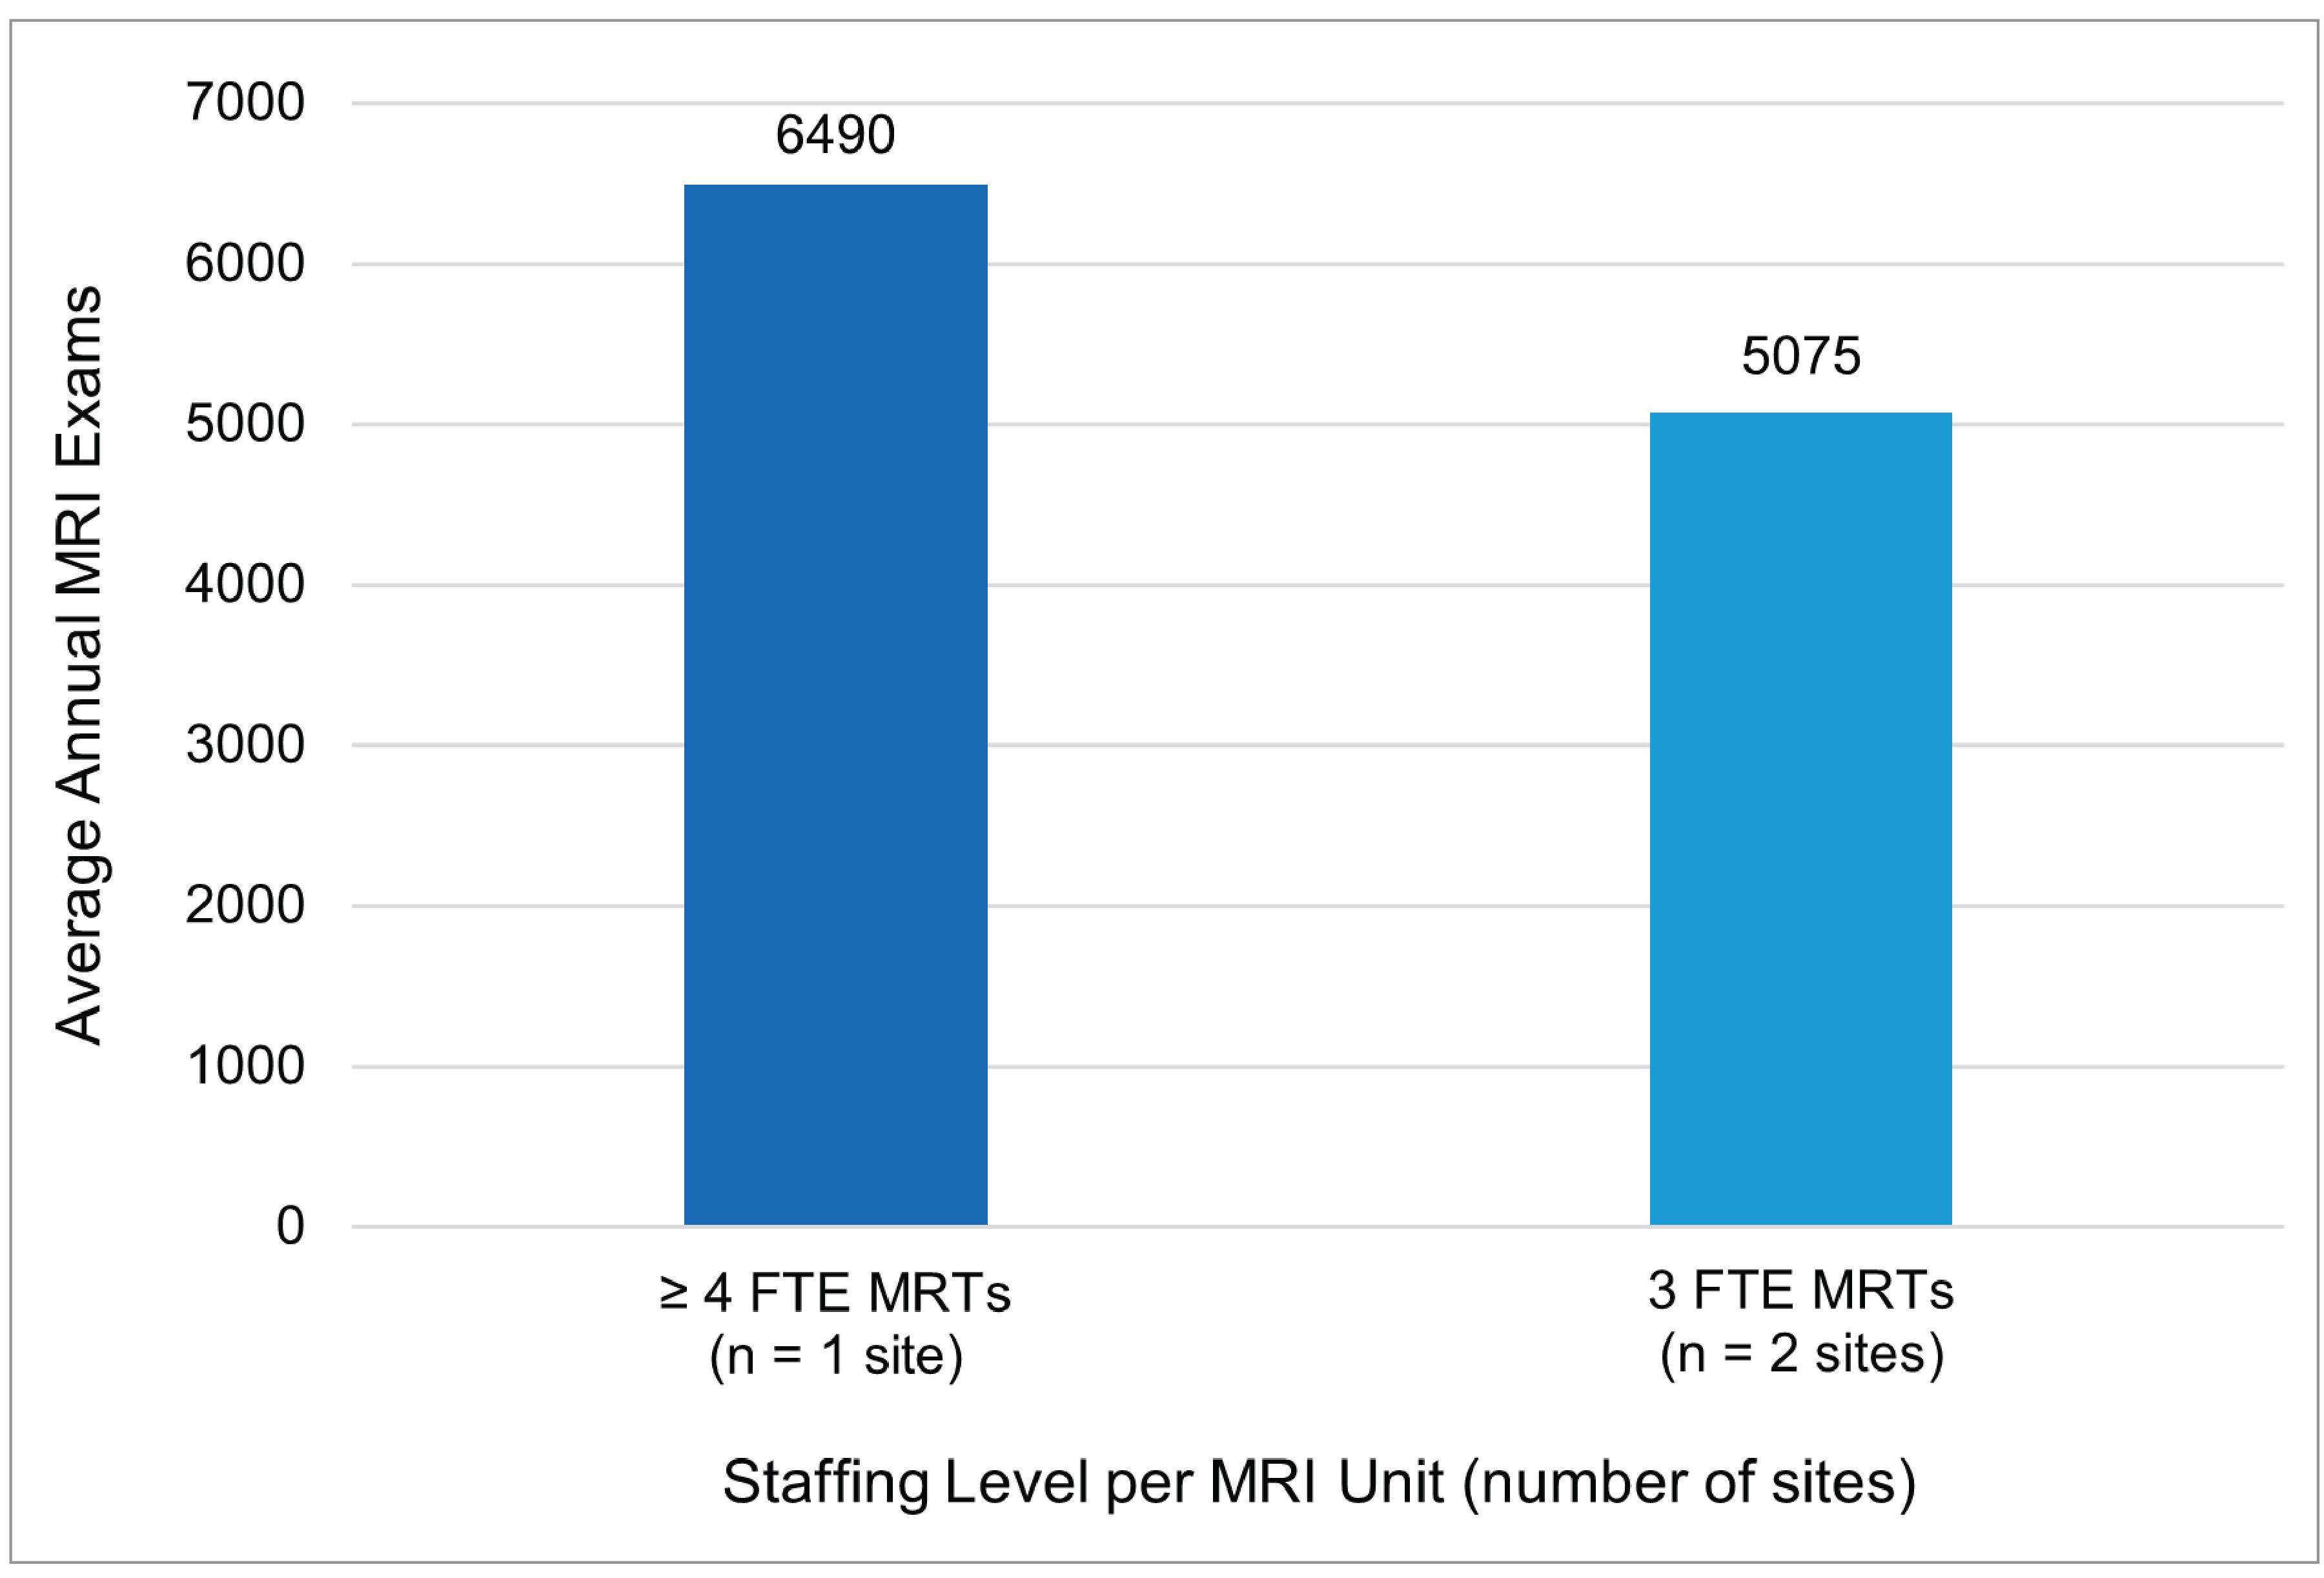
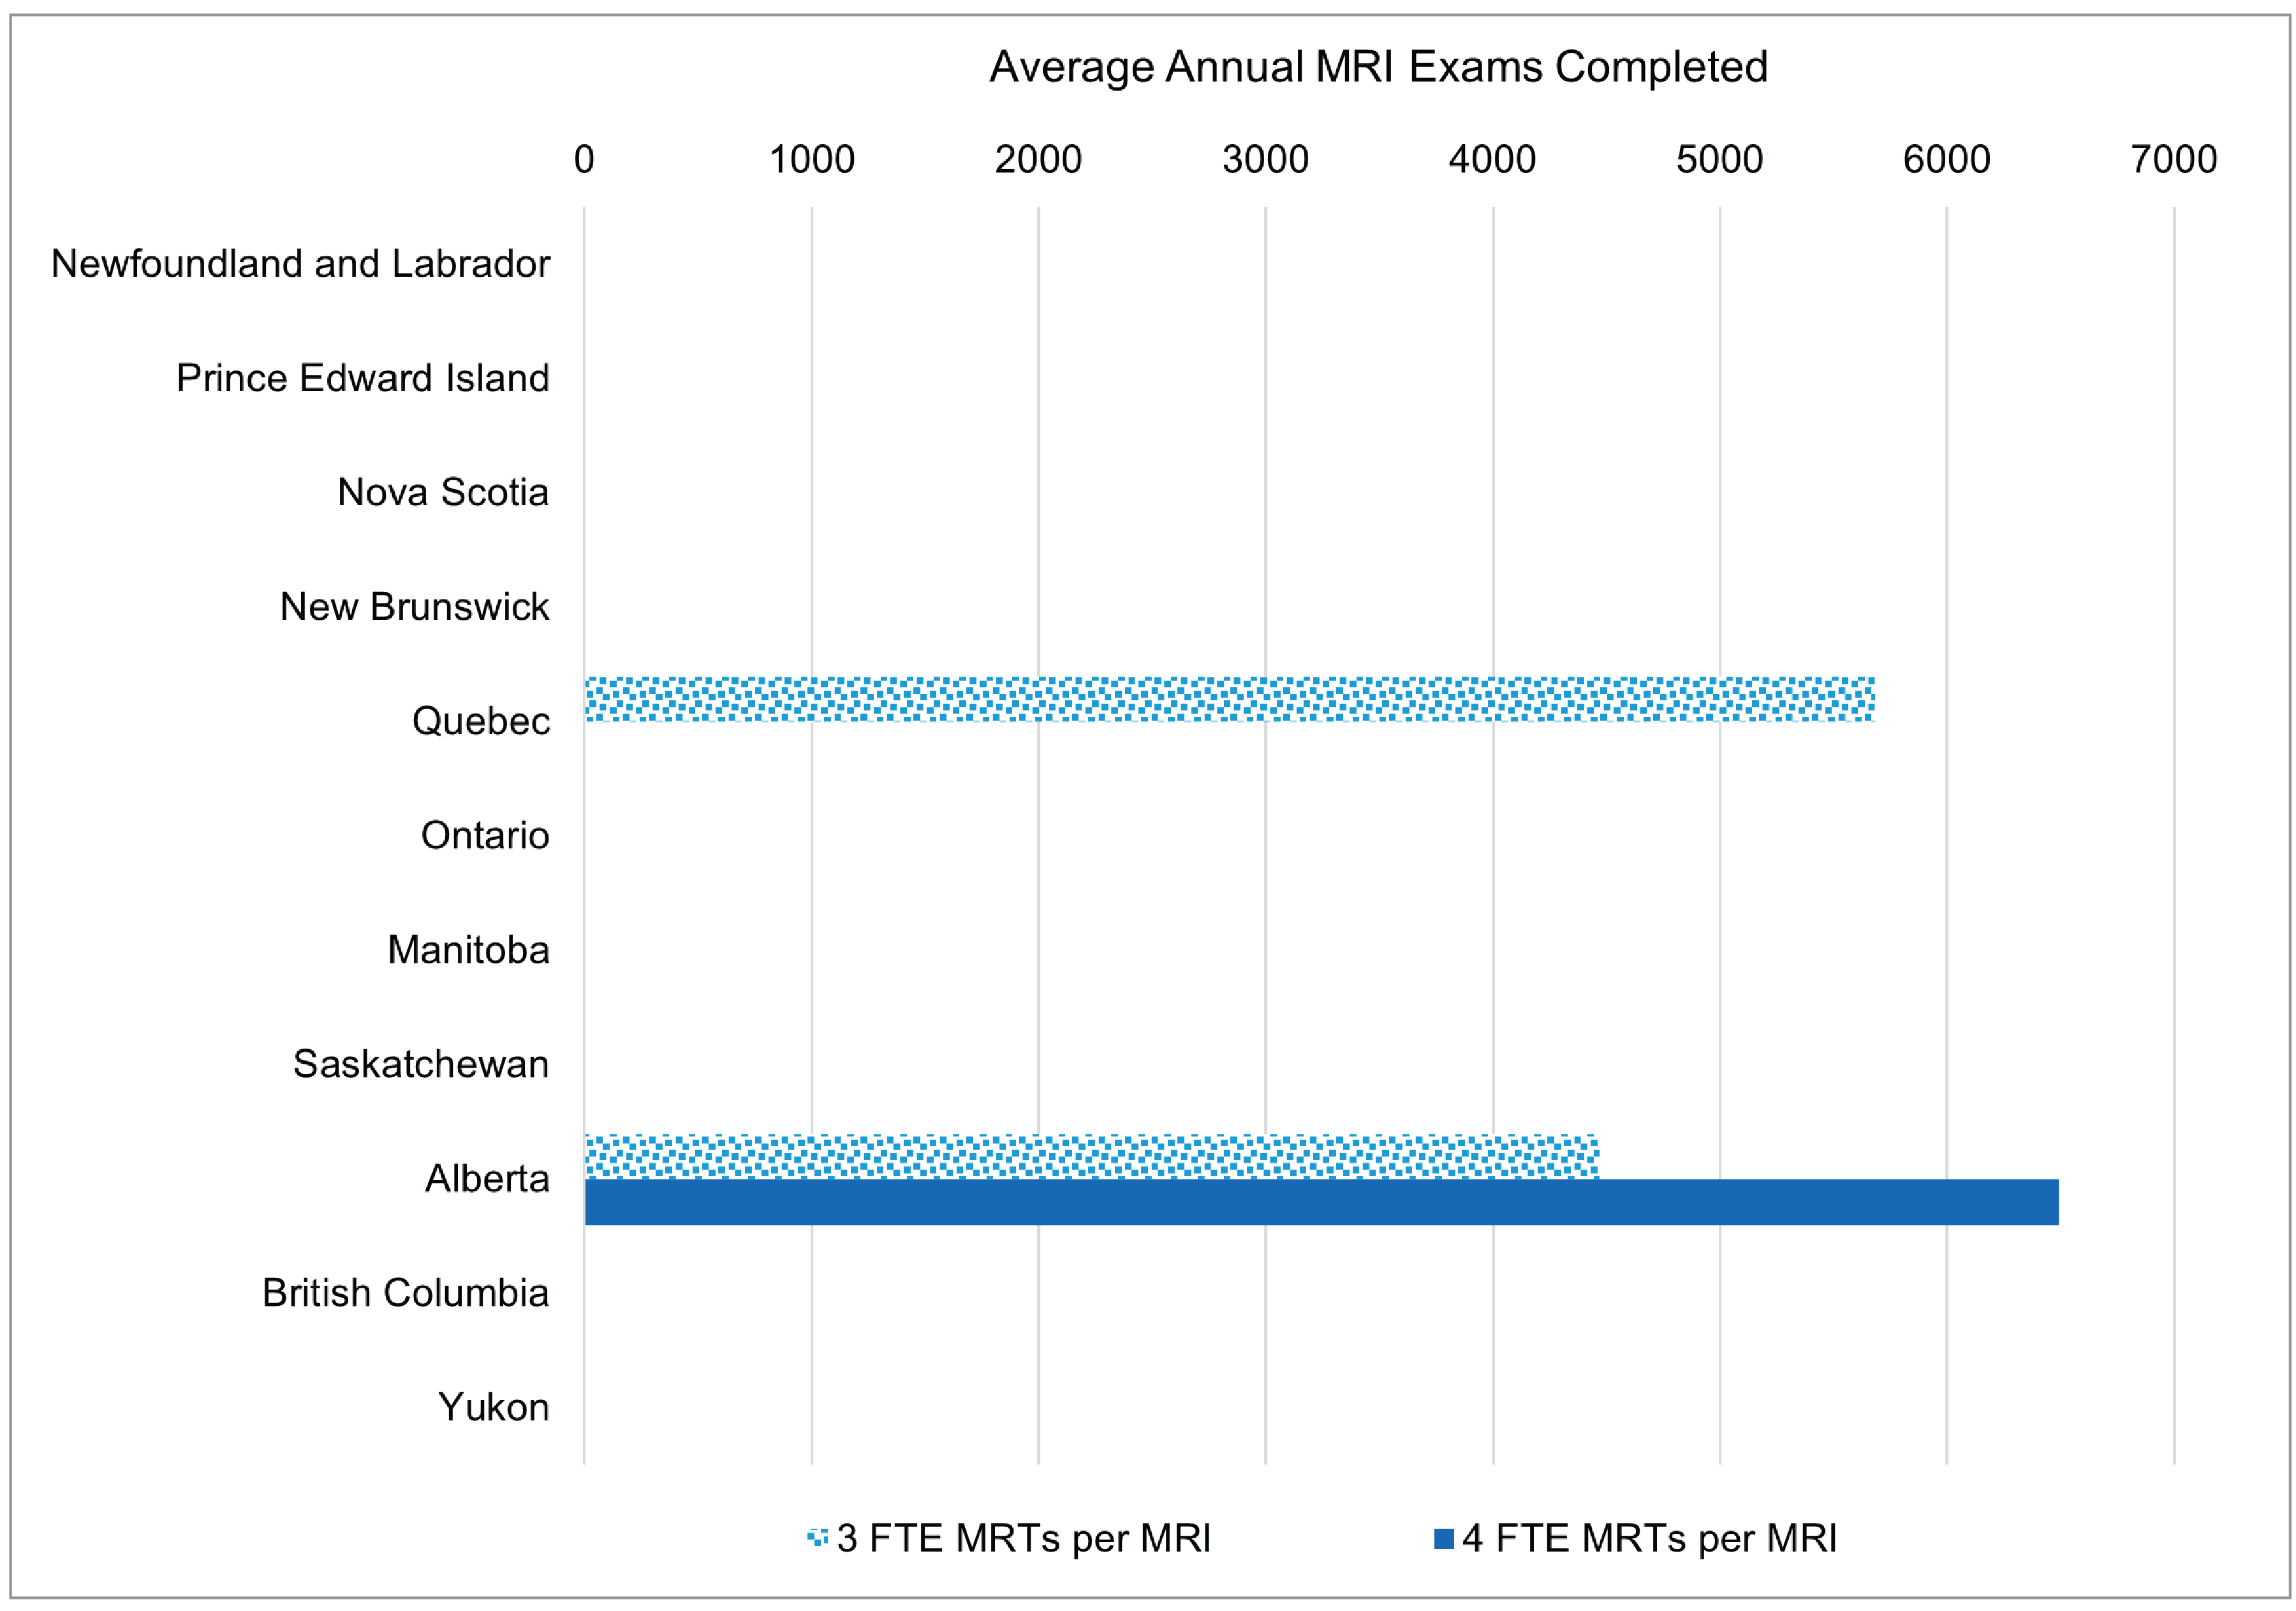
At a national level, 66% of sites (2 of 3) with 4 or more MRI units reported 3 FTE MRTs per MRI unit (refer to Figure 4 and Table 5 in Appendix 1).
On average, sites with 4 or more MRI units reported the following exam volumes at the national level
4 or more FTE MRTs per unit = 6,490 exams
3 FTE MRTs per unit = 5,075 exams
Among sites with 4 units or more across jurisdictions, the sole site with 4 or more FTE MRTs per MRI unit in Alberta reported the highest annual exam volume, at 6,490 exams.
Among the 3 sites with 4 or more MRI units, the one that staffed 4 or more FTE MRTs per unit reported the highest average annual exams completed, at 6,490 exams. It is possible that some MRI units at facilities with 4 or more units may be allocated for complex exams or used for research purposes, which could lower the overall exam volume. As a result, the overall exam volume — and the associated staffing level — may not fully reflect routine clinical operations, particularly given the small sample size in this category.
Figure 4: National Summary of MRI Exam Volumes and Staffing Levels for Sites With 4 or More MRI Units
FTE = full-time equivalent; MRT = medical radiation technologist.
Jurisdictional Variations
Overall, the national trend showing a relationship between higher staffing levels and greater annual MRI exam volumes was generally reflected across jurisdictions. Based on data from sites that reported both average annual exams and budgeted FTE MRTs, the following jurisdictional observations were made:
Sites in Alberta with 4 FTE MRTs per MRI unit consistently reported some of the highest average annual exam volumes across various facility sizes (refer to Tables 2 to 5 in Appendix 1).
Some jurisdictions reported lower average exam volumes despite comparable staffing levels. This may reflect differences in patient population sizes, operational hours, case mix, service delivery models, or operational priorities.
Among some sites with a single MRI unit, certain jurisdictions (Manitoba and Ontario) reported higher exam volumes at sites with 2 FTE MRTs per unit compared to sites with 3 MRTs (refer to Figure 5). This result is likely influenced by the small sample size and the presence of outliers.
Figure 5: Jurisdictional Summary of Average MRI Exam Volumes and Staffing Levels for Sites With 1 MRI Unit
FTE = full-time equivalent; MRT = medical radiation technologist.
Note: Northwest Territories and Nunavut did not possess MRI units at the time of the 2022–2023 CMII National Survey.
These jurisdiction-level differences underscore the importance of ensuring workforce planning is contextualized with jurisdictional and regional realities. This can include local demand for imaging, patient clinical needs and demographics, existing infrastructure, and resource constraints. For a full breakdown of jurisdictional data by site type and staffing levels, refer to Tables 2 to 5 and Figures 6 to 8 in Appendix 1.
Limitations
The data used in this analysis were self-reported by sites through the CMII National Survey and may be subject to reporting errors or misinterpretation of survey questions. Exam volume data were collected in aggregate at the site level, with average annual volumes assumed to be evenly distributed across all MRI units. However, this may not reflect actual practice, as certain units may be dedicated to specific functions (e.g., research, pediatric, or complex exams). As such, the analysis does not account for variation in case mix, which can influence exam duration and throughput. Sites performing more specialized or time-intensive scans may report lower exam volumes despite operating efficiently and at full capacity.
FTE data reflect budgeted positions for MRTs, but these may not always be fully staffed due to vacancies, part-time arrangements, or temporary absences. This can impact throughput, particularly in rural or remote areas where recruitment and retention challenges may be more common.13 Additionally, although sites may report having 4 or more FTE MRTs per unit, this does not guarantee simultaneous onsite staffing. Information on staff scheduling, shift coverage, and operating hours was not collected, all of which can significantly influence exam volumes. For example, 2 sites with identical FTEs per MRI unit may have very different exam volumes if one operates extended hours and the other does not.
There is also the possibility that sites included MRTs that are cross-trained to operate both CT and MRI units. In such cases, staffing data may overstate the availability of MRTs dedicated exclusively to MRI operations.
Due to the scope of the CMII National Survey, some relevant data could not be captured, such as MRT experience levels, which may also affect exam efficiency and quality. Finally, only 107 of 296 eligible sites submitted complete data on both FTE MRT staffing and annual exam volumes. As a result, the findings may not be fully generalizable, particularly if the characteristics of responding sites differ systematically from those that did not participate (e.g., higher-capacity urban centres versus smaller or lower-volume facilities).
Implications for Decision-Making
A 2024 study offered a preliminary look at trends in MRT staffing and MRI exam volumes in Ontario from 2003 to 2020, using per capita data.1 Although informative, this approach did not account for key site-level characteristics, such as the number of MRI units operating at a facility. In contrast, this report expands the analysis nationally and examines MRT staffing patterns in relation to average annual exam volumes, using site-specific data from the 2022–2023 CMII National Survey.10
Nationally, the most common staffing level category reported was 4 or more FTE MRTs per MRI unit, a pattern observed across 69% of facilities, regardless of the number of scanners. This aligns with findings from the Ontario study, which showed that MRT staffing per unit remained stable — at roughly 4 MRTs per unit — while MRI exams per machine increased over time with the authors suggesting this increase was due to extended hours of operation.1 It is also possible that this increase is due to potential gains in efficiency linked to increased staff experience and technological improvements.
However, this report highlights that even with technological advancements, adequate staffing remains a key factor in supporting higher exam volumes. Facilities with 4 or more MRTs per MRI unit consistently reported the highest average annual exam volumes. This staffing level likely reflects operational needs to maintain safe, efficient workflows; manage scheduling flexibility; and reduce staff strain.
Optimizing MRT staffing also requires tailoring workforce models to local and regional needs. A standardized staffing approach may not reflect variations in demand, exam complexity, or the number of MRI units at a given site. For example, sites with high exam volumes may require more personnel to maintain throughput, while lower-volume sites could be over-resourced under a uniform model. In addition to total exam volume, workforce planning should consider case mix because time-intensive or specialized exams (e.g., pediatric or cardiac imaging) can significantly affect throughput.
Although sufficient staffing plays a role in producing high volumes of exams, other factors are also important for exam throughput, including exam complexity, staff experience and morale, and the maintenance of the MRI units. This report found that facilities with more MRI units may appear to perform fewer exams per unit, but this may be due to exam complexity with more time-intensive exams reducing overall exam volume. Additionally, more experienced staff can lead to better outcomes in both exam efficiency and patient safety, and higher morale can support staff retention.8,9 Furthermore, newer MRI units or well-maintained units are less likely to break down, ensuring more time can be spent on exams instead of repair and refurbishment.14
Conclusions
This report offers the first national-level analysis of how MRI exam volumes relate to MRT staffing across facilities with varying numbers of MRI units. Findings indicate that sites with 4 or more FTE MRTs per MRI unit consistently reported higher average exam volumes, suggesting that adequate staffing is a key enabler of operational efficiency and access to care.
These findings provide insights on how staffing patterns can affect MRI exam volumes relative to MRI site capacity. Well-staffed and experienced medical imaging departments are important not only for maximizing MRI throughput but also for ensuring efficient operation of MRI exams and managing staff morale by reducing stress due to overwork. For health system leaders and planners, the findings emphasize the need to align staffing levels with site capacity, patient demand, and service complexity. Strategic workforce planning, particularly around MRT recruitment and retention, will be critical to improving MRI access across jurisdictions. Continued collection and use of facility-level data will be key to refining planning approaches and ensuring evidence-informed policy and operational decisions moving forward.
References
1.Morrill S. BMO, Patlas M.N., Kanani S., Kantarevic J., van der Pol C.B. CT, MRI, and Medical Radiation Technologist Trends in Ontario. Can Assoc Radiol J. 2024;75(2):432-434. PubMed
2.Ariste R. FG. Could MRI and CT Scanners Be Operated More Intensively in Canada? Healthc Policy. 2007;3(1);e113-e120. PubMed
3.Radiologists CAo. Improving Access to Lifesaving Imaging Care for Canadians. Ottawa (ON): Canadian Association of Radiologists;2022.
4.Radiologists CAo. Addressing the Medical Imaging Dilemma in Canada: Restoring Timely Access for Patients Post-Pandemic. Ottawa (ON): Canadian Association of Radiologists;2022.
5.Agency CsD. Canadian Medical Imaging Inventory 2022–2023: The Medical Imaging Team. Canadian Journal of Health Technologies. 2024;4(8):1-40.
6.CAMRT. Optimal staffing in the MRI Environment (RTMR). 2021; https://camrt-bpg.ca/patient-safety/mri-safety/optimal-staffing-in-mri/. Accessed Apr 14, 2025.
7.Radiologists CAo. CAR Standard for Magnetic Resonance Imaging. Ottawa (ON): Canadian Association of Radiologists;2011.
8.Norbash A. YK, Yuh W., Doros G., Ajam A., Lang E., Pauker S., Mayr N. Effect of team training on improving MRI study completion rates and no-show rates. J Magn Reson Imaging. 2016;44(4):1040-1047. PubMed
9.Corrente M. ZL, Given M., Mihailescu M. Supporting MRT mental health: Through COVID-19 and beyond. Journal of Medical Imaging and Radiation Sciences. 2023;54(2):S85-S94. PubMed
10.Agency CsD. Canadian Medical Imaging Inventory 2022–2023: MRI. Canadian Journal of Health Technologies. 2024;4(8):1-65.
11.Agency CsD. The Procurement of Advanced Medical Imaging Equipment: A Pan-Canadian Comparison. Ottawa (ON): Canada's Drug Agency;2021.
12.Topfer L.A. dLL. Diagnostic Imaging Equipment Replacement and Upgrade in Canada. Ottawa (ON): Canada's Drug Agency;2016.
13.Davidson M. KA, Tonseth R.P., Seland K., Harvie S., Hanneman K. The Landscape of Rural and Remote Radiology in Canada: Opportunities and Challenges. Can Assoc Radiol J. 2023;75(2):304-312. PubMed
14.Radiology ESo. Renewal of radiological equipment. Insights Imaging. 2014;5(5):543-546. PubMed
Appendix 1: Supplementary Data
Please note that this appendix has not been copy-edited.
Table 1: Average Exams and FTE MRTs per MRI Unit by Jurisdiction
Jurisdiction | Number of MRI units | Number of sites with MRIs | Number of sites with sufficient data | Average annual exams per MRI | Average FTE MRT per MRI |
|---|---|---|---|---|---|
Newfoundland and Labrador | 5 | 5 | 2 | 3,132 | 4 |
Prince Edward Island | 1 | 1 | 1 | 5,823 | 3 |
Nova Scotia | 11 | 10 | 4 | 3,932 | 4 |
New Brunswick | 11 | 9 | 7 | 4,881 | 3.9 |
Quebec | 123 | 92 | 10 | 4,945 | 3.9 |
Ontario | 157 | 89 | 31 | 7,189 | 4.7 |
Manitoba | 14 | 8 | 4 | 6,798 | 4.1 |
Saskatchewan | 11 | 9 | 5 | 5,871 | 5.8 |
Alberta | 43 | 28 | 18 | 6,496 | 3.9 |
British Columbia | 55 | 44 | 24 | 6,277 | 5.5 |
Yukon | 1 | 1 | 1 | 3,198 | 2 |
Northwest Territories | N/A | N/A | N/A | N/A | N/A |
Nunavut | N/A | N/A | N/A | N/A | N/A |
Canada | 432 | 296 | 107 | 61,156 | 4.5 |
N/A = Not Applicable
Table 2: Average Annual MRI Exams per Unit by FTE MRTs per Unit Across Jurisdictions With 1 MRI Unit Onsite
Jurisdiction | Average annual exams at sites with 2 FTE MRTs per MRI (number of sites) | Average annual exams at sites with 3 FTE MRTs per MRI (number of sites) | Average annual exams at sites with 4 or more FTE MRTs per MRI (number of sites) |
|---|---|---|---|
Newfoundland and Labrador | NR | NR | 3,132 (2) |
Prince Edward Island | NR | 5,823 (1) | NR |
Nova Scotia | 3,100 (1) | NR | 3,522 (3) |
New Brunswick | 2,604 (1) | 4,161 (2) | 5,868 (3) |
Quebec | NR | 526 (1) | 5,120 (5) |
Ontario | 4,500 (1) | 3,250 (2) | 9,013 (13) |
Manitoba | 8,500 (1) | 2,803 (1) | 8,125 (1) |
Saskatchewan | NR | 5,902 (2) | 9,063 (1) |
Alberta | 4,389 (1) | 4,826 (1) | 9,312 (10) |
British Columbia | NR | 3,347 (5) | 7,098 (12) |
Yukon | 3,198 (1) | NR | NR |
Northwest Territories | N/A | N/A | N/A |
Nunavut | N/A | N/A | N/A |
Canada | 4,382 (6) | 3,823 (15) | 7,454 (50) |
NR = Not Reported; N/A = Not Applicable
Note: All the sites with data on exams and full-time MRTs had more than 1 full-time MRT per MRI
Table 3: Average Annual MRI Exams per Unit by FTE MRTs per Unit Across Jurisdictions With 2 MRI Units Onsite
Jurisdiction | Average annual exams at sites with 2 FTE MRTs per MRI (number of sites) | Average annual exams at sites with 3 FTE MRTs per MRI (number of sites) | Average annual exams at sites with 4 or more FTE MRTs per MRI (number of sites) |
|---|---|---|---|
Newfoundland and Labrador | NR | NR | NR |
Prince Edward Island | NR | NR | NR |
Nova Scotia | NR | NR | NR |
New Brunswick | NR | NR | 5,634 (1) |
Quebec | NR | 6,478 (2) | NR |
Ontario | 5,750 (2) | 6,159 (1) | 7,827 (8) |
Manitoba | NR | NR | NR |
Saskatchewan | NR | NR | 4,245 (2) |
Alberta | 4,351 (2) | NR | 10,379 (1) |
British Columbia | NR | NR | 6,803 (6) |
Yukon | NR | NR | NR |
Northwest Territories | N/A | N/A | N/A |
Nunavut | N/A | N/A | N/A |
Canada | 5,051 (4) | 6,372 (3) | 7,107 (18) |
NR = Not Reported; N/A = Not Applicable
Note: All the sites with data on exams and full-time MRTs had more than 1 full-time MRT per MRI
Table 4: Average Annual MRI Exams per Unit by FTE MRTs per Unit Across Jurisdictions With 3 MRI Units Onsite
Jurisdiction | Average annual exams at sites with 2 FTE MRTs per MRI (number of sites) | Average annual exams at sites with 3 FTE MRTs per MRI (number of sites) | Average annual exams at sites with 4 or more FTE MRTs per MRI (number of sites) |
|---|---|---|---|
Newfoundland and Labrador | NR | NR | NR |
Prince Edward Island | NR | NR | NR |
Nova Scotia | NR | NR | NR |
New Brunswick | NR | NR | NR |
Quebec | 4,685 (1) | NR | NR |
Ontario | NR | 3,928 (2) | 3,284 (2) |
Manitoba | NR | NR | 7,763 (1) |
Saskatchewan | NR | NR | NR |
Alberta | NR | NR | 7,980 (1) |
British Columbia | NR | NR | 7,927 (1) |
Yukon | NR | NR | NR |
Northwest Territories | N/A | N/A | N/A |
Nunavut | N/A | N/A | N/A |
Canada | 4,685 (1) | 3,928 (2) | 6,048 (5) |
NR = Not Reported; N/A = Not Applicable
Note: All the sites with data on exams and full-time MRTs had more than 1 full-time MRT per MRI
Table 5: Average Annual MRI Exams per Unit by FTE MRTs per Unit Across Jurisdictions With 4 or More MRI Units Onsite
Jurisdiction | Average annual exams at sites with 3 FTE MRTs per MRI (number of sites) | Average annual exams at sites with 4 or more FTE MRTs per MRI (number of sites) |
|---|---|---|
Newfoundland and Labrador | NR | NR |
Prince Edward Island | NR | NR |
Nova Scotia | NR | NR |
New Brunswick | NR | NR |
Quebec | 5,683 (1) | NR |
Ontario | NR | NR |
Manitoba | NR | NR |
Saskatchewan | NR | NR |
Alberta | 4,467 (1) | 6,490 (1) |
British Columbia | NR | NR |
Yukon | NR | NR |
Northwest Territories | N/A | N/A |
Nunavut | N/A | N/A |
Canada | 5,075 (2) | 6,490 (1) |
NR = Not Reported; N/A = Not Applicable
Note: All the sites with data on exams and full-time MRTs had more than 2 full-time MRTs per MRI
Figure 6: Jurisdictional Summary of MRI Exam Volumes and Staffing Levels for Sites With 2 MRI Units
FTE = full-time equivalent; MRT = medical radiation technologist.
Note: Northwest Territories and Nunavut did not possess MRI units at the time of the 2022–2023 CMII National Survey.
ISSN: 2563-6596
Canada’s Drug Agency (CDA-AMC) is a pan-Canadian health organization. Created and funded by Canada’s federal, provincial, and territorial governments, we’re responsible for driving better coordination, alignment, and public value within Canada’s drug and health technology landscape. We provide Canada’s health system leaders with independent evidence and advice so they can make informed drug, health technology, and health system decisions, and we collaborate with national and international partners to enhance our collective impact.
Disclaimer: CDA-AMC has taken care to ensure that the information in this document was accurate, complete, and up to date when it was published, but does not make any guarantee to that effect. Your use of this information is subject to this disclaimer and the Terms of Use at cda-amc.ca.
The information in this document is made available for informational and educational purposes only and should not be used as a substitute for professional medical advice, the application of clinical judgment in respect of the care of a particular patient, or other professional judgments in any decision-making process. You assume full responsibility for the use of the information and rely on it at your own risk.
CDA-AMC does not endorse any information, drugs, therapies, treatments, products, processes, or services. The views and opinions of third parties published in this document do not necessarily reflect those of CDA-AMC. The copyright and other intellectual property rights in this document are owned by the Canadian Agency for Drugs and Technologies in Health (operating as CDA-AMC) and its licensors.
Questions or requests for information about this report can be directed to Requests@cda-amc.ca.