Drugs, Health Technologies, Health Systems
Health Technology Review
Hourly MRI Exam Volumes Across Canada in 2022–2023
Key Messages
What Is the Issue?
Canada’s Drug Agency (CDA-AMC) received a request related to the number of hourly MRI exams that can be performed per MRI unit across the country.
A recent CDA-AMC report examined hourly MRI exams performed at a site, but did not examine the hourly exam throughput of an individual MRI unit.
The last estimates of individual unit exam throughput were from 2005. Increases in MRI units since 2005 and technological advances make these estimates outdated, limiting the evaluation of current exam throughput.
What Did We Do?
CDA-AMC leveraged data from the 2022–2023 Canadian Medical Imaging Inventory National Survey including unit specifications and staffing levels. Overall, 111 of 239 sites with MRI units possessed sufficient data to estimate hourly MRI exam throughput.
Analyzing variables and potential confounders allowed for a deeper exploration of factors affecting hourly exam throughput per unit.
What Did We Find?
The national average MRI exam throughput in 2022–2023 was 1.25 exams per unit per hour, with rates ranging from 0.89 to 1.68 across jurisdictions.
Sites with MRI units that were 5 to 9 years old and sites with higher staffing levels generally had higher exam throughputs, indicating that technological advances and sufficient staffing supports increased exam volumes.
MRI units with a field strength of 1.5 tesla (T) had higher exam throughputs than units with 3.0 T. While higher strength MRI units are more powerful, they are likely reserved for complex exams, reducing hourly exam throughput.
Fixed MRI units had higher throughput compared to mobile units. However, expanding imaging access to underserved rural and remote communities is the primary reason for procuring mobile units rather than high exam throughputs.
Sites with more units on site tended toward lower per-unit exam throughput, possibly due to challenges such as scheduling inefficiencies, interunit coordination, or allocation of units for specialized studies, diluting overall throughput despite greater capacity.
What Does This Mean?
These findings provide valuable insights into how MRI exam throughput can be optimized and help guide decision-making in several ways:
Exam throughput is not solely dependent on the number of MRI units. Efficient resources use, including maintenance, staffing, and scheduling, can optimize workflows and staffing levels, ensuring that units are effectively used while increasing hourly exam throughput.
The analysis of unit age and associated exam throughput suggests older units may be used less or reserved for simpler exams.
Higher staffing levels were associated with increased exam throughput, indicating sufficient staffing supports better operational efficiency.
Variation in exam throughputs across jurisdictions and sites demonstrates that future solutions must take jurisdiction- or site-specific contexts into consideration when trying to reduce wait times and enhance throughput efficiencies.
Increasing exam throughput should be balanced with maintaining high-quality, patient-centred care.
Context
Canada’s Drug Agency (CDA-AMC) received a request related to the number of MRI exams that can be performed per unit per hour across the country. In 2024, CDA-AMC published a report examining the average number of MRI exams performed per hour at the national level, using data from the 2019–2020 Canadian Medical Imaging Inventory (CMII) National Survey.1 That report focused on the output of an entire site, rather than an individual unit, and found that, at a national level, sites with MRI performed an average of 1.80 exams per hour.1
A prior 2005 report from the Canadian Institute of Health Information (CIHI) reported an average hourly exam throughput of 1.5 MRI exams per unit per hour.2,3 At that time, Canada had 176 MRI units compared to the 432 MRI units reported in the most recent CMII National Survey conducted in 2022–2023.2,4 The Canadian medical imaging landscape for MRI has changed substantially during this time period, with technological advancements like larger magnets and improved image acquisition in newer MRI units, potentially increasing the number of exams a unit can complete per hour.
Health care decision-makers can leverage data on average MRI exam throughput to identify operational bottlenecks and explore opportunities for workflow improvements and efficiency gains. These efforts have the potential to increase patient throughput and help reduce wait times for medical imaging in Canada.5 However, an overall average does not consider all of the factors that can influence exam volumes, which vary across different sites and can be affected by numerous confounding variables, including the age of the MRI units, the number of MRI units on site, the field strength of MRI units, and whether the MRI units are fixed or mobile.6-8
With newly collected CMII survey data from 2022–2023, CDA-AMC is uniquely positioned to provide an update and expand information on average hourly MRI exam volumes per unit across Canada.4 Policy-makers and decision-makers can use this report to measure unit performance, examine trends from 2019–2020, and identify some potential areas for improvement in addressing wait times.
Objectives
This report summarizes data from the 2022–2023 CMII National Survey collected by CDA-AMC. The average hourly MRI exam throughput per unit at the national and jurisdictional level was calculated and the impact of some factors that may influence this average were explored, including:
MRI unit age
staffing (as measured by budgeted full-time equivalent [FTE] medical radiation technologists [MRTs] per unit)
MRI unit field strength
unit mobility
number of units per site.
Methods
This report summarizes information gathered through the 2022–2023 CMII National Survey by CDA-AMC, with each province and territory represented, where sufficient data were available. Sites reported the number of operational MRI units, their technical specifications, and the initial year of equipment operation. Sites also reported the average annual number of MRI exams performed, hours of operation, and budgeted FTEs for MRTs.
For the purposes of this report, an imaging exam is considered a single medical imaging session using an imaging modality to study 1 (or more than 1) body structure, body system, or anatomic area that yields 1 or more views for diagnostic and/or therapeutic purposes.
The average hourly MRI exam throughput for an individual unit was calculated by dividing the reported number of average annual MRI exams by the number of units at a site. The resulting values were then divided by 52 weeks, and then divided by the reported average weekly operating hours.
The average hourly MRI exam throughput for a site was calculated by dividing the reported average annual MRI exams by 52 weeks and dividing the resulting value by the reported average weekly operating hours.
The results are based on 111 sites that had reported data on both annual exam volume and weekly hours of operation to calculate an average hourly MRI exam throughput.
An examination of factors that influence average hourly exam throughput was also done. These factors include:
age of the MRI unit
staffing levels, as measured by budgeted FTE MRTs per unit
unit field strength
unit mobility
number of MRI units at a site.
This list of factors is not exhaustive, as the CMII survey does not capture all aspects of each site’s unique circumstances that can influence exam throughput. Other factors that might influence throughput include administrative and operational workflow processes, scheduling practices, staff experience, patient demographics and their specific clinical needs, population density, operating funds, and availability of supportive tools and technologies.6-8 Furthermore, government health policies and priorities can affect the availability and use of MRI units across the country through budget allocations, wait time management, and procedure reimbursements, which are beyond the scope of the CMII survey and not included in the analysis.5,9,10 Figure 1 shows the interrelationships of some of the mentioned factors that affect exam throughput.
It should also be noted that the CMII survey relies on self-reported data from sites. These data may contain errors or biases and are limited by the number of sites that provide complete information. In some instances, small sample sizes may affect the reliability of results.
Figure 1: Factors Affecting Hourly MRI Exam Throughput
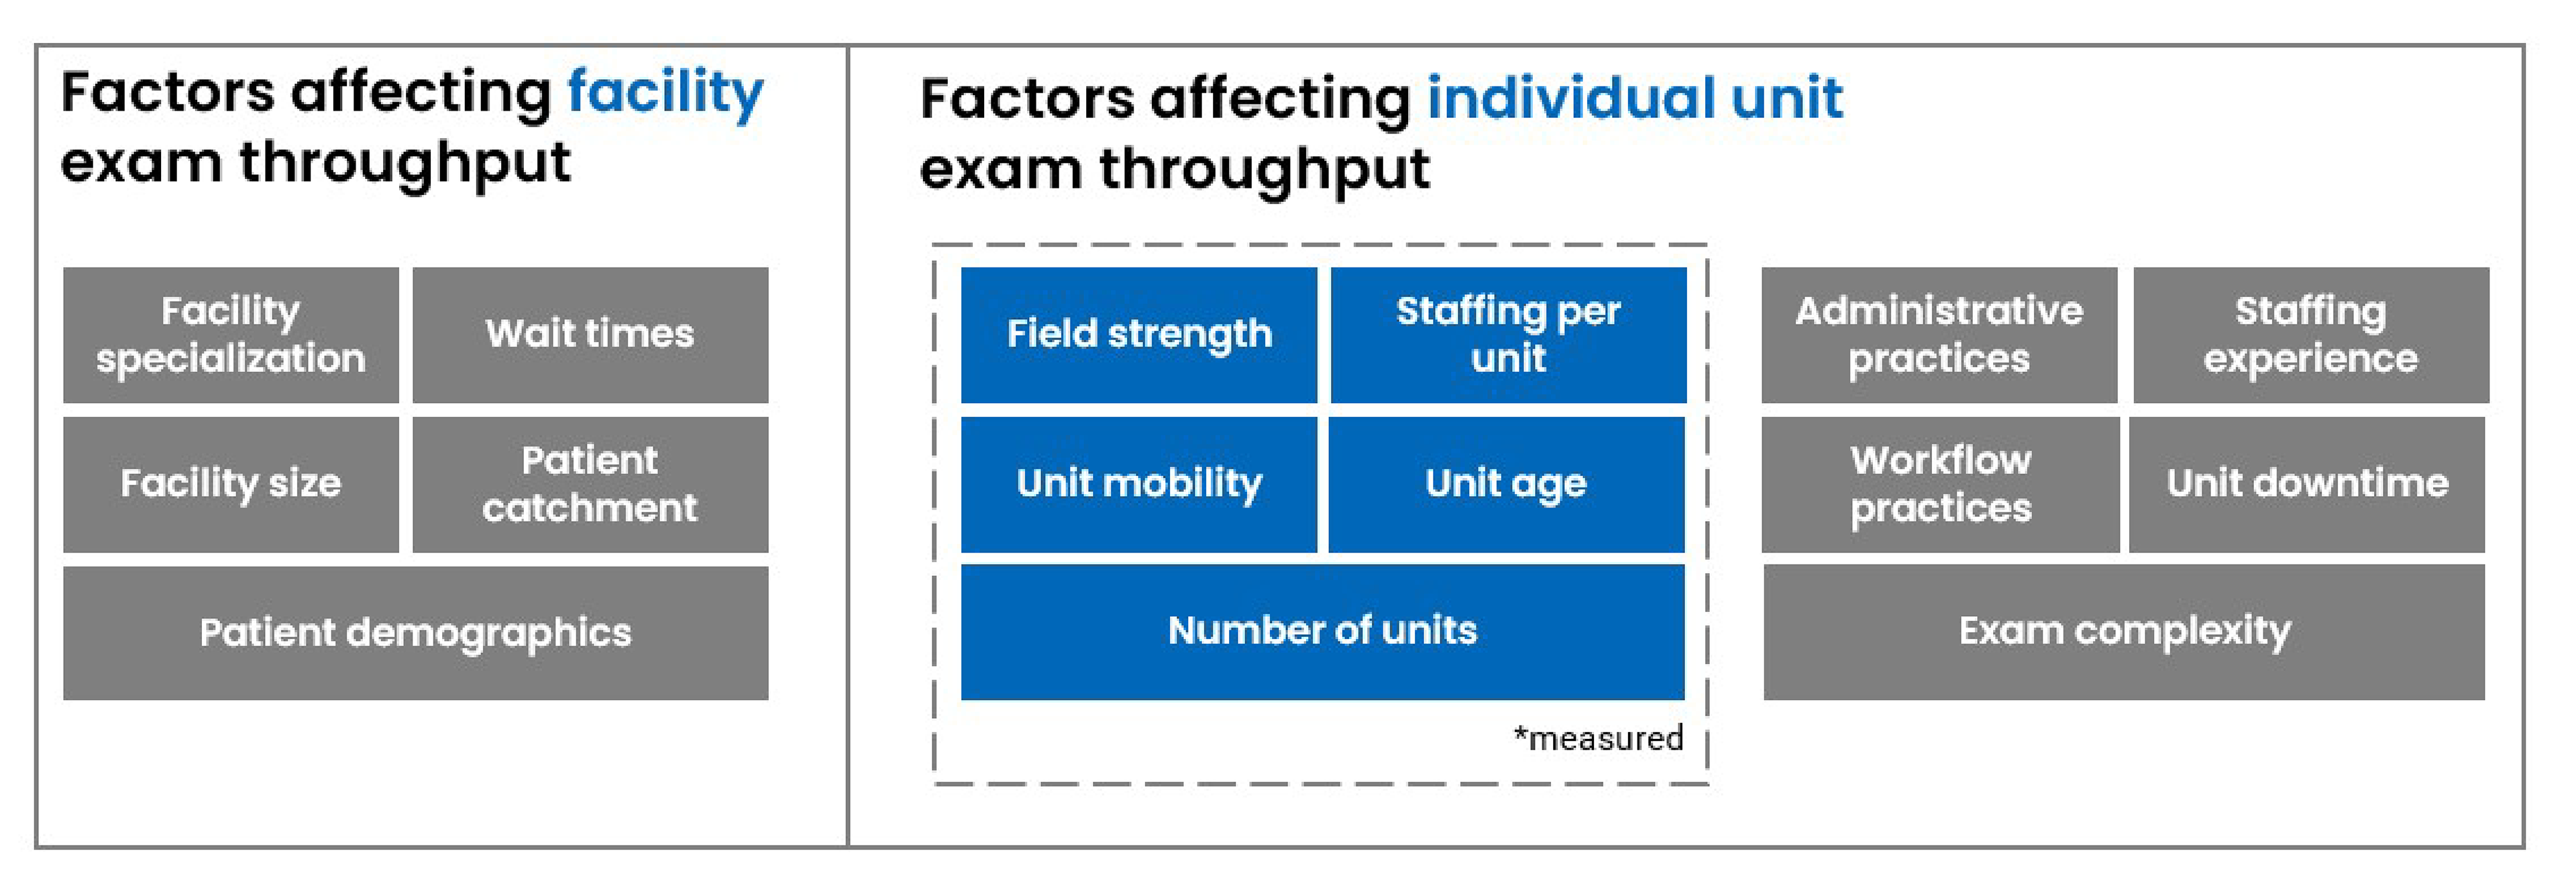
Note: Not all factors affecting hourly MRI exam throughput are depicted.
Results
Hourly exam rates are presented primarily at an individual unit level based on an aggregated national average. All jurisdictional level data are available in Tables 1 to 7 in Appendix 1. Individual unit-level hourly exam throughput represents the average number of MRI exams produced per MRI unit per hour.
Average Hourly MRI Exam Throughput
In 2022–2023, the national average MRI exam throughput per unit per hour was 1.25 exams, ranging from 0.89 to 1.68 exams across different jurisdictions (refer to Table 1 in Appendix 1).
In some instances, jurisdictions may have lower hourly exam throughputs than the national average but individual sites within a jurisdiction may have above-average exam throughput.
Average Hourly MRI Exams by Age of Unit
MRI unit age has been demonstrated to have impacts on exam throughput, as older machines may require more frequent upkeep compared to newer equipment, with higher risk of unexpected downtime, reducing the overall number of exams completed.7,8,11 Additionally, newer MRI units may have advancements in technology, such as faster image acquisition sequences, improved data processing, and larger magnets, which can influence the number of exams performed.12
Using data from sites reporting unit age, results are presented for average hourly exam throughputs of units grouped into 4 age categories of 5-year intervals. At the national level, the relationship between MRI unit age and average hourly exam throughput was as follows (refer to Table 2 in Appendix 1):
MRI units that were less than 5 years old (which accounted for 25% of total MRI units) had an average throughput of 1.37 exams per unit per hour, ranging from 0.88 to 1.59 exams per unit per hour.
MRI units that were 5 to 9 years old (which accounted for 29% of total MRI units) had an average throughput of 1.64 exams per unit per hour, ranging from 0.94 to 2.86 exams per unit per hour.
MRI units that were 10 to 14 years old (which accounted for 32% of total MRI units) had an average throughput of 1.60 exams per unit per hour, ranging from 1.02 to 2.27 exams per unit per hour.
MRI units that were 15 years old or older (which accounted for 14% of total MRI units) had an average throughput of 1.25 exams per unit per hour, ranging from 0.97 to 1.64 exams per unit per hour.
Generally, higher exam throughputs were associated with MRI units that were 5 to 14 years old across most jurisdictions, similar to what was noted in the prior CDA-AMC report on the 2019–2020 average MRI hourly exam throughput.1
When examining the performance of the newest MRI units, it is possible that newer machines are reserved for more complex, time-intensive scans, lowering their exam throughput. Some newer machines require performance testing, adjustments, and calibrations to ensure optimal performance and image quality, which reduces their availability for patient exams until these newer units are optimally set up. Additionally, while some older MRI units may be kept at a high level of maintenance and used by experienced staff for less complex exams, it is also possible that they use less efficient sequences, which can reduce throughput.
Average Hourly MRI Exams by FTE MRTs per Unit
The staffing complement of an imaging department has been found to affect MRI exam throughput, and is influenced by factors such as patient and workflow processes.13,14 Using data from sites reporting MRT staffing levels (as measured by FTE MRTs per unit), the national average hourly exam throughput of individual MRI units was as follows (refer to Table 3 in Appendix 1):
One to 2 FTE MRTs per unit had an average throughput of 1.25 exams per unit per hour, ranging from 1.00 to 1.46 exams per unit per hour.
Three to 5 FTE MRTs per unit had an average throughput of 1.13 exams per unit per hour, ranging from 0.80 to 1.77 exams per unit per hour.
Six or more FTE MRTs per unit had an average throughput of 1.47 exams per unit per hour, ranging from 0.98 to 1.99 exams per unit per hour.
At a national level, sites with 6 or more FTE MRTs per unit had a higher exam throughput compared to those with fewer FTE MRTs per unit. The difference in hourly exam throughput between sites with 1 to 2 FTE MRTs per unit and sites with 3 to 5 FTE MRTs per unit could be due in part to possible workflow inefficiencies that may limit the number of hourly exams that can be completed, particularly at sites with multiple units that require staff coordination across them. This added workload can reduce overall exam throughput. Additionally, sites with 6 or more FTE MRTs per unit typically have a larger number of MRI units, which demands a higher staffing budget. In such cases, the exam throughput calculations distribute exams evenly across all MRI units at a site, which can artificially inflate the individual unit's throughput.
Average Hourly MRI Exams by MRI Field Strength
MRI field strength, measured in tesla (T), plays a role in hourly exam throughput, as higher field strength units can perform scans more quickly with higher resolution compared to units with a lower field strength (which may require more time to acquire an equivalent image).15,16 Using data from sites reporting the MRI field strength, the national average hourly exam throughput of individual units was as follows (refer to Table 4 in Appendix 1):
Units with a field strength of 1.5 T (which accounted for 78% of total MRI units) had an average exam throughput of 1.47 exams per unit per hour, ranging from 0.88 to 1.89 exams per unit per hour.
Units with a field strength of 3.0 T (which accounted for 22% of total MRI units) had an average exam throughput of 1.39 exams per unit per hour, ranging from 0.81 to 2.07 exams per unit per hour.
In general, at the national level, units with a field strength of 1.5 T had a slightly higher average exam throughput compared to units with a field strength of 3.0 T. A potential reason for this lower exam throughput for MRI with 3.0 T is that these units may be reserved for more complex exams that require more time and greater image resolution. It is also possible that units with 3.0 T field strength are used more often for research compared to units with 1.5 T field strength, reducing their available time for clinical exams and overall exam throughput.
Average Hourly MRI Exams by Unit Mobility
Unit mobility plays a role in reducing disparities in medical imaging availability by expanding imaging access to underserved areas, such as rural and remote communities.17-19 Using data from sites reporting MRI unit mobility, the national average hourly exam throughput of individual units was as follows (refer to Table 5 in Appendix 1):
Conventional, fixed MRI units (which accounted for 94% of total MRI units) had an average exam throughput of 1.84 exams per unit per hour, ranging from 0.88 to 2.62 exams per unit per hour.
Mobile MRI units (which accounted for 6% of total MRI units) had an average exam throughput of 0.95 exams per unit per hour, ranging from 0.57 to 1.23 exams per unit per hour.
At a national level, conventional, fixed MRI units had a higher average hourly exam throughput compared to mobile units. Mobile MRI units often use a lower field strength, which means exams can take longer to perform. Mobile units also often require more maintenance, leading to increased downtime compared to conventional, fixed MRI units, reducing their hourly exam throughput. However, the benefit of expanding MRI access with mobile units is the primary goal, rather than increased exam throughput, as this allows patients in rural and remote communities to receive care closer to their homes.
Average Hourly MRI Exams by Number of Units on Site
Many sites operate more than 1 MRI unit, which can impact exam throughput. Nationally, hourly exam throughputs appeared to decrease if a site had multiple MRI units, as follows (refer to Table 6 in Appendix 1):
Units at sites with 1 MRI unit had an average throughput of 1.36 exams per unit per hour, ranging from 0.72 to 1.84 exams per unit per hour.
Units at sites with 2 MRI units had an average throughput of 1.07 exams per unit per hour, ranging from 0.81 to 1.41 exams per unit per hour.
Units at sites with 3 MRI units had an average throughput of 0.90 exams per unit per hour, ranging from 0.58 to 1.39 exams per unit per hour.
Units at sites with 4 or more MRI units had an average throughput of 1.02 exams per unit per hour, ranging from 0.98 to 1.04 exams per unit per hour.
While each additional MRI unit raises the average hourly exam throughput of the overall site (refer to Table 7 in Appendix 1), it is likely that these additional MRI units were reserved for specific clinical uses or for research, or operated less intensively. This can appear as a comparatively lower exam throughput of individual units located at sites with multiple MRI units compared to sites with only 1 MRI unit. Patient bottlenecks or operational inefficiencies could also be taking place in medical imaging departments when coordinating multiple units, further lowering individual unit exam throughput at sites with multiple MRI units.
Limitations
As the data collected from the CMII National Survey were aggregated, it is not possible to determine whether specific MRI units were designated to handle certain types of complex or time-intensive exams (e.g., newer and more powerful units performing more complex exams). The reported average annual exams from a given site were equally split across all onsite MRI units. This assumes each unit took an equal share of exams, regardless of age, type, or designated purpose, which may not reflect what occurred in practice at a particular site.
Additionally, using budgeted FTEs as a proxy measure for MRT staffing levels may not be a fully accurate representation of how well staffed a medical imaging department is, as these positions have been budgeted for but are not necessarily filled. Given the increasing shortage of trained MRTs in Canada, this may affect the accuracy of our findings.20 Additionally, FTE MRT ratios do not account for staff scheduling, as not all MRTs will work simultaneously (e.g., some staff may rotate weekend or night shifts). As a result, the number of FTE MRTs per unit may not reflect how staff are assigned across medical imaging departments.
Furthermore, while weekly hours of operation were used to calculate the average hourly exam throughput, it assumes that MRI units were used for the full duration, which may not necessarily be reflective of what occurs during day-to-day operations in a medical imaging department. MRI units require warm-up cycles before use and rooms require cleaning between patient visits, and MRI units cannot produce exams during this time.
This report is also reliant on self-reported data from sites, which may include errors, misinterpretations, or other data issues leading to potential biases in the report. Additionally, this report is limited by the number of sites that reported the necessary information required for this analysis. Sometimes, limited sample sizes may have been unable to provide a reliably accurate result.
This analysis is also limited by what can be measured in the CMII survey, as administrative practices like standardized protocols and robust scheduling methods were not investigated. Therefore, no data were available to examine the effects of these factors.
Implications for Decision-Making
The prior CDA-AMC report using 2019–2020 data indicated an hourly exam throughput of 1.80 exams per hour, while the current report, using 2022–2023 data, indicated 1.25 exams per hour. While seeming to show a decrease, the hourly throughput using 2019–2020 data was at a site level, and the current analysis using 2022–2023 data examined the average hourly exams completed by an individual MRI unit.1 The 2019–2020 hourly exam throughput was likely boosted by sites with multiple MRI units.
The 2005 CIHI analysis also reported hourly exam throughput for an individual MRI unit, and found the average exam throughput was 1.5 exams per MRI unit per hour.2 However, there are methodological differences in how the 2005 throughput was calculated compared to this report. The 2005 calculations used aggregated jurisdictional average annual exams, units, and weekly hours of operation, whereas the 2022–2023 calculations used data reported at the site level.2 Site-level data from more recent versions of the CMII survey allowed for a more detailed analysis that was more reflective of what is occurring in medical imaging departments. In addition, the 2022–2023 analysis was based on data from 111 sites, whereas the 2005 calculations used aggregated jurisdictional data and were theoretically reporting for all sites in a jurisdiction, with broad assumptions.2 Additionally, MRI usage has expanded since 2005 with new clinical indications and applications, as well as novel complex procedures, which can affect exam throughput.12,21,22
A variety of factors beyond what was examined in this report can influence exam throughput, and these can be context-specific based on the setting a site operates in. Optimizing and standardizing administrative workflows and protocols, adopting technological advances like artificial intelligence, and adapting scheduling procedures are approaches to increasing exam throughput and turnaround times.23,24
It is also important to ensure that exams are of high value in nature, in addition to increasing exam throughput, so that wait times are reduced for patients who have the most urgent medical imaging needs.
Conclusions
The findings from the 2022–2023 CMII National Survey offer an updated overview of MRI exam throughput across Canada. While the national average hourly MRI exam throughput was 1.25 exams per unit per hour, there was variability across jurisdictions, highlighting the complex factors that influence throughput. Although the 2022–2023 throughput appeared to be lower than what was observed in 2005, differences in calculation methods, staffing capacity in medical imaging, and the expanded clinical uses of MRI due to technological advancements have contributed to this change, rather than a decline in overall productivity.
When exam data were examined with equipment age, MRI units that were 5 to 9 years old had a higher average hourly exam throughput compared to units in other age categories, likely due to factors such as the complexity of exams conducted on these units, the use of these MRI units for other clinical and research purposes, and the relatively young age of the units. Similarly, sites with higher staffing or additional units had higher average hourly MRI exam throughput. MRI units with 1.5 T field strength generally had higher hourly exam throughput, with higher field strength units likely reserved for complex, time-intensive procedures.
The analysis shows that, to increase exam throughput, a balance must be struck between technological advancements — such as newer MRI units with quicker image acquisition and higher resolution images — and other considerations like staffing levels and experience, and other site-specific circumstances.
The results suggest that attention to workflow and administrative efficiencies, optimizing resource utilization, standardizing protocols and practices, and leveraging technological innovations can help to improve the overall performance and exam throughput of MRI units. However, steps must be taken to ensure that quality of patient care remains a top priority, as faster exam throughput must not come at the expense of accurate diagnostics or patient safety.
Ultimately, these findings provide decision-makers with a valuable tool to assess the performance of MRI units and identify potential bottlenecks. Tailored solutions at the site level and jurisdictional level that consider the unique circumstances of each will be crucial in advancing the efficiency and accessibility of medical imaging across Canada.
References
1.Agency CsD. Average Volume of MRI Exams Conducted per Hour Across Canada. Ottawa, ON: Canada's Drug Agency;2024.
2.Information CIfH. Medical Imaging in Canada 2005. Ottawa (ON): Canadian Institute for Health Information;2005.
3.Ariste R. FG. Could MRI and CT Scanners Be Operated More Intensively in Canada? Healthc Policy. 2007;3(1):e113-e120. PubMed
4.Agency CsD. Canadian Medical Imaging Inventory 2022–2023: MRI. Canadian Journal of Health Technologies. 2024;4(8):1-65.
5.Agency CsD. Wait List Strategies for CT and MRI Scans. Canadian Journal of Health Technologies. 2023;3(1):1-68.
6.Chao Y.S. SA, Morrison A., Hafizi D., Pyke L. The Canadian Medical Imaging Inventory 2019-2020. Canadian Journal of Health Technologies. 2021;1(1):1-215. PubMed
7.Radiology ESo. Renewal of radiological equipment. Insights Imaging. 2014;5(5):543-546. PubMed
8.Radiologists CAo. Improving Access to Lifesaving Imaging Care for Canadians. Ottawa (ON): Canadian Association of Radiologists;2022.
9.Fine B. SSE, White L., Henry D. Impact of restricting diagnostic imaging reimbursement for uncomplicated low back pain in Ontario: a population-based interrupted time series analysis. CMAJ Open. 2017;5(4):E760-E767. PubMed
10.Radiologists CAo. National Practice Guidelines. Practice Guidelines 2025; https://car.ca/patient-care/practice-guidelines/. Accessed Mar 12, 2025.
11.Sutherland G. RN, Gibbard R., Dobrescu A. The Value of Radiology, Part II. Ottawa (ON): The Conference Board of Canada;2019.
12.H. K. MR Imaging in the 21st Century: Technical Innovation over the First Two Decades. Magn Reson Med Sci. 2021;21(1):71-82. PubMed
13.CAMRT. Optimal staffing in the MRI Environment (RTMR). 2021; https://camrt-bpg.ca/patient-safety/mri-safety/optimal-staffing-in-mri/. Accessed Mar 27, 2025.
14.CAR. CAR Standard for Magnetic Resonance Imaging. 2011; https://car.ca/wp-content/uploads/Magnetic-Resonance-Imaging-2011.pdf. Accessed Mar 27, 2025.
15.Hori M. HA, Goto M., Wada A., Aoki S. Low-Field Magnetic Resonance Imaging: Its History and Renaissance. Invest Radiol. 2021;56(11):669-679. PubMed
16.R.A. B. Benchmarking MRI Operations. 2002; https://axisimagingnews.com/radiology-products/imaging-equipment/mri/benchmarking-mri-operations. Accessed Mar 26, 2025.
17.Reeve J. BJ. A Comparison of Fixed and Mobile CT and MRI Scanners. Ottawa (ON): Canadian Coordinating Office for Health Technology Assessment;1995.
18.CADTH. Mobile CT and MRI Units in Canada, 2019–2020. Ottawa (ON): CADTH;2021.
19.CADTH. Mobile Imaging: The Benefits and Challenges. Ottawa (ON): CADTH;2021.
20.Agency CsD. Canadian Medical Imaging Inventory 2022–2023: The Medical Imaging Team. Canadian Journal of Health Technologies. 2024;4(8):1-40.
21.Vanderby S. BA, Sanchez J.N.P., Kalra N., Babyn P. Variations in Magnetic Resonance Imaging Provision and Processes Among Canadian Academic Centres. Can Assoc Radiol J. 2017;68(1):56-65. PubMed
22.Lecouvet F.E. MN, Toukap A.N. Larbi A., Berg B.V., Malghem J., Triqueneaux P., Omoumi P., Stoenoiu M.S. The Increasing Spectrum of Indications of Whole-Body MRI Beyond Oncology: Imaging Answers to Clinical Needs. Semin Musculoskelet Radiol. 2015;19(4):348-362. PubMed
23.Almanaa M. JA, Matabi M., Alahmad H., Alhulail A., Alshuhri M., Alotaibi A., Alarifi M. Evaluating MRI and CT scan scheduling workflows: A retrospective analysis. Journal of Radiation Research and Applied Sciences. 2024;17(4).
24.Wenderott K. KJ, Zaruchas F., Weigl M. Effects of artificial intelligence implementation on efficiency in medical imaging—a systematic literature review and meta-analysis. NPJ Digital Medicine. 2024;7(265). PubMed
Appendix 1: Supplementary Data
Please note that this appendix has not been copy-edited.
Table 1: Average MRI Hourly Exam Throughput of Individual Units by Jurisdiction
Jurisdiction | Number of MRI units | Number of sites with MRIs | Number of sites with sufficient data to calculate average hourly MRI exams | Average hourly MRI throughput per individual unit |
|---|---|---|---|---|
Newfoundland and Labrador | 5 | 5 | 2 | 0.98 |
Prince Edward Island | 1 | 1 | 0 | NR |
Nova Scotia | 11 | 10 | 5 | 1.14 |
New Brunswick | 11 | 9 | 7 | 1.31 |
Quebec | 91 | 60 | 10 | 0.89 |
Ontario | 151 | 83 | 31 | 1.19 |
Manitoba | 14 | 8 | 4 | 1.44 |
Saskatchewan | 8 | 6 | 5 | 1.17 |
Alberta | 36 | 23 | 22 | 1.68 |
British Columbia | 44 | 33 | 24 | 1.10 |
Yukon | 1 | 1 | 1 | 1.23 |
Northwest Territories | NA | NA | NA | NA |
Nunavut | NA | NA | NA | NA |
Canada | 373 | 239 | 111 | 1.25 |
NR = not reported; NA = not applicable.
Table 2: Average MRI Hourly Exam Throughput of Individual Units by Age Categories Across Jurisdictions
Jurisdiction | Average hourly MRI exam throughput of individual units aged less than 5 years (number of units) | Average hourly MRI exam throughput of individual units aged 5 to 9 years (number of units) | Average hourly MRI exam throughput of individual units aged 10 to 14 years (number of units) | Average hourly MRI exam throughput of individual units aged 15 years or more (number of units) |
|---|---|---|---|---|
Newfoundland and Labrador | 0.88 (1) | NR | NR | NR |
Prince Edward Island | NR | NR | NR | NR |
Nova Scotia | NR | NR | 1.38 (1) | 0.97 (1) |
New Brunswick | NR | 1.93 (1) | 1.23 (3) | 1.64 (1) |
Quebec | 0.94 (4) | 2.86 (10) | 1.02 (1) | NR |
Ontario | 1.59 (20) | 1.35 (11) | 1.62 (10) | 1.19 (4) |
Manitoba | NR | 1.38 (2) | 1.30 (1) | 1.45 (2) |
Saskatchewan | NR | 0.94 (1) | 1.20 (4) | 1.47 (2) |
Alberta | 1.47 (5) | 1.83 (10) | 2.27 (17) | NR |
British Columbia | 1.05 (4) | 1.04 (5) | 1.08 (7) | 1.16 (10) |
Yukon | NA | 1.23 (1) | NA | NA |
Northwest Territories | NA | NA | NA | NA |
Nunavut | NA | NA | NA | NA |
Canada | 1.37 (34) | 1.64 (41) | 1.60 (44) | 1.25 (20) |
NR = not reported; NA = not applicable.
Table 3: Average MRI Hourly Exam Throughput of Individual Units by Staffing Categories Across Jurisdictions
Jurisdiction | Average hourly MRI exam throughput for individual units with 1 to 2 FTEs per unit (number of sites) | Average hourly MRI exam throughput for individual units with 3 to 5 FTEs per unit (number of sites) | Average hourly MRI exam throughput for individual units with 6 or more FTEs per unit (number of sites) |
|---|---|---|---|
Newfoundland and Labrador | NR | 0.98 (2) | NR |
Prince Edward Island | NR | NR | NR |
Nova Scotia | 1.19 (1) | 1.16 (3) | NR |
New Brunswick | 1.32 (1) | 1.18 (5) | 1.93 (1) |
Quebec | 1.39 (1) | 0.80 (7) | 0.98 (2) |
Ontario | 1.00 (3) | 1.00 (17) | 1.54 (11) |
Manitoba | 1.46 (1) | 1.34 (2) | 1.61 (1) |
Saskatchewan | NR | 1.24 (2) | 1.13 (3) |
Alberta | 1.39 (3) | 1.77 (9) | 1.99 (6) |
British Columbia | NR | 0.98 (13) | 1.25 (11) |
Yukon | 1.23 (1) | NA | NA |
Northwest Territories | NA | NA | NA |
Nunavut | NA | NA | NA |
Canada | 1.25 (11) | 1.13 (60) | 1.47 (35) |
NR = not reported; NA = not applicable.
Table 4: Average MRI Hourly Exam Throughput of Individual Units by MRI Field Strength Categories Across Jurisdictions
Jurisdiction | Average hourly MRI exam throughput for individual units with 1.5 T (number of units) | Average hourly MRI exam throughput for individual units with 3.0 T (number of sites) |
|---|---|---|
Newfoundland and Labrador | 0.88 (1) | NR |
Prince Edward Island | NR | NR |
Nova Scotia | 1.13 (4) | NR |
New Brunswick | 1.31 (7) | NR |
Quebec | 1.50 (14) | 1.94 (4) |
Ontario | 1.44 (34) | 1.04 (11) |
Manitoba | 1.89 (4) | 1.30 (1) |
Saskatchewan | 1.17 (5) | 0.81 (2) |
Alberta | 1.88 (23) | 2.07 (12) |
British Columbia | 1.25 (23) | 1.06 (3) |
Yukon | 1.23 (1) | NA |
Northwest Territories | NA | NA |
Nunavut | NA | NA |
Canada | 1.47 (116) | 1.39 (33) |
NR = not reported; NA = not applicable.
Table 5: Average MRI Hourly Exam Throughput of Individual Units by Unit Mobility Across Jurisdictions
Jurisdiction | Average hourly MRI exam throughput for individual units that are fixed (number of units) | Average hourly MRI exam throughput for individual units that are mobile (number of units) |
|---|---|---|
Newfoundland and Labrador | 0.88 (1) | NR |
Prince Edward Island | NR | NR |
Nova Scotia | 1.16 (3) | NR |
New Brunswick | 1.45 (5) | NR |
Quebec | 2.04 (16) | NR |
Ontario | 1.62 (41) | 0.97 (1) |
Manitoba | 2.75 (4) | NR |
Saskatchewan | 1.50 (7) | NR |
Alberta | 2.62 (31) | 1.23 (4) |
British Columbia | 1.58 (23) | 0.57 (3) |
Yukon | 1.23 (1) | NA |
Northwest Territories | NA | NA |
Nunavut | NA | NA |
Canada | 1.84 (132) | 0.95 (8) |
NR = not reported; NA = not applicable.
Table 6: Average MRI Hourly Exam Throughput of Individual Units by Number of MRI Units on Site Across Jurisdictions
Jurisdiction | Average hourly MRI exam throughput of individual units at sites with 1 MRI (number of sites) | Average hourly MRI exam throughput of individual units at sites with 2 MRIs (number of sites) | Average hourly MRI exam throughput of individual units at sites with 3 MRIs (number of sites) | Average hourly MRI exam throughput of individual units at sites with 4 or more MRIs (number of sites) |
|---|---|---|---|---|
Newfoundland and Labrador | 0.98 (2) | NR | NR | NR |
Prince Edward Island | NR | NR | NR | NR |
Nova Scotia | 1.17 (4) | 1.02 (1) | NR | NR |
New Brunswick | 1.33 (6) | 1.19 (1) | NR | NR |
Quebec | 0.72 (6) | 1.11 (2) | 1.39 (1) | 0.98 (1) |
Ontario | 1.47 (16) | 1.01 (11) | 0.58 (4) | NR |
Manitoba | 1.48 (3) | NR | 1.30 (1) | NR |
Saskatchewan | 1.42 (3) | 0.81 (2) | NR | NR |
Alberta | 1.84 (16) | 1.41 (3) | 1.26 (1) | 1.04 (2) |
British Columbia | 1.12 (17) | 1.07 (6) | 0.91 (1) | NR |
Yukon | 1.23 (1) | NA | NA | NA |
Northwest Territories | NA | NA | NA | NA |
Nunavut | NA | NA | NA | NA |
Canada | 1.36 (74) | 1.07 (26) | 0.90 (8) | 1.02 (3) |
NR = not reported; NA = not applicable.
Table 7: Site Average MRI Hourly Exam Throughput by Number of MRI Units on Site Across Jurisdictions
Jurisdiction | Site average hourly MRI exam throughput at sites with 1 MRI (number of sites) | Site average hourly MRI exam throughput at sites with 2 MRIs (number of sites) | Site average hourly MRI exam throughput at sites with 3 MRIs (number of sites) | Site average hourly MRI exam throughput at sites with 4 or more MRIs (number of sites) |
|---|---|---|---|---|
Newfoundland and Labrador | 0.98 (2) | NR | NR | NR |
Prince Edward Island | NR | NR | NR | NR |
Nova Scotia | 1.17 (4) | 2.04 (1) | NR | NR |
New Brunswick | 1.33 (6) | 2.38 (1) | NR | NR |
Quebec | 0.72 (6) | 2.22 (2) | 4.16 (1) | 6.83 (1) |
Ontario | 1.47 (16) | 2.02 (11) | 1.73 (4) | NR |
Manitoba | 1.48 (3) | NR | 3.89 (1) | NR |
Saskatchewan | 1.42 (3) | 1.62 (2) | NR | NR |
Alberta | 1.84 (16) | 2.81 (3) | 3.77 (1) | 5.18 (2) |
British Columbia | 1.12 (17) | 2.14 (6) | 2.72 (1) | NR |
Yukon | 1.23 (1) | NR | NR | NR |
Northwest Territories | NA | NA | NA | NA |
Nunavut | NA | NA | NA | NA |
Canada | 1.36 (74) | 2.14 (26) | 2.69 (8) | 5.73 (3) |
NR = not reported; NA = not applicable.
ISSN: 2563-6596
Canada’s Drug Agency (CDA-AMC) is a pan-Canadian health organization. Created and funded by Canada’s federal, provincial, and territorial governments, we’re responsible for driving better coordination, alignment, and public value within Canada’s drug and health technology landscape. We provide Canada’s health system leaders with independent evidence and advice so they can make informed drug, health technology, and health system decisions, and we collaborate with national and international partners to enhance our collective impact.
Disclaimer: CDA-AMC has taken care to ensure that the information in this document was accurate, complete, and up to date when it was published, but does not make any guarantee to that effect. Your use of this information is subject to this disclaimer and the Terms of Use at cda-amc.ca.
The information in this document is made available for informational and educational purposes only and should not be used as a substitute for professional medical advice, the application of clinical judgment in respect of the care of a particular patient, or other professional judgments in any decision-making process. You assume full responsibility for the use of the information and rely on it at your own risk.
CDA-AMC does not endorse any information, drugs, therapies, treatments, products, processes, or services. The views and opinions of third parties published in this document do not necessarily reflect those of CDA-AMC. The copyright and other intellectual property rights in this document are owned by the Canadian Agency for Drugs and Technologies in Health (operating as CDA-AMC) and its licensors.
Questions or requests for information about this report can be directed to Requests@CDA-AMC.ca.