CADTH Reimbursement Review
Ibrutinib (Imbruvica)
Sponsor: Janssen Inc.
Therapeutic area: Waldenström macroglobulinemia
This multi-part report includes:
Clinical Review
Pharmacoeconomic Review
Stakeholder Input
Clinical Review
Abbreviations
AE
adverse event
BR
bendamustine plus rituximab
BTK
Bruton tyrosine kinase
CI
confidence interval
CIT
chemoimmunotherapy
CLL
chronic lymphocytic leukemia
CNS
central nervous system
CR
complete response
CVP
cyclophosphamide plus vincristine plus prednisolone
DOR
duration of response
ECOG PS
Eastern Cooperative Oncology Group Performance Status
GRADE
Grading of Recommendations Assessment, Development and Evaluation
HR
hazard ratio
HRQoL
health-related quality of life
IgM
immunoglobulin M
INESSS
Institut national d'excellence en santé et en services sociaux
IPSS
International Prognostic Scoring System
IPTW
inverse probability of treatment weighting
IR
ibrutinib plus rituximab
IRC
independent review committee
ITC
indirect treatment comparison
ITT
intention to treat
IWWM
International Workshop on Waldenström’s Macroglobulinemia
LC
Lymphoma Canada
MAIC
matching-adjusted indirect comparison
MRR
major response rate
NE
not evaluable
NHL
non-Hodgkin lymphoma
NICE
National Institute for Health and Care Excellence
OH-CCO
Ontario Health Cancer Care Ontario
ORR
overall response rate
OS
overall survival
PC
physician’s choice
PD
progressive disease
PE
pharmacoeconomic
PFS
progression-free survival
PR
partial response
PSM
propensity score matching
QoL
quality of life
r/r
relapsed or refractory
RCT
randomized controlled trial
R-CVP
rituximab plus cyclophosphamide plus vincristine plus prednisone
RWE
real-world evidence
SAE
serious adverse event
TEAE
treatment-emergent adverse event
TTNT
time to next treatment
VGPR
very good partial response
WHIM
warts, hypogammaglobulinemia, immunodeficiency, and myelokathexis
WM
Waldenström macroglobulinemia
Executive Summary
An overview of the submission details for the drug under review is provided in Table 1.
Table 1: Background Information of Application Submitted for Review
Item | Description |
|---|---|
Drug product | Ibrutinib (Imbruvica), 140 mg capsule, oral |
Sponsor | Janssen Canada Inc. |
Indication | For the treatment of adult patients with:
|
Reimbursement request | Ibrutinib with or without rituximab for the treatment of adults with previously treated r/r WM |
Health Canada approval status | NOC |
Health Canada review pathway | Ibrutinib monotherapy: standard IR: priority |
NOC date | Ibrutinib monotherapy: March 31, 2016 IR: February 11, 2019 |
Recommended dose | For WM, the dose is 420 mg once daily. When given as a single drug, ibrutinib is administered until disease progression or until it is no longer tolerated by the patient. |
cGVHD = chronic graft vs. host disease; CLL = chronic lymphocytic leukemia; IR = Ibrutinib plus rituximab; MCL = mantle cell lymphoma; MZL = marginal zone lymphoma; NOC = Notice of Compliance; r/r = relapsed or refractory; WM = Waldenström macroglobulinemia.
Introduction
Non-Hodgkin lymphomas (NHLs) are a group of more than 60 types of cancer originating from cells of the lymphatic system (i.e., B-cells, T-cells, and natural killer cells).1,2 Waldenström macroglobulinemia (WM) is a low-grade, slow-growing cancer, also considered a subtype of lymphoplasmacytic lymphoma, that develops from malignant B-cells.3,4 Typical characteristics of WM include the overproduction of monoclonal immunoglobulin M (IgM) antibody due to changes in the malignant to B-cells during maturation and the infiltration of lymphoplasmacytic cells into bone marrow by malignant cells, leading to cytopenia. Clinical manifestations of the disease include hyperviscosity, cytopenia, lymphadenopathy, organomegaly, hemolytic anemia, peripheral neuropathy, and cryoglobulinemia.3
WM is rare, comprising about 1% of all hematologic malignancies. The incidence in Canada is estimated at 4 cases per 1,000,000 persons. About 150 new WM cases are reportedly diagnosed yearly in Canada, with an overall prevalence estimated at 1,500 cases. Males and older adults have a higher risk of developing WM than people in other demographic groups.5 The median age at diagnosis is 72 years. Risk factors identified include genetic susceptibility and strong familial aggregation.6 Symptoms of WM include fatigue, unexplained weight loss, and enlarged lymph nodes or spleen. Hyperviscosity symptoms may include vision problems, especially blurred or double vision, confusion, dizziness, loss of coordination, headaches, nosebleeds, or bleeding gums.3
Treatment goals include disease (symptom) control, preventing end-organ damage, and maximizing health-related quality of life (HRQoL).7 Treatment initiation depends on clinical and laboratory criteria. The majority of patients with WM are treated with combined chemoimmunotherapy (CIT) in the first line, such as bendamustine plus rituximab (BR). Other regimens are occasionally used. Bruton tyrosine kinase (BTK) inhibitors have demonstrated efficacy in patients with treatment-naive WM and in those with relapsed WM, but in Canada the majority of patients typically receive CIT in the first line. Treatment response in WM is primarily determined by a reduction in the serum IgM protein, in addition to the presence or absence of clinical manifestations of active and extramedullary disease.8 Most patients who relapse after first-line treatment will go on to receive subsequent therapy.9 BTK inhibitors (ibrutinib and zanubrutinib) are the most common treatment options available for patients with relapsed or refractory (r/r) disease after CIT failure.7,10 Ibrutinib monotherapy is a commonly used second-line treatment;10 however, access is limited to compassionate programs or private insurers. Zanubrutinib was recently approved and reimbursed across provincial jurisdictions in Canada.7 Other therapies for patients with previously treated r/r WM in the second-line setting include bortezomib-based regimens.10
Ibrutinib is an oral, first-in-class BTK inhibitor that specifically targets PCI-45227.11 It received Health Canada approval on March 31, 2016, as follows: “Imbruvica (ibrutinib) for the treatment of adult patients with Waldenström macroglobulinemia (WM).” Later, on February 11, 2019, ibrutinib received the following approval: Ibrutinib is indicated in combination with rituximab for the treatment of adults with WM. Ibrutinib is also approved in Canada for adults with previously untreated chronic lymphocytic leukemia (CLL), for adults with r/r mantle cell lymphoma, for patients with marginal zone lymphoma, and for patients with steroid-dependent or refractory chronic graft versus host disease. Ibrutinib was reviewed by the Institut national d'excellence en santé et services sociaux (INESSS) in 2017 for the treatment of patients with WM and by the National Institute for Health and Care Excellence (NICE); both reviews resulted in a negative recommendation to reimburse.12 Ibrutinib in combination with rituximab has not been reviewed by CADTH, INESSS, or NICE for adults with previously treated r/r WM.
The requested listing criteria for ibrutinib are for a subpopulation of the Health Canada indication and the clinical trial populations. Specifically, the criteria are for ibrutinib with or without rituximab for the treatment of adult patients with previously treated r/r WM.
Stakeholder Perspectives
The information in this section is a summary of input provided by the patient and clinician groups who responded to CADTH’s call for input and from clinical experts consulted by CADTH for the purpose of this review.
Patient Input
Two patient groups provided input for this submission: the Waldenström’s Macroglobulinemia Foundation of Canada and Lymphoma Canada (LC). Their activities include funding WM research and providing patient support services through education, support, advocacy, and research.
Input from the LC group was gathered from an anonymous online survey. The LC group collaborated with the Waldenström’s Macroglobulinemia Foundation of Canada to promote access to the survey for members in Canada. Of the 291 participants who contributed to the survey, 101 identified as Canadian. The majority of the respondents (43%) were aged between 65 and 74 years, and 57% identified as male. Most respondents reported that they had been diagnosed with WM for more than 9 years. Forty-nine respondents had experience with ibrutinib and 12 respondents had experience with ibrutinib plus rituximab (IR) (including 4 from Canada). Respondents described how WM had impacted their quality of life (QoL) at diagnosis; fatigue, anemia, and night sweats were the most common symptoms reported, and stress and anxiety were commonly reported psychosocial impacts. Their current day-to-day QoL was also affected. Some respondents expressed concerns about contracting infections, such as COVID-19, and the treatment duration of current therapies.
The most important outcomes highlighted by survey respondents were the control of disease and symptoms, longer periods of remission, improvement in QoL, longer survival, and fewer side effects. Most respondents expressed the importance of having a choice of treatment. A majority of respondents (71%) indicated that they were willing to tolerate treatment side effects, provided they were short-term. Many respondents shared that treatment was initiated after diagnosis, and almost half (48%) reported going through a period of watch and wait. In total, 34% (n = 82) of respondents reportedly received at least 1 line of therapy, 48% (n = 114) received 2 or more lines, and 18% (n = 43) were not on any treatment at the time of the survey. Most respondents (68%) expressed they were pleased with their current treatment options. Respondents reported that the most difficult adverse events (AEs) to tolerate were fatigue, brain fog, neuropathy, and nausea. Ninety-six survey respondents from Canada provided input on WM treatments; of these, 71% indicated that they had little or no difficulty accessing their current or most recent treatment; 78% indicated that they had local access to treatment; and 25% indicated that they needed to pay out-of-pocket for travel costs. Overall, 66% of respondents who had received at least 1 therapy expressed that they were satisfied or very satisfied with the treatment, and 38% of respondents expressed satisfaction with the treatments they received for r/r disease.
Overall, 61 respondents indicated that they had received ibrutinib in the r/r setting; of these, 49 received ibrutinib as monotherapy and 12 received it in combination with rituximab. The majority of respondents reported that they had received their WM diagnosis in the previous 3 to 5 years and had accessed ibrutinib through a compassionate access program or a public or government program. Half of the respondents reported that ibrutinib controlled symptoms such as fatigue, 42% reported that it controlled anemia, and 32% reported that it controlled night sweats. The Waldenström’s Macroglobulinemia Foundation of Canada noted that zanubrutinib, another BTK inhibitor, is approved and currently funded in 4 jurisdictions in Canada. They also noted that both therapies are considered equally effective for WM but that they have different toxicity profiles, which may play a role in treatment selection.
Clinician Input
Two clinical specialists with expertise in the diagnosis and management of WM provided input to this submission. Both agreed that the treatment goals of any therapy for patients with WM include durable remission, stopping progression, improving QoL, reducing the symptom burden, all while reducing possible toxicity.
Until recently, BTK therapy in Canada for patients who either had r/r disease or were treatment-naive was only available through access programs or private insurance. Zanubrutinib has been recently approved and funded in most provinces. Although generally well tolerated, there are patients who stop zanubrutinib due to side effects, so there is a need for an alternate BTK inhibitor for patients whose disease does not respond to initial treatment for relapsed WM. Even if zanubrutinib is preferred because of its safety profile (in particular with respect to the risk of atrial fibrillation and bleeding due to platelet inhibition), ibrutinib can have a role among patients who are intolerant to zanubrutinib and a place in therapy as another available option for patients with WM. The clinical experts noted that it is unclear how much the addition of rituximab to BTK inhibitors would benefit current treatments paradigms. The experts also noted that there are no specific patient criteria that would identify who would preferentially be best for ibrutinib. The clinical specialists acknowledged that there are very few data describing the success of switching from zanubrutinib to ibrutinib for intolerance; hence, this may be an infrequent situation if both drugs are funded. Both experts said they would work under the assumption that the criteria for ibrutinib and zanubrutinib would be similar in most cases.
According to clinical experts, response to treatment is assessed clinically, based on blood counts and chemistry tests. Successful therapy for WM is expected to lead to improvements in cytopenias and reductions in IgM monoclonal protein. The clinical experts noted that ibrutinib can be continued until evidence of disease progression or intolerable AEs, although dose reduction could be considered, as lower doses can maintain efficacy with a more favourable side effect profile. Failure of efficacy is typically noted through new progressive cytopenias (anemia most commonly) and increases in IgM monoclonal protein. The clinicians stated that data comparing BTK inhibitor monotherapy with BTK inhibitor plus rituximab are needed before the funding of rituximab in this combination can be considered in Canada.
Experts noted that WM is a rare condition that should generally be managed by hematologists or oncologists with experience in the treatment of lymphoproliferative disorders, although the prescription of a BTK inhibitor would generally be within the scope of hematologist and medical oncologist training in Canada. Generally, BTK inhibitor therapy for WM is delivered in an outpatient setting. Patients with WM may, however, require hospitalization in tertiary care centres for the complications of disease or treatment.
Clinician Group Input
Input from 1 clinician group, the Ontario Health Cancer Care Ontario (OH-CCO) Hematology Cancer Drug Advisory Committee, was summarized for this submission. The OH-CCO Cancer Drug Advisory Committees provide timely evidence-based clinical and health system guidance on drug-related issues in support of Cancer Care Ontario’s mandate, including the Provincial Drug Reimbursement Programs and the Systemic Treatment Program. Information from this group was gathered using videoconferencing.
The OH-CCO Hematology Cancer Drug Advisory Committee highlighted the following important goals for patients with WM: reducing paraprotein levels, reducing symptoms, improving blood counts, and improving QoL. The group noted that zanubrutinib is available for patients with r/r WM and is accessed through employee assistance programs. Other treatments highlighted included chemotherapy (e.g., bendamustine or cyclophosphamide plus vincristine plus prednisone [CVP]) in combination with rituximab or bortezomib. The group expressed that current BTK inhibitors (e.g., zanubrutinib) do not address treatment gaps for patients with WM; thus, they were uncertain whether the addition of rituximab to a BTK inhibitor would be more beneficial than a BTK inhibitor alone. The group emphasized that the addition of ibrutinib alone or IR may be a beneficial alternative for patients with WM in the second-line setting or beyond, and added that ibrutinib may be an appropriate alternative for patients who are intolerant to zanubrutinib. The group indicated that the patients least suited for this treatment are those for whom BTK inhibitors are contraindicated and/or those with a history of severe reactions to rituximab. The group indicated that response to treatment is assessed by evaluating IgM and paraprotein levels, blood counts, and symptom burden. Factors such as significant intolerance to treatment (bleeding, atrial fibrillation), disease progression, and lack of response are considered when deciding treatment discontinuation, according to the group. The group noted that ibrutinib is best administered in an outpatient setting.
Drug Program Input
The drug plans inquired which patients should receive ibrutinib monotherapy and which should receive ibrutinib in combination with rituximab, and whether there are differences in expected outcomes between ibrutinib monotherapy and ibrutinib in combination with rituximab. The clinical experts mentioned that the data are still too uncertain to assert definitive conclusions on this question. Rituximab may add some value to ibrutinib monotherapy, but it remains to be confirmed with more data. Both experts were comfortable using only ibrutinib.
The drug plans also asked if patients who have been previously treated with a BTK inhibitor would be eligible for ibrutinib. The clinical experts agree that patients can be eligible for ibrutinib, but only if they have not shown any progression of the disease on another BTK inhibitor (i.e., as long as they are not refractory to a BTK inhibitor).
The iNNOVATE clinical trial comparing IR with rituximab monotherapy included patients who received rituximab in the 12 months before the first study dose and who were not refractory to the most recent rituximab-based therapy. Provinces typically do not fund rituximab re-treatment if disease relapse occurs less than 6 months (or in some provinces, 12 months) from the completion of rituximab therapy. If both ibrutinib monotherapy and IR are recommended for previously treated r/r WM, provinces may only be able to implement ibrutinib monotherapy for patients who experience disease relapse less than 6 months (or in some provinces, 12 months) from the completion of rituximab therapy. The drug plan asked if the iNNOVATE trial data would be generalizable to patients who had a disease-free interval of at least 6 months from the previous rituximab exposure. There is uncertainty about generalizability in this case, according to the experts, mainly due to a lack of data and the experience in Canada with ibrutinib monotherapy for patients who relapse after a short period of time (whether 6 or 12 months) (i.e., there are no data comparing patients who relapsed in less than 12 months to those who relapsed after 12 months that can be used to reach a judgment on the generalizability and applicability of results).
Another question is related to the eligibility of patients not considered in the studies assessed, such as whether patients with central nervous system (CNS) lymphoma or those with evidence of disease transformation to a rapidly progressive, high-grade, malignant lymphoma would be eligible for treatment with ibrutinib. Both experts agreed that eligibility is possible for CNS lymphoma, because there are some data supporting the crossing of the blood-brain barrier, but for the second question, if there is a biopsy-confirmed transformation, the patient should not be treated with this drug. According to experts, if patients had biopsy-proven transformation to aggressive lymphoma, it would indicate that they do not have WM and they would not be part of the indication being discussed.
The drug plans also asked about the seventh International Workshop on Waldenström’s Macroglobulinemia (IWWM) response criteria used in Canada to determine response or loss of response to treatment. In the clinical experts’ opinion, it varies. As they perceive, it is used by some of clinicians treating patients with WM to determine progression.
When asked about other criteria used to determine disease progression or when to stop therapy, the clinical experts mentioned that clinical measures of progression and toxicity are usual among practitioners in Canada seeing patients with WM.
For patients on the combination of IR who experience disease relapse after completion of rituximab therapy, the drug plans asked if ibrutinib can be continued and rituximab reinitiated at the time of relapse. Experts stated that there is likely no clinical value in a strategy of restarting rituximab if patients have started with rituximab plus ibrutinib, stopped rituximab, and then progressed.
The clinical experts noted that there are no sufficient data to make a strong recommendation but, overall, they would not manage this situation by adding rituximab to ibrutinib for patients on ibrutinib monotherapy who experience disease relapse.
In the PCYC-1118E study of ibrutinib monotherapy, treatment was continued for 40 months. The drug plans asked if ibrutinib monotherapy should end after 40 months. The clinicians agreed that the decision to stop ibrutinib should not be based on time but rather on disease progression and toxicity of the drug.
Clinical Evidence
Systematic Review
Description of Studies
Clinical evidence for this submission included 1 pivotal study identified in the sponsor’s systematic review — the iNNOVATE study — that included patients with r/r WM treated with IR or rituximab plus placebo (N = 150 for the overall population and 82 for the r/r population). This study incorporated a single-arm substudy that consisted of patients previously treated with rituximab who received monotherapy with ibrutinib.
In the next section, we describe a report of indirect treatment comparisons (ITCs) or adjusted analyses submitted by the sponsor that first analyzed the feasibility of ITCs or adjusted analyses of the relevant comparators of ibrutinib, including physician’s choice (PC) of therapies, and then portrayed the possible comparisons made based on the appropriateness of the analysis of the data obtained.
Next, we describe 2 studies that provided additional evidence relevant to the clinical question addressed in this submission. The first is a single-arm study (PCYC-1118E; N = 63) of patients with WM treated with ibrutinib monotherapy. The second is a randomized controlled trial (RCT) (the ASPEN study; N = 201 for the overall population and 164 for the r/r population) that compared ibrutinib with zanubrutinib in patients with r/r WM.
Efficacy Results
Progression-free survival (PFS) is a critical outcome considered important by clinical experts, patient groups, and other stakeholders for decision-making and deliberations. It was also the primary end point of the iNNOVATE study, in which the median PFS was not reached in patients with r/r WM in the IR arm of the study, whereas it was 14.8 months in the rituximab plus placebo arm (95% confidence interval [CI], 5.6 to 25.8 months). The rate of PFS among patients in the IR arm ranged from 79.5% (95% CI, 63.2% to 89.2%) at 30 months to 67.5% (95% CI, 49.6% to 80.2%) at 54 months, whereas among patients treated with rituximab plus placebo, the PFS rate started at 29.1% (95% CI, 15.5% to 44%) at 30 months to 19.9% (95% CI, 8.7% to 34.4%) at 54 months. The PFS hazard ratio (HR) for this comparison in the r/r WM population was 0.22 (95% CI, 0.11 to 0.43; log-rank test P < 0.001). In the iNNOVATE substudy of 31 patients treated with ibrutinib monotherapy, the median PFS was 39 months (95% CI, 25 months to not evaluable [NE]) and the PFS rate ranged from 81% at 18 months (95% CI, 62% to 91%) to 40% (95% CI, 22% to 57%) at 5 years.
Overall survival (OS) was also of critical interest from the perspective of the clinical experts and other stakeholders. For the r/r population in the iNNOVATE study, the median OS was not reported across time points for any of the arms of the study. In the single-arm substudy of those treated with ibrutinib monotherapy, the OS rate reached 94% (95% CI, 77% to 98%) at 18 months and 73% (95% CI, 54% to 86%) at 5 years.
Duration of response (DOR) was defined as the date of initial documentation of response (i.e., partial response [PR] or better) to the date of first documented evidence of progressive disease (PD) or death for responders. In the r/r WM population, 31 patients and 9 patients, respectively, responded in the IR and rituximab plus placebo arms. Events of PD or death occurred in 5 (16.1%) patients in the IR group and 5 (55.6%) in the rituximab plus placebo arm. The median DOR was not reached in the IR arm (95% CI, 55.8 months to NE), whereas it was 23.5 months (95% CI, 9.2 months to NE) in the rituximab plus placebo arm. At 30 months, 96.6% of patients (95% CI, 77.9% to 99.5%) in the IR arm and 37.5% (95% CI, 8.7% to 67.4%) in the rituximab plus placebo arm continued their response. At the 54-month landmark, the DOR rate was 82.6% in the IR arm; however, in the rituximab plus placebo arm, no patient had a DOR longer than 48 months, so DOR is NE.
For the r/r population, time to next treatment (TTNT) was reported in a Kaplan-Meier curve as a subgroup analysis by treatment history with no specific data; at week 54, 84% of patients in the IR arm and 21% in the rituximab plus placebo arm had not received subsequent therapy. The TTNT was reported also for the single-arm substudy with 31 patients, but only 10 patients (32.3%) received subsequent treatment. In this group, median TTNT was not reached. At the 60-month landmark estimate, 64.6% of patients had not received subsequent treatment.
The rate of improvements in hemoglobin levels was defined as the proportion of patients with sustained hemoglobin improvement for more than 56 days. In the r/r WM population, baseline hemoglobin levels were 10.9 g/dL in the IR arm and 10.3 g/dL in the rituximab plus placebo arm. At follow-up, 29 of 41 patients (70.7%) had sustained hemoglobin improvement in the IR arm, whereas in the rituximab plus placebo arm, 12 patients (29.3%) had sustained improvement. This represents an absolute difference of 41.5% (95% CI, 19.3% to 60.5%; P = 0.003).
For the r/r population, changes in IgM levels were reported only in the iNNOVATE substudy (31 patients treated with ibrutinib monotherapy). At baseline, median IgM levels were 39.2 g/L. The maximum median decrease from baseline was 36.6 g/L less (95% CI, 74.8 g/L less to 4.5 g/L less) in this single-arm study.
Harms Results
All 75 patients in each arm of the iNNOVATE study presented with at least 1 AE, as did 30 of the 31 patients in the ibrutinib monotherapy arm in the iNNOVATE substudy). The most common AEs of any grade in the IR and rituximab plus placebo groups, were, respectively, infusion-related reaction (43% and 59%), anemia (24% and 28%), and diarrhea (31% and 15%). Some AEs more commonly reported in the IR arm than in the rituximab plus placebo arm included hypertension (25% versus 5%), diarrhea (31% versus 15%), nausea (23% versus 12%), dyspepsia (17% versus 1%), peripheral edema (23% versus 12%), and arthralgia (27% versus 12%).
Serious adverse events (SAEs) in the iNNOVATE study were more common in the IR arm than in the rituximab plus placebo arm (40 patients [53%] versus 25 patients [33%]). These included pneumonia (11% versus 3%) and atrial fibrillation (11% versus 1%). In the ibrutinib monotherapy (substudy) arm, 16 patients presented with at least 1 SAE (52%). In the iNNOVATE study, 1 patient died due to an AE in the IR arm and 3 patients died in the rituximab plus placebo arm. The cause of these patient deaths included pneumonia, Bing-Neel syndrome, and intracranial hemorrhage. No deaths were reported in the iNNOVATE substudy.
Among the significant concerns identified by clinical experts consulted by CADTH and other stakeholders were issues like atrial fibrillation, serious respiratory infections, major hemorrhage, and cytopenias. All these AE were evaluated in the general population of the iNNOVATE study and substudy.
In this case, the proportion of patients with atrial fibrillation was larger in the IR arm (14 patients [19%]) than in the rituximab plus placebo arm (2 patients [3%]); there was no atrial fibrillation in the ibrutinib monotherapy arm of the substudy. Similarly, serious respiratory infections occurred in 4 patients (5%) in the IR arm, none in the rituximab plus placebo arm, and 1 in the substudy population. Major hemorrhage occurred slightly more frequently in the IR arm (5 patients [7%]) than in the rituximab plus placebo arm (3 patients [4%]). Of the cytopenias evaluated, the IR arm had more cases of neutropenia than the rituximab plus placebo arm (16% versus 9%), but fewer cases of anemia (24% versus 28%) and thrombocytopenia (7% versus 11%).
Critical Appraisal
Overall, the iNNOVATE trial, comparing IR to rituximab plus placebo, was deemed to have a low risk of bias. The iNNOVATE study presents no concerns in the randomization process, with a properly generated randomization list and concealment allocation of patients to each arm of the study. No substantial baseline imbalances were detected that would suggest an issue with the randomization process. The use of placebo and the blinding of patients and outcome assessors ameliorate concerns about the risk of bias due to deviations from the intended interventions. An intention-to-treat (ITT) analysis was performed to assess the effects of assignment to the intervention. Although patients were allowed to cross over to receive ibrutinib after disease progression, patients were analyzed in the arm to which they were initially randomized. Data regarding primary outcomes were available for almost all randomly assigned participants, minimizing the potential for bias from incomplete outcome data. There were some discrepancies in the number of censored patients in the outcome of PFS, with more patients being censored in the IR arm, possibly because there were fewer patients available to analyze in the rituximab plus placebo arm as the study advanced. Despite this difference, sensitivity analyses based on censoring at the last adequate response assessment before documented progression or death showed results to those in the base case of PFS.
In terms of external validity, according to clinical experts consulted by CADTH, the patients included in the iNNOVATE study had overall baseline characteristics and prognostic factors similar to those encountered in the clinical landscape in Canada. However, 1 concern from the experts was the lack of a relatable direct comparison commonly used in practice (like ibrutinib monotherapy or zanubrutinib monotherapy). In terms of applicability, although the iNNOVATE trial is a well-conducted study, the results would only be applicable to a relatively small proportion of patients in Canada, because the direct comparison provided is only against rituximab, and currently other BTK inhibitors (zanubrutinib) are available and preferred over rituximab monotherapy. The generalizability of these findings is uncertain, according to clinical experts, but unlikely to have differences in real-life practice.
GRADE Summary of Findings and Certainty of the Evidence
For the pivotal studies and RCTs identified in the sponsor’s systematic review, the Grading of Recommendations Assessment, Development and Evaluation (GRADE) approach was used to assess the certainty of the evidence for the outcomes considered most relevant to CADTH’s expert committee deliberations, and a final certainty rating was determined, as outlined by the GRADE Working Group.13,14
With the GRADE approach, evidence from RCTs started as high-certainty evidence and could be rated down for concerns related to study limitations (which refers to internal validity or risk of bias), inconsistency across studies, indirectness, imprecision of effects, and publication bias.
Although GRADE guidance is not available for noncomparative studies, the CADTH review team assessed pivotal single-arm trials for study limitations (which refers to internal validity or risk of bias), inconsistency across studies, indirectness, imprecision of effects, and publication bias. Because the lack of a comparator arm does not allow for a conclusion to be drawn on the effect of the intervention or any comparator, the certainty of evidence for single-arm trials started at a very low certainty, with no opportunity for rating up.
When possible, certainty was rated in the context of the presence of an important (nontrivial) treatment effect; if this was not possible, certainty was rated in the context of the presence of any treatment effect (i.e., the clinical importance is unclear). In all cases, the target of the certainty of evidence assessment was based on the point estimate and it was located relative to the threshold for a clinically important effect (when a threshold was available) or to the null assessment.
Results of GRADE Assessments
The GRADE assessments included an evaluation of the main outcomes considered important by clinicians, patient groups, and stakeholders. The selection of outcomes for GRADE assessment was based on the sponsor’s Summary of Clinical Evidence, consultation with clinical experts, and input received from patient and clinician groups and public drug plans. The following list of outcomes was finalized in consultation with expert committee members: PFS, OS, DOR, TTNT, hematological improvement, and harms.
The comparison evaluated in the GRADE assessment was that of IR against rituximab plus placebo. Table 2 presents the GRADE summary of findings for this comparison.
Overall, there was moderate certainty for the outcome of PFS due to imprecision. The threshold of clinical importance for benefit or harm was set at 10 more (or fewer) patients per 1,000 on the event rate for PFS. This was obtained by iterative discussions with the clinical experts and the CADTH team. Despite observing an effect estimate beyond this threshold, the team decided to rate the evidence down 1 level due to concerns about the sample size (N = 82) in the study.
OS was very uncertain because the 1 single-arm study provided only descriptive data for survival, so the evidence was rated down 3 levels for risk of bias and down 1 level for indirectness because the population included in the study (patients previously treated with rituximab) was different than the population described in Table 2 (r/r patients with or without previous rituximab use). There is a row in Table 2 with indirect evidence obtained from the overall population (r/r and treatment-naive patients) for the patient or population, intervention, comparison, and outcomes (PICO) question; hence, the evidence was rated down 1 level for indirectness and down 2 levels for imprecision.
DOR was also imprecise due to the small number of observations available (i.e., only patients who responded).
For TTNT, low-certainty evidence was included from the iNNOVATE study r/r population (rated down 2 levels for imprecision and because there were no thresholds with which to judge the evidence only the null assessment was used).
Sustained hemoglobin improvement was deemed to be of moderate certainty, rated down only for imprecision due to the sample size, but input from the clinical experts acknowledged that the results, with such a large effect size, are credible, well above the threshold of 100 per 1,000 patients for a clinically important benefit (or harm, if on either side). IgM levels were not deemed appropriate for evaluation with thresholds because no precise estimates could be obtained.
As with IgM levels, no precise estimates were obtained for AEs, SAEs, and other harms; hence, the null and clinical assessments were used to judge the precision of the possible differences observed in a narrative way. Except for AEs, all harms were deemed to be of moderate certainty.
Indirect and Adjusted Comparisons
Description of Studies
To estimate the relative efficacy of the interventions for treatment of patients with WM (first-line or r/r), a systematic review of the literature was conducted to identify whether data were available to inform the ITCs section (date of the last search update was March 23, 2021). The identified evidence for treatments of WM was limited by the availability of only a few RCTs and by methodological flaws in the included studies, such as small sample sizes and a lack of blinding. Specific methods of ITC and adjusted comparisons depended on the type of data available, and included propensity score matching (PSM), matching-adjusted indirect comparison (MAIC), inverse probability of treatment weighting (IPTW) analyses, and adjusted Cox proportional hazard model.
Despite attempts to compare ibrutinib to other interventions relevant to this submission, there were no direct feasible comparisons using these bodies of evidence. The network of evidence was not appropriate to create loops to use in a network meta-analysis. The only feasible way was to use the bodies of evidence from databases and chart reviews (real-world evidence [RWE]) of patients with WM to compare PC regimens with IR or rituximab data from the iNNOVATE study and the single-arm substudy, as well as to compare ibrutinib monotherapy with IR. Still, the authors were able to present assessments for these comparisons (using MAIC, PSM, IPTW, and naive assessments), although only the IR versus PC comparison was applicable to this review report, albeit with important limitations to obtain credible effect estimates.
Table 2: Summary of Findings for IR in Patients With r/r WM
Outcome and follow-up | Patients (studies), N | Relative effect (95% CI) | Absolute effects (95% CI) | Certainty | What happens | ||
|---|---|---|---|---|---|---|---|
Rituximab plus placebo | IR | Difference | |||||
Progression-free survival | |||||||
PFS rate Follow-up: 30 months | N = 82 (1 RCT) | HR = 0.22 (0.11 to 0.43) | 291 per 1,000 | 795 per 1,000 (632 to 892) | 505 per 1,000 more (from 311 more to 699 more) | Moderatea | IR likely results in larger PFS rates than rituximab plus placebo at 30 months |
PFS rate Follow-up: 54 months | N = 82 (1 RCT) | HR = 0.22 (0.11 to 0.43) | 199 per 1,000 | 675 per 1,000 (496 to 802) | 476 per 1,000 more (from 273 more to 679 more) | Moderatea | IR likely results in larger PFS rates than rituximab plus placebo at 54 months |
Overall survival | |||||||
OS rate Follow-up: 18 to 60 months | N = 31 (1 single-arm substudy) | NR | In a single-arm study (ibrutinib monotherapy), the OS rates were 94% (77 to 98) and 73% (54 to 86) at 18 months and 60 months, respectively | Very lowb | The evidence is uncertain about the effects of IR vs. rituximab plus placebo for OS | ||
OS ratec Follow-up: 54 months | N = 150 (1 RCT) | HR = 0.80 (0.32 to 1.99) | 842 per 1,000 | 864 per 1,000 (737 to 933) | 23 more per 1,000 (from 113 fewer to 158 more) | Very lowc | The evidence is uncertain about the effects of IR vs. rituximab placebo for OS in the overall population |
Duration of response | |||||||
DOR event rated Follow-up: 30 months | N = 40 (1 RCT) | NR | PD or death occurred in 5 patients in the IR group and 5 in the rituximab plus placebo arm; the 30-month DOR rate (continued response) was 96.6% (77.9 to 99.5) in the IR arm and 37.5% (8.7 to 67.4) in the rituximab plus placebo arm | Lowe | At 30 months, IR may result in a large increase in the DOR compared to rituximab plus placebo | ||
DOR event rated Follow-up: 54 months | N = 40 (1 RCT) | NR | The 54-month DOR rate was 82.6% for the IR arm, and no patient had a DOR > 48 months; therefore, DOR is NE in the rituximab plus placebo arm | Lowe | At 54 months, IR may result in a larger increase in DOR than rituximab plus placebo | ||
Time to next treatment | |||||||
TTNT rate Follow-up: 54 months | N = 82 (1 RCT) | NR | Reported as a subgroup; at 54 months, 84% of patients in the IR arm and 21% in the rituximab plus placebo arm had not received subsequent therapy | Lowf | At 54 months, IR may result in a large increase in TTNT rates than rituximab plus placebo | ||
TTNT rate, overall population Follow-up: 54 months | N = 50 (1 RCT) | HR = 0.10 (0.05 to 0.21) | 294 per 1,000 | 874 per 1,000 (772 to 933) | 580 per 1,000 more (from 438 more to 722 more) | Moderateg | At 54 months, IR likely results in a large increase in TTNT rates when compared to rituximab plus placebo in the overall population. |
Hematological improvement | |||||||
Proportion of patients with sustained hemoglobin improvement Follow-up: 54 months | N = 82 (1 RCT) | NR | 293 per 1,000 | 707 per 1,000 (507 to 906) | 415 per 1,000 more (from 193 more to 605 more) | Moderateh | IR likely results in a larger increase in the proportion of patients with sustained hemoglobin improvement than rituximab plus placebo |
IgM improvement Follow-up: 30 to 54 months | N = 31 (1 single-arm substudy) | NR | Changes in IgM levels were reported only in the iNNOVATE substudy (31 patients with ibrutinib monotherapy). At baseline, IgM levels were 39.2 g/L. The maximum median decrease was 36.6 g/L less (74.8 less to 4.5 less). | Very lowb | Evidence is uncertain about the effects of IR vs. rituximab plus placebo for IgM improvements | ||
Harms | |||||||
AEs Follow-up: 60 months | N = 150 (1 RCT) | NR | All patients in the IR and rituximab plus placebo arms presented with at least 1 AE | Highi | IR does not increase or reduce the number of patients with at least 1 AE compared with rituximab plus placebo | ||
SAEs Follow-up: 60 months | N = 150 (1 RCT) | NR | There were, in total, 40 (53%) patients in the IR arm and 25 (33%) in the rituximab plus placebo arm with an SAE | Moderatej | IR likely results in an increase in the proportion of patients with SAEs compared to rituximab plus placebo; the clinical significance of the difference is uncertain | ||
Atrial fibrillation Follow-up: 60 months | N = 150 (1 RCT) | NR | There were, in total, 14 (19%) patients in the IR arm and 2 (3%) in the rituximab plus placebo arm with atrial fibrillation events | Moderatej | IR likely results in an increase in the proportion of patients with atrial fibrillation compared to rituximab plus placebo | ||
Respiratory infections Follow-up: 60 months | N = 150 (1 RCT) | NR | In total, there were 4 (5%) patients in the IR arm and none (0%) in the rituximab plus placebo arm with serious respiratory infections | Moderatej | IR likely results in little to no difference in the proportion of patients with serious respiratory infections | ||
Major bleeding Follow-up: 60 months | N = 150 (1 RCT) | NR | In total, there were 5 (7%) patients in the IR arm and 3 (4%) in the rituximab plus placebo arm with major bleeding (hemorrhage) | Moderatej | IR likely results in little to no difference in the proportion of patients with major bleeding | ||
Cytopenias Follow-up: 60 months | N = 150 (1 RCT) | NR | In the IR and rituximab plus placebo arms, respectively, there were, in total, 12 (16%) vs. 7 (9%) patients with neutropenia; 18 (24%) vs. 21 (28%) patients with anemia; and 5 (7%) vs. 8 (11%) patients with thrombocytopenia | Moderatej | IR likely results in a small increase in neutropenia, but little to no difference in the proportion of patients with anemia or thrombocytopenia | ||
AE = adverse event; CI = confidence interval; DOR = duration of response; IgM = immunoglobulin M; IR = ibrutinib plus rituximab; NE = not estimable; NR = not reported; OS = overall survival; PD = progressive disease; PFS = progression-free survival; RCT = randomized controlled trial; r/r = relapsed or refractory; SAE = serious adverse events; TTNT = time to next treatment; WM = Waldenström macroglobulinemia.
aRated down 1 level due to imprecision. The threshold for important benefit (or harm) was set at 10 patients per 1,000, in consultation with clinical experts and stakeholders. Even though the effect estimate is beyond the threshold, the sample size did not reach the less-restrictive optimal information size.
bRated down by 3 levels for risk of bias because of the single-arm design with no comparator. Rated down 1 level for indirectness because the population is all previously treated with rituximab.
cResults from the r/r and treatment-naive population. Rated down 2 levels for imprecision and 1 level for indirectness. The data come from the overall population (r/r and treatment-naive). The target of the certainty was for no important benefit or harm, and the threshold of clinical importance was also 10 per 1,000; hence, the CIs include plausible benefit and harms.
dDOR is defined as the duration from the initial documentation of response to the date of first documented evidence of PD or death for responders. Only 31 and 9 patients, respectively, responded in the IR and rituximab plus placebo arms; hence, only these 40 patients were included in the analysis.
eRated down 2 levels for imprecision. The target of the certainty aims at no important benefit or harm, but a threshold could not be obtained. Using the null assessment and sample size, we judged that there was very serious imprecision.
fNo thresholds or effect estimates could be obtained for the r/r population. The null assessment was used. Due to this and small sample size, the judgment on imprecision was to rate the evidence down by 2 levels.
gEffect estimates could be obtained and the threshold of 10 per 1,000 patients was used; given this, we did not rate down the evidence for imprecision. However, we rated the evidence down 1 level for indirectness because the population comes from the full set of patients (r/r and treatment-naive) and not the r/r WM population relevant to this CADTH submission.
hRated down 1 level for imprecision due to the sample size being below a not-restrictive optimal information size. The target of certainty was that of an important effect, and it was beyond the threshold of 100 per 1,000 patients considered by clinical experts and the CADTH team.
iNo imprecision was deemed possible because all patients in each arm presented with the event.
jRated down for imprecision only. Even though there were no effect estimates obtained and no thresholds of clinical importance, it was deemed by the review team that the effects might still include important differences.
Source: iNNOVATE Clinical Study Report (2020).15
Efficacy Results
The only possible adjusted comparison was the 1 comparing PC with IR, where the authors used the iNNOVATE study arm with IR patients and compared to patients from the chart review. Despite trying to use PSM and IPTW, the small sample size and imbalances made it challenging to obtain effect estimates.
IR versus ibrutinib monotherapy was a relevant comparison for this CADTH submission; however, no comparison was possible other than a naive comparison of the iNNOVATE IR arm and the single-arm PCYC-1118E study with ibrutinib monotherapy. The HR obtained was 1.25 (95% CI, 0.63 to 2.48). The comparisons of PC versus rituximab plus PC versus IR are described, but the former is not relevant to the submission and the latter was not possible to analyze.
Harms Results
No harms were assessed in the ITCs or adjusted analyses submitted by the sponsor.
Critical Appraisal
All effect estimates from comparisons assessed in the ITCs or adjusted analyses remain very uncertain due to the limitations of the data. These include imbalances in patients characteristics and the nature of the observational data, which generated the possibility of confounding and risk of bias due to the selection of patients, or deviations from the intended interventions. All of these limitations are connected to the infeasibility of conducting any direct or indirect comparisons. Furthermore, the low number of patients and events produced very imprecise effect estimates in situations where HRs could be obtained.
The results of these ITCs or adjusted analyses also have limited applicability and generalizability in current clinical practice in Canada because 1 of the main comparators currently used (zanubrutinib) was not included in the ITCs or adjusted analyses. Furthermore, according to the clinical experts consulted by CADTH, a comparison between ibrutinib monotherapy and zanubrutinib would be more pertinent to practice in Canada because both are gaining attention in the treatment of patients with r/r disease, as opposed to the combination of IR or rituximab monotherapy.
Studies Addressing Gaps in the Evidence From the Systematic Review
Description of Studies
Two studies are included in this section. The first is the single-arm PCYC-1118E study (with a long-term assessment update), which evaluated ibrutinib monotherapy in 63 patients who had a clinicopathological diagnosis of WM, an Eastern Cooperative Oncology Group Performance Status (ECOG PS) of 0 to 2, and had received 1 or more prior treatments.
The second, the ASPEN study (N = 201 for the total population), compared ibrutinib with zanubrutinib in patients with r/r WM (N = 164) after 1 prior line of therapy or in patients with WM who were treatment-naive and who were considered unsuitable for standard immunochemotherapy. The ASPEN study was a randomized, open-label, multicentre, phase III trial comparing the efficacy and safety of ibrutinib and zanubrutinib in patients with WM who met the seventh IWWM consensus criteria.16 Patients were assigned in a 1:1 ratio to receive ibrutinib at an approved dose of 420 mg once daily or zanubrutinib at a dose of 160 mg twice daily. The primary rationale was to demonstrate the superiority of zanubrutinib over ibrutinib, measured by the proportion of patients who experience a complete response (CR) or a very good partial response (VGPR), assessed by an independent review committee (IRC). Secondary end points included IRC-assessed major response rate (MRR), DOR (time from initial qualifying response until progression or death), PFS (time from randomization until progression or death), reductions in bone marrow and extramedullary tumour burden, and harms. OS and changes in QoL were exploratory end points. The study consisted of an initial screening phase, a treatment phase, and a follow-up phase. The study was conducted at 60 centres in 9 countries (Germany, Greece, Italy, Netherlands, Poland, Spain, Sweden, UK, and US).
Efficacy Results
In the PCYC-1118E study, at a median follow-up of 14.8 months, median OS was not reached at the data cut-off (February 28, 2014). In total, 95.2% of patients were alive at the study cut-off. At the landmark of 18 months, the estimated survival rate was 92.7% (95% CI, 76.6% to 97.9%). The 5-year OS rate for all patients was 87%, as shown in the long term evaluation. Median PFS was also not reached at the median follow-up (i.e., time on study) of 14.8 months. The 18-month landmark estimate of PFS per the IRC evaluation was 79.5% (95% CI, 65.8% to 88.2%). The 5-year PFS rate reported for all patients was 54% (95% CI, 39% to 67%). Sustained improvement in hemoglobin was observed in 37 of 63 patients (58.7%) in the all-treated population.
In the ASPEN study, median PFS was not reached in either treatment arm in the 2 cohorts (i.e., r/r or overall population). In the r/r WM population, the event-free rates at 18 months were 81.7% (95% CI, 71.1% to 88.8%) in the ibrutinib and 85.9% (95% CI, 73.7% to 92.7%) in the zanubrutinib arm. In the overall population, after a median follow-up of 18.0 and 18.5 months, respectively, 15 (15%) patients in the ibrutinib and 16 patients (16%) in the zanubrutinib arm progressed or died. Median OS was not reached in either treatment arm of the r/r or overall populations. There were 8 deaths reported in the ibrutinib arm (all in the r/r population), and 6 deaths in the zanubrutinib arm (3 in the r/r population). Event-free rates for patients in the ibrutinib and zanubrutinib treatment arms were 93.9% (95% CI, 86.8% to 97.2%) and 97.0% (95% CI, 90.9% to 99.0%), respectively, at 12 months, and 92.8% (95% CI, 85.5% to 96.5%) and 97.0% (95% CI, 90.9% to 99.0%), respectively, at 18 months. When assessing DOR, the median duration of CR or VGPR and MRR was been reached in the overall or r/r populations in either treatment arm in patients who had experienced a response to study treatment. Four events occurred in patients with a VGPR or CR in the ibrutinib arm, and 1 event occurred in patients with a VGPR or CR in the zanubrutinib arm. Among patients who experienced a major response, 9 events occurred in the ibrutinib arm and 6 events occurred in the zanubrutinib arm. Event-free rates at 12 months and 18 months for patients in the ibrutinib arm who experienced a major response were 87.9% (95% CI, 77.0% to 93.8%) and 87.9% (95% CI, 77.0% to 93.8%), respectively. Median TTNT was not reached. Data showed that 9 patients in the ibrutinib arm and 6 patients in the zanubrutinib arm had begun nonprotocol anticancer therapy. The median time to initiation of nonprotocol anticancer therapy were 6.44 months in the ibrutinib treatment arm and 6.83 months in the zanubrutinib treatment arm.
Harms Results
In the ASPEN study, the most common AEs in the ibrutinib arm (overall population) were diarrhea (31.6%), upper respiratory tract infection (28.6%), contusion (23.5%), and muscle spasms (23.5%). In the zanubrutinib arm, the most common AEs were neutropenia (24.8%), upper respiratory tract infection (23.8%), and diarrhea (20.8%).
SAEs were reported in 40 patients (40.8%) in the ibrutinib treatment arm and in 40 patients (39.6%) in the zanubrutinib treatment arm. The most common SAE in the ibrutinib treatment arm was pneumonia (9 patients [9.2%]), followed by pyrexia (3 patients [3.1%]) and sepsis (3 patients [3.1%]). The most common SAEs in the zanubrutinib treatment arm were febrile neutropenia, influenza, and neutropenia (each reported by 3 patients [3.0%]). In total, 7 patients (7.1%) in the ibrutinib treatment arm and 6 patients (5.9%) in the zanubrutinib treatment arm died during the study. Deaths due to AEs occurred in 2 patients treated with ibrutinib and 1 patient treated with zanubrutinib.
When assessing harms of special interest, neutropenia was reported in 12 patients (13%) in the ibrutinib arm and 25 patients (29%) in the zanubrutinib arm. Hemorrhage (including minor and major bleeding) was reported in 58 patients (59.2%) in the ibrutinib arm and 49 patients (48.5%) in the zanubrutinib arm. Cardiovascular events included atrial fibrillation or flutter and were reported in 14 patients (14.3%) in the ibrutinib arm and 2 patients (2.0%) in the zanubrutinib treatment arm.
Critical Appraisal
The open-label, nonrandomized design with no concurrent comparator is a key limitation of the PCYC-1118E study; hence, any treatment effects observed might not be helpful when estimating causal effects and should be interpreted with caution.
The ASPEN trial was a randomized, phase III, open-label design. Randomization was stratified based on relevant prognostic factors, which included CXCR4WHIM mutational status and prior lines of therapy. Appropriate methods of randomization and treatment allocation were implemented, which reduced the potential for selection bias. The study was generally well balanced with respect to patient baseline demographic and disease characteristics, suggesting that randomization was successful. The open-label design may have introduced bias for subjective outcomes such as AE and HRQoL outcomes, although these were not of concern, according to the clinical experts consulted by CADTH.
The primary end point and key secondary end points were appropriate and adequately described. Data were immature for time-to-event outcomes, and median PFS and OS were not reached in either treatment arm. There were no methods or techniques outlined to account for missing data, and no methods were described for imputing data. The absence of appropriate methods to account for missing data may have introduced bias in the assessment of efficacy outcomes. The direction of bias is unclear. Sensitivity analyses were conducted for the primary outcome, although it was unclear whether there were major differences between the primary and the sensitivity analyses. There were no credible subgroup effects observed. Subgroup analyses were predefined, and the results presented were consistent with the primary analyses.
Conclusions
The evidence evaluating the use of ibrutinib, with or without rituximab, in patients with r/r WM consisted of 1 RCT comparing IR with rituximab plus placebo, 1 RCT comparing ibrutinib with zanubrutinib, and 2 single-arm studies of ibrutinib monotherapy. Evidence from the indirect comparisons (adjusted analyses) had serious limitations that precluded the use of their effect estimates to draw conclusions.
The body of evidence included in this report provides information on the effects of ibrutinib or IR on the outcomes of PFS, OS, DOR, TTNT, hematological improvements, and harms. All these are considered critical outcomes for decision-making by clinical experts, patient groups, and stakeholders. The evidence shows that the combination of IR, compared to rituximab plus placebo, likely results in higher rates of PFS and a larger proportion of patients with sustained hemoglobin improvements. The effects on DOR and TTNT were less certain, but show that IR likely results in improvements of clinical significance for these end points. Meanwhile, the effects on OS were very uncertain due to study limitations and imprecision.
One RCT showed no evidence of a difference between zanubrutinib and ibrutinib for PFS rates or OS rates, and there is still uncertainty about the difference in effects on hematological values, DOR, and TTNT between these 2 interventions.
Ibrutinib, with or without rituximab, was well tolerated, and the number of AEs was similar to that in the rituximab plus placebo group. However, IR likely results in more SAEs and events of atrial fibrillation and neutropenia than rituximab plus placebo. Atrial fibrillation was also more common with ibrutinib than zanubrutinib. Among the harms of special interest, neutropenia was reported more commonly with zanubrutinib than with ibrutinib. Clinical experts consider these events to be manageable and expected among patients with r/r WM, who might value their options differently, based on the outcomes of benefits against harms.
Overall, the use of ibrutinib, with or without rituximab, likely yields better estimates of survival without progression than rituximab alone. Furthermore, ibrutinib and zanubrutinib demonstrate comparable efficacy, although zanubrutinib has a better safety profile.
Introduction
The objective of this report is to review and critically appraise the evidence submitted by the sponsor on the beneficial and harmful effects of ibrutinib, 420 mg capsules, taken orally, with or without rituximab, for the treatment of adults with previously treated r/r WM.
Disease Background
The contents within this section have been informed by materials submitted by the sponsor and clinical expert input. The following has been summarized and validated by the CADTH review team.
NHLs are a group of more than 60 types of cancer that originate from cells of the lymphatic system (i.e., B-cells, T-cells, and natural killer cells).1,2 In 2022, NHL was the sixth most diagnosed cancer in Canada, with about 6,600 new cases and 1,700 related deaths projected in males and 4,800 new cases with 1,250 related deaths in females.17 WM is a low-grade, slow-growing cancer that is also considered a subtype of lymphoplasmacytic lymphoma, developing from malignant B-cells.3,4 Typical characteristics of WM include the overproduction of monoclonal IgM antibodies due to changes in malignant cells to B-cells during maturation and the infiltration of lymphoplasmacytic cells into bone marrow by malignant cells, leading to cytopenia. Typical clinical manifestations of the disease include hyperviscosity, cytopenia, lymphadenopathy, organomegaly, hemolytic anemia, peripheral neuropathy, and cryoglobulinemia.3
WM is a rare form of NHL, comprising of about 1% to 2% of all hematologic malignancies. The incidence in Canada and the US is estimated to be about 4 cases per 1,000,000 persons. About 150 new WM cases are reportedly diagnosed yearly in Canada, with an overall prevalence estimated at 1,500 cases. Males and older adults have a higher risk of developing WM than people in other demographic groups.5 The median age at diagnosis is 72 years. Risk factors include genetic susceptibility and strong familial aggregation. The median life expectancy at diagnosis is between 4 and 12 years, with a 10-year OS rate of 69% (95% CI, 62% to 74%).6 Other risk factors include IgM monoclonal gammopathy of undermined significance, which reportedly confers a 46-fold higher relative risk than in the general population. Age, sex (males are at higher risk), and race are also included as risk factors.
Symptoms of WM include fatigue, unexplained weight loss, enlarged lymph nodes or spleen, numbness, weakness or other nervous system problems, pain in the hands or feet (also called peripheral neuropathy), abdominal swelling and diarrhea, and shortness of breath, and infections. Hyperviscosity symptoms may include vision problems (especially blurred or double vision), confusion, dizziness, loss of coordination, headaches, nosebleeds, or bleeding gums.3
Patients are assessed at diagnosis for prognostic risk factors, according to the International Prognostic Scoring System (IPSS), which includes age (> 65 years), beta-2 microglobulin (> 3 mg/L), anemia (hemoglobin ≤ 11.5 g/dL), thrombocytopenia (≤ 100 × 109/L), IgM monoclonal gammopathy (> 7.0 g/dL), and a 5-year survival, which ranges from 36% to 87% in high-risk and low-risk patients, respectively.2 Patients considered low-risk (those with no risk factors except age) have an 87% 5-year survival rate; intermediate-risk patients (those with 2 risk factors or those older than 65 years) have a 68% chance; and high-risk patients (those with more than 2 risk factors) have a 36% chance of a 5-year survival.
Standards of Therapy
The contents within this section have been informed by materials submitted by the sponsor and clinical expert input. The following has been summarized and validated by the CADTH review team.
The treatment goals highlighted by the sponsor and confirmed by the clinical experts consulted by CADTH include disease (symptom) control, preventing end-organ damage, and maximizing HRQoL.7 Treatment initiation depends on clinical and laboratory criteria. Clinical manifestations, such as fatigue, anemia, cryoglobulinemia, and hyperviscosity syndrome, and tolerance of medications and the avoidance of short-term and long-term toxicity are taken into consideration.
The clinical experts also noted that asymptomatic patients can be followed by active surveillance, and some may continue in an asymptomatic phase for years before treatment is indicated. The majority of patients with WM who require treatment in Canada are treated with combined CIT in the first-line setting. Most commonly, this would be with BR in the frontline. Other regimens (such as rituximab plus cyclophosphamide plus vincristine plus prednisone [R-CVP], rituximab plus cyclophosphamide plus dexamethasone (RCd), and bortezomib-containing combinations) are occasionally used. BTK inhibitors have demonstrated efficacy in both treatment-naive and relapsed WM, but in Canada, the majority of patients typically receive CIT in the first-line setting, given the preference for time-limited therapy.
Treatment response in patients with WM is primarily determined by a reduction in the serum IgM protein, in addition to the presence or absence of clinical manifestations of active and extramedullary disease.8
Frontline Settings
Rituximab is a generally well tolerated intervention available in the first-line setting, and is often used in combination with other treatments (such as chemotherapy) to maximize response.5 For instance, BR followed by rituximab maintenance is a commonly implemented treatment combination in clinical practice.10 For patients who do not tolerate BR, dexamethasone plus rituximab plus cyclophosphamide (DRC) or bortezomib-based therapy may be considered. Other less common regimens include fludarabine and alkylating drugs (chlorambucil), which may be used in combination with each other or different therapies. Most patients who relapse after first-line treatment will go on to receive a subsequent therapy.9
r/r Setting
BTK inhibitors (ibrutinib and zanubrutinib) are the most common treatment options for patients with r/r disease after CIT failure.7,10 Ibrutinib monotherapy is a commonly used second-line treatment, according to the Cancer Care Alberta;10 however, access is limited to compassionate programs and private insurers. Zanubrutinib is currently approved and reimbursed across provincial jurisdictions in Canada.7 Other therapies highlighted by Cancer Care Alberta for previously treated patients with r/r WM in the second-line setting include bortezomib-based regimens, which typically include bortezomib in combination with rituximab (if not used in first-line treatment) or bortezomib in combination with cyclophosphamide, dexamethasone, and rituximab (R-CyBorD). High-dose chemotherapy regimens (such as rituximab plus cyclophosphamide plus doxorubicin plus vincristine plus prednisone [R-CHOP] and R-CVP), along with purine analogues (such as fludarabine, and alkylators, such as chlorambucil), are also used but are reserved for those who have experienced multiple relapses.10
Drug Under Review
Ibrutinib is an oral, first-in-class, BTK inhibitor that specifically targets PCI-45227.11 The key characteristics of ibrutinib are summarized in Table 3, as are those of other treatments available for WM.
Ibrutinib received Health Canada approval for the following indication on March 31, 2016: “the treatment of adult patients with Waldenström macroglobulinemia (WM).” Later, on February 11, 2019, ibrutinib received Health Canada approval for another indication: in combination with rituximab for the treatment of adult patients with WM.
Ibrutinib is also approved in Canada for the following indications:
For the treatment of adults with previously untreated CLL, including those with 17p deletion
In combination with obinutuzumab for the treatment of adults with previously untreated CLL, including those with 17p deletion
In combination with rituximab for the treatment of adults with previously untreated CLL
For the treatment of adults with CLL who have received at least 1 prior therapy, including those with 17p deletion
In combination with BR for the treatment of adults with CLL who have received at least 1 prior therapy
For the treatment of adults with r/r mantle cell lymphoma
For the treatment of adults with marginal zone lymphoma who require systemic therapy and have received at least 1 prior anti-CD20-based therapy
For the treatment of adults with steroid-dependent or refractory chronic graft versus host disease.
Ibrutinib has been reviewed by other Health Technology Assessment agencies for similar indications. A negative recommendation was issued by the INESSS in 2017 for the treatment of patients with WM, and NICE issued a negative recommendation on June 8, 2022.12 Ibrutinib in combination with rituximab has not been reviewed by CADTH, INESSS, or NICE for adults with previously treated r/r WM.
The requested listing criteria for ibrutinib are for a subpopulation of the Health Canada indication and the clinical trial populations. Specifically, ibrutinib with or without rituximab is indicated for the treatment of adults with previously treated r/r WM.
Mechanism of Action
B-cell receptor signalling is a key mechanism of disease progression in B-cell malignancy, and BTK has a pivotal role in the signalling cascade.18,19 Ibrutinib is an oral, first-in-class, targeted BTK inhibitor.20 Specifically, the target of ibrutinib and its active metabolite, PCI-45227, is a cysteine residue located on site 481 within the adenosine triphosphate (ATP)–binding domain of BTK. Both molecules bind covalently and irreversibly to this residue, providing potent and sustained inhibition of BTK enzymatic activity.18,19 Thus, ibrutinib has a strong biologic rationale for use in patients with WM, given its ability to inhibit the pathways involved in BTK signalling. Notably, ibrutinib also inhibits pathways involved in tumour growth and survival initiated by the MYD88L265P mutation, a distinct mutation of WM that is present in more than 90% of patients.21,22
Table 3: Key Characteristics of Ibrutinib and Relevant Comparators
Characteristic | Ibrutinib | Rituximab | Zanubrutinib | PC |
|---|---|---|---|---|
Mechanism of action | BTK inhibitor. B-cell receptor signalling is a key mechanism of disease progression in B-cell malignancy, and BTK has a pivotal role in the signalling cascade | Monoclonal antibody that targets CD20 proteins on the cell surface of B-cells | BTK inhibitor. B-cell receptor signalling is a key mechanism of disease progression in B-cell malignancy, and BTK has a pivotal role in the signalling cascade | Varies |
Indicationa | Monotherapy or in combination with rituximab for previously treated or untreated WM | r/r low-grade or follicular, CD20-positive, B-cell NHL (WM is a subtype of NHL) | Patients with WM | Untreated or previously treated patients with WM |
Route of administration | Oral | IV | Oral | Varies |
Recommended dose | 420 mg. Three 140 mg capsules once daily until disease progression or no longer tolerated If applicable, rituximab is administered as an IV dose of 375 mg/m2 Infusions on day 1 of weeks 1 to 4 and 17 to 20 | 375 mg/m2 Every 3 months until disease progression or for a maximum period of 2 years | 320 mg. Four capsules of 80 mg once daily or two 80 mg capsules twice daily | Varies |
Serious adverse effects or safety issues | Major bleeding events, fatal and serious cardiac arrhythmias have been reported Caution in patients with severe hepatic impairment | Progressive multifocal leukoencephalopathy Infusion reactions (fatal) have been reported Tumour lysis, hepatitis B reactivation, serious infections, and cardiovascular events | Serious hemorrhages Atrial fibrillation and flutter Cytopenias, serious infections, and tumour lysis syndrome have been reported | Varies |
Other | Treatment with rituximab should be withheld immediately at the first sign or symptom of progressive multifocal leukoencephalopathy | Treatment with rituximab should be withheld immediately at the first sign or symptom of progressive multifocal leukoencephalopathy | Monitoring requirements | Monitoring requirements |
BTK = Bruton tyrosine kinase; NHL = non-Hodgkin lymphoma; PC = physician’s choice; r/r = relapsed or refractory; WM = Waldenström macroglobulinemia.
Note: PC regimens for r/r WM in the Canadian health care landscape include bendamustine plus rituximab; dexamethasone plus rituximab plus cyclophosphamide; rituximab plus cyclophosphamide plus hydroxydaunorubicin plus oncovin plus prednisone; chlorambucil; cyclophosphamide plus bortezomib plus dexamethasone; rituximab plus fludarabine; fludarabine, rituximab plus cyclophosphamide plus vincristine plus prednisone; and stem cell transplant.
aHealth Canada–approved indication.
Sources: Product monograph for Imbruvica23 and Cancer Care Ontario product monographs.24-27
Stakeholder Perspectives
Patient Group Input
This section was prepared by the CADTH review team based on the input provided by patient groups. The full original patient input(s) received by CADTH have been included in the Stakeholder section of this report.
Two patient groups provided input for this submission: the Waldenström’s Macroglobulinemia Foundation of Canada and LC. The Waldenström’s Macroglobulinemia Foundation of Canada is a patient group in Canada devoted exclusively to WM. Their activities include funding WM research and providing patient support services. LC, in contrast, is a national Canadian registered charity with a mission to empower patients and the lymphoma community through education, support, advocacy, and research.
Input from the LC group was gathered from an anonymous online survey, which ran from May 26 to June 29, 2023, and was circulated by email and on social media outlets. The LC group collaborated with the Waldenström’s Macroglobulinemia Foundation of Canada to promote access to the survey for members in Canada. Of the 291 participants that contributed to the survey, 101 identified as Canadian. The majority of the respondents (43%) were aged between 65 and 74 years and 57% identified as male. Most respondents reported that they had been diagnosed with WM for more than 9 years but did not know the chromosome abnormalities associated with the diagnosis. Forty-nine respondents (24 in Canada) had experience with ibrutinib and 12 respondents (4 in Canada) had experience with IR.
When respondents to the LC survey were asked to describe how WM had impacted their QoL at diagnosis, the most common symptoms expressed (rated 3 out of 5) were fatigue (65%), anemia (52%), and night sweats (11%). Stress of diagnosis (62%) and anxiety or worry (58%) were the most common psychosocial impacts reported. Respondents further indicated that fatigue (47%), body aches and pains (29%), and anemia (22%) were the most common symptoms that impacted the current day-to-day QoL of these patients; anxiety or worry (40%) and difficulty sleeping (22%) were still the most common psychosocial symptoms reported. Only 24% of patients reported that they had experienced no psychosocial symptoms. Overall, the majority of respondents noted that WM had a minimal impact on their activities, such as the ability to fulfill family obligations, complete household chores, spend time with family and friends, travel, or volunteer or work. Some respondents expressed concerns about contracting infections, such as COVID-19, and about the treatment duration of current therapies.
The most Important outcomes highlighted by respondents to the LC survey were the control of disease and symptoms (100%), extended remission (97%), improvement in QoL (96%), longer survival (94%), and fewer side effects (82%). Sixty-four percent of the respondents emphasized the importance of having a choice of treatments, and 62% preferred the availability of various treatment options. The majority of respondents (71%) indicated that they were willing to tolerate treatment side effects, provided they were short-term. Fatigue (79%), headache or cognitive changes (66%), and changes in vision (52%) were the most common symptoms reported by respondents that required management.
About half the respondents (52%) to the LC survey indicated that treatment was initiated after diagnosis, and 48% reported going through a period of watch and wait before treatment initiation. In total, 34% (n = 82) of respondents reportedly received at least 1 line of therapy, 47% (n = 114) had received 2 or more lines, and 18% (n = 43) were currently not on any treatment. Common treatments reported in the first-line setting included BR, rituximab, fludarabine-based chemotherapy (fludarabine plus cyclophosphamide [FC] or fludarabine plus cyclophosphamide plus rituximab [FCR]), BTK inhibitors (ibrutinib), rituximab plus cyclophosphamide plus hydroxydaunorubicin plus oncovin plus prednisone (R-CHOP), and bortezomib plus dexamethasone plus rituximab (BDR). Most respondents stated that they were pleased with their current treatment options and, when asked to rate how their treatment managed symptoms on a scale of 1 (strongly disagree) to 10 (strongly agree), 68% of respondents reported a score of 7 or higher for their frontline treatment and 54% reported the same score for treatments in the r/r setting.
The most common side effects after therapy reported in the LC survey included fatigue (65%), low white blood cell counts (35%), brain fog (34%), low red blood cell counts (32%), nausea and/or vomiting (30%), skin rashes (28%), and constipation (25%). Respondents explained that the most difficult AEs to tolerate were fatigue, brain fog, neuropathy, and nausea. Of the 96 respondents from Canada who provided input on WM treatments in the survey, 71% indicated that they had little or no difficulty accessing their current or most recent treatment, 78% indicated that they had local access to treatment, 54% reported no financial impact associated with WM treatment, and 25% indicated that they needed to pay out-of-pocket for travel costs. Overall, 66% of respondents who had received at least 1 therapy reported that they were satisfied or very satisfied with their treatment, and 38% of respondents with r/r disease expressed satisfaction with their treatments.
Of the 61 respondents who indicated that they had received ibrutinib in the r/r setting, 49 had received it as monotherapy and 12 had received it in combination with rituximab. The majority of respondents reported that they had received their WM diagnosis in the previous 3 to 5 years, were currently undergoing or were about to start treatment, and had access to ibrutinib through a compassionate access program or public and/or government program. Half of the respondents reported that ibrutinib controlled symptoms such as fatigue, 42% reported that it controlled anemia, and 32% reported that it controlled night sweats. The Waldenström’s Macroglobulinemia Foundation of Canada mentioned that zanubrutinib, another BTK inhibitor, is approved and currently funded in 4 jurisdictions in Canada. They noted that the 2 therapies are equally effective for WM but have different toxicity profiles, which may be play a role in treatment selection.
Clinician Input
Input From Clinical Experts Consulted by CADTH
All CADTH review teams include at least 1 clinical specialist with expertise in the diagnosis and management of the condition for which the drug is indicated. Clinical experts are a critical part of the review team and are involved in all phases of the review process (e.g., providing guidance on the development of the review protocol, assisting in the critical appraisal of clinical evidence, interpreting the clinical relevance of the results, and providing guidance on the potential place in therapy). The following input was provided by 2 clinical specialists with expertise in the diagnosis and management of WM.
Unmet Needs
Treatment goals of any therapy for patients with WM include durable remissions, stopping progression, improving QoL, and reducing symptom burden, all while reducing possible toxicity. WM is considered an incurable hematological malignancy.
Until recently, BTK therapy in Canada for either patients with r/r disease or who were treatment-naive was only available through access programs or private insurance. Zanubrutinib is a BTK inhibitor that was recently approved to be funded in most provinces for relapsed WM. Although generally well tolerated, there are patients who stop zanubrutinib due to side effects, so there is a need for an alternate BTK inhibitor for patients whose disease does not respond to initial treatment for relapsed WM.
Place in Therapy
According to the clinical experts, it would be reasonable to have another of BTK inhibitor option. Even if zanubrutinib is preferred because of its safety profile, shown in studies of patients with WM and other indolent lymphoproliferative disorders (in particular with respect to risk of atrial fibrillation and bleeding due to platelet inhibition), ibrutinib can have a role among patients who are intolerant to zanubrutinib and a place in therapy as another available option for patients with WM.
Patient Population
The clinical experts noted that there are no good data comparing BTK inhibitors with and without rituximab. Rituximab can work well in patients with WM and should be given to those who receive CIT. According to the experts, it is unclear how much rituximab will extend remissions achieved with BTK inhibitors.
The clinical experts noted that it is also unclear how much the addition of rituximab to BTK inhibitors benefits current treatments paradigms. The experts added that there are no specific patient criteria to identify who would preferentially be best for ibrutinib, other than the logical step of using ibrutinib in patients who do not experience a response to, or are intolerant to, zanubrutinib. The clinical specialists acknowledged that there are very few data describing the success of switching from zanubrutinib to ibrutinib for intolerance; hence, this may be an infrequent situation if both drugs are funded. Both experts said they would work under the assumption that criteria for ibrutinib and zanubrutinib would be similar in most cases. There is no good evidence to suggest restricting the use of BTK inhibitor therapy by mutation status or using BTK inhibitor therapy as a criterion for the initiation of therapy.
WM is typically diagnosed by pathologists with expertise in hematologic pathology and/or lymphoproliferative disorders based on standard international criteria. There can sometimes be diagnostic uncertainty between lymphoplasmacytic lymphoma or WM and some other indolent B-cell lymphoproliferative disorders. Notably, BTK inhibitors are generally effective treatment for these other malignancies as well.
The clinical experts commented on a note from the drug program input in relation to patients who experienced disease relapse fewer than 12 months from their last rituximab exposure (or did not experience a minor response). These patients were included in the main trial comparing ibrutinib monotherapy with IR; however, in Canada, provinces typically do not fund rituximab re-treatment in this subgroup of patients. The clinicians did not expect to find differences between patients who relapse early and those who relapses late, but there is no evidence that leads to a definite conclusion.
The clinicians and drug plans also pointed out that patients with CNS lymphoma could be eligible for treatment with ibrutinib (as described in Table 4).
Assessing the Response Treatment
According to clinical experts, response to treatment is assessed clinically with blood counts and chemistry tests. In rare cases, a bone marrow biopsy is used or repeated if the hematological values are not improving as expected. Successful therapy for WM is expected to lead to improvements in cytopenias and reductions in IgM monoclonal protein. These patients frequently have B symptoms, and subjective reductions in B symptoms are also a meaningful benefit in patients with WM. Imaging studies for patients presenting with adenopathy and/or splenomegaly may be performed after treatment and at the time of suspected relapse.
Discontinuing Treatment
The clinical experts noted that discontinuation of ibrutinib should be considered at the time of disease progression or intolerable AEs, although dose reduction could be considered in the latter case, as lower doses can maintain efficacy with a more favourable side effect profile. Failure of efficacy is typically noted after new progressive cytopenias (anemia most commonly) and increases in IgM monoclonal protein.
Prescribing Considerations
WM is a rare condition that should generally be managed by hematologists or oncologists with experience in treating lymphoproliferative disorders, although the prescription of BTK inhibitors would generally be within the scope of hematologist and medical oncologist training in Canada. Oncology nurse practitioners or general practitioners with a scope that includes lymphoproliferative diseases may be involved in the care of patients with WM in some practice settings. Generally, W BTK inhibitor therapy is delivered in an outpatient setting. Patients with WM may, however, require hospitalization due to complications of disease or treatment. Some complications, such as hyperviscosity, may require special treatments (e.g., plasmapheresis) that are only available at specialized (generally tertiary care) centres.
Clinician Group Input
This section was prepared by the CADTH review team based on the input provided by clinician groups. The full original clinician group input(s) received by CADTH have been included in the Stakeholder section of this report.
Input from 1 clinician group, the OH-CCO Hematology Cancer Drug Advisory Committee, was summarized for this submission. The OH-CCO’s Cancer Drug Advisory Committee provides timely evidence-based clinical and health system guidance on drug-related issues in support of Cancer Care Ontario’s mandate, including the Provincial Drug Reimbursement Programs and the Systemic Treatment Program. Information from this group was gathered during a videoconference.
The OH-CCO Hematology Cancer Drug Advisory Committee highlighted the following important goals for patients with WM: reducing paraprotein levels, reducing symptoms, improving blood counts, and improving QoL. The group emphasized that zanubrutinib is available for patients with WM in the r/r setting and is accessed through employee assistance programs. Other treatments highlighted included chemotherapy (e.g., bendamustine or CVP) in combination with rituximab or bortezomib. The group explained that current BTK inhibitors (e.g., zanubrutinib) do not address treatment gaps for patients with WM; thus, they are uncertain whether the addition of rituximab to a BTK inhibitor will be more beneficial than a BTK inhibitor alone. The group noted that the addition of ibrutinib alone or IR may be a beneficial alternative for patients with WM in the second-line setting or beyond, and added that ibrutinib may be an appropriate alternative for patients who are intolerant to zanubrutinib. The group indicated that the patients least suited for this treatment are those for whom BTK inhibitors are contraindicated and/or those with a history of severe reactions to rituximab. The group indicated that response to treatment is assessed by evaluating IgM and paraprotein levels, blood counts, and symptom burden. Factors such as significant intolerance to treatment (bleeding, atrial fibrillation), disease progression, or lack of response will be assessed when treatment discontinuation is being considered, according to the group. The group noted that ibrutinib is best administered in an outpatient setting.
Drug Program Input
The drug programs provide input on each drug being reviewed through CADTH’s reimbursement review processes by identifying issues that may impact their ability to implement a recommendation. The implementation questions and corresponding responses from the clinical experts consulted by CADTH are summarized in Table 4.
Table 4: Summary of Drug Plan Input and Clinical Expert Response
Drug program implementation questions | Clinical expert response |
|---|---|
Relevant comparators | |
Zanubrutinib received a positive pERC recommendation for patients with previously treated, relapsed or refractory (r/r) WM and is funded in most jurisdictions at the time of this input. In patients who have a long response to initial therapy, the same therapy may be reinitiated in some cases. Alternate chemoimmunotherapy (e.g., R-CHOP, R-CVP, R-fludarabine) may also be used in some patients, depending on the timing of relapsed disease. A bortezomib-based regimen is also sometimes used in previously treated patients with r/r WM, if not used in the first-line. | For pERC deliberations. |
Considerations for initiation of therapy | |
Which patients should receive ibrutinib monotherapy vs. ibrutinib in combination with rituximab? Are there differences in the expected outcomes between ibrutinib monotherapy and ibrutinib in combination with rituximab? | The clinical experts mentioned that the data are still too uncertain to assert definitive conclusions on this question. Rituximab may add some value to ibrutinib monotherapy, but it remains to be confirmed with more data. Both experts were comfortable using only ibrutinib. |
Should patients who have been previously treated with a BTK inhibitor be eligible for ibrutinib? | Clinical experts agree that patients can be eligible for ibrutinib, but only if they have not shown any progression of the disease on another BTK inhibitor (i.e., as long as they are not refractory to a BTK inhibitor). |
The iNNOVATE clinical trial evaluating ibrutinib + rituximab vs. rituximab monotherapy included patients who experienced disease relapse less than 12 months from their last rituximab exposure or who did not experience a minor response with a prior rituximab-containing regimen. Provinces typically do not fund rituximab re-treatment if disease relapse occurs less than 6 months (and some provinces may use 12 months) from the completion of rituximab therapy. If both ibrutinib monotherapy and ibrutinib in combination with rituximab are recommended for previously treated patients with r/r WM, provinces may only be able to implement ibrutinib monotherapy for patients who experience disease relapse less than 6 months (or 12 months in some provinces) from the completion of rituximab therapy. Are the iNNOVATE trial data generalizable to patients who had a disease-free interval of at least 6 months from their last rituximab exposure? | There is uncertainty about generalizability in this case, according to the experts, mainly due to the lack of data and experience in Canada with ibrutinib monotherapy for patients relapsing in a short period of time (whether 6 or 12 months) (i.e., there are no data to compare those who relapsed in less than 12 months to those who relapsed after 12 months with which to reach a judgment of the generalizability and applicability of the results). |
Should patients with CNS lymphoma be eligible? | Yes. There are some data that support the crossing of the blood-brain barrier. |
Should patients with evidence of disease transformation to a rapidly progressive, high-grade malignant lymphoma be eligible? | If there's biopsy-confirmed transformation, the patient should not be treated with this drug. According to the experts, if patients have a biopsy-proven transformation to aggressive lymphoma, that would indicate it is not WM and would not be part of the indication being discussed. |
Consider alignment with the reimbursement criteria for zanubrutinib for patients with r/r WM. | For pERC deliberations. |
Considerations for continuation or renewal of therapy | |
None | Not applicable. |
Considerations for discontinuation of therapy | |
Are the seventh IWWM response criteria used in Canada to determine response or loss of response to treatment? | In the clinical experts’ opinion, it varies. As they perceive it, the seventh IWWM criteria are used by some clinicians treating patients with WM to determine progression. |
Should these criteria be used to determine the progression of disease and when to discontinue ibrutinib ± rituximab? | They are used mainly for progression rather than response. The former is more clinically meaningful, according to the experts. |
What other criteria are used to determine disease progression or when to stop therapy? | Clinical measure in practice of progression and toxicity are typical among practitioners in Canada seeing patients with WM. |
For patients on the combination of ibrutinib and rituximab who experience disease relapse after completion of rituximab therapy, can ibrutinib be continued and can rituximab be reinitiated at the time of relapse? | Experts mentioned that there is likely no clinical value in the strategy of restarting rituximab if patients have started with rituximab plus ibrutinib, stopped rituximab, and then progressed. . |
For patients on ibrutinib monotherapy who experience disease relapse, can rituximab be added to ibrutinib at the time of relapse? | As in the previous question, the clinical experts considered that the data are insufficient to make a strong recommendation, but overall, they would not manage this situation with the addition of rituximab to ibrutinib. |
In the PCYC-1118E study with ibrutinib monotherapy, treatment was continued for 40 months, with an option to continue with commercial therapy in an extension study thereafter. Should ibrutinib monotherapy end after 40 months? | The decision to stop should not be based on time, but rather on disease progression and the toxicity of the drug. |
Consider alignment with the stopping criteria for zanubrutinib in patients with r/r WM. | For pERC deliberations. |
Considerations for prescription of therapy | |
In the iNNOVATE clinical trial that combined ibrutinib with rituximab, IV rituximab was administered on day 1 of week 1 and then weekly for 4 consecutive weeks, followed by a second 4-weekly rituximab course after a 3-month interval (weeks 1, 2, 3, 4 and weeks 17, 18, 19, 20). Should this schedule of rituximab be used in clinical practice when combined with ibrutinib? | Clinical experts considered this a reasonable suggestion and, if reimbursed, it should be administered as it was in the study, but they cannot make this a strong recommendation due to the lack of a direct comparison to a no-rituximab (ibrutinib monotherapy) regimen. |
Can subcutaneous rituximab be substituted for IV rituximab? | Yes. |
Can ibrutinib be used with biosimilar rituximab? | Yes. |
Consider alignment with prescribing criteria for zanubrutinib for r/r WM | For pERC deliberations. |
Generalizability | |
Should patients currently receiving alternate therapy for previously treated r/r WM (including zanubrutinib) be switched to ibrutinib monotherapy or ibrutinib in combination with rituximab? | Not in combination with rituximab. The best data available are for the comparison of ibrutinib monotherapy with zanubrutinib, and the clinical experts would advocate more for the ibrutinib monotherapy . |
System and economic issues | |
Zanubrutinib has successfully completed price negotiations through the pCPA for previously treated r/r WM. Biosimilar IV rituximab and subcutaneous rituximab have also successfully completed price negotiations through pCPA. Generic bortezomib is also available. | For pERC deliberations. |
BTK = Bruton tyrosine kinase; CNS = central nervous system; IWWM = International Workshop on Waldenström’s Macroglobulinemia; pCPA = pan-Canadian Pharmaceutical Alliance; pERC = CADTH pan-Canadian Oncology Review Expert Review Committee; r/r = relapsed or refractory; R-CHOP = rituximab plus cyclophosphamide plus doxorubicin plus vincristine plus prednisone; R-CVP = rituximab plus cyclophosphamide plus vincristine plus prednisone; R-fludarabine = rituximab plus fludarabine; WM = Waldenström macroglobulinemia.
Clinical Evidence
The objective of CADTH’s Clinical Review Report is to review and critically appraise the clinical evidence submitted by the sponsor on the beneficial and harmful effects of ibrutinib as monotherapy and in combination with rituximab for the treatment of patients with WM. The focus will be placed on ibrutinib relative to relevant comparators and the identification of gaps in the current evidence.
A summary of the clinical evidence submitted by the sponsor in the review of ibrutinib is presented in 4 sections, with CADTH’s critical appraisal of the evidence included at the end of each section. The first section, the Systematic Review, includes pivotal studies and RCTs that were selected in accordance with the sponsor’s systematic review protocol. CADTH’s assessment of the certainty of the evidence in this first section using the GRADE approach follows the critical appraisal of the evidence. The second section includes sponsor-submitted long-term extension studies. The third section includes indirect evidence from the sponsor. The fourth section includes additional studies that were considered by the sponsor to address important gaps in the systematic review evidence.
Included Studies
Clinical evidence from the following sources is included in the CADTH review and appraised in this document:
1 pivotal study identified in the sponsor’s systematic review
2 additional studies providing additional evidence
1 report that includes several ITCs of relevant comparators of ibrutinib.
Systematic Review
The contents of this section have been informed by materials submitted by the sponsor. The information has been summarized and validated by the CADTH review team.
Description of Studies
A total of 8 studies were included in the sponsor’s systematic literature review: 4 trials with published results, and 4 trials without published results. Of the 4 trials with published results, 2 were phase III randomized trials (iNNOVATE and ASPEN) and 2 were single-arm, phase II trials (PCYC-1118E and NCT02604511). The following 4 studies without published results were not included in this report: a phase III RCT (CZAR-1), a phase II/III RCT (RAINBOW), a phase IV nonrandomized trial (NCT04042376), and a single-arm phase II trial (NCT04062448).
The iNNOVATE study —the pivotal phase III RCT —is summarized in Table 5. This study also provides data from a single-arm, open-label substudy that evaluated patients who had a centrally confirmed diagnosis of WM, an ECOG PS of 0 to 2, and who had did not experience at least a minor response to their last rituximab-containing therapy or who relapsed fewer than 12 months after their last rituximab-containing therapy.
The ASPEN study is presented in the Studies Addressing Gaps in the Systematic Review Evidence section, as it informs the critical comparison of ibrutinib with zanubrutinib in patients with r/r WM, the population relevant to this CADTH reimbursement review.
Table 5: Details of Studies Included in the Systematic Review
Detail | iNNOVATE | Single-arm substudy |
|---|---|---|
Designs and populations | ||
Study design | Double-blind, randomized, placebo-controlled, phase III study | Open-label, single-arm, interventional, phase III study |
Locations | 45 sites in 9 countries: Australia, Canada, France, Germany, Greece, Italy, Spain, UK, US | 19 sites in 7 countries: Australia, Canada, France, Greece, Italy, Spain, US |
Patient enrolment dates | Start date: July 2014 End date: January 2016 | Start date: August 2014 End date: February 2015 |
Patients enrolled | N = 150 IR, n = 75 Rituximab plus placebo, n = 75 | N = 31 |
Inclusion criteria | Eligible patients had a centrally confirmed diagnosis of WM that required treatment and an ECOG PS of ≤ 2 | Eligible patients had a centrally confirmed diagnosis of WM, an ECOG PS of 0 to 2, and did not experience at least a minor response to their last rituximab-containing therapy or had relapsed fewer than 12 months after their last rituximab-containing therapy. |
Exclusion criteria | Patients were excluded if they had resistance to their previous rituximab-containing therapy or had received rituximab in the 12 months before the administration of the first dose of a trial drug. Additional exclusion criteria were CNS involvement, prior exposure to BTK inhibitors, and clinically significant cardiovascular disease. | Patients who experienced central CNS involvement, stroke, or intracranial hemorrhage fewer than 12 months before enrolment, clinically significant cardiovascular disease, active hepatitis B or hepatitis C viral infection, and a known bleeding disorder were excluded. |
Drugs | ||
Intervention | Oral ibrutinib (420 mg once daily) plus IV rituximab (375 mg/m2 of body-surface area, with infusions on day 1 of weeks 1 to 4 and weeks 17 to 20) | Oral ibrutinib (420 mg once daily) |
Comparator(s) | Placebo plus IV rituximab (375 mg/m2 of body-surface area, with infusions on day 1 of weeks 1 to 4 and weeks 17 to 20) | NA |
Study duration | ||
Screening phase | In the 30 days before study treatment, beginning on the day the patient signs an informed consent form | NR |
Treatment phase | From randomization (arm A and arm B) until the end-of-treatment visit Rituximab: 16 months (median) IR: 48 months (median) | 41 months (median) (range, 0.3 to 61) |
Follow-up phase | 50 months (median) (range, 0.5 to 63 months); 32 patients continued treatment in a treatment extension program after study closure | 58 months (median) (range, 9 to 61 months); 8 patients opted to enrol in a treatment extension study |
Outcomes | ||
Primary end point | PFS (54 months) | PFS (54 months) |
Secondary and exploratory end points | Secondary:
Exploratory: PROs: FACIT-Fatigue subscale score (25 weeks) | Secondary:
Exploratory: PROs (NR) |
Publications | Dimopoulos et al. (2018)28 | Dimopoulos et al. (2017)29 |
Clinical trial record | NCT02165397 | |
BTK = Bruton tyrosine kinase; CNS = central nervous system; ECOG PS = Eastern Cooperative Oncology Group Performance Status; FACIT = Functional Assessment of Chronic Illness Therapy; IR = Ibrutinib plus rituximab; NR = not reported; ORR = overall response rate; OS = overall survival; PFS = progression-free survival; PRO = patient-reported outcome; TTNT = time to next treatment; WM = Waldenström macroglobulinemia.
Note: Details included in the table are from the sponsor’s Summary of Clinical Evidence.
Source: iNNOVATE Clinical Study Report (2020).15
The objective of the iNNOVATE study was to evaluate the safety and efficacy of ibrutinib in combination with rituximab in patients with WM. This study was randomized, double-blind, and placebo-controlled, and treatment was administered through a parallel assignment model. Eligible patients were adults with a confirmed clinicopathological diagnosis of WM, either untreated or previously treated, with documented disease progression or no response to the most recent treatment regimen, and an ECOG PS of 2 or less. A total of 150 patients were enrolled between July 2014 and January 2016 and randomized. Forty-five study sites were used in 9 countries. Four sites were specific to Canada, with 1 site located in each of the following provinces: Alberta, Nova Scotia, Ontario, and Quebec. During the screening phase, the following procedures were performed before the first dose of the study drug and randomization: medical history (including demographic information), complete physical examination, eye-related symptom assessment, evaluation of ECOG PS, vital signs (including blood pressure, heart rate, and body temperature), triplicate 12-lead electrocardiogram (≥ 1 minute apart), recording of AEs since the informed consent form was signed, recording of concomitant medication history since the informed consent form was signed, imaging by CT, bone marrow aspirate and biopsy (if not performed in the 30 days before first dose of the study drug), obtaining blood specimens for laboratory tests, serum pregnancy test for people of childbearing potential only, and confirming eligibility.
Treatment was split into 2 arms: IR and rituximab plus placebo . In both arms, IV rituximab was administered (375 mg/m2) every week for 4 consecutive weeks, and then for another 4 weeks after a 3-month interval. Ibrutinib (420 mg/day) and placebo (3 capsules/day) were administered orally. Patients were randomly assigned in a 1:1 ratio to either treatment arm (75 patients in each arm) until disease progression or unacceptable toxic effects, and were stratified according to the score on the IPSS for WM (IPSSWM) at screening (low versus intermediate versus high), the number of prior regimens (0 versus 1 or 2 versus 3 or more), and ECOG PS score (0 or 1 versus 2). The clinical cut-off date for the final analysis was December 18, 2019.
The single-arm iNNOVATE substudy was designed to assess the efficacy and safety of single-drug ibrutinib in patients with rituximab-refractory WM. It was an international, multicentre, single-arm, open-label, phase III study. Eligible patients had a centrally confirmed diagnosis of WM, an ECOG PS of 0,1, or 2, and had not experienced at least a minor response to their last rituximab-containing therapy or had relapsed fewer than 12 months after their last rituximab-containing therapy. Between August 2014 and February 2015, 31 patients were enrolled and participated in the study at 19 sites in 7 countries. Two of these sites were in Canada. All patients received 420 mg of ibrutinib once daily (three 140 mg capsules). Patient randomization was not necessary and stratification details were not reported.
Populations
Inclusion and Exclusion Criteria
Patients in iNNOVATE had to have a confirmed diagnosis of WM, evidence of measurable disease, and an ECOG PS of 0, 1, or 2 to be eligible. The randomized iNNOVATE study allowed patients to be untreated or previously treated, whereas the substudy required patients to have been previously treated and to have been refractory to rituximab in their last rituximab-containing therapy. Involvement of the CNS and/or known CNS lymphoma, clinically significant cardiovascular disease, and prior treatment with BTK inhibitors (ibrutinib or otherwise) was cause for exclusion in iNNOVATE. The randomized iNNOVATE study excluded patients who experienced refractory disease after their last prior rituximab-containing therapy and those who received rituximab treatment in the 12 months before the first study drug dose.
In the randomized iNNOVATE study, patients were excluded if they had resistance to the previous rituximab-containing therapy or had received rituximab in the 12 months before the administration of the first dose of a trial drug. Additional exclusion criteria were CNS involvement, prior exposure to BTK inhibitors, and clinically significant cardiovascular disease. In the single-arm substudy, patients with central CNS involvement, stroke, or intracranial hemorrhage fewer than 12 months before enrolment, clinically significant cardiovascular disease, active hepatitis B or hepatitis C viral infection, and a known bleeding disorder were excluded.
Interventions
Patients in the randomized iNNOVATE study were randomized in a 1:1 ratio to 1 of 2 rituximab-containing treatment arms: IR or rituximab plus placebo. In both arms, IV rituximab was administered at a dose of 375 mg/m2 on day 1 of weeks 1 to 4 and weeks 17 to 20. Oral ibrutinib was administered daily at a dose of 420 mg (3 capsules of 140 mg), until unacceptable toxicity or PD. Matching-administration placebo was supplied as 3 hard gelatin capsules that were identical to ibrutinib capsules and orally administered daily until unacceptable toxicity or PD. Patients were stratified according to the IPSSWM, number of prior regimens, and ECOG PS score. The first dose was administered in the clinic on day 1 of week 1, after which the study drug was self-administered daily on an outpatient basis by the patients.
Outcomes
A list of efficacy end points assessed in this Clinical Review Report is provided in Table 6, which is followed by descriptions of the outcome measures. Summarized end points are based on outcomes included in the sponsor’s Summary of Clinical Evidence and on any outcomes identified as important to this review, according to the clinical experts consulted by CADTH and stakeholder input from patient and clinician groups and public drug plans. Using the same considerations, the CADTH review team selected the end points that were considered to be most relevant to CADTH’s expert committee deliberations in consultation with members of the expert committee. All summarized efficacy end points considered critical for decision-making are assessed with the GRADE approach. In addition, selected notable harms outcomes considered important to CADTH’s expert committee deliberations are also assessed with the GRADE approach.
Table 6: Outcomes Summarized From the Studies Included in the Systematic Review
Outcome measure | Randomized study | Single-arm substudy |
|---|---|---|
PFS | Primary | Primary |
Time point | 30, 48, 50, and 54 months | 18 and 60 months |
OS | Secondary | Secondary |
Time point | 30, 48, and 54 monthsa | 18 and 60 months |
Hematological improvement (IgM and/or hemoglobin levels) | Secondary | Secondary |
Time point | 30 and 50 months | Median follow-up: 58 months |
TTNT | Secondary | Secondary |
Time point | 54 months | Median follow-up: 58 months |
DOR | Exploratory | Exploratory |
Time point | NR | Median follow-up: 58 months |
Safety | Secondary | Secondary |
Time point | Years 0 to 1, 1 to 2, 2 to 3, 3 to 4, 4 to 5, and overall AEs at 30 and 50 months | Median follow-up: 58 months |
AE = adverse event; DOR = duration of response; IgM = immunoglobulin M; NR = not reported; OS = overall survival; PFS = progression-free survival; TTNT = time to next treatment.
Note: Details included in the table are from the sponsor’s Summary of Clinical Evidence.
aStatistical testing for OS was adjusted for the treatment effect of patients who crossed over in the final analysis.
Source: iNNOVATE Clinical Study Report (2020).15
In the iNNOVATE study, the authors used the modified criteria from the sixth IWWM to assess response rate. Briefly, reductions in serum IgM levels of 25% to 49%, 50% to 89%, and greater than 90% denoted a minor response, PR, and VGPR, respectively. The overall response rate (ORR) was defined as the proportion of patients achieving at least a minor response, and the MRR was defined as the proportion of patients achieving at least a PR.
OS was defined as the date of randomization to the date of death from any cause. For patients who were not known to have died at or before the clinical cut-off date, OS was censored on the last known alive date.
PFS was defined as the date of randomization to progression or death, assessed by the IRC. In the iNNOVATE trial, for patients who do not have IRC-confirmed PD and were not known to have died as of clinical data cut-off, PFS was censored at the date of the last evidence of no progression by IRC.
DOR was an exploratory end point and defined as the date of initial documentation of a response (PR or better) to the date of the first documented evidence of PD or death for responders (PR or better). For patients who do not have IRC-confirmed PD and were not known to have died as of clinical data cut-off, DOR was censored at the date of the last evidence of no progression by IRC.
TTNT was defined as the date of randomization to the start date of any subsequent WM treatment. Patients without subsequent treatment were censored at the date of the last study visit.
The EQ-5D utility score and visual analogue scale and the Functional Assessment of Cancer Therapy-Anemia (FACT-An) total score and subscale scores were exploratory end points in the iNNOVATE study, but they were not considered critical for inclusion in the summary of findings of this report.
Safety was assessed according to the Medical Dictionary for Regulatory Activities (MedDRA). AE severity was graded according to the National Cancer Institute Common Terminology Criteria for Adverse Events (NCI CTCAE) version 4.03 in the iNNOVATE study. In the iNNOVATE study, safety was assessed by the investigator.
CADTH addressed these outcomes of efficacy and harms using an iterative approach to determine the importance of each end point to the different stakeholders. Once a final decision, which involved a discussion with the CADTH review team, the outcomes were selected for inclusion in Table 2.
Statistical Analysis
iNNOVATE Clinical Trial End Points
Progression-Free Survival
PFS was a primary end point in the iNNOVATE trial and substudy. When comparing the efficacy of IR and rituximab plus placebo, 2 randomization stratification factors were used: IPSSWM at screening, and the number of prior systemic therapies. For patients without IRC-confirmed progression and who were not known to have died as of clinical data cut-off, PFS was censored at the date of the last evidence of no progression. The treatment effect was assessed using a stratified log-rank test. The HR and 95% CI were assessed using a stratified Cox regression model. The PFS distribution was evaluated using the Kaplan-Meier analysis and the median PFS was estimated with a 2-sided 95% CI. The primary analysis for PFS was a 2-sided log-rank test stratified according to the IPSSWM (low, intermediate, high) and the number of prior regimens (0 or ≥ 1). The alpha spending for PFS was determined based on the actual information fraction using the O’Brien-Fleming boundary. Tests of secondary end points were performed at the 2-sided significance level of 0.05 in a sequential hierarchical manner, based on a closed testing procedure. The subgroup analyses of PFS are based on an unstratified Cox model.
Missing efficacy and safety data were not imputed in the iNNOVATE trial. There were 4 sensitivity analyses for PFS in the iNNOVATE trial, which involved censoring patients who received subsequent antineoplastic therapy, censoring patients who missed at least 2 consecutive disease assessments immediately before progression confirmed by IRC, and investigator-assessed PFS, all of which used the same analyses as the primary end point. The final sensitivity analysis was IRC-assessed PFS by unstratified log-rank test and unstratified Cox regression model. The iNNOVATE substudy provided a descriptive analysis of PFS outcomes; no statistical analyses were performed.
Overall Survival
OS was a secondary end point assessed in the main iNNOVATE study and the substudy in an interim analysis for the population of interest (r/r WM). In the iNNOVATE trial, OS was evaluated using an unstratified log-rank test, unstratified Cox regression model, and Kaplan-Meier analysis. For patients who were not known to have died at or before the clinical cut-off date, OS was censored on the date the patient was last known to be alive. An OS sensitivity analysis was performed for patients in the iNNOVATE study who crossed over to single-drug ibrutinib to adjust the treatment effect using the 2-stage accelerated failure time model. The iNNOVATE substudy provided a descriptive analysis of OS outcomes; no statistical analyses were performed.
Response Rates
ORR and MRR were secondary end points in the main iNNOVATE study and the substudy. In the iNNOVATE study, ORR was assessed using the Cochran-Mantel-Haenszel chi-square distribution, adjusted using the randomization stratification factors. The sensitivity analysis was investigator-assessed ORR using the same analyses as for OS. The iNNOVATE substudy provided a descriptive analysis of response rates; no statistical analyses were performed.
A summary of the statistical analyses reported in the iNNOVATE study is presented in Table 7.
Sample Size and Power Calculation
The iNNOVATE trial had a sample size of 150, with 75 patients in the IR arm and 75 in the rituximab plus placebo arm. This study was powered to evaluate the treatment effect on PFS, using a 2-sided log-rank test that assumed an HR of 0.5, minimum 80% power, and 2-sided overall significance level of 0.05. Loss to follow-up was not reported or accounted for. The open-label iNNOVATE substudy had a sample size of 31 patients and was not designed to provide statistical comparisons.
Statistical Testing
In the iNNOVATE trial, a type I error rate of 0.05 was used. Whenever possible, the final analyses were presented in this report. Because the primary end point of PFS achieved statistical significance in the iNNOVATE trial, secondary end points were tested at the 2-sided overall significance level of 0.05 in a hierarchal manner (ORR, TTNT, rate of sustained hemoglobin improvement, proportion of patients with improvement in fatigue experience score, and OS) based on a closed testing procedure.
Subgroup Analyses
In the iNNOVATE trial, the following prespecified subgroups were analyzed for PFS: age (< 65 years, ≥ 65 years), sex (male, female), prior treatment (no, yes), baseline serum IgM (< 40 g/L, ≥ 40 g/L), baseline serum hemoglobin (≤ 110 g/L, > 110 g/L), baseline beta-2 microglobulin (≤ 3 mg/L, > 3 mg/L), IPSSWM (low, intermediate, high), and MYD88L265P mutation status (mutated, not mutated). Other subgroups that were prespecified but not reported include race, geographic region (US, non-US), baseline ECOG PS (0 to 1, 2), concomitant use of CYP3A inhibitors (yes, no), baseline creatinine clearance (< 60 mL/min, ≥ 60 mL/min), and baseline liver function (normal, abnormal). For ORR, treatment history and MYD88L265P mutation status were selected as subgroups. For the rate of sustained hemoglobin improvement, a subgroup analysis was specified for patients with hemoglobin ≤ 11 g/dL at baseline. It was not reported whether the comparability of the treatment arms was checked, nor whether multiplicity was considered in the iNNOVATE trial. In the iNNOVATE substudy, subgroups for genotype (MYD88 and CXCR4 status) were assessed for PFS and OS.
Table 7: Statistical Analysis of Efficacy End Points in the iNNOVATE Study
End point | Statistical model | Adjustment factors | Handling of missing data | Sensitivity analyses |
|---|---|---|---|---|
PFS | Stratified log-rank test Stratified Cox regression model Kaplan-Meier analysis | IPSSWM at screening (low, intermediate, high) Number of prior systemic treatments (0, ≥ 1) | For patients who do not have IRC-confirmed PD and who are not known to have died as of the clinical data cut-off, PFS is censored at the date of the last evidence of no progression by IRC. Missing efficacy data were not imputed unless otherwise specified. | Patients who received subsequent antineoplastic therapy are censored at the last disease assessment showing no evidence of PD before the use of subsequent therapy; patients who missed ≥ 2 consecutively planned disease assessments immediately before IRC-confirmed PD or death are censored at the last disease assessment before documented PD or death; and investigator-assessed PFS: Cox regression model IRC-assessed PFS by unstratified log-rank test and unstratified Cox regression model |
TTNT | Stratified log-rank test Stratified Cox regression model Kaplan-Meier analysis | IPSSWM at screening (low, intermediate, high) Number of prior systemic treatments (0, ≥ 1) | Patients without subsequent treatment are censored at the date of the last study visit. Missing efficacy data were not imputed unless otherwise specified. | NA |
OS | Unstratified log-rank test Unstratified Cox regression model Kaplan-Meier analysis | NA | For patients who were not known to have died at or before the clinical cut-off date, OS is censored on the date the patient was last known to be alive. Missing efficacy data were not imputed unless otherwise specified. | For patients who crossed over to single-drug ibrutinib in the randomized study: 2-stage accelerated failure time model |
ORR | CMH chi-square distribution | IPSSWM at screening (low, intermediate, high) Number of prior systemic treatments (0, ≥ 1) | Missing efficacy data were not imputed unless otherwise specified. | Investigator-assessed ORR: adjusted CMH chi-square distribution |
Rate of sustained hematological improvement | Chi-square distribution | NR | Missing efficacy data were not imputed unless otherwise specified. | Chi-square distribution for patients with hemoglobin ≤ 11 g/dL at baseline |
Proportion of patients with an increase of ≥ 3 points from baseline by week 25 in fatigue experience score | Chi-square distribution | NR | The sum of the item score multiplied by the number of items in the subscale is divided by the number of items answered. A subscale score is calculated if more than half of the items were answered. | NR |
Time to sustained hemoglobin improvement; IgM, hemoglobin; lymph nodes and spleen; tumour involvement of bone marrow; medical resource use | Descriptive summary statistics | NR | NR | NR |
DOR by IRC, DOR by investigator | Kaplan-Meier analysis | NR | NA | NR |
CRR by IRC, CRR by investigator | CMH chi-square distribution | NR | NR | NR |
EQ-5D-5L visual analogue scale and utility score FACT-An total score and subscale scores | Descriptive summary statistics Chi-square distribution MMRM | Baseline scores, baseline ECOG PS (0, 1 to 2), treatment history on CRF (previously untreated, previously treated), IPSSWM on CRF (low, intermediate, high) as covariates; treatment, time point, and treatment-by-time point interaction as fixed effects; and patients as random effect | For the FACT-An, if there are missing subscale scores, the total score is calculated as the sum of the prorated subscale scores. Total scores are calculated only if the overall item response rate is > 80%. Handling of missing data for the EQ-5D-5L visual analogue scale is not described. | NR |
CMH = Cochran-Mantel-Haenszel; CRF = case reported form; CRR = complete response rate; DOR = duration of response; ECOG PS = Eastern Cooperative Oncology Group Performance Status; EQ-5D-5L = 5-Level EQ-5D; FACT-An = Functional Assessment of Cancer Therapy-Anemia; IgM = immunoglobulin M; IPSSWM = International Prognostic Scoring System for Waldenström Macroglobulinemia; IRC = Independent Review Committee; MMRM = mixed models for repeated measures; NA = not appliable; NR = not reported; ORR = overall response rate; OS = overall survival; PD = progressive disease; PFS = progression-free survival; TTNT = time to next treatment; WM = Waldenström macroglobulinemia.
Note: Details included in the table are from the sponsor’s Summary of Clinical Evidence.
Source: iNNOVATE Clinical Study Report (2020).15
For the purposes of this report, the clinical experts consulted by CADTH did not consider whether any of these variables had a modifying effect on patients receiving or not receiving ibrutinib, either as monotherapy or with rituximab.
Analysis Populations
A summary of study populations in the iNNOVATE trial is presented in Table 8.
Table 8: Analysis Populations in the iNNOVATE Study
Population | Definition | Application |
|---|---|---|
ITT | All randomized (treatment arms A and B) patients. Patients in this population will be analyzed according to the treatment to which they are randomized. | Study population and characteristics, efficacy, and PRO data |
Safety | All patients who received at least 1 dose of the study drug. Patients in this population will be analyzed according to the actual treatment received (i.e., as treated). | Safety data |
Pharmacokinetic-evaluable | All patients who received at least 1 dose of the study drug and had at least 1 pharmacokinetic sample obtained after treatment. | To determine the pharmacokinetics of ibrutinib in combination with rituximab in patients with WM |
Biomarker | All patients with sufficient malignant cells collected from at least 1 time point during the study. | To determine prognostic and predictive biomarkers and genetics relative to treatment outcomes |
ITT = intention to treat; PRO = patient-reported outcome; WM = Waldenström macroglobulinemia.
Note: Details included in the table are from the sponsor’s Summary of Clinical Evidence.
Source: iNNOVATE Clinical Study Report (2020).15
Results
Patient Disposition
Patient disposition by study treatment in the iNNOVATE study is summarized in Table 9. Of note is the number of patients who discontinued rituximab early (before completing the eighth dose) in the rituximab plus placebo group (22 of 75) compared to the number in the IR group (5 out of 75). It is also important to note the number of patients who switched to the IR arm from the rituximab plus placebo arm (30 patients crossed over to ibrutinib after IRC-confirmed progression).
Table 9: Summary of Patient Disposition From Studies Included in the Systematic Review
Patient disposition | iNNOVATE study | iNNOVATE substudy | |
|---|---|---|---|
IR (N = 75) | Rituximab plus placebo (N = 75) | Ibrutinib (N = 31) | |
Screened, N | NR | NR | NR |
Reason for screening failure, N (%) | |||
Failed to meet eligibility criteria | NR | NR | NR |
Declined to participate | NR | NR | NR |
Withdrew consent | NR | NR | NR |
AEs occurred during screening, not related to study procedure | NR | NR | NR |
Out of screening window | NR | NR | NR |
Physician and/or patient decision | NR | NR | NR |
Randomized, N (%) | 75 | 75 | NA |
Discontinued from study, N (%)a | 75 | 75b | 31 |
Reason for discontinuation, N | |||
AE | 8 | 5 | 2 |
Progressive disease | 7 | 34 | 13 |
Patient withdrawal | 10 | 7 | 2 |
Investigator decision | 3 | 29c | 0 |
Study closure by sponsor | 47 | 0 | 14 |
Nonresponse | 0 | 0 | 0 |
Change in therapy | 0 | 0 | 0 |
Secondary cancer | 0 | 0 | 0 |
Other | 0 | 0 | 0 |
Discontinued rituximab early | 5d | 22 | NA |
Completed rituximab | 70 | 53 | NA |
FAS, N | 75 | 75 | 31 |
Safety, N | 75 | 75 | 31 |
AE = adverse event; FAS = full analysis set; IR = Ibrutinib plus rituximab; NA = not applicable; NR = not reported.
aAs of the final analysis, all patients discontinued. The main reason for discontinuation was study closure by sponsor.
bThirty-five patients crossed over to receive single-drug ibrutinib after PD.
cOf the 29 patients in the rituximab plus placebo arm who discontinued treatment due to investigator decision, 24 patients discontinued due to study unblinding, per data monitoring committee recommendation.
dPatients discontinued rituximab before the completion of 8 infusions.
Note: Details included in the table are from the sponsor’s Summary of Clinical Evidence.
Source: iNNOVATE Clinical Study Report (2020).15
Baseline Characteristics
The baseline characteristics of the trial population are outlined in Table 10 and are limited to those that are most relevant to this review or were felt to affect the outcomes or interpretation of the study results. Overall, small imbalances were observed in select variables (e.g., sex, baseline hemoglobin), but the clinical experts consulted by CADTH did not consider these imbalances to be of clinical concern. Otherwise, no other potential imbalances were detected. The clinical characteristics at baseline are in alignment with the Health Canada indication and the sponsor’s reimbursement request with sufficient generalizability, as judged by the clinical experts consulted by CADTH. Patients with relapsed disease had received a median of 2 prior therapies (range, 1 to 6). Of the 82 patients considered to be previously treated (41 in each arm), 70 patients (85%) had been previously treated with rituximab. These 82 patients formed the group of patients with WM who had received previous therapies (r/r) for the main reimbursement request assessed in this CADTH review; their characteristics are summarized in Table 11.
Table 10: Summary of Baseline Characteristics From Studies Included in the Systematic Review
Characteristic | iNNOVATE study | iNNOVATE substudy | |
|---|---|---|---|
IR (N = 75) | Rituximab plus placebo (N = 75) | Ibrutinib (N = 31) | |
Median age, years (range) | 70 (36 to 89) | 68 (39 to 85) | 67 (47 to 90) |
Male, n (%) | 45 (60) | 54 (72) | NR |
IPSSWM, n (%) Low Intermediate High | 15 (20) 33 (44) 27 (36) | 17 (23) 28 (37) 30 (40) | 7 (23) 11 (35) 13 (42) |
Median hemoglobin, g/dL (range) Baseline hemoglobin ≤ 11.0 g/dL, n (%) | 10.5 (6.9 to 15.5) 44 (59) | 10.0 (6.6 to 16.1) 50 (67) | 10.3 (6.4 to 14.6) 21 (68) |
Median serum IgM, g/L (range) | 33 (6 to 78) | 32 (6 to 83) | 39 (9 to 107) |
Prior systemic therapies, n (%) 0 1 to 2 ≥ 3 | 34 (45) 34 (45) 7 (9) | 34 (45) 36 (48) 5 (7) | 0 (0) 9 (29) 22 (71) |
Genotype, n (%) MYD88L265P and/or CXCR4WT MYD88L265P and/or CXCR4WHIM MYD88WT and/or CXCR4WT Unknown or other | 32 (43) 26 (35) 11 (15) 6 (8)a | 35 (47) 23 (31) 9 (12) 8 (11) | 17 (55) 7 (23) 1 (3) 6 (19) |
Bone marrow infiltration, % of cellularity, median (range) | 80 (25 to 100) | 80 (2 to 100) | 75 (NR) |
Cytopenia at baseline, n (%) Hemoglobin of ≤ 11 g/dL Platelet count of ≤ 100,000/mm3 Absolute neutrophil count of ≤ 1,500/mm3 Median absolute neutrophil count × 109/L, (range) | 44 (59) 4 (5) 4 (5) 3.6 (0.2 to 8.3) | 50 (67) 7 (9) 1 (1) 3.3 (1.5 to 11.5) | NR NR NR 2.9 (1.8 to 4.3) |
Median beta-2 microglobulin, mg/L (range) | 3.4 (1.4 to 27.9) | 3.9 (1.5 to 11.6) | 3.6 (2.9 to 5.2) |
Extramedullary disease, n (%) Adenopathyb Splenomegaly | 57 (76) 9 (12) | 58 (77) 18 (24) | 25 (81) 6 (19) |
Previous rituximab-containing regimen, n/total N (%) | 36/41 (88) | 34/41 (83) | 31/31 (100) |
ECOG PS 0 or 1 2 | 71 (95)c 4 (5) | 69 (92)d 6 (8) | 25 (81) 6 (19) |
Median months from initial diagnosis, (range) | 50 (1 to 257) | 56 (1 to 247) | 91 (6 to 198) |
Prior SCT, n (%) | NR | NR | 2 (6) |
ECOG PS = Eastern Cooperative Oncology Group Performance Status; IgM = immunoglobulin M; IPSSWM = International Prognostic Scoring System for Waldenström Macroglobulinemia; IR = Ibrutinib plus rituximab; NR = not reported; SCT = stem cell transplant.
aGenetic subtype was unevaluable because of poor sample quality: 12 of 14 patients had low tumour cell counts and 2 of 14 had low library yields.
bAdenopathy is defined as the presence of lymph nodes with a long axis of more than 1.5 cm or a short axis of more than 1.0 cm. Splenomegaly is defined as a spleen depth (cranial to caudal) of more than 13 cm.
cStudy reported that 39 (52%) patients had an ECOG PS of 0 and 32 (43%) patients had an ECOG PS of 1.
dStudy reported that 37 (49%) patients had an ECOG PS of 0 and 32 (43%) patients had an ECOG PS = 1.
Source: iNNOVATE Clinical Study Report (2020).15
Table 11: Summary of Baseline Characteristics From the iNNOVATE Study in the r/r Population
Characteristic | iNNOVATE study r/r population | |
|---|---|---|
IR (N = 41) | Placebo + rituximab (N = 41) | |
Median age, years (range) | 70 (36 to 89) | 68 (39 to 85) |
Male, n (%) | 27 (66) | 29 (71) |
IPSSWM, n (%) Low Intermediate High | 8 (19) 20 (49) 13 (32) | 9 (22) 16 (39) 16 (39) |
Median hemoglobin, g/dL (range) | 10.9 (6.9 to 15.5) | 10.0 (6.6 to 16.1) |
Median serum IgM, g/L (range) | 37.8 (6.2 to 70.0) | 31.8 (9.2 to 83.3) |
Prior systemic therapies, n (%) 0 1 to 2 ≥ 3 | 0 (0) 34 (83) 7 (17) | 0 (0) 36 (88) 5 (12) |
Genotype, n (%) MYD88L265P and/or CXCR4WT MYD88L265P and/or CXCR4WHIM MYD88WT and/or CXCR4WT Unknown and/or other | 15 (37) 14 (34) 8 (20) 4 (10) | 17 (41) 11 (27) 7 (17) 6 (15) |
Bone marrow infiltration, % of cellularity, median (range) | 70 (30 to 100) | 78 (2 to 100) |
Cytopenia at baseline, n (%) Hemoglobin of ≤ 11 g/dL Platelet count of ≤ 100,000/mm3 Absolute neutrophil count of ≤ 1500/mm3 Median absolute neutrophil count × 109/L, (range) | 22 (54) 2 (5) 1 (2) 3.6 (0.2 to 7.3) | 27 (66) 4 (10) 0 (0) 3.2 (1.7 to 11.5) |
Median beta-2 microglobulin, mg/L (range) | 3.7 (1.4 to 15.7) | 4.1 (1.5 to 7.0) |
Extramedullary disease, n (%) Adenopathya Splenomegaly Lymphadenopathy Other | 30 (73) 4 (10) NR NR | 31 (76) 8 (19) NR NR |
Previous rituximab-containing regimen, n (%) | 36 (88) | 34 (83) |
ECOG PS 0 or 1 2 | 38 (93)b 3 (7) | 37 (90)c 4 (10) |
Median months from initial diagnosis, (range) | 94 (20 to 257) | 95 (8 to 247) |
Prior SCT, n (%) | NR | NR |
ECOG PS = Eastern Cooperative Oncology Group Performance Status; IgM = immunoglobulin M; IPSSWM = International Prognostic Scoring System for Waldenström Macroglobulinemia; IR = Ibrutinib plus rituximab; NR = not reported; r/r = relapsed or refractory; SCT = stem cell transplant.
aAdenopathy is defined as the presence of lymph nodes with a long axis of more than 1.5 cm or a short axis of more than 1.0 cm. Splenomegaly is defined as a spleen depth (cranial to caudal) of more than 13 cm.
bStudy reported that 23 (56%) patients had an ECOG PS of 0 and 15 (37%) patients had an ECOG PS of 1.
cStudy reported that 19 (46%) patients had an ECOG PS of 0 and 18 (44%) patients had an ECOG PS of 1.
Source: iNNOVATE Clinical Study Report (2020).15
Exposure to Study Treatments
In the iNNOVATE study, the median duration of treatment exposure ranged from 16 months to 48 months, depending on treatment. All patients in the randomized iNNOVATE arms received treatment until the end of the study, whereas only 45% of patients were receiving treatment at the end of the iNNOVATE substudy. A summary of patient exposure to the interventions in the iNNOVATE study is presented in Table 12.
Table 12: Summary of Patient Exposure From Studies Included in the Systematic Review
Exposure | iNNOVATE study | iNNOVATE substudy | |
|---|---|---|---|
IR (N = 75) | Rituximab (N = 75) plus placebo | Ibrutinib (N = 31) | |
Total, patient-weeks or patient-years | NR | NR | NR |
Duration, median (range), months | 48 (1 to 59) | 16 (0.4 to 37) | 41 (0.3 to 61) |
Adherence, % | NR | NR | NR |
IR = ibrutinib plus rituximab; NR = not reported.
Note: Details included in the table are from the sponsor’s Summary of Clinical Evidence.
Source: iNNOVATE Clinical Study Report (2020).15
The proportion of patients who received concomitant medications of interest described in the iNNOVATE study in the randomized arms included treatment with CYP3A inhibitors (45%), acid-related disorders (52%; specifically, pantoprazole [21%], omeprazole [19%], and esomeprazole [12%]), antihypertensives (8%), antiplatelets (41%), anticoagulants (24%), and growth factors (16%).The most common concomitant medications in the single-arm iNNOVATE substudy included antibacterials (84%), analgesics (55%), antivirals (52%), anti-inflammatory and/or antirheumatic drugs (45%), acid-related disorder medications (42%), antithrombotic drugs (39%), antianemic preparations (39%), vitamins (36%), and ophthalmological medications (32%).
Crossover to other treatment groups was described in the iNNOVATE study. In the randomized iNNOVATE arms, patients receiving rituximab plus placebo were allowed to crossover to ibrutinib monotherapy treatment after disease progression confirmed by IRC. In total, 40% of patients on rituximab plus placebo crossed over to receive ibrutinib after disease progression in the primary analysis (30 months) and 46.7% crossed over in the final analysis (54 months). Subsequent treatment use was described in the iNNOVATE study. Of the 75 patients in each randomized iNNOVATE treatment arm, 9 (12%) patients in the IR arm and 47 (63%) patients in the rituximab plus placebo arm received subsequent treatment. In the single-arm iNNOVATE substudy, 12 patients (39%) received subsequent therapies.
A summary of concomitant therapies and subsequent treatments in the iNNOVATE study is presented in Table 13.
Table 13: Summary of Concomitant Medication and Subsequent Treatments in the iNNOVATE Study
Exposure | iNNOVATE study | iNNOVATE substudy | |
|---|---|---|---|
IR (N = 75) | Rituximab plus placebo (N = 75) | Ibrutinib (N = 31) | |
Concomitant medications | |||
CYP3A inhibitor, n (%) | 34 (45) | 32 (43) | 13 (42) |
Acid-related disorders,a n (%) | 39 (52) | 32 (43) | 13 (42) |
Pantoprazole | 16 (21) | 9 (12) | 3 (10) |
Omeprazole | 14 (19) | 12 (16) | 6 (19) |
Ranitidine | 9 (12) | 10 (13) | 1 (3) |
Esomeprazole | 9 (12) | 1 (1) | 2 (7) |
Famotidine | 4 (5) | 7 (9) | 1 (3) |
Antihypertensives, n (%) | 6 (8) | 2 (3) | 0 |
Antiplatelets, n (%) | 31 (41) | 19 (25) | 18 (58) |
Anticoagulants, n (%) | 18 (24) | 12 (16) | 5 (16) |
Growth factors, n (%) | 12 (16) | 15 (20) | 8 (26) |
Antibacterial, n (%) | 63 (84) | 40 (53) | 26 (84) |
Analgesics, n (%) | 75 (100) | 75 (100) | 17 (55) |
Antivirals, n (%) | 32 (43) | 26 (35) | 16 (52) |
Anti-inflammatory and antirheumatic drugs, n (%) | 17 (23) | 8 (11) | 14 (45) |
Antithrombotic drugs, n (%) | 31 (41) | 22 (29) | 12 (39) |
Antianemic preparations, n (%) | 21 (28) | 27 (36) | 12 (39) |
Vitamins, n (%) | 20 (27) | 11 (15) | 11 (36) |
Ophthalmological, n (%) | 22 (29) | 9 (12) | 10 (32) |
Subsequent therapy | |||
Received subsequent therapy, n (%) | 9 (12) | 47 (63) | 12 (39) |
Alkylating drug, n (%) | 7 (9) | 9 (12) | 7 (23) |
Anti-CD20 antibody therapy, n (%) | 8 (11) | 12 (16) | 6 (19) |
Corticosteroids, n (%) | 3 (4) | 2 (3) | 6 (19) |
Proteasome inhibitor, n (%) | 2 (3) | 2 (3) | 3 (10) |
Vinca alkaloids, n (%) | 2 (3) | 2 (3) | 2 (7) |
Anthracyclines, n (%) | 1 (1) | 1 (1) | 1 (3) |
Immunomodulator, n (%) | NR | NR | 1 (3) |
Purine analogue, n (%) | 2 (3) | 0 | |
Nucleoside analogues, n (%) | 0 | 1 (1) | 1 (3) |
Other, n (%) | 3 (4) | 8 (11) | 4 (13) |
IR = ibrutinib plus rituximab; NR = not reported.
aIn more than 10% of patients.
Note: Details included in the table are from the sponsor’s Summary of Clinical Evidence.
Source: iNNOVATE Clinical Study Report (2020).15
Efficacy
Progression-Free Survival
PFS was considered a critical outcome by clinical experts, patient groups, and other stakeholders for decision-making and deliberations. It was also the primary end point in the iNNOVATE study and substudy.
Among patients with r/r WM in the iNNOVATE study, median PFS was not reached in the IR arm, whereas it reached 14.8 months in the rituximab plus placebo at 30 months to 68% (95% CI, 50% to 80%) at 54 months, whereas in patients treated with rituximab plus placebo, the PFS rate ranged from 29% (95% CI, 16% to 44%) at 30 months to 20% (95% CI, 9% to 34%) at 54 months. The PFS HR for this comparison in this same population was 0.22 (95% CI, 0.11 to 0.43; log-rank test P < 0.001).
In the iNNOVATE substudy (i.e., the 31 patients treated with ibrutinib monotherapy), median PFS was 39 months (95% CI, 25 months to NE), and the PFS rate ranged from 81% at 18 months to 40% at 5 years.
The overall population (i.e., patients who were treatment-naive and those with r/r WM) is also presented. The primary analysis of the main iNNOVATE study showed that among patients treated with IR, median PFS was not reached. The PFS rate was 82% at 30 months. In patients treated with rituximab plus placebo, the PFS rate reached 28% at 30 months, with a HR of 0.20 (95% CI, 0.10 to 0.38; P < 0.001).
Overall Survival
OS was among the outcomes of critical interest to clinical experts and other stakeholders. For the r/r population in the iNNOVATE study (Table 14), median OS was not reported across time points for any of the arms of the study. In the single-arm substudy of those treated with ibrutinib monotherapy, the OS rate reached 94% (95% CI, 77% to 98%) at 18 months and 73% (95% CI, 54% to 86%) at 5 years.
In the total population (primary analysis), including the r/r WM and treatment-naive populations, median OS was not reached in either the IR arm or the rituximab plus placebo arm. Across time points, OS was similar in the IR and rituximab plus placebo treatment arms. For patients treated with IR, OS at 30 months was 93.7% (95% CI, 83.8% to 97.6%), whereas in patients treated with rituximab plus placebo, the OS rate was 91.9% (95% CI, 82%.8 to 96.3%). HR for OS in this same population was 0.61 (95% CI, 0.17 to 2.18; log-rank P not reported) at 30 months.
Duration of Response
DOR was defined as the date of initial documentation of response (i.e., PR or better) to the date of first documented evidence of PD or death for responders. The clinical experts considered DOR an important outcome because WM is a rare and very symptomatic condition and patients would likely value the delay of PD or death events, and DOR would help in the deliberation of further decisions.
In the r/r WM population, 31 patients and 9 patients responded in the IR and rituximab plus placebo arms, respectively. Events of PD or death occurred in 5 (16.1%) patients in the IR group and 5 (55.6%) in the rituximab plus placebo arm. The median DOR was not reached in the IR arm (95% CI, 55.8 months to NE), whereas it was 23.5 months (95% CI, 9.2 months to NE) in the rituximab plus placebo arm. At 30 months, 96.6% of patients (95% CI, 77.9% to 99.5%) in the IR arm and 37.5% (95% CI, 8.7% to 67.4%) in the rituximab plus placebo arm continued to respond. At the 54-month landmark, the DOR rate was 82.6% in the IR arm; no patients in the rituximab plus placebo arm had a DOR longer than 48 months observed, so DOR is NE.
For patients who responded in the overall population (patients who were treatment-naive and patients with r/r WM) of the iNNOVATE study, median DOR per IRC assessment was not reached in the IR arm or in the rituximab plus placebo arm. At the 54-month landmark, the DOR rate for patients with a PR or better was 76.9% in the IR arm; no patients in the rituximab plus placebo arm had a DOR longer than 48 months observed, so DOR is NE,.
Time to Next Treatment
For the r/r population, TTNT was reported in a Kaplan-Meier curve as subgroup analysis by treatment history (Figure 1), and at week 54, 84% of patients in the IR arm and 21% in the rituximab plus placebo arm had not received subsequent therapy. The TTNT was reported also for the single-arm substudy with 31 patients, but only 10 patients (32.3%) received subsequent treatment. In this group, the median TTNT was not reached. At the 60-month landmark estimate, 64.6% of patients had not received subsequent treatment.
For TTNT in the general population (patients who were treatment-naive and patients with r/r WM) of the iNNOVATE study, the HR for the IR arm compared to the rituximab plus placebo arm was HR of 0.10 (95% CI, 0.05 to 0.21). Median TTNT was not reached in the IR arm and was 18.1 months (95% CI, 11.1 to 33.1 months) the rituximab plus placebo arm. At 54 months, 87.4% of patients in the IR arm and 29.4% in the rituximab plus placebo arm had not received subsequent therapy.
Figure 1: Kaplan-Meier Curves for TTNT by Treatment History
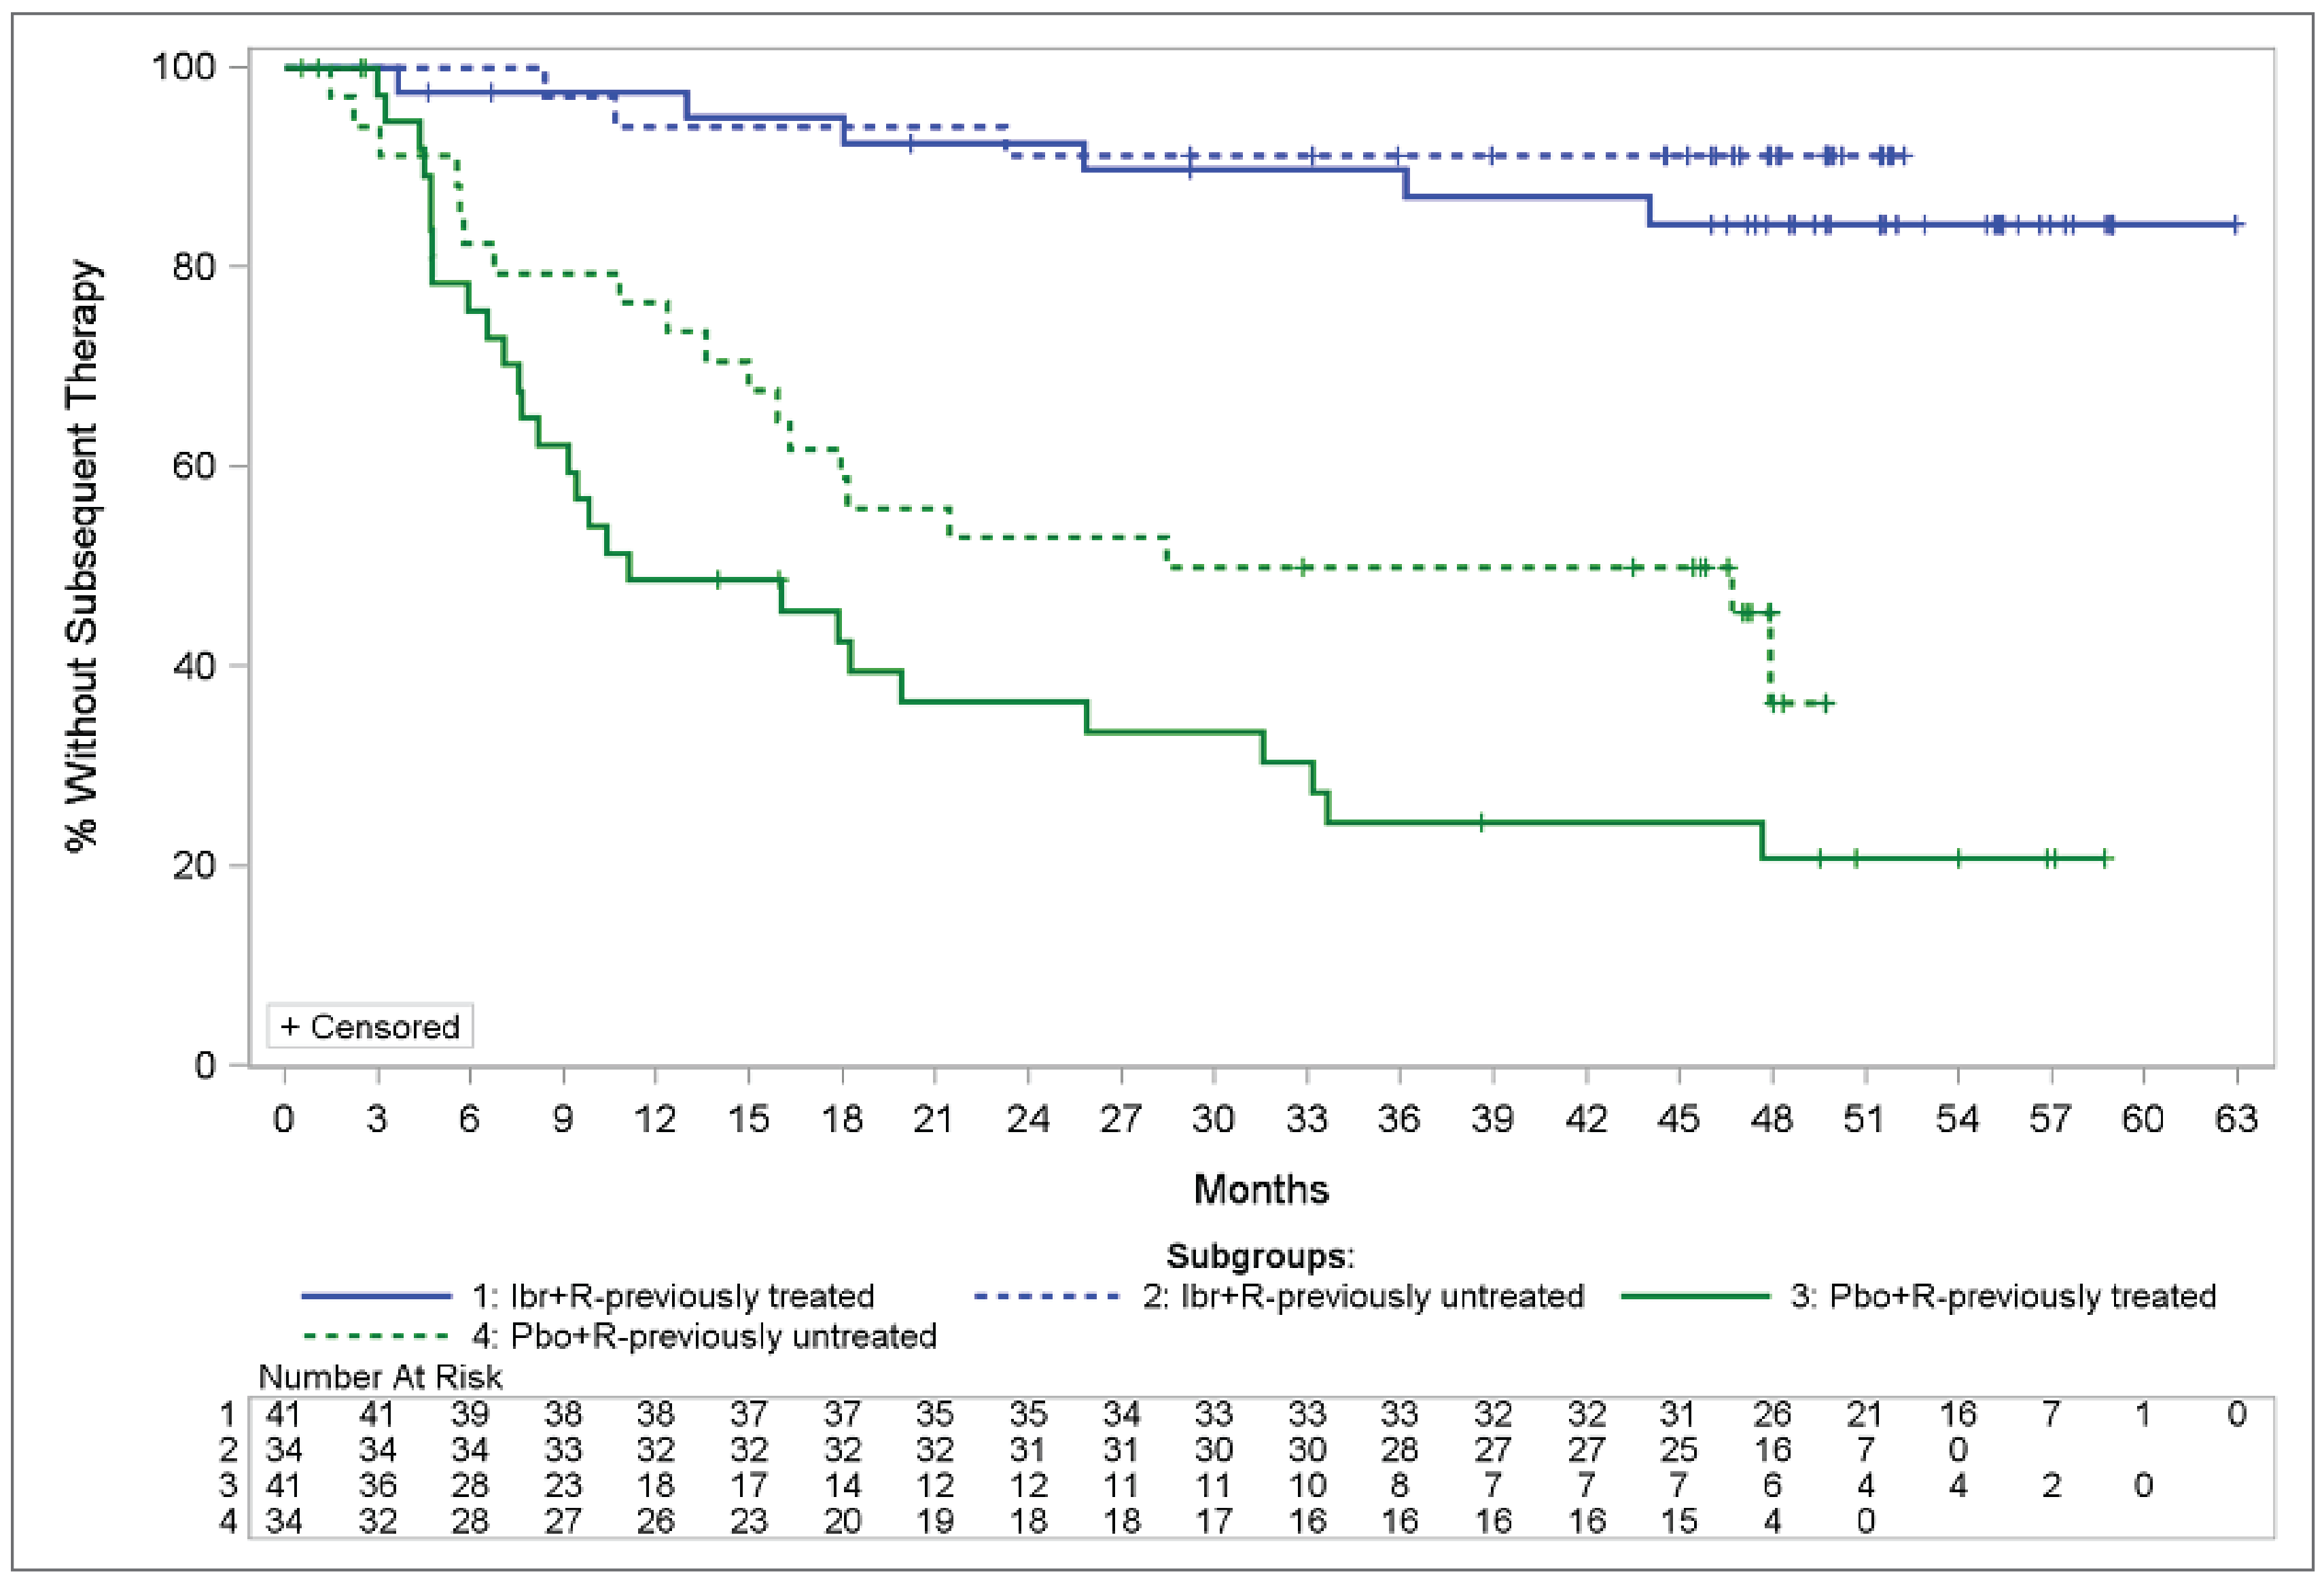
Ibr+R = ibrutinib plus rituximab; Pbo+R = placebo plus rituximab; TTNT = time to next treatment.
Source: iNNOVATE Clinical Study Report (2020).15
Improvements in Hemoglobin Levels
This end point is defined as the proportion of patients with sustained hemoglobin improvement for more than 56 days. In the r/r WM population, baseline hemoglobin levels were 10.9 g/dL in the IR arm and 10.3 g/dL in the rituximab plus placebo arm. At follow-up, 29 of 41 (70.7%) patients had sustained hemoglobin improvement in the IR arm, whereas in the rituximab plus placebo arm, 12 patients (29%) had sustained improvement. This represents an absolute difference of 41.5% (95% CI, 19.3% to 60.5%; P = 0.003).
For the general population (patients who were treatment-naive and patients with r/r WM) in the iNNOVATE study), baseline hemoglobin levels were comparable in the IR and rituximab plus placebo arms (10.5 g/dL versus 10 g/dL), and 58 of 75 (77.3%) patients treated with IR and 32 of 75 patients (42.7%) treated with rituximab plus placebo had sustained hemoglobin improvement.
Improvements in IgM Levels
For the r/r population, changes in IgM levels were reported only in the iNNOVATE substudy (31 patients treated with ibrutinib monotherapy). At baseline, median IgM levels were 39.2 g/L. The maximum median decrease was 36.6 g/L less (95% CI, 74.8 less to 4.5 less) in this single-arm study.
For the general population (patients who were treatment-naive and patients with r/r WM) in the iNNOVATE study, median baseline IgM levels were 32.9 g/L and 31.8 g/L for patients treated with IR and rituximab plus placebo, respectively. For patients treated with IR, IgM levels were reduced by 33.3 g/L. For patients treated with rituximab plus placebo, the maximum median reduction in IgM levels was 26.9 g/L.
Table 14: Summary of Key Efficacy Results in the r/r Population
Key efficacy outcome | iNNOVATE study | iNNOVATE substudy | |
|---|---|---|---|
IR (N = 41) | Rituximab plus placebo (N = 41) | Ibrutinib (N = 31) | |
PFS | |||
n | 41 | 41 | 31 |
Median, months (95% CI) | NE (49.8 to NE) | 14.8 (5.6 to 25.8) | 39 (25 to NE) |
Rate, % (95% CI) | 30-month: 79.5 (63.2 to 89.2) 48-month: 71.1 (53.7 to 82.9) 54-month: 67.5 (49.6 to 80.2) | 30-month: 29.1 (15.5 to 44.0) 48-month: 19.9 (8.7 to 34.4) 54-month: 19.9 (8.7 to 34.4) | 18-month: 81 (62 to 91) 60-month: 40 (22 to 57) |
Absolute difference in rates between IR and rituximab plus placebo, % (95% CI), | 30-month: 50.5 (31.1 to 69.9) 48-month: 51.1 (31.5 to 70.8) 54-month: 47.6 (27.3 to 67.9) | Not applicable | |
HR (95% CI) | 0.22 (0.11 to 0.43) | Not applicable | |
P value | < 0.0001 | Not applicable | |
OS | |||
n | NR | NR | 31 |
Median, months (95% CI) | NR | NR | NE (NE-NE) |
Rate, % (95% CI) | NR | NR | 18-month: 94 (77 to 98) 60-month: 73 (54 to 86) |
HR (95% CI) | NR | Not applicable | |
P value | NR | Not applicable | |
CI = confidence interval; HR = hazard ratio; IR = ibrutinib plus rituximab; NE = not evaluable; NR = not reported; OS = overall survival; PFS = progression-free survival; r/r = relapsed or refractory.
Note: Details included in the table are from the sponsor’s Summary of Clinical Evidence.
Source: iNNOVATE Clinical Study Report (2020).15
Table 15: Summary of Other Key Efficacy Results in the r/r Population
Other efficacy end points | iNNOVATE study | iNNOVATE substudy | |
|---|---|---|---|
IR (N = 41) | Rituximab plus placebo (N = 41) | Ibrutinib (N = 31) | |
DORa | |||
Number of patients contributing to the analysis | 31 | 9 | 24 |
n (%) | 5 (16) | 5 (56) | 13 (54) |
Median, months (95% CI) | NE (56 to NE) | 24 (9 to NE) | 33 (23 to NE) |
TTNT | |||
Number of patients contributing to the analysis, n (%) | NR | NR | 10 (32) |
Median TTNT, months (95% CI) | NR | NR | NE (42 to NE) |
OR, RR, or HR (95% CI) | NR | NR | NA |
P value | NR | NR | NA |
Improvements in hemoglobin levels | |||
Number of patients contributing to the analysis | 41 | 41 | 31 |
Baseline, median, g/dL | NR | NR | 10.3 |
Value at last time point, median, g/dL | NR | NR | NR |
Proportion of patients with sustained hemoglobin improvement, n (%) | 29 (70.7) | 12 (29.3) | 22 (71) |
Rate difference (95% CI) | 41.5 (19.3 to 60.5) | NA | |
P value | 0.00032.41 | NR | |
Maximum median change, g/L (minimum to maximum) | NR | NR | Week 249: 23 (7 to 89) |
Improvements in IgM levels | |||
Number of patients contributing to the analysis | NR | NR | 31 |
Baseline, median, g/L | NR | NR | 39.2 |
Maximum median change, g/L (95% CI) | NR | NR | Week 233: –36.6 (–74.8 to –4.5) |
P value | NR | NR | NR |
CI = confidence interval; DOR = duration of response; HR = hazard ratio; IgM = immunoglobulin M; IR = ibrutinib plus rituximab; NA = not applicable; NE = not evaluable; NR = not reported; OR = odds ratio; r/r = relapsed or refractory; RR = relative risk; TTNT = time to next treatment.
aDefined as the date of initial documentation of response to the date of first documented evidence of PD or death for responders.
Source: iNNOVATE Clinical Study Report (2020).15
Harms
Overview of Safety
Atrial fibrillation, diarrhea, and hypertension were some of the most reported AEs (by ≥ 10% of patients) of any grade in the iNNOVATE study. The largest number of AEs of any grade was seen in patients receiving rituximab plus placebo: 59% of patients reported infusion-related reactions. Some of the most reported SAEs were pneumonia and atrial fibrillation in iNNOVATE. Study discontinuation due to AEs was relatively low; the proportion of patients who discontinued the study treatment due to AEs was, at most, 12%.
The key safety outcomes and AEs in the iNNOVATE study are summarized in Table 16.
Adverse Events
All 75 patients in each arm presented with at least 1 AE (as did 30 of the 31 patients in the ibrutinib monotherapy arm of the iNNOVATE substudy).
The most common AEs of any grade in the IR and rituximab plus placebo groups, respectively, were infusion-related reaction (43% and 59%), anemia (24% and 28%), and diarrhea (31% and 15%).
Some AEs more commonly reported in the IR arm than in the rituximab plus placebo arm included hypertension (25% versus 5%), diarrhea (31% versus 15%), nausea (23% versus 12%), dyspepsia (17% versus 1%), peripheral edema (23% versus 12%), and arthralgia (27% versus 12%).
AEs of grade 3 or higher in the IR and rituximab plus placebo arms included anemia (11% versus 17%), infusion-related reaction (1% and 16%), hypertension (13% and 4%), and atrial fibrillation (12% and 1%).
Serious Adverse Events
SAEs in the iNNOVATE study were more common in the IR arm than in the rituximab plus placebo arm (40 patients [53%] versus 25 patients [33%]). These included pneumonia (11% versus 3%) and atrial fibrillation (11% versus 1%). In the ibrutinib monotherapy arm (substudy), 16 patients presented with at least 1 SAE (52%).
Withdrawals Due to Adverse Events
In the iNNOVATE study, 12% of patients in the IR arm withdrew due to an AE, as did 8% of those in the rituximab plus placebo arm. The most common AE leading to discontinuation across studies was atrial fibrillation. Other AEs included metastatic breast cancer, interstitial lung disease, pneumonia, small cell lung cancer, macular rash, anemia, asthenia, breast cancer, Brugada syndrome, immune thrombocytopenic, and night sweats.
Mortality
In the iNNOVATE study, 1 patient died due to an AE in the IR arm and 3 patients died in the rituximab plus placebo arm. The cause of these patient deaths included pneumonia, Bing-Neel syndrome, and intracranial hemorrhage. No deaths were reported in the iNNOVATE substudy.
Notable Harms
Among the significant concerns identified by the clinical experts consulted by CADTH and other stakeholders were issues like atrial fibrillation, serious respiratory infections, major hemorrhage, and cytopenias. All of these AEs reported here were evaluated in the general population of the iNNOVATE study and the substudy.
In this case, the proportion of patients with atrial fibrillation was larger in the IR arm (14 patients [19%]) than in the rituximab plus placebo arm (2 patients [3%]), but there was no atrial fibrillation in the ibrutinib monotherapy arm of the substudy. Similarly, serious respiratory infections occurred in 4 patients (5%) in the IR arm, in none in the rituximab plus placebo arm, and 1 patient in the substudy population. Major hemorrhage occurred slightly more frequently in the IR arm (5 patients [7%]) than in the rituximab plus placebo arm (3 patients [4%]).
Of the cytopenias evaluated, neutropenia was more common in the IR arm than in the rituximab plus placebo arm (16% versus 9%), but anemia (24% versus 28%) and thrombocytopenia (7% versus 11%) were less common.
Table 16: Summary of Harms Results From Studies Included in the Systematic Review
AEs | iNNOVATE study (all populations) | iNNOVATE substudy | |
|---|---|---|---|
IR (N = 75) | Rituximab plus placebo (N = 75) | Ibrutinib (N = 31) | |
Most common AE (any grade or otherwise specified), n (%)a | |||
Patients with ≥ 1 AE | 75 (100) Grade ≥ 3: 54 (72) | 75 (100) Grade ≥ 3: 45 (60) | 30 (97) Grade ≥ 3: 25 (81) |
Anemia | 18 (24) | 21 (28) | 5 (16) |
Neutropenia | 12 (16) | 7 (9) | 9 (29) |
Increased tendency to bruise | 9 (12) | 2 (3) | 8 (26) |
Thrombocytopenia | 5 (7) | 8 (11) | 7 (23) |
Atrial fibrillation | 14 (19) | 2 (3) | 0 |
Tinnitus | 1 (1) | 3 (4) | 4 (13) |
Increased lacrimation | 9 (12) | 3 (4) | 1 (3) |
Reduced visual acuity | 9 (12) | 3 (4) | 1 (3) |
Cataract | 7 (9) | 1 (1) | 4 (13) |
Vision blurred | 7 (9) | 2 (3) | 4 (13) |
Diarrhea | 23 (31) | 11 (15) | 15 (48) |
Nausea | 17 (23) | 9 (12) | 7 (23) |
Dyspepsia | 13 (17) | 1 (1) | 2 (7) |
Constipation | 10 (13) | 9 (12) | 6 (19) |
Abdominal pain | 4 (5) | 3 (4) | 4 (13) |
Peripheral edema | 17 (23) | 9 (12) | 5 (16) |
Pyrexia | 13 (17) | 12 (16) | 11 (36) |
Fatigue | 13 (17) | 18 (24) | 5 (16) |
Asthenia | 12 (16) | 19 (25) | 5 (16) |
Nasopharyngitis | 12 (16) | 7 (9) | 3 (10) |
Bronchitis | 11 (15) | 5 (7) | 3 (10) |
Urinary tract infection | 11 (15) | 0 | 3 (10) |
Upper respiratory tract infection | 10 (13) | 3 (4) | 6 (19) |
Influenza | 10 (13) | 5 (7) | 2 (7) |
Pneumonia | 9 (12) | 4 (5) | 3 (10) |
Respiratory tract infection | 8 (11) | 2 (3) | 5 (16) |
Conjunctivitis | 4 (5) | 3 (4) | 4 (13) |
Sinusitis | 4 (5) | 2 (3) | 4 (13) |
Fall | 8 (11) | 3 (4) | 3 (10) |
Hypokalemia | 9 (12) | 1 (1) | 2 (7) |
Arthralgia | 20 (27) | 9 (12) | 7 (23) |
Muscle spasms | 16 (21) | 9 (12) | 5 (16) |
Back pain | 13 (17) | 7 (9) | 9 (29) |
Pain in extremity | 10 (13) | 6 (8) | 5 (16) |
Headache | 13 (17) | 17 (23) | 7 (23) |
Dizziness | 10 (13) | 6 (8) | 4 (13) |
Insomnia | 12 (16) | 5 (7) | 2 (7) |
Cough | 16 (21) | 8 (10) | 9 (29) |
Dyspnea | 8 (11) | 10 (13) | 3 (10) |
Epistaxis | 8 (11) | 8 (11) | 4 (13) |
Ecchymosis | 9 (12) | 0 | 0 |
Petechiae | 7 (9) | 0 | 4 (13) |
Dry skin | 3 (4) | 0 | 6 (19) |
Onychoclasis | 2 (3) | 0 | 4 (13) |
Hypertension | 19 (25) | 4 (5) | 8 (26) |
Infusion-related reaction | 32 (43) | 44 (59) | 0 |
SAE, n (%)b | |||
Patients with ≥ 1 SAE | 40 (53) | 25 (33) | 16 (52) |
Respiratory tract infection | 4 (5) | 0 | 1 (3) |
Arthralgia | 3 (4) | 0 | 0 |
Fall | 3 (4) | 0 | 0 |
Syncope | 1 (1) | 0 | 2 (7) |
Musculoskeletal chest pain | 2 (3) | 0 | 3 (10) |
Pneumonia | 8 (11) | 2 (3) | 1 (3) |
Atrial fibrillation and/or flutter | 8 (11) | 1 (1) | 0 |
Hypertension | 1 (1) | 3 (4) | NR |
Infusion-related reaction | 0 | 5 (7) | NR |
Patients who stopped treatment due to adverse events, n (%) | |||
Patients who stopped | 9 (12) | 6 (8) | 2 (7) |
Deaths, n (%) | |||
Patients who died | 1 (1) | 3 (4) | 0 |
Pneumonia | 1 (1) | 0 | 0 |
General disorders and administration-site conditions, death | 0 | 1 (1) | 0 |
Bing-Neel syndrome | 0 | 1 (1) | 0 |
Hemorrhage intracranial | 0 | 1 (1) | 0 |
Harms of special interest | |||
Atrial fibrillation c | 14 (19) | 2 (3) | 0 |
Serious respiratory infections | 4 (5) | 0 | 1 (3) |
Major hemorrhage | 5 (7) | 3 (4) | 0 |
Neutropenia | 12 (16) | 7 (9) | 9 (29) |
Anemia | 18 (24) | 21 (28) | 5 (16) |
Thrombocytopenia | 5 (7) | 8 (11) | 7 (23) |
AE = adverse event; IR = ibrutinib plus rituximab; NR = not reported; SAE = serious adverse event.
aAE occurring in ≥ 10% of patients.
bSAE occurring in ≥ 4% of patients.
cOne patient (1.1%) discontinued due to atrial fibrillation and macular rash.
Note: Details included in the table are from the sponsor’s Summary of Clinical Evidence.
Source: iNNOVATE Clinical Study Report (2020).15
Critical Appraisal
Internal Validity
Overall, the iNNOVATE trial comparing IR to rituximab plus placebo has a low risk of bias, and presents no concerns about the randomization process. The randomization list was properly generated and ensured a concealment allocation of patients to each arm of the study. No baseline imbalances were detected that would suggest an issue with the randomization process. With the use of a placebo, blinded patients receiving the interventions and assessors of the study are unlikely to have known which intervention the patients were receiving. Hence, there were no concerns about a risk of bias due to deviations from the intended interventions. An ITT analysis was performed to assess the effects of assignment to the intervention.
Although patients were allowed to cross over to receive ibrutinib after disease progression, patients were analyzed in the arm to which they were initially randomized, and the main outcome (i.e., disease progression) was considered by the clinical experts to be an objective end point that is correlated with OS and DOR.
Data regarding the primary outcomes were available for almost all randomly assigned participants, minimizing the potential for bias from incomplete outcome data. There were discrepancies in the number of censored patients for the outcome of PFS, with more patients being censored in the IR arm than in the rituximab plus placebo arm; in this case, patients were censored if they did not have PD and were not known to have died as of clinical data cut-off at the date of the last evidence of no progression by IRC. This discrepancy may be related to the lower number of patients available to analyze in the rituximab plus placebo arm as the study advanced in time and to the large number of patients crossing over once they reached a progression state. Despite this difference, sensitivity analyses based on censoring at the last adequate response assessment before documented progression or death showed results similar to those in the base case of PFS, minimizing the possibility of bias due to discrepancies in censoring between arms.
The IRC evaluated response and disease progression in a blinded manner; hence, there was a low risk of bias resulting from the measurement of outcomes. Furthermore, outcomes of interest were objective to measure, according to clinical experts, and similarly assessed between treatment arms of the study.
External Validity
Patients included in the iNNOVATE study have baseline characteristics and prognostic factors similar to those encountered in the clinical landscape in Canada, according to the clinical experts consulted by CADTH.
One concern from the experts was the lack of a relatable direct comparison of treatments commonly used in practice (like ibrutinib monotherapy or zanubrutinib monotherapy). Although the iNNOVATE trial is a well-conducted study, its results are only applicable to a small proportion of patients in Canada, because currently, other BTK inhibitors (zanubrutinib) are available and preferred over rituximab monotherapy.
The iNNOVATE clinical trial assessed patients treated with IR or rituximab monotherapy who experienced disease relapse fewer than 12 months from the last rituximab exposure or who did not experience a minor response with a prior rituximab-containing regimen. Canadian provinces typically do not fund rituximab re-treatment if disease relapse occurs fewer than 6 months (and some provinces, 12 months) from the completion of rituximab therapy. Therefore, if both ibrutinib monotherapy and ibrutinib in combination with rituximab are recommended for patients with previously treated r/r WM, provinces may only be able to implement ibrutinib monotherapy. The generalizability of this finding is uncertain, according to clinical experts, but is unlikely to make a difference in real-life practice.
GRADE Summary of Findings and Certainty of the Evidence
Methods for Assessing Certainty of the Evidence
For pivotal studies and RCTs identified in the sponsor’s systematic review, GRADE was used to assess certainty of the evidence for the outcomes considered most relevant to CADTH’s expert committee deliberations and a final certainty rating was determined as outlined by the GRADE Working Group.13,14
High certainty: We are very confident that the true effect lies close to that of the estimate of the effect.
Moderate certainty: We are moderately confident in the effect estimate. The true effect is likely to be close to the estimate of the effect, but there is a possibility that it is substantially different. We use the word “likely” for evidence of moderate certainty (e.g., “X intervention likely results in Y outcome”).
Low certainty: Our confidence in the effect estimate is limited. The true effect may be substantially different from the estimate of the effect. We use the word “may” for evidence of low certainty (e.g., “X intervention may result in Y outcome”).
Very low certainty: We have very little confidence in the effect estimate. The true effect is likely to be substantially different from the estimate of effect. We describe evidence of very low certainty as “very uncertain.”
For RCTs using the GRADE approach, evidence started as high-certainty evidence and could be rated down for concerns related to study limitations (which refers to internal validity or risk of bias), inconsistency across studies, indirectness, imprecision of effects, and publication bias.
For the pivotal single-arm trials, although GRADE guidance is not available for noncomparative studies, the CADTH review team assessed them for study limitations (which refers to internal validity or risk of bias), inconsistency across studies, indirectness, imprecision of effects, and publication bias to present these important considerations. Because the lack of a comparator arm does not allow for a conclusion to be drawn about the effect of the intervention relative to any comparator, the certainty of evidence for single-arm trials started at very low certainty, with no opportunity for rating up.
When possible, certainty was rated in the context of the presence of an important (nontrivial) treatment effect; if this was not possible, certainty was rated in the context of the presence of any treatment effect (i.e., the clinical importance is unclear). In all cases, the target of the certainty of the evidence assessment was based on the point estimate and where it was located relative to the threshold for a clinically important effect (when a threshold was available) or to the null assessment.
Results of GRADE Assessments
The GRADE assessments included an evaluation of the main outcomes considered important by clinicians, patient groups, and stakeholders. The comparison evaluated in the GRADE assessment was that of IR against rituximab plus placebo. Table 2 presents the GRADE summary of findings for this comparison.
Overall, there was moderate certainty about the outcome of PFS due to imprecision. The threshold of clinical importance for benefit or harm was set at 10 more (or fewer) patients per 1,000 for the event rate for PFS. This was obtained after iterative discussions with the clinical experts and the CADTH team. Despite observing an effect estimate beyond this threshold, the team decided to rate the evidence down 1 level due to concerns about the sample size (N = 82) in the study.
OS was very uncertain because the 1 single-arm study provided only descriptive data for survival, and was therefore rated down 3 levels for risk of bias and down 1 level for indirectness because the population included in the study (patients previously treated with rituximab) was different than the population described in Table 2 (patients with r/r disease with or without previous rituximab use). There is a row in Table 2 with indirect evidence obtained from the overall population (patients with r/r disease and patients who were treatment-naive) for the patient or PICO question; hence, the evidence was rated down 1 level for indirectness and 2 levels for imprecision.
DOR was also imprecise due to the small number of observations available (i.e., only those patients who responded).
In TTNT, low-certainty evidence was included from the iNNOVATE study r/r population (rated down 2 levels for imprecision and because there were no thresholds with which to judge the evidence, only the null assessment was used).
Sustained hemoglobin improvement was deemed to be of moderate certainty, rated down only for imprecision due to the sample size, but as input from the clinical experts acknowledged, results with such a large effect size are credible and well above the threshold of 100 per 1,000 patients, which was determined to be a clinically important benefit (or harm). IgM levels were deemed not appropriate for evaluation with thresholds because no precise estimates could be obtained.
As with IgM levels, no precise estimates were obtained from AEs, SAEs, or other harms; hence, the null and clinical assessments were used to judge the precision of the possible differences observed in a narrative way. Except for AEs, all harms were deemed to be of moderate certainty.
Indirect Evidence
The contents within this section have been informed by materials submitted by the sponsor. The following has been summarized and validated by the CADTH review team.
Objectives for the Summary of Indirect Evidence
The aim of the analysis submitted by the sponsor was to determine the comparative efficacy of IR relative to PC, rituximab plus placebo with PC, and ibrutinib monotherapy for PFS and preprogression mortality in the first-line setting for patients with r/r WM. The sponsor provides an ITC and adjusted analyses, depending on the data available for analysis. First, a systematic review of the literature was conducted to assess the feasibility of the analyses.
Study Selection Methods
To estimate the relative efficacy of interventions for patients with WM (first-line or r/r), a systematic review of the literature was conducted to identify whether data were available to inform the ITCs. The date of the last search update was March 23, 2021. The identified evidence for the treatment of patients with WM was limited by the availability of only a few RCTs and by methodological flaws of the included studies, including small sample sizes and a lack of blinding. In addition, the heterogeneity of patient characteristics and inconsistencies in their reporting complicated potential comparisons of the treatment effect across studies.
Description of Indirect Comparisons and Adjusted Analyses
The specific ITC method depended on the type of data available and included PSM, MAIC, IPTW analyses, and adjusted Cox proportional hazards) model (refer to Table 17).
The ITCs were conducted for the first-line and r/r patient population; however, only ITCs for the latter are reported in this section because this is the population of interest for the CADTH review.
First, a chart review study, which included data from 454 patients with WM, was conducted in collaboration with the European Consortium for Waldenström's Macroglobulinemia in 10 European countries: France, Germany, Italy, Spain, the UK, Czechia, Poland, Austria, Greece, and the Netherlands.6 Electronic records were collected retrospectively for patients who had:
proven and confirmed WM, according to recommendations from the second IWWM6
symptomatic disease at the initiation of therapy
a diagnosis of WM and treatment initiation after January 2000 and before January 2014
experienced at least 1 salvage regimen (excluding maintenance settings).
The chart review provided longitudinal data on patients and treatment outcomes for up to 5 lines of treatment. Data for PFS, OS, and key prognostic variables (age, sex, IPSSWM, and beta-2 microglobulin, serum IgM, hemoglobin, and platelet levels) were captured. The chart review was the primary data source in the model for the clinical efficacy of the PC comparator. Only regimens recommended in treatment guidelines1,30 and those with the greatest proportion of patients receiving them were used to select the regimens that informed the efficacy of PC. As a note, in the chart review data, the 10-year OS rate for patients with r/r disease was 69% (95% CI, 62% to 74%).
The Lyon-Sud database was another source of information that provided data on patients treated with PC (RWE PC) for the indirect comparison against IR (from the iNNOVATE phase III trial arm).31 The adjusted comparison to be evaluated included survival outcomes from 224 lines of therapy in 117 patients from the Lyon-Sud database and from 75 patients in the iNNOVATE trial (Table 18 and Table 19). The most common treatment regimens in the RWE arm of the comparison were rituximab (with 51 treatment lines), chemotherapy (with 66 lines; including 31 for chlorambucil), DRC (with 35 lines), and rituximab with or without cyclophosphamide plus doxorubicin plus vincristine plus prednisone (CHOP)–like therapy (with 21 lines); other rituximab-containing regimens comprised the remaining sample of treatment lines.
The other sources of evidence stem from the iNNOVATE trial (data for IR, rituximab plus placebo, and ibrutinib monotherapy from the single-arm substudy), the PCYC-1118E study (data for ibrutinib monotherapy), and the ASPEN study (data for zanubrutinib), as shown in Figure 2.
The iNNOVATE study, the chart review, and the PCYC-1118E trial were evaluated for the feasibility of conducting ITCs (Table 18). The feasibility assessment focused on similarities and differences in trial designs and populations, inclusion criteria, outcomes assessment, and the availability of information on prognostic factors that impact PFS and OS and can be used for adjustment in ITCs.
Given the variation between populations captured in the iNNOVATE and PCYC-1118E trials and the chart review, it was important to attempt to adjust for differences in the populations for the ITC analyses to reduce bias. Adjusted patient characteristics include age, sex, diagnosis history, IPSS score, blood test abnormalities, and previous treatments. Note that only patients with complete baseline characteristics were included in the analysis. Individual patient data were available for the chart review and the iNNOVATE trial, whereas only published data were available for the PFS outcome from the PCYC-1118E trial.
The efficacy for IR relative to rituximab was available from the head-to-head iNNOVATE trial data. However, it was not possible to form a connected network through the rituximab control arm to establish the efficacy of IR relative to PC. Alternative ITC methods were required to estimate comparative efficacy. Data on ibrutinib monotherapy were available from the PCYC-1118E trial, so no comparative trial data to link those data to iNNOVATE trial comparators were available. In patients with r/r disease, the IR iNNOVATE arm was indirectly compared to the RWE PC data from the Lyon-Sud database. The adjusted comparison evaluated survival outcomes from 224 lines of therapy in 117 patients (i.e., RWE) in the Lyon-Sud database.
Table 17: Study Selection Criteria and Methods for ITCs Submitted by the Sponsor
Characteristics | Indirect comparison |
|---|---|
Population | Patients with WM and TN or r/r disease |
Intervention | Any therapy for WM |
Comparator | Any comparator, including active treatment, placebo, or no treatment |
Outcome | Efficacy:
Safety:
Economic and health care resource use:
|
Study designs | Clinical efficacy and safety:
Economic outcomes:
HRQoL outcomes:
|
Exclusion criteria | Narrative publications, nonsystematic reviews, case studies, case reports, and editorials; comparative studies with fewer than 10 patients with WM per treatment group |
Databases searched | MEDLINE, MEDLINE In-Process (via PubMed), Embase, Embase In-Process, and CENTRAL |
Selection process | Records were independently screened and assessed for eligibility by 2 reviewers |
Data extraction process | Data were extracted by 1 reviewer and verified by a second reviewer |
Quality assessment | Quality assessment was not performed |
AE = adverse event; DOR = duration of response; EQ-5D-5L = 5 Level EQ-5D; FACT-An = Functional Assessment of Cancer Therapy-Anemia; HRQoL = health-related quality of life; IgM = immunoglobulin M; ITC = indirect treatment comparison; OS = overall survival; PFS = progression-free survival; PR = partial response; PRO = patient-reported outcome; QALY = quality-adjusted life-year; TN = treatment naive; TTNT = time to next treatment; WM = Waldenström macroglobulinemia.
Note: Details included in the table are from the sponsor’s Summary of Clinical Evidence.
IR Versus PC
For the comparison of IR and PC, PSM, adjusted Cox proportional hazard model, and IPTW analyses were performed (Figure 2 and Table 18). For the PSM, baseline demographic and disease characteristics available in both the iNNOVATE trial and chart review were the following: age (linear and squared), sex, serum beta-2 macroglobulin, hemoglobin, serum monoclonal IgM, platelet count, IPSSWM, time from WM diagnosis (linear and squared), and prior lines of treatment (0, 1, 2, 3, or 4+). All analyses were stratified by population (first-line versus r/r). A logistic regression model for the propensity of enrolment in the IR arm of iNNOVATE trial or of PC from the chart review was fitted. All commonly available baseline demographic and disease characteristics (except prior line of treatment) were used to derive the probability of belonging to each treatment using the method of likelihood maximization. As advised in the NICE Decision Support Unit Technical Support Document 18,32 the distribution and the mean of the propensity score was computed for both groups. This was used to assess overlap in the propensity score, which represents the degree to which cohorts have a shared range of estimated propensity scores. The distribution of propensity scores was relatively similar in the IR and PC arms for the first-line population. However, there were some extreme values for the IR arm of the r/r population that could not be matched to any patient from the chart review.
Given the lack of overlap of propensity scores in the r/r population, an adjusted Cox proportional hazard model approach was attempted, which included all the terms that were used in the propensity score calculation. However, due to heavy imbalances in baseline patient characteristics, specifically the number of previous regimens, the authors considered the treatment effect estimated to be unreliable.
Given the lack of overlap in propensity scores in the r/r population, the IPTW approach was attempted, which included additional interaction terms of covariates with previous line of treatment and backward-elimination covariates with a P value > 0.20 from the propensity score calculation. However, the lack of overlap in patient characteristics created extremely small weights, as well as a few patients with heavy weights relative to the rest of the population. This formed sudden drops at around 10 months and 18 months in the PC arm of the chart review cohort when the patients with the heaviest weights experienced an event. Furthermore, IPTW is heavily reliant on correct specification of the PSM, and bias and imprecision are increased with misspecification. Due to these limitations, the authors did not consider further analyses for this comparison.
Rituximab Plus Placebo Versus Physician Choice
The comparison of rituximab plus placebo and PC was available and is briefly described in Table 18, but it was not considered relevant to this CADTH review.
Ibrutinib Monotherapy Versus IR
For the comparison of ibrutinib monotherapy and IR, a MAIC analysis was performed (detailed in Table 18). A MAIC is a population-based approach that involves making comparisons between treatments using information from compatible studies and adjusting for differences in the profiles of the populations of these studies.
Published data on patient characteristics and outcomes from the PCYC-1118E trial of ibrutinib monotherapy and patient-level data from the IR arm of the iNNOVATE trial (n = 41) were used for the analyses. The compatibility assessment showed that there was a higher proportion of patients younger than 65 years in the PCYC-1118E study than in the iNNOVATE study. Patients enrolled in the PCYC-1118E study were heavily pretreated as well; overall, 16 (25.4%) patients received 5 or more regimens. In the iNNOVATE study, only 1 patient received 4 prior regimens and 1 patient received 5 prior regimens. Due to these limitations, the authors determined that a MAIC would be unreliable, given the minimal overlap in the patient population and limited sample size. Hence, a naive comparison was produced and provided in the results.
Results
Summary of Included Studies
Evidence Networks
The evidence network for PFS across r/r subgroups is represented in Figure 2 and Table 20 and, as discussed in the Description of Studies section, so are the possible actions to assess the comparisons of interest.
Table 18: ITC Analysis Methods
Methods | PC vs. IR | PC vs. Rituximab | Ibrutinib vs. IR | IR vs. RWE PC |
|---|---|---|---|---|
Analysis methods | PSM IPTW Adjusted Cox PH model | PSM IPTW Adjusted Cox PH model Naive comparison | MAIC Naive comparison | MAIC |
Data sources | PC: IPD from chart review (n = 210) IR: IPD from the iNNOVATE study (n = 41) | PC: IPD from chart review (n = 210) Rituximab: IPD from the iNNOVATE study (n = 41) | Ibrutinib monotherapy: PCYC-1118E (n = 63) IR: iNNOVATE study (n = 41) | IR: IPD from the iNNOVATE study (n = 41) RWE PC: Lyon-Sud database (n = 54) |
Outcomes | PFS | PFS | PFS | PFS, OS |
Model estimation | PSM: A logistic regression model was fit to estimate the propensity score, using the listed PSM and ITPW covariates. Matching was performed in a 1:2 ratio. A Cox PH model was used with matched data to estimate the HR. IPTW: Weights were calculated from the propensity score, as estimated from the logistic regression model used for PSM, but using the listed PSM and ITPW covariates. A weighted Cox PH model was then used to estimate the HR. Adjusted Cox PH model: A Cox PH model was fit to estimate the HR, using the listed PSM and ITPW covariates. | PSM: A logistic regression model was fit to estimate the propensity score, using the listed PSM and ITPW covariates. Matching performed at a 1:1 ratio with 0.2 × SD caliper, stratified by line of treatment. A Cox PH model was used with matched data to estimate the HR. IPTW: Weights were calculated as propensity score / (1 – propensity score) for PC arm and as1 for rituximab arm, where propensity score represents the propensity score estimated from the logistic regression model used for PSM, using the listed PSM and ITPW covariates. A weighted Cox PH model was then used to estimate the HR. Adjusted Cox PH model: A Cox PH model was fit to estimate the HR, using the listed PSM and ITPW covariates. | MAIC: A logistic regression model was fit to estimate the propensity score, using method of moments, per NICE DSU TSD 18, and therefore patient weights. A weighted Cox PH was fit to estimate the HR. | Not stated |
Covariates included | PSM:
IPTW:
| PSM:
IPTW:
| MAIC:
| Not stated |
Assessment of distribution or overlap in propensity score or patient weights | The distribution and summary statistics (i.e., mean, SD) were assessed and compared between groups. | The distribution and summary statistics (i.e., mean, SD) were assessed and compared between groups. A difference in means of 0.25 was considered large. | Effective sample size was evaluated to assess the impact of matching and adjustment on the sample size. | Not stated |
Assessment of balance | SMDs were compared before and after to assess degree of covariate balance. | SMDs were compared before and after to assess degree of covariate balance. | Comparison of baseline characteristic summary statistics before and after matching and adjustment. | Not stated |
Sensitivity analyses | Not stated | Not stated | Additional prognostic factors:
| Not stated |
Subgroup analysis | First-line patients Patients with r/r disease | Patients with r/r disease only | Patients with r/r disease only | First-line patients First-line and beyond patients Second-line and beyond patients |
HR = hazard ratio; IgM = immunoglobulin M; IPD = individual patient data; IPSSWM = International Prognostic Scoring System for Waldenström Macroglobulinemia; IPTW = inverse probability of treatment weighting; IR = ibrutinib plus rituximab; ITC = indirect treatment comparison; MAIC = matching-adjusted indirect comparison; NICE DSU TSD 18 = National Institute for Health and Care Excellence Decision Support Unit Technical Support Document 18; OS = overall survival; PC = physician’s choice; PFS = progression-free survival; PH = proportional hazards; PSM = propensity score matching; r/r = relapsed or refractory; RWE = real-world evidence; SD = standard deviation; SMD = standardized mean difference; WM = Waldenström macroglobulinemia.
Note: Details included in the table are from the sponsor’s Summary of Clinical Evidence.
Table 19: Assessment of Homogeneity for ITC
Characteristics | Description and handling of potential effect modifiers |
|---|---|
Disease severity | Patients in the chart review study had a shorter time since diagnosis (64.4 months) and most were IPSSWM high (48.1%). Patients in iNNOVATE and PCYC-1118E had longer times since diagnosis (101 and 90 months, respectively) and most were IPSSWM intermediate (49% and 42.9%, respectively). The chart review had the lowest proportion of IPSSWM low patients (12.4%) compared to iNNOVATE (19%) and PCYC-1118E (23.8%). The proportion of patients with serum IgM < 40 g/L was similar in the iNNOVATE study, the chart review, and the PCYC-1118E study, ranging from 54% to 63%. Disease severity for patients in the Lyon-Sud database was not reported. |
Treatment history | Among patients with r/r disease, most in the iNNOVATE IR arm (46%) and the chart review first-line through fifth-line study (61.4%) received 1 prior line of therapy. In the PCYC-1118E study, patients received 1 (28.6%), 2 (22.2%), or 5+ (25.4%) lines of therapy. Data from the Lyon-Sud database showed that patients were receiving first-line (48.7%), second-line (25%), and third-line and beyond (26.3) therapy. Survival outcomes were from 224 lines of therapy in 117 patients (i.e., RWE) in the Lyon-Sud database. |
Trial eligibility criteria | Patients in all trials had a clinicopathological diagnosis of WM and symptomatic disease at the time of treatment initiation. r/r WM patients were eligible for inclusion in the PCYC-1118E trial, whereas chart review patients could have up to 5 prior treatment lines and iNNOVATE patients could have any number of prior treatment lines. The Lyon-Sud database held medical records for all patients with WM diagnosed between 1980 and 2017 at Centre Hospitalier Lyon-Sud. |
Dosing of comparators | In the iNNOVATE trial, rituximab plus placebo was administered at 375 mg/m2 weekly during weeks 1 to 4 and weeks 17 to 20. Both the chart review and the Lyon-Sud database included patients treated with various WM therapies at various doses (e.g., rituximab [375 mg/m2, 1 day per cycle] + cyclophosphamide [100 mg/m2, days 1 to 5 per cycle] + dexamethasone [20 mg, 1 day per cycle]). The PCYC-1118E trial did not have a comparator. |
Placebo response | Only the iNNOVATE trial had a placebo-based comparator. The r/r subgroup reported a PFS rate of 19.9% at 54 months, with an HR of 0.222 (95% CI, 0.114 to 0.433), using an unstratified Cox regression model. |
Definitions of end points | The iNNOVATE trial defined PFS as the date of randomization to progression or death, assessed by IRC. The PCYC-1118E trial defined PFS as the time between therapy initiation and disease progression. In the iNNOVATE trial, OS was defined as the date of randomization to the date of death from any cause. The PCYC-1118E trial categorized OS as a secondary end point but did not define the outcome. The chart review and Lyon-Sud database did not report end point definitions. |
Timing of end point evaluation | The iNNOVATE trial evaluated PFS at 30, 48, 50, and 54 months and OS at 30, 48, and 54 months. The PCYC-1118E trial evaluated PFS and OS at 24 months and 5 years. The chart review and Lyon-Sud database did not report end point evaluation timing. |
Withdrawal frequency | The frequency of patients who withdrew from the iNNOVATE and PCYC-1118E trials was similar. Seventeen (11.3%) patients withdrew from the iNNOVATE trial (10 in the IR arm [10/75, 13.3%] and 7 in the rituximab plus placebo arm [7/75, 9.3%]) and 6 (9.5%) withdrew from the PCYC-1118E trial. Withdrawal frequency was not reported in the chart review and was not applicable in the Lyon-Sud database. |
Clinical trial setting | Patients in the iNNOVATE and PCYC-1118E trials and the chart review were treated in clinical settings, although the chart review retrospectively and electronically reviewed patient data. The PCYC-1118E trial was a US-only study, whereas the iNNOVATE trial and the chart review were multinational. Data from the Lyon-Sud database came from patients who were diagnosed with WM at a French hospital between 1980 and 2017. |
Study design | The iNNOVATE and PCYC-1118E trials were both prospective studies. The iNNOVATE trial was a phase III, randomized, double-blind study, whereas the PCYC-1118E trial was a phase II, single-arm study. The chart review retrospectively collected electronic records, and medical records were retrospectively collected in the Lyon-Sud database. |
HR = hazard ratio; IgM = immunoglobulin M; IPSSWM = International Prognostic Scoring System for Waldenström Macroglobulinemia; IR = ibrutinib plus rituximab; ITC = indirect treatment comparison; OS = overall survival; PFS = progression-free survival; r/r = relapsed or refractory; RWE = real-world evidence; WM = Waldenström macroglobulinemia.
Note: Details included in the table are from the sponsor’s Summary of Clinical Evidence.
Sources: iNNOVATE — Dimopoulos et al. (2018);28 chart review — Buske et al. (2018);6 PCYC-1118E — Treon et al. (2015).33
Figure 2: Evidence Network for PFS in r/r WM Populations
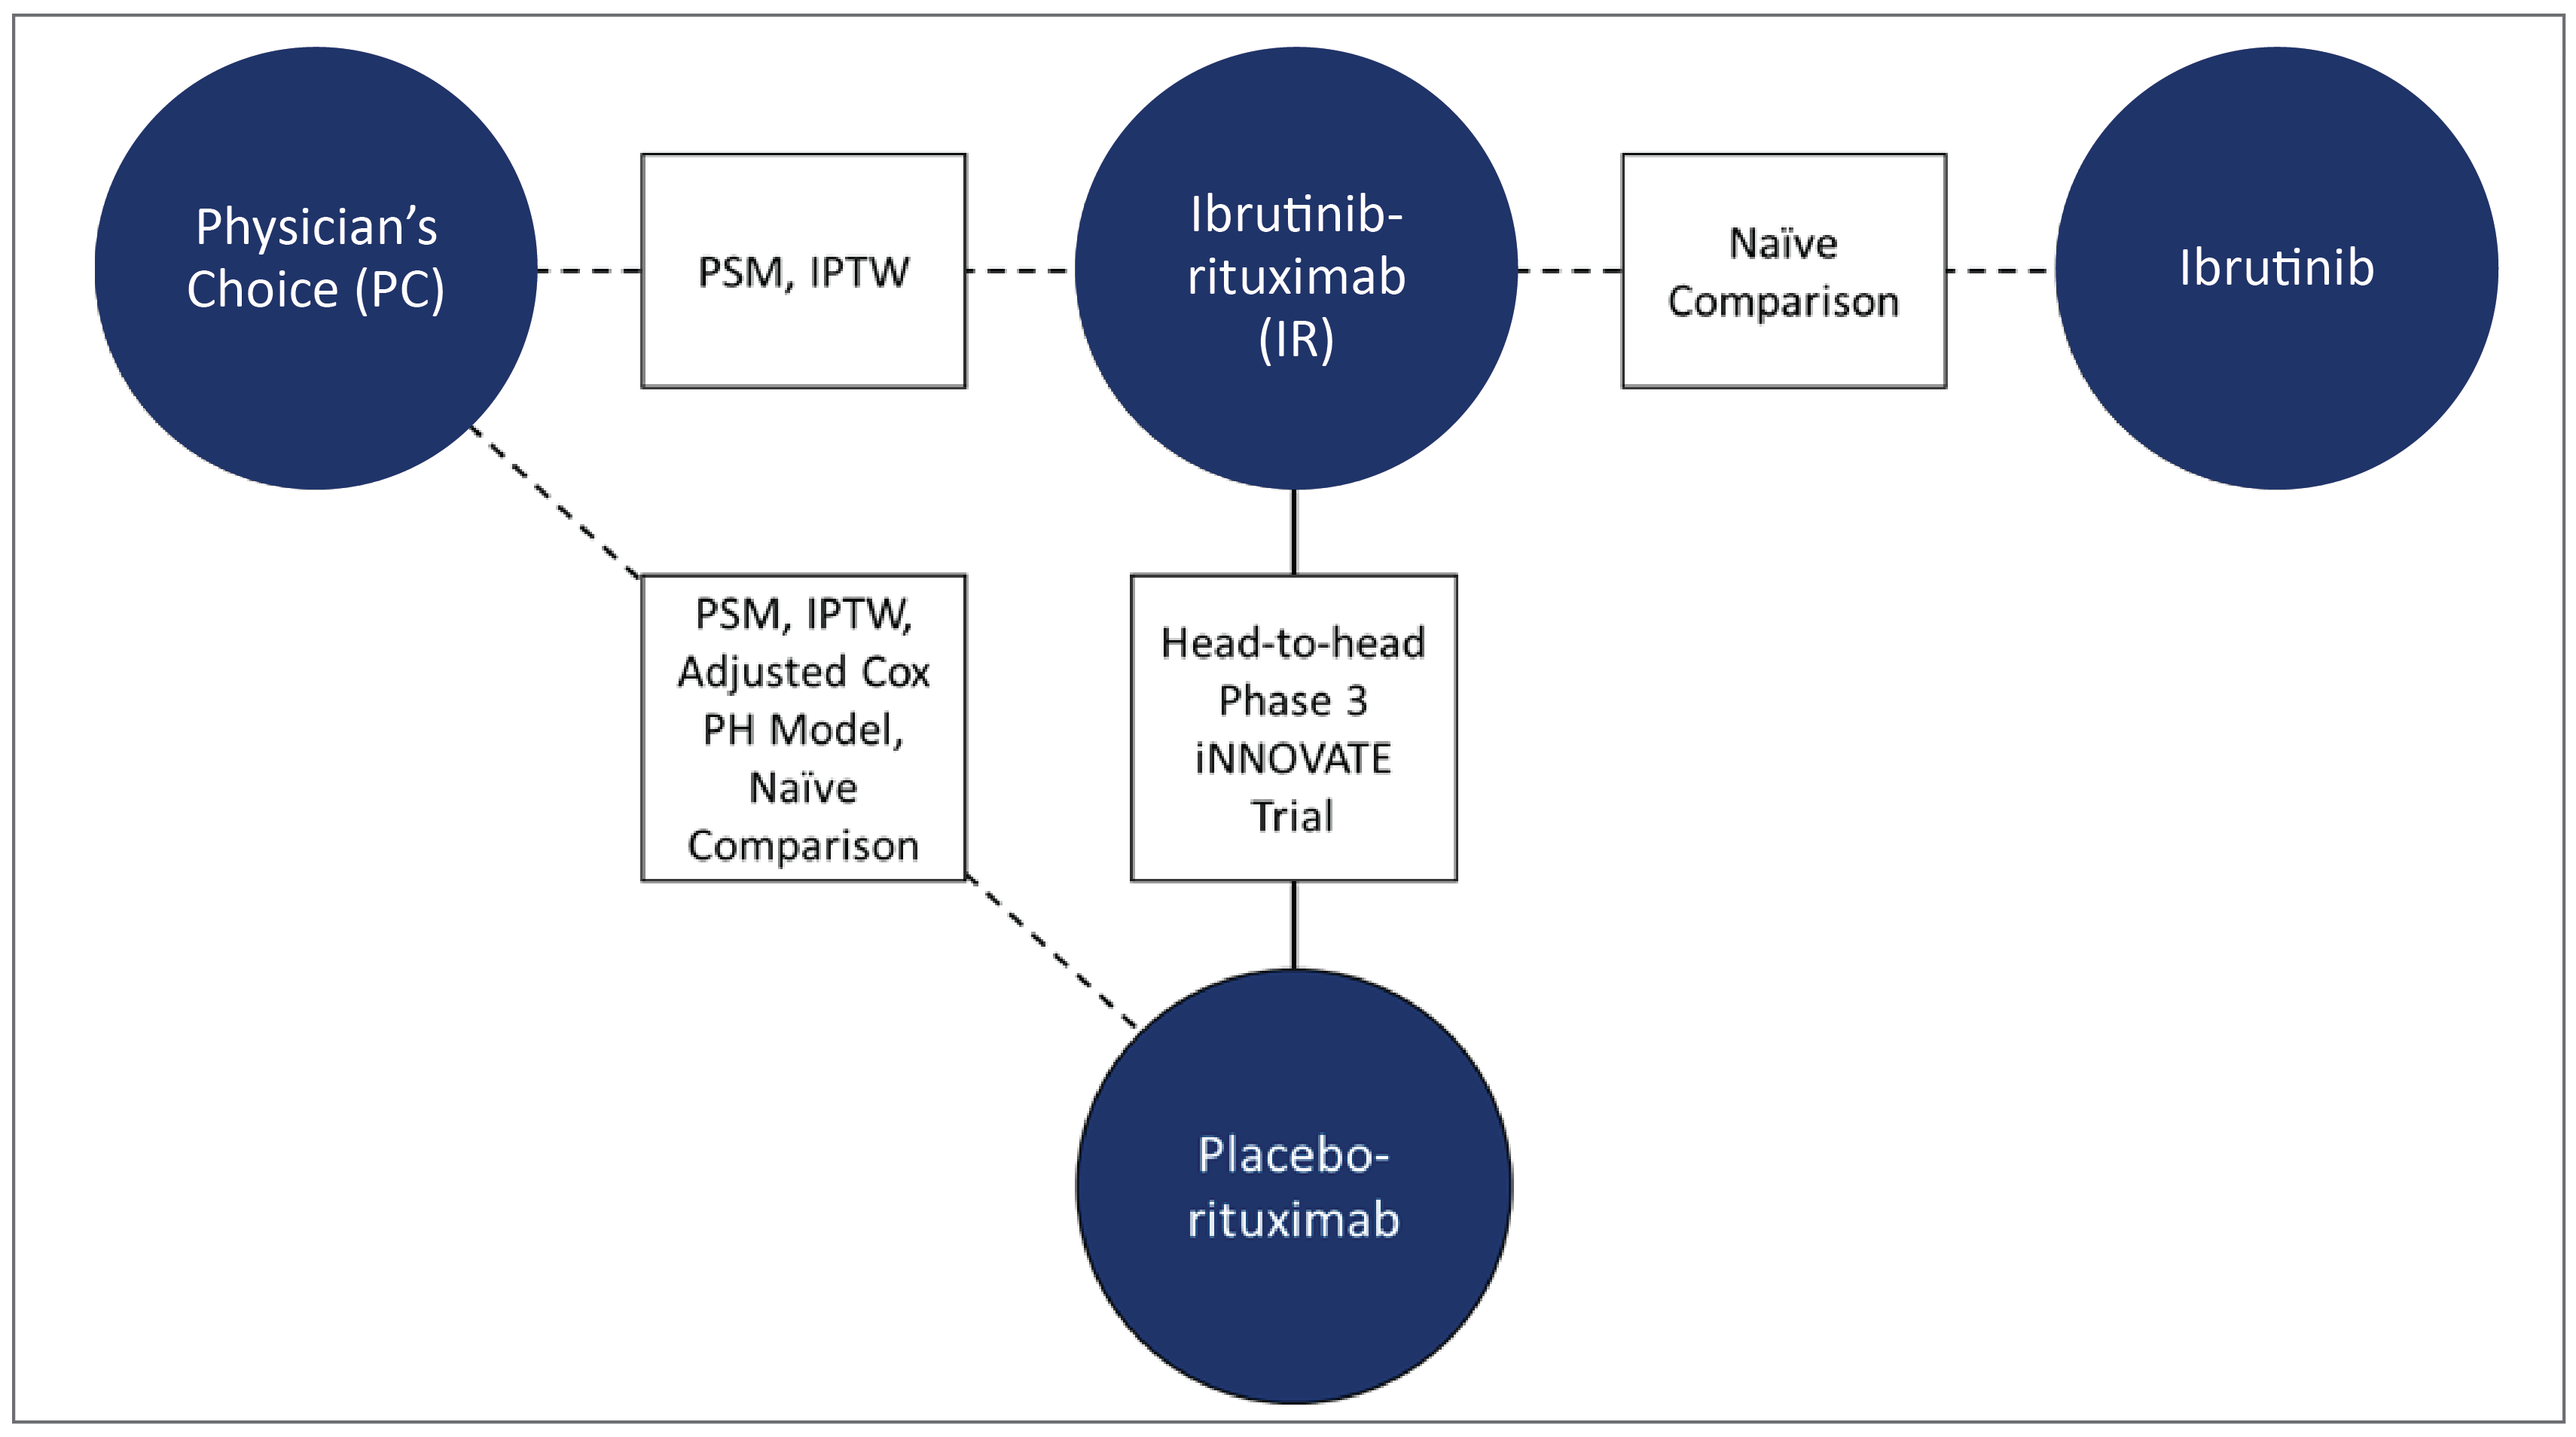
IPTW = inverse probability of treatment weighting; PFS = progression-free survival; PH = proportional hazards; PSM = propensity score matching; r/r = relapsed or refractory; WM = Waldenström macroglobulinemia.
Efficacy
The estimated relative efficacy between WM treatment options in patients with r/r disease is summarized in Table 20.
Progression-Free Survival
Regarding PC versus IR (iNNOVATE study versus chart review), based on PSM and IPTW in the r/r population, there were residual imbalances in baseline patient characteristics between treatments. Some of the imbalances were greater after adjustment, as suggested by the standardized mean differences caused by outlier propensity scores and extremely small weights. Similarly, the effective sample size in the PCYC-1118E trial was too small to reliably estimate the treatment effect of ibrutinib monotherapy.
For the comparison of IR and ibrutinib monotherapy, published data on patient characteristics and outcomes from the PCYC-1118E trial and patient data level from the IR arm of the iNNOVATE trial were used for the analyses. A MAIC was found to be unreliable, given the minimal overlap in the patient population and the limited sample size. There was a higher proportion of patients younger than 65 years in the PCYC-1118E trial, and those patients were more heavily pretreated than those in the iNNOVATE trial. Imbalances remained after MAIC, but attempts were made to adjust for certain patient characteristics used in each analysis between the IR r/r iNNOVATE arm and the ibrutinib PCYC-1118E single-arm. The effective sample size of the iNNOVATE subgroup was reduced from || ||||||||| |||| ||||||||||, and as a result, in addition to the excess of low weights assigned to patients, the estimates from these analyses showed high uncertainty. Hence, a naive comparison of ibrutinib monotherapy and IR was applied in the base-case analysis as a naive comparison, which resulted in an HR of |||| |||| ||| |||| || |||||.
Table 20: Summary of Estimated Relative Efficacy in Patients With r/r WM
Comparison | Data sources | Subgroup | ITC method | Adjusted results HR (95% CI) |
|---|---|---|---|---|
PFS | ||||
PC vs. rituximab | iNNOVATE, chart review | r/r WM | PSM | |||| ||||| || ||||| |
IPTW | |||| ||||| || ||||| | |||
Adjusted Cox PH model | |||| ||||| || ||||| | |||
Naive comparison | |||| ||||| || ||||| | |||
PC vs. IR | iNNOVATE, chart review | r/r WM | PSM | Analysis attempted but the small sample size and low number of PFS events made it a challenge to achieve optimal matching and to estimate reliable HR |
IPTW | Analysis attempted but the small sample size and low number of PFS events made it a challenge to achieve an optimal characteristics balance and to estimate reliable HR | |||
IR vs. ibrutinib | iNNOVATE, PCYC-1118E | r/r WM | Naive comparison | |||| ||||| || ||||| |
CI = confidence interval; HR = hazard ratio; IPTW = inverse probability of treatment weighting; IR = ibrutinib plus rituximab; ITC = indirect treatment comparison; PC = physician’s choice; PFS = progression-free survival; PH = proportional hazards; PSM = propensity score matching; r/r = relapsed or refractory; WM = Waldenström macroglobulinemia.
Harms
No harms outcomes were evaluated in the ITC for the frontline or r/r WM populations.
Critical Appraisal of the Body of Evidence for ITC
Despite various statistical analysis attempts, optimal matching and reliable HR estimates were a challenge to achieve, given the small sample size and the low number of PFS events in the IR arm in the iNNOVATE trial.
The results of the systematic literature review show that the limitation of data sources presented a challenge for modelling approaches. Generally, there was a lack of multiple studies on any 1 treatment, meaning the available results were particularly affected by patient variation and could not be generalized to patients with r/r WM. Most of the identified studies focused on response rather than survival outcomes, so provided little insight into any long-term benefits of the treatments.
The body of evidence included in the ITC and adjusted analyses submitted in this report were limited to naive comparisons (ibrutinib monotherapy versus IR), attempted analyses using PSM and IPTW methods limited by baseline imbalances, and low sample sizes and few events (PC versus IR).
All effect estimates from comparisons assessed in the ITCs remain very uncertain, mainly due to the limitations of the data. These include imbalances in patient characteristics owing to the nature of the observational data, the possibility of confounding and risk of bias owing to selection of patients, and deviations from the intended interventions. All of these limitations are connected to the infeasibility of conducting any direct or indirect comparisons. Furthermore, the low number of patients and events produced very imprecise effect estimates in situations in which HRs could be obtained.
The results of these analyses may have limited applicability and generalizability in current clinical practice in Canada because 1 of the main comparators currently used (zanubrutinib) was not included. Furthermore, according to the clinical experts consulted by CADTH, the comparison of ibrutinib monotherapy and zanubrutinib would provide data more pertinent to Canadian practice because both options are gaining more attention in the treatment of patients with r/r disease than the combination of IR or rituximab monotherapy.
Summary
Four sources were identified and used in an ITC of patients with r/r WM. The interventions included IR, ibrutinib monotherapy, rituximab monotherapy, and PC (in RWE and clinical settings). PSM, IPTW, adjusted Cox proportional hazards, and MAIC were evaluated in the ITCs. PFS and OS were modelled and evaluated, although data limitation and small sample sizes resulted in mostly unreliable HRs.
Effect estimates from indirect comparisons of IR and PC (RWE) showed that PFS and OS were improved with IR, but there is high uncertainty due to the limitations of the data. In a naive comparison of IR and ibrutinib monotherapy, it was shown that the treatments may have similar PFS efficacy, but it also had limitations that preclude the drawing of conclusions.
Despite various statistical analysis attempts, no results reached statistical significance in the ITC of rituximab and PC. There was heterogeneity between the data for each source and the results should be interpreted with caution. Finally, optimal matching and reliable HRs were a challenge to achieve in the comparison of IR and PC in the clinical setting.
Studies Addressing Gaps in the Systematic Review Evidence
The contents within this section have been informed by materials submitted by the sponsor. The following has been summarized and validated by the CADTH review team.
Description of Studies
Two studies were considered for this section to provide relevant data for the reimbursement request in this submission. The first is the PCYC-1118E trial,34 a single-arm, phase II trial assessing ibrutinib monotherapy in patients with r/r WM. The second is the ASPEN study, a randomized double-blind, placebo-controlled study comparing zanubrutinib to ibrutinib monotherapy in patients with r/r WM. The latter was assessed directly from the publication.16 Both studies are described in detail in Table 21.
PCYC-1118E Study
The PCYC-1118E study34 was a phase II, open-label, single-arm, multicentre study designed to evaluate the efficacy and safety of ibrutinib (420 mg), administered orally, daily in 4-week cycles (for up to 40 4-week cycles), until disease progression in symptomatic patients with r/r WM. The primary objective was to assess the effect of ibrutinib on ORR (> 25% reduction in disease burden), MRRs (> 50% reduction in disease burden), and VGPR or CR. Safety and tolerability, PFS, and TTNT were some of the secondary end points evaluated for ibrutinib. Investigator assessments of outcomes were confirmed by an independent IRRC. In total, 64 patients were enrolled and 63 patients were treated and analyzed for safety and efficacy end points. The median age at baseline was 63 years (range, 44 to 86 years), with 49.2% of patients were 65 years or older. Most of the patients were male (76.2%) and white (95.2%). Patients were enrolled at 3 sites in the US.
Patients who had received ibrutinib for 40 months could opt to continue in an extension of the PCYC-1118E study for response determination. In this long-term evaluation, the primary objective was to determine the overall and MRRs using modified criteria from the sixth IWWM. The ORR included minor response or better, and the MRR included PR or better. Secondary objectives assessed included PFS and drug safety.
Table 21: Details of Studies Addressing Gaps in the Systematic Review Evidence
Characteristics | PCYC-118E | ASPEN |
|---|---|---|
Design and population | ||
Study design | Open-label, single-arm, interventional, phase II study | Open-label, randomized, interventional, phase III study |
Locations | 3 sites in 1 country: US | 58 sites in 13 countries: Australia, Belgium, Czechia, France, Germany, Greece, Italy, Netherlands, Poland, Spain, Sweden, UK, US |
Patient enrolment dates | Start date: May 2012 End date: June 2013 | Start date: January 2017 End date: July 2018 |
Patients enrolled | N = 63 | N = 201 Ibrutinib, n = 99 Zanubrutinib, n = 102 |
Inclusion criteria | Eligible patients had a clinicopathological diagnosis of WM, an ECOG PS of ≤ 2, and had received 1 or more prior treatments | Eligible patients had r/r WM after ≥ 1 prior line of therapy or TN WM unsuitable for standard immunochemotherapy |
Exclusion criteria | Patients with CNS disease involvement, clinically significant cardiovascular disease, or who were on warfarin and/or medications that could prolong QT interval were excluded | Patients with prior BTK inhibitor exposure, disease transformation, active CNS lymphoma, clinically significant cardiovascular disease, or who required warfarin and/or another vitamin K antagonist were excluded |
Drugs | ||
Intervention | Oral ibrutinib (420 mg/day) | Oral zanubrutinib (160 mg twice daily) |
Comparator(s) | NA | Oral ibrutinib (420 mg/day) |
Study duration | ||
Screening phase | NR | NR |
Treatment phase | 40 months | NR |
Follow-up phase | 59 months (median); participants could opt for an extension study for response determination | 19.4 months (median), LTE study not specified |
Outcomes | ||
Primary end point | ORR (minor response or better) and MRR (PR or better) (4 years) | CR or VGPR (≤ 3 years) |
Secondary and exploratory end points | Secondary: PFS and TTNT (6 years) Drug safety and VGPR (4 years) Exploratory: NR | Secondary: MRR, DOR, PFS, investigator-assessed efficacy outcomes, safety (TEAE, AESI), reductions in bone marrow and extramedullary tumour burden, and onset of atrial fibrillation and/or ventricular arrhythmia (≤ 5 years) Exploratory: OS, changes in QoL |
Publication status | ||
Publications | Tappenden (2018)35 Treon et al. (2021)36 Treon (2015)33 | Tam, 202016 Dimopoulos (2020)37 |
Clinical trial record number | NCT01614821 | NCT03053440 |
AESI = adverse event of special interest; BTK = Bruton tyrosine kinase; CNS = central nervous system; CR = complete response; DOR = duration of response; ECOG PS = Eastern Cooperative Oncology Group Performance Status; LTE = long-term extension; MRR = major response rate; NA = not applicable; NR = not reported; ORR = overall response rate; OS = overall survival; PFS = progression-free survival; PR = partial response; QoL = quality of life; r/r = relapsed or refractory; TEAE = treatment-emergent adverse event; TN = treatment naive; TTNT = time to next treatment; VGPR = very good partial response; WM = Waldenström macroglobulinemia.
Note: Details included in the table are from the sponsor’s Summary of Clinical Evidence.
Sources: PCYC-1118E Clinical Study Report34 and ASPEN study publication.16
ASPEN Study
ASPEN was a randomized, open-label, multicentre, phase III trial comparing the efficacy and safety of ibrutinib and zanubrutinib in patients with WM who required treatment based on the seventh IWWM consensus criteria.16 Patients with MYD88L265P disease were assigned in a 1:1 ratio to receive ibrutinib at an approved dose of 420 mg once daily or zanubrutinib at a dose of 160 mg twice daily, for a 28-day cycle, until progression or intolerance (cohort 1). Randomization was stratified by warts, hypogammaglobulinemia, immunodeficiency, myelokathexis (WHIM) syndrome–like mutation status, and number of prior lines of therapy. The primary rationale was to demonstrate the superiority of zanubrutinib over ibrutinib, measured by the proportion of patients achieving a CR or VGPR, assessed by an IRC. Secondary end points included IRC-assessed MRR, DOR (time from initial qualifying response to progression or death), and PFS (time from randomization to progression or death), reductions in bone marrow and extramedullary tumour burden, and harms. OS and changes in QoL were exploratory end points. The study consisted of an initial screening phase, a treatment phase, and a follow-up phase. The study was conducted at 60 centres in 9 countries (Germany, Greece, Italy, Netherlands, Poland, Spain, Sweden, UK, and US).
Populations
PCYC-1118E Study
Adults 18 years and older were included if they presented with a clinicopathological diagnosis of WM and met the consensus panel criteria for treatment; had measurable disease, defined as the presence of serum IgM (with a minimum IgM level of greater than 2 times the institutional upper limit of normal); had at least 1 prior therapy for WM; had an ECOG PS of at least 2; had adequate hematologic, renal, and hepatic function; and had no active therapy for other malignancies (with the exception of topical therapies for basal cell or squamous cell cancers of the skin). Patients were excluded if they had known lymphoma of the CNS and were on an anticoagulant such as warfarin therapy.
The long-term extension of this study had the same inclusion and exclusion criteria.
ASPEN Study
Patients 18 years and older were eligible if they had r/r WM after 1 or more prior lines of therapy or treatment-naive WM unsuitable for standard immunochemotherapy based on the presence of documented comorbidities or risk factors. Patients were required to meet at least 1 criterion for treatment, according to the consensus panel criteria from the seventh IWWM, and to have measurable disease (defined as a serum IgM level greater than 0.5 g/dL); adequate end-organ function; absolute neutrophil counts of 0.75 × 10⁹/L and platelet counts of and 50 × 109/L; and an ECOG PS of at least 2. Patients with prior BTK inhibitor exposure, disease transformation, active CNS lymphoma, clinically significant cardiovascular disease, or who required warfarin or another vitamin K antagonist were excluded from the trial. Patients who were relapsed were defined as those who had previously experienced a CR, a VGPR, or a PR but showed disease progression after a period of 6 months or more. Refractory patients were defined as those who experienced prior treatment failure or disease progression in the 6 months after the initiation of therapy.
Interventions
PCYC-1118E Study
Ibrutinib was administered as a 420 mg (three 140 mg capsules) daily dose. Dose reductions of 2 dose levels were permitted but dose re-escalation was not permitted once the dose had been reduced to a lower dose level. If a participant required a dose delay of 21 days or more, the patient was permitted to resume study treatment at the discretion of the investigator. Dose modifications and/or discontinuation actions related to AEs were also permitted.
Patients could discontinue a drug for disease progression (including initiation of new therapy), intercurrent illness that prevented further administration of treatment, unacceptable AEs, patient inability or unwillingness to comply with the oral medication regimen and/or documentation requirements, a decision to withdraw from the study, and/or general or specific changes in the patient’s condition that rendered further treatment unacceptable in the opinion of the treating investigator.
A safety follow-up visit was required for all patients who prematurely discontinued the study for any reason. Patients who met the criteria for disease progression (based on the consensus panel criteria of IgM response) but were deemed by the investigator to be receiving clinical benefit from ibrutinib therapy were permitted to continue on the protocol at the discretion of the principal investigator.
Standard supportive care medications were permitted, along with the use of hematopoietic growth factors, based on the American Society of Clinical Oncology: guidelines. Antidiarrheal and antiemetics (if clinically indicated) were allowed.
Any other chemotherapy or anticancer immunotherapy was not prophylactically administered but was prescribed at the discretion of the treating physician for treatment-related cytopenic events, in accordance with American Society of Clinical Oncology guidelines. Concomitant use of antiplatelet and anticoagulant drugs was avoided, and treatment with ibrutinib was withheld in cases of serious bleeding. Coadministration with substrates, inducers, or inhibitors of CYP3A4/5 and P-glycoprotein, as well as grapefruit, Seville oranges, and star fruit (which are potent CYP3A4 inhibitors) were discouraged.
For the long-term follow-up update of the PCYC-1118E study, ibrutinib (420 mg/d) was administered orally until disease progression or intolerance. Ibrutinib was withheld in cases where absolute neutrophil count was less than 0.5 × 10⁹/L; platelet counts were less than 25 × 109/L or less than 50 × 109/L with bleeding; nausea, vomiting, or diarrhea was of grade 3 or higher, and nonhematological toxicities were of grade 3 or higher. Filgrastim or transfusion support was permitted.
ASPEN Study
Patients randomized to the zanubrutinib arms (arms A and C) received 160 mg (two 80 mg capsules) orally daily, at approximately the same time each day. Patients were advised to have at least an 8-hour interval between 2 consecutive doses.
Patients took ibrutinib 420 mg (three 140 mg capsules or other applicable dose forms) orally once daily, at approximately the same time each day. Of note, patients were advised not to fast before or after the administration of ibrutinib or zanubrutinib. Zanubrutinib or ibrutinib was to be taken as prescribed from cycle 1, day 1 until disease progression, unacceptable toxicity, death, withdrawal of consent, loss to follow-up, or termination of the study by the sponsor. Patient diaries were reviewed and tablet counts were assessed at each study visit to ensure that the patient had an adequate drug supply for administration at home throughout the treatment phase.
Outcomes
A list of efficacy end points assessed in the PCYC-1118E and ASPEN studies is presented in Table 22. The summarized end points are based on outcomes included in the sponsor’s Summary of Clinical Evidence, but only outcomes identified as important to this review by the clinical experts consulted by CADTH and by stakeholder input from patient and clinician groups and public drug plans are assessed in full in this report.
PCYC-1118E Study
The primary end point of the PCYC-1118E study was the ORR. It was defined as the proportion of patients who experienced a best overall response of a minor response (i.e., a reduction in serum IgM of > 25%) or better. Response was classified according to the definitions of CR, VGPR, PR, minor response, stable disease, and PD, as assessed by the investigator using a response criteria adapted from the IWWM.
Key supportive end points assessed in the PCYC-1118E study included DOR, duration of major response, OS, MRR (PR or better), time to response, hemoglobin improvement, and PFS. MRR, DOR, time to response, and PFS were also assessed by the IRRC. Change in serum IgM from baseline, tumour involvement in bone marrow, lymph node and spleen size were important exploratory end points assessed.
ASPEN Study
The primary efficacy end point was the proportion of patients in each arm of cohort 1 achieving either a CR or a VGPR, as determined by the IRC using an adaptation of the response criteria updated at the sixth IWWM. Key secondary outcomes included MRR assessed by the IRC, defined as the proportion of patients achieving a CR, VGPR, or PR; DOR assessed by the IRC, defined as the time from the first determination of response (CR, VGPR, or PR) (per the modified IWWM criteria) to the first documentation of progression (per the modified IWWM criteria) or death, whichever comes first; PFS assessed by the IRC, defined as the time from randomization to the first documentation of progression (per the modified IWWM criteria) or death, whichever occurs first; and resolution of treatment-precipitating symptoms, defined as the absence of the symptoms that triggered the initiation of the study treatment (per the IWWM treatment guidelines) at any point during study treatment. Exploratory end points included TTNT, OS, MRR according to CXCR4 mutation status (CXCR4WHIM versus CXCR4WT) in patients with MYD88L265P WM (cohort 1), change in QoL, assessed using the European Organisation for Research and Treatment of Cancer Quality of Life Questionnaire Core 30 (EORTC QLQ-C30) and EQ-5D in patients with MYD88L265P WM (cohort 1), medical resource use, anticancer activity of zanubrutinib (i.e., CR or VGPR rate, MRR, ORR, PFS, DOR, and OS assessed by the IRC and by the investigator) in patients with MYD88WT WM (cohort 2).
Table 22: Summary of Relevant Outcomes From Studies Addressing Gaps in the Evidence
Outcome measure | PCYC-1118E | ASPEN |
|---|---|---|
PFS | Secondary | Secondary |
Time point | 24 months and 5 years | 12 and 18 months |
OS | Secondary | Exploratory |
Time point | 24 months and 5 years | 12 and 18 months |
Hematological improvement (IgM and/or hemoglobin levels) | Primary | Secondary |
Time point | Median duration of treatment: 19.1 months (range, 0.5 to 29.7 months) Median study follow-up: 59 months (95% CI, 40 to 60 months) | Median treatment duration Zanubrutinib: 18.7 months Ibrutinib:18.6 months |
TTNT | Secondary | NA |
Time point | NR | NA |
DOR | NA | Secondary |
Time point | NA | 18 months |
Harms | Secondary | Secondary |
Time point | NR | Median treatment duration Zanubrutinib: 18.7 months Ibrutinib:18.6 months |
CI = confidence interval; DOR = duration of response; IgM = immunoglobulin; NA = not applicable; NR = not reported; OS = overall survival; PFS = progression-free survival; TTNT = time to next treatment.
Note: Statistical testing for OS was adjusted for the treatment effect of patients who crossed over in the final analysis.
Sources: PCYC-1118E Clinical Study Report34 and ASPEN study publication.16
Harms outcomes in the PCYC-1118E study included the rate of overall treatment-emergent adverse events (TEAEs), regardless of causality; TEAEs of grade 3 or more; SAEs; TEAEs leading to treatment discontinuation or dose reduction; TEAEs of clinical interest; other safety observations of clinical importance; laboratory abnormalities; and vital signs. TEAEs were coded by the Medical Dictionary for Regulatory Affairs (MedDRA), version 17, by system organ class and preferred term. Laboratory parameters and vital signs were summarized using CTCAE grade criteria available for low and/or high values.
In the ASPEN study, the incidence, timing, and severity of AEs were assessed using CTCAE version 4.3. AEs of special interest included hemorrhage (e.g., minor bleeding, such as contusion and petechiae), major hemorrhage (defined as serious bleeding or bleeding of grade 3 or more at any site or CNS bleeding of any grade), atrial fibrillation or flutter, hypertension, second primary malignancies, tumour lysis syndrome, infections (opportunistic), neutropenia, thrombocytopenia, and anemia.
Statistical Analysis
PCYC-1118E Study
A sample size of approximately 60 patients was estimated to have at least 80% power to declare an ORR of 32% or higher at a 1-sided significance level of 0.025, based on a 50% response rate for ibrutinib. The ORR was estimated from a crude proportion and the 95% CI, and a 1-sided P value was calculated using the exact binomial distribution. Patients’ best overall responses (number and percentage) were tabulated, and sensitivity analyses for ORR were based on the IRRC analysis. The null hypothesis was tested at an overall significance level of 0.025 (1-sided) and rejected if the lower bound of the CI exceeded 32%. Summary statistics were used to describe patient disposition, demographic characteristics, disease and baseline characteristics, concomitant medications, and study drug exposure.
Time-to-event variables (including DOR, PFS, and OS) were analyzed using comparisons of Kaplan-Meier curves and a log-rank test. Time to response was summarized descriptively for responders only. The proportion of patients with sustained hemoglobin improvement was summarized, with the change from baseline in hemoglobin value summarized descriptively by treatment cycle. For exploratory end points, values of IgM and IgM change (i.e., absolute and percent change) from baseline were summarized descriptively by the protocol-scheduled time points.
For harms, the incidence of, toxicity grade, and the relationship to the study drug of all TEAEs reported were examined during the study period. Changes in clinical laboratory results and vital signs from baseline were also assessed in the safety population.
Subgroup analyses were performed for the primary end point for selected baseline and potential prognostic variables, such as: age group (< 65 years versus ≥ 65 years), sex (male versus female), ECOG PS at baseline (0 versus 1), number of prior systemic therapies (1 to 2 versus > 2), IgM (< 40 versus ≥ 40 g/L), hemoglobin ≤ 11 g/dL (yes versus no), and beta-2 microglobulin (> 3 versus ≤ 3 mg/L)
For the long-term follow-up update for the PCYC-1118E study, PFS was defined as the time between therapy initiation and disease progression, death, or last follow-up. Survival analyses were determined using comparisons of Kaplan-Meier curves and a log-rank test. Univariable and multivariable logistic regression analyses were performed for major response and VGPR, and a Cox proportional hazards regression was performed for PFS. Pairwise comparisons were determined using a Wilcoxon signed rank test. A 1-way analysis of variance (ANOVA) with Tukey’s honestly significant difference (HSD) was used for the 3-way data comparisons for genomic cohorts. A Fisher’s 3 × 4 exact probability test was used for categorical response comparisons by genotype. A Cochran-Mantel-Haenszel test was used in the analysis of matched categorical data. P values of 0.05 or less were considered statistically significant.
ASPEN Study
Sample size was estimated based on CR or VGPR rate in the r/r analysis set in cohort 1. The sponsor assumed that the CR or VGPR rate in arm A equalled 0.35 and the CR or VGPR rate in arm B equalled 0.15. A sample size of 75 patients per arm (150 in total) was estimated to have 81.4% power in to compare response rates in arm A and arm B in the r/r analysis set in cohort 1, using a normal approximation binomial test at a 2-sided significance of 0.05. Assuming that the MRR in arm A equalled 0.90 and the MRR in arm B equalled 0.80, the power to demonstrate the noninferiority of zanubrutinib in the r/r analysis set in cohort 1 was 96.8% when a noninferiority margin of 12% was used. In addition to the 150 patients with r/r disease, approximately 20% (n = 38) of patients with MYD88L265P who were treatment-naive and considered unfit were enrolled in cohort 1. Assuming that the MYD88L265P mutation was present in 90% of the enrolled patients, approximately 210 patients would be enrolled in cohorts 1 and 2, combined.
The primary efficacy analysis was planned approximately 12 months after the last patient with r/r disease was randomized. The comparison of ibrutinib and zanubrutinib for the primary efficacy end point (cohort 1) was based on a hierarchical fixed-sequence procedure to adjust for multiplicity. The analysis of the superiority of zanubrutinib over ibrutinib in patients with r/r WM was performed first. If the comparison was statistically significant, further testing was performed using the ITT population (with 38 patients who were treatment-naive in addition to the patients with MYD88L265P and r/r disease). The superiority of the primary end point was assessed using the Cochran-Mantel-Haenszel test stratified by CXCR4 status (CXCR4WHIM versus CXCR4WT and/or missing), number of prior lines of therapy (1 to 3 versus > 3 for patients with r/r disease and 0 versus > 3 in the ITT analysis set), and age group (≤ 65 years versus > 65 years), at a 1-sided significance level of 0.025. If the 2-sided P value was less than 0.05 and the estimated risk difference was positive, it was concluded that the VGPR or CR rate for zanubrutinib was significantly greater than the VGPR or CR rate for ibrutinib and the primary objective of superiority was met. In the event that the primary end point was superior in both the r/r and ITT analysis sets, MRR was tested for noninferiority in the r/r and ITT analysis sets, at a 1-sided significance level of 0.025. The study-wide type I error was controlled at a 1-sided 0.05 level.
For the secondary end points, including PFS, the statistical tests performed were descriptive and without multiplicity adjustment. The 95% CI for the Cochran-Mantel-Haenszel common risk difference was constructed with a normal approximation and standard error. If the lower bound of the CI was greater than the noninferiority margin, the null hypothesis would be rejected, concluding that the MRR with zanubrutinib is noninferior to the MRR with ibrutinib.
TTNT was summarized descriptively using the Kaplan-Meier method. TTNT for patients who did not receive subsequent anticancer therapy was censored at the date of the patient’s last available information.
PFS was analyzed at the time of the primary analysis, approximately 4 years after the first patient was randomized. The Kaplan-Meier method was used; PFS was right-censored for patients who met 1 of the criteria outlined in the Statistical Analysis Plan. Two-sided 95% CIs for median PFS were estimated using the Brookmeyer and Crowley method.
OS was analyzed using methods similar to those described for PFS. Patients who remained alive as of the data cut-off date or who discontinued the study for reasons other than death were right-censored at the date on which the patient was last known to be alive.
DOR was conducted in a manner similar to that of PFS. DOR was not compared between the 2 treatment arms. The difference in the resolution of any and all treatment-precipitating symptoms between zanubrutinib and ibrutinib was tested using a chi-square distribution. The number and percentage of patients with the resolution of each and all symptoms were summarized.
Subgroup analyses were applied to patients in cohort 1 who experienced a VGPR or CR and included sex (male versus female), age (≤ 65 years versus > 65 years; > 75 years versus ≤ 75 years), geographic region (Australia or New Zealand versus Europe versus North America), number of prior lines of therapy (0 versus 1 to 3 versus ≥ 3 and r/r versus treatment-naive), baseline ECOG PS (0 versus ≥ 1), baseline CXCR4 mutation status using the Sanger method (WHIM versus wild type or missing), baseline IgM level (≤ 40 g/L versus > 40 g/L), baseline beta-2 microglobulin level (≤ 3 mg/L versus 3 mg/L), baseline hemoglobin concentration (≤ 110 g/L versus > 110 g/L), baseline platelet count (≤ 100 × 109/L versus > 100 × 109/L), baseline presence of extramedullary disease (yes versus no), and IPSSWM score (low versus intermediate versus high).
Missing data were not imputed unless otherwise specified. Missing dates or partially missing dates were not imputed at the data level for prior or concomitant medications or procedures, new anticancer therapies, AEs, or deaths.
Results
Baseline Characteristics and Patient Disposition
PCYC-1118E Study
The median follow-up period (i.e., time on study) was 14.8 months at the data cut-off. Of the 63 patients included in the study, 12 (19%) discontinued study treatment; the main reasons for discontinuation were unacceptable toxicity (in 6.3% of patients), followed by PD (4.8%), other reasons (3.2%) (1 patient had myelodysplastic syndrome and 1 patient had amyloidosis), death (1.6%), nonresponse (1.6%), and patient withdrawal (1.6%). Eight patients (12.7%) discontinued the study, 7 of whom (11.1%) discontinued due to the administration of new systemic therapy. One patient died as a result of worsening pleural effusion. Fifty-one patients (81.0%) treated with ibrutinib continued on therapy for the long-term analysis, after the data cut-off of the initial study (February 28, 2014).
The median age of patients was 63 years (range, 44 to 86 years) and 76% were male (Table 23). At the data cut-off of the initial analysis (February 28, 2014), median time from the patients’ initial WM diagnosis was 73.7 months (range, 6.3 to 334.0 months); 48 (76.2%) patients presented with an intermediate-risk or high-risk IPSSWM score at baseline; the median beta-2 microglobulin concentration was 3.9 mg/L; and 68.3% of patients had beta-2 microglobulin levels higher than 3 mg/L. Median hemoglobin concentration was 105.0 g/L, and 60.3% of patients had hemoglobin levels of 110 g/L or less; median serum IgM concentration was 34.9 g/L, and 73% of patients had an IgM level of 30 g/L or more. A low platelet count (100 × 109/L or less) and/or a low neutrophil count (absolute neutrophil count levels of 1.5 × 10⁹/L or less) was reported in 11.1% and 4.8% of patients, respectively.
The median duration of treatment for patients on ibrutinib therapy by the data cut-off in the initial study was 11.7 months (range, 0.5 to 21.1 months), and the median relative dose intensity was 99.0%.
ASPEN Study
By the data cut-off (August 31, 2019), 164 patients with WM considered to be r/r and 37 patients considered to be unfit and treatment-naive were included into cohort. The median age of all patients was 70.0 years (Table 23). The majority of patients were male (66.7%) and white (91.0%). Approximately 85% were in the intermediate-risk or high-risk prognostic category, and 77% had CT evidence of extramedullary disease. All 37 patients who were treatment-naive and deemed unfit(100%) and 160 patients with r/r disease (97.6%) had prior and/or concomitant medical conditions.
By the data cut-off (August 31, 2019), the median duration of treatment in the overall population of cohort 1 was 18.5 months and 18.7 months in the ibrutinib and zanubrutinib treatment arms, respectively. The median relative dose intensities were 98.1% and 97.6%, respectively. For patients with r/r disease, median treatment durations were 17.99 months and 18.0 months in the ibrutinib and zanubrutinib treatment arms, respectively, with median relative dose intensities of 98.14% and 97.73%, respectively. Median treatment durations for patients who were treatment-naive were 20.73 months and 21.45 months in the ibrutinib and zanubrutinib treatment arms, respectively, with median relative dose intensities of 98.76% and 97.58%, respectively.
Table 23: Summary of Baseline Characteristics of the PCYC-1118E and ASPEN Studies
Characteristics | PCYC-1118E | ASPEN (overall, cohort 1 MYD88L265P) | |
|---|---|---|---|
Ibrutinib (N = 63) | Ibrutinib (N = 99) | Zanubrutinib (N = 102) | |
Median age, years (range) | 63 (44 to 86) | 70 (38 to 90) | 70 (45 to 87) |
Male, n (%) | 48 (76) | 65 (66) | 69 (68) |
IPSSWM, n (%) Low Intermediate High | 14 (22) 27 (43) 22 (35) | 13 (13) 42 (42) 44 (44) | 17 (17) 38 (37) 47 (46) |
Median hemoglobin, g/dL (range) Baseline hemoglobin ≤ 11.0 g/dL, n (%) | 10.5 (8.2 to 13.8) 37 (59)a | NR 53 (54) | NR 67 (66) |
Median serum IgM, g/L (range) | 35.2 (7.24 to 83.90)b | 34.2 (2.4 to 108) | 31.8 (5.8 to 87) |
Prior systemic therapies, n (%) 0 1 or 2 ≥ 3 | 0 (0) 36 (57)e 27 (43) | 18 (18) NR NR | 19 (19) NR NR |
Genotype, n (%) MYD88L265P and/or CXCR4WT MYD88L265P and/or CXCR4WHIM MYD88WT and/or CXCR4WT Unknown and/or other | 36 (57) 22 (35) 4 (6) 1 (1) | 90 (91) 8 (8) NR 1 (1.0) | 91 (89) 11 (11) NR 0 |
Bone marrow infiltration: percentage of cellularity, median (range) | 60 (3 to 95)c | 60 (0 to 90)d | 60 (0 to 90)d |
Cytopenia at baseline Platelet count of ≤ 100,000/mm3, n (%) Absolute neutrophil count of ≤ 1500/mm3, n (%) Median absolute neutrophil count (range) | 7 (11) NR 3.18 (1.14 to 10.97) per mm3 | 12 (12) 7 (7) NR | 12 (12) 11 (11) NR |
Median beta-2 microglobulin, mg/L (range) | 3.9 (1.3 to 14.2) | 4.2 (1.7 to 13.6) | 4.3 (1.6 to 21.7) |
Extramedullary disease, n (%) Adenopathy Splenomegaly Lymphadenopathy Other | 37 (59)e 7 (11)e NR NR | NR 13 (13) 67 (68) 1 (1)f | NR 17 (17) 79 (78) 4 (4)f |
Previous rituximab-containing regimen, n of N (%) | NR | NR | NR |
ECOG PS 0 or 1 2 | NR | 92 (93) 7 (7) | 96 (94) 6 (6) |
Median time from initial diagnosis, years (range) | NR | 4.9 (0.1 to 25) | 4.4 (0.1 to 23) |
Prior SCT, n (%) | NR | 1 (1) | 3 (3) |
+ECOG PS = Eastern Cooperative Oncology Group Performance Status; IgM = immunoglobulin M; IPSSWM = International Prognostic Scoring System for Waldenström Macroglobulinemia; NR = not reported; SCT = stem cell transplant.
aStudy reported patients with hemoglobin levels < 11 g/dL. In addition, it was reported that 25 (40%) patients had hemoglobin < 10 g/dL.
bSerum IgM levels converted were from mg/dL to g/L.
cThe proportion of patients is calculated.
dStudy reported median bone marrow disease involvement.
eStudy reported the proportion of patients with adenopathy > 1.5 cm and the proportion of patients with splenomegaly > 15 cm.
fThree patients had discrete extranodal splenic lesions; 1 patient had 2 breast lesions.
Sources: PCYC-1118E Clinical Study Report34 and ASPEN study publication.16
Efficacy
PCYC-1118E Study
Results obtained in the initial analysis at the data cut-off of February 28, 2014, are presented in Table 24 and Table 25.
Median PFS was not reached at the median follow-up (i.e., time on study) of 14.8 months. The 18-month landmark estimate of PFS per the IRRC evaluation was 79.5% (95% CI, 65.8% to 88.2%). The 5-year PFS rate reported for all patients was 54% (95% CI, 39% to 67%).
At a median follow-up of 14.8 months, median OS was not reached at the data cut-off (February 28, 2014). In total, 95.2% of patients were alive at the study cut-off. At the landmark of 18 months, the estimated survival rate was 92.7% (95% CI, 76.6% to 97.9%). The 5-year OS rate for all patients was 87%, as shown in the long term evaluation.
For hemoglobin improvement, median hemoglobin levels were 105.0 g/L at baseline, 114.0 g/L at cycle 2, and 134.0 g/L at cycle 12. Sustained improvement in hemoglobin was observed in 37 of 63 patients (58.7%) in the all-treated population. In the subset of patients with low hemoglobin levels (≤ 110 g/L at baseline), 31 of 38 patients (81.6%) were reported to have a sustained improvement in hemoglobin count during the study.
For DOR per the IRRC assessment, 80.9% of responders remained alive and progression-free at the 18-month landmark (95% CI, 64.9% to 90.2%); the median duration of overall response was not reached. Overall, 82.4% of all major responders remained alive and progression-free at the 18-month landmark (95% CI, 58.1% to 93.3%). The median duration of major response was not reached. Per IRRC assessment, 86.7% of all major responders remained alive and progression-free at the 18-month landmark (95% CI, 67.9% to 94.9%); the median duration of major response was not reached.
ASPEN Study
Results are summarized in Table 24 and Table 25.
By the data cut-off (August 31, 2019), median IRC-assessed PFS was not reached in either treatment arm in all cohorts (i.e., r/r or overall population). In the r/r WM population, event-free rates at 18 months were 81.7% (95% CI, 71.1 to 88.8) versus 85.9% (95% CI, 73.7 to 92.7) in the ibrutinib and zanubrutinib arms, respectively. In the overall population, after a median follow-up of 18.0 months and 18.5 months, 15 (15%) patients and 16 patients (16%) in the ibrutinib and zanubrutinib arms, respectively, progressed or died.
By the data cut-off (August 31, 2019), median OS was not reached in either treatment arm of the r/r or overall population. There were 8 deaths reported in the ibrutinib arm (all in the r/r population) and 6 deaths in the zanubrutinib arm (3 in the r/r population). Event-free rates for patients in the ibrutinib and zanubrutinib treatment arms were 93.9% (95% CI, 86.8% to 97.2%) and 97.0% (95% CI, 90.9% to 99.0%) at 12 months, respectively, and 92.8% (95% CI, 85.5% to 96.5%) and 97.0% (95% CI, 90.9% to 99.0%) at 18 months, respectively.
Table 24: Summary of Key Efficacy Outcomes in the Overall and r/r Populations From Studies Addressing Gaps in the Evidence
Characteristics | PCYC-1118E study | ASPEN study | |||
|---|---|---|---|---|---|
r/r population | All-treated population | ||||
Ibrutinib (N = 63) | Ibrutinib (N = 81) | Zanubrutinib (N = 83) | Ibrutinib (N = 99) | Zanubrutinib (N = 102) | |
PFS | |||||
n | 63 | 81 | 83 | 99 | 102 |
Median, months (range) | NR | NE (0 to 28+) | NE (0 to 28+) | NE | NE |
Rate, % (95% CI) | 5-year: 54 (39 to 67) | 18-month: 81.7 (71 to 89) | 18-month: 86 (74 to 93) | 18-month: 84 (75 to 90) | 18-month: 85 (75 to 91) |
HR (95% CI) | NR | NR | NR | 18-month: 0.84 (0.42 to 1.75) | NR |
P value | NR | NR | NR | 18-month: 0.687 | NR |
OS | |||||
n | 63 | NR | NR | 99 | 102 |
Median, months | NR | NR | NR | NR | NR |
Rate, % (95% CI) | 18-months: 92.7 (76.6 to 97.9) 5-year: 87 (NR)a | NR | NR | 18-month: 93.9 (86.8 to 97.2) | 18-month: 97 (90.9 to 99.0) |
HR (95% CI) | NR | NR | NR | NR | NR |
P value | NR | NR | NR | NR | NR |
CI = confidence interval; HR = hazard ratio; NE = not evaluable; NR = not reported; OS = overall survival; PFS = progression-free survival; r/r = relapsed or refractory.
aObtained from the long-term assessment of the same study.
Sources: PCYC-1118E Clinical Study Report34 and ASPEN study publication.16
Table 25: Summary of Other Efficacy Outcomes in the r/r Population From Studies Addressing Gaps in the Evidence
Characteristics | PCYC-1118E | ASPEN | |
|---|---|---|---|
Ibrutinib (N = 63) | Ibrutinib (N = 81) | Zanubrutinib (N = 83) | |
Best overall response | |||
Number of patients contributing to the analysis | 38 | 81 | 83 |
Minor response, n (%) | NR | 11 (14) | 13 (16) |
PR, n (%) | NR | 49 (61) | 41 (49) |
VGPR, n (%) | NR | 16 (20) | 24 (29) |
CR, n (%) | 0 | 0 | 0 |
Stable disease, n (%) | NR | 2 (3) | 3 (4) |
Progressive disease, n (%) | NR | 2 (3) | 1 (1) |
NE, n (%) | NR | 1 (1) | 1 (6) |
Response rates | |||
Number of patients contributing to the analysis | 63 | 81 | 83 |
ORR, % (95% CI) | 90.5 (NR) | 94 (86 to 98) | 94 (87 to 98) |
VGPR or CR, % (95% CI) | NR | 20 (12 to 30) | 29 (20 to 40) |
P value | NR | 0.12 | |
MRR, % (95% CI) | 79.4 (NR) | 80 (NR) | 78 (NR) |
P value | NR | NR | NR |
Minor response, % (95% CI) | 11.1 (NR) | NR | NR |
PR, % (95% CI) | 49.2 (NR) | NR | NR |
VGPR, % (95% CI) | 30.2 (NR) | NR | NR |
CR, % (95% CI) | 0 (NR) | NR | NR |
Duration of CR or VGPR | |||
n | NR | 81 | 83 |
Median, months (range) | NE (NE to NE) | NE (1+ to 21+) | NE (0+ to 19+) |
Event-free rate (95% CI) | NR | 18-month: 64 (29 to 85) | 18-month: 90 (47 to 99) |
Duration of major response | |||
n | NR | 81 | 83 |
Median, months (95% CI) | NR | NE (0+ to 26+) | NE (0+ to 25+) |
Event-free rate (95% CI) | NR | 86 (73 to 93) | 87 (73 to 94) |
DOR | |||
n | NR | NR | NR |
Median, months | NR | NR | NR |
TTNT | |||
Number of patients contributing to the analysis, n | NR | NR | NR |
Median TTNT, months | NR | NR | NR |
OR, RR, or HR | NR | NR | NR |
P value | NR | NR | NR |
Improvements in hemoglobin levels | |||
Number of patients contributing to the analysis | 63 | NR | NR |
Baseline, median, g/dL | 10.5 | NR | NR |
Value at last time point, median, g/dL | 14.2 | NR | NR |
Proportion of patients with sustained hemoglobin improvement, n | NR | NR | NR |
P value | NR | NR | NR |
Maximum median change, g/L | NR | NR | NR |
Improvements in IgM levels | |||
Number of patients contributing to the analysis | 63 | NR | NR |
Baseline, median, g/L | 35.2 | NR | NR |
Maximum median change, g/L | –26.99 | NR | NR |
P value | NR | NR | NR |
CI = confidence interval; CR = complete response; DOR = duration of response; HR = hazard ratio; IgM = immunoglobulin M; MRR = major response rate; NE = not evaluable; NR = not reported; OR = odds ratio; ORR = overall response rate; PR = partial response; r/r = relapsed or refractory; RR = relative risk; TTNT = time to next treatment; VGPR = very good partial response.
Sources: PCYC-1118E — Treon et al. (2015);33 Treon et al. (2021);35 ASPEN — Tam et al. (2020).16
When assessing DOR, by the data cut-off (August 31, 2019), the median duration of CR or VGPR and MRR had not been reached in the overall or r/r population in either treatment arm in patients who had experienced a response to study treatment. Four events occurred in patients with VGPR or CR in the ibrutinib arm, and 1 event occurred in patients with VGPR or CR in the zanubrutinib arm. Among patients who experienced a major response, 9 events occurred in the ibrutinib arm and 6 events occurred in the zanubrutinib arm. Event-free rates at 12 months and 18 months for patients in the ibrutinib arm who experienced a major response were 87.9% (95% CI, 77.0% to 93.8%) and 87.9% (95% CI, 77.0% to 93.8%), respectively.
Median TTNT assessed by the data cut-off (August 31, 2019) was not reached. The data showed that 9 patients in the ibrutinib arm and 6 patients in the zanubrutinib arm had begun nonprotocol anticancer therapy. Median time to the initiation of nonprotocol anticancer therapy were 6.44 months in the ibrutinib treatment arm and 6.83 months in the zanubrutinib treatment arm.
Harms
PCYC-1118E Study
All patients treated in the initial analysis phase of the study experienced at least 1 AE (Table 26). Thirty-two patients (50.8%) experienced 1 or more AEs of grade 3 or higher, and 1 patient died in the 30 days after the last dose of the study drug. SAEs were reported in 24 patients (38.1%), and patients with any AE resulting in treatment discontinuation or dose reduction were observed at a low incidence (9.5% and 11.1%, respectively).
Overall, the highest incidence of AEs were reported for gastrointestinal disorders (79.4%), and the most common AEs included diarrhea (36.5%), nausea (20.6%), stomatitis (14.3%), and gastroesophageal reflux disease (12.7%). A similar incidence of AEs was observed for infections and infestations (73.0%), which included sinusitis (19.0%), upper respiratory tract infection (19.0%), and folliculitis (11.1%).
AEs of grade 3 or higher were reported in 32 patients (50.8%), with 34.9% reporting grade 3 events and 14.3% reporting grade 4 events. The most frequently reported grade 3 to 4 AEs were hematologic events, including neutropenia (11 patients [17.5%]) and thrombocytopenia (8 patients [12.7%]). Other hematologic AEs reported for more than 1 patient included anemia (2 patients [3.2%]) and febrile neutropenia (2 patients [3.2%]). Nonhematological AEs reported for more than 1 patient included atrial fibrillation 2 patients [3.2%]), pyrexia 2 patients [3.2%]), and pneumonia (2 patients [3.2%]).
Twenty-four patients (38.1%) experienced a SAE. Infections were the most common type of SAEs, including pneumonia, which was reported as an SAE for 2 patients; the severity of each of these events was grade 3.
Six patients (9.5%) discontinued treatment due to AEs. Grade 4 myelodysplastic syndrome, grade 3 thrombocytopenia, postprocedural hematoma (due to bone marrow biopsy), and B-cell lymphoma resulted in the discontinuation of ibrutinib therapy in individual patients.
In the long term follow-up update for the PCYC-1118E study, AEs of grade 3 or higher were reported in the follow-up analysis, including neutropenia (15.9%), thrombocytopenia (11.1%), and pneumonia (3.2%). Eight (80%) of 10 and 6 (86%) of 7 neutropenic and thrombocytopenic events of grade 3 or higher, respectively, occurred in patients with 3 or more prior therapies. Five patients discontinued the study due to AEs (procedure-related hematoma [n = 1], thrombocytopenia [n = 1], influenza-related pneumonia [n = 1], streptococcal endocarditis [n = 1], and atrial fibrillation [n = 1]). Twelve patients experienced dose reductions to 280 mg/d (n = 9) or to 140 mg per day (n = 3). Reasons for dose reductions included cytopenias (n = 5), dermatitis or rash (n = 2), stomatitis (n = 2), leg edema (n = 1), myalgia (n = 1), and atrial fibrillation (n = 1).
ASPEN Study
The most common AEs (Table 26) in the ibrutinib arm (overall population) were diarrhea (31 patients [31.6%]), upper respiratory tract infection (28 patients [28.6%]), contusion (23 patients [23.5%]), and muscle spasms (23 patients [23.5%]). In the zanubrutinib arm, the most common AEs were neutropenia (25 patients [24.8%]), upper respiratory tract infection (24 patients [23.8%]), and diarrhea (21 patients [20.8%]).
SAEs were reported in 40 patients (40.8%) in the ibrutinib treatment arm and in 40 patients (39.6%) in the zanubrutinib treatment arms. The most common SAEs in the ibrutinib treatment arm were pneumonia (9 patients [9.2%]), followed by pyrexia (3 patients [3.1%]), and sepsis (3 patients [3.1%]). The most common SAEs in the zanubrutinib treatment arm were febrile neutropenia (3 patients [3.0%]), influenza (3 patients [3.0%]), and neutropenia (3 patients [3.0%]).
In total, 7 patients (7.1%) in the ibrutinib treatment arm and 6 patients (5.9%) in the zanubrutinib treatment arm died during the study. Disease progression was the most common cause of death in the zanubrutinib treatment arm, reported in 3 patients (3.0%). Death due to AEs occurred in 2 patients treated with ibrutinib and 1 patients treated with zanubrutinib.
When assessing harms of special interest, neutropenia was reported in 12 patients (13%) in the ibrutinib arm and 25 patients (25%) in the zanubrutinib arm. Hemorrhage (including minor and major bleeding) was reported in 58 patients (59.2%) in the ibrutinib arm and 49 patients (48.5%) in the zanubrutinib arm.
Cardiovascular events included atrial fibrillation or flutter, and were reported in 14 patients (14.3%) in the ibrutinib arm and 2 patients (2.0%) in the zanubrutinib treatment arm.
A second primary malignancy was reported in 11 patients (11.2%) in the ibrutinib arm. In the zanubrutinib arm, 12 patients (11.9%) were observed to have a second primary malignancy.
Table 26: Summary of Key Harms Data in Other Studies With Published Results
AE | PCYC-1118E | ASPEN | |
|---|---|---|---|
Ibrutinib (N = 63) | Ibrutinib (N = 98) | Zanubrutinib (N = 101) | |
Most common AE (any grade or otherwise specified), n (%) | |||
Neutropenia | Grades 2 to 4: 15 (23.8) | 13 (13) | 29 (29) |
Thrombocytopenia | Grades 2 to 4: 8 (12.7) | 10 (10) | 10 (10) |
Atrial fibrillation | All grades: 8 (12.7) Grades 2 to 4: 6 (9.5) | 15 (15) | 2 (2) |
Diarrhea | Grades 2 to 4: 2 (3.2) | 31 (32) | 21 (21) |
Upper respiratory tract infection | Grades 2 to 4: 1 (1.6) | 28 (29) | 24 (24) |
Muscle spasms | NR | 23 (24) | 10 (10) |
Fatigue | NR | 15 (15) | 19 (19) |
Hematoma | Grade not specified: 1 (1.6) | NR | NR |
Urinary tract infection | Grades 2 to 4: 2 (3.2) | 10 (10) | 10 (10) |
Hemorrhage | Grades 2 to 4: 1 (1.6) | 0.6 events/ 100 person-months | 0.3 events/ 100 person-months |
Hypertension | Grades 2 to 4: 4 (6.3) | 16 (16) | 11 (11) |
Infusion-related reaction | NR | NR | NR |
SAE, n (%) | |||
Neutropenia | Grade ≥ 3: 10 (15.9) | Grade ≥ 3: 8 (8) | Grade ≥ 3: 19 (20) |
Thrombocytopenia | Grade ≥ 3: 7 (11.1) | Grade ≥ 3: 3 (3) | Grade ≥ 3: 6 (6) |
Pneumonia | Grade ≥ 3: 2 (3.2) | SAE: 9 (9) | SAE: 1 (1) |
Lung infection and infestation | Grade ≥ 3: 2 (3.2) | 0 (0) | 2 (2) |
Sepsis | NR | 3 (3) | 2 (2) |
Pyrexia | NR | 3 (3) | 2 (2) |
Atrial fibrillation and/or flutter | Grade ≥ 3: 1 (1.6) | Grade ≥ 3: 4 (4) | Grade ≥ 3: 0 |
Anemia | Grade ≥ 3: 1 (1.6) | Grade ≥ 3: 5 (5) | Grade ≥ 3: 5 (5) |
Hypertension | Grade ≥ 3: 0 (0) | Grade ≥ 3: 11 (11) | Grade ≥ 3: 6 (6) |
Infusion-related reaction | NR | NR | NR |
Patients who stopped treatment due to AEs, n (%) | |||
Patients who stopped | 5 (7.9) | 9 (9) | 4 (4) |
Procedure-related hematoma | 1 (1.6) | NR | NR |
Thrombocytopenia | 1 (1.6) | NR | NR |
Influenza-related pneumonia | 1 (1.6) | NR | NR |
Streptococcal endocarditis | 1 (1.6) | NR | NR |
Atrial fibrillation | 1 (1.6) | NR | NR |
Deaths, n (%) | |||
Patients who died | NR | 2 (2) | 1 (1) |
Septic shock | NR | 2 (2) | NR |
Cardiac arrest post plasmapheresis complications | NR | NR | 1 (1) |
AE = adverse event; NR = not reported; SAE = serious adverse event.
Sources: PCYC-1118E Clinical Study Report34 and ASPEN study publication.16
Critical Appraisal
Internal Validity
PCYC-1118E Study
The open-label, nonrandomized design and the lack of a concurrent comparator are key limitations of the PCYC-1118E study; hence, any treatment effects observed should be interpreted with caution. The lack of an internal comparator limits the interpretation of the treatment effect, as it is uncertain whether the magnitude of the effect observed can be attributed to ibrutinib, the natural history of WM, or a placebo effect. There is potential for confounding due to natural history and other unidentified prognostic factors that could affect outcomes. The single-arm design does not allow for the differentiation of the symptoms of underlying WM from treatment-related AEs. The direction and magnitude of bias are unknown.
Both investigator and IRRC assessments were conducted for primary and secondary outcomes, which minimizes bias related to performance and assessments for single-arm data. The updated analysis of the PCYC-1118E study included long-term data (median follow-up of up to 59 months) from participants enrolled in the initial study. The extended follow-up time from the updated analysis ameliorates uncertainty when assessing the long-term efficacy of ibrutinib in patients with WM who were previously treated, although these data are still considered descriptive rather than comparative. Sample size calculation and power calculation were clearly defined in the study. The sponsor used the all-treated population, which included all enrolled patients who received at least 1 dose of the study drug. Overall, missing data and protocol deviations reported were minimal and unlikely to have affected overall estimates of the efficacy and harms results of the study.
ASPEN Study
The ASPEN trial had a randomized, phase III, open-label design. Randomization was stratified by relevant prognostic factors, which included CXCR4WHIM mutational status and prior lines of therapy. Appropriate methods of randomization and treatment allocation were implemented, which reduced the potential for selection bias. The study was generally well balanced with respect to patient baseline demographic and disease characteristics, suggesting that randomization was successful.
The open-label design may have introduced bias for subjective outcomes, such as AEs and HRQoL outcomes. The potential for measurement bias in outcomes such as response rates (e.g., ORR, VGPR, CR, DOR, PFS, MRR) was considered minimal, given that the IRC was blinded to study treatment.
The initial hierarchical testing procedure of the primary end point (VGPR or CR) was changed from a noninferiority hypothesis to a superiority hypothesis of VGPR or CR before the unblinded analyses was performed by the sponsor. The sponsor further conducted a post hoc analysis to compare the noninferiority of VGPR or CR in patients treated with zanubrutinib with that in patients treated with ibrutinib. Although the post hoc analysis supports the primary efficacy analysis, it is also an inherent limitation of the study; hence, the analysis was considered exploratory. There were 5 protocol amendments before the data cut-off. Overall, protocol violations were low in the ASPEN study, as only 7 patients (3.5%) reportedly had major protocol violations.
Given that WM is a rare disease, the sample size was considered acceptable. The target sample size (210 in cohorts 1 and 2, combined) was achieved.
The primary end point and key secondary end points were appropriate and adequately described. Data were immature for time-to-event outcomes, and median PFS and OS were not reached in either treatment arm. In addition to PFS and OS, TTNT and HRQoL were identified in the systematic review protocol as important efficacy outcomes. However, these were studied as exploratory outcomes in the ASPEN trial, which limits the interpretation of results.
There were no methods or techniques outlined to account for missing data and no methods were described for imputing data. The absence of appropriate methods to account for missing data may have introduced bias in the assessment of efficacy outcomes. The direction of bias is unclear. Sensitivity analyses were conducted for the primary outcome, although it was unclear whether there were major differences between the primary and sensitivity analyses.
Multiplicity adjustments were conducted for the primary end point in the primary cohort 1 using a hierarchical fixed-sequence procedure with a 1-sided significance level of 0.025. The methods outlined to account for multiplicity in the analysis of the primary outcome were considered appropriate. However, given that the superiority hypothesis was not met during the analysis, the authors deemed a post hoc analysis to be warranted to assess a noninferiority hypothesis; the results presented should be considered not adjusted for multiplicity. Secondary end points, including PFS, were descriptive and also without multiplicity adjustment.
There were no credible subgroup effects observed. Subgroup analyses were predefined, and the results presented were consistent with the primary analyses; however, these analyses were not statistically powered to assess within-group or between-group differences.
External Validity
PCYC-1118E Study
The population of the PCYC-1118E trial included patients with WM with a clinicopathological diagnosis based on consensus panel criteria who had received at least 1 prior therapy for WM. Concomitant medications, prior therapies, and procedures were considered to align with Canadian practice settings. Study results were considered generalizable to the Canadian setting.
The efficacy outcomes assessed in the PCYC-1118E trial were similar to those in the iNNOVATE trial, which was considered clinically relevant and important for patients with WM, according to the clinical experts consulted by CADTH.
The follow-up analysis of the PCYC-1118E study allowed patients enrolled in the initial study to enter a long-term assessment phase, which lasted for 59 months, as opposed to 19 months in the initial analysis; the long-term data of the updated analysis were considered valuable for evaluating the efficacy of ibrutinib in patients with WM who had received at least 1 prior therapy.
ASPEN Study
The ASPEN study presents relevant information for the comparison of ibrutinib and zanubrutinib. The clinical experts, clinician groups, and drug plans noted that ibrutinib is an appropriate comparator for zanubrutinib in current Canadian clinical practice, because the latter has been recently approved for reimbursement and the former has been available through special access patient programs. Relevant comparators also included rituximab-based chemotherapy for patients who were treatment-naive and those with relapsed disease. Re-treatment with rituximab is funded for patients with a relapse-free interval (6 months to 12 months, depending on jurisdiction) after the last dose of rituximab. At the time of this CADTH review, the standard of care highlighted by the experts and clinician groups consulted included BR, zanubrutinib, and bendamustine or CVP in combination with rituximab or bortezomib, including ibrutinib (accessed through special access programs or employee assistance programs).
Results from the r/r population of the ASPEN trial was of key interest in this CADTH review. Cohort 1 of the ASPEN trial included patients with r/r WM after at least 1 prior line of therapy, which was considered reflective of the sponsor’s reimbursement population. Patients described as relapsed in the ASPEN trial were defined as those who previously experienced a CR or VGPR or a PR but showed PD after a period of 6 months or more. Refractory patients were defined as those who experienced prior treatment failure or disease progression in the 6 months after therapy initiation. The efficacy outcomes used in this study were considered clinically relevant and important for patients with WM.
Assessments conducted for efficacy outcomes, concomitant therapies administered to patients, and prior anticancer therapies used in the study were considered to be reflective of Canadian practice.
Discussion
Summary of Available Evidence
The body of evidence informing this submission consists of 3 individual studies assessing ibrutinib for patients with WM. First, the pivotal iNNOVATE study (N = 150, 82 patients with r/r disease) evaluated IR against rituximab plus placebo in patients with WM (and an ECOG PS of 0 to 2), and included, at the same time, an additional single-arm substudy (N = 31) evaluating ibrutinib monotherapy in patients (with an ECOG PS of 0 to 2) who had failed to achieve a minor response to their last rituximab-containing therapy. Second, the single-arm PCYC-1118E study (with a long-term assessment update) evaluating ibrutinib monotherapy in 63 patients who had a clinicopathological diagnosis of WM, an ECOG PS of 0 to 2, and had received 1 or more prior treatments. And third, the ASPEN study (N = 201 for the total population), comparing ibrutinib with zanubrutinib in patients with r/r WM (N = 164) after 1 prior line of therapy or in patients with WM who were treatment-naive and who were considered unsuitable for standard immunochemotherapy.
Despite attempts to compare ibrutinib to other interventions relevant to this submission, there were no direct feasible comparisons with other bodies of evidence. The network of evidence was not appropriate to create a connected network for a network meta-analysis. The only feasible way was to compare bodies of RWE from databases and chart reviews of patients with WM receiving PC regimens with IR data from the iNNOVATE study and the single-arm substudy, as well as to compare ibrutinib monotherapy to IR. For these comparisons, the authors were able to conduct MAIC, PSM, IPTW, and naive assessments, albeit with important limitations, to obtain credible effect estimates.
Interpretation of Results
Efficacy
Comparison of IR and Rituximab Plus Placebo
For patients with r/r WM, the absence of symptoms and surviving without progression are highly valued outcomes. These, together with improvements in hemoglobin levels and fewer side effects, were linked to effects on HRQoL overall. This was reinforced by clinical experts and other stakeholders who consider these key factors when making decisions in clinical practice.
PFS was 1 of the main outcomes deemed relevant for decision-making by clinicians and for deliberations by committee panel members. Evidence from the RCT iNNOVATE study (N = 82) showed that, on average, 291 per 1,000 patients with r/r WM in the rituximab plus placebo arm present with the event of interest for PFS (this is, when patients continue living without progression of the disease) at 30 months of follow-up. In contrast, in the group of patients treated with IR, 765 per 1,000 patients presented with this event, meaning that 505 more patients per 1,000 treated with IR than with rituximab plus placebo will experience this event (with a 95% CI, going from 311 more to 699 more). Taking this into perspective, the clinical experts consulted by CADTH considered that a difference of 10 more (or fewer) patients per 1,000 in the PFS rate would be clinically meaningful. Thus, these results were considered a large effect, with effect estimates of benefit beyond this clinically meaningful threshold in favour of IR therapy. The certainty of evidence was still considered moderate due to the sample size of the total population, which was below a less conservative estimate of an optimal information size. These results and their interpretation were similar to those at 54 months, = (i.e., 476 more patients per 1,000 in the IR arm presenting with the PFS event).
OS was also deemed important for decisions; however, the effects estimates were more uncertain. The body of evidence from the iNNOVATE study only provided rates from the overall population (150 patients), of which just more than half (82 patients) had r/r WM, but no specific data on OS was reported for previously treated patients. The iNNOVATE substudy presented single-arm data for ibrutinib monotherapy in patients previously treated with rituximab. This study showed rates of OS at 18 months and 60 months of 94% and 73%, respectively, although this estimate is only applicable to patients receiving ibrutinib monotherapy, not IR. Another study (PCYC-1118E) provided similar effect estimates for OS, but with the same limitations of a single-arm study. Overall, the effect estimates of OS from these 3 sources are uncertain, owing to the limitations of the studies and the imprecision of the data.
Similarly, DOR had imprecise estimates at 30 months and 54 months. Evidence from the iNNOVATE study r/r WM population could only be obtained from patients who responded initially, which decreased the number of observations available (n = 40), as well as the number of events. Hence, the effect estimates were considered to be highly imprecise, and the evidence was deemed to be of low certainty. Despite these limitations, the effects were large, and considering the body of evidence, it was determined that IR may result in a meaningful effect in DOR estimates compared to rituximab plus placebo.
TTNT was evaluated with information from the iNNOVATE r/r WM population. However, these data were reported as a subgroup in a Kaplan-Meier curve plot and no formal statistical analysis was performed. It was observed that at 54 months, IR may result in a meaningful increase in TTNT rates compared to rituximab plus placebo, with 84% of patients in the IR arm and 21% in the rituximab plus placebo arm not needing subsequent therapy. Even when there were no specific estimates of relative effects in the r/r population, the estimates were in agreement with those in the overall population of the iNNOVATE study (N = 150), where an HR of 0.10 (95% 0.05 to 0.21) was obtained and rates were similar.
Hemoglobin improvements were also deemed relevant for decision-making. Evidence from the RCT iNNOVATE study (N = 82) showed that, on average, 293 per 1,000 patients with r/r WM in the rituximab plus placebo arm presented with a sustained improvement of hemoglobin at 30 months of follow-up. In contrast, in the group of patients treated with IR, 707 per 1,000 patients presented with this event, meaning that 415 more patients per 1,000 treated with IR will have a sustained improvement (95% CI, going from 193 more to 605 more). In context, the clinical experts consulted by CADTH considered that a difference of 100 more (or fewer) patients per 1,000 would be considered clinically meaningful. Thus, these results were considered large effects, with effect estimates of benefit beyond this clinically meaningful threshold in favour of IR therapy. The certainty of evidence was still considered moderate due to the sample size, which was below a less conservative estimate of an optimal information size.
The measurement of effects for IgM was less certain. Evidence was only available from the 2 single-arm studies: the iNNOVATE substudy and the PCYC-1118E single-arm study. The former showed an average reduction from baseline of 36.6 g/L and the latter of 26.9 g/L (from baseline values of 39.2 and 35.2, respectively). The clinical significance of these effects was deemed important by the experts, but for the comparison of IR and rituximab was still uncertain due to study limitations and imprecision.
Comparison of Ibrutinib and Zanubrutinib
The comparison of ibrutinib and zanubrutinib was deemed relevant for discussion because the latter is the most likely comparator in current clinical practice in Canada. The same end points were considered, with the same values from clinicians, patient groups, and stakeholders.
Only 1 RCT (ASPEN, which had 201 patients in the total population and 164 in the r/r population) was available that directly compared the 2 drugs. The study reported effect estimates for the outcomes of PFS, OS, harms, but not for other relevant end points for this CADTH submission.
The evidence showed that in a comparison of ibrutinib and zanubrutinib, there is likely no difference in PFS rates at 18 months. The r/r WM population had event-free rates of 81.7% and 85.9% in the ibrutinib and zanubrutinib arms, respectively. This was in alignment with the overall population (i.e., patients with r/r disease and patients who were treatment-naive).
For OS, rates were only available for the overall population, with survival rates at 18 months of 94% and 97% in the ibrutinib and zanubrutinib arms, respectively. The number of deaths in the total population was similar with ibrutinib and zanubrutinib, at 6 (all in the r/r population) and 8 (3 in the r/r population), respectively.
The clinical experts considered that similar effects between groups for OS and PFS were expected, credible, and applicable in clinical practice.
Comparison of Ibrutinib and Other Interventions
The body of evidence from indirect comparisons was considered too uncertain to draw conclusions about, due to limitations in the data and the infeasibility of creating adequate effect estimates from the comparisons. Hence, comparing ibrutinib monotherapy with IR, PC, or rituximab monotherapy was difficult, and the effect estimates were considered very uncertain.
Harms
All patients treated with IR or rituximab plus placebo in the iNNOVATE study presented with at least 1 AE. Clinical experts considered this a common and expected situation when managing patients with WM and, overall, the AEs were deemed manageable and of no concern.
SAEs were more frequently observed in the IR arm than in the rituximab plus placebo arm in the iNNOVATE study. The clinical experts also considered these to be expected and usually clinically manageable.
Atrial fibrillation is a concern commonly reported with ibrutinib. In the body of evidence of this submission, the atrial fibrillation rate reached 19% in the iNNOVATE study (overall population) and 15% in the ASPEN trial. In contrast, the rate was 3% in the rituximab plus placebo arm of the iNNOVATE study and 2% in the zanubrutinib arm of the ASPEN study. The clinical experts noted that these events are frequently observed, but manageable and with no meaningful consequences, and added that patients might value their options differently, depending on the outcomes of benefits and harms.
Other harms of importance included respiratory infections, major bleeding, and cytopenias (neutropenia, anemia, and thrombocytopenia). Of these, only respiratory infections were slightly higher in the IR arm than in the rituximab plus placebo arm, but the difference was likely of little to no meaning. However, when comparing ibrutinib with zanubrutinib, respiratory infections were more common with ibrutinib.
Cytopenias were, overall, similar in the IR and rituximab plus placebo arms, with the exception of neutropenia. There were more events of neutropenia in the IR arm than in the rituximab plus placebo arm (16% versus 9%) in the iNNOVATE study. In the ASPEN study, neutropenia cases with ibrutinib monotherapy were similar to those in the iNNOVATE study (13%), but were more common with zanubrutinib (29%). These events and differences between arms were also expected and considered manageable by the clinical experts.
Other Considerations
One of the main concerns from the experts consulted by CADTH is that the main body of evidence for this report stems from the comparison of IR and rituximab plus placebo, but this comparison might not always be used in real clinical practice; it would be rare to reach a situation in which the choice would be between these 2 therapies. However, there are improvements with the drug, even though the evidence might be indirectly used in clinical decisions.
WM is a rare disease, but due to its effects and burden, it holds significance for patients diagnosed with it. Clinicians deemed it important to have another option when facing treatment decisions with their patients.
Conclusion
The evidence evaluating the use of ibrutinib, with or without rituximab, in patients with r/r WM consisted of 1 RCT comparing IR with rituximab plus placebo, 1 RCT comparing ibrutinib with zanubrutinib, and 2 single-arm studies of ibrutinib monotherapy. Evidence from the indirect comparisons (adjusted analyses) had serious limitations that precluded the use of their effect estimates to draw conclusions.
The body of evidence included in this report provides information on the effects of ibrutinib or IR on the outcomes of PFS, OS, DOR, TTNT, hematological improvements, and harms. All these are considered critical outcomes for decision-making by clinical experts, patient groups, and stakeholders. The evidence shows that the combination of IR, compared to rituximab plus placebo, likely results in higher rates of PFS and a larger proportion of patients with sustained hemoglobin improvements. The effects on DOR and TTNT were less certain, but show that IR likely results in improvements of clinical significance for these end points. Meanwhile, the effects on OS were very uncertain due to study limitations and imprecision.
One RCT showed no evidence of a difference between zanubrutinib and ibrutinib for PFS rates or OS rates, and there is still uncertainty about the difference in effects on hematological values, DOR, and TTNT between these 2 interventions.
Ibrutinib, with or without rituximab, was well tolerated, and the number of AEs was similar to that in the rituximab plus placebo group. However, IR likely results in more SAEs and events of atrial fibrillation and neutropenia than rituximab plus placebo. Atrial fibrillation was also more common with ibrutinib than zanubrutinib. Among the harms of special interest, neutropenia was reported more commonly with zanubrutinib than with ibrutinib. Clinical experts consider these events to be manageable and expected among patients with r/r WM, who might value their options differently, based on the outcomes of benefits against harms.
Overall, the use of ibrutinib, with or without rituximab, likely yields better estimates of survival without progression than rituximab alone. Furthermore, ibrutinib and zanubrutinib demonstrate comparable efficacy, although zanubrutinib has a better safety profile.
References
1.European Society for Medical Oncology (ESMO). Waldenström’s macroglobulinaemia: ESMO Clinical Practice Guidelines for diagnosis, treatment and follow-up. https://www.esmo.org/Guidelines/Haematological-Malignancies/Waldenstrom-s-Macroglobulinaemia. Published 2018. Accessed 2021 May 1.
2.Pratt G, El-Sharkawi D, Kothari J, et al. Diagnosis and management of Waldenström macroglobulinaemia—A British Society for Haematology guideline. Br J Haematol. 2022;197(2):171-187. PubMed
3.Buske C, Leblond V. How to manage Waldenstrom's macroglobulinemia. Leukemia. 2013;27(4):762-772. PubMed
4.Leblond V, Kastritis E, Advani R, et al. Treatment recommendations from the Eighth International Workshop on Waldenström's Macroglobulinemia. Blood. 2016;128(10):1321-1328. PubMed
5.Kapoor P, Ansell SM, Fonseca R, et al. Diagnosis and management of Waldenstrom macroglobulinemia: Mayo stratification of macroglobulinemia and risk-adapted therapy (mSMART) guidelines 2016. JAMA Oncol. 2017;3(9):1257-1265. PubMed
6.Buske C, Sadullah S, Kastritis E, et al. Treatment and outcome patterns in European patients with Waldenström’s macroglobulinaemia: A large, observational, retrospective chart review. Lancet Haematol. 2018;5(7):e299–309. PubMed
7.CADTH Reimbursement Review: Zanubrutinib (Brukinsa) for Waldenström macroglobulinemia. Can J Health Technol. 2022;2(2). https://www.cadth.ca/sites/default/files/DRR/2022/PC0248-Brukinsa.pdf. Accessed 2023 Aug 21.
8.Owen RG, Kyle RA, Stone MJ, et al. Response assessment in Waldenström macroglobulinaemia: Update from the VIth International Workshop. Br J Haematol. 2013;160(2):171-176. PubMed
9.Ansell SM, Kyle RA, Reeder CB, et al. Diagnosis and management of Waldenström macroglobulinemia: Mayo stratification of macroglobulinemia and risk-adapted therapy (mSMART) guidelines. Mayo Clin Proc. 2010;85(9):824-833. PubMed
10.Cancer Care Alberta, Alberta Health Services. Clinical practice guideline on lymphoma (LYHE-002 V19). https://www.albertahealthservices.ca/assets/info/hp/cancer/if-hp-cancer-guide-lyhe002-lymphoma.pdf. Published 2023. Accessed 2023 Aug 8.
11.IMBRUVICA (ibrutinib): 140 mg, 280 mg, 420 mg, 560 mg tablets, 140 mg capsules, oral [product monograph]. Toronto (ON): Janssen, Inc.; 2023 Jun 20. In.
12.Drug Reimbursement Review sponsor submission: IMBRUVICA (ibrutinib): 140 mg, 280 mg, 420 mg, 560 mg tablets, 140 mg capsules, oral [internal sponsor's package]. Toronto (ON): Janssen Inc.; 2023 Jun 20. In.
13.Santesso N, Glenton C, Dahm P, et al. GRADE guidelines 26: informative statements to communicate the findings of systematic reviews of interventions. J Clin Epidemiol. 2020;119:126-135. PubMed
14.Balshem H, Helfand M, Schünemann HJ, et al. GRADE guidelines: 3. Rating the quality of evidence. J Clin Epidemiol. 2011;64(4):401-406. PubMed
15.Pharmacyclics LLC. A randomized, double-blind, placebo-controlled, phase 3 study of ibrutinib or placebo in combination with rituximab in subjects with Waldenstrom's macroglobulinemia [accessed by sponsor], (2020).
16.Tam CS, Opat S, D'Sa S, et al. A randomized phase 3 trial of zanubrutinib vs ibrutinib in symptomatic Waldenström macroglobulinemia: The ASPEN study. Blood. 2020;136(18):2038-2050. PubMed
17.Brenner DR, Poirier A, Woods RR, et al. Projected estimates of cancer in Canada in 2022. CMAJ. 2022;194(17):E601-E607. PubMed
18.Charalambous A, Schwarzbich MA, Witzens-Harig M. Ibrutinib. Recent Results Cancer Res. 2018;212:133-168. PubMed
19.Papanota AM, Ntanasis-Stathopoulos I, Kastritis E, Dimopoulos MA, Gavriatopoulou M. Evaluating ibrutinib in the treatment of symptomatic Waldenstrom's macroglobulinemia. J Blood Med. 2019;10:291-300. PubMed
20.Janssen Biotech Inc. IMBRUVICA® (ibrutinib) capsules or tablets, for oral use: Full Prescribing Information. Initial U.S. Approval: 2013. Revised February 2018. Marketed by: Janssen Biotech, Inc. Horsham, PA USA 19044 [accessed by sponsor]. https://www.imbruvica.com/docs/librariesprovider7/default-document-library/prescribing-information.pdf. Published 2018. Accessed May 2021.
21.Treon SP, Xu L, Yang G, et al. MYD88 L265P somatic mutation in Waldenström's macroglobulinemia. N Engl J Med. 2012;367(9):826-833. PubMed
22.Yang G, Zhou Y, Liu X, et al. A mutation in MYD88 (L265P) supports the survival of lymphoplasmacytic cells by activation of Bruton tyrosine kinase in Waldenström macroglobulinemia. Blood. 2013;122(7):1222-1232. PubMed
23.Imbruvica (Ibrutinib): tablets 140 mg, 280 mg, 420 mg, 560 mg, capsules 140 mg [product monograph]. Toronto (ON): Janssen Inc.; 2023 Jun 20. In.
24.Cancer Care Ontario. Drug Formulary - ZANU [accessed by sponsor]. In:2021.
25.Cancer Care Ontario. Drug Formulary - riTUXimab [accessed by sponsor]. In:2022.
26.Cancer Care Ontario. Drug Formulary - iBRUtinib [accessed by sponsor]. In:March 2022.
27.Cancer Care Ontario. Drug Formulary - FC+R [accessed by sponsor]. In:2020.
28.Dimopoulos Ma TA, Trotman J G, Sanz R MD, et al. Phase 3 trial of ibrutinib plus rituximab in Waldenström's macroglobulinemia. N Engl J Med. 2018;378(25):2399. PubMed
29.Dimopoulos MA, Trotman J, Tedeschi A, et al. Ibrutinib for patients with rituximab-refractory Waldenstrom's macroglobulinaemia (iNNOVATE): An open-label substudy of an international, multicentre, phase 3 trial. Lancet Oncol. 2016;18(2):241-250. PubMed
30.National Comprehensive Cancer Network. NCCN Guidelines: Waldenström macrolobulinemia/lymphoplasmacytic lymphoma [accessed by sponsor]. In: Plymouth Meeting (PA): National Comprehensive Cancer Network; 2021.
31.Karlin L, Besson H, Tapprich C, Garside J, Salles G. Efficacy of ibrutinib-rituximab versus real-world (RW) treatments for patients with Waldenström's macroglobulinemia (WM): Adjusted comparison of iNNOVATE and the Lyon-Sud RW database. Blood. 2018;132(Supplement 1):1604. doi:10.1182/blood-2018-99-112203.
32.Phillippo DM, Ades AE, Dias S, Palmer S, Abrams KR, Welton NJ. NICE DSU Technical Support Document 18: Methods for population-adjusted indirect comparisons in health technology appraisal in submissions to NICE. Report by the Decision Support Unit. http://scharr.dept.shef.ac.uk/nicedsu/wp-content/uploads/sites/7/2017/05/Population-adjustment-TSD-FINAL.pdf. Published 2016. Accessed 2021 Jul 1.
33.Treon SP, Tripsas CK, Meid K, et al. Ibrutinib in previously treated Waldenström's macroglobulinemia. N Engl J Med. 2015;372(15):1430-1440. PubMed
34.Pharmacyclics LLC. Clincal Study Report – Phase 2 Study of Bruton's Tyrosine Kinase (BTK) inhibitor, Ibrutinib (PCI-32765) in Waldenstrom's Macroglobulinemia -PCYC-118E [accessed by sponsor]. 2014.
35.Tappenden P, Carroll C, Stevens J, et al. Ibrutinib for Treating Waldenstrom's Macroglobulinaemia: An Evidence Review Group Perspective of a NICE Single Technology Appraisal. Pharmacoeconomics. 2019;37(1):7-18. PubMed
36.Treon SP, Meid K, Gustine J, et al. Long-term follow-up of ibrutinib monotherapy in symptomatic, previously treated patients with Waldenström macroglobulinemia. J Clin Oncol. 2021;39(6):565-575. PubMed
37.Dimopoulos M, Sanz RG, Lee HP, et al. Zanubrutinib for the treatment of MYD88 wild-type Waldenstrom macroglobulinemia: a substudy of the phase 3 ASPEN trial. Blood Adv. 2020;4(23):6009-6018. PubMed
Appendix 1: Additional Outcome Data
Note that this appendix has not been copy-edited.
Table 27: Summary of Key Efficacy Outcomes in the Overall Population in the iNNOVATE Study
Key efficacy outcome | Primary analysis | Final analysis | ||
|---|---|---|---|---|
IR (N = 75) | Placebo-rituximab (N = 75) | IR (N = 75) | Placebo-rituximab (N = 75) | |
PFS | ||||
n | 75 | 75 | 75 | 75 |
Median, months (95% CI) | NE (35.0 to NE) | 20.3 (13.7 to 27.6) | NE (57.7 to NE) | 20.3 (13.0 to 27.6) |
Rate (95% CI) | 30-month: 81.6% (70.5 to 88.9) | 30-month: 27.5% (12.8 to 44.4) | 30-month: 78.8% (67.3 to 86.6) 48-month: 70.6% (58.1 to 80.0) 54-month: 68.0% (54.8 to 78.1) | 30-month: 37.4% (26.0 to 48.9) 48-month: 25.3% (15.3 to 36.6) 54-month: 25.3% (15.3 to 36.6) |
HR (95% CI) | 0.202 (0.107 to 0.380) | 0.250 (0.148 to 0.420) | ||
P value | < 0.0001 | < 0.0001 | ||
OS | ||||
n | 75 | 75 | 75 | 75 |
Median, months (95% CI) | NE (NE-NE) | NE (NE-NE) | NE (57.7-NE) | NE (NE-NE) |
Rate (95% CI) | 30-month: 93.7% (83.8 to 97.6) | 30-month: 91.9% (82.8 to 96.3) | 30-month: 93.2% (84.4 to 97.1) 48-month: 89.5% (79.1 to 94.9) 54-month: 86.4% (73.7 to 93.3) | 30-month: 90.4% (81.0 to 95.3) 48-month: 87.5% (77.4 to 93.3) 54-month: 84.2% (71.3 to 91.6) |
HR (95% CI) | 0.616 (0.174 to 2.186) | 0.808 (0.328 to 1.990) 0.64 (0.256 to 1.618) | ||
P value | NR | 0.6430 | ||
CI = confidence interval; HR = hazard ratio; IR = Ibrutinib plus rituximab; NA = not applicable; NE = not evaluable; NR = not reported; OS = overall survival; PFS = progression-free survival.
Sources: iNNOVATE Clinical Study Report, 2020.15
Table 28: Summary of Other Efficacy Outcomes in the Overall Population in the iNNOVATE Study
Other efficacy outcome | Primary analysis | Final analysis | ||
|---|---|---|---|---|
IR (N = 75) | Placebo-rituximab (N = 75) | IR (N = 75) | Placebo-rituximab (N = 75) | |
Best overall response | ||||
Number of patients contributing to the analysis | 75 | 75 | 75 | 75 |
Minor response, n (%) | 15 (20) | 11 (15) | 12 (16) | 10 (13) |
PR, n (%) | 35 (47) | 20 (27) | 34 (45) | 19 (25) |
VGPR, n (%) | 17 (23) | 3 (4) | 22 (29) | 3 (4) |
CR, n (%) | 2 (3) | 1 (1) | 1 (1) | 1 (1) |
Stable disease, n (%) | 2 (3) | 31 (41) | 2 (3) | 31 (41) |
Progressive disease, n (%) | 0 | 7 (9) | 0 | 8 (11) |
NE/unknown, n (%) | 4 (5) | 2 (3) | 4 (5) | 3 (4) |
Response rates | ||||
Number of patients contributing to the analysis | 75 | 75 | 75 | 75 |
ORR,a % (95% CI) | 72 (NR) | 24 (NR) | 76 (65 to 85) | 31 (21 to 42) |
Rate ratio (95% CI) | 2.299 (1.592 to 3.319) | 2.526 (1.753 to 3.639) | ||
P value | < 0.0001 | < 0.0001 | ||
CRR,b % (95% CI) | 92 (NR) | 47 (NR) | 92 (83 to 97) | 44 (33 to 56) |
Rate ratio (95% CI) | 2.001 (1.554 to 2.576) | 2.122 (1.627 to 2.767) | ||
P value | < 0.0001 | < 0.0001 | ||
DORc | ||||
Number of patients contributing to the analysis | NR | NR | 57 | 23 |
n (%) | NR | NR | 11 (19) | 11 (48) |
Median, months (95% CI) | NR | NR | NE (56 to NE) | NE (20 to NE) |
TTNT | ||||
Number of patients contributing to the analysis, n (%) | NR | NR | 9 (12) | 47 (63) |
Median TTNT, months (95% CI) | NR | NR | NE (NE to NE) | 18.1 (11 to 33) |
HR (95% CI) | NR | 0.102 (0.049 to 0.212) | ||
P value | NR | < 0.0001 | ||
Improvements in hemoglobin levels | ||||
Number of patients contributing to the analysis | NR | NR | 75 | 75 |
Baseline, median, g/dL | NR | NR | 10.5 | 10.0 |
Value at last time point, median, g/dL | NR | NR | NR | NR |
Proportion of patients with sustained hemoglobin improvement, n (%) | 55 (73) | 31 (41) | 58 (77) | 32 (43) |
Rate ratio (95% CI) | 1.774 (1.311 to 2.400) | 1.813 (1.357 to 2.421) | ||
P value | < 0.0001 | < 0.0001 | ||
Improvements in IgM | ||||
Number of patients contributing to the analysis | NR | NR | 75 | 75 |
Baseline, median, g/L | NR | NR | 32.9 | 31.8 |
Maximum median change, g/L (95% CI) | NR | NR | Week 249: –33.3 (−55.2 to −10.4) | Week 249: –26.9 (−32.1 to −21.6) |
P value | NR | NR | NR | NR |
EQ-5D-5L visual analogue scale | ||||
Number of patients contributing to the analysis | NR | NR | 75 | 75 |
Proportion of patients with clinically meaningful improvement, n (%) | NR | NR | 38 (51) | 41 (55) |
Rate ratio (95% CI) | NR | 0.932 (0.689 to 1.261) | ||
P value | 0.6516 | |||
EQ-5D-5L utility score | ||||
Number of patients contributing to the analysis | NR | NR | 75 | 75 |
Proportion of patients with clinically meaningful improvement, n (%) | NR | NR | 35 (47) | 27 (36) |
Rate ratio (95% CI) | NR | 1.318 (0.884 to 1.964) | ||
P value | NR | 0.1680 | ||
FACT-An | ||||
Number of patients contributing to the analysis | NR | NR | 75 | 75 |
Proportion of patients with clinically meaningful improvement, n (%) | NR | NR | 56 (75) | 44 (59) |
Rate ratio (95% CI) | NR | 1.273 (1.012 to 1.602) | ||
P value | NR | 0.0394 | ||
Anemia subscale score | ||||
Number of patients contributing to the analysis | NR | NR | 75 | 75 |
Proportion of patients with clinically meaningful improvement, n (%) | NR | NR | 50 (67) | 36 (48) |
Rate ratio (95% CI) | NR | 1.384 (1.035 to 1.850) | ||
P Value | NR | 0.0247 | ||
CI = confidence interval; CR = complete response; EORTC QLQ-C30 = European Organisation for Research and Treatment of Cancer Quality of Life Questionnaire Core 30; EQ-5D-5L = EuroQoL 5-Dimension 5-Level Questionnaire; FACT-An = Functional Assessment of Cancer Therapy-Anemia; HR = hazard ratio; IgA = immunoglobulin A; IgG = immunoglobulin G; IgM = immunoglobulin M; IR = Ibrutinib plus rituximab; MRR = major response rate; NE = not evaluable; NR = not reported; OR = odds ratio; ORR = overall response rate; PR = partial response; RR = relative risk; TTNT = time to next treatment; VGPR = very good partial response.
aORR is made up of CR, VGPR, and PR.
bCRR is made up of CR, VGPR, PR, and MR.
cDefined as the duration from the date of initial documentation of response to the date of first documented evidence of progressive disease or death for responders.
Source: iNNOVATE Clinical Study Report, 2020.
Pharmacoeconomic Review
Abbreviations
BIA
budget impact analysis
BR
bendamustine plus rituximab
BSC
best supportive care
BTK
Bruton tyrosine kinase
CyBorD
cyclophosphamide plus bortezomib plus dexamethasone
HR
hazard ratio
ICER
incremental cost-effectiveness ratio
IR
ibrutinib with rituximab
OS
overall survival
PC
physician’s choice
PFS
progression-free survival
QALY
quality-adjusted life-year
R-CHOP
rituximab plus cyclophosphamide plus doxorubicin plus vincristine plus prednisone
R-CVP
rituximab plus vincristine plus cyclophosphamide plus prednisone
R-DB
rituximab plus bortezomib plus dexamethasone
RDI
relative dose intensity
R-fludarabine
rituximab plus fludarabine
r/r
relapsed or refractory
WM
Waldenström macroglobulinemia
Executive Summary
The executive summary comprises 2 tables (Table 1 and Table 2) and a conclusion.
Item | Description |
|---|---|
Drug product | Ibrutinib (Imbruvica), 140 mg capsule |
Submitted price | Ibrutinib, 140 mg: $99.84 per capsule |
Indication | For the treatment of adult patients with WM as monotherapy or in combination with rituximab for the treatment of adult patients with WM |
Health Canada approval status | NOC |
Health Canada review pathway | Ibrutinib monotherapy: Standard Ibrutinib with rituximab: Priority |
NOC date | For the treatment of adult patients with WM: March 31, 2016 Ibrutinib with rituximab: February 11, 2019 |
Reimbursement request | Ibrutinib, as a monotherapy or in combination with rituximab, for the treatment of patients with previously treated, relapsed or refractory WM |
Sponsor | Janssen Canada Inc. |
Submission history | Previously reviewed: Yes Indication: For the treatment of patients with WM who have received at least 1 prior therapy. Recommendation date: November 3, 2016 Recommendation: Do not reimburse Indication: For the treatment of patients with CLL or small lymphocytic lymphoma with or without 17p deletion who have received at least 1 prior therapy and are not considered appropriate for treatment or re-treatment with a purine analogue (e.g., fludarabine) Recommendation date: March 5, 2015 Recommendation: Reimburse with clinical criteria and/or conditions Indication: For the treatment of patients with relapsed or refractory mantle cell lymphoma Recommendation date: July 19, 2016 Recommendation: Reimburse with clinical criteria and/or conditions Indication: Patients with previously untreated CLL Recommendation date: November 3, 2016 Recommendation: Reimburse with clinical criteria and/or conditions |
CLL = chronic lymphocytic leukemia; NOC = Notice of Compliance; WM = Waldenström macroglobulinemia.
Table 2: Summary of Economic Evaluation
Component | Description |
|---|---|
Type of economic evaluation | Cost-utility analysis Markov model |
Target population | Adults with relapsed or refractory WM |
Treatments | Ibrutinib monotherapy Ibrutinib with rituximab |
Comparators | Rituximab monotherapy PC, defined as a basket of chemotherapy treatments used in Canada Zanubrutinib |
Perspective | Canadian publicly funded health care payer |
Outcomes | QALYs, LYs |
Time horizon | Lifetime (30 years) |
Key data source | iNNOVATE study: direct head-to-head comparison of IR vs. rituximab monotherapy ASPEN study: head-to-head comparison of ibrutinib monotherapy and zanubrutinib Adjusted analysis: Inverse probability treatment weighting for rituximab vs. PC Naive comparison for IR vs. ibrutinib monotherapy |
Submitted results | In the base-case sequential analysis, ibrutinib monotherapy was dominated by zanubrutinib. PC, zanubrutinib, and IR were on the cost-effectiveness efficiency frontier. IR was the most expensive and most effective regimen identified on the cost-effectiveness frontier, associated with a sequential ICER of $192,834 per QALY gained compared to zanubrutinib (incremental costs = $90,960; incremental QALYs = 0.47). |
Key limitations |
|
CADTH reanalysis results |
|
AE = adverse event; ICER = incremental cost-effectiveness ratio; IR = ibrutinib plus rituximab; LY = life-year; PC = physician’s choice; QALY = quality-adjusted life-year; WM = Waldenström macroglobulinemia.
Conclusions
Evidence from the iNNOVATE trial comparing ibrutinib plus rituximab (IR) with placebo plus rituximab, showed that IR was associated with large progression-free survival (PFS) rates and a greater proportion of patients with sustained hemoglobin improvements. The effects on overall survival (OS) were very uncertain due to study limitations and imprecision in assessing the outcome. In comparison to zanubrutinib, evidence from the ASPEN trial suggests that ibrutinib monotherapy demonstrates comparable efficacy, although zanubrutinib is suggested to have a better safety profile. There were no head-to-head comparisons between IR and physician’s choice (PC) (defined as a basket of immunochemotherapies), ibrutinib monotherapy, or zanubrutinib, nor were there any comparative data between ibrutinib monotherapy and PC or rituximab. As indirect comparative evidence submitted by the sponsor was limited due to low sample sizes and baseline imbalances, all effect estimates from comparisons assessed in the adjusted analyses or the naive comparison remain very uncertain.
Overall, there remains significant uncertainty for the comparison of IR and ibrutinib monotherapy to other comparators. As zanubrutinib was identified as the key comparator, and due to the limitations with the sponsor-submitted indirect comparative evidence, CADTH undertook a reanalysis that compared ibrutinib monotherapy with zanubrutinib. The CADTH reanalysis also incorporated the following changes to address some of the key limitations identified, beyond the removal of PC, rituximab monotherapy, and IR as comparators: aligning AE rates for ibrutinib monotherapy to the rates reported in the ASPEN trial and aligning routine care frequency more closely with Canadian clinical practice. Based on the CADTH reanalysis, the CADTH results were similar to those of the sponsor; ibrutinib monotherapy was dominated by zanubrutinib, as ibrutinib monotherapy was associated with equal QALYs and greater costs (incremental costs = $65,303). When considering an exploratory analysis that included IR and assumed equal efficacy for all 3 comparators in the absence of robust comparative clinical evidence, IR was also dominated by both ibrutinib monotherapy and zanubrutinib.
There is insufficient comparative clinical evidence to justify a price premium for ibrutinib monotherapy in comparison with zanubrutinib, as ibrutinib monotherapy demonstrated efficacy similar to zanubrutinib in a head-to-head trial. As noted in the CADTH clinical report, ibrutinib had a less favourable safety profile than zanubrutinib, mainly due to the larger proportion of patients experiencing atrial fibrillation. Therefore, a higher price reduction may be warranted to account for the less favourable safety profile of ibrutinib than of zanubrutinib. Furthermore, while clinical expert feedback received by CADTH noted that the use of IR is likely to be limited in Canada (to less than 10% of patients), a higher price reduction may be required, should rituximab be used in combination with ibrutinib, to account for the additional cost, as there is limited evidence to support a greater benefit for IR than for ibrutinib monotherapy.
Stakeholder Input Relevant to the Economic Review
This section is a summary of the feedback received from the patient groups, registered clinicians, and drug plans that participated in the CADTH review process.
Patient input was received from Lymphoma Canada and the Waldenström’s Macroglobulinemia Foundation of Canada. Lymphoma Canada collected data via online anonymous patient surveys conducted from May 26, 2023, to June 29, 2023. Of the 291 individuals who responded, 101 identified as Canadian, 43% were aged between 65 and 74 years, and 57% identified as male. Most respondents had been diagnosed with Waldenström macroglobulinemia (WM) at least 9 years ago. Patients noted that the most important factors related to treatment included controlling disease and symptoms (100%), extending remission (97%), improving quality of life (96%), extending survival (94%), and limiting side effects (64%). Among the respondents, 65% expressed the importance of having a choice in their treatment options. In addition, 49 respondents reported experience with ibrutinib (24 of whom were from Canada), and an additional 12 reported experience with IR (4 of whom were from Canada). Twenty of these patients received access to ibrutinib through a compassionate access program. The majority of respondents who had experience with ibrutinib with or without rituximab noted that they were pleased with their treatment, with most of the severe reactions being associated with rituximab infusions. Input from the Waldenström’s Macroglobulinemia Foundation of Canada noted that Bruton tyrosine kinase (BTK) inhibitors (i.e., zanubrutinib) have been the primary second-line treatment in Canada for WM and that the reimbursement of ibrutinib would increase treatment options for patients.
Registered clinician input was received from Ontario Health Cancer Care Ontario Hematology Cancer Drug Advisory Committee. The goal of treatment for relapsed or refractory (r/r) WM is to reduce paraprotein levels, reduce symptoms, and improve overall quality of life. Clinician input noted that zanubrutinib is a treatment option available through the exceptional access program in Ontario, and other treatment options included chemotherapy in combination with rituximab or bortezomib. Given the availability of BTK inhibitors, clinician input noted that it is unclear how ibrutinib addresses current treatment gaps; however, the input also noted that ibrutinib (with or without rituximab) may be an alternative option for treatment in the second-line setting or beyond, or for patients who are intolerant to zanubrutinib.
Feedback from the drug plans indicated concerns with the choice of comparators in the trials, as immunochemotherapies followed by rituximab maintenance is typically the standard first-line therapy for patients with WM and zanubrutinib is funded in most jurisdictions for r/r WM. The drug plans had questions about which patients should get ibrutinib monotherapy and which should get IR, and about the different outcomes associated with each regimen. The drug plans inquired how treatment discontinuation should be handled, given the combined use of rituximab and ibrutinib (i.e., can rituximab be reinitiated for patients who relapse after initial rituximab therapy or can those who relapse on ibrutinib monotherapy have rituximab added at the time of therapy). Last, the drug plans noted that zanubrutinib and biosimilars of rituximab (both subcutaneous and IV) have successfully completed price negotiations with the pan-Canadian Pharmaceutical Alliance.
Several of these concerns were addressed in the sponsor’s model:
The impact of r/r WM on a patient’s quality of life was captured with health state utility values.
AEs associated with IR, ibrutinib monotherapy, and other comparators were included in the analysis.
In addition to rituximab monotherapy and PC (consisting of a basket of immunochemotherapy regimens), zanubrutinib was also included as a comparator.
CADTH was unable to address the following concern raised from stakeholder input: Analyses were based on publicly available prices and therefore may not reflect the confidential prices for drugs such as zanubrutinib or rituximab biosimilars.
Economic Review
The current review is for ibrutinib (Imbruvica) with or without rituximab for the treatment of adult patients with previously treated r/r WM.
Economic Evaluation
Summary of Sponsor’s Economic Evaluation
Overview
The sponsor submitted a cost-utility analysis assessing the cost-effectiveness of ibrutinib with or without rituximab (included as 2 distinct comparators) relative to rituximab monotherapy, PC, and zanubrutinib for the treatment of adults with r/r WM. The model population deviates from the Health Canada indication, in that only patients with r/r WM were of interest, but represents the sponsor’s reimbursement request.1
Ibrutinib is available as 140 mg oral capsules.2 The recommended dose is 420 mg once daily until disease progression or until it is no longer tolerated by the patient.2 The submitted price for ibrutinib is $99.84 per capsule, or $8,386.14 per 28-day cycle.3 The comparators for this analysis included rituximab monotherapy, PC, and zanubrutinib. PC was defined as a basket of commonly prescribed combination therapies and monotherapies used in Canada, and consisted of bendamustine plus rituximab (BR), dexamethasone plus rituximab plus cyclophosphamide (DRC), rituximab plus cyclophosphamide plus doxorubicin plus vincristine plus prednisone (R-CHOP), chlorambucil rituximab plus bortezomib plus dexamethasone (R-DB), cyclophosphamide plus bortezomib plus dexamethasone (CyBorD), rituximab plus fludarabine (R-fludarabine), fludarabine, rituximab plus vincristine plus cyclophosphamide plus prednisone (R-CVP), and stem cell transplant. The proportion of use was informed by treatment guidelines (Alberta Lymphoma Guidelines and the National Comprehensive Cancer Network), clinical experts in Canada consulted by the sponsor, and real-world evidence from a chart review study.3-6
Outcomes of the model included quality-adjusted life-years (QALYs) and life-years over a lifetime horizon of 30 years. Discounting (1.5% per annum) was applied to both costs and outcomes, and a cycle length of 4 weeks was used, with a half-cycle correction applied.3
Model Structure
The sponsor submitted a Markov model to track a cohort of patients with r/r WM. As noted in Figure 1, the model consisted of 5 health states: initial treatment PFS, first subsequent treatment PFS, second subsequent treatment PFS, best supportive care (BSC), and death.
Patients with r/r WM entered the model in the initial treatment PFS state and could either remain there, experience progression, or die. Upon experiencing progression, a proportion of patients were assumed to transition to the first subsequent treatment PFS state, and the remaining transitioned to the BSC health state. Patients in the first subsequent treatment PFS state followed a similar transition pattern; they could remain in their current health state or experience progression and transition to second-line subsequent treatment PFS or BSC. Patients who experienced progression while in the second subsequent treatment state transitioned to BSC. At any point in the model time horizon, patients could transition to death.3
Model Inputs
The target population was based on the r/r subgroup of the iNNOVATE trial (a phase III, multicentre, randomized, double-blind, placebo-controlled trial that compared IR with placebo plus rituximab in patients living with first-line and r/r WM), which had a baseline age of 68 years, and 68.3% of patients were male.3
The model required efficacy data to inform PFS on initial therapy for each treatment. PFS curves for IR and for rituximab were generated by extrapolating Kaplan-Meier curves from the iNNOVATE study using parametric survival functions. The exponential curve was selected for both IR and rituximab in the sponsor’s base case, based on best visual fit, Akaike information criterion and Bayesian information criterion, along with clinical plausibility.3 In the absence of head-to-head evidence, hazard ratios (HRs) from separate analyses were used to derive PFS estimates for PC and ibrutinib monotherapy.3 Specifically, PFS for PC was derived by applying the HR from an indirect, adjusted analysis comparing PC with rituximab, which used an inverse probability of treatment weighting approach, to the rituximab reference curve (PC versus rituximab HR: 0.72; 95% CI, 0.40 to 1.31). PFS for ibrutinib monotherapy was derived by applying an HR obtained from a naive comparison of ibrutinib monotherapy with IR to the IR reference curve (ibrutinib monotherapy versus IR HR: 1.26; 95% CI 0.64 to 2.49).3 All efficacy for zanubrutinib was assumed to be equal to ibrutinib monotherapy, based on findings from the ASPEN trial.3
The proportion of patients receiving subsequent treatments after initial therapy for r/r disease was informed by a chart review and the iNNOVATE trial. The proportion receiving first subsequent treatment was 67%, calculated as a weighted average of the percentage of patients who received second-line to seventh-line treatment in the iNNOVATE trial and the percentage of patients who received a third-line to eighth-line treatment in the chart review. The proportion of patients receiving a second subsequent treatment after progression from the initial subsequent treatment was 57%, estimated in a manner similar to that used for the proportion of patients receiving a first subsequent treatment. The weighted percentages were applied to all patients progressing from initial treatment or first subsequent treatment, regardless of the initial treatment received.
A constant probability of progression was assigned to both lines of subsequent treatment, at 0.46 per year (i.e., 0.0457 per 4-week cycle). This value was derived from annual progression rates obtained from the chart review for patients who received 2 and 3 prior lines of therapy, and weighted using the distribution of patients with 2 and 3 prior lines of therapy from the iNNOVATE trial.
The probability of death in the model was capped using age-specific annual probabilities of death by sex from Statistics Canada.7 Preprogression mortality for IR and for rituximab monotherapy were informed by the constant annual mortality rate derived from the iNNOVATE trial and age-adjusted general population mortality. Age-adjusted general population mortality was applied at the beginning of year 8 for IR and year 9 for rituximab monotherapy.3 It was assumed that ibrutinib monotherapy and zanubrutinib would have the same preprogression mortality as IR.3 Mortality associated with PC was estimated to be 12.84 deaths per 100 patient-years, derived from the matched chart review cohort. This rate of death was applied in the model as a constant mortality risk until year 22.3 A single postprogression mortality rate was derived from the chart review and applied to all patients, independent of the initial therapy received. The probability of death during the postprogression period was 0.12 per year (i.e., 0.0093 per 4-week cycle).
Treatment duration for each component of the IR regimen was modelled separately. The duration of ibrutinib treatment was based on the parametric survival extrapolation of time-to-discontinuation data from the iNNOVATE trial, whereas rituximab duration in the IR regimen was based on observed Kaplan-Meier data, owing to its fixed dosing.7 The exponential distribution was used to estimate the long-term time-to-discontinuation projections for ibrutinib (in the IR regimen) because it was the best statistical fit. The rituximab monotherapy comparator was assumed to have the same treatment duration as rituximab in the IR regimen. Patients on PC were assumed to discontinue treatment upon death, progression, or the completion of the maximum treatment duration of 2 years, whichever occurred first.7 The treatment duration for ibrutinib monotherapy was assumed to have the same relationship with IR as it did for PFS (i.e., ibrutinib monotherapy versus IR HR, 1.26). Last, zanubrutinib treatment duration was assumed to be equal to that of ibrutinib monotherapy.7
AEs included in the model were restricted to grade 3 and 4 AEs occurring in at least 5% of patients in at least 1 of the treatment arms from the available data sources.3 AE frequencies for IR and for rituximab monotherapy were based on the iNNOVATE trial, whereas trials for other treatments, consisting of various PC regimens,8-16 the PCYC-1118E study,8 and the ASPEN study,17 were used to inform the AE rates for PC, ibrutinib, and zanubrutinib, respectively.
Health-related quality of life was captured in the model by combining health state utilities with disutilities associated with AEs. Health state utility values for the PFS states were derived from 5-Level EQ-5D data obtained from the iNNOVATE trial using UK-specific preference weights.3 The utility of BSC was calculated by applying a 12.8% decrement to the PFS utility value, as informed from Beusterien et al., (2010).18
Utility decrements associated with AEs were applied as a 1-off relative change in the first cycle, and disutility inputs were informed by published literature when available or by clinical expert validated assumptions.18,19 AEs were not considered for subsequent treatments.3
Costs considered in the economic analysis included drug acquisition, administration, AE management costs, routine care and follow-up costs, and terminal care costs. Treatment-acquisition costs were informed by the Ontario Drug Benefit Formulary, the Ontario Exceptional Access Program, and McKesson Canada.3,20,21 Drug-dispensing fees and mark-ups were not considered. Dosing intensity for IR and ibrutinib monotherapy was included in the base case and informed by the iNNOVATE trial.3 Costs for the IV administration of treatment were set at $202.03 per administration (inflated from 2010 to 2022).22 Treatment costs for subsequent therapies were calculated by combining drug-acquisition and administration costs for each relevant option and weighting them by the percentage of patients expected to be on each regimen.3
Routine care and follow-up costs, including physician visits and laboratory tests, were included in the model. Costing inputs were informed by the Ontario Schedule of Benefits for Physician and Laboratory Services, the Ontario Case Costing Initiative, published literature, and feedback from clinical experts in Canada consulted by the sponsor.3,23-26 Frequency of resource use was segregated by year of care (i.e., years 1 to 2, years 3 to 5, and years 6+) and validated by clinical experts in Canada. The cost of AEs was informed by the Ontario Case Costing Initiative (inflated to 2022), and the proportion of patients treated in inpatient and outpatient settings was informed by estimates from clinical experts.3,27 Terminal care costs were included as a 1-time cost upon entry into the death state, and were informed by published literature.23
Summary of Sponsor’s Economic Evaluation Results
All analyses were run probabilistically with 1,000 iterations. The deterministic results were aligned with submitted probabilistic results. The probabilistic findings are presented here.
Base-Case Results
Based on the sponsor’s probabilistic base-case analysis, the sequential cost-effectiveness analysis showed that ibrutinib monotherapy was dominated by zanubrutinib, owing to equal QALYs but greater costs (incremental costs = $52,369). Rituximab was extendedly dominated through zanubrutinib and IR; while PC, IR, and zanubrutinib remained on the cost-effectiveness frontier. Of these, IR was the most costly and most effective treatment, associated with an incremental cost-effectiveness ratio (ICER) of $192,834 per QALY gained ($90,960 more costs and 0.47 more QALYs) compared to zanubrutinib. Zanubrutinib was associated with a sequential ICER of $133,639 per QALY gained, compared with PC. At a willingness-to-pay threshold of $50,000 per QALY gained, IR had a 0.6% probability of being cost-effective and ibrutinib monotherapy had a 0.0% probability of being cost-effective.
In the sponsor’s probabilistic base-case pairwise analysis, which may be more appropriate than a sequential analysis, given the lack of a common comparative framework to derive efficacy data for all comparators, IR was associated with an additional 2.71 QALYs at an additional cost of $305,175 compared with rituximab. Therefore, the ICER was $112,579 per QALY gained. When compared with ibrutinib monotherapy and zanubrutinib, IR was associated with more QALYS (0.47 for both) and a higher cost ($38,591 and $90,960, respectively). Therefore, the ICERs for IR versus ibrutinib monotherapy and zanubrutinib were $81,700 per QALY gained and $192,834 per QALY gained, respectively. Based on the deterministic results, the majority (68%) of the incremental QALYs for IR (50 months) was accrued during the extrapolation period (i.e., after the median follow-up period of the IR arm in the iNNOVATE trial).
Compared to rituximab, ibrutinib monotherapy was associated with more QALYs (2.24) and more costs ($266,584), resulting in an ICER of $119,095 per QALY gained. Compared to PC, ibrutinib monotherapy was also more effective (3.25 additional QALYs), with a higher cost (an additional $485,482), resulting in an ICER of $149,791. In comparison with zanubrutinib, ibrutinib monotherapy was dominated, owing to equal QALYs but greater costs (incremental costs = $52,369). A summary of all the sponsor-submitted pairwise analyses results can be found in Table 14 and Table 15.
Table 3: Summary of the Sponsor’s Economic Evaluation Results
Drug | Total costs ($) | Total QALYs | Sequential ICER ($/QALY) |
|---|---|---|---|
PC | 489,808 | 5.05 | Reference |
Zanubrutinib | 923,920 | 8.30 | $133,639 |
IR | 1,014,880 | 8.77 | $192,834 |
Rituximab | 709,705 | 6.06 | Extendedly dominated through zanubrutinib and IR |
Ibrutinib | 976,289 | 8.30 | Dominated by zanubrutinib |
ICER = incremental cost-effectiveness ratio; IR = ibrutinib with rituximab; PC = physician’s choice; QALY = quality-adjusted life-year.
Source: Sponsor’s pharmacoeconomic submission.3
Sensitivity and Scenario Analysis Results
In addition to the base-case analysis, the sponsor conducted several scenario analyses. Analyses conducted included those that examined the impact of an alternative time horizon; alternative discount rates; an alternative HR (derived from a naive comparison to inform the HR for PFS between PC and rituximab); alternative time-to-discontinuation distributions for ibrutinib in the IR regimen; assuming 100% compliance; excluding drug wastage; excluding terminal care costs; alternative health state utilities; excluding AE costs and disutilities; and including direct costs. No scenario had a significant impact on the relative cost-effectiveness of IR or ibrutinib monotherapy.
CADTH Appraisal of the Sponsor’s Economic Evaluation
CADTH identified several key limitations to the sponsor’s analysis that have notable implications for the economic analysis:
Comparative effectiveness evidence to relevant comparators is uncertain and was not derived from a common assessment framework. Other than the iNNOVATE trial comparing IR to rituximab and the ASPEN trial comparing ibrutinib monotherapy to zanubrutinib, there are no direct head-to-head data comparing either IR or ibrutinib monotherapy to the other comparators or comparing IR with ibrutinib. As such, the sponsor conducted indirect adjusted analyses (i.e., propensity score matching, matching-adjusted indirect comparison, inverse probability of treatment weighting analysis, and an adjusted Cox proportional hazards model) and a naive comparison to derive comparative evidence informing PFS for IR versus ibrutinib monotherapy and PC versus rituximab. However, as noted in the CADTH clinical review, there were notable limitations with the sponsor’s conducted analyses, such as imbalances in patients’ baseline characteristics, a low sample size, and the observational nature of the data used to inform these analyses. Because WM is a rare disease, low samples sizes are not unexpected and observational data are among the few ways to inform model parameters, but there is no analysis assessing all potential comparators within a common framework (e.g., a network meta-analysis). Therefore, no conclusion could be drawn regarding the clinical effectiveness of IR relative to comparators (excluding rituximab), of ibrutinib monotherapy relative to comparators (excluding zanubrutinib), or of IR relative to ibrutinib monotherapy (described in the subsequent limitation). As a result, there is considerable uncertainty about the results of the sponsor’s analysis, and pairwise comparisons between drugs for which there is direct evidence may be more reflective of the available evidence.
The CADTH base case considered a pairwise comparison between ibrutinib monotherapy and zanubrutinib, given that this was the only comparison for which there was both robust clinical evidence, and the comparator most relevant to the likely place in therapy of ibrutinib.
CADTH considered 2 exploratory analyses — 1 that included IR and another that included all comparators (i.e., IR, PC, and rituximab monotherapy) — in addition to the analysis of ibrutinib monotherapy and zanubrutinib. However, CADTH noted that these analyses are highly uncertain, given the limitations of the available evidence.
Uncertainty associated with the clinical benefit of rituximab as an add-on to ibrutinib therapy. There is no direct head-to-head evidence comparing ibrutinib monotherapy with IR. The long-term PFS related to ibrutinib monotherapy in the sponsor’s submission was derived by applying an HR obtained from a naive comparison of the IR arm from the iNNOVATE trial (with the single-arm PCYC-1118E study assessing ibrutinib monotherapy) to the IR PFS curve (ibrutinib versus IR HR: 1.26; 95% CI 0.64 to 2.49). As noted in the CADTH clinical review, there were notable limitations with this naive comparison between IR and ibrutinib monotherapy, such as imbalances in patient characteristics owing to the nature of the observational data, which generate the possibility of confounding and risk of bias due to the selection of patients. As such, no conclusion could be drawn regarding the clinical effectiveness of IR relative to ibrutinib monotherapy. This was aligned with the clinical expert feedback received by CADTH, which noted there were no robust data suggesting an additional benefit with the addition of rituximab to ibrutinib.
In the CADTH base-case analysis, IR was not included as a comparator, given that there is only robust clinical evidence for ibrutinib monotherapy compared with zanubrutinib and that the available evidence for IR is in comparison with rituximab. CADTH noted that given that the sponsor’s model relies on the HR for ibrutinib monotherapy compared with IR to derive the PFS estimate for ibrutinib monotherapy and zanubrutinib, the CADTH base case included a change that assumed equal efficacy between IR and ibrutinib monotherapy (i.e., HR = 1); there is insufficient evidence to support the superiority of IR over ibrutinib monotherapy.
In an exploratory analysis, IR was included as an additional comparator, and the efficacy between IR and ibrutinib monotherapy was assumed to be equal (i.e., HR = 1).
PC and rituximab comparators are not likely to remain relevant in Canadian clinical practice. In the base-case analysis, the sponsor included PC (defined as a basket of immunochemotherapy regimens), rituximab, and zanubrutinib as relevant comparators to IR and ibrutinib monotherapy for previously treated patients with r/r WM. Based on the clinical expert feedback received by CADTH, due to the recent public reimbursement of zanubrutinib, PC and rituximab are not likely to remain relevant comparators in Canadian clinical practice. This is also aligned with the sponsor’s submitted budget impact analysis (BIA), in which ibrutinib was only assumed to displace zanubrutinib upon reimbursement.
In the CADTH base-case analysis, only ibrutinib monotherapy and zanubrutinib were included (as noted previously). Two exploratory analyses were conducted; 1 included IR and another included all comparators (IR, PC, and rituximab).
Ibrutinib monotherapy AE rates are not reflective of Canadian clinical practice. In the sponsor’s base-case analysis, AE rates were informed by grade 3 or 4 AEs occurring in at least 5% of patients in relevant clinical trials. For ibrutinib monotherapy, the rate of AEs was informed by the PCYC-1118E study (median follow-up, 59 months) and aligned with the source of efficacy in the model. Clinical expert feedback noted that some AE rates used in the model for ibrutinib monotherapy, such as atrial fibrillation, were lower than expected. It was suggested this may be attributed to a lack of physician awareness about certain AEs as a result of the older trial date (enrolment for the PCYC-1118E study began in 2012).8 Feedback from the clinical experts noted that AE rates from the ASPEN trial (median follow-up, 44 months) would be more reflective of anticipated AE rates for ibrutinib monotherapy in previously treated patients with r/r WM.
To address this limitation, AE rates from the ASPEN trial were used to inform ibrutinib monotherapy.
The sponsor underestimated IR and rituximab monotherapy costs due to the use of relative dose intensity (RDI). In the sponsor’s base-case analysis, the mean RDI observed in the iNNOVATE trial was used to derive drug-acquisition costs for both IR and rituximab monotherapy. This meant that the costs for these drugs were less than 100%, whereas for the rest of the included comparators, the costs corresponded to 100% of the assumed dose. A reduction in RDI can be derived from a delayed dose, a missed dose, or a reduction in dose. There is no evidence to support the assumption that IR would have a lower RDI than ibrutinib monotherapy or zanubrutinib. The sponsor’s approach is expected to have underestimated the total costs of IR and rituximab.
In the CADTH exploratory analyses that included IR and/or rituximab monotherapy as comparators, RDI was set at 100% for all drugs.
Routine care costs for patients with r/r WM were overestimated. In the sponsor’s base-case analysis, it was assumed that patients in the PFS health state on a first or second subsequent treatment, or on BSC, would require 10.5 hematologist visits per year, according to clinical expert feedback received by the sponsor. Based on clinical expert feedback received by CADTH, it was noted that patients performing well on treatment (i.e., PFS) would only be expected to see a hematologist 3 to 4 times a year, and even patients on subsequent immunochemotherapy treatment would, on average, visit a hematologist just 8 times per year.
In the CADTH base-case analysis, the annual frequency of hematologist visits was set at 4 and 8 for PFS and BSC, respectively.
The distribution of immunochemotherapy regimens informing PC cost is not reflective of Canadian clinical practice. Costing for PC was based on a distribution of immunochemotherapy regimens derived from clinical experts in Canada consulted by the sponsor. These included BR (10%), DRC (10%), R-CHOP (1.67%), chlorambucil (2.5%), R-DB (20%), CyBorD (50%), R-fludarabine (1.67%), fludarabine (2.5%), and R-CVP (1.67%). Clinical expert feedback received by CADTH noted that although R-DB and CyBorD made up 70% of the cost in the sponsor’s model, this is not representative of Canadian clinical practice. Given the availability of bortezomib, R-DB and CyBorD are not popular treatment options when opting for an immunochemotherapy regimen. The experts further stated that zanubrutinib remains the most appropriate comparator for ibrutinib in patients with r/r WM.
In the CADTH base-case analysis, ibrutinib monotherapy and zanubrutinib were included in the analysis. Two exploratory analyses were conducted; 1 included IR and another included all comparators (IR, PC, and rituximab).
In the CADTH exploratory analysis that included PC and rituximab as comparators, the distribution of PC regimens informing cost was updated to be more reflective of Canadian clinical practice, based on clinical expert feedback received by CADTH (refer to Table 19).
Additionally, the following key assumptions were made by the sponsor and have been appraised by CADTH (refer to Table 4).
Table 4: Key Assumptions of the Submitted Economic Evaluation (Not Noted as Limitations to the Submission)
Sponsor’s key assumption | CADTH comment |
|---|---|
IR PFS was informed by the exponential curve. | Clinical expert feedback received by CADTH noted that the estimated PFS curves generated from the exponential curve used in the model were optimistic projections of PFS for ibrutinib with or without rituximab. It was noted that many patients with r/r WM have other comorbidities such as immune dysfunction and, therefore, it would be unlikely to have more than 30% of patients alive at 10 years (based on the starting age of 68 years), let alone progression-free. Based on the submitted data, the clinical expert feedback received by CADTH noted that PFS estimates determined by the generalized gamma curve may be more reflective of Canadian clinical practice. Due to structural limitations, CADTH conducted a deterministic exploratory analysis using the generalized gamma curve. Based on results of this exploratory analysis, use of the generalized gamma curve is not expected to have a meaningful impact on the cost-effectiveness of ibrutinib with or without rituximab relative to zanubrutinib. |
Zanubrutinib treatment discontinuation was assumed to be equivalent to that of ibrutinib monotherapy. | Potentially inappropriate. Feedback from clinical experts consulted by CADTH noted that several studies across various indications show that zanubrutinib is better tolerated than ibrutinib, particularly with respect to risk of atrial fibrillation and bleeding due to platelet inhibition. However, the inclusion of zanubrutinib-specific treatment discontinuation is not expected to have a meaningful impact on the cost-effectiveness of ibrutinib with or without rituximab, as treatment discontinuation rates between zanubrutinib and ibrutinib are not expected to be significantly different. |
Ibrutinib monotherapy and zanubrutinib have the same preprogression mortality rates as IR. | Reasonable as a simplifying assumption, as confirmed by clinical expert feedback received by CADTH. |
Patients on PC would discontinue treatment due to death, progression, or completion of a maximum treatment duration of 2 years (whichever occurred first). | Reasonable. However, clinical expert feedback received by CADTH noted that most of the regimens available in Canada would have a maximum duration of 6 months. |
Probability of progressing while on first-line or second-line subsequent treatment is constant. | Potentially inappropriate. According to clinical expert feedback sought by CADTH, the probability of progressing while on a first-line or second-line subsequent treatment would be influenced by several factors, such as previous treatment responses, and likely would not remain constant across subsequent lines of treatments. The impact of different progression rates for different subsequent treatments on the ICER of ibrutinib with or without rituximab relative to relevant comparators is unknown. |
Health state utility values for PFS, regardless of treatment line, is the same. | Inappropriate. Clinical expert feedback received by CADTH noted that quality of life is expected to be worse the more treatments a patient has received. The effect of this assumption on the model results is unknown. |
Drug dosing was informed by Canadian product monographs or from clinical trials, whereas costing was informed by the Ontario Drug Benefit Formulary, Ontario Exceptional Access Program, or McKesson.20,21 | Although reasonable, there is some uncertainty about the accuracy of drug-dosing schedules and costing informed by McKesson used in Canadian clinical practice, as regimens can vary, depending on the cancer centre or jurisdiction. This is only expected to impact the cost-effectiveness of ibrutinib with or without rituximab relative to PC, as the uncertainty only affects the chemotherapy drug-dosing schedule and costs. As such, the overall impact is expected to be minimal, as chemotherapy costs are expected to be similar. |
The efficacy of PC was informed by an international retrospective UK chart review study that examined the electronic records of 454 patients with WM. Only regimens recommended in treatment guidelines and received by the greatest proportion of patients were used to inform the efficacy of PC, which included BR (35%), DRC (19%), R-CHOP (16%), rituximab (16%), and chlorambucil (14%). | Reasonable. Although clinical expert feedback received by CADTH noted that the UK chart review efficacy data may not be completely reflective of Canadian practice, general efficacy trends may be representative of a patient with WM on immunochemotherapy in Canada. There remains uncertainty about the effectiveness of PC relative to ibrutinib with or without rituximab as a result of limitations of the sponsor’s conducted adjusted analyses. |
BR = bendamustine plus rituximab; DRC = dexamethasone plus rituximab plus cyclophosphamide; ICER = incremental cost-effectiveness ratio; IR = ibrutinib plus rituximab; PC = physician’s choice; PFS = progression-free survival; R-CHOP = rituximab plus cyclophosphamide plus doxorubicin plus vincristine plus prednisone; WM = Waldenström macroglobulinemia.
CADTH Reanalyses of the Economic Evaluation
Base-Case Results
The CADTH base case was derived by making changes to the model parameter values, in consultation with clinical experts. These changes, summarized in Table 5, involved assuming equal PFS for IR and ibrutinib monotherapy (and for zanubrutinib); removal of IR, PC, and rituximab monotherapy as base-case comparators; changing the source informing ibrutinib monotherapy AEs; and updating routine care frequency.
Due to equal QALYs and greater costs, ibrutinib was dominated by zanubrutinib (incremental costs = $65,303). A summary of the stepped analysis taken to derive the CADTH base case can be found in Appendix 4.
Table 5: CADTH Revisions to the Submitted Economic Evaluation
Stepped analysis | Sponsor’s value or assumption | CADTH value or assumption |
|---|---|---|
Corrections to sponsor’s base case | ||
None | — | — |
Changes to derive the CADTH base case | ||
1. Base-case comparators | IR Ibrutinib monotherapy Zanubrutinib PC Rituximab | Ibrutinib monotherapy Zanubrutinib |
2. HR for PFS and treatment duration for ibrutinib monotherapy vs. IR | 1.26 | 1 |
3. Ibrutinib monotherapy AEs | Informed by PCYC-1118E study | ASPEN trial |
4. Routine care frequency | 10.5 for all health states | PFS: 4 BSC: 8 |
CADTH base case | 1 + 2 + 3 + 4 | |
AE = adverse event; BSC = best supportive care; HR = hazard ratio; IR = ibrutinib plus rituximab; PC = physician’s choice; PFS = progression-free survival.
Table 6: Summary of the CADTH Reanalysis Results
Drug | Total costs ($) | Total QALYs | Sequential ICER ($) |
|---|---|---|---|
Sponsor base case | |||
PC | 489,808 | 5.05 | Reference |
Zanubrutinib | 923,920 | 8.30 | 133,639 |
IR | 1,014,880 | 8.77 | 192,834 |
Rituximab | 709,705 | 6.06 | Extendedly dominated through zanubrutinib and IR |
Ibrutinib | 976,289 | 8.30 | Dominated by zanubrutinib |
Sponsor base case (IR, PC, and rituximab comparators removed) | |||
Zanubrutinib | 923,920 | 8.30 | Reference |
Ibrutinib | 976,289 | 8.30 | Dominated by zanubrutinib |
CADTH base case | |||
Zanubrutinib | 978,277 | 8.74 | Reference |
Ibrutinib | 1,043,580 | 8.74 | Dominated by zanubrutinib |
ICER = incremental cost-effectiveness ratio; IR = ibrutinib with rituximab; PC = physician’s choice; QALY = quality-adjusted life-year.
Exploratory Analysis Results
CADTH conducted an exploratory analysis that included IR as a comparator. This analysis also included a revision to assume 100% RDI with IR to address a limitation identified in the sponsor’s base case. As in the CADTH base case, due to equal QALYs and greater costs, IR was dominated by zanubrutinib (incremental costs = $83,151) and by ibrutinib monotherapy (incremental costs = $17,848). A summary of results can be found in Table 18.
Although zanubrutinib remains the most relevant comparator for adults with WM in Canadian practice, a deterministic exploratory analysis was conducted on the CADTH base case to investigate the impact of including PC and rituximab as comparators. This exploratory analysis also included revisions to the parametric extrapolation of PFS from exponential to the generalized gamma curve to inform IR PFS, and an update of the distribution of chemotherapy regimens informing PC costs to align with clinical practice in Canada, based on expert feedback received by CADTH. A summary of changes for this exploratory analysis can be found in Appendix 4. Based on the conducted analysis, the results of this exploratory analysis showed that due to equal QALYs but greater costs, IR and ibrutinib monotherapy were both dominated by zanubrutinib, and that zanubrutinib and PC were on the cost-effectiveness efficiency frontier.
Table 7: CADTH Cost Comparison of Ibrutinib With or Without Rituximab and Zanubrutinib
Drug | Recommended dosinga | Annual treatment costb ($) | Reduction needed (%) | Reduced annual treatment cost of ibrutinib ($) | Savings in treatment cost ($) |
|---|---|---|---|---|---|
Zanubrutinib | 320 mg daily | 99,324 | NA | NA | NA |
Ibrutinib monotherapy | 420 mg daily | 109,394c | 9.21 | 99,324 | 10,071 |
IR | 420 mg ibrutinib daily 375 mg rituximab per m2 on weeks 1 to 4 and weeks 17 to 20d | 126,026c | 9.21 to 21.2 (depending on year) | 99,324 | 26,703 |
IR = ibrutinib plus rituximab; NA = not applicable.
Note: All prices are from the Ontario Drug Benefit Formulary or the Ontario Exceptional Access Formulary (accessed July 2023), unless otherwise indicated, and do not include dispensing fees.
aAligned with associated product monograph, unless otherwise indicated.2,28
bAnnual costs are based on 365.25 days per year.
cAs submitted by the sponsor.3
dRituximab dosing informed by the iNNOVATE trial, assuming patient body surface area of 1.8 m2.
Given the conclusions of the CADTH clinical review, which suggests that there is no evidence to support a price premium for IR or ibrutinib monotherapy relative to zanubrutinib, CADTH conducted an annual drug cost comparison instead of price reduction analyses on the CADTH base case. In this comparison scenario, the annual cost of zanubrutinib was $99,324, whereas the annual cost of ibrutinib ranged from $109,394 to $126,026, depending on the inclusion of rituximab. With the exception of the year 1 cost of IR, ibrutinib would require a price reduction of approximately 9.21% to be equal to that of zanubrutinib. Based on clinical expert feedback received by CADTH, it was noted that if IR was used in Canadian practice, it would have a small market share (< 10%). Therefore, accounting for the limited use, a weighted average price reduction of approximately 10.4% for ibrutinib is required. CADTH noted that this analysis does not account for potential differences in safety between these therapies.
Issues for Consideration
A higher price reduction for ibrutinib, beyond the price reduction needed to be equivalent to the price of zanubrutinib, may be required. As noted in the CADTH clinical review, ibrutinib monotherapy demonstrates comparable efficacy to zanubrutinib, but zanubrutinib is associated with a better safety profile. As such, a price reduction beyond the price reduction needed to equal the price of zanubrutinib may be required to account for this difference. Additionally, although clinical expert feedback received by CADTH noted that the use of ibrutinib with rituximab may be limited in Canada, a higher price reduction may be required should rituximab be used combination with ibrutinib, as no conclusion could be drawn for the comparative efficacy data between ibrutinib with rituximab and ibrutinib monotherapy.
Previous CADTH reviews for ibrutinib. Ibrutinib was previously reviewed by CADTH for the treatment of patients with WM who had received at least 1 prior therapy in 2016, and it received a do not reimburse recommendation, as the CADTH pan-Canadian Oncology Drug Review Expert Review Committee (pERC) was unable to conclude from the available evidence that there is a net clinical benefit with ibrutinib compared with appropriate comparators.29 Ibrutinib has also been reviewed by CADTH for other indications, including chronic lymphocytic leukemia, small lymphocytic lymphoma (previously treated), and mantle cell lymphoma (r/r), and is currently undergoing review for the treatment of adults with previously untreated chronic lymphocytic leukemia, including those with 17p deletion, when used in combination with venetoclax.29-32
Comparison to the zanubrutinib pharmacoeconomic review. CADTH has previously reviewed zanubrutinib for WM.33 However, owing to differences in model structure, clinical effectiveness parameters, health state utility values, and cost inputs, the results of the zanubrutinib submission may not be directly comparable to the review presented in this report.
Publicly available list prices may not reflect actual acquisition costs incurred by public plans. The true acquisition costs paid by Canadian public drug plans may be lower than those listed on public formularies. CADTH’s cost comparison scenarios and BIA are sensitive to this issue, as all drugs included in this review (either as monotherapies or in combination) have negotiated prices with various health care jurisdictions in Canada.
Overall Conclusions
Evidence from the iNNOVATE trial comparing IR with rituximab showed that IR was associated with large PFS rates and a greater proportion of patients with sustained hemoglobin improvements. The effects on OS were very uncertain, owing to study limitations and imprecision in assessing the outcome. In comparison to zanubrutinib, evidence from the ASPEN trial suggests that ibrutinib monotherapy has comparable efficacy, although zanubrutinib has a better safety profile. There were no head-to-head comparisons between IR and PC (defined as a basket of immunochemotherapies), ibrutinib monotherapy, or zanubrutinib, nor were there any data comparing ibrutinib monotherapy to PC or rituximab. As indirect comparative evidence submitted by the sponsor was limited because of low sample sizes and baseline imbalances, all effect estimates from comparisons assessed in the adjusted analyses or with a naive comparison remain very uncertain.
Overall, there remains significant uncertainty about the comparison of IR and ibrutinib monotherapy to other comparators. As zanubrutinib was identified as the key comparator, and because of the limitations with the sponsor-submitted indirect comparative evidence, CADTH undertook a reanalysis that compared ibrutinib monotherapy with zanubrutinib. The CADTH reanalysis also incorporated the following changes to address some of the key limitations identified, beyond the removal of PC, rituximab monotherapy, and IR as comparators: setting AE rates for ibrutinib monotherapy to be aligned with the rates reported in the APSEN trial, and adjusting routine care frequency to be more aligned with Canadian clinical practice. Based on the CADTH reanalysis, the results were similar to those of the sponsor; ibrutinib monotherapy was dominated by zanubrutinib, as ibrutinib monotherapy was associated with equal QALYs and greater costs (incremental costs = $65,303). When considering an exploratory analysis that included IR and assumed equal efficacy for all 3 comparators in the absence of robust comparative clinical evidence, IR was also dominated by both ibrutinib monotherapy and zanubrutinib.
There is insufficient comparative clinical evidence to justify a price premium for ibrutinib monotherapy relative to zanubrutinib, as the efficacy of ibrutinib monotherapy was demonstrated to be similar to zanubrutinib in a head-to-head trial. As noted in the CADTH clinical report, ibrutinib has a comparatively less favourable safety profile than zanubrutinib, mainly due to a larger proportion of patients experiencing atrial fibrillation. Therefore, a higher price reduction may be warranted to account for the less favourable safety profile of ibrutinib relative to zanubrutinib. Furthermore, although clinical expert feedback received by CADTH noted that the use of ibrutinib with rituximab is likely to be limited in Canada (to less than 10% of patients), a higher price reduction may be required, should rituximab be used in combination with ibrutinib, to account for the additional cost, as there is limited evidence to support a greater benefit with IR than with ibrutinib monotherapy.
References
1.Drug Reimbursement Review sponsor submission: Imbruvica (ibrutinib), 140 mg, 280 mg, 420 mg, 560 mg tablets and 140 mg capsules [internal sponsor's package]. Toronto (ON): Janssen Inc.; 2023 Jun 20.
2.Imbruvica (ibrutinib): 140 mg, 280 mg, 420 mg, 560 mg tablets; 140 mg capsules [product monograph]. Toronto (ON): Janssen Inc.; 2023 Mar 15.
3.Pharmacoeconomic evaluation [internal sponsor's report]. In: Drug Reimbursement Review sponsor submission: Imbruvica (ibrutinib), 140 mg, 280 mg, 420 mg, 560 mg tablets and 140 mg capsules. Toronto (ON): Janssen Inc.; 2023 Jun 20.
4.Buske C, Sadullah S, Kastritis E, et al. Treatment and outcome patterns in European patients with Waldenström’s macroglobulinaemia: A large, observational, retrospective chart review. Lancet Haematol. 2018;5(7):e299–309. PubMed
5.Cancer Care Alberta, Alberta Health Services. Clinical Practice Guidelines: Lymphoma In: Unit GR, ed. LYHE-002 V12 ed2019. 2019.
6.National Comprehensive Cancer Network. NCCN Guidelines: Waldenström macrolobulinemia/lymphoplasmacytic lymphoma [accessed by sponsor]. Plymouth Meeting (PA): National Comprehensive Cancer Network; 2021.
7.Statistics Canada. Table: 17-10-0057-01 Projected population, by projection scenario, age and sex, as of July 1 (x 1,000). 2022; https://www150.statcan.gc.ca/t1/tbl1/en/tv.action?pid=1710005701. Accessed 2023 Jun 30.
8.Treon SP, Meid K, Gustine J, et al. Long-term follow-up of ibrutinib monotherapy in symptomatic, previously treated patients with Waldenström macroglobulinemia. J Clin Oncol. 2021;39(6):565-575. PubMed
9.Pharmacyclics LLC. Clincal study report addendum – Final analysis randomized, placebo-controlled, phase 3 study of ibrutinib or placebo in combination with rituximab in subjects iwth Waldenstrom's macroglobulinemia (iNNOVATE)) PCYC-1127-CA. 2020.
10.Dimopoulos MA, Garcia-Sanz R, Gavriatopoulou M, et al. Primary therapy of Waldenstrom macroglobulinemia (WM) with weekly bortezomib, low-dose dexamethasone, and rituximab (BDR): long-term results of a phase 2 study of the European Myeloma Network (EMN). Blood. 2013;122(19):3276-3282. PubMed
11.Treon SP, Branagan AR, Ioakimidis L, et al. Long-term outcomes to fludarabine and rituximab in Waldenström macroglobulinemia. Blood. 2009;113(16):3673-3678. PubMed
12.Leblond V, Johnson S, Chevret S, et al. Results of a randomized trial of chlorambucil versus fludarabine for patients with untreated Waldenström macroglobulinemia, marginal zone lymphoma, or lymphoplasmacytic lymphoma. J Clin Oncol. 2013;31(3):301-307. PubMed
13.Marcus R, Imrie K, Belch A, et al. CVP chemotherapy plus rituximab compared with CVP as first-line treatment for advanced follicular lymphoma. Blood. 2005;105(4):1417-1423. PubMed
14.Paludo J, Abeykoon JP, Kumar S, et al. Dexamethasone, rituximab and cyclophosphamide for relapsed and/or refractory and treatment-naive patients with Waldenstrom macroglobulinemia. Br J Haematol. 2017;179(1):98-105. PubMed
15.Reeder CB, Reece DE, Kukreti V, et al. Cyclophosphamide, bortezomib and dexamethasone induction for newly diagnosed multiple myeloma: High response rates in a phase II clinical trial. Leukemia. 2009;23(7):1337-1341. PubMed
16.Rummel MJ, Niederle N, Maschmeyer G, et al. Bendamustine plus rituximab versus CHOP plus rituximab as first-line treatment for patients with indolent and mantle-cell lymphomas: An open-label, multicentre, randomised, phase 3 non-inferiority trial. Lancet. 2013;381(9873):1203-1210. PubMed
17.Tam CS, Opat S, D'Sa S, et al. A randomized phase 3 trial of zanubrutinib vs ibrutinib in symptomatic Waldenström macroglobulinemia: The ASPEN study. Blood. 2020;136(18):2038-2050. PubMed
18.Beusterien KM, Davies J, Leach M, et al. Population preference values for treatment outcomes in chronic lymphocytic leukaemia: A cross-sectional utility study. Health Qual Life Outcomes. 2010;8:50. PubMed
19.Tolley K, Goad C, Yi Y, Maroudas P, Haiderali A, Thompson G. Utility elicitation study in the UK general public for late-stage chronic lymphocytic leukaemia. Eur J Health Econ. 2013;14(5):749-759. PubMed
20.Ontario Ministry of Health and Long-Term Care. Ontario drug benefit formulary. https://www.formulary.health.gov.on.ca/formulary/. Accessed 2022 Mar 15.
21.Ontario Ministry of Health and Long-Term Care. Ontario exceptional access program formulary. 2022; https://www.health.gov.on.ca/en/pro/programs/drugs/odbf/odbf_except_access.aspx. Accessed 2022 Mar 15.
22.Tam VC, Ko YJ, Mittmann N, et al. Cost-effectiveness of systemic therapies for metastatic pancreatic cancer. Curr Oncol. 2013;20(2):e90-e106. PubMed
23.Walker H, Anderson M, Farahati F, et al. Resource use and costs of end-of-life/palliative care: Ontario adult cancer patients dying during 2002 and 2003. J Palliat Care. 2011;27(2):79-88. PubMed
24.Schedule of benefits for laboratory services: Effective July 1, 2020. Toronto (ON): Ontario Ministry of Health; 2020: http://www.health.gov.on.ca/en/pro/programs/ohip/sob/lab/lab_mn2020.pdf. Accessed 2023 Jul 7.
25.Schedule of benefits for physician services under the Health Insurance Act: (January 25, 2022 (effective July 1, 2022)). Toronto (ON): Ontario Ministry of Health; 2022: https://www.health.gov.on.ca/en/pro/programs/ohip/sob/physserv/sob_master.pdf. Accessed July 7, 2023.
26.Ontario Case Costing Initiative (OCCI). Toronto (ON): Ontario Health and Long-Term Care; 2017: https://data.ontario.ca/dataset/ontario-case-costing-initiative-occi. Accessed July 7, 2023.
27.Ontario Case Costing Initiative. OCCI costing analysis tool. https://data.ontario.ca/dataset/ontario-case-costing-initiative-occi. Accessed 2022 Mar 15.
28.Brukinsa (zanubrutinib): Capsuels 80 mg [product monograph]. Basel (Switzerland): BeiGene Switzerland GmbH; 2021 Jul 20: https://www.beigene.com/PDF/BRUKINSACAProductMonograph_EN_2.pdf. Accessed 2023 Aug 17.
29.pan-Canadian Oncology Drug Review final clincial guidance report: Ibrutinib (Imbruvica) for Waldenstrom's macroglobulinemia. Ottawa (ON): CADTH; 2016: https://www.cadth.ca/sites/default/files/pcodr/pcodr_ibrutinib_imbruvica_wm_fn_cgr.pdf. Accessed 2023 Jul 22.
30.pan-Canadian Oncology Drug Review final clincial guidance report: Ibrutinib (Imbruvica) for mantle cell lymphoma. Ottawa (ON): CADTH; 2016: https://www.cadth.ca/sites/default/files/pcodr/pcodr_ibrutinib_imbruvica_mcl_fn_cgr.pdf. Accessed 2023 Jul 22.
31.pan-Canadian Oncology Drug Review final clincial guidance report: Ibrutinib (Imbruvica) for chronic lymphocytic leukemia/small lymphocytic lymphoma (previously untreated). Ottawa (ON): CADTH; 2016: https://www.cadth.ca/sites/default/files/pcodr/pcodr_ibrutinib_imbruvica_cll-sll_fn_cgr.pdf. Accessed 2023 Jul 22.
32.pan-Canadian Oncology Drug Review final clincial guidance report: Ibrutinib (Imbruvica) for chronic lymphocytic leukemia/small lymphocytic lymphoma (previously treated). Ottawa (ON): CADTH; 2016: https://www.cadth.ca/sites/default/files/pcodr/pcodr-ibrutinib-cll-sll-fn-cgr.pdf. Accessed 2023 Jul 22.
33.CADTH Reimbursement Review: Zanubrutinib (Brukinsa) for Waldenström macroglobulinemia. Can J Health Technol. 2022;2(2). https://www.cadth.ca/sites/default/files/DRR/2022/PC0248-Brukinsa.pdf. Accessed 2023 Aug 21.
34.Cancer Care Ontario. BEND+RITU regimen product monograph. 2023; https://www.cancercareontario.ca/en/drugformulary/regimens/monograph/46691. Accessed 2023 Aug 16.
35.Cancer Care Ontario. CYCLDEXA+RITU regimen product monograph. 2023; https://www.cancercareontario.ca/sites/ccocancercare/files/CYCLDEXARITU_HEM_NHLLO.pdf. Accessed 2023 Aug 16.
36.Cancer Care Ontario. Flud(PO)+R product monograph. 2023; https://www.cancercareontario.ca/en/drugformulary/regimens/monograph/47676. Accessed 2023 Aug 16.
37.DeltaPA. [Ottawa (ON)]: IQVIA; 2022: https://www.iqvia.com/. Accessed Aug 16, 2023.
38.Statistics Canada. Table 14-10-0064-01 Employee wages by industry, annual, median hourly wage, both sexes, full-time and part-time, 55 years and up. 2021. Accessed 2022 Apr 15.
39.Canadian Cancer Statistics Advisory Committee in collaboration with the Canadian Cancer Society, Statistics Canada and the Public Health Agency of Canada. Canadian cancer statistics 2021. Toronto (ON): Canadian Cancer Society; 2021: https://cdn.cancer.ca/-/media/files/research/cancer-statistics/2021-statistics/2021-pdf-en-final.pdf. Accessed 2023 Jun 30.
40.Paludo J, Abeykoon JP, Shreders A, et al. Bendamustine and rituximab (BR) versus dexamethasone, rituximab, and cyclophosphamide (DRC) in patients with Waldenström macroglobulinemia. Ann Hematol. 2018;97(8):1417-1425. PubMed
Appendix 1: Cost Comparison Table
Note that this appendix has not been copy-edited.
The comparators presented in the following table have been deemed to be appropriate based on feedback from clinical expert(s). Comparators may be recommended (appropriate) practice or actual practice. Existing Product Listing Agreements are not reflected in the table and as such, the table may not represent the actual costs to public drug plans.
Table 8: CADTH Cost Comparison Table for BTK Inhibitors for WM
Treatment | Strength / concentration | Form | Price | Recommended dosagea | Daily cost | 28-day cost | Annual costb |
|---|---|---|---|---|---|---|---|
Ibrutinib (Imbruvica) | 140 mg | Capsule | $99.8350c | 420 mg daily | $299.51 | $8,386 | $109,394d |
BTK inhibitor | |||||||
Zanubrutinib (Brukinsa) | 80 mg | Capsule | $67.9833 | 320 mg daily | $271.93 | $7,614 | $99,324 |
BTK = Bruton tyrosine kinase; WM = Waldenström macroglobulinemia.
Note: All prices are from the Ontario Drug Benefit Formulary or Ontario Exceptional Access Formulary (accessed July 2023), unless otherwise indicated, and do not include dispensing fees.
aAligned with associated product monograph, unless otherwise indicated.2,28
bAnnual costs are based on 365.25 days per year.
cAs submitted by the sponsor.3
dNote when ibrutinib is used in combination with rituximab, annual costs will increase by $16,632 for the first year, assuming a dosing regimen of 375 mg/m2 at weeks 1 to 4 and 17 to 20 (as informed by the iNNOVATE trial) for rituximab for patients with a body surface area of 1.8m2.
Table 9: CADTH Cost Comparison Table for Other Treatments for WM
Treatment | Strength / concentration | Form | Price | Recommended dosagea | Daily cost | 28-day cost | Annual costb |
|---|---|---|---|---|---|---|---|
Ibrutinib (Imbruvica) | 140 mg | Capsule | $99.8350c | 420 mg daily | $299.51 | $8,386 | $109,394 |
BR34 | |||||||
Bendamustine | 1 mg/mL | IV infusion 25 mg 100 mg | $315.000d $1,260.0000d | 90 mg/m2 on days 1 and 2 every 4 weeks | $157.50 | $4,410 | $57,527 |
Rituximab (biosimilar) | 10 mg/mL | IV infusion 10 mL 50 mL | $297.0000 $1,485.0000 | 375 mg/m2 every 4 weeks for 6 cycles | $74.25 | $2,079 | NA |
BR regimen | $220.50 | $6,174 | $65,892 | ||||
DRC35 | |||||||
Cyclophosphamide | 25 mg 50 mg | Tablet | $0.3545 $0.4773 | 200 mg/m2 on days 1 to 5 every 3 weeks | $0.88 | $24.64 | NA |
Dexamethasone | 4 mg/mL | IV infusion | $1.6900 | 20 mg every 3 weeks | $0.40 | $11.27 | $147 |
Rituximab (biosimilar) | 10 mg/mL | IV infusion 10 mL 50 mL | $297.0000 $1,485.0000 | 375 mg/m2 every 3 weeks for 6 cycles | $99.00 | $2,772 | NA |
DRC regimen | $99.86 | $2,796 | $12,787 | ||||
R-Fludarabine36 | |||||||
Fludarabine | 10 mg | Tablet | $41.8940 | 40 mg/m2 days 1 to 5 every 4 weeks | $53.86 | $1,508 | $19,672 |
Rituximab (biosimilar) | 10 mg/mL | IV infusion 10 mL 50 mL | $297.0000 $1,485.0000 | 375 mg/m2 every 4 weeks for 6 cycles | $74.25 | $2,079 | NA |
R-Fludarabine | $128.11 | $3,587 | $21,523 | ||||
BR = bendamustine plus rituximab; DRC = rituximab plus dexamethasone and cyclophosphamide; R-fludarabine = rituximab plus fludarabine; WM = Waldenström macroglobulinemia.
Note: All prices are from the Ontario Drug Benefit Formulary (accessed July 2023), unless otherwise indicated, and do not include dispensing fees. Assumed patient body surface area of 1.8 m2.
aAligned with associated product monograph, unless otherwise indicated.
bAnnual costs are based on 365.25 days per year.
cAs submitted by the sponsor.3
dWholesale pricing from DeltaPA.37
Appendix 2: Submission Quality
Note that this appendix has not been copy-edited.
Description | Yes or no | Comments |
|---|---|---|
Population is relevant, with no critical intervention missing, and no relevant outcome missing | Yes | No comment. |
Model has been adequately programmed and has sufficient face validity | No | The method used to calculate state membership were not aligned with best practices for a semi-Markov approach. |
Model structure is adequate for decision problem | Yes | No comment. |
Data incorporation into the model has been done adequately (e.g., parameters for probabilistic analysis) | Yes | No comment. |
Parameter and structural uncertainty were adequately assessed; analyses were adequate to inform the decision problem | No | There were calculation errors when selecting the generalized gamma curve to inform IR PFS that would not allow the model to be run probabilistically. |
The submission was well organized and complete; the information was easy to locate (clear and transparent reporting; technical documentation available in enough details) | No | The model was poorly organized and more complex than required. |
IR = ibrutinib with rituximab, PC = physician’s choice, PFS = progression-free survival.
Appendix 3: Additional Information on the Submitted Economic Evaluation
Note that this appendix has not been copy-edited.
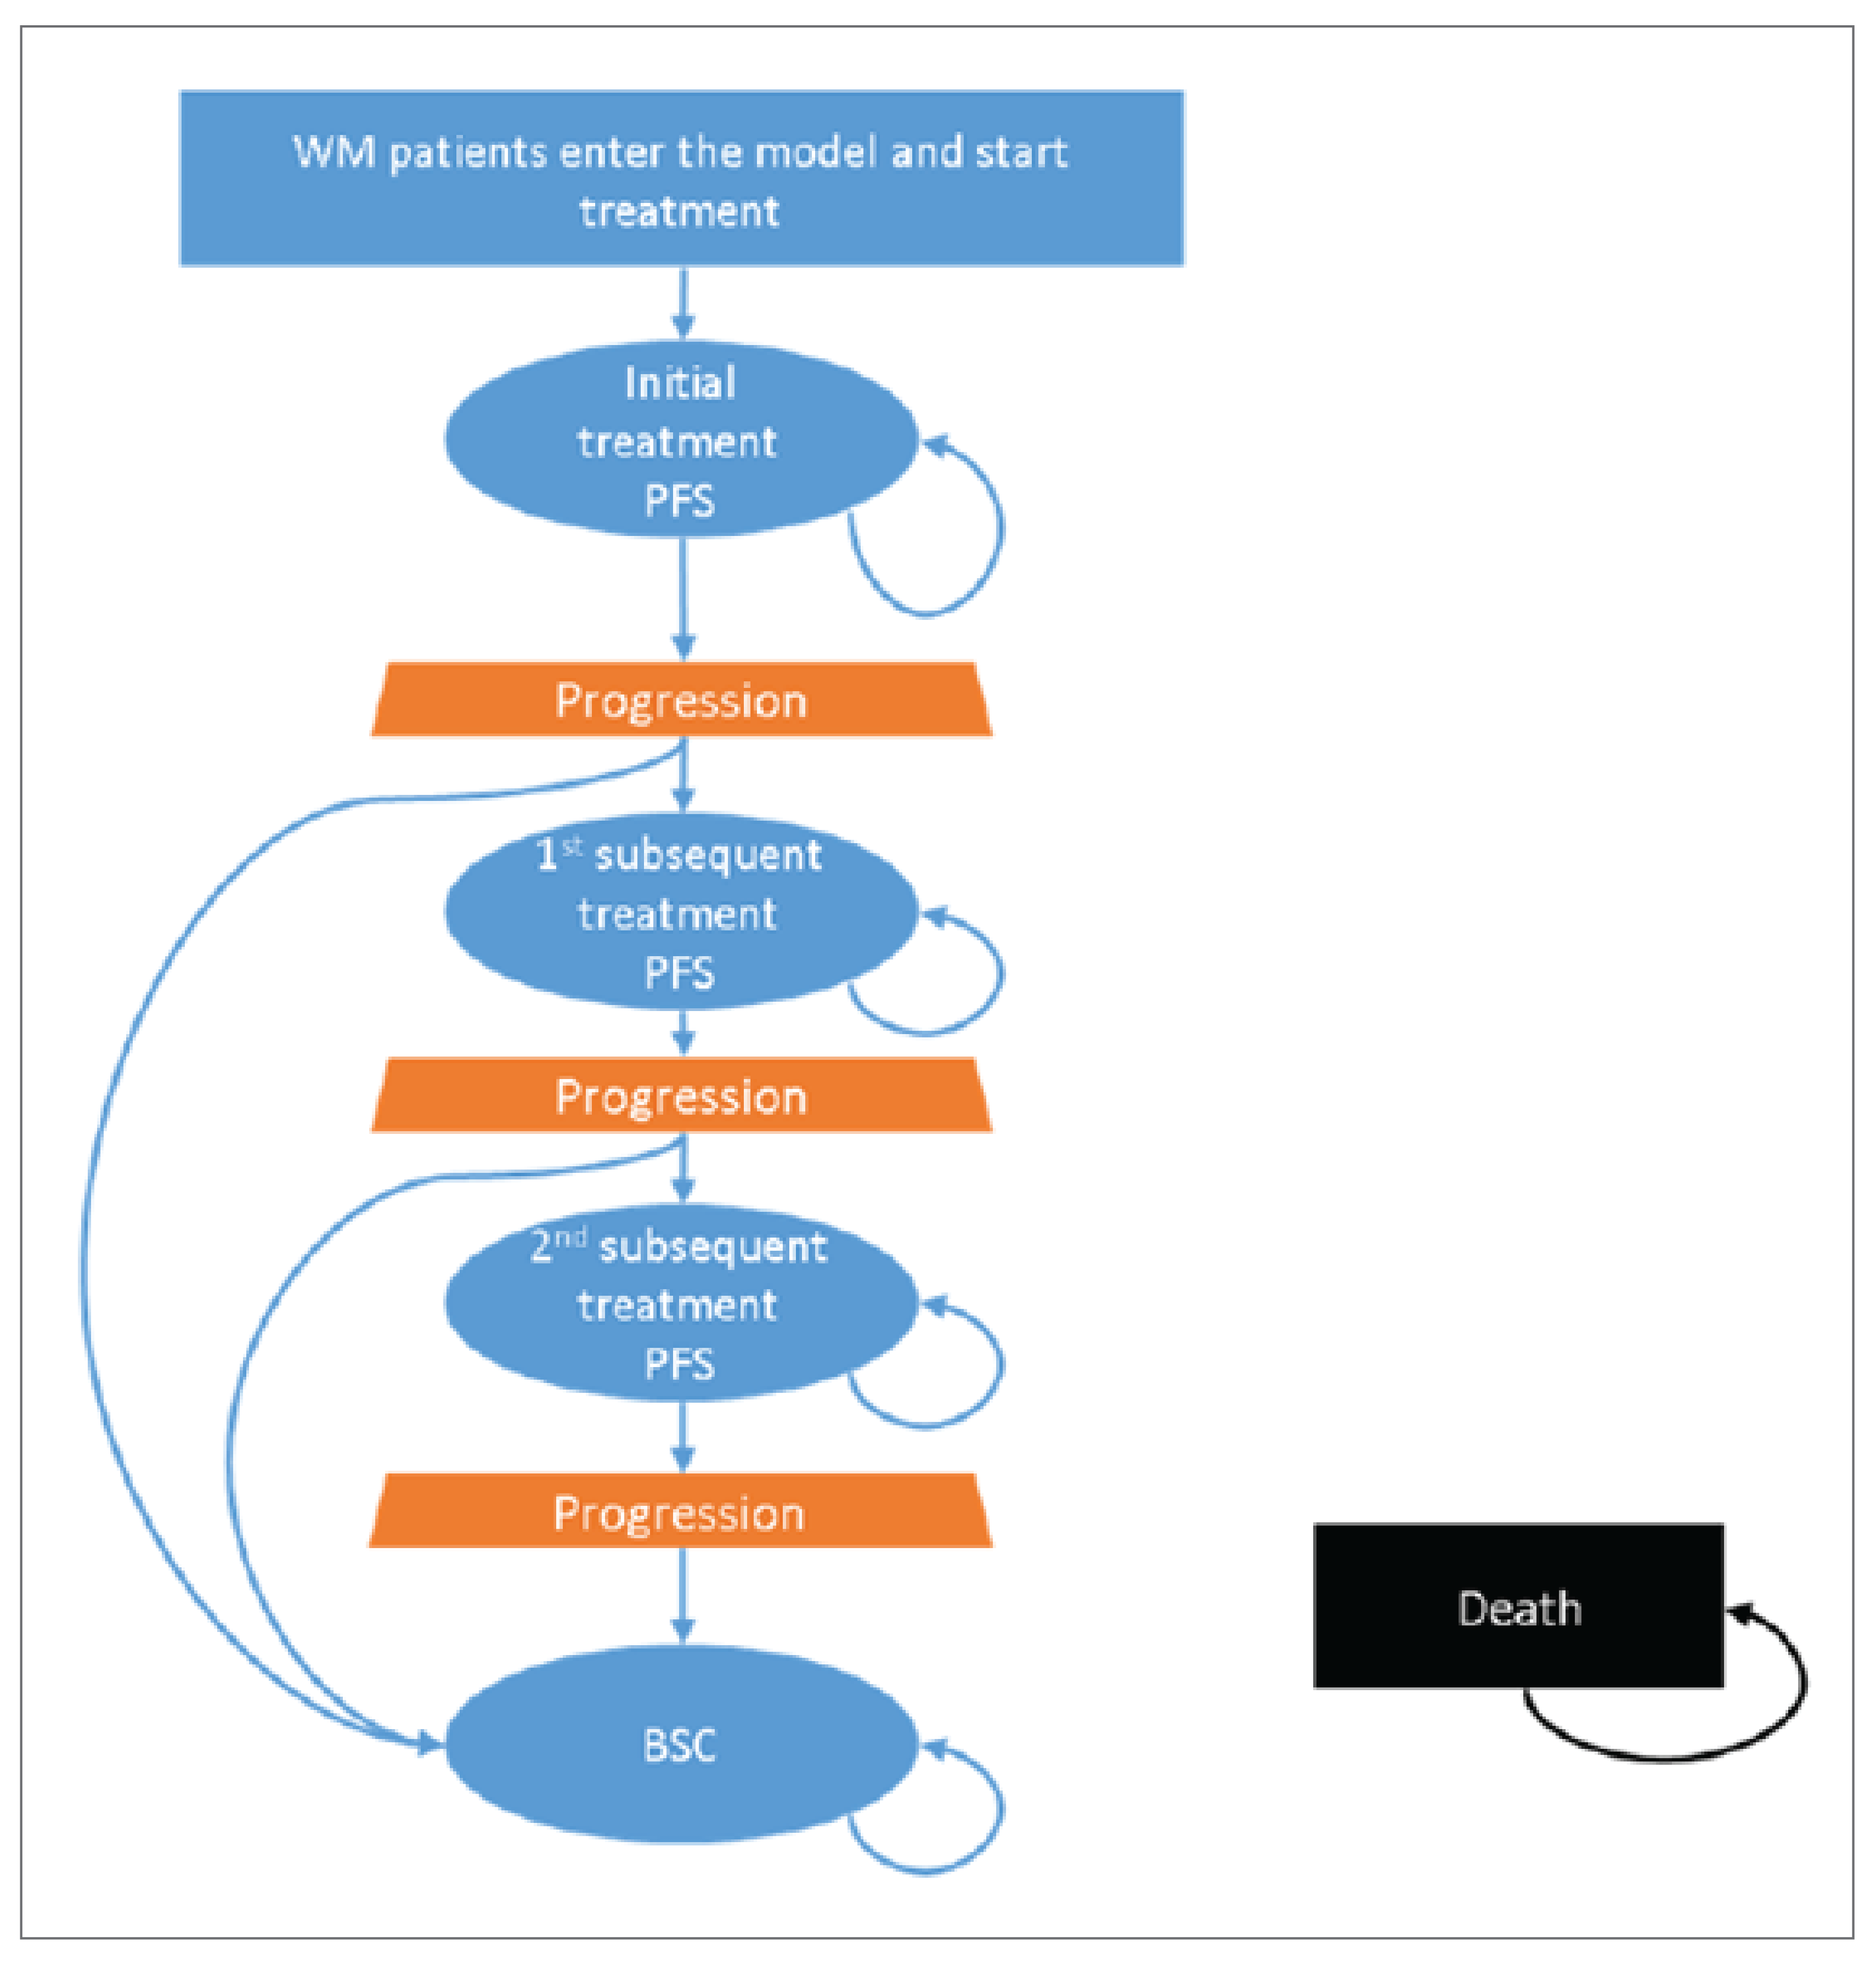
BSC = best supportive care; PFS = progression-free survival; WM = Waldenström macroglobulinemia.
Source: Sponsor’s pharmacoeconomic submission.3
Detailed Results of the Sponsor’s Base Case
Table 11: Disaggregated Mean LYs, QALYs, and Costs of the Sponsor’s Economic Evaluation Results
Parameter | IR | Rituximab | PC | Ibrutinib | Zanubrutinib |
|---|---|---|---|---|---|
Discounted LYs | |||||
Total | 11.07 | 8.07 | 6.59 | 10.55 | 10.55 |
PFS | 8.38 | 2.07 | 2.93 | 7.22 | 7.22 |
PPS | 2.69 | 6.00 | 3.66 | 3.33 | 3.33 |
Discounted QALYs | |||||
Total | 8.77 | 6.06 | 5.05 | 8.30 | 8.30 |
PFS | 6.81 | 1.68 | 2.38 | 5.87 | 5.87 |
PPS | 1.96 | 4.37 | 2.67 | 2.43 | 2.43 |
Discounted costs ($) | |||||
Total | 1,014,880 | 709,705 | 489,808 | 976,289 | 923,920 |
Total costs – PFS | 690,706 | 21,990 | 53,591 | 581,052 | 528,683 |
PFS – Drug cost (and SCT cost for PC) | 669,520 | 15,578 | 37,382 | 565,024 | 513,009 |
PFS – Administration cost | 1,554 | 1,456 | 8,937 | 0 | 0 |
PFS – MRU | 17,638 | 4,471 | 6,260 | 15,216 | 15,216 |
PFS – AE cost | 1,995 | 484 | 1,012 | 812 | 458 |
PFS – Indirect costs | 0 | 0 | 0 | 0 | 0 |
Total costs - PPS | 324,174 | 687,716 | 436,217 | 395,237 | 395,237 |
First SubTx – Drug, admin, and SCT | 201,212 | 445,994 | 275,237 | 248,843 | 248,843 |
First SubTx – MRU | 793 | 1,754 | 1,083 | 980 | 980 |
First SubTx – Indirect costs | 0 | 0 | 0 | 0 | 0 |
Second SubTx – Drug, admin, and SCT | 93,453 | 206,294 | 127,379 | 115,706 | 115,706 |
Second SubTx – MRU | 372 | 820 | 506 | 460 | 460 |
Second SubTx – Indirect costs | 0 | 0 | 0 | 0 | 0 |
BSC | 1,778 | 3,973 | 2,423 | 2,204 | 2,204 |
BSC – Indirect costs | 0 | 0 | 0 | 0 | 0 |
Terminal care | 26,567 | 28,880 | 29,589 | 27,044 | 27,044 |
AE = adverse event; BSC = best supportive care; ICER = incremental cost-effectiveness ratio; IR = ibrutinib plus rituximab; LY = life-year; MCU = medial resource use; PC = physician’s choice; PFS = progression-free survival; PPS = postprogression survival; QALY = quality-adjusted life-year; SubTx = subsequent treatment.
Source: Sponsor’s pharmacoeconomic submission.3
Table 12: Disaggregated Mean Incremental Results for IR vs. Comparators From the Sponsor’s Economic Evaluation Results
Parameter | Rituximab | PC | Ibrutinib | Zanubrutinib |
|---|---|---|---|---|
Discounted LYs | ||||
Total | 3.00 | 4.48 | 0.52 | 0.52 |
PFS | 6.31 | 5.45 | 1.16 | 1.16 |
PPS | –3.31 | –0.97 | –0.64 | –0.64 |
Discounted QALYs | ||||
Total | 2.71 | 3.72 | 0.47 | 0.47 |
PFS | 5.12 | 4.43 | 0.94 | 0.94 |
PPS | –2.41 | –0.71 | –0.47 | –0.47 |
Discounted costs ($) | ||||
Total | 305,175 | 525,073 | 38,591 | 90,960 |
Total costs – PFS | 668,716 | 637,115 | 109,654 | 162,023 |
PFS – Drug cost (and SCT cost for PC) | 653,942 | 632,138 | 104,496 | 156,511 |
PFS – Administration cost | 98 | –7,383 | 1,554 | 1,554 |
PFS – MRU | 13,166 | 11,377 | 2,422 | 2,422 |
PFS – AE cost | 1,510 | 983 | 1,182 | 1,537 |
PFS – Indirect costs | 0 | 0 | 0 | 0 |
Total costs – PPS | –363,541 | –112,043 | –71,063 | –71,063 |
First SubTx – Drug, admin, and SCT | –244,783 | –74,025 | –47,632 | –47,632 |
First SubTx – MRU | –962 | –290 | –187 | –187 |
First SubTx – Indirect costs | 0 | 0 | 0 | 0 |
Second SubTx – Drug, admin, and SCT | –112,841 | –33,926 | –22,253 | –22,253 |
Second SubTx – MRU | –448 | –134 | –88 | –88 |
Second SubTx – Indirect costs | 0 | 0 | 0 | 0 |
BSC | –2,195 | –645 | –426 | –426 |
BSC – Indirect costs | 0 | 0 | 0 | 0 |
Terminal care | –2,313 | –3,022 | –477 | –477 |
ICER | 112,579 | 141,145 | 81,700 | 192,834 |
AE = adverse event; BSC = best supportive care; ICER = incremental cost-effectiveness ratio; IR = ibrutinib plus rituximab; LY = life-year; MRU = medial resource use; PC = physician’s choice; PFS = progression-free survival; PPS = postprogression survival; QALY = quality-adjusted life-year; SCT = stem cell transplant; SubTx = subsequent treatment.
Source: Sponsor’s pharmacoeconomic submission.3
Table 13: Disaggregated Mean Incremental Results for Ibrutinib Monotherapy vs. Comparators From the Sponsor’s Economic Evaluation Results
Parameter | IR | Rituximab | PC | Zanubrutinib |
|---|---|---|---|---|
Discounted LYs | ||||
Total | –0.52 | 2.48 | 3.96 | 0.00 |
PFS | –1.16 | 5.14 | 4.29 | 0.00 |
PPS | 0.64 | –2.67 | –0.33 | 0.00 |
Discounted QALYs | ||||
Total | –0.47 | 2.24 | 3.25 | 0.00 |
PFS | –0.94 | 4.18 | 3.49 | 0.00 |
PPS | 0.47 | –1.94 | –0.24 | 0.00 |
Discounted costs ($) | ||||
Total | –38,591 | 266,584 | 486,482 | 52,369 |
Total Costs – PFS | –109,654 | 559,063 | 527,461 | 52,369 |
PFS – Drug cost (and SCT cost for PC) | –104,496 | 549,446 | 527,642 | 52,015 |
PFS – Administration cost | –1,554 | –1,456 | –8,937 | 0 |
PFS – MRU | –2,422 | 10,745 | 8,956 | 0 |
PFS – AE cost | –1,182 | 328 | –200 | 354 |
PFS – Indirect costs | 0 | 0 | 0 | 0 |
Total Costs – PPS | 71,063 | –292,478 | –40,980 | 0 |
First SubTx – Drug, admin, and SCT | 47,632 | –197,151 | –26,393 | 0 |
First SubTx – MRU | 187 | –775 | –103 | 0 |
First SubTx – Indirect costs | 0 | 0 | 0 | 0 |
Second SubTx – Drug, admin, and SCT | 22,253 | –90,589 | –11,674 | 0 |
Second SubTx – MRU | 88 | –360 | –46 | 0 |
Second SubTx – Indirect costs | 0 | 0 | 0 | 0 |
BSC | 426 | –1,769 | –219 | 0 |
BSC – Indirect costs | 0 | 0 | 0 | 0 |
Terminal care | 477 | –1,836 | –2,545 | 0 |
ICER | Less costly, less effective | 119,095 | 149,791 | Dominated |
AE = adverse event; BSC = best supportive care; ICER = incremental cost-effectiveness ratio; IR = ibrutinib plus rituximab; LY = life-year; MRU = medial resource use; PC = physician’s choice; PFS = progression-free survival; PPS = postprogression survival; QALY = quality-adjusted life-year; SCT = stem cell transplant; SubTx = subsequent treatment.
Source: Sponsor’s pharmacoeconomic submission.3
Table 14: Summary of Sponsor’s Economic Evaluation Results — Pairwise Analysis (IR vs. Comparators)
Parameter | Rituximab | PC | Ibrutinib | Zanubrutinib |
|---|---|---|---|---|
Incremental costs | 305,175 | 525,073 | 38,591 | 90,960 |
Incremental QALYs | 2.71 | 3.72 | 0.47 | 0.47 |
ICER ($ per QALY) | 112,579 | 141,145 | 81,700 | 192,834 |
IR = ibrutinib plus rituximab; PC = physician’s choice; QALY = quality-adjusted life-year; vs. = versus.
Source: Sponsor’s pharmacoeconomic submission.3
Table 15: Summary of Sponsor’s Economic Evaluation Results — Pairwise Analysis (Ibrutinib Monotherapy vs. Comparators)
Parameter | IR | Rituximab | PC | Zanubrutinib |
|---|---|---|---|---|
Incremental costs | −38,591 | 266,584 | 486,482 | 52,369 |
Incremental QALYs | −0.47 | 2.24 | 3.25 | 0.00 |
ICER ($ per QALY) | Less costly, less effective | 119,095 | 149,791 | Dominated |
IR = ibrutinib plus rituximab; PC = physician’s choice; QALY = quality-adjusted life-year; vs. = versus.
Source: Sponsor’s pharmacoeconomic submission.3
Appendix 4: Additional Details on the CADTH Reanalyses and Sensitivity Analyses of the Economic Evaluation
Note that this appendix has not been copy-edited.
Table 16: Stepped Analysis of the CADTH Economic Evaluation Results (Sequential)
Stepped analysis | Drug | Total costs | Total QALYs | Sequential ICER |
|---|---|---|---|---|
Sponsor’s base case | PC | $489,808 | 5.05 | Reference |
Zanubrutinib | $923,920 | 8.30 | $133,639 | |
IR | $1,014,880 | 8.77 | $192,834 | |
Rituximab | $709,705 | 6.06 | Extendedly dominated by zanubrutinib, IR | |
Ibrutinib | $976,289 | 8.30 | Dominated by zanubrutinib | |
CADTH reanalysis 1: Sponsor’s base case – IR, rituximab and PC comparators removed | Zanubrutinib | $923,920 | 8.30 | Reference |
Ibrutinib | $976,289 | 8.30 | Dominated by zanubrutinib | |
CADTH reanalysis 2: Ibrutinib monotherapy vs. IR HR for PFS and treatment duration | Zanubrutinib | $963,943 | 8.67 | Reference |
Ibrutinib | $1,006,613 | 8.67 | Dominated by zanubrutinib | |
CADTH reanalysis 3: Ibrutinib monotherapy AE source | Zanubrutinib | $923,920 | 8.30 | Reference |
Ibrutinib | $976,138 | 8.30 | Dominated by zanubrutinib | |
CADTH reanalysis 4: Routine care frequency | Zanubrutinib | $919,507 | 8.30 | Reference |
Ibrutinib | $971,876 | 8.30 | Dominated by zanubrutinib | |
CADTH base case | Zanubrutinib | $978,277 | 8.74 | Reference |
Ibrutinib | $1,043,580 | 8.74 | Dominated by zanubrutinib |
AE = adverse event; HR = hazard ratio; ICER = incremental cost-effectiveness ratio; IR = ibrutinib with rituximab; PC = physician’s choice, QALY = quality-adjusted life-year; RDI = relative dose intensity; vs. = versus.
Note: Stepped analyses were run deterministically, whereas the CADTH base case was run probabilistically.
Detailed Results of CADTH Base Case
Table 17: Disaggregated Results of the CADTH Economic Evaluation Results
Parameter | Ibrutinib monotherapy | Zanubrutinib | Incremental difference |
|---|---|---|---|
Discounted LYs | |||
Total | 11.03 | 11.03 | 0.00 |
PFS | 8.37 | 8.37 | 0.00 |
PPS | 2.65 | 2.65 | 0.00 |
Discounted QALYs | |||
Total | 8.74 | 8.74 | 0.00 |
PFS | 6.80 | 6.80 | 0.00 |
PPS | 1.93 | 1.93 | 0.00 |
Discounted Costs ($) | |||
Total | 1,043,580 | 978,277 | 65,303 |
Total Costs – PFS | 721,317 | 656,014 | 65,303 |
PFS – Drug cost (and SCT cost for PC) | 707,235 | 642,128 | 65,107 |
PFS – Administration cost | 0 | 0 | 0 |
PFS – MRU | 13,424 | 13,424 | 0 |
PFS – AE cost | 658 | 461 | 197 |
PFS – Indirect costs | 0 | 0 | 0 |
Total Costs – PPS | 322,263 | 322,263 | 0 |
First SubTx – Drug, admin, and SCT | 201,667 | 201,667 | 0 |
First SubTx – MRU | 609 | 609 | 0 |
First SubTx – Indirect costs | 0 | 0 | 0 |
Second SubTx – Drug, admin, and SCT | 91,840 | 91,840 | 0 |
Second SubTx – MRU | 283 | 283 | 0 |
Second SubTx – Indirect costs | 0 | 0 | 0 |
BSC | 1,349 | 1,349 | 0 |
BSC – Indirect costs | 0 | 0 | 0 |
Terminal care | 26,515 | 26,515 | 0 |
AE = adverse event; BSC = best supportive care; ICER = incremental cost-effectiveness ratio; LY = life-year; MRU = medial resource use; PC = physician’s choice; PFS = progression-free survival; PPS = postprogression survival; QALY = quality-adjusted life-year; SCT = stem cell transplant; SubTx = subsequent treatment.
Exploratory Analyses
Table 18: Summary of the CADTH Exploratory Analysis Results (Including IR and 100% RDI)
Drug | Total costs | Total QALYs | Sequential ICER |
|---|---|---|---|
Zanubrutinib | 978,277 | 8.74 | Reference |
Ibrutinib | 1,043,580 | 8.74 | Dominated by zanubrutinib |
Ibrutinib + rituximab | 1,061,428 | 8.74 | Dominated by zanubrutinib, ibrutinib |
ICER = incremental cost-effectiveness ratio; IR = ibrutinib with rituximab; QALY = quality-adjusted life-year; RDI = relative dose intensity.
Note: CADTH notes that the presented results are highly uncertain as comparative effectiveness for all included comparators were not derived from the same analysis framework and thus a sequential analysis may not be the most appropriate form of analysis.
Table 19: Summary of Changes for the CADTH Exploratory Analysis With All Comparators, Generalized Gamma Distribution of Regimens to Inform PC Costs, and 100% RDI (Deterministic)
Parameter | CADTH base case | CADTH exploratory analysis |
|---|---|---|
IR PFS | Exponential | Generalized gamma |
Included Treatments | Ibrutinib monotherapy Zanubrutinib | IR Ibrutinib monotherapy Zanubrutinib PC Rituximab |
Chemotherapy distribution informing PC costs | NA | BR: 40% DCR: 40% R-CHOP: 2.86% Chlorambucil: 2.86% R-DB: 2.86% CyBorD: 2.86% R-Fludarabine: 2.86% Fludarabine: 2.86% R-CVP: 2.86% |
RDI | NA | IR and Rituximab = 100% |
BR = bendamustine-rituximab; CyBorD = cyclophosphamide-bortezomib-dexamethasone; DRC = dexamethasone-rituximab-cyclophosphamide; ICER = incremental cost-effectiveness ratio; IR = ibrutinib with rituximab; NA = not applicable; PC = physician’s choice; PFS = progression-free survival; QALY = quality-adjusted life-year; R-CHOP = rituximab-cyclophosphamide-doxorubicin-vincristine-prednisone; R-CVP = rituximab-vincristine-cyclophosphamide-prednisone R-DB = rituximab-bortezomib-dexamethasone; RDI = relative dose intensity.
Table 20: Summary of the CADTH Exploratory Analysis Results With All Comparators, Generalized Gamma Distribution of Regimens to Inform PC Costs, and 100% RDI (Deterministic)
Drug | Total costs ($) | Total QALYs | Sequential ICER |
|---|---|---|---|
PC | 483,307 | 5.21 | Reference |
Zanubrutinib | 1,138,396 | 8.99 | 172,959 |
Rituximab | 728,191 | 6.35 | Extendedly dominated by zanubrutinib |
Ibrutinib | 1,197,964 | 8.99 | Dominated by zanubrutinib |
IR | 1,216,840 | 8.99 | Dominated by zanubrutinib, ibrutinib |
ICER = incremental cost-effectiveness ratio; IR = ibrutinib with rituximab; PC = physician’s’ choice; QALY = quality-adjusted life-year; RDI = relative dose intensity.
Note: CADTH notes that the presented results are highly uncertain as comparative effectiveness for all included comparators were not derived from the same framework and thus a sequential analysis may not be the most appropriate form of analysis.
Appendix 5: Submitted BIA and CADTH Appraisal
Note that this appendix has not been copy-edited.
Table 21: Summary of Key Take-Aways
Key take-aways of the BIA |
|---|
|
Summary of Sponsor’s BIA
The sponsor submitted a budget impact analysis (BIA) to estimate the 3-year budget impact of reimbursing ibrutinib with or without rituximab for the treatment of WM patients that were r/r to prior treatment. The analysis was taken from the perspective of the Canadian public drug plan. A 3-year time horizon was used from 2024 to 2026, with 2023 as the base year. The target population size was derived with an epidemiological approach using prevalence and incidence of WM. Key inputs to the BIA are documented in Table 22.
Table 22: Summary of Key Model Parameters
Parameter | Sponsor’s estimate (reported as year 1 / year 2 / year 3 if appropriate) |
|---|---|
Target population | |
Population in Canada38 | 39,904,847 / 40,401,438 / 40,904,208 |
WM incidence rate (per million)33 | 4a |
WM prevalence rate (per million)33 | 11.6 |
Proportion of prevalent patients in 1L treatment33 | 75% |
Proportion of prevalent patients in relapsed/refractory treatment33 | 25% |
% of WM patients eligible for public funding39 | 85.3% |
% of 1L WM patients not requiring treatment33 | 19% |
% of 1L WM patients progression to relapsed/refractory each year33 | 11.4% |
% of relapsed/refractory WM patients progressing on treatment each year33 | 25% |
Mortality rate in relapsed/refractory WM33 | 0.33%a |
% of survival progressing patients requiring subsequent treatment | 90% (assumption) |
Number of patients eligible for drug under review | 75 / 75 / 76 |
Market uptake (3 years) | |
Uptake (reference scenario) Zanubrutinib BR ± R maintenance CDR ± R maintenance Other | 60% / 60% / 60% 25% / 25% / 25% 10% / 10% / 10% 5% / 5% / 5% |
Uptake (new drug scenario) Ibrutinib monotherapy IR Zanubrutinib BR ± R maintenance CDR ± R maintenance Other | 25% / 20% / 20% 0% / 0% / 0% 35% / 40%/ 40% 25% / 25% / 25% 10% / 10% / 10% 5% / 5% / 5% |
Cost of treatment (per patient per year) | |
Cost of treatment Ibrutinib monotherapy IR Zanubrutinib BR ± R maintenance CDR ± R maintenance Otherb | $109,319 / $109,319 / $109,319 $121,793 / $109,319 / $109,319 $99,256 / $99,256 / $99,256 $54,948 / $4,158 / $0 $26,975 / $4,158 / $0 $26,934 / $252 / $0 |
1L = first line; BR = bendamustine-rituximab; CDR = dexamethasone-rituximab-cyclophosphamide; CyBorD = cyclophosphamide-bortezomib-dexamethasone; IR = ibrutinib with rituximab; R = rituximab; R-CHOP = rituximab-cyclophosphamide-doxorubicin-vincristine-prednisone; R-CVP = rituximab-vincristine-cyclophosphamide-prednisone; R-DB = rituximab-bortezomib-dexamethasone; R-fludarabine = rituximab plus fludarabine; WM = Waldenström macroglobulinemia.
aUpdated input value based on the sponsor’s response to a CADTH request for additional information.
b‘Other’ consists of R-CHOP with or with rituximab maintenance, chlorambucil, Rituximab monotherapy, R-DB, CyBorD, R-Fludarabine, Fludarabine, and R-CVP with or without rituximab maintenance. The proportion of utilization of each regimen is based on clinical expert feedback obtained by the sponsor.
The BIA compared 2 scenarios to determine the incremental budget impact of reimbursing ibrutinib with or without rituximab for the reimbursement request. The reference case scenario assumed that patients would be treated with zanubrutinib, BR with or without rituximab maintenance, CDR with or without rituximab maintenance or other immunochemotherapies. The new drug scenario included the same comparators in addition to ibrutinib monotherapy and IR. In the sponsor’s base case, costs related to drug acquisition were considered and drug wastage was included.
Key assumptions included:
Zanubrutinib is reimbursed in all participating Canadian public drug plans.
The “other” comparator consists of R-CHOP with or with rituximab maintenance, chlorambucil, Rituximab monotherapy, R-DB, CyBorD, R-Fludarabine, Fludarabine, and R-CVP with or without rituximab maintenance. The proportion of utilization of each regimen is based on clinical expert feedback obtained by the sponsor.
90% of surviving patients relapsing from initial therapy will require subsequent treatment.
Upon reimbursement, only ibrutinib monotherapy will be used, with no patients receiving ibrutinib in combination with rituximab.
Ibrutinib monotherapy will only capture market share from zanubrutinib.
Newly diagnosed incident patients would not experience relapse within the first year of diagnosis.
Summary of the Sponsor’s BIA Results
In the sponsor’s base-case analysis, the estimated incremental budget impact of funding ibrutinib with or without rituximab for the treatment of r/r WM was $187,515 in year 1, $339,394 in year 2, and $493,163 in year 3. Therefore, the 3-year incremental budget impact was $1,020,072.
CADTH Appraisal of the Sponsor’s BIA
CADTH identified several key limitations to the sponsor’s analysis that have notable implications on the results of the BIA:
Incidence WM patients were not incorporated into the eligible patient population. The sponsor’s submission included prevalent patients, but not incident patients with WM. Following an additional information request to the sponsor, it was noted that the sponsor assumed that newly diagnosed incident patients would not experience a relapse within the first year of diagnosis, aligned with findings by Paludo et al., (2018).40 While this may be appropriate for the patient’s first year with WM, the sponsor did not include the proportion of patients who progress to r/r in the subsequent years of the BIA therefore, underestimating the total eligible population in the analysis.
Due to the model structure, this limitation could not be addressed by CADTH. However, in the event that a larger number of patients are eligible for ibrutinib with or without rituximab, the budget impact of reimbursing ibrutinib would likely increase.
Market share estimates are not reflective of Canadian clinical practice. In the submitted base case, the sponsor assumed that zanubrutinib would account for 60% of the market share in the world without ibrutinib with the remaining 25%, 10% and 5% being distributed to BR ± rituximab maintenance, CDR ± rituximab maintenance or other therapies, respectively. Feedback from clinical experts consulted by CADTH noted that the market share values for zanubrutinib in the world without ibrutinib would be higher (i.e., 90%) with the remaining being distributed among the immunochemotherapy options. The sponsor further assumed that upon reimbursement, ibrutinib monotherapy would capture 25%, 20% and 20% of the market share with 100% of the uptake coming from zanubrutinib. While clinical experts consulted by CADTH agreed the market source for ibrutinib would be from zanubrutinib they noted that these estimates were overestimated based on the anticipated clinal performance and safety concerns of ibrutinib in comparison with zanubrutinib.
In the CADTH base case, the market share values in the world without ibrutinib for zanubrutinib, BR ± rituximab maintenance, CDR ± rituximab maintenance or other were assigned as 90%, 4%, 4%, and 2% respectively. CADTH further set the market share values for ibrutinib monotherapy to 20%, 15% and 10% for years 1, 2, and 3, respectively as informed by the clinical experts consulted by CADTH.
CADTH Reanalyses of the BIA
Table 23: CADTH Revisions to the Submitted BIA
Stepped analysis | Sponsor’s value or assumption | CADTH value or assumption |
|---|---|---|
Corrections to sponsor’s base case | ||
None | — | — |
Changes to derive the CADTH base case | ||
1a. World without Ibrutinib Market Shares | Zanubrutinib = 60% BR ± R Maintenance = 25% DRC ± R Maintenance = 10% Other = 5% | Zanubrutinib = 90% BR ± R Maintenance = 4% DRC ± R Maintenance = 4% Other = 2% |
1b. World with Ibrutinib Market Shares | Ibrutinib Monotherapy = 25%/ 20% / 20% IR = 0%/ 0%/ 0% Zanubrutinib = 35%/ 40%/ 40% BR ± R Maintenance = 25%/ 25%/ 25% DRC ± R Maintenance = 10%/ 10%/ 10% Other = 5%/ 5%/ 5% | Ibrutinib Monotherapy = 20%/ 15%/ 10% IR = 0%/ 0%/ 0% Zanubrutinib = 70%/ 75%/ 80% BR ± R Maintenance = 4%/ 4%/ 4% DRC ± R Maintenance = 4%/ 4%/ 4% Other = 2%/ 2%/ 2% |
CADTH base case | 1a + 1b | |
BR = bendamustine-rituximab; CDR = dexamethasone-rituximab-cyclophosphamide; IR = ibrutinib with rituximab; R = rituximab; WM = Waldenström macroglobulinemia.
The results of the CADTH stepwise reanalyses are presented in summary format in Table 24 and a more detailed breakdown is presented in Table 25.
Based on the CADTH base case, the estimated incremental budget impact of reimbursing ibrutinib is $150,012 in year 1, $263,921 in year 2, and $340,806 in year 3. Therefore, the 3-year total budget impact is $754,739.
The scenario analysis where the annal cost of ibrutinib was set equal to the lowest cost reimbursed BTK comparator (i.e., zanubrutinib) resulted in a 3-year budget impact of $0.
Table 24: Summary of the CADTH Reanalyses of the BIA
Stepped analysis | Three-year total |
|---|---|
Submitted base case | $1,020,072 |
CADTH reanalysis 1 | $754,739 |
CADTH base case | $754,739 |
BIA = budget impact analysis.
Table 25: Detailed Breakdown of the CADTH Reanalyses of the BIA
Stepped analysis | Scenario | Year 0 (current situation) | Year 1 | Year 2 | Year 3 | Three-year total |
|---|---|---|---|---|---|---|
Submitted base case | Reference | $5,693,004 | $5,951,365 | $10,722,672 | $15,444,240 | $32,118,277 |
New drug | $5,693,004 | $5,763,850 | $10,383,278 | $14,951,077 | $31,098,205 | |
Budget impact | $0 | $187,515 | $339,394 | $493,163 | $1,020,072 | |
CADTH base case | Reference | $5,693,004 | $7,092,275 | $13,975,506 | $20,880,900 | $41,948,681 |
New drug | $5,693,004 | $6,942,263 | $13,711,585 | $20,540,095 | $41,193,942 | |
Budget impact | $0 | $150,012 | $263,921 | $340,806 | $754,739 | |
CADTH scenario analysis: priced no more than least-costly reimbursed comparator | Reference | $5,693,004 | $6,942,263 | $13,711,585 | $20,540,095 | $41,193,942 |
New drug | $5,693,004 | $6,942,263 | $13,711,585 | $20,540,095 | $41,193,942 | |
Budget impact | $0 | $0 | $0 | $0 | $0 |
BIA = budget impact analysis.
Stakeholder Input
Patient Input
Waldenstrom’s Macroglobulinemia Foundation of Canada
About Waldenstrom’s Macroglobulinemia Foundation of Canada
The Waldenstrom’s Macroglobulinemia Foundation of Canada is the only patient group in Canada devoted exclusively to Waldenstrom’s macroglobulinemia (WM). We are an all-volunteer group with the exception of a paid part-time bookkeeper and we employ an audit firm for CRA required audits. Our activities are primarily split between funding WM research and providing patient support group services. We also fund (through pharmaceutical educational grants) lectures to Canadian hematologists about WM, by internationally recognized experts in this rare field. Many Canadian hematologists have never seen a case of WM before and this rare condition presents very differently from other indolent NHLs. Indeed, WM patients commonly have widely variable presentations from each other. We also provide local WM support group meetings in Canada. And we regularly provide national Zoom lectures to WM patients by leading WM experts from Calgary, Toronto, Ottawa and Boston. We maintain an active website that is full of information for patients and doctors. We have also coordinated with Beigene and Sunnybrook Hospital in Toronto to create a series of WM white board videos for newly diagnosed WM patients. These are available via our website and given physically, via a preloaded self-player, to newly diagnosed patients in Canada. Our website, in French and English, is https://www.wmfc.ca.
Information Gathering
The subject of Imbruvica comes up at all of our Support Group meetings. We also are in regular contact with Dr. Steven Treon of the Bing Center for Waldenstom’s Macroglobulinemai at the Dana Farber Cancer Institute (Harvard Medical School) in Boston, USA. And we use Dr. Neil Berinstein of Sunnybrook hospital, Toronto, as a scientific advisor. Dr. Berinstein is running the largest WM clinical trial (BRAWM) that has ever been undertaken in Canada. It will shortly be filled at 59 patients spread across Canada in five provinces.
Disease Experience
WM is very rare, and it has an amazingly wide spectrum of presentations, as it is a transition condition from lymphoma to Multiple Myeloma. The defining feature is production of monoclonal (cancer generated) IgM, a very large immunoglobulin. This immunoglobulin causes neuropathy in most patients by means of antibody reactions against the nerve’s myelin sheath and by hyperviscosity. Bleeding is another major issue as monoclonal IgM can encapsulate platelets, making them must be less effective at clotting. Few hematologists / oncologists have experience with these side effects. One of our missions is to promote a greater understanding of these rare side effects within the medical community.
Experiences With Currently Available Treatments
With respect, the WMFC has a strong objection to how CADTH undertakes reimbursement reviews for Waldenstrom’s macroglobulinemia. This is our second presentation to CADTH. The first was our objection to CADTH’s draft reimbursement review for another BTK inhibitor, Zanubrutinib (Beigene). The draft CADTH proposal called for reimbursement but only if the price was dropped by 93%, in order to compete with the comparator treatment. But CADTH did not state what the comparator was. The WMFC formally challenged that assertion as being unscientific and stated that the comparator had to be named. CADTH refused to supply the name and hence it refused to supply the scientific justification for its assertion in the final report. The math would suggest that CADTH used the repeating of bendamustine and rituximab (BR) after relapse but also used the primary treatment results again as well. That was an error. Please note, BR is the most cost-effective front-line treatment out there as it provides median remissions of seven years. But re-challenging with BR, after relapse, provides a median remission of significantly less than twelve months. That stat comes from Dr. Steven Treon, who is the most widely respected WM expert out there. BTK inhibitors have been the de facto second line treatment in Canada these last few years. That was made possible by compassionate access programs at Janssen and Beigene. The provincial health ministries in Quebec, Ontario, Alberta and British Columbia went to their lymphoma tumour group experts and decided to ignore the CADTH funding recommendation and these provinces are now fully covering Zanubrutinib for WM in relapse. And the best way to get the price down? Competition.
Improved Outcomes
Lymphoma Canada has covered this extremely well in their submission. The WMFC will simply state that there is no second line treatment out there that is as medically effective as BTK inhibitors like Ibrutinib, Zanubrutiinib and Acalabrutinib. And there is no second line treatment that is more cost effective than BTK inhibitors. If CADTH insists that there is, CADTH has to name the comparator. Anything less would be unscientific.
Experience With Drug Under Review
The best patient summaries are not anecdotal but scientific. Zanubrutinib is both approved and funded in many provinces for relapsed WM. It has been tested against Ibrutinib in a large Ph III WM clinical trial, the ASPEN trial, which CADTH has examined. No examination of Ibrutinib can take place without studying the ASPEN trial. The initial report is carried in the journal Blood https://www.ncbi.nlm.nih.gov/pmc/articles/PMC7596850/. This was updated at the AMERICAN Society of Clinical Oncology annual meeting in 2022. https://meetings.asco.org/abstracts-presentations/207258. The drugs are equivalent in effectiveness but have somewhat different toxicity profiles. Zanubrutinib causes more neutropenia than Ibrutinib. Ibrutinib causes more bleeding disorders than Zanubrutinib. WM by itself can cause both of these conditions. So, a doctor can pick the toxicity profile that is most beneficial to the patient. This is an important medical option. And competition between the two pharmaceutical companies can only lead to competitive pricing. Ibrutinib and Zanubrutinib have been proven in the Ph III ASPEN trial to be equally effective in controlling WM. Only their toxicity profile is slightly different. Zanubrutinib is now fully funded within Canada’s four largest provinces. It is time to have Ibrutinib funded. The WMFC is very interested in stretching health care dollars. We believe that financial competition between the makers of Ibrutinib and Zanubrutinib will be beneficial to the Canadian health care system by reducing costs through competition.
Companion Diagnostic Test
The WMFC does not consider this a relevant point in this submission. What are relevant are a patient’s wellbeing and public costs.
Anything Else?
WM is a rare condition with highly unusual and often debilitating symptoms. The number of newly diagnosed WM patients each year in Canada is believed to be 150 +/-. The WMFC would request that CADTH respect the input of the provincial lymphoma tumour groups. They have already spoken and called for the use and reimbursement of Zanubrutinib as the most effective WM treatment after relapse. The ASPEN trial has proven that Ibrutinib is equally effective. The WMFC would ask CADTH to approve reimbursement without specifying a price. Let market economies work to lower prices through competition. The third covalent BTK inhibitor in Canada is Acalabrutiinib. While not yet approved for WM it is nonetheless being used in the BRAWM trial, a groundbreaking Canadian trial for WM. The non-covalent BTK inhibitors, Nemtabrutinib and Pirtobrutinib are also in trial in Canada. But these two have a different binding site than the covalent BTKs, Ibrutinib, Zanubrutinib and Acalabrutinib.
Conflict of Interest Declaration — Waldenstrom’s Macroglobulinemia Foundation of Canada
To maintain the objectivity and credibility of the CADTH reimbursement review process, all participants in the drug review processes must disclose any real, potential, or perceived conflicts of interest. This Patient Group Conflict of Interest Declaration is required for participation. Declarations made do not negate or preclude the use of the patient group input. CADTH may contact your group with further questions, as needed.
Did you receive help from outside your patient group to complete this submission? If yes, please detail the help and who provided it.
Dr. Steven Treon, Professor of Medicine at Harvard University, provided the feedback about BR being used again after a WM patient relapses. He is the Medical Director of the Bing Center for Waldenstrom’s Macroglobulinemia at the Dana-Farber Cancer institute (Harvard’s cancer hospital) in Boston, USA.
Did you receive help from outside your patient group to collect or analyze data used in this submission?
Not applicable.
List any companies or organizations that have provided your group with financial payment over the past 2 years AND who may have direct or indirect interest in the drug under review.
Table 1: Financial Disclosures for Waldenstrom’s Macroglobulinemia Foundation of Canada
Company | $0 to 5,000 | $5,001 to 10,000 | $10,001 to 50,000 | In Excess of $50,000 |
|---|---|---|---|---|
Beigene (Zanubrutinib) | — | — | — | X |
Clinician Input
Ontario Health (Cancer Care Ontario) Hematology Cancer Drug Advisory Committee
About Ontario Health (Cancer Care Ontario) Hematology Cancer Drug Advisory Committee
OH-CCO’s Cancer Drug Advisory Committees provide timely evidence-based clinical and health system guidance on drug-related issues in support of CCO’s mandate, including the Provincial Drug Reimbursement Programs (PDRP) and the Systemic Treatment Program.
Information Gathering
Information was gathered via videoconferencing.
Current Treatments and Treatment Goals
Currently for R/R WM, zanubrutinib is a treatment option available through EAP. Other alternatives include chemotherapy (such as bendamustine or CVP) in combination with rituximab, or bortezomib.
The goals with this treatment are to reduce paraprotein levels, reduce symptoms, improve blood counts and quality of life.
Treatment Gaps (Unmet Needs)
Considering the treatment goals, please describe goals (needs) that are not being met by currently available treatments.
Given the availability of a BTK inhibitor, this treatment does not address any treatment gaps. It is not clear if the addition of rituximab may be beneficial compared to a BTK inhibitor alone.
Place in Therapy
How would the drug under review fit into the current treatment paradigm?
This drug (ibrutinib alone or ibrutinib+rituximab) would be an alternative option in second line or beyond. Ibrutinib may be an option in patients who experience intolerance to zanubrutinib.
Which patients would be best suited for treatment with the drug under review? Which patients would be least suitable for treatment with the drug under review?
Patients least suited include those with relative contraindications to BTK inhibitor therapy and/or with a history of a severe reaction to rituximab.
What outcomes are used to determine whether a patient is responding to treatment in clinical practice? How often should treatment response be assessed?
IgM and paraprotein levels, blood counts, symptom burden are used to assess if patient is responding to treatment.
What factors should be considered when deciding to discontinue treatment with the drug under review?
Significant intolerance (bleeding, atrial fibrillation), disease progression or lack of response is considered when deciding to discontinue treatment.
What settings are appropriate for treatment with [drug under review]? Is a specialist required to diagnose, treat, and monitor patients who might receive [drug under review]?
Outpatient setting.
Additional Information
Not applicable.
Conflict of Interest Declarations — Ontario Health (Cancer Care Ontario) Hematology Cancer Drug Advisory Committee
To maintain the objectivity and credibility of the CADTH drug review programs, all participants in the drug review processes must disclose any real, potential, or perceived conflicts of interest. This conflict of interest declaration is required for participation. Declarations made do not negate or preclude the use of the clinician group input. CADTH may contact your group with further questions, as needed. Please refer to the Procedures for CADTH Drug Reimbursement Reviews (section 6.3) for further details.
Did you receive help from outside your clinician group to complete this submission? If yes, please detail the help and who provided it.
OH-CCO provided secretariat function to the group.
Did you receive help from outside your clinician group to collect or analyze any information used in this submission?
No.
List any companies or organizations that have provided your group with financial payment over the past two years AND who may have direct or indirect interest in the drug under review. Please note that this is required for each clinician who contributed to the input.
Declaration for Clinician 1
Name: Dr. Tom Kouroukis
Position: Lead, Ontario Health (Cancer Care Ontario) Hematology Cancer Drug Advisory Committee
Date: 08-06-2023
Table 2: COI Declaration for OH-CCO Hematology Cancer Drug Advisory Committee — Clinician 1
Company | $0 to $5,000 | $5,001 to $10,000 | $10,001 to $50,000 | In Excess of $50,000 |
|---|---|---|---|---|
No COI | — | — | — | — |
Declaration for Clinician 2
Name: Dr. Pierre Villeneuve
Position: Member, Ontario Health (Cancer Care Ontario) Hematology Cancer Drug Advisory Committee
Date: 08-06-2023
Table 3: COI Declaration for OH-CCO Hematology Cancer Drug Advisory Committee — Clinician 2
Company | $0 to $5,000 | $5,001 to $10,000 | $10,001 to $50,000 | In Excess of $50,000 |
|---|---|---|---|---|
No COI | — | — | — | — |
Declaration for Clinician 3
Name: Dr. Joanna Graczyk
Position: Member, Ontario Health (Cancer Care Ontario) Hematology Cancer Drug Advisory Committee
Date: 08-06-2023
Table 4: COI Declaration for OH-CCO Hematology Cancer Drug Advisory Committee — Clinician 3
Company | $0 to $5,000 | $5,001 to $10,000 | $10,001 to $50,000 | In Excess of $50,000 |
|---|---|---|---|---|
No COI | — | — | — | — |
Declaration for Clinician 4
Name: Dr. Lee Mozessohn
Position: Member, Ontario Health (Cancer Care Ontario) Hematology Cancer Drug Advisory Committee
Date: 08-06-2023
Table 5: COI Declaration for OH-CCO Hematology Cancer Drug Advisory Committee — Clinician 4
Company | $0 to $5,000 | $5,001 to $10,000 | $10,001 to $50,000 | In Excess of $50,000 |
|---|---|---|---|---|
No COI | — | — | — | — |
Declaration for Clinician 5
Name: Mark Brown
Position: Member, Ontario Health (Cancer Care Ontario) Hematology Cancer Drug Advisory Committee
Date: 08-06-2023
Table 6: COI Declaration for OH-CCO Hematology Cancer Drug Advisory Committee — Clinician 5
Company | $0 to $5,000 | $5,001 to $10,000 | $10,001 to $50,000 | In Excess of $50,000 |
|---|---|---|---|---|
Janssen | X | — | — | — |
ISSN: 2563-6596
Disclaimer: The information in this document is intended to help Canadian health care decision-makers, health care professionals, health systems leaders, and policy-makers make well-informed decisions and thereby improve the quality of health care services. While patients and others may access this document, the document is made available for informational purposes only and no representations or warranties are made with respect to its fitness for any particular purpose. The information in this document should not be used as a substitute for professional medical advice or as a substitute for the application of clinical judgment in respect of the care of a particular patient or other professional judgment in any decision-making process. The Canadian Agency for Drugs and Technologies in Health (CADTH) does not endorse any information, drugs, therapies, treatments, products, processes, or services.
While care has been taken to ensure that the information prepared by CADTH in this document is accurate, complete, and up-to-date as at the applicable date the material was first published by CADTH, CADTH does not make any guarantees to that effect. CADTH does not guarantee and is not responsible for the quality, currency, propriety, accuracy, or reasonableness of any statements, information, or conclusions contained in any third-party materials used in preparing this document. The views and opinions of third parties published in this document do not necessarily state or reflect those of CADTH.
CADTH is not responsible for any errors, omissions, injury, loss, or damage arising from or relating to the use (or misuse) of any information, statements, or conclusions contained in or implied by the contents of this document or any of the source materials.
This document may contain links to third-party websites. CADTH does not have control over the content of such sites. Use of third-party sites is governed by the third-party website owners’ own terms and conditions set out for such sites. CADTH does not make any guarantee with respect to any information contained on such third-party sites and CADTH is not responsible for any injury, loss, or damage suffered as a result of using such third-party sites. CADTH has no responsibility for the collection, use, and disclosure of personal information by third-party sites.
Subject to the aforementioned limitations, the views expressed herein are those of CADTH and do not necessarily represent the views of Canada’s federal, provincial, or territorial governments or any third party supplier of information.
This document is prepared and intended for use in the context of the Canadian health care system. The use of this document outside of Canada is done so at the user’s own risk.
This disclaimer and any questions or matters of any nature arising from or relating to the content or use (or misuse) of this document will be governed by and interpreted in accordance with the laws of the Province of Ontario and the laws of Canada applicable therein, and all proceedings shall be subject to the exclusive jurisdiction of the courts of the Province of Ontario, Canada.
The copyright and other intellectual property rights in this document are owned by CADTH and its licensors. These rights are protected by the Canadian Copyright Act and other national and international laws and agreements. Users are permitted to make copies of this document for non-commercial purposes only, provided it is not modified when reproduced and appropriate credit is given to CADTH and its licensors.
Redactions: Confidential information in this document may be redacted at the request of the sponsor in accordance with the CADTH Drug Reimbursement Review Confidentiality Guidelines
Stakeholder Input: The views expressed in each submission are those of the submitting organization or individual; not necessarily the views of CADTH or of other organizations. As such, they are independent of CADTH and do not necessarily represent or reflect the view of CADTH. No endorsement by CADTH is intended or should be inferred. By filing with CADTH, the submitting organization or individual agrees to the full disclosure of the information. CADTH does not edit the content of the submissions.
CADTH does use reasonable care to prevent disclosure of personal information in posted material; however, it is ultimately the submitter’s responsibility to ensure no identifying personal information or personal health information is included in the submission. The name of the submitting organization or individual and all conflict of interest information are included in the submission; however, the name of the author, including the name of an individual patient or caregiver submitting the patient input, are not posted.
Accessibility: CADTH is committed to treating people with disabilities in a way that respects their dignity and independence, supports them in accessing material in a timely manner, and provides a robust feedback process to support continuous improvement. All materials prepared by CADTH are available in an accessible format. Where materials provided to CADTH by a submitting organization or individual are not available in an accessible format, CADTH will provide a summary document upon request. More details on CADTH’s accessibility policies can be found here.
About CADTH: CADTH is an independent, not-for-profit organization responsible for providing Canada’s health care decision-makers with objective evidence to help make informed decisions about the optimal use of drugs, medical devices, diagnostics, and procedures in our health care system.
Funding: CADTH receives funding from Canada’s federal, provincial, and territorial governments, with the exception of Quebec.