Drugs, Health Technologies, Health Systems
Reimbursement Review
Enfortumab Vedotin (Padcev)
Sponsor: Seagen Canada Inc.
Therapeutic area: Metastatic urothelial cancer
This multi-part report includes:
Clinical Review
Pharmacoeconomic Review
Clinical Review
Abbreviations
ADC
antibody drug conjugate
AE
adverse event
AESI
adverse event of special interest
BCC
Bladder Cancer Canada
BICR
blinded independent central review
CDA-AMC
Canada’s Drug Agency
CI
confidence interval
DAC
Drug Advisory Committee
DOR
duration of response
ECOG PS
Eastern Cooperative Oncology Group Performance Status
EORTC QLQ-C30
European Organisation for Research and Treatment of Cancer Quality of Life Core 30
EQ VAS
EQ visual analogue scale
EV + P
enfortumab vedotin plus pembrolizumab
GEM
gemcitabine
GHS
Global Health Status
GRADE
Grading of Recommendations Assessment, Development and Evaluation
HR
hazard ratio
HRQoL
health-related quality of life
ITT
intention to treat
MID
minimal important difference
MMAE
monomethyl auristatin E
ORR
objective response rate
OS
overall survival
PFS
progression-free survival
PLAT
platinum-based chemotherapy (cisplatin or carboplatin)
PLAT + GEM
platinum-based chemotherapy (cisplatin or carboplatin) plus gemcitabine
PRO
patient-reported outcome
QoL
quality of life
RECIST 1.1
Response Evaluation Criteria in Solid Tumours Version 1.1
SAE
serious adverse event
SD
standard deviation
TEAE
treatment-emergent adverse event
UC
urothelial cancer
Executive Summary
An overview of the submission details for the drug under review is provided in Table 1.
Table 1: Background Information of Application Submitted for Review
Item | Description |
|---|---|
Drug product, strength, formulation | Enfortumab vedotin (Padcev), 10 mg per mL (single-dose vials containing 20 mg and 30 mg of enfortumab vedotin), lyophilized powder for solution for IV infusion |
Sponsor | Seagen Canada Inc. (now part of Pfizer Canada ULC) |
Indication | In combination with pembrolizumab, for the treatment of adult patients with unresectable locally advanced or metastatic urothelial cancer with no prior systemic therapy for metastatic urothelial cancer |
Reimbursement request | As per indication |
Health Canada approval status | NOC |
Health Canada review pathway | Priority review and Project Orbis |
NOC date | August 20, 2024 |
NOC = Notice of Compliance.
Introduction
Urothelial carcinoma can begin in the renal collecting duct, the ureters, or urethra, in addition to the bladder, and accounts for approximately 90% of all bladder cancer cases.1,2 Bladder cancer is the fifth most common cancer in Canada, where an estimated 13,400 new cases of bladder cancer occurred in 2023.3 The mean age of diagnosis is 73 years, and about 90% of patients with bladder cancer are older than 55 years.4 Between 20% and 40% of patients with bladder cancer develop metastatic disease.1 Regional metastasis is referred to as locally advanced urothelial carcinoma, and distant metastasis is referred to as metastatic urothelial carcinoma. Both locally advanced and metastatic urothelial carcinoma are incurable, aggressive malignancies. Despite recent treatment advances, patients with locally advanced or metastatic urothelial cancer (UC) have a 5-year survival rate of only 5%.5,6 Pathological staging is considered the gold standard.7,8 Patients with locally advanced or metastatic UC report high symptom burden, including pain, impaired quality of life (QoL), reduced physical and emotional functioning, blood in urine, fatigue, and difficulty urinating.9,10 Patients have also reported being affected by stress, impaired emotional well-being, and loss of sleep.10,11 Patients’ ability to work, travel, exercise, and engage in social activities were among the most severely affected day-to-day activities.9 The current number of patients with bladder cancer was estimated using the prevalence of bladder cancer in Canada in the past 5 years.3,12 Of patients with locally advanced or metastatic UC, more than 35% would be expected to receive first-line systemic treatment with platinum-based chemotherapy.13 The best estimated prevalence of patients eligible for first-line systemic therapy for locally advanced or metastatic UC is 926 (range, 695 to 1,158).14
The goal of the treatment of locally advanced or metastatic UC is to delay disease progression, prolong life while minimizing symptoms, improve health-related quality of life (HRQoL), increase the ability to maintain employment and independence, and reduce burdens on caregivers.10 Based on a 2019 consensus statement by the Canadian Urological Association and Genitourinary Medical Oncologists of Canada15 and a 2020 management algorithm from a Canadian national, multidisciplinary working group,16 the recommended and preferred regimen for the first-line treatment of locally advanced or metastatic UC is platinum-based chemotherapy (PLAT) in the form of cisplatin plus gemcitabine (GEM) or carboplatin plus GEM. Carboplatin plus GEM is the recommended and preferred regimen in patients who are cisplatin-ineligible.17 The reasons for ineligibility for cisplatin are largely based on the Galsky criteria. Rarely, patients who have received adjuvant chemotherapy and progressed within 12 months may receive pembrolizumab in the first-line setting.18 For the subset of patients who do not progress during or after platinum-based chemotherapy (those who do not attain a complete response, partial response, or stable disease), avelumab maintenance therapy can be given, according to Cancer Care Alberta, Cancer Care Ontario, and the Canada’s Drug Agency (CDA-AMC) Provisional Funding Algorithm.2,18,19 The clinical experts consulted for this review indicated that, in Canada, platinum-based chemotherapy (cisplatin or carboplatin) plus gemcitabine (PLAT + GEM) followed with avelumab is considered the first-line treatment for patients who responded to PLAT + GEM without progression (i.e., attained a complete response, partial response, or stable disease). Despite current treatments, patients with metastatic disease have a 5-year survival rate of 5%.5,6 Based on real-world evidence in Alberta, the median overall survival (OS) from the time of initiation of first-line systemic therapy was only 9.1 months.13 Cisplatin is associated with cumulative toxicities leading to nephrotoxicity, neuropathy, ototoxicity, acute gastrointestinal toxicity, and myelosuppression.20-22 Carboplatin is associated with thrombocytopenia with bleeding, anemia, leukopenia, neutropenia, febrile neutropenia, renal toxicity, and mucositis.23-28 As well, only some patients will respond to platinum-based chemotherapy, and fewer patients would receive and respond to avelumab maintenance. Based on real-world data generated by Oncology Outcomes in Alberta, only 35% of patients with de novo and recurrent metastatic UC receive first-line systemic therapy; the majority of patients do not receive any systemic therapy.13,29 Of those treated with first-line platinum-based chemotherapy, only 38% of patients were eligible for avelumab. In the real world, 30% of patients treated with first-line platinum-based chemotherapy receive avelumab maintenance. There is a significant unmet need for new therapies that increase survival with a manageable safety profile and maintain QoL.
Enfortumab vedotin is an antibody drug conjugate (ADC) directed against nectin-4, an adhesion protein on the surface of most UC cells. Enfortumab vedotin is an antineoplastic, lyophilized powder for solution for IV infusion only as 20 mg and 30 mg single-use vials. When given in combination with pembrolizumab, the recommended dose of enfortumab vedotin is 1.25 mg/kg (up to a maximum of 125 mg for patients ≥ 100 kg) administered as an IV infusion over 30 minutes on days 1 and 8 of a 21-day cycle until disease progression or unacceptable toxicity. Enfortumab vedotin was previously reviewed by CDA-AMC (then CADTH) in 2022 and the CADTH pan-Canadian Oncology Review Expert Review Committee recommended that enfortumab vedotin be reimbursed for the treatment of patients with locally advanced or metastatic UC who have previously received a PD-1 or PD-L1 inhibitor and who have received a platinum-containing chemotherapy in the neoadjuvant or adjuvant locally advanced or metastatic setting. The FDA has approved enfortumab vedotin (Padcev, Astellas Pharma) in combination with pembrolizumab (Keytruda, Merck) for patients with locally advanced or metastatic UC. The FDA previously granted accelerated approval to this combination for patients with locally advanced or metastatic UC who are ineligible for cisplatin-containing chemotherapy. Enfortumab vedotin has not been filed or reviewed by the European Medicines Agency. Enfortumab vedotin is undergoing a priority Project Orbis review by Health Canada. The sponsor’s reimbursement request is in combination with pembrolizumab for the treatment of patients with locally advanced or metastatic UC. The request aligns with the Health Canada–approved indication.
Perspectives of Patients, Clinicians, and Drug Programs
The information in this section is a summary of input provided by the patient and clinician groups who responded to a CDA-AMC call for input and from clinical experts consulted for the purpose of this review.
Patient Input
The review team received 1 submission from Bladder Cancer Canada (BCC), a registered national charity in Canada serving those facing a bladder cancer diagnosis. Their objectives are to help patients with bladder cancer and their support teams, increase awareness of bladder cancer, and fund research.
Data from 7 patients and 2 caregivers were collected by BCC through an online survey conducted between April 17 and May 29, 2024. Overall, 7 survey respondents were from Canada, 1 was from the US, and the origin of 1 was unknown. All of the survey respondents had experience with locally advanced or metastatic UC, and 7 respondents (5 patients and 2 caregivers) had treatment experience with enfortumab vedotin in combination with pembrolizumab (EV + P).
According to BCC, the most reported cancer symptoms were blood in urine (88%), fatigue (63%), and bone pain (50%). Blood in urine and frequent urination were cited in interviews as the most difficult symptoms to tolerate. It was also noted that frequent urination could interfere with the patient’s ability to sleep.
The BCC input noted that respondents had treatment experience with GEM, cisplatin, carboplatin, paclitaxel, radiation, transurethral resection of bladder tumour procedures, radical cystectomy, and neobladder reconstruction. Among the respondents, 6 had received platinum-based chemotherapy, while 3 had received enfortumab vedotin as their first IV treatment. BCC added that, based on respondents’ answers, current therapies are broadly adequate for managing patient symptoms, and the most reported side effects of these treatments were fatigue (67%), loss of appetite (44%), neuropathy (44%), and hair loss (44%). Fatigue and neuropathy were the most difficult side effects to tolerate. Three respondents reported screening problems that delayed access to treatment and may have affected health outcomes. One respondent reported difficulty accessing treatment because of the distance to the nearest large urban centre. BCC noted that respondents strongly prioritize health outcomes and are willing to accept more aggressive side effects.
Experience With Drug Under Review
According to BCC, when 7 patients were asked to rate how their life had changed on enfortumab vedotin compared to other therapies that they had received, maintaining QoL received the highest average score, followed by drug side effects, cancer symptoms, controlling disease progression, and preventing recurrence. Two respondents noted that, while this treatment was effective for soft-tissue tumours, it failed to control the growth of bone metastases. BCC reported that hair loss and nausea were the most commonly reported side effects (43% each, n = 7).
The BCC input noted that, when respondents were asked to rate the tolerability of the side effects associated with enfortumab vedotin on a scale from 1 (completely tolerable) to 10 (completely intolerable), the average score was 6.0 (3 patients and 1 caregiver supplied a score of 1, while 2 patients and 1 caregiver supplied scores of 8 or higher). Additionally, BCC reported that 1 caregiver indicated that the worst side effects occurred during the first week of treatment and largely cleared up afterward; by contrast, 1 patient indicated that the side effects built up over time. BCC added that 1 patient reported dose reductions as a result of adverse events (AEs), and 1 patient reported a dose reduction because of concerns about peripheral neuropathy.
The BCC input stated that, when patients were asked to rate how the side effects associated with enfortumab vedotin had affected different aspects of their life, the highest average score was for ability to sleep, followed by ability to work, ability to spend time with family and friends, ability to perform household chores, and ability to care for children. BCC added that the treatment appeared to have a moderately negative effect in most areas of life, but this effect was particularly dramatic with respect to the respondents’ ability to care for children.
According to BCC, 1 patient reported a lack of geographical accessibility.
Clinician Input
Input From Clinical Experts Consulted for the Review
The following input was provided by 2 clinical specialists with expertise in the diagnosis and management of UC.
Unmet Needs
The clinical experts indicated that the goal of the treatment for patients with incurable locally advanced or metastatic UC is to reduce cancer burdens and improve the quantity and QoL. Only about one-half of patients respond to the standard of care of PLAT + GEM. With chemotherapy alone, the average survival of these patients is 14 to 18 months, and this improves to about 16 to 20 months with the addition of avelumab maintenance therapy. These treatments also have adverse effects that can diminish the QoL, and almost no patients are cured. One clinical expert indicated that, although some slow advances have been made in treating metastatic UC, the majority of patients die swiftly from their disease. Treatments that significantly prolong OS (particularly in an unselected population) and provide more frequent and prolonged disease control are therefore needed.
Place in Therapy
The clinical experts noted that the first line of the standard-of-care pharmaceutical therapy for patients with incurable locally advanced or metastatic UC is platinum-based combination chemotherapy. The clinical experts emphasized that, for patients who do not progress during or after platinum-based chemotherapy (i.e., attained a complete response, partial response, or stable disease), PLAT + GEM followed by avelumab maintenance treatment is considered the first-line treatment for this setting. The clinical experts indicated that, technically, the most relevant comparator is chemotherapy followed by maintenance immunotherapy in patients who were not progressing. Patients who progress despite chemotherapy are offered immunotherapy with pembrolizumab. Supportive treatments may also include analgesics for pain, palliative radiotherapy, bisphosphonates, and palliative care referral. Patients with progressive cancer despite immunotherapy may be offered enfortumab vedotin monotherapy or, if their tumour has a FGFR alteration, erdafitinib may be offered. The clinical experts stated that platinum-based chemotherapy typically consists of GEM with either cisplatin or carboplatin, or, less commonly, dose-intense methotrexate, vinblastine sulphate, doxorubicin hydrochloride (Adriamycin), and cisplatin, which includes granulocyte colony-stimulating factor support. The clinical experts also noted that a randomized trial (Checkmate 901)30 that added concurrent and maintenance nivolumab to GEM plus cisplatin found evidence of an OS benefit. Although nivolumab is not approved for this indication, because it is available in Canada and commonly used for many other cancers, it could also be considered a comparator for patients eligible for cisplatin. One clinical expert indicated that economic comparators must include the maintenance avelumab portion of first-line treatment. The expert estimated that roughly 65% to 75% of patients would not progress on platinum-based chemotherapy and would be offered or be eligible for maintenance avelumab until progression. One expert indicated that, in real-world clinical practice, not all patients who are eligible for avelumab actually receive avelumab, estimating that approximately 30% of the patients receiving PLAT + GEM treatment actually receive avelumab in the real world.
The clinical experts emphasized that EV + P has the highest reported tumour response rate in incurable UC. In addition, the median OS in the EV + P arm was almost double that in the PLAT + GEM arm. It can be given to patients who are ineligible for cisplatin, who constitute up to one-half of patients with advanced UC. The clinical experts indicated that, based on the results of the EV-302 trial, it is expected that EV + P will become the de facto standard of care for incurable UC.
Patient Population
The clinical experts indicated that all patients with incurable UC should be considered for first-line EV + P treatment. Patients with contraindications to immunotherapy may not be able to receive pembrolizumab. Enfortumab vedotin has dermatological, neuropathic and diabetogenic risks that may pose contraindications in some patients. One clinical expert indicated that, given the significant survival advantages with EV + P, access should not be limited to only patients who would have met inclusion criteria for the clinical trial (i.e., with regard to performance status or pre-existing autoimmune conditions). Rather, EV + P should be the standard first-line consideration for the patients deemed appropriate candidates by care providers.
Assessing the Response Treatment
The clinical experts indicated that OS, European Organisation for Research and Treatment of Cancer Quality of Life Core 30 (EORTC QLQ-C30) score, objective response rate (ORR), safety, progression-free survival (PFS), and duration of response (DOR) are commonly used to assess the treatment response (benefit) for locally advanced or metastatic UC. Additionally, 1 clinical expert noted that the frequency of assessments will vary from prescriber to prescriber and from patient to patient, depending on the stage of the treatment course.
Discontinuing Treatment
The clinical experts indicated that treatment should be discontinued if there is cancer progression despite treatment, severe or intolerable adverse effects, or deterioration in the patient’s condition because of other factors, or at the patient’s request.
Prescribing Considerations
The clinical experts indicated that patient eligibility for this treatment should be assessed by a medical oncologist with experience treating incurable UC but added that the treatment can be administered in an outpatient setting. One clinical expert indicated that medical oncologists should be assessing and prescribing at the initial stage. Ongoing care can likely be safely continued and prescribed by general practice oncologists outside of major cancer centres.
Clinician Group Input
The review team received input from 2 clinician groups: BCC and the Ontario Health (Cancer Care Ontario) Genitourinary Cancer Drug Advisory Committee (DAC).
The objectives of BCC are to help patients with bladder cancer and their support teams, increase awareness of bladder cancer, and fund research. Ontario Health (Cancer Care Ontario) DACs provide timely evidence-based clinical and health-system guidance on drug-related issues in support of Cancer Care Ontario’s mandate through the Provincial Drug Reimbursement Programs and the Systemic Treatment Program. BCC conducted an online survey and gathered information from 5 clinicians. The DAC collected information from 7 clinicians through videoconferencing.
According to the clinician groups, the first line of treatment includes platinum-based chemotherapy and avelumab. BCC added that, for patients who progress on chemotherapy, the standard subsequent treatment is pembrolizumab, and once patients have progressed on immunotherapy (avelumab or pembrolizumab), the standard of care for second-line treatment is enfortumab vedotin monotherapy or erdafitinib (for FGFR-altered cancers).
The DAC noted that the treatment goals are to improve OS, PFS, and improved response rates, including a complete response with potential for long-term remission.
According to BCC, the unmet needs were durable disease control, toxicity of the treatment, QoL and complete response. The DAC described OS and durable responses as treatment gaps.
Both clinician groups stated that EV + P would become the first-line standard of care.
The DAC mentioned that patients deemed eligible by a physician for immunotherapy-based regimens are best suited for treatment with the drug under review, and any patient with UC should be eligible irrespective of the histology. The DAC added that patients with a contraindication to immunotherapy are least suitable. According to BCC, it is not possible to identify which patients will benefit from this treatment because of the absence of any identified biomarkers. BCC added that patients with an active autoimmune disease or organ transplant would not be able to receive this treatment because of the effects of pembrolizumab.
The DAC pointed out that patient response assessment is based on clinical and radiographic assessment according to standard of care. BCC mentioned that survival time, recurrence of disease, ability to perform activities of daily living, and reduction of cancer symptoms would be the outcomes used to determine whether patients are responding to treatment, and BCC explained that, among the survey respondents, 4 clinicians suggested assessments every 3 months, with 1 clinician suggesting every 3 weeks before each subsequent treatment cycle.
According to the DAC, clinically significant disease progression and unacceptable toxicity should be considered when deciding whether to discontinue treatment. BCC described AEs and recurrence of the disease as other relevant factors.
The DAC noted that outpatient cancer centres, under the advisement of a medical oncologist, are appropriate settings for this treatment. BCC added hospital outpatient clinics and private infusion clinics to that list.
The DAC explained that, for patients who had completed their initial 2-year course of pembrolizumab at the time of confirmed disease recurrence, re-treatment with pembrolizumab should be funded for up to an additional year (i.e., up to 17 additional doses every 3 weeks or 9 additional doses every 6 weeks) provided pembrolizumab was not previously discontinued because of disease progression.
Drug Program Input
The drug programs provide input on each drug being reviewed through CDA-AMC Reimbursement Review processes by identifying issues that may affect their ability to implement a recommendation. The implementation input and corresponding responses from the clinical experts consulted for this review are summarized in Table 4.
Clinical Evidence
Systematic Review
Description of Studies
One pivotal trial (EV-302) is included in this review. The EV-302 trial was a multinational, open-label, phase III, randomized controlled trial (RCT) that compared the efficacy and harms of EV + P versus PLAT + GEM in the treatment of patients with locally advanced or metastatic UC. The main inclusion criteria were: histologically documented unresectable locally advanced or metastatic UC; measurable disease by investigator assessment according to Response Evaluation Criteria in Solid Tumours Version 1.1 (RECIST 1.1); no prior systemic therapy for locally advanced or metastatic UC unless it involved neoadjuvant chemotherapy with recurrence more than 12 months after therapy was completed or adjuvant chemotherapy following cystectomy with recurrence more than 12 months after therapy was completed; eligible for cisplatin-containing or carboplatin-containing chemotherapy, and an Eastern Cooperative Oncology Group Performance Status (ECOG PS) of 0, 1, or 2. The EV-302 trial included a screening phase, a treatment phase, and a follow-up phase. There was no limitation of treatment cycles for enfortumab vedotin; pembrolizumab could be administered for up to 35 cycles. Cisplatin, carboplatin and/or GEM could be administered for up to 6 cycles. In both arms, reasons for treatment discontinuation included progressive disease, AEs, pregnancy, start of subsequent anticancer therapy, investigator decision, patient decision, study termination, or completion of study treatment. During the follow-up phase after discontinuation of study treatment, patients continued to be followed to collect information regarding subsequent anticancer therapy and survival (patient-reported outcomes [PROs] were collected at select follow-ups) until the first instance of death, study termination, loss to follow-up, or withdrawal of consent. A total of 886 patients, including 47 patients from Canada, were randomized (1:1) to receive EV + P (n = 442) or PLAT + GEM (n = 444). The mean age was 67.9 years (standard deviation [SD] = 9.2 years). Male patients accounted for 680 (76.7%) of the patient population, and the majority of patients were white (n = 598, 67.5%) or of Asian ethnicity (n = 191, 21.6%). Most patients (96.9%) had an ECOG PS of 0 or 1 (n = 858). A total of 404 patients (45.6%) were cisplatin-ineligible at randomization. The dual-primary efficacy outcomes were PFS according to RECIST 1.1 by a blinded independent central review (BICR) and OS. PFS was defined as the time from randomization to the first instance of disease progression or death from any cause. OS was defined as the time from randomization to death from any cause. The secondary outcome end points included ORR according to RECIST 1.1 by BICR, time to pain progression, change from baseline in worst pain, DOR, EORTC QLQ-C30, 5-Level EQ-5D, and safety. At the data cut-off (August 8, 2023), the overall median follow-up time was 17.2 months (95% confidence interval [CI], 16.5 to 17.9; range, 0.07 to 37.16). In EV + P arm, the median follow-up was 17.3 months (95% CI, 16.4 to 18.2; range, 0.26 to 37.16). In the PLAT + GEM arm, the median follow-up was 16.9 months (95% CI, 16.1 to 18.5; range, 0.07 to 36.21). The median treatment duration in the EV + P arm was 9.43 months (range, 0.3 to 31.9) and the median treatment duration in the PLAT + GEM arm was 4.14 months (range, 0.0 to 7.7)
Efficacy Results
Outcomes were assessed after an overall median follow-up of 17.2 months (95% CI, 16.5 to 17.9) at the data cut-off of August 23, 2023.
Progression-Free Survival
Analysis of PFS by BICR revealed a statistically significant and clinically meaningful improvement in the EV + P arm compared with the PLAT + GEM arm. The relative hazard of developing a disease-progression event in the EV + P arm was clinically meaningfully reduced by 55% compared to the PLAT + GEM arm (hazard ratio [HR] = 0.450; 95% CI, 0.377 to 0.538; 2-sided P < 0.00001). Patients in the EV+ P arm also had a clinically meaningful longer median PFS than those in the PLAT + GEM arm (treatment-group difference = 6 months; 95% CI, ||||| || ||||). In addition, compared with the PLAT + GEM arm, PFS in patients in the EV + P arm was ||||| || higher (95% CI, ||||| || |||| at 6 months, 29.1% higher (95% CI, ||||| || |||| at 12 months, and 32.2% higher (95% CI, ||||| || |||| at 18 months. According to the clinical experts consulted for this review, first-line treatment with EV + P was followed by a clinically meaningful higher PFS rate compared with PLAT + GEM, starting from 12 months and sustained through 18 months. Subgroup analyses and sensitivity analyses of PFS were consistent with the primary analysis.
Overall Survival
Analysis of OS revealed a statistically significant and clinically meaningful improvement in OS with EV + P versus PLAT + GEM. The relative hazard of death in the EV + P arm was clinically meaningfully reduced by 53.2% compared to the PLAT + GEM arm (HR = 0.468; 95% CI, 0.376 to 0.582; 2-sided P < 0.00001). The median OS in the EV + P arm was 15.4 months (||||| || ||||) longer (95% CI, ||||| || ||||) than in the PLAT + GEM arm, which is a clinically meaningful difference. Furthermore, the OS rate for EV + P was higher than for the PLAT + GEM arm by ||||| || |||| (95% CI, ||||| || ||||) at 6 months, 16.7% (95% CI, ||||| || |||| at 12 months, and 24.8% (95% CI, ||||| || |||| at 18 months. According to the clinical experts consulted for this review, first-line treatment using EV + P was followed by a clinically meaningfully higher OS rate compared with PLAT + GEM starting from 12 months and sustained to 18 months. Results from subgroup and sensitivity analyses of OS were consistent with the primary analysis.
Objective Response Rate by Blinded Independent Central Review
After an overall median follow-up of 17.2 months, 23.3% (95% CI, ||||| || |||| more patients in EV + P arms attained the ORR compared with those in the PLAT + GEM arm, an improvement that was considered clinically meaningful by the clinical experts consulted for this review. The ORR rates at 6 months, 12 months, and 18 months were not reported. Subgroup analyses revealed consistent ORR benefits favouring EV + P across all prespecified subgroups.
Duration of Response by Blinded Independent Central Review
The median DOR was longer in the EV + P arm compared to the PLAT + GEM arm (not reached versus 7.0 months, respectively) and a lower proportion of patients had progressed or died in the EV + P arm (33.4% versus 60.7%). A greater proportion of patients in the EV + P arm maintained their responses compared to those in the PLAT + GEM arm, with between-group differences of ||||| || |||| (95% CI, ||||| || ||||) at 6 months, ||||| || |||| (95% CI, ||||| || |||| 12 months, and ||||| || |||| (95% CI, ||||| || |||| at 18 months. Although the analysis of DOR by BICR was not formally tested, according to the clinical experts consulted for this review, the improved DOR through 18 months in the EV + P arm was considered clinically meaningful compared with the results for the PLAT + GEM for first-line treatment. The results of the sensitivity analysis (DOR by investigator assessment) were generally similar to those of the primary analysis, favouring the EV + P arm.
EORTC QLQ-C30
Patients’ HRQoL outcomes were assessed using the EORTC QLQ-C30 tool. The findings showed no clinical meaningful difference between the EV + P and PLAT + GEM arms at week 26. Similarly, no clinical meaningful intragroup or intergroup difference was observed from week 8 to week 71. The clinical experts consulted for this review emphasized that they did not expect to see a significant improvement in QoL with the anticancer treatment for this population.
Harms Results
Most patients in both treatment arms (99.8% in the EV + P arm and 98.6% in the PLAT + GEM arm) experienced AEs after a median follow-up of 17.2 months (95% CI, 16.5 to 17.9) as of the data cut-off of August 23, 2023. The most common AEs (> 40%) that occurred more often in the EV + P arm than in the PLAT + GEM arm were peripheral sensory neuropathy (EV + P versus PLAT + GEM: 52.0% versus 10.2%, respectively) and pruritus (41.4% versus 6.7%). Other AEs (by system organ class) observed more often in the EV + P arm than in the PLAT + GEM arm were skin and subcutaneous tissue disorders (83.2% versus 35.9%), eye disorders (34.5% versus 6.0%), infections and infestations (60.2% versus 37%), and nervous system disorders (74.8% versus. 33.3%). The most common AEs (> 40%) that occurred more often in the PLAT + GEM arms than in the EV + P arm were anemia (24.5% versus 61.7%, respectively), neutropenia (9.8% versus 41.8%), and nausea (26.4% versus 41.1%). More patients in EV + P arm experienced serious adverse events (SAEs) compared with those in the PLAT + GEM arm (50% versus 39%, respectively). Furthermore, fewer patients reported blood and lymphatic system disorders in the EV + P arm than in the PLAT + GEM arm (35.7% versus 78.5%, respectively). Grade 3 to 5 treatment-emergent adverse events (TEAEs) were reported in 73.0% of patients in the EV + P arm versus 78.8% in the PLAT + GEM arm. The proportion of patients who discontinued treatment because of AEs was higher in the EV + P arm compared to the PLAT + GEM arm (39.8% versus 21.5%, respectively). Peripheral sensory neuropathy was the most common AE associated with treatment discontinuation in the EV + P arm (11.1%). Anemia was the most common AE that caused treatment discontinuation in the PLAT + GEM arm (2.8%). TEAEs leading to death were similar across both arms (4.3% in the EV + P arm versus 3.2% in the PLAT + GEM arm).
Patients in the EV + P arm reported more AEs compared to those in the PLAT + GEM arm. The clinical experts consulted for this review indicated that, of the reported AEs of special interest for enfortumab vedotin, skin reactions and hyperglycemia were the most clinically important. The incidence of skin reactions was higher in the EV + P arm than in the PLAT + GEM arm, with a between-group difference of ||||| || |||| (95% CI, ||||| || ||||). Skin reactions included rashes and scars. Most skin reactions were mild.31 The incidence of hyperglycemia was higher in the EV + P arm than in the PLAT + GEM arm, with a between-group difference of ||||| || ||||||||| || ||||), which was considered clinically important by the clinical experts consulted for this review. The incidence of hepatitis was higher in the EV + P arm than in the PLAT + GEM arm, with a between-group difference of ||||| || ||||||||| || ||||, which was also considered clinical meaningful.
The harms profile of EV + P in the EV-302 trial was generally consistent with that previously reported for enfortumab vedotin monotherapy and pembrolizumab monotherapy in the treatment of patients with locally advanced or metastatic UC; no new safety signals or adverse drug reactions were identified. Overall, AEs were predictable, acceptable and clinically manageable in most patients.
Critical Appraisal
EV-302 was a phase III, open-label RCT. Appropriate methods for randomization were reported. The outcomes assessed were clinically relevant, and statistical analyses were carried out using standard methods. The risk of selection bias, confounding bias, and detection bias were considered very low for the key objective outcomes (i.e., OS, PFS and ORR). However, several potential limitations were identified.
Because of the open-label design of the EV-302 trial, subjective PROs, such as HRQoL (e.g., EORTC QLQ-C30), and some of the harms outcomes (e.g., skin reactions) may have been biased or influenced by patient or investigator knowledge of treatment assignment. Use of concomitant medications and concomitant cancer-related procedures were slightly imbalanced between the 2 arms, which could affect the comparative efficacy assessment of the HRQoL measures (e.g., EORTC QLQ-C30), although the direction and the magnitude of the bias were unknown. Furthermore, a significant number of patients were not included in the EORTC QLQ-C30 analysis. No statistical analyses were performed to identify statistical differences in HRQoL between treatments.
The clinical experts consulted for this review noted that the inclusion and exclusion criteria for the EV-302 trial were generally similar to the criteria for selecting patients with locally advanced or metastatic UC who were eligible for EV + P treatment in clinical settings in Canada, except that patients with central nervous system metastases would be eligible if their disease was under control. In addition, the clinical experts indicated that, in clinical practice, measurable disease according to RECIST 1.1 is typically not a necessary criterion for selecting patients for treatment, as the treatment response can be assessed based on clinical response, such as symptom reduction. The clinical experts emphasized that treatment with EV + P should be based on the judgment of the treatment oncologist, and not restricted to patients with an ECOG PS of no greater than 2. According to the clinical experts consulted for this review, based on the demographic and disease characteristics of participants in the EV-302 trial, there is no major generalizability concern about how its findings may translate to the Canadian clinical practice context.
GRADE Summary of Findings and Certainty of the Evidence
Methods for Assessing the Certainty of the Evidence
For the single RCT included in the sponsor’s systematic review, Grading of Recommendations Assessment, Development and Evaluation (GRADE) was used to assess the certainty of the evidence for outcomes considered most relevant to inform CDA-AMC expert committee deliberations. The final certainty rating was determined as outlined by the GRADE Working Group (Balshem et al. [2011]32 and Santesso et al. [2020]33).
High certainty: We are very confident that the true effect lies close to that of the estimate of the effect.
Moderate certainty: We are moderately confident in the effect estimate — The true effect is likely to be close to the estimate of the effect, but there is a possibility that it is substantially different. We use the word “likely” for evidence of moderate certainty (e.g., “X intervention likely results in Y outcome”).
Low certainty: Our confidence in the effect estimate is limited — The true effect may be substantially different from the estimate of the effect. We use the word “may” for evidence of low certainty (e.g., “X intervention may result in Y outcome”).
Very low certainty: We have very little confidence in the effect estimate — The true effect is likely to be substantially different from the estimate of effect. We describe evidence of very low certainty as “very uncertain.”
In the GRADE approach, evidence from RCTs starts as high-certainty evidence and can be rated down for concerns related to study limitations (internal validity or risk of bias), inconsistency across studies, indirectness, imprecision of effects, and publication bias.
When possible, certainty was rated in the context of the presence of an important (nontrivial) treatment effect; if this was not possible, certainty was rated in the context of the presence of any treatment effect (i.e., the clinical importance is unclear). In all cases, the target of the certainty of evidence assessment was based on the point estimate and where it was located relative to the threshold for a clinically important effect (when a threshold was available) or to the null.
Results of GRADE Assessments
Table 2 presents the GRADE summary of findings for EV + P versus PLAT + GEM for the treatment of patients with locally advanced or metastatic UC in the intention-to-treat (ITT) population.
Long-Term Extension Studies
No long-term extension studies were submitted by the sponsor.
Indirect Comparisons
No indirect comparison were submitted by the sponsor.
Studies Addressing Gaps in the Evidence From the Systematic Review
No studies addressing gaps in the evidence were submitted by the sponsor.
Conclusions
Evidence from the EV-302 trial showed that EV + P demonstrated a clinically meaningful benefit compared with PLAT + GEM in improving PFS, OS, and the ORR for the treatment of patients with locally advanced or metastatic UC. Based on the EORTC QLQ-C30 Global Health Status (GHS) results, EV + P may result in little to no clinically important difference in patients’ HRQoL compared with PLAT + GEM, which was expected for this population. The safety profile of EV + P appeared to differ from that of PLAT + GEM. The safety profile of EV + P was consistent with the known safety profiles of enfortumab vedotin monotherapy and pembrolizumab monotherapy, which are predictable, acceptable, and clinically manageable in most patients. No new safety signals were identified in the EV-302 trial.
Table 2: Summary of Findings of Enfortumab Vedotin Plus Pembrolizumab Combination Therapy Versus Platinum Plus Gemcitabine Chemotherapies for the Treatment of Patients With Locally Advanced or Metastatic Urothelial Cancer (ITT Population)
Outcome and follow-up | Patients (studies), N | Relative effect (95% CI) | Absolute effects (95% CI) | Certainty | What happens | ||
|---|---|---|---|---|---|---|---|
PLAT + GEM | EV + P | Difference | |||||
PFS at data cut-off date: August 5, 2023 | |||||||
PFS probability at 12 months | 886 (1 RCT) | NR | 21.6 per 100 | 50.7 per 100 ||||| || |||| | ||||| || ||||||||| || ||||||||| || ||| | High | The combination of EV + P is likely to result in a clinically important increase in PFS when compared with PLAT + GEM at 12 months. |
OS at data cut-off date: August 5, 2023 | |||||||
OS probability at 18 months | 886 (1 RCT) | NR | 44.7 per 100 | 69.5 per 100 ||||| || ||||||||| || ||| | ||||| || ||||||||| || ||||||||| || ||| | High | The combination of EV + P results in a clinically important increase in OS when compared with PLAT + GEM at 18 months. |
ORR at data cut-off date: August 5, 2023 | |||||||
ORR probability at an overall median follow-up of 17.2 months (95% CI, 16.5 to 17.9 months) | 878 (1 RCT) | NR | 44.4 per 100 | 67.7 per 100 ||||| || ||||||||| || ||| | ||||| || ||||||||| || ||||||||| || ||| | High | The combination of EV + P results in a clinically important increase in ORR when compared with PLAT + GEM at an overall median follow-up of 17.2 months. |
Health-related quality of life (EORTC QLQ-C30 GHS) at data cut-off date: August 5, 2023 | |||||||
EORTC QLQ-C30 GHS total score (range, 0 [worst] to 100 [best]), LS mean change from baseline to week 26, points | 731 (1 RCT) | NA | ||||| || ||||||||| || ||| | ||||| || ||||||||| || ||| | ||||| || ||||||||| || ||||||||| || ||| | Lowa | The combination of EV + P may result in little to no clinically important difference in EORTC QLQ-C30 GHS when compared with PLAT + GEM at week 26. |
Notable harms (AEs of special interest) at data cut-off date: | |||||||
Notable harms for enfortumab vedotin | |||||||
Skin reactions | 873 (1 RCT) | NR | 15.7 per 100 | 69.1 per 100 (NR) | 53.4 more per 100 (||||| || ||||||||| || ||||||||| || |) | Moderateb | The combination of EV + P is likely to result in a clinically important increase in skin reactions when compared with PLAT + GEM. |
Hyperglycemia | 873 (1 RCT) | NR | 3.5 per 100 | 19.3 per 100 (NR) | 15.9 more per 100 (||||| || ||||||||| || ||||||||| || ||) | High | The combination of EV + P results in a clinically important increase in hyperglycemia when compared with PLAT + GEM. |
Notable harms for pembrolizumab | |||||||
Hepatitis | 873 (1 RCT) | NR | 0.5 per 100 | 3.2 per 100 (NR) | 2.7 more per 100 (||||| || ||||||||| || ||||||||| || |||) | High | The combination of EV + P results in clinically important increase in hepatitis when compared with PLAT + GEM. |
AE = adverse event; CI = confidence interval; EORTC QLQ-C30 = European Organisation for Research and Treatment of Cancer Quality of Life Core 30; EV + P = enfortumab vedotin plus pembrolizumab; GHS = Global Health Status; ITT = intention to treat; LS = least square; NA = not applicable; NR = not reported; ORR = objective response rate; OS = overall survival; PFS = progression-free survival; PLAT + GEM = platinum-based chemotherapy (cisplatin or carboplatin) plus gemcitabine; RCT = randomized controlled trial; SD = standard deviation.
Note: Study limitations (which refers to internal validity or risk of bias), inconsistency across studies, indirectness, imprecision of effects, and publication bias were considered when assessing the certainty of the evidence. All serious concerns in these domains that led to the rating down of the level of certainty are documented in the table footnotes.
aRated down 2 levels for very serious study limitations for this outcome: there is risk of bias in measurement of the outcome because of the open-level design and missing outcome data (only 238 patients in the EV + P arm and 170 patients in the PLAT + GEM arm were included for the analysis at week 26, and only 53.8%% of the ITT patients in the EV + P arm and 38.2% of the ITT patients in the PLAT + GEM arm were included in the assessment at week 26).31
bRated down 1 level for a serious study limitation: there is risk of bias in measurement of the outcome (AE) because of the open-level design.
Introduction
Disease Background
Contents within this section were informed by materials submitted by the sponsor and clinical expert input. The following summary was validated by the CDA-AMC review team.
Urothelial carcinoma, which encompasses disease that can begin in the renal collecting duct, the ureters, or urethra, in addition to the bladder, accounts for approximately 90% of all bladder cancer cases.1,2 Bladder cancer is the fifth most common cancer in Canada, with an estimated 13,400 new cases of bladder cancer occurring in Canada in 2023.3 The mean age of diagnosis is 73 years, and about 90% of patients with bladder cancer are older than 55 years.4 Urothelial carcinoma is characterized clinically by the extent of invasion and can be nonmuscle-invasive (i.e., carcinoma in situ), muscle-invasive, or metastatic.6 Between 20% and 40% of patients with bladder cancer develop metastatic disease.1 Regional metastasis is referred to as locally advanced or metastatic UC, and distant metastasis is referred to as metastatic UC. Locally advanced urothelial carcinoma and metastatic UC are incurable, aggressive malignancies with a 5-year survival rate of 5% despite recent advances in treatment.5,6 Pathological staging is according to the tumour-node-metastasis classification34 based on primary tumour size and extent (T), regional lymph node involvement (N), and presence or absence of distant metastases (M, where M0 indicates no distant metastasis and M1 indicates metastasis to distant organs [beyond regional lymph nodes]). Tumour-node-metastasis information is combined to assign an overall stage of 0, I, II, III or IV. Individuals with locally advanced or metastatic UC report high symptom burdens, including pain, reduced QoL, and reduced physical and emotional functioning, blood in urine, fatigue, difficulty urinating, and a burning sensation during urination.9,10 Patients have also reported being affected with stress, reduced emotional well-being, and difficulty sleeping.10,11 Abilities to work, travel, exercise, and engage in social activities were among the most severely impacted day-to-day activities.9
Patients with muscle- and nonmuscle-invasive bladder cancer eventually develop locally advanced or metastatic UC; 2% of patients with nonmuscle-invasive cancer are expected to develop locally advanced or metastatic UC35 and 75% of patients with muscle-invasive cancer are expected to have inoperable cancer.36 Of the patients who develop locally advanced or metastatic UC, more than 35% would be expected to receive first-line systemic treatment with platinum-based chemotherapy.13 Patients eligible for first-line systemic therapy for locally advanced or metastatic UC would be under the care of a clinician experienced in the treatment of cancer throughout the earlier stages of the disease.
Standards of Therapy
Contents within this section were informed by materials submitted by the sponsor and clinical experts. The following summary was validated by the CDA-AMC review team.
The goal of locally advanced or metastatic UC treatment is to delay disease progression, prolong life while minimizing symptoms, improve HRQoL, increase the ability to maintain employment, maintain independence, and reduce burdens on caregivers.10 From the patient perspective, an ideal treatment would slow or stop disease progression, recurrence and spread; reduce pain, fatigue, and impaired sexual function; increase energy levels and strength; improve mental health, continence, and urination control; and result in fewer or no infections and avoidance of surgery.10 Based on a 2019 consensus statement from the Canadian Urological Association and Genitourinary Medical Oncologists of Canada15 and a 2020 management algorithm from a Canadian national, multidisciplinary working group,16 the recommended and preferred locally advanced or metastatic UC treatment regimen in the first-line is cisplatin plus GEM. Carboplatin plus GEM is the recommended and preferred regimen in patients who are cisplatin-ineligible.17 The reasons for ineligibility for cisplatin are largely based on the Galsky criteria. Cancer Care Alberta and Cancer Care Ontario have also recently released guidance on the subject2 and a guideline endorsement,19 respectively, endorsing, cisplatin- or carboplatin-based chemotherapy as the mainstay of first-line treatment of locally advanced or metastatic UC, depending on eligibility.2,19 Clinicians from British Columbia, Alberta, Ontario, and Québec confirmed these findings regarding PLAT as the current Canadian standard of care in interviews conducted by the drug’s sponsor in preparation for the submission.37 In rare cases, patients who have received adjuvant chemotherapy and progressed within 12 months may receive pembrolizumab in the first-line setting.18 For a subset of patients who do not progress during or after platinum-based chemotherapy (i.e., attain a complete response, partial response, or stable disease), avelumab maintenance therapy can be given, according to Cancer Care Alberta, Cancer Care Ontario, and the CDA-AMC Provisional Funding Algorithm.2,18,19The clinical experts indicated that, in Canada, PLAT + GEM followed by avelumab treatment is considered the first-line treatment for patients who responded to PLAT + GEM without progression (i.e., attain a complete response, partial response, or stable disease). However, it is important to note that decision-making for first-line treatment happens upfront, and it is not possible to predict which patients will respond to PLAT.
Despite current treatments, patients with metastatic disease have a 5-year survival rate of 5%.5,6 Based on real-world evidence in Alberta, the median OS from the time of initiation of first-line systemic therapy is only 9.1 months.13 Cytotoxic PLAT yields modest survival benefit and is associated with significant toxicities. Cisplatin is associated with cumulative toxicities leading to nephrotoxicity, neuropathy, ototoxicity, acute gastrointestinal toxicity, and myelosuppression.20-22 Carboplatin is associated with thrombocytopenia with bleeding, anemia, leukopenia, neutropenia, febrile neutropenia, renal toxicity, and mucositis.23-28 As well, only some patients will respond to PLAT, and even fewer patients would receive and respond to avelumab maintenance. Based on real-world data generated by Oncology Outcomes in Alberta, only 35% of patients with de novo and recurrent metastatic UC receive first-line systemic therapy; the majority of patients do not receive any systemic therapy.13,29 Of those treated with first-line PLAT, only 38% of patients were eligible for avelumab; however, it is estimated that up to 80% of eligible patients actually receive avelumab, and 30% of patients treated with first-line platinum-based chemotherapy receive avelumab maintenance. There is a significant unmet need for new therapies that increase survival with a manageable safety profile and maintain QoL.
Drug Under Review
Key characteristics of enfortumab vedotin are summarized in Table 3.
Enfortumab vedotin is an ADC directed against nectin-4, an adhesion protein on the surface of most UC cells. The drug comprises a fully human immunoglobin G1-kappa antibody conjugated to the microtubule-disrupting drug monomethyl auristatin E (MMAE) via a protease-cleavable linker. Nonclinical data suggest that the anticancer activity of enfortumab vedotin involves the binding of the ADC to nectin-4-expressing cells, followed by internalization of the ADC–nectin-4 complex, and the release of MMAE via proteolytic cleavage. Release of MMAE disrupts the microtubule network within the cell, subsequently inducing cell-cycle arrest, apoptosis, and immunogenic cell death. Enfortumab vedotin is an antineoplastic,formulated as lyophilized powder for solution for IV infusion as 20 mg and 30 mg single-use vials. The recommended dose of enfortumab vedotin as a single drug is 1.25 mg/kg (up to a maximum of 125 mg for patients ≥ 100 kg) administered as an IV infusion over 30 minutes on days 1, 8, and 15 of a 28-day cycle (i.e., 3 weeks per cycle) until disease progression or unacceptable toxicity. When given in combination with pembrolizumab, it is supplied at the same recommended dose and administered as an IV infusion over 30 minutes on days 1 and 8 of a 21-day cycle until disease progression or unacceptable toxicity. Enfortumab vedotin has been previously reviewed by CDA-AMC (then CADTH) in 2022, and the CADTH pan-Canadian Oncology Review Expert Review Committee recommended that the drug be reimbursed for the treatment of patients with locally advanced or metastatic UC who have previously received a PD-1 or PD-L1 inhibitor and who have received a platinum-containing chemotherapy in the neoadjuvant or adjuvant locally advanced or metastatic setting.
The FDA has approved enfortumab vedotin (Padcev, Astellas Pharma) in combination with pembrolizumab (Keytruda, Merck) for patients with locally advanced or metastatic UC. The FDA previously granted accelerated approval to this combination for patients with locally advanced or metastatic UC who are ineligible for cisplatin-containing chemotherapy. Enfortumab vedotin has not been filed with or reviewed by the European Medicines Agency.
Enfortumab vedotin is undergoing a priority Project Orbis review by Health Canada. The sponsor’s reimbursement request aligns with the Health Canada indication for use in combination with pembrolizumab, for the treatment of patients with locally advanced or metastatic UC.
Table 3: Key Characteristics of Enfortumab Vedotin
Characteristic | Enfortumab vedotin |
|---|---|
Mechanism of action | Release of MMAE, which disrupts the microtubule network within the cell, subsequently inducing cell-cycle arrest and apoptosis, and immunogenic cell death |
Indicationa | In combination with pembrolizumab, for the treatment of patients with locally advanced or metastatic urothelial cancer |
Route of administration | IV infusion over 30 minutes |
Recommended dose | 1.25 mg/kg (up to a maximum of 125 mg for patients ≥ 100 kg) |
Serious adverse effects or safety issues | Severe cutaneous adverse reactions, including Stevens-Johnson syndrome and toxic epidermal necrolysis with fatal outcome, hyperglycemia, and diabetic ketoacidosis, including fatal events, infusion-site extravasation, peripheral neuropathy, ocular disorders, pneumonitis, and interstitial lung disease |
Other | Must be reconstituted and diluted before administration; not to be administered as an IV push or bolus |
MMAE = monomethyl auristatin E.
aHealth Canada pre–Notice of Compliance indication.
Source: Product monograph draft for enfortumab vedotin.38
Perspectives of Patients, Clinicians, and Drug Programs
Patient Group Input
This section was prepared by the CDA-AMC review team based on the input provided by patient groups. The full original patient inputs received by the review team are included in the previously mentioned Perspectives of Patients, Clinicians, and Drug Programs section of this report.
The review team received 1 submission from BCC, a registered national charity in Canada serving those facing a bladder cancer diagnosis. Its objectives are to help patients with bladder cancer and their support teams, increase awareness of bladder cancer, and fund research.
Data from 7 patients and 2 caregivers were collected by BCC through an online survey conducted between April 17 and May 29, 2024. Overall, 7 survey respondents were from Canada, 1 was from the US, and the origin of 1 was unknown. All survey respondents had experience with locally advanced or metastatic UC, and 7 respondents (5 patients and 2 caregivers) had treatment experience with enfortumab vedotin in combination with pembrolizumab.
According to BCC, the most commonly reported cancer symptoms were blood in urine (88%), fatigue (63%) and bone pain (50%). Blood in urine and frequent urination were cited in interviews as the most difficult symptoms to tolerate. It was also noted that frequent urination could interfere with the patient’s ability to sleep.
Respondents in the BCC survey had treatment experience with GEM, cisplatin, carboplatin, paclitaxel, radiation, transurethral resection of bladder tumour procedures, radical cystectomy, and neobladder reconstruction. Six had received PLAT, while 3 had received enfortumab vedotin as their first IV treatment. BCC added that, based on respondents answers, current therapies are broadly adequate for managing patient symptoms, and the most reported side effects of these treatments were fatigue (67%), loss of appetite (44%), neuropathy (44%), and hair loss (44%). Fatigue and neuropathy were the most difficult side effects to tolerate. Three respondents reported screening problems that delayed access to treatment and may have affected health outcomes. One respondent reported difficulty accessing treatment because of the distance from the nearest large urban centre. BCC noted that respondents strongly prioritize health outcomes and are willing to accept more aggressive side effects.
Experience With Drug Under Review
According to BCC, when 7 patients were asked to rate how their life had changed on enfortumab vedotin compared to other therapies that they had received, maintaining QoL received the highest average score, followed by drug side effects, cancer symptoms, controlling disease progression, and preventing recurrence. Two BCC respondents noted that, while this treatment was effective for soft-tissue tumours, it failed to control the growth of bone metastases. BCC reported that hair loss and nausea were the most commonly reported side effects (43% each, n = 7).
When BCC respondents were asked to rate the tolerability of the side effects associated with enfortumab vedotin on a scale from 1 (completely tolerable) to 10 (completely intolerable), the average score was 6.0 (3 patients and 1 caregiver supplied scores of 1, while 2 patients and 1 caregiver supplied scores of 8 or higher). Additionally, BCC reported that 1 caregiver indicated that the worst side effects occurred during the first week of treatment and largely cleared up afterward; by contrast, 1 patient indicated that the side effects built up over time. BCC added that 1 patient reported dose reductions as a result of AEs, and 1 patient reported a dose reduction because of concern about peripheral neuropathy.
When patients in the BCC input were asked to rate how the side effects associated with enfortumab vedotin had affected different aspects of their life, the highest average score was for ability to sleep, followed by ability to work, ability to spend time with family and friends, ability to perform household chores, and ability to care for children. BCC added that the treatment had a moderately negative effect on most areas of life, but this effect was particularly dramatic with respect to respondents’ ability to care for children.
According to BCC, 1 patient reported lack of geographical accessibility.
Clinician Input
Input From Clinical Experts Consulted by CDA-AMC
All CDA-AMC review teams include at least 1 clinical specialist with expertise in the diagnosis and management of the condition for which the drug is indicated. Clinical experts are a critical part of the review team and are involved in all phases of the review process (e.g., providing guidance on the development of the review protocol, assisting in the critical appraisal of clinical evidence, interpreting the clinical relevance of the results, and providing guidance on the potential place in therapy). The following input was provided by 2 clinical specialists with expertise in the diagnosis and management of UC.
Unmet Needs
According to the clinical experts, the goal of the treatment for patients with incurable locally advanced or metastatic UC is to reduce cancer burdens and improve the quantity and QoL. Only about one-half of patients respond to the standard of care of PLAT. With chemotherapy alone, the average survival of these patient is 14 to 18 months, and this improves to about 16 to 20 months with the addition of avelumab maintenance therapy. These treatments also have adverse effects that can diminish the QoL, and almost no patients are cured. One clinical expert indicated that, although some slow advances in the treatment of metastatic UC have been made, the majority of patients die swiftly. Treatments that significantly prolong OS (particularly in an unselected population) and provide more frequent and prolonged disease control are therefore needed.
Place in Therapy
According to the clinical experts, the first line of the standard-of-care pharmaceutical therapy for patients with incurable locally advanced or metastatic UC is PLAT. The clinical experts emphasized that PLAT + GEM followed by avelumab maintenance treatment is considered the first-line treatment in this setting. Technically, the most relevant comparator is chemotherapy followed by maintenance immunotherapy in patients who were not progressing. Patients who progress despite chemotherapy are offered immunotherapy with pembrolizumab. Supportive treatments may also include analgesics for pain, palliative radiotherapy, bisphosphonates, and palliative care referral. Patients with progressive cancer despite immunotherapy may be offered enfortumab vedotin monotherapy or, if their tumour has a FGFR alteration, erdafitinib may be offered. The clinical experts stated that PLAT typically consists of either cisplatin or carboplatin, or less commonly dose-intense methotrexate, vinblastine sulphate, doxorubicin hydrochloride (Adriamycin), and cisplatin chemotherapy, which includes granulocyte colony-stimulating factor support. The clinical experts also noted that data from a randomized trial (Checkmate 901)30 that added concurrent and maintenance nivolumab to GEM plus cisplatin showed an OS benefit. Although not approved for this indication, nivolumab is available in Canada and is commonly used for many other cancers. It could therefore be considered a comparator for patients eligible for cisplatin. One clinical expert indicated that economic comparators must include the maintenance avelumab portion of first-line treatment. The expert estimated that 65% to 75% of patients would not progress on PLAT and would be offered maintenance avelumab until progression. One expert indicated that, in real clinical practice, not all patients who are eligible for avelumab will receive it; approximately 30% of the patients receiving PLAT + GEM treatment actually receive avelumab in real world.
The clinical experts emphasized that EV + P has the highest reported tumour response rate among treatments for incurable UC. In addition, the median OS was almost doubled in the EV + P arm when compared to the PLAT + GEM arm. EV + P can be given to patients who are cisplatin-ineligible, who constitute up to one-half of patients with advanced UC. The clinical experts indicated that, based on the results of the EV-302 trial, EV + P is expected to become the de facto standard of care for incurable UC.
Patient Population
The clinical experts indicated that all patients with incurable UC should be considered for EV + P as a first-line treatment. Patients with contraindications to immunotherapy may not be able to receive pembrolizumab. Enfortumab vedotin has dermatological, neuropathic, and diabetogenic risks that may be contraindications for some patients. One clinical expert indicated that, given the significant survival advantages with EV + P, access to it should not be limited to only those patients who would have met inclusion criteria for the clinical trial (i.e., with regard to performance status and pre-existing autoimmune conditions). Instead, EV + P should be the standard first-line consideration for patients deemed to be appropriate candidates by care providers.
Assessing the Response Treatment
The clinical experts noted that OS, EORTC QLQ-C30, ORR, safety, PFS, and DOR are commonly used to assess the treatment response (benefit) for locally advanced or metastatic UC. Additionally, 1 clinical expert noted that the frequency of assessments will vary from prescriber to prescriber and from patient to patient depending on the stage of the patient’s treatment course.
Discontinuing Treatment
The clinical experts advised that treatment should be discontinued if there is cancer progression despite treatment, severe or intolerable adverse effects, or deterioration in the patient’s condition because of other factors, or at the patient’s request.
Prescribing Considerations
The clinical experts indicated that patient eligibility for this treatment should be assessed by a medical oncologist with experience treating incurable UC. This treatment is suitable for outpatient administration. One clinical expert indicated that medical oncologists should perform the initial assessments and prescriptions. Ongoing care can likely be safely continued and prescribed by general practice oncologists outside of major cancer centres.
Clinician Group Input
This section was prepared by the CDA-AMC review team based on the input from clinician groups. The full original clinician group inputs received by the review team are included in the Perspectives of Patients, Clinicians, and Drug Programs section of this report.
Input was received from 2 clinician groups: BCC and the Ontario Health (Cancer Care Ontario) Genitourinary Cancer Drug DAC.
The objectives of BCC, which is a registered national charity in Canada serving those facing a bladder cancer diagnosis, are to help patients with bladder cancer and their support teams, increase awareness of bladder cancer, and fund research. Ontario Health (Cancer Care Ontario) DACs provide timely evidence-based clinical and health system guidance on drug-related issues in support of Cancer Care Ontario’s mandate through the Provincial Drug Reimbursement Programs and the Systemic Treatment Program. BCC conducted an online survey and gathered information from 5 clinicians. The DAC collected information from 7 clinicians through videoconferences.
According to the clinician groups, the first line of treatment includes PLAT and avelumab. BCC added that, for patients who progress on chemotherapy, the standard subsequent treatment is pembrolizumab, and once patients have progressed on immunotherapy (avelumab or pembrolizumab), the standard of care for second-line treatment is enfortumab vedotin monotherapy or erdafitinib (for FGFR–altered cancers).
The DAC noted that treatment goals are to improve OS, PFS, and response rates, including a complete response with potential for long-term remission.
According to BCC, the unmet needs were durable disease control, toxicity of the treatment, QoL, and complete response. The DAC described OS and durable responses as treatment gaps.
Both clinician groups stated that EV + P would become the first-line standard of care.
The DAC mentioned that patients who are deemed eligible by a physician for immunotherapy-based regimens are best suited for treatment with the drug under review, and that any patient with UC should be eligible irrespective of histology. The DAC added that patients with a contraindication to immunotherapy are least suitable. According to BCC, it is not currently possible to identify which patients will benefit most from this treatment because of the absence of any identified biomarkers. BCC added that patients with an active autoimmune disease or organ transplants would not be able to receive this treatment because of the effects of pembrolizumab.
The DAC stated that assessments of patient responses should be based on clinical and radiographic assessment according to the standard of care. BCC mentioned that survival time, recurrence of disease, ability to perform activities of daily living, and reduction of cancer symptoms would be the outcomes used to determine whether patients are responding to treatment, and BCC explained that, among the survey respondents, 4 clinicians suggested assessment every 3 months and 1 suggested every 3 weeks before each subsequent treatment cycle.
According to the DAC, clinically significant disease progression and unacceptable toxicity should be considered when deciding whether to discontinue treatment. BCC identified AEs and recurrence of the disease as other relevant factors.
The DAC noted that outpatient cancer centres under the advisement of a medical oncologist are appropriate settings for this treatment. BCC added hospital outpatient clinics and private infusion clinics to that list.
The DAC explained that, for patients who had completed their initial course of 2 years of pembrolizumab at the time of confirmed disease recurrence, re-treatment with pembrolizumab should be funded for up to an additional year (i.e., up to 17 additional doses every 3 weeks or 9 additional doses every 6 weeks) provided pembrolizumab was not previously discontinued because of disease progression.
Drug Program Input
The drug programs provide input on each drug being reviewed through CDA-AMC Reimbursement Review processes by identifying issues that may affect their ability to implement a recommendation. The implementation questions and corresponding responses from the clinical experts consulted by the review team are summarized in Table 4.
Table 4: Summary of Drug Plan Input and Clinical Expert Response
Drug program implementation questions | Clinical expert response |
|---|---|
Relevant comparators | |
Issues with the choice of comparator in the submitted trial
| One clinical expert indicated that the trial was designed without including avelumab maintenance therapy (i.e., without formally incorporating maintenance into the protocol; however, it was allowed at the investigators' discretion). Avelumab maintenance therapy for locally advanced or metastatic UC in patients whose cancer is stable or had responded to PLAT + GEM is the current standard of care in Canada. In the EV-302 trial, it was reported that 135 of 444 (30.4%) of patients in the control arm used avelumab at their investigator’s discretion. Both clinical experts indicated, in a Canadian setting, although about 50% to 60% of patients receiving PLAT + GEM are potentially eligible for avelumab, based on real-world data, only about 30% of patients treated with first-line platinum-based chemotherapy actually receive avelumab maintenance. Therefore, the 30% of patients who received avelumab reported in the EV-302 trial is likely close to what is routinely seen in Canadian clinical practice. Second-line pembrolizumab for patients whose cancer progresses despite PLAT + GEM is also a standard option in Canada. It appears that 125 of 444 patients (28.2%) received “subsequent” PD-1 or PD-L1 inhibitors including 60 patients (13.6%) with a best response of “progressive disease,” suggesting minimal undertreatment with second-line immunotherapy. It is not possible to estimate the proportion of patients treated with enfortumab vedotin in the control arm from the trial publication. |
Considerations for initiation of therapy | |
Disease diagnosis, scoring or staging for eligibility In the EV-302 study, patients were required to have histologically documented, unresectable locally advanced or metastatic UC (i.e., cancer of the bladder, renal pelvis, ureter, or urethra). Patients with squamous or sarcomatoid differentiation or mixed cell types were eligible. Please confirm if this should be the same eligibility for EV + P if recommended for reimbursement. | The same eligibility criteria should apply if EV + P is recommended for treatment. |
Other patient characteristics for eligibility (e.g., age restrictions, comorbidities) Patients with an ECOG PS of 0, 1, or 2 were eligible for the EV-302 study, but patients with ECOG PS 2 were required to have a hemoglobin ≥ 100 g/L, GFR ≥ 50 mL/min, and no history of NYHA Class III heart failure.
| One clinical expert indicated yes, for patients with an ECOG PS of 2 by trial criteria, but no, for full-dose enfortumab vedotin for those with an ECOG PS of 3. The other clinical expert noted that the criteria should not be too prescriptive as many factors other than an ECOG PS are involved in determining a treatment plan for a patient. |
Prior therapies required for eligibility Patients were not eligible to participate in the EV-302 study if they had received prior PD-1 or PD-L1 inhibitor therapy, including for earlier stages of UC. Should patients who previously received adjuvant nivolumab and experience relapse ≥ 6 months from completion be eligible for EV + P? | Yes. Patients who previously received adjuvant nivolumab and experience relapse ≥ 6 months from completion should be eligible for EV + P. |
Eligibility to re-treatment Pembrolizumab was administered for a maximum of 35 cycles (every 3 weeks) in the EV-302 study. Should patients who complete 35 cycles or 2 years of therapy be eligible to receive an additional 1 year of treatment with pembrolizumab at time of relapse if it was initially discontinued without any evidence of disease progression (similar to how pembrolizumab is currently funded in several other advanced cancers, including metastatic UC)? If re-treatment is permitted, would this be as pembrolizumab monotherapy or in combination with EV? | Yes. Re-treatment with enfortumab vedotin should depend on why it was discontinued. |
Considerations for prescribing of therapy | |
Dosing, schedule and frequency, dose intensity The PAG would like to inform pERC that it plans to implement weight-based dosing up to a cap for pembrolizumab (2 mg/kg up to a maximum of 200 mg every 3 weeks or 4 mg/kg up to a maximum of 400 mg every 6 weeks), similar to other cancer sites. | No objection was raised to the proposed weight-based dosing cap. |
Generalizability | |
Patients on active treatment with a time-limited opportunity to switch to the drug under review Should patients currently receiving alternate first-line therapy for locally advanced or metastatic UC be switched to EV + P on a time-limited basis at the time of implementation? | Only patients who have not started or completed platinum-based first-line chemotherapy should be switched to EV + P. |
Funding algorithm | |
Drug may change the place in therapy of comparator drugs. | Yes |
Drug may change the place in therapy of drugs reimbursed in subsequent lines. | Yes |
Complex therapeutic space with multiple lines of therapy, subpopulations, or competing products. | Yes |
Care provision issues | |
NA | — |
System and economic issues | |
Concerns regarding the anticipated budget impact and sustainability The PAG notes the sponsor projected a 3-year budget impact analysis (incremental costs) of more than $321 million and is concerned about budget impact and sustainability. | This is a comment from the drug plans to inform pERC deliberations. |
Presence of confidential negotiated prices for comparators Confidential prices exist for pembrolizumab and avelumab. Generic versions of cisplatin, carboplatin and gemcitabine are available. | This is a comment from the drug plans to inform pERC deliberations. |
ECOG PS = Eastern Cooperative Oncology Group Performance Status; EV + P = enfortumab vedotin plus pembrolizumab; GFR = glomerular filtration rate; NA = not applicable; NYHA = New York Heart Association; PAG = Provincial Advisory Group; pERC = pan-Canadian Oncology Drug Review Expert Review Committee; PLAT + GEM = platinum-based chemotherapy (cisplatin or carboplatin) plus gemcitabine; UC = urothelial cancer.
Clinical Evidence
The objective of the Clinical Review Report is to review and critically appraise the clinical evidence submitted by the sponsor on the beneficial and harmful effects of enfortumab vedotin as lyophilized powder for solution for IV infusion at 10 mg per mL (single-dose vials containing 20 mg and 30 mg of enfortumab vedotin), in combination with pembrolizumab, for the treatment of patients with locally advanced or metastatic UC. The review focuses on comparing enfortumab vedotin in combination with pembrolizumab to relevant comparators and identifying gaps in the current evidence.
This summary of the clinical evidence presented by the sponsor is followed by a critical GRADE appraisal of the evidence at the end of each section. The first section, the systematic review, includes pivotal studies and RCTs that were selected according to the sponsor’s systematic review protocol.
Included Studies
Clinical evidence from 1 pivotal RCT identified in systematic review is included and appraised in this review.
Systematic Review
Contents within this section were summarized and validated by the review team based on materials submitted by the sponsor.
Description of Studies
Characteristics of the included study (EV-302) are summarized in Table 5. The EV-302 trial is a global, phase III, open-label, 2-arm RCT (Figure 1) comparing EV + P with PLAT + GEM, which is the current standard of care for patients in Canada as first-line treatment for locally advanced or metastatic UC. The choice of cisplatin or carboplatin in the chemotherapy arm was based on the investigator’s assessment of whether a given patient was eligible for cisplatin or carboplatin. The primary objectives were to compare the dual-primary end points of PFS by BICR and OS between the EV + P arm and the PLAT + GEM arm.
Patients with locally advanced or metastatic UC were randomized 1:1 by interactive response technology to receive EV + P or PLAT + GEM using stratification according to cisplatin eligibility (eligible or ineligible), PD-L1 expression (low or high), and liver metastasis (present or absent). At the data cut-off date (August 8, 2023), 886 patients across both arms had been randomized to receive EV + P (n = 442) or PLAT + GEM (n = 444). Of these patients, 47 were enrolled at 11 Canadian sites.
Table 5: Details of Studies Included in the Systematic Review
Detail | EV-302 study (KEYNOTE-A39) |
|---|---|
Designs and populations | |
Study design | Phase III, open-label, 2-arm randomized multicentre study comparing EV + P vs. standard-of-care chemotherapy |
Locations | 180 sites across North America, Europe, South America, Australia, Asia, and the Middle East, including 11 sites in Canada that enrolled 47 patients |
Key dates | Start date: March 20, 2020 Data cut-off date: August 8, 2023 |
Randomized (N) | A total of 886 patients were randomized 1:1 to receive EV + P (n = 442) or platinum-based chemotherapy plus gemcitabine (n = 444) |
Inclusion criteria |
Patients with ECOG PS of 2 must additionally meet the following criteria:
|
Exclusion criteria |
|
Drugs | |
Intervention | Enfortumab vedotin (IV at 1.25 mg/kg over 30 minutes on days 1 and 8) plus pembrolizumab (administered intravenously at 200 mg over 30 minute on day 1) |
Comparator(s) | Standard of care chemotherapy (cisplatin plus gemcitabine or carboplatin plus gemcitabine)
|
Study duration | |
Screening phase | Up to 42 days before randomization |
Treatment phase |
|
Follow-up phase | After discontinuation of treatment, patients were followed to collect information regarding subsequent anticancer therapy and survival (patient-reported outcomes were collected at select follow-ups) until the first instance of death, study termination, loss to follow-up, or withdrawal of consent |
Outcomes | |
Dual-primary end points | The dual-primary end points were PFS by BICR and OS |
Secondary and exploratory end points | Secondary (sequential testing):
Secondary (descriptive analyses):
|
Publication status | |
Publications | Powles et al. (2024)39 EV-302 ClinicalTrials (NCT04223856)40 Sponsor-provided clinical study report31 |
AUC = area under the curve; BICR = blinded independent central review; DCR = disease control rate; DOR = duration of response; ECOG PS = Eastern Cooperative Oncology Group Performance Status; EORTC QLQ-C30 = European Organisation for Research and Treatment of Cancer Quality of Life Core 30; EV + P = enfortumab vedotin plus pembrolizumab; GFR = glomerular filtration rate; MMAE = monomethyl auristatin E; NYHA = New York Heart Association; ORR = objective response rate; OS = overall survival; PFS = progression-free survival; RECIST 1.1 = Response Evaluation Criteria in Solid Tumours Version 1.1; UC = urothelial cancer.
Sources: Clinical Study Report for EV-30231 and the sponsor’s Summary of Clinical Evidence.14
A schematic of the EV-302 study design is shown in Figure 1.

BICR = blinded independent central review; ECOG = Eastern Cooperative Oncology Group; PRO = patient-reported outcome.
Source: Clinical Study Report for EV-302 (Figure1).31
Populations
Inclusion and Exclusion Criteria
Eligibility Criteria
The key eligibility criteria for the EV-302 trial selected for a population of patients with histologically documented evidence of unresectable locally advanced urothelial carcinoma or metastatic UC (squamous or sarcomatoid differentiation or mixed cell types were allowed) and measurable disease as determined by investigator assessment using RECIST 1.1. These patients were selected to receive first-line systemic treatment for locally advanced or metastatic UC and were required to have no prior systemic therapy for locally advanced or metastatic UC. However, patients were allowed to have previously received neoadjuvant or adjuvant chemotherapy if the disease recurred more than 12 months after therapy was completed. Patients who had previously undergone definitive radiotherapy were required to have measurable disease outside the radiation field or unequivocal progression since completion of radiotherapy. Finally, patients were required to be eligible for cisplatin- or carboplatin-containing chemotherapy and have a good performance status (an ECOG PS of 0 to 2). Patients with an ECOG PS of 2 also had to meet the following criteria: a hemoglobin count of 10 g/dL or higher, a glomerular filtration rate of 50 mL/min or higher, and no history of New York Heart Association Class III heart failure.
Patients were excluded if they had previously received enfortumab vedotin any other MMAE-based ADC treatment targeting another stimulatory or co-inhibitory T-cell receptor, or prior anticancer treatment that was not completed 4 weeks before the start of study treatment. Patients were also excluded if they had previously received a PD-1 or PD-L1 inhibitor for any malignancy, including earlier-stage urothelial carcinoma. Moreover, patients were excluded if they had uncontrolled diabetes, an estimated life expectancy of less than 12 weeks, ongoing grade 2 or higher sensory or motor neuropathy, or active central nervous system metastasis. Finally, patients were excluded if they had conditions that required high doses of steroids (> 10 mg/day of prednisone or equivalent) or other immunosuppressive medications.
Interventions
Treatments were administered in an open-label manner. Patients in the EV + P arm received enfortumab vedotin via a 30-minute IV infusion at a dose of 1.25 mg/kg on days 1 and 8 of a 21-day cycle, followed by pembrolizumab administered via a 30-minute IV infusion at a dose of 200 mg on day 1 of the 21-day cycle. Patients in the PLAT + GEM arm received treatment in 21-day cycles using either cisplatin (70 mg/m2 via a 1-hour IV infusion on day 1 or following local standards) plus gemcitabine (1,000 mg/m2 via IV infusion on days 1 and 8) or carboplatin (area under the curve 4.5 via a 1-hour IV infusion on day 1, or following local standards) plus gemcitabine (1,000 mg/m2 via IV infusion on days 1 and 8). Although not mandated in the study protocol, patients in the PLAT + GEM arm were permitted to receive avelumab maintenance therapy (if eligible and where locally available) after their treatment.
Enfortumab vedotin treatment was not restricted to a maximum number of cycles. Pembrolizumab was administered for a maximum of 35 cycles while cisplatin or carboplatin and GEM were administered for a maximum of 6 cycles. Protocol-defined reasons for treatment discontinuation include progressive disease, AEs, pregnancy, start of subsequent anticancer therapy, investigator decision, patient decision, study termination, or completion of study treatment. In the EV + P arm, treatment beyond progression could be considered for patients who, in the investigator’s judgment, were deriving clinical benefit.
In the EV + P arm, patients who experienced an unacceptable AE attributable only to enfortumab vedotin could continue on pembrolizumab monotherapy up to a maximum of 35 cycles, as determined by the protocol.31 Patients who experienced an unacceptable AE attributable only to pembrolizumab could continue on enfortumab vedotin monotherapy until a protocol-defined reason for treatment discontinuation.31
In the PLAT + GEM arm, patients who experienced an unacceptable AE attributable only to platinum-based chemotherapy (cisplatin or carboplatin) could continue on GEM monotherapy for up to 6 cycles, as determined by the protocol.31 Patients who experienced an unacceptable AE attributable only to GEM could continue on platinum-based chemotherapy for up to 6 cycles, as specified by the protocol.31
Outcomes
The outcomes assessed in the EV-302 trial are presented in Table 6.
Table 6: Outcomes Summarized From the Studies Included in the Systematic Review (At the Data Cut-Off of August 8, 2023)
Outcome measure | EV-302 trial |
|---|---|
PFS according to RECIST 1.1 by BICR | Dual-primarya |
OS | Dual-primarya |
ORR according to RECIST 1.1 by BICR | Secondarya |
Time to pain progression | Secondarya |
Change from baseline in worst painb | Secondarya |
PFS according to RECIST 1.1 by investigator assessment | Secondary |
ORR according to RECIST 1.1 by investigator assessment | Secondary |
DOR and DCR per RECIST 1.1 by investigator assessment | Secondary |
EORTC QLQ-C30 | Secondary |
EQ-5D-5L | Secondary |
Safety | Secondary |
PFS, ORR, and DOR by investigator assessment in the EV + P arm using modified RECIST 1.1 for immune-based therapeutics | Exploratory |
BICR = blinded independent central review; DCR = disease control rate; DOR = duration of response; EORTC QLQ-C30 = European Organisation for Research and Treatment of Cancer Quality of Life Core 30; EV + P = enfortumab vedotin plus pembrolizumab; ORR = objective response rate; OS = overall survival; PFS = progression-free survival; RECIST 1.1 = Response Evaluation Criteria in Solid Tumours Version 1.1.
aStatistical testing for these end points was adjusted for multiple comparisons (sequential testing).
bChange from baseline in worst pain was formally assessed and summarized at week 26.
Sources: Clinical Study Report for EV-302 (Section 4 and Section 5.6.3.4.1)31 and the sponsor’s Summary of Clinical Evidence.14
Overall survival was a dual-primary outcome defined as the time from randomization to death because of any cause. A previous CDA-AMC review of EV monotherapy for second-line or later locally advanced or metastatic UC indicated that, for OS, an HR of 0.702 (95% CI, 0.556 to 0.886; P = 0.00142) relative to chemotherapy was a clinical benefit,41 suggesting that a 30% improvement in the risk of OS events is a reasonable estimate for a minimal important difference (MID) in patients with locally advanced or metastatic UC.
PFS was a dual-primary end point defined as the time from randomization to the first instance of disease progression or death because of any cause. No MID for PFS was identified in the first-line locally advanced or metastatic UC setting. However, a previous CDA-AMC review of EV monotherapy for locally advanced or metastatic UC indicated that an HR of 0.615 (95% CI, 0.505 to 0.748; P = 0.00142) for PFS relative to chemotherapy provided a clinical benefit.41 A 39% improvement in the risk of PFS events is therefore a reasonable estimate for an MID in patients with locally advanced or metastatic UC.
The independent BICR evaluated response-based outcomes (PFS, ORR, DOR, and disease control rate) using RECIST 1.1. No MIDs for the ORR, DOR, or disease control rate outcomes were reported.
The EORTC QLQ-C30 questionnaire is a 30-item, patient-reported, cancer-specific tool for evaluating QoL. Measures within the tool include a GHS and QoL scale, 5 functional scales (physical, role, cognitive, emotional, and social), 3 symptom scales (fatigue, pain, and nausea/vomiting), and 6 single items (dyspnea, loss of appetite, insomnia, constipation, diarrhea, and perceived financial impact). Most questions are scored from 1 (not at all) to 4 (very much), while the 2 items for the GHS and QoL scale are scored from 1 (very poor) to 7 (excellent). Raw scores are computed as the average of the items that contribute to a particular scale. Each raw scale score is converted to a standardized score that ranges from 0 to 100 using a linear transformation. For functional scales, higher scores represent higher level or healthy functioning; for symptom scales, higher scores indicate high symptom burden (worse); for the GHS and QoL scale, a higher score means better health status and QoL. The sponsor was not aware of reported MIDs for the EORTC QLQ-C30 scores in patients with locally advanced or metastatic UC. However, an anchor-based approach in patients with other cancer types provided estimated MIDs of 10 points (“a little change”), 10 to 20 points (“a moderate change”), and greater than 20 points (“very much changed”).42 This indicates that 10 points is a reasonable estimate for an MID in patients with locally advanced or metastatic UC.
The EQ-5D is a generic utility-based measure of HRQoL that includes 5 self-reported items regarding functioning and well-being as well as a visual analogue scale (EQ VAS). The 5 items evaluate dimensions of health (mobility, self-care, usual activities, pain or discomfort, and anxiety or depression) across 5 levels (no problems, slight problems, moderate problems, severe problems, and extreme problems). A unique EQ-5D health state is defined by combining 1 level from each of the 5 dimensions, with responses to the 5 items converted into a weighted health-state index (utility score) ranging from 0 (death) to 1 (perfect health).43 Patients also self-rate their health status on the EQ VAS, which is scored from 0 (the worst health imaginable) to 100 (the best health imaginable). The sponsor was not aware of any reported MID for the EQ-5D-5L specifically for patients with locally advanced or metastatic UC. However, McClure et al.44 reported that the Canada-specific MID for the index score was 0.037, while Pickard et al.45 reported an MID of 7 to 12 points for the EQ VAS in patients with advanced cancer. These values are therefore reasonable estimates for MIDs in patients with locally advanced or metastatic UC.
Safety assessments included TEAEs, SAEs, withdrawals because of TEAEs, mortality, and adverse events of special interest (AESIs). For enfortumab vedotin, AESIs were broadly classified as skin reactions (grade 3 or 4), peripheral neuropathy (grade 3 or 4), hyperglycemia (grade 3 or 4), ocular disorders (grade 3 or 4, or grade 2 requiring systemic steroids), and infusion-related reactions (grade 3 or 4). For pembrolizumab, common categories of AESIs include severe skin reactions, hypothyroidism, pneumonitis, hyperthyroidism, hepatitis, colitis, and gastritis. The grading of TEAEs was based on the National Cancer Institute Common Terminology Criteria for Adverse Events, version 4.03.
A list of efficacy end points assessed in this Clinical Review is provided in Table 7, followed by descriptions of the outcome measures. Summarized end points are based on outcomes included in the sponsor’s Summary of Clinical Evidence as well as any outcomes identified as important according to the clinical experts consulted for this review and input from patient and clinician groups and public drug plans. Key summarized efficacy end points were assessed using GRADE. Select notable harms outcomes considered important for informing expert committee deliberations were also assessed using GRADE.
Statistical Analysis
Clinical Trial End Points
Time-to-event analyses were conducted using a stratified Cox proportional hazards model with Kaplan-Meier estimates and a stratified log-rank test. Rates of response were analyzed using the Cochran-Mantel-Haenszel test with 95% CIs computed using the Clopper-Pearson method.
Table 7: Statistical Analysis of Efficacy End Points in the EV-302 Trial
End point | Statistical model | Adjustment factors | Handling of missing data | Sensitivity analyses |
|---|---|---|---|---|
PFS by BICR | Stratified log-rank test, stratified Cox proportional hazards model, and Kaplan-Meier estimates with corresponding 95% CIs for median values | Stratification according to cisplatin eligibility (eligible or ineligible), PD-L1 expression (high or low), and liver metastases (present or absent) | Censoring at the data cut-off; no other imputation was performed for missing data | PFS by BICR:
PFS by investigator |
OS | As for PFS by BICR | As for PFS by BICR | As for PFS by BICR |
|
ORR by BICR | Cochran-Mantel-Haenszel test with 95% CI computed using the Clopper-Pearson method | As for PFS by BICR | Missing data not imputed | ORR by investigator |
Time to pain progression | As for PFS by BICR | Age (≥ 65 or < 65 years), sex, region, cisplatin eligibility (eligible or ineligible), PD-L1 expression (high or low), and liver metastases (present or absent) | Missing data not imputed | Censoring of patients (at randomization) who reported opioid pain medication at baseline |
Change from baseline in worst pain at week 26 | Mixed model for repeated measures | Time point, age (≥ 65 or < 65 years), sex, region, baseline worst pain score, baseline opioid pain medication use, cisplatin eligibility (eligible or ineligible), PD-L1 expression (high or low), and liver metastases (present or absent) | Missing data not imputed | None |
DOR by BICR | Stratified log-rank test and Kaplan-Meier estimates | As for PFS by BICR | Missing data not imputed | DOR by investigator |
DCR by BICR | As for ORR by BICR | As for ORR by BICR | Missing data not imputed | DCR by investigator |
Change from baseline in EORTC QLQ-C30 | Descriptive analyses with summary statistics | None | Missing data not imputed | None |
Change from baseline in EQ-5D-5L | Descriptive analyses with summary statistics | None | Missing data not imputed | None |
BICR = blinded independent central review; CI = confidence interval; DCR = disease control rate; DOR = duration of response; EORTC QLQ-C30 = European Organisation for Research and Treatment of Cancer Quality of Life Core 30; IPCW = inverse probability of censoring weighting; ORR = objective response rate; OS = overall survival; PD = progressive disease; PFS = progression-free survival.
Sources: Clinical Study Report for EV-302 (Section 5.6 and the Study Protocol)31 and the sponsor’s Summary of Clinical Evidence.14
Sample Size and Power Calculation
The PFS and OS assumptions for the control arm of the EV-302 trial (PLAT + GEM) were based on a weighted average that 60% of patients would be eligible for cisplatin plus GEM and 40% of patients would be eligible for carboplatin plus GEM. Using that weighting, the control arm was assumed to have a median PFS of 7 months and a median OS of 15.3 months, based on reported values of 5.8 months to 6.6 months for median PFS and 9.3 to 14.3 months for median OS with PLAT + GEM for locally advanced or metastatic UC.46-49 It was also assumed that the OS curves would follow a piecewise exponential distribution, the HR values between the 2 arms would be 0.73 for OS and 0.7 for PFS, the enrolment period would be 30 months, and the annual dropout rate would be 5%. With those assumptions, a planned sample size of 860 patients (randomized 1:1 in the EV-302 trial) would provide at least 90% power for each of the dual-primary end points: OS analyzed at a 2-sided alpha of 0.045 and PFS analyzed at a 2-sided alpha of 0.005. Approximately 489 OS events would be required to demonstrate OS superiority at an interim analysis with an approximately 72.8% information fraction; if OS was statistically significant at the interim analysis, that analysis would be treated as the final OS analysis. The final PFS analysis would be conducted at the interim analysis for OS and approximately 526 PFS events would be required to demonstrate PFS superiority.
Statistical Testing
The EV-302 study controlled the family-wise type I error rate at a 2-sided level of 5% using a graphical approach with sequential testing (Figure 2). The initial alpha allocations were 0.005 to PFS and 0.045 to OS; if 1 of the primary end points was statistically significant, the alpha for that end point could be rolled over to the other end point. Analyses were planned at 2 time points: an interim OS analysis and a final PFS analysis (at the same time point) and a final OS analysis (if necessary); the interim OS analysis would be considered the final OS analysis if OS was statistically significant at that time point. The efficacy boundaries at the interim and final analyses of OS were determined using the Lan-DeMets spending function to approximate O’Brien-Fleming boundaries. If both primary end points were statistically significant, a gatekeeping testing strategy was used to subsequently test ORR by BICR, time to pain progression, and mean change from baseline in worst pain at week 26 for statistical significance. Each of these secondary end points would be tested at a 2-sided alpha of 0.05 if all preceding null hypotheses were rejected.
Figure 2: Graphical Approach with Group Sequential Testing
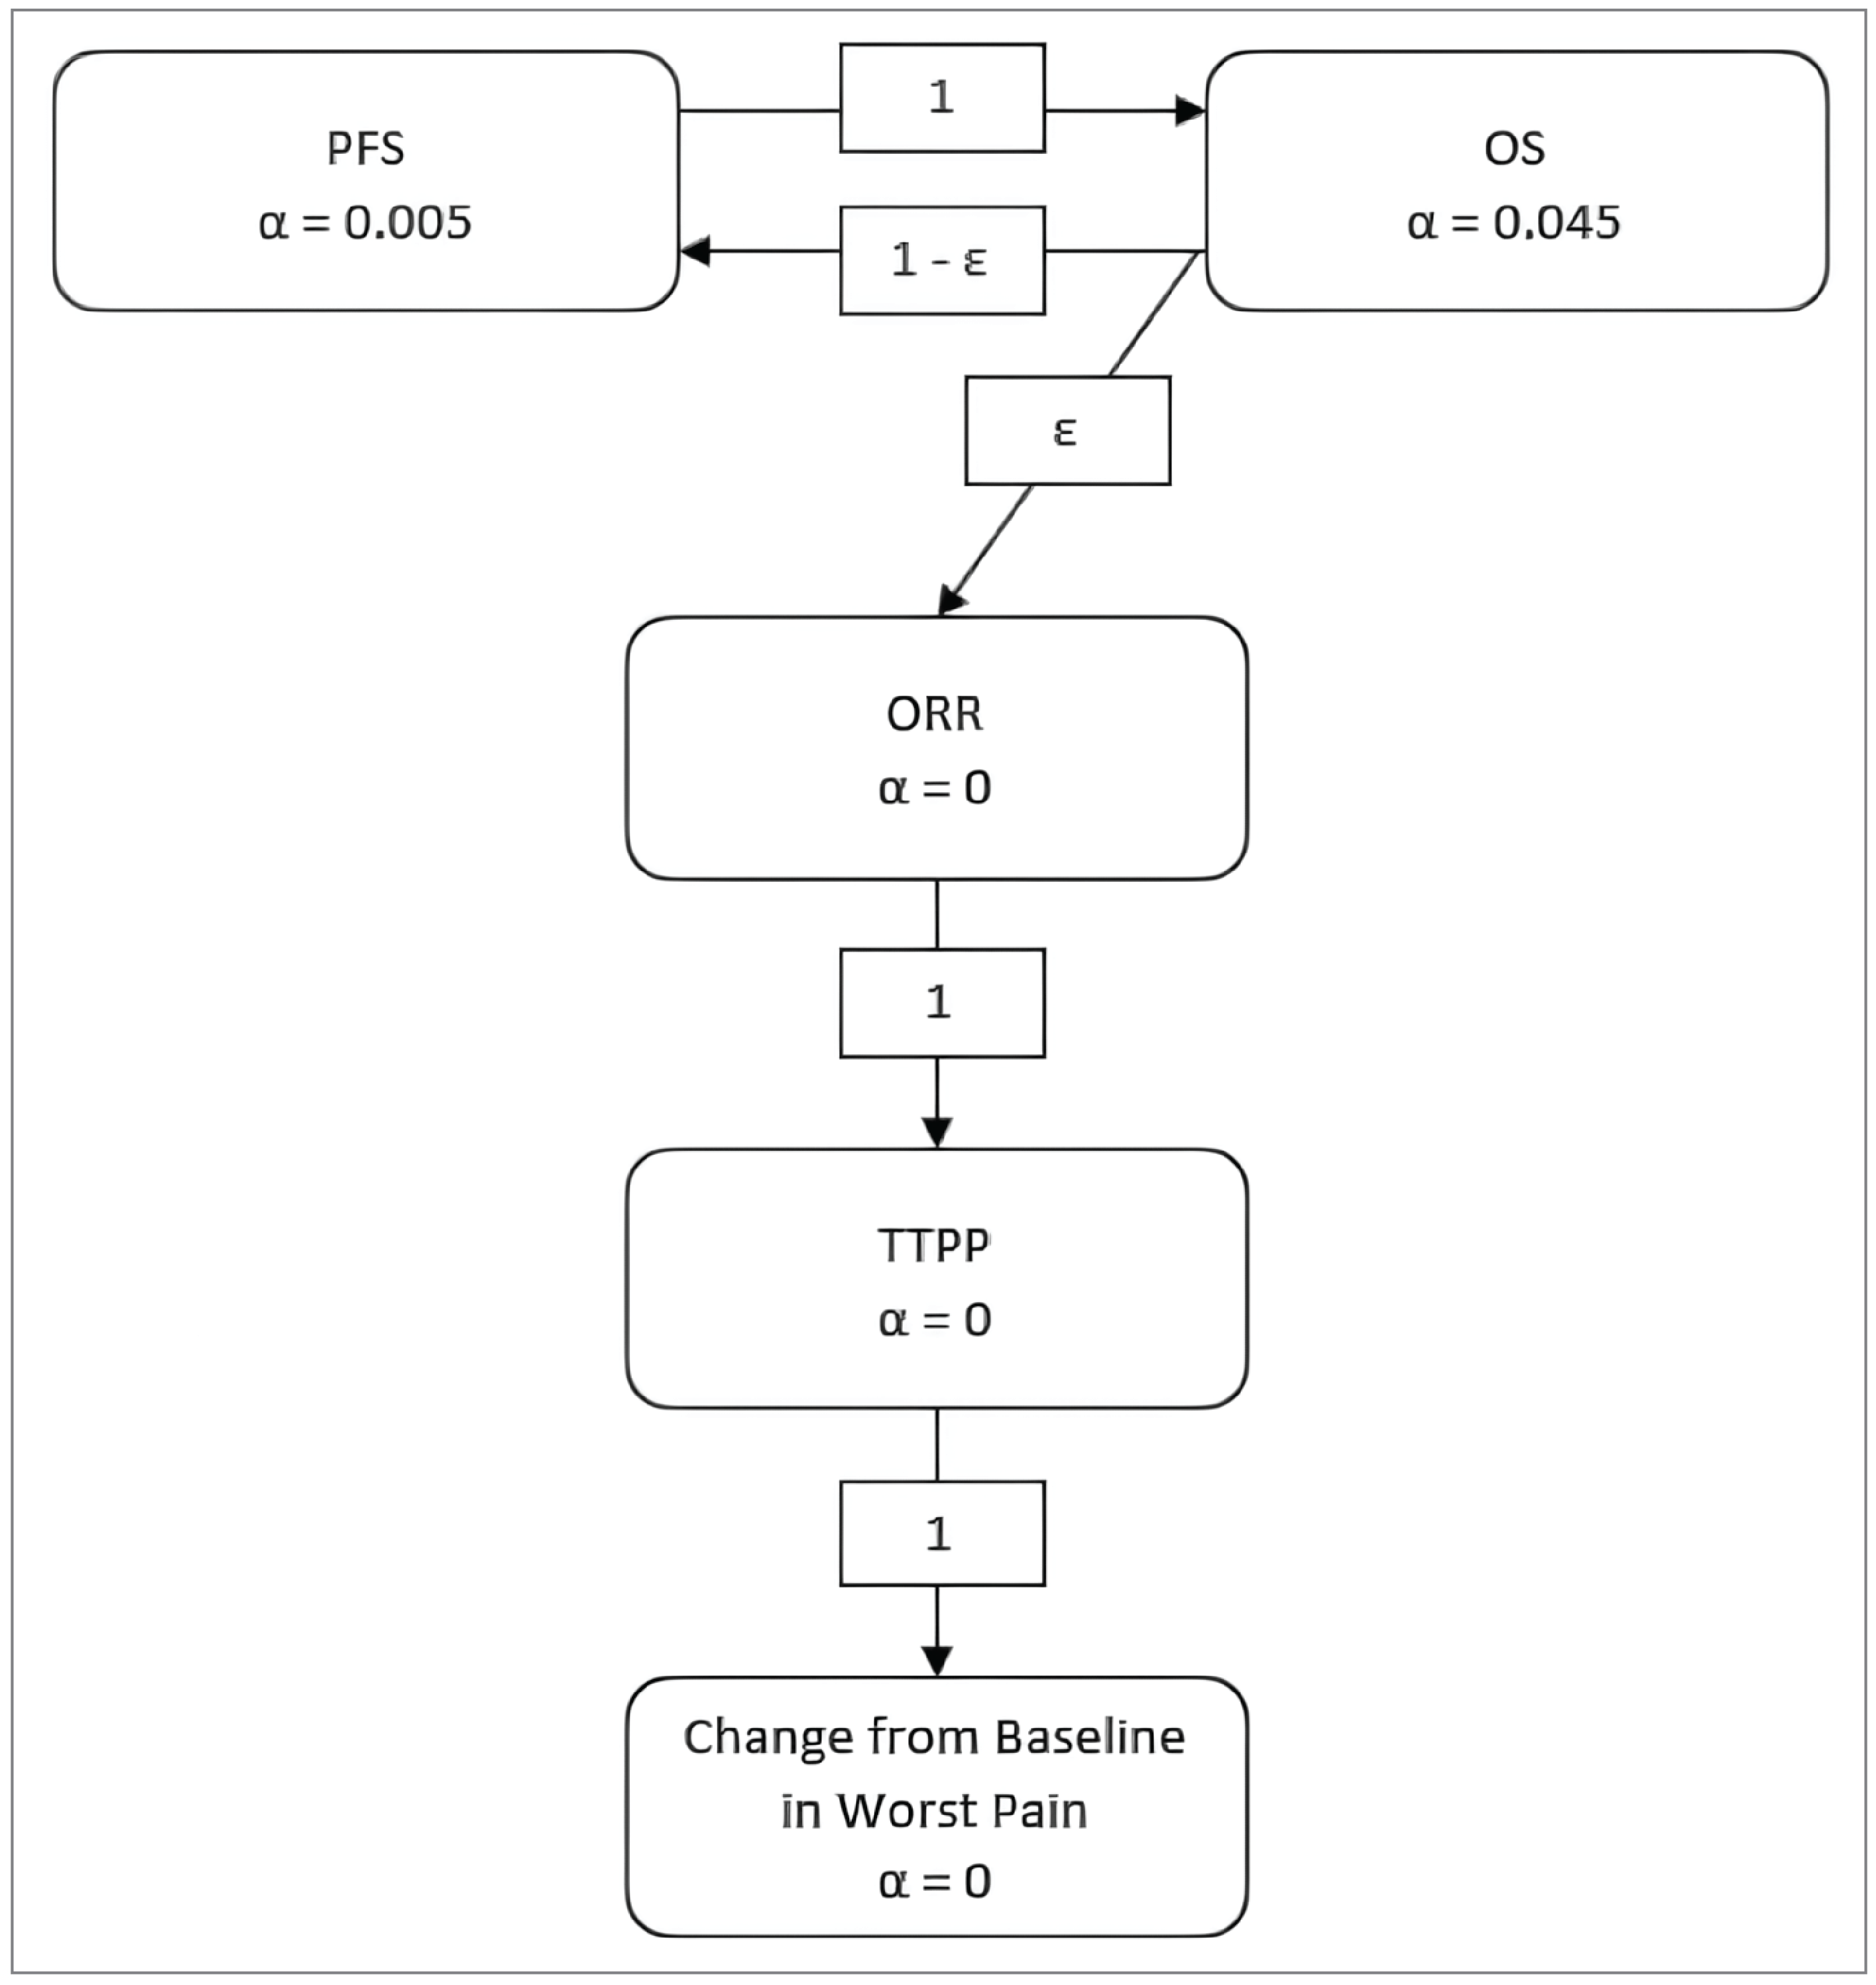
ORR = objective response rate; OS = overall survival; PFS = progression-free survival; TTPP = time to pain progression.
Note: ε is a positive number close to zero (i.e., a negligible amount), indicating the potential to pass alpha to ORR only if both PFS and OS are statistically significant.
Source: Clinical Study Report for EV-302 (Figure 2).31
Subgroup Analyses
Several subgroup analyses were planned, although these were not adjusted for multiplicity:
stratification factors
cisplatin eligibility (eligible, ineligible)
PD-L1 expression (low, high)
liver metastasis (present, absent)
age (< 65 years, ≥ 65 years)
region (North America, Europe, rest of the world)
sex (female, male)
race (white, nonwhite) [from original source]
ECOG PS at baseline (0, 1, or 2)
metastasis site (visceral, lymph nodes only)
primary disease site of origin (upper tract, lower tract)
renal function (normal, mild, moderate-severe)
Sensitivity Analyses
Sensitivity analysis for PFS by BICR included unstratified analysis, ignoring subsequent therapy before progressive disease or death, ignoring 2 or more missed disease assessments before progressive disease or death, and stratified analysis using strata that were verified after randomization and PFS by investigator. Sensitivity analysis for OS included unstratified analysis, stratified analysis using strata that were verified after randomization, and an inverse probability of censoring weighting method for subsequent anticancer therapy (Table 8).
Analysis Populations
Four main analysis populations are summarized in Table 9. The EV-302 study also included a pharmacokinetic analysis set, although this set was excluded because it is not relevant to decision-making.
Table 8: Analysis Dataset for the EV-302 Trial
Population | Definition | Application |
|---|---|---|
Intention-to-treat analysis set | Includes all randomized patients; patients analyzed according to the treatment arm assigned at randomization regardless of the actual treatment received | OS and PFS |
Response-evaluable analysis set | Includes all randomized patients who had measurable disease according to RECIST 1.1 at baseline; patients analyzed according to the treatment arm assigned at randomization regardless of the actual treatment received | ORR |
Safety analysis set | Includes all patients who receive any study treatment; patients analyzed according to the actual treatment received | Safety analyses |
PRO full analysis set | Includes all randomized patients who received any study treatment and completed at least 1 PRO assessment at baseline; patients analyzed according to the treatment arm assigned at randomization | PROs |
ORR = objective response rate; OS = overall survival; PFS = progression-free survival; PRO = patient-reported outcome; RECIST 1.1 = Response Evaluation Criteria in Solid Tumours Version 1.1.
Sources: Clinical Study Report for EV-302 (Table 7)31 and the sponsor’s Summary of Clinical Evidence.14
Results
Patient Disposition
A total of 1,297 patients gave informed consent but 397 patients did not meet eligibility criteria or withdrew consent (Table 9). As a result, 886 patients (the ITT population) were randomized to receive EV + P (n = 442) or PLAT + GEM (n = 444). At the data cut-off (August 8, 2023), the overall median follow-up was 17.2 months (95% CI, 16.5 to 17.9; range, 0.07 to 37.16). A total of 114 patients (32.6%) in the EV + P arm remained on treatment while no patients were continuing treatment in the PLAT + GEM arm (the maximum number of cycles was 6). In the EV + P arm, the most common reasons for treatment discontinuation were disease progression and TEAEs. In the PLAT + GEM arm, the most common reason for treatment discontinuation was completed treatment. Study discontinuation was recorded for 33.0% of patients in the EV + P arm and 54.3% of patients in the PLAT + GEM arm. The most common reason for study discontinuation in both treatment arms was death (EV + P: 29.9%; PLAT + GEM: 50.9%) and most deaths were considered related to the patients’ locally advanced or metastatic UC.
Table 9: Summary of Patient Disposition From the EV-302 ITT Population Included in the Systematic Review
Patient disposition | EV + P (N = 442) | PLAT + GEM (N = 444) |
|---|---|---|
Consented to be enrolled, N | 1,297 | |
Reason for unsuccessful screening, n (%) | 397 (30.6) | |
Patient did not meet eligibility criteria | 263 of 397 (66.2) | |
Patient withdrew consent | 52 of 397 (13.1) | |
Death | 19 of 397 (4.8) | |
Investigator decision | 24 of 397 (6.0) | |
Other | 39 of 397 (9.8) | |
Randomized, N | 442 | 444 |
Treated | 440 (99.6) | 433 (97.5) |
On treatment | 144 (32.6) | 0 |
Discontinued from treatment, n (%) | 296 (67.0) | 433 (97.5) |
Completed treatment | 8 (1.8) | 244 (55.0) |
Progressive disease | 153 (34.6) | 73 (16.4) |
Adverse event | 97 (21.9) | 62 (14.0) |
Physician decision | 9 (2.0) | 28 (6.3) |
Patient decision | 22 (5.0) | 24 (5.4) |
Other | 7 (1.6) | 2 (0.5) |
Discontinued from study, n (%) | 146 (33.0) | 241 (54.3) |
Patient withdrawal | 12 (2.7) | 14 (3.2) |
Lost to follow-up | 2 (0.5) | 1 (0.2) |
Death | 132 (29.9) | 226 (50.9) |
ITT analysis set, N | 442 (100) | 444 (100) |
Safety analysis set, N | 440 (99.5) | 433 (97.5) |
Response evaluable by BICR, N | 437 (98.9) | 441 (99.3) |
PRO analysis set | 376 (85.1) | 355 (80.0) |
BICR = blinded independent central review; EV + P = enfortumab vedotin plus pembrolizumab; ITT = intention to treat; PLAT + GEM = platinum-based chemotherapy (cisplatin or carboplatin) plus gemcitabine; PRO = patient-reported outcome.
Sources: Clinical Study Report for EV-302 (Figure 3 and Table 10)31 and the sponsor’s Summary of Clinical Evidence.14
Baseline Characteristics
Patient Population
The 2 treatment arms had generally similar demographic characteristics (Table 10), clinical characteristics (Table 11), and disease characteristics (Table 12). No major imbalances were noted.
Among all patients, the mean age was 67.9 years (SD = 9.2 years) and most patients were male (76.7%), white (67.5%), and aged 65 years or older (68.5%). Enrolled patients were distributed across Europe (41.6%), other regions (37.1%), and North America (21.2%), and included 47 (5.3%) who were enrolled at 11 sites in Canada.
Most patients had an ECOG PS of 0 or 1, and an ECOG PS of 2 was reported by 2.9% of patients overall. Most patients (65.5%) were current or former smokers, and most (55.1%) had a body mass index of 25 kg/m2 or greater. The most common organ function classifications were moderate renal insufficiency (41.2%) and normal hepatic function (88.7%). The mean hemoglobin A1C concentration was 5.37% (SD = 1.10%). Cisplatin ineligibility was noted for 45.6% of patients overall (404 of 886), most commonly related to a glomerular filtration rate of less than 60 mL/min (327 of 404 patients, or 80.9%).
Most patients had metastatic disease at baseline (94.9%), with a mean interval of 2.65 months (SD = 5.73) between the diagnosis of locally advanced or metastatic UC and enrolment. The most common primary disease site was the lower tract (72.7%), and most cases involved visceral metastases (71.8%).
Table 10: Demographic Characteristics of Patients in the EV-302 ITT Analysis Set
Characteristic | EV + P (N = 442) | PLAT + GEM (N = 444) | Total (N = 886) |
|---|---|---|---|
Age (years) | |||
Mean (SD) | 67.9 (9.1) | 68.0 (9.4) | 67.9 (9.2) |
Range | 37 to 87 | 22 to 91 | 22 to 91 |
< 65 years, n (%) | 144 (32.6) | 135 (30.4) | 279 (31.5) |
65 to < 75 years, n (%) | 196 (44.3) | 201 (45.3) | 397 (44.8) |
≥ 75 years, n (%) | 102 (23.1) | 108 (24.3) | 210 (23.7) |
Sex, n (%) | |||
Male | 344 (77.8) | 336 (75.7) | 680 (76.7) |
Female | 98 (22.2) | 108 (24.3) | 206 (23.3) |
Race, n (%) | |||
American Indian or Alaska Native | 2 (0.5) | 2 (0.5) | 4 (0.5) |
Asian | 99 (22.4) | 92 (20.7) | 191 (21.6) |
Black or African American | 3 (0.7) | 7 (1.6) | 10 (1.1) |
Native Hawaiian or other Pacific Islander | 0 | 1 (0.2) | 1 (0.1) |
White | 308 (69.7) | 290 (65.3) | 598 (67.5) |
Other | 3 (0.7) | 1 (0.2) | 4 (0.5) |
Multiple | 0 | 4 (0.9) | 4 (0.5) |
Unknown | 5 (1.1) | 10 (2.3) | 15 (1.7) |
Not reportable | 22 (5.0) | 37 (8.3) | 59 (6.7) |
Geographic region, n (%) | |||
North America | 103 (23.3) | 85 (19.1) | 188 (21.2) |
Europe | 172 (38.9) | 197 (44.4) | 369 (41.6) |
Rest of world | 167 (37.8) | 162 (36.5) | 329 (37.1) |
EV + P = enfortumab vedotin plus pembrolizumab; ITT = intention to treat; PLAT + GEM = platinum-based chemotherapy (cisplatin or carboplatin) plus gemcitabine; SD = standard deviation.
Sources: Clinical Study Report for EV-302 (Table 11)31 and the sponsor’s Summary of Clinical Evidence.14
Table 11: Baseline Clinical Characteristics of Patients in the EV-302 ITT Analysis Set
Characteristic | EV + P (N = 442) | PLAT + GEM (N = 444) | Total (N = 886) |
|---|---|---|---|
ECOG PS, n (%) | |||
0 | 223 (50.5) | 215 (48.4) | 438 (49.4) |
1 | 204 (46.2) | 216 (48.6) | 420 (47.4) |
2 | 15 (3.4) | 11 (2.5) | 26 (2.9) |
Missing | 0 | 2(0.5) | 2 (0.2) |
Smoking status, n (%) | |||
Former or current smoker | 301 (68.1) | 279 (62.8) | 580 (65.5) |
Nonsmoker | 128 (29.0) | 144 (32.4) | 272 (30.7) |
Unknown | 13 (2.9) | 21 (4.7) | 34 (3.8) |
Body mass index (kg/m2) | |||
Mean (SD) | 26.08 (4.72) | 26.66 (5.20) | 26.37 (4.97) |
Range | 15.1, 42.3 | 15.6, 49.3 | 15.1, 49.3 |
< 25 kg/m2 | 206 (46.6) | 185 (41.7) | 391 (44.1) |
25 to < 30 kg/m2 | 144 (32.6) | 155 (34.9) | 299 (33.7) |
≥ 30 kg/m2 | 89 (20.1) | 101 (22.7) | 190 (21.4) |
Missing | 3 (0.7) | 3 (0.7) | 6 (0.7) |
Renal function based on CrCl,a n (%) | |||
Normal: ≥ 90 mL/min | ||||| || ||||||||| || |||| | ||||| || ||||||||| || |||| | ||||| || ||||||||| || |||| |
Mild decrease: ≥ 60 and < 90 mL/min | ||||| || ||||||||| || |||| | ||||| || ||||||||| || |||| | ||||| || ||||||||| || |||| |
Moderate decrease: ≥ 30 and < 60 mL/min | ||||| || ||||||||| || |||| | ||||| || ||||||||| || |||| | ||||| || ||||||||| || |||| |
Severe decrease: ≥ 15 and < 30 mL/min | ||||| || ||||||||| || |||| | ||||| || ||||||||| || |||| | ||||| || ||||||||| || |||| |
Hepatic function,b n (%) | |||
Normal | ||||| || ||||||||| || |||| | ||||| || ||||||||| || |||| | ||||| || ||||||||| || |||| |
Mild | ||||| || ||||||||| || |||| | ||||| || ||||||||| || |||| | ||||| || ||||||||| || |||| |
Moderate | ||||| || ||||||||| || |||| | ||||| || ||||||||| || |||| | ||||| || ||||||||| || |||| |
Severe | ||||| || ||||||||| || |||| | ||||| || ||||||||| || |||| | ||||| || ||||||||| || |||| |
Unknown | ||||| || ||||||||| || |||| | ||||| || ||||||||| || |||| | ||||| || ||||||||| || |||| |
Hemoglobin A1C (%) | |||
Mean (SD) | ||||| || ||||||||| || |||| | ||||| || ||||||||| || |||| | ||||| || ||||||||| || |||| |
Range | ||||| || ||||||||| || |||| | ||||| || ||||||||| || |||| | ||||| || ||||||||| || |||| |
< 5.7% | ||||| || ||||||||| || |||| | ||||| || ||||||||| || |||| | ||||| || ||||||||| || |||| |
≥ 5.7 and < 6.5% | ||||| || ||||||||| || |||| | ||||| || ||||||||| || |||| | ||||| || ||||||||| || |||| |
≥ 6.5% | ||||| || ||||||||| || |||| | ||||| || ||||||||| || |||| | ||||| || ||||||||| || |||| |
Missing | ||||| || ||||||||| || |||| | ||||| || ||||||||| || |||| | ||||| || ||||||||| || |||| |
Bajorin risk factors,c n (%) | |||
0 | 179 (40.5) | 183 (41.2) | 362 (40.9) |
1 | 263 (59.5) | 259 (58.3) | 522 (58.9) |
Missing | 0 | 2 (0.5) | 2 (0.2) |
Cisplatin ineligibility | |||
Patients who were cisplatin-ineligible at randomization | 202 | 202 | 404 |
Patients meeting ≥ 1 of following criteria,d n/N (%) | ||||| || ||||||||| || |||| | ||||| || ||||||||| || |||| | ||||| || ||||||||| || |||| |
GFR < 60 mL/min | ||||| || ||||||||| || |||| | ||||| || ||||||||| || |||| | ||||| || ||||||||| || |||| |
Grade ≥ 2 hearing loss | ||||| || ||||||||| || |||| | ||||| || ||||||||| || |||| | ||||| || ||||||||| || |||| |
ECOG PS of 2 | ||||| || ||||||||| || |||| | ||||| || ||||||||| || |||| | ||||| || ||||||||| || |||| |
NYHA Class III heart failure | ||||| || ||||||||| || |||| | ||||| || ||||||||| || |||| | ||||| || ||||||||| || |||| |
Patients meeting ≥ 2 criteria, n/N (%) | ||||| || ||||||||| || |||| | ||||| || ||||||||| || |||| | ||||| || ||||||||| || |||| |
AST = aspartate transaminase; CrCl = creatinine clearance; ECOG PS = Eastern Cooperative Oncology Group Performance Status; EV + P = enfortumab vedotin plus pembrolizumab; GFR = glomerular filtration rate; ITT = intention to treat; NYHA = New York Heart Association; PLAT + GEM = platinum-based chemotherapy (cisplatin or carboplatin) plus gemcitabine; SD = standard deviation; ULN = upper limit of normal.
aCreatinine clearance was estimated using Cockcroft-Gault formula based on the last nonmissing serum creatinine measurement before the first dose of the study treatment.
bHepatic function was estimated based on the last nonmissing AST and total bilirubin measurements before the first dose of study treatment. Normal: total bilirubin less than or equal to the ULN and AST less than or equal to the ULN; mild: (total bilirubin > 1 − 1.5 × ULN and any AST) or (total bilirubin ≤ ULN and AST > ULN); moderate: (total bilirubin > 1.5 to 3 × ULN and any AST; severe: (total bilirubin > 3 × ULN and any AST).
cBajorin risk factors include visceral metastases (bone, lung, liver) and an ECOG PS greater than 2. Patients with an ECOG PS greater than 2 were not eligible for the study.
dA patient could be counted in more than 1 category.
Sources: Clinical Study Report for EV-302 (Table 12 and Table 14)31 and the sponsor’s Summary of Clinical Evidence.14
Table 12: Baseline Disease Characteristics of Patients in the EV-302 ITT Analysis Set
Characteristics | EV + P (N = 442) | PLAT + GEM (N = 444) | Total (N = 886) |
|---|---|---|---|
Disease status at randomization, n (%) | |||
Metastatic | 421 (95.2) | 420 (94.6) | 841 (94.9) |
Locally advanced | 21 (4.8) | 24 (5.4) | 45 (5.1) |
Time from diagnosis of locally advanced or metastatic disease to randomization,a months | |||
Mean (SD) | ||||| || |||| | ||||| || |||| | ||||| || |||| |
Range | ||||| || |||| | ||||| || |||| | ||||| || |||| |
Primary disease site of origin, n (%) | |||
Upper tract | 135 (30.5) | 104 (23.4) | 239 (27.0) |
Lower tract | 305 (69.0) | 339 (76.4) | 644 (72.7) |
Unknown | 2 (0.5) | 1 (0.2) | 3 (0.3) |
Histology type, n (%) | |||
Urothelial carcinoma | 379 (85.7) | 373 (84.0) | 752 (84.9) |
Urothelial carcinoma mixed | 50 (11.3) | 53 (11.9) | 103 (11.6) |
Variant urothelial carcinoma only without typical UC | 4 (0.9) | 7 (1.6) | 11 (1.2) |
Unknown | 9 (2.0) | 11 (2.5) | 20 (2.3) |
Disease stage at randomization, n (%) | |||
III | ||||| || |||| | ||||| || |||| | ||||| || |||| |
IIIA | ||||| || |||| | ||||| || |||| | ||||| || |||| |
IIIB | ||||| || |||| | ||||| || |||| | ||||| || |||| |
IV | ||||| || |||| | ||||| || |||| | ||||| || |||| |
IVA | ||||| || |||| | ||||| || |||| | ||||| || |||| |
IVB | ||||| || |||| | ||||| || |||| | ||||| || |||| |
Other | ||||| || |||| | ||||| || |||| | ||||| || |||| |
Unknown | ||||| || |||| | ||||| || |||| | ||||| || |||| |
Metastasis category, n (%) | |||
Visceral metastases | 318 (71.9) | 318 (71.6) | 636 (71.8) |
Lymph-nodes-only disease | 103 (23.3) | 104 (23.4) | 207 (23.4) |
Not applicableb | 21 (4.8) | 22 (5.0) | 43 (4.9) |
EV + P = enfortumab vedotin plus pembrolizumab; ITT = intention to treat; PLAT + GEM = platinum-based chemotherapy (cisplatin or carboplatin) plus gemcitabine; SD = standard deviation; UC = urothelial cancer.
aCalculated from the date of locally advanced or metastatic disease, whichever is later, to the date of randomization.
bPatients had locally advanced disease without metastasis to lymph nodes or distant organs.
Sources: Clinical Study Report for EV-302 (Table 12)31 and the sponsor’s Summary of Clinical Evidence.14
The baseline characteristics outlined in Table 11 are limited to those that were most relevant to this review or were assumed to affect the outcomes or interpretation of the study results.
Exposure to Study Treatments
Prior Anticancer Treatments
According to the study protocol, patients could have previously undergone local therapy or adjuvant or neoadjuvant treatment for their urothelial carcinoma, although patients were not permitted to have previously received systemic treatment for locally advanced or metastatic UC. No notable differences were observed in the patients’ previous local therapies or adjuvant or neoadjuvant treatments (Table 13).
Table 13: Prior Anticancer Treatments (ITT Analysis Set)
Treatments | EV + P (N = 442) | PLAT + GEM (N = 444) |
|---|---|---|
Prior systemic therapy in adjuvant or neoadjuvant setting, n (%) | ||
Platinum-based therapy | 40 (9.0) | 36 (8.1) |
Cisplatin-based therapy | 35 (7.9) | 33 (7.4) |
Carboplatin-based therapy | 5 (1.1) | 3 (0.7) |
Nonplatinum-based therapy | 1 (0.2) | 4 (0.9) |
Prior surgery, n (%) | ||||| || |||| | ||||| || |||| |
Cystectomy | ||||| || |||| | ||||| || |||| |
Nephrectomy or ureterectomy | ||||| || |||| | ||||| || |||| |
Metastasectomy | ||||| || |||| | ||||| || |||| |
Prior radiation therapy, n (%) | ||||| || |||| | ||||| || |||| |
EV + P = enfortumab vedotin plus pembrolizumab; PLAT = platinum-based chemotherapy (cisplatin or carboplatin).
Sources: Clinical Study Report for EV-302 (Table 18 and Table 19)31 and the sponsor’s Summary of Clinical Evidence.14
Study Treatments
The maximum number of cycles was 35 cycles for pembrolizumab and 6 cycles for cisplatin, carboplatin, and/or GEM. No maximum number of cycles was defined for enfortumab vedotin (Table 14).
In the EV + P arm, the median treatment duration was 9.43 months and the median number of cycles was 12. In the PLAT + GEM arm, the median treatment duration was 4.14 months, and the median number of cycles was 6. This difference is related to the maximum number of cycles specified in the protocol for the PLAT + GEM arm (Table 14).
Table 14: Summary of Patient Exposure From Studies Included in the Systematic Review (Safety Analysis Set)
Parameters and drugs | Drugs | EV + P (N = 442) | PLAT + GEM (N = 444) |
|---|---|---|---|
Duration of treatment (months)a | |||
Overall | Mean (SD) | ||||| || |||| | ||||| || |||| |
Median | 9.43 | 4.14 | |
Range | 0.3 to 31.9 | 0.0 to 7.7 | |
Enfortumab vedotin | Mean (SD) | ||||| || |||| | — |
Median | 7.01 | — | |
Range | 0.3 to 31.9 | — | |
Pembrolizumab | Mean (SD) | ||||| || |||| | — |
Median | 8.46 | — | |
Range | 0.3 to 28.5 | — | |
Number of cyclesb | |||
Overall | Mean (SD) | ||||| || |||| | ||||| || |||| |
Median | 12.0 | 6.0 | |
Range | 1 to 46 | 1 to 6 | |
Enfortumab vedotin | Mean (SD) | ||||| || |||| | — |
Median | 9.0 | — | |
Range | 1 to 46 | — | |
Pembrolizumab | Mean (SD) | ||||| || |||| | — |
Median | 11.0 | — | |
Range | 1 to 35 | — | |
Enfortumab vedotin RDI, %c | |||
Enfortumab vedotin | Mean (SD) | ||||| || |||| | — |
Median | ||||| || |||| | — | |
Range | ||||| || |||| | — | |
ADI = actual dose intensity; EV + P = enfortumab vedotin plus pembrolizumab; IDI = intended dose intensity; PLAT + GEM = platinum-based chemotherapy (cisplatin or carboplatin) plus gemcitabine; RDI = relative dose intensity; SD = standard deviation.
aDuration of treatment is the time from the first dose of study drug to the earliest of the following: day 21 of the last treatment cycle, start of subsequent anticancer therapy, date of death, end of study or analysis data cut-off date if the subject is still on treatment at the time of the analysis.
bCycle with any amount (> 0) of study drug received.
cRDI = ADI-IDI × 100%, where IDI is the intended dose intensity per study protocol (i.e., 2.50 mg/kg/3-week cycle), and ADI is the actual dose per unit of time that a patient received over the entire treatment period. For the purpose of calculating the ADI, the treatment period is defined as the time from first dose of enfortumab vedotin to day 21 of last treatment cycle that enfortumab vedotin was administered regardless of whether death occurs before the end of cycle.
Sources: Clinical Study Report for EV-302 (Table 23)31 and the sponsor’s Summary of Clinical Evidence.14
Concomitant Medications and Co-Interventions
Concomitant medications used during the EV-302 trial were consistent with the management of patients with locally advanced or metastatic UC. Analgesics were common in the EV + P arm (68.9%) and the PLAT + GEM arm (60.3%), as were antibacterials for systemic use (EV + P: 56.8%, PLAT + GEM: 43.2%) and antithrombotic agents (EV + P: 38.4%, PLAT + GEM: 43.6%). Antiemetics and antinauseants were less common in the EV + P arm (34.8%) than in the PLAT + GEM arm (75.1%), as were corticosteroids for systemic use (EV + P: 52.5%, PLAT + GEM: 72.3%). Antihistamines for systemic use were more common in the EV + P arm (52.5%) than in the PLAT + GEM arm (21.0%).
Table 15: Concomitant Cancer-Related Procedures (Safety Analysis Set)
Procedures | EV + P (N = 440) | PLAT + GEM (N = 433) |
|---|---|---|
Overall | ||||| || |||| | ||||| || |||| |
Radiotherapy | ||||| || |||| | ||||| || |||| |
Surgical resection | ||||| || |||| | ||||| || |||| |
Biopsy | ||||| || |||| | ||||| || |||| |
Other (e.g., paracentesis, thoracentesis) | ||||| || |||| | ||||| || |||| |
EV + P = enfortumab vedotin plus pembrolizumab; PLAT + GEM = platinum-based chemotherapy (cisplatin or carboplatin).
Sources: Clinical Study Report for EV-302 (Table 12.2.2.6)31 and the sponsor’s Summary of Clinical Evidence.14
Small proportions of patients underwent concomitant cancer-related procedures (Table 15), although these procedures are not expected to substantially bias the findings in favour of either treatment arm. Palliative radiotherapy on a nontarget bone lesion that was not progressing was permitted according to the study protocol.
Subsequent Anticancer Treatments
Subsequent anticancer treatment was substantially less frequent in the EV + P arm (31.7%) compared to the PLAT + GEM arm (70.5%), a difference that was expected because of the restriction of the maximal treatment cycles for PLAT + GEM (i.e., 6 cycles). The first subsequent systemic treatment was most commonly used platinum-based therapy in the EV + P arm (24.9%) compared to PD-L1 therapy in the PLAT + GEM arm (58.6%, split between maintenance therapy [32.2%] and second-line therapy [26.4%]). In the PLAT + GEM arm, avelumab maintenance was the most common first subsequent systemic therapy (30.4%), as shown in Table 16. This pattern of switching between immunotherapy and chemotherapy is considered consistent with Canadian practice for patients with locally advanced or metastatic UC.13,29
Table 16: Summary of Subsequent Treatment From Studies Included in the Systematic Review (ITT Analysis Set)
Treatments | EV + P (N = 442) | PLAT + GEM (N = 444) |
|---|---|---|
Any subsequent therapy, n (%) | 140 (31.7) | 313 (70.5) |
Palliative radiotherapy | ||||| || |||| | ||||| || |||| |
Nonpalliative radiotherapy | ||||| || |||| | ||||| || |||| |
Systemic therapy | ||||| || |||| | ||||| || |||| |
Surgical procedure | ||||| || |||| | ||||| || |||| |
Other | ||||| || |||| | ||||| || |||| |
Number of lines of subsequent systemic therapy, n (%) | ||
1 | ||||| || |||| | ||||| || |||| |
2 | ||||| || |||| | ||||| || |||| |
≥ 3 | ||||| || |||| | ||||| || |||| |
First subsequent systemic therapy, n (%) | ||
Platinum-based therapy | 110 (24.9) | 17 (3.8) |
Cisplatin-based | ||||| || |||| | ||||| || |||| |
Carboplatin-based | ||||| || |||| | ||||| || |||| |
Other | ||||| || |||| | ||||| || |||| |
Maintenance PD-1 or PD-L1 inhibitor | 0 | 143 (32.2) |
Avelumab | 0 | 135 (30.4) |
Pembrolizumab | ||||| || |||| | ||||| || |||| |
Other PD-1 or PD-L1 inhibitor–containing therapy | 7 (1.6) | 117 (26.4) |
Other | ||||| || |||| | ||||| || |||| |
Enfortumab vedotin | ||||| || |||| | ||||| || |||| |
Time from last dose to first subsequent systemic therapy for progressive disease (months) | ||
n | 113 | 193 |
Mean (SD) | ||||| || |||| | ||||| || |||| |
Median | ||||| || |||| | ||||| || |||| |
Minimum to maximum | ||||| || |||| | ||||| || |||| |
EV + P = enfortumab vedotin plus pembrolizumab; ITT = intention to treat; PLAT = platinum-based chemotherapy (cisplatin or carboplatin); SD = standard deviation.
Sources: Clinical Study Report for EV-302 (Table 20)31 and the sponsor’s Summary of Clinical Evidence.14
Efficacy
Data from the data cut-off (August 8, 2023) is presented in this section. At the data cut-off, an overall median follow-up time was 17.2 months (95% CI, 16.5 to 17.9 months; range, 0.07 to 37.16). In the EV+ P arm, the median follow-up was 17.3 months (95% CI, 16.4 to 18.2 months; range, 0.26 to 37.16). In the PLAT + GEM arm, the median follow-up was 16.9 months (95% CI, 16.1 to 18.5 months; range, 0.07 to 36.21). The key efficacy outcomes are presented briefly in Table 17.
Table 17: Summary of Key Efficacy Results From Studies Included in the Systematic Review (ITT Analysis Set)
Outcomes | EV + P (N = 442) | PLAT + GEM (N = 444) |
|---|---|---|
Dual-primarya: PFS by BICR | ||
Progression or death, n (%) | 223 (50.5) | 307 (69.1) |
Median PFS, months (95% CI) | 12.5 (10.4 to 16.6) | 6.3 (6.2 to 6.5) |
Treatment-group difference of median PFS vs. control, months (95% CI) | 6.2 (||||| || ||||) | |
Stratified hazard ratio (95% CI) | 0.450 (0.377 to 0.538) | |
P value (threshold for statistical significance is 0.005) | < 0.00001a | |
Dual-primarya: OS | ||
Deaths, n (%) | 133 (30.1) | 226 (50.9) |
Median OS, months (95% CI) | 31.5 (25.4 to NE) | 16.1 (13.9 to 18.3) |
Treatment-group difference of median OS vs. control, months (95% CI) | ||||| || |||| | |
Stratified hazard ratio (95% CI) | 0.468 (0.376 to 0.582) | |
P value (threshold for statistical significance is 0.01548) | < 0.00001a | |
Key secondarya: ORR by BICR | ||
Response evaluable by BICR | N = 437 | N = 441 |
Number of patients with objective response, n | 296 | 196 |
ORR, % (95% CI) | 67.7 (63.1 to 72.1) | 44.4 (39.7 to 49.2) |
Treatment-group difference vs. control, % (95%) | ||||| || |||| | |
P value (threshold for statistical significance is 0.05) | < 0.00001a | |
Key secondarya: time to pain progression | ||
Patients with baseline BPI-SF scores | N = 374 | N = 355 |
Patients with pain progression | 162 (43.3) | 144 (40.6) |
Time to pain progression, median months (95% CI) | 14.2 (||||| || ||||) | 10.0 (||||| || ||||) |
Treatment-group difference vs. control, % | 4.2 | |
Stratified hazard ratio (95% CI) | 0.916 (0.720 to 1.166) | |
P value (threshold for statistical significance is 0.05) | 0.48374a | |
Key secondaryb: change from baseline in worst pain at week 26 | ||
LS mean (95% CI) at week 26 | −0.61 (−0.96 to −0.25) | −0.03 (−0.42 to 0.37) |
Treatment-group difference vs. control, LS mean (95% CI) | −0.58 (−1.05 to −0.11) | |
Nominal P value (not formally tested) | 0.01467b | |
Secondary: DOR by BICR | ||
Responders | N = 296 | N = 196 |
Progression or death, n (%) | 99 of 296 (33.4) | 119 of 196 (60.7) |
Median duration of response, months (95% CI) | NE (20.2 to NE) | 7.0 (6.2 to 10.2) |
Secondary: changes from baseline in EORTC QLQ-C30 GHS | ||
Patients with baseline GHS scores | 365 | 350 |
Mean change from baseline (SD) at week 23, points [patients] | ||||| || |||| | ||||| || |||| |
Mean change from baseline (SD) at week 47, points [patients] | ||||| || |||| | ||||| || |||| |
Mean change from baseline (SD) at week 71, points [patients] | ||||| || |||| | ||||| || |||| |
Secondary: changes from baseline in EQ-5D-5L VAS | ||
Patients with baseline VAS scores | 376 | 355 |
Mean change from baseline (SD) at week 23, points [patients] | ||||| || |||| | ||||| || |||| |
Mean change from baseline (SD) at week 47, points [patients] | ||||| || |||| | ||||| || |||| |
Mean change from baseline (SD) at week 71, points [patients] | ||||| || |||| | ||||| || |||| |
BICR = blinded independent central review; BPI-SF = Brief Pain Inventory–Short Form; CI = confidence interval; DOR = duration of response; EORTC QLQ-C30 = European Organisation for Research and Treatment of Cancer Quality of Life Core 30; EV + P = enfortumab vedotin plus pembrolizumab; GHS = Global Health Status; ITT = intention to treat; GHS = Global Health Status; NE = not evaluable; ORR = objective response rate; OS = overall survival; PFS = progression-free survival; PLAT + GEM = platinum-based chemotherapy (cisplatin or carboplatin) plus gemcitabine; VAS = visual analogue scale.
aFamily-wise type I error was tightly controlled using a sequential testing strategy.
bAlthough change from baseline to week 26 in worst pain was included in the sequential testing strategy, it was not formally tested because the preceding end point (time to pain progression) did not reach statistical significance.
Sources: Clinical Study Report for EV-30231 and the sponsor’s Summary of Clinical Evidence.14
Coprimary End Point: Progression-Free Survival by BICR
The results for PFS in the ITT population at the data cut-off are shown in Table 18.
A total of 530 PFS events (59.8%) were observed, including 223 (50.5%) in the EV + P and 307 (69.1%) in the PLAT + GEM arm. The median PFS values were 12.5 months (95% CI, 10.4 to 16.6 months) in the EV + P arm and 6.3 months, (95% CI, 6.2 to 6.5 months) in the PLAT + GEM arm. The HR was 0.450 (95% CI, 0.377 to 0.538; P < 0.00001) for EV + P compared to PLAT + GEM (Table 18). Clear and early separation of the Kaplan-Meier PFS curves was observed (Figure 3). The between-group differences in PFS for EV + P versus PLAT + GEM were ||||| || (95% CI ||||| || %) at 6 months ||||| || (95% CI, ||||| || ||||| || at 12 months, and ||||| || (95% CI ||||| ||) at 18 months.
Table 18: PFS According to RECIST 1.1 by BICR (ITT Analysis Set)
Outcomes | EV + P (N = 442) | PLAT + GEM (N = 444) |
|---|---|---|
Patients who progressed or died, n (%) | 223 (50.5) | 307 (69.1) |
Stratified hazard ratio (95% CI) | 0.450 (0.377 to 0.538) | |
Two-sided P value (threshold for statistical significance is 0.005) | < 0.00001a | |
Median months (95% CI) | 12.5 (10.4 to 16.6) | 6.3 (6.2 to 6.5) |
Range | 0.03b to 30.42b | 0.03b to 32.99b |
Treatment-group difference vs. control (95% CI); P value | ||||| || |||| | |
PFS at 6 months, % (95% CI) | ||||| || |||| | ||||| || |||| |
Treatment effect, % (95% CI) | ||||| || |||| | |
PFS at 12 months, % (95% CI) | 50.7 (||||| || ||||) | 21.6 (||||| || ||||) |
Treatment effect, % (95% CI) | ||||| || |||| | |
PFS at 18 months, % (95% CI) | 43.9 (||||| || ||||) | 11.7 (||||| || ||||) |
Treatment effect, % (95% CI) | ||||| || |||| | |
CDA- AMC = Canada’s Drug Agency; BICR = blinded independent central review; CI = confidence interval; EV + P = enfortumab vedotin plus pembrolizumab; ITT = intention to treat; PFS = progression-free survival; PLAT + GEM = platinum-based chemotherapy (cisplatin or carboplatin) plus gemcitabine; RECIST 1.1 = Response Evaluation Criteria in Solid Tumours Version 1.1.
aFamily-wise type I error was tightly controlled using a sequential testing strategy.
bIndicates censoring.
cBetween-group differences were provided by the sponsor on June 20, 2024. For additional context, the 95% CIs for the between-group differences in the outcome measures requested by CDA-AMC are provided without adjustment for multiplicity. These are not formal methods for assessing statistical significance of between-group differences.50
Sources: Clinical Study Report for EV-30231 and the sponsor’s Summary of Clinical Evidence.14
Figure 3: Kaplan-Meier Plot of PFS According to RECIST 1.1 by BICR (ITT Analysis Set)
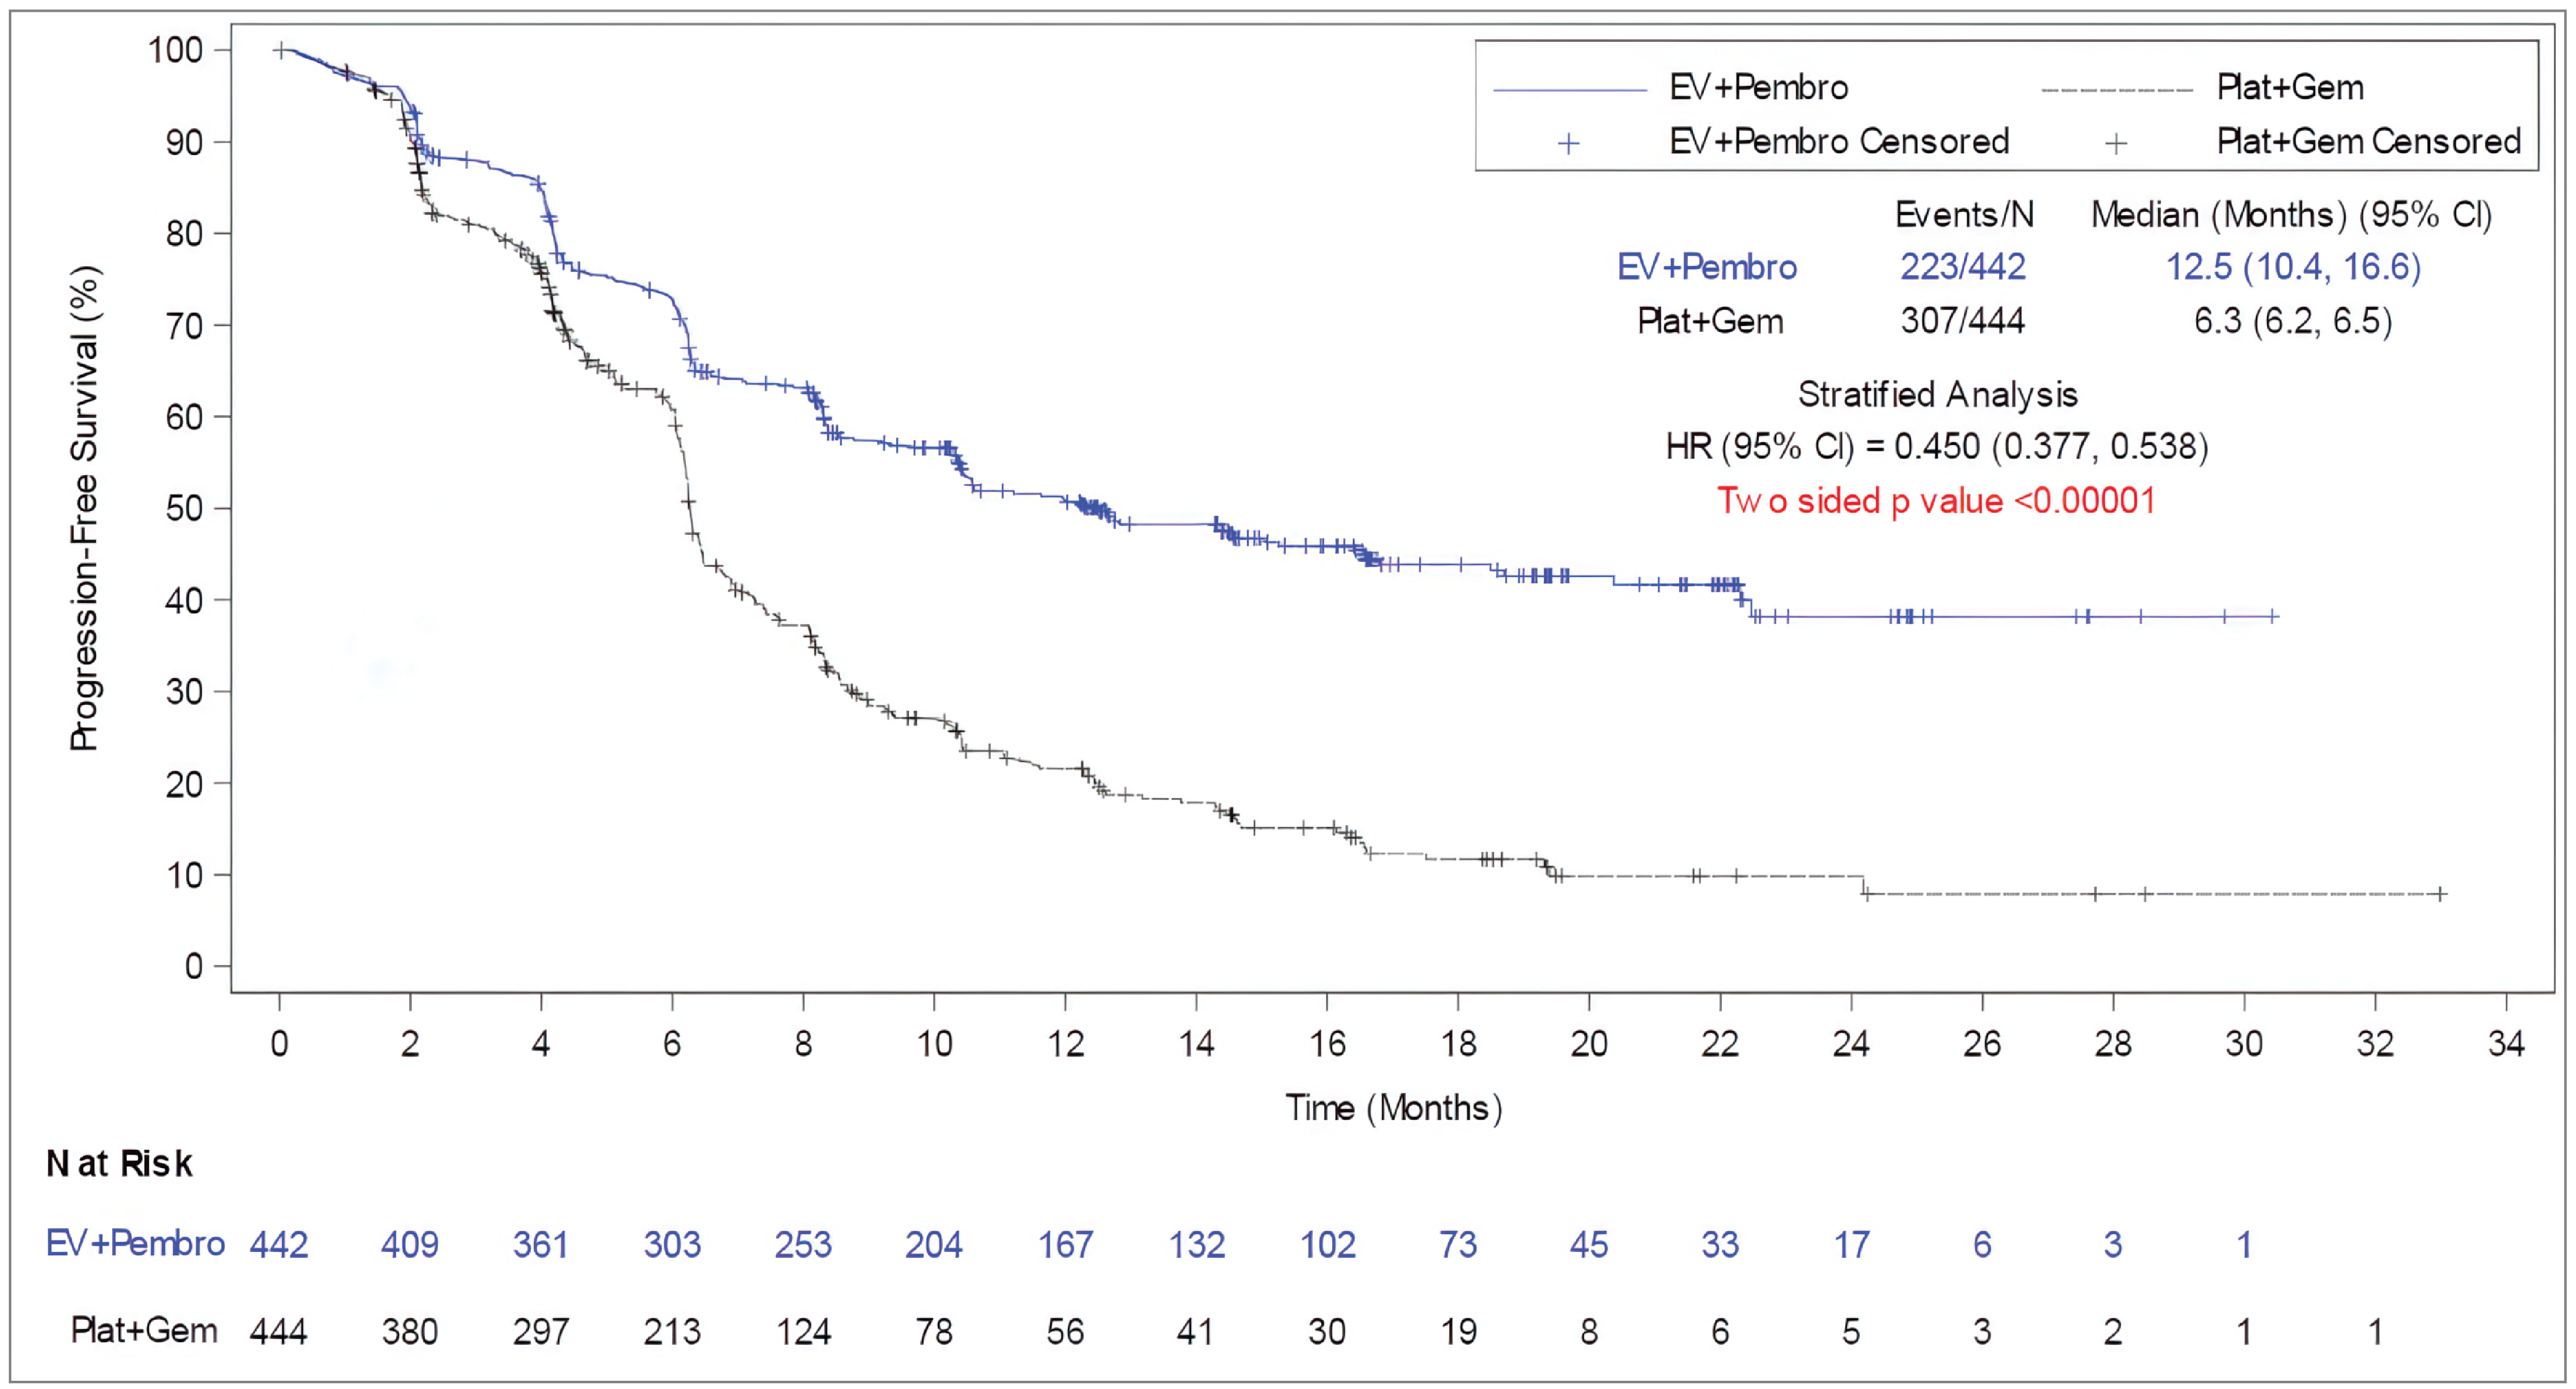
BICR = blinded independent central review; CI = confidence interval; EV = enfortumab vedotin; Gem = gemcitabine; HR = hazard ratio; ITT = intention to treat; Pembro = pembrolizumab; PFS = progression-free survival; Plat = platinum-based chemotherapy (cisplatin or carboplatin); RECIST 1.1 = Response Evaluation Criteria in Solid Tumours Version 1.1.
Sources: Clinical Study Report for EV-302)31 and the sponsor’s Summary of Clinical Evidence.14
Subgroup Analyses of Progression-Free Survival
As shown in Figure 4, subgroup analyses revealed consistent PFS benefits favouring EV + P across all prespecified subgroups (HR values ranging from 0.451 to 0.534), regardless of baseline cisplatin eligibility (eligible or ineligible), PD-L1 expression status (high combined positive score [≥ 10] or low combined positive score [< 10]), or liver metastases (present or absent).
Figure 4: Subgroup Analyses of PFS According to RECIST 1.1 by BICR (ITT Analysis Set)
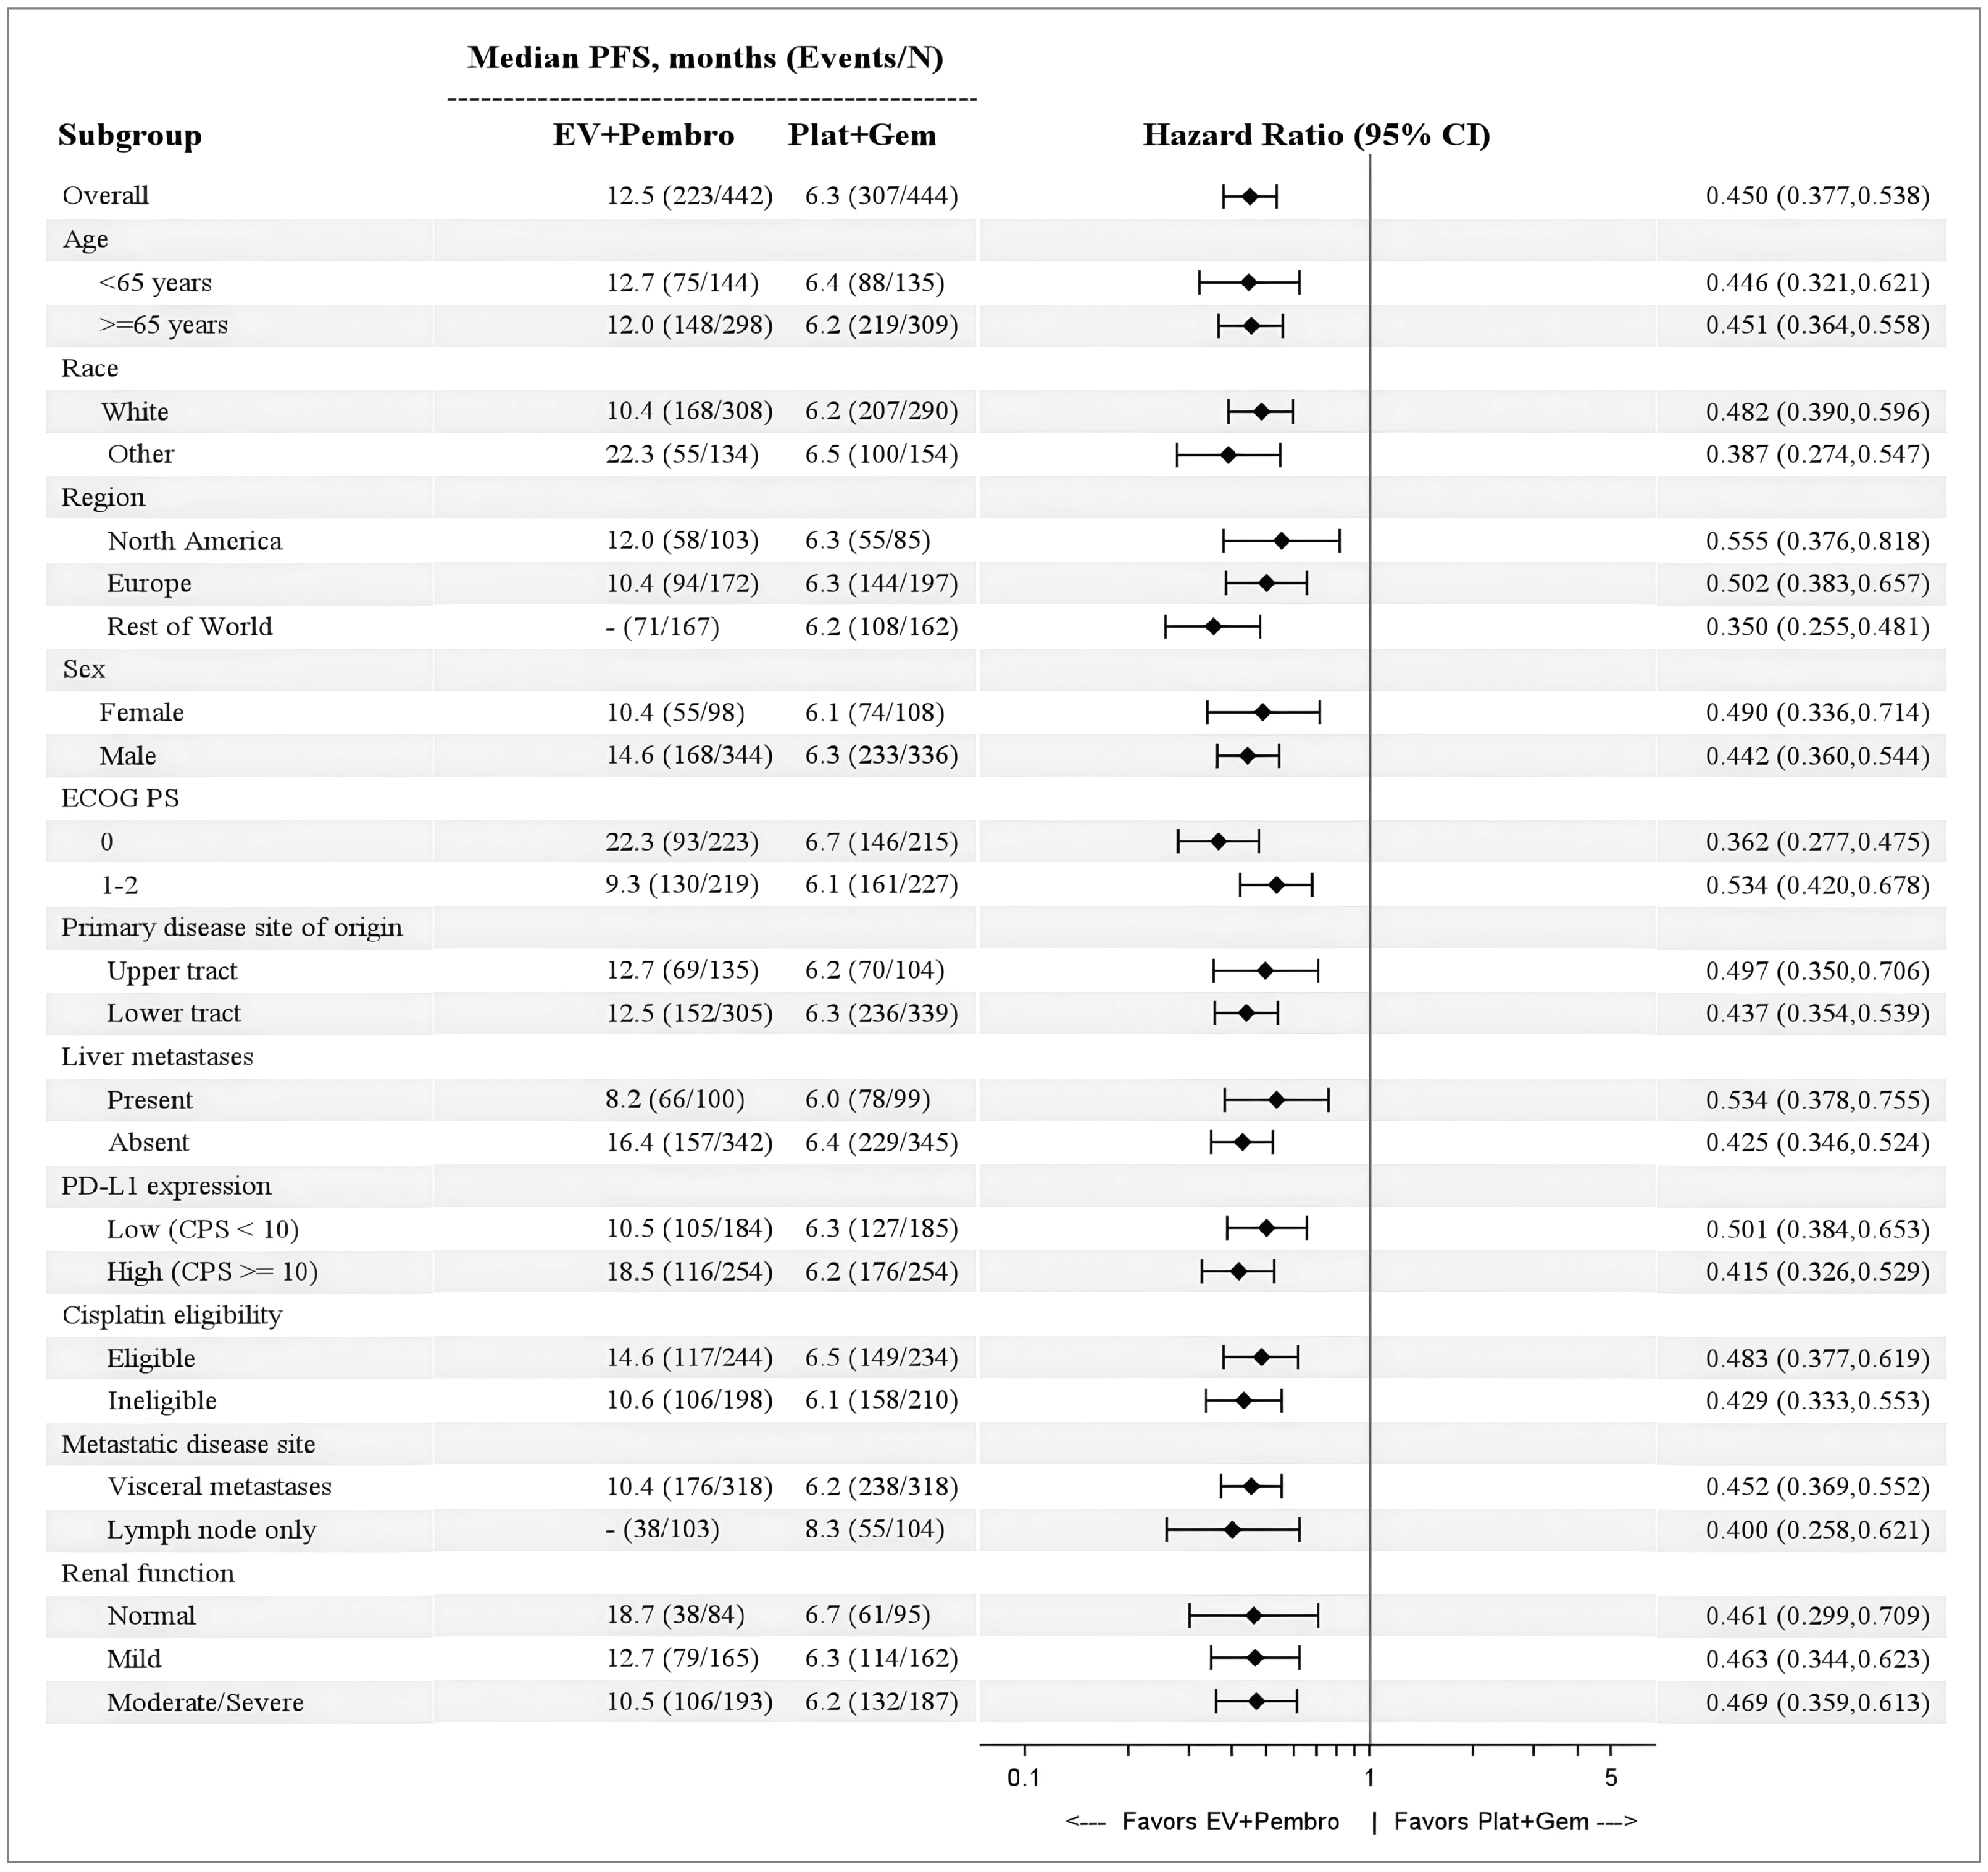
BICR = blinded independent central review; CPS = combined positive score; CRF = case report form; ECOG PS = Eastern Cooperative Oncology Group Performance Status; EV = enfortumab vedotin; Gem = gemcitabine; ITT = intention to treat; Pembro = Pembrolizumab; Plat = platinum-based chemotherapy; PFS = progression-free survival; RECIST 1.1 = Response Evaluation Criteria in Solid Tumours Version 1.1.
Note: Liver metastases and cisplatin eligibility subgroups are based on postrandomization corrections CRF. Randomization was stratified by PD-L1 status (high or low) based on information available at screening. For subgroup analyses by PD-L1 status (low or high), patients whose tissue sample was found to be unsuitable forPD-L1 22C3 per testing guidelines after randomization were not included in analyses by PD-L1 status.
Sources: EV-302 Clinical Study Report31 and the sponsor’s Summary of Clinical Evidence.14
Sensitivity Analyses of Progression-Free Survival
Consistent results were also observed in various sensitivity analyses (HR values ranging from 0.446 to 0.460) based on unstratified analyses, ignoring subsequent therapy before progressive disease or death, ignoring 2 or more missed disease assessments before progressive disease or death, and stratified analysis using strata verified after randomization. Moreover, consistent results were observed when PFS was judged by the investigators, with a high concordance rate (90.5%) between the investigator and BICR assessments. These results confirm the robustness of the primary analysis results.
Coprimary End Point: Overall Survival
The results for OS in the ITT population at the data cut-off (August 8, 2023) at an overall median follow-up of 17.2 months (range, 0.07 to 37.16 months) are shown in Table 19. A total of 359 deaths (40.5%) were observed, including 133 (30.1%) in the EV + P arm and 226 (50.9%) in the PLAT + GEM arm. The median OS was 31.5 months (95% CI, 25.4 months to not evaluable) in EV + P arm and 16.1 months (95% CI, 13.9 to 18.3 months) in the PLAT + GEM arm. The HR was 0.468 (95% CI, 0.376 to 0.582; P < 0.00001) for EV + P compared to PLAT + GEM. (Table 19). Clear and early separation of the Kaplan-Meier OS curves are evident in Figure 4. The between-group differences in the OS rate for EV + P versus PLAT + GEM were 8.3% (95% CI, 3.8% to 12.9%) at 6 months, 16.8% (95% CI, 10.6% to 22.9%) at 12 months, and 24.8% (95% CI, 17.5% to 32.1%) at 18 months.
Table 19: Overall Survival (Intention-to-Treat Analysis Set)
Parameters | EV + P (N = 442) | PLAT + GEM (N = 444) |
|---|---|---|
Patients who died, n (%) | 133 (30.1) | 226 (50.9) |
Stratified hazard ratio (95% CI) | 0.468 (0.376 to 0.582) | |
2-sided P value (threshold for statistical significance is 0.01548) | < 0.00001a | |
Median (95% CI), months | 31.5 (25.4 to NE) | 16.1 (13.9 to 18.3) |
Range | 0.26b to 37.16b | 0.07b to 36.21b |
Treatment-group difference vs. control (95% CI) | ||||| ||||||| || | |
OS at 6 months, % (95% CI) | ||||| ||||||| || | ||||| ||||||| || |
Treatment effect, %, (95% CI) | ||||| ||||||| || | |
OS at 12 months, % (95%, CI) | 78.2 (||||| ||||||| |) | 61.4 (||||| ||||||| |) |
Treatment effect, %, (95% CI) | ||||| ||||||| | | |
OS at 18 months, % (95%, CI) | 69.5 (||||| ||||||| |) | 44.7 (||||| ||||||| |) |
Treatment effect, % (95% CI) | ||||| ||||||| | | |
CDA-AMC = Canada’s Drug Agency; CI = confidence interval; EV + P = enfortumab vedotin plus pembrolizumab; NE = not evaluable; OS = overall survival; PFS = progression-free survival; PLAT = platinum-based chemotherapy (cisplatin or carboplatin).
aFamily-wise type I error was tightly controlled using a sequential testing strategy.
bIndicates censoring.
cBetween-group differences were provided by the sponsor on June 20, 2024. For additional context, the 95% CIs for the between-group differences in the outcome measures requested by CDA-AMC are provided without adjustment for multiplicity. These are not formal methods for assessing statistical significance of between-group differences.50
Sources: Clinical Study Report for EV-302 (Table 25)31 and the sponsor’s Summary of Clinical Evidence.14
Figure 5: Kaplan-Meier Plot of Overall Survival (ITT Analysis Set)
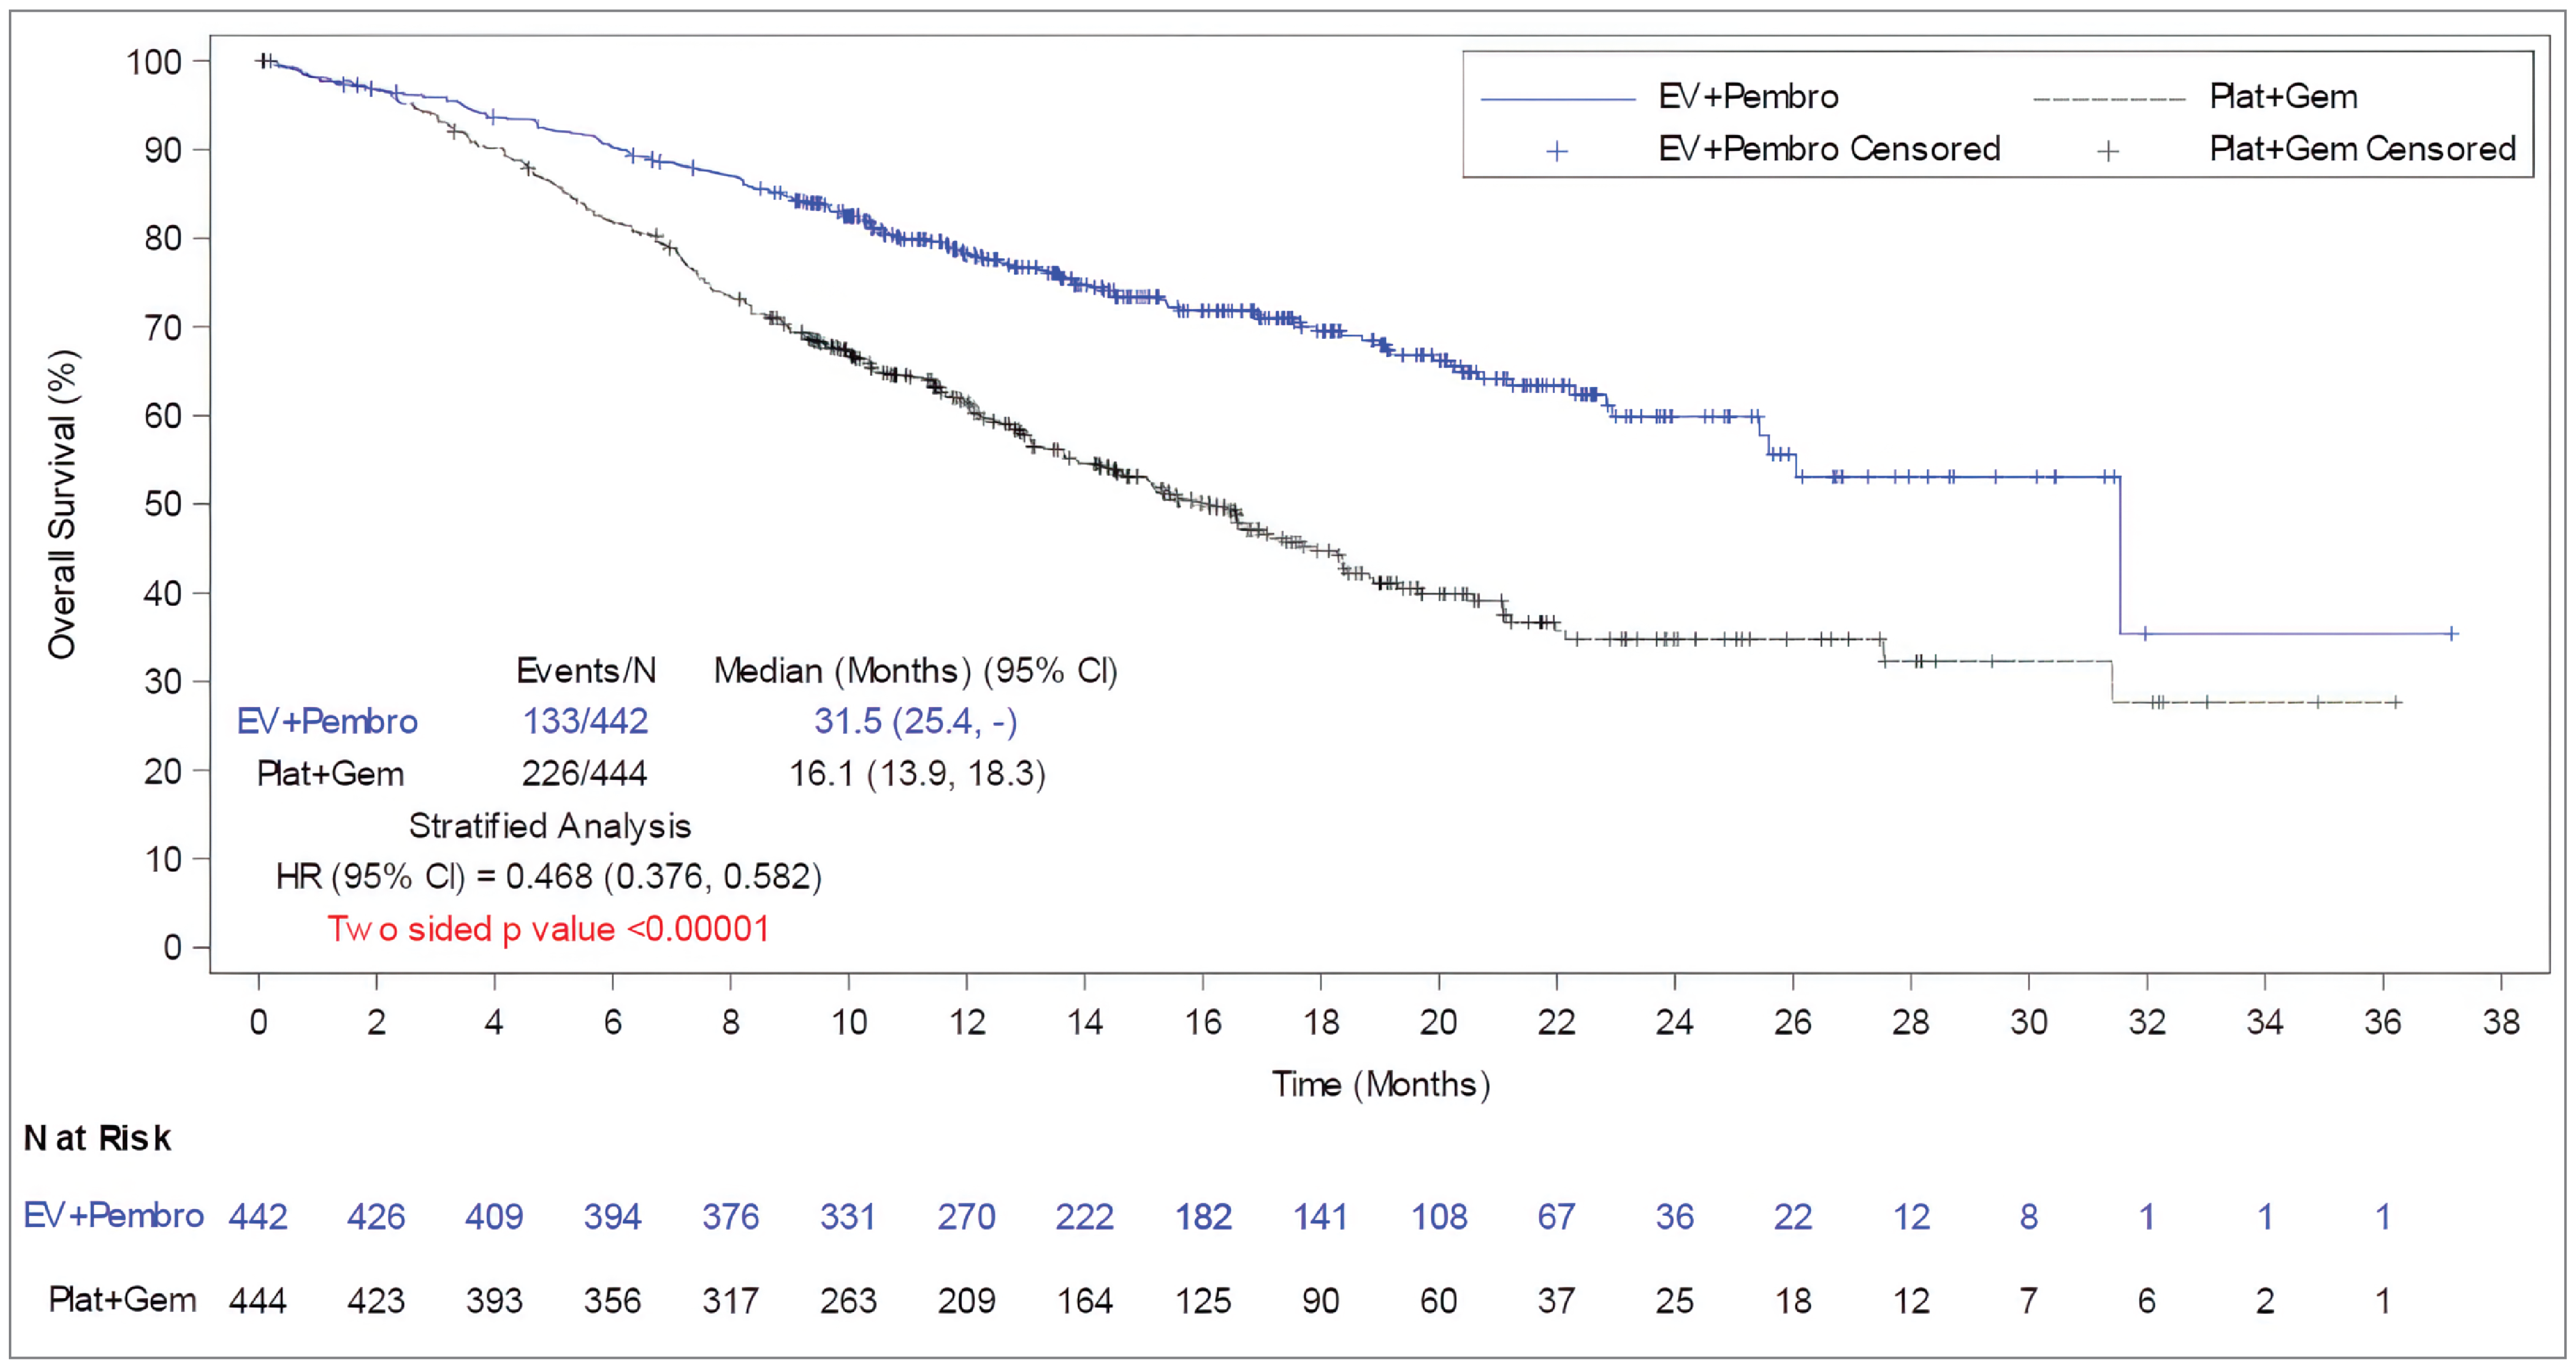
CI = confidence interval; EV = enfortumab vedotin; Gem = gemcitabine; HR = hazard ratio; ITT = intention to treat; Pembro = pembrolizumab; OS = overall survival; Plat = platinum-based chemotherapy (cisplatin or carboplatin).
Source: Clinical Study Report for EV-302 (Figure 6).31
Subgroup Analyses of Overall Survival
Subgroup analyses revealed consistent OS benefits favouring EV + P across almost all prespecified subgroups (HR values generally ranging from 0.428 to 0.528), regardless of baseline cisplatin eligibility (eligible or ineligible), PD-L1 expression status (high [combined positive score ≥ 10] or low [CPS < 10]), or liver metastases (present or absent). One exception was the North American subgroup (HR = 0.705, 95% CI, 0.443 to 1.120), where the HR point estimate may have been influenced by the substantially smaller sample size and by the EV + P arm having higher proportions of patients with poor prognostic factors (e.g., liver metastasis and ECOG PS 1 or 2) (Figure 6).
Figure 6: Subgroup Analyses of Overall Survival (ITT Analysis Set)
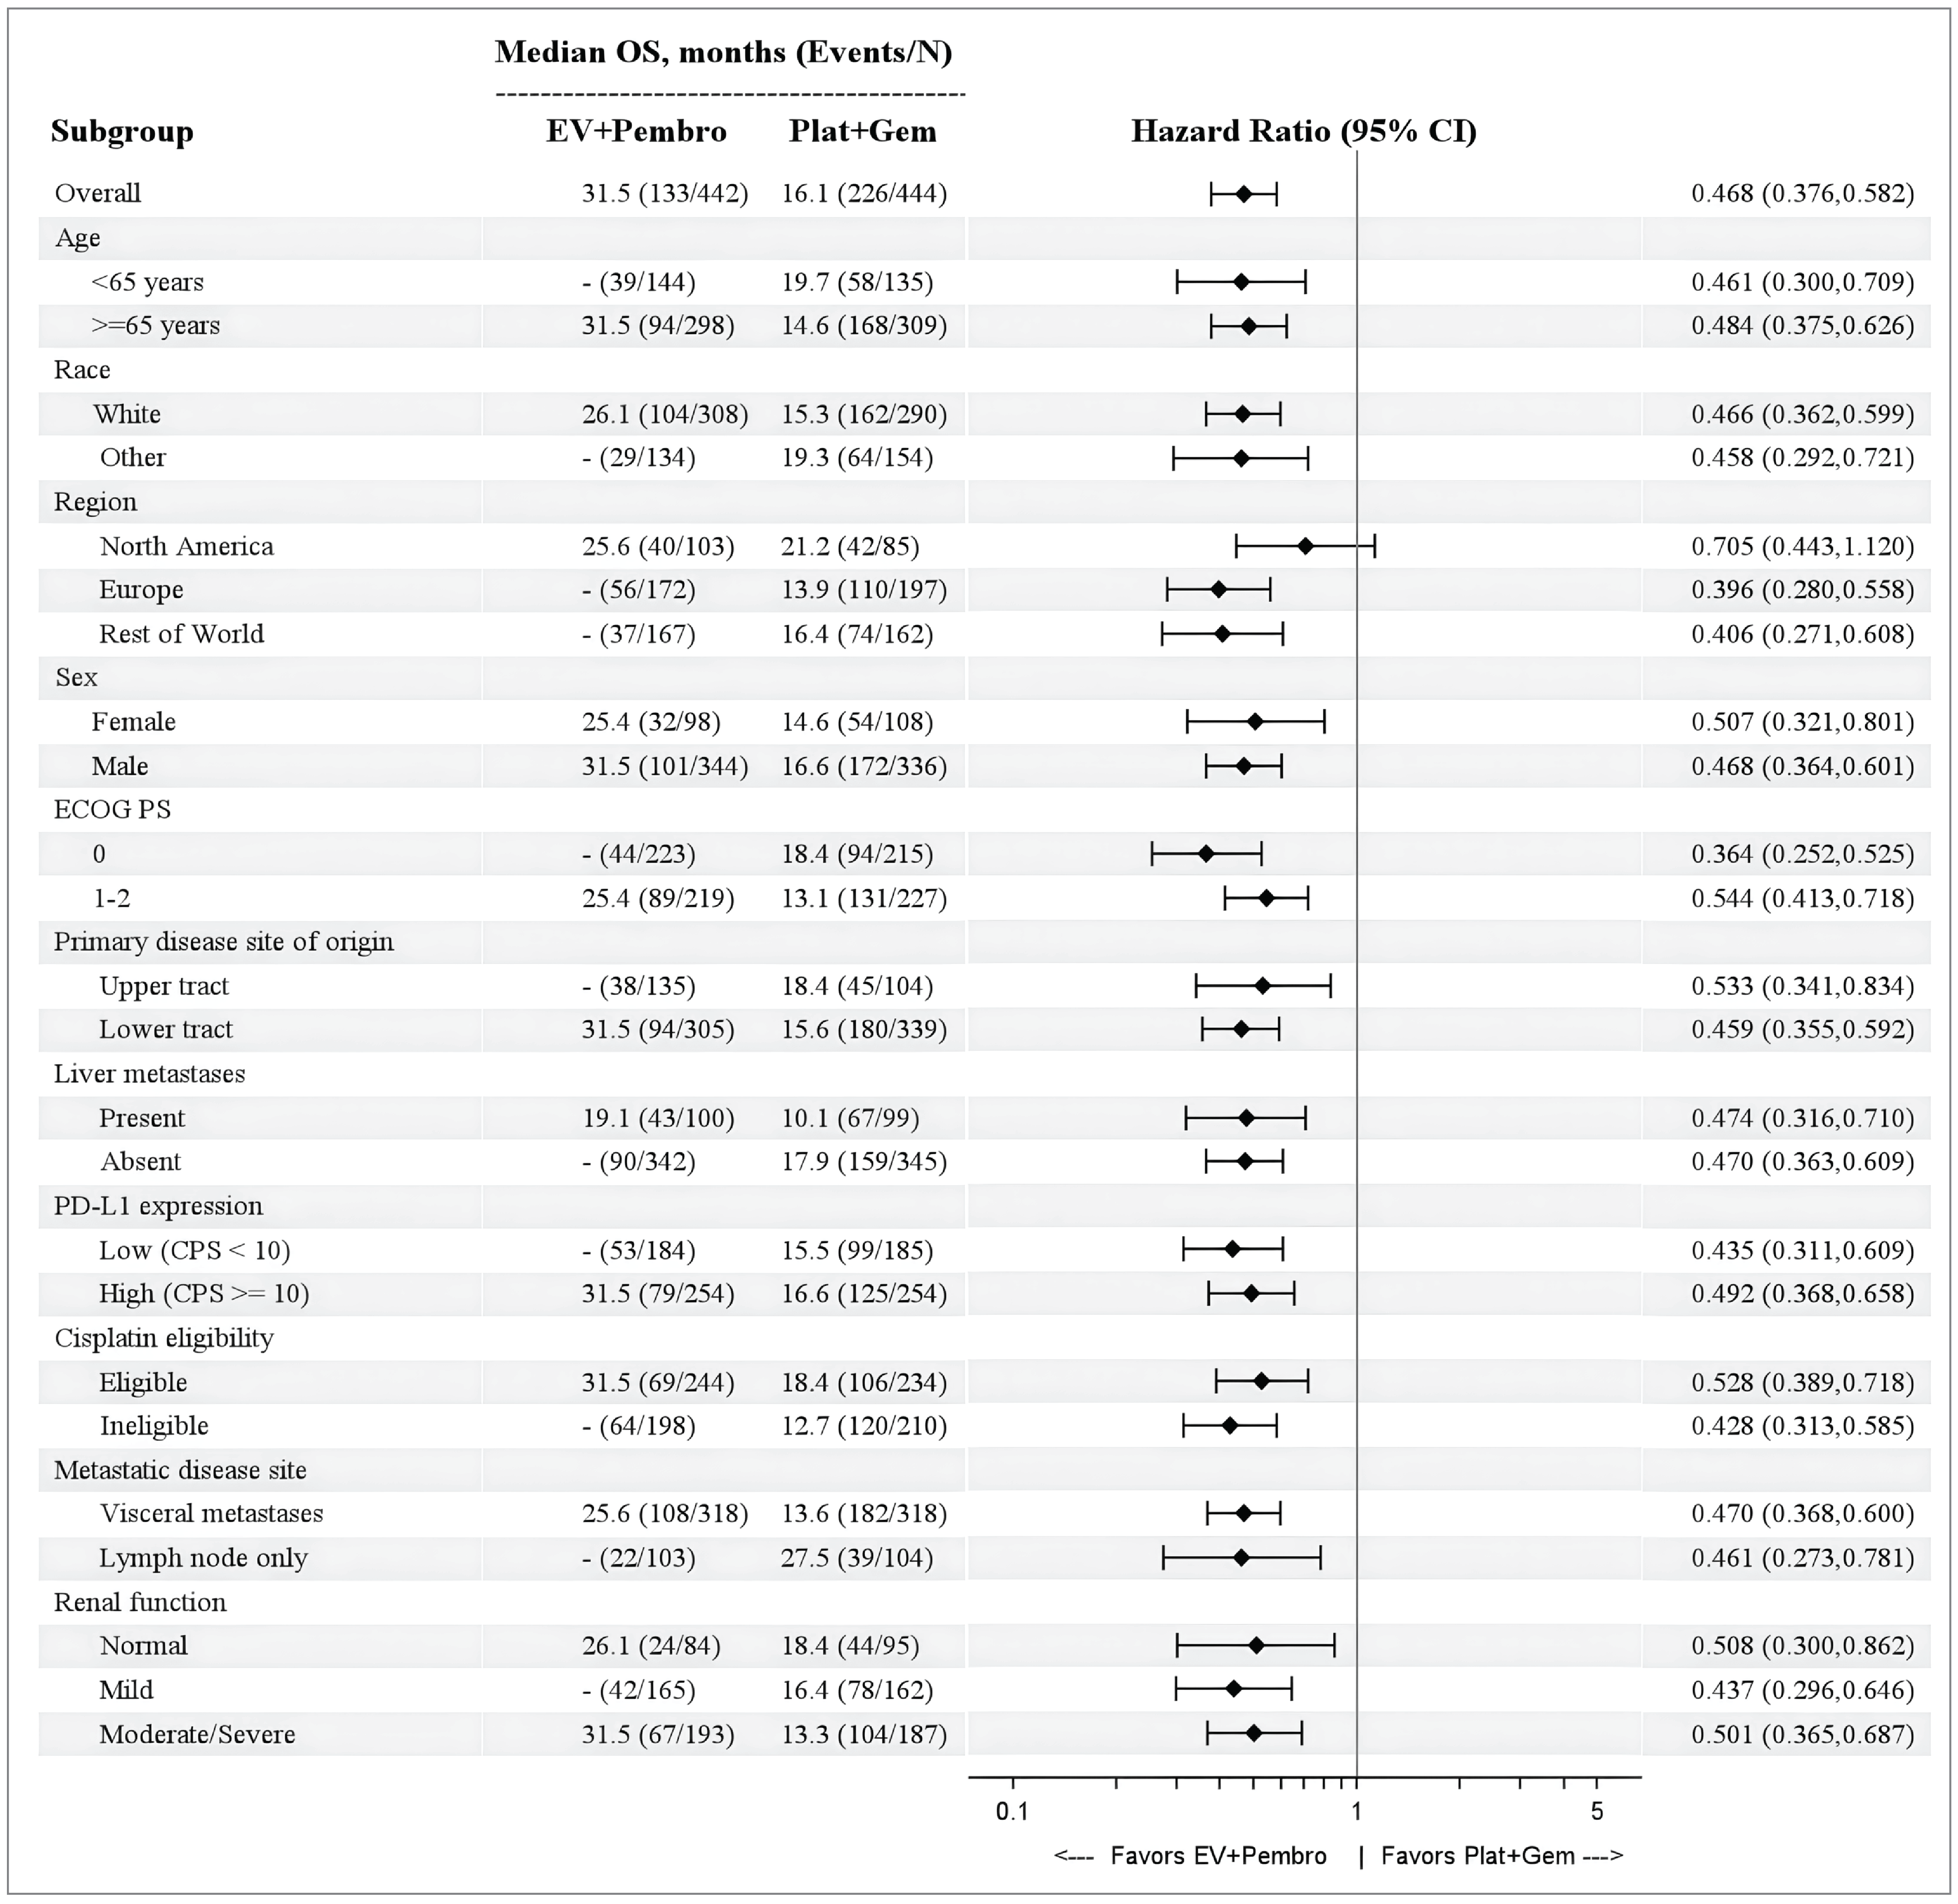
CPS = combined positive score; CRF = case report form; ECOG PS = Eastern Cooperative Oncology Group Performance Status; EV = enfortumab vedotin; Gem = gemcitabine; ITT = intention-to-treat; Pembro = Pembrolizumab; Plat = platinum-based chemotherapy; PFS = progression-free survival; OS = overall survival.
Note: Liver metastases and cisplatin eligibility subgroups are based on postrandomization corrections of the CRF. Randomization was stratified by PD-L1 status (high or low) based on information available at screening. For subgroup analyses by PD-L1 status (low or high), patients whose tissue sample was found to be unsuitable for PD-L1 22C3 according to testing guidelines after randomization were not included in analyses by PD-L1 status.
Source: EV-302 Clinical Study Report.31
Sensitivity Analyses of Overall Survival
Consistent results were also observed in various sensitivity analyses (HR values ranging from 0.479 to 0.486) based on unstratified analyses, stratified analysis using strata that were verified after randomization, and the inverse probability of censoring weights method for subsequent anticancer therapy.31
Objective Response Rate by Blinded Independent Central Review
The results for ORR in the response-evaluable set analysis at the data cut-off (August 8, 2023), with an overall median follow-up of 17.2 months (range, 0.07 to 37.16) are shown in Table 20. In the EV + P arm, the ORR was 67.7% (95% CI, 63.1% to 72.1%). In the PLAT + GEM arm, the ORR was 44.4% (95% CI, 39.7% to 49.2%). The between-group difference in the ORR was 23.3 (95% CI, 16.8% to 29.6%; P < 0.00001). Furthermore, a higher proportion of patients attained a complete response in the EV + P arm versus the PLAT + GEM arm (29.1% versus 12.5%, respectively). Similar median times to response were observed in the EV + P arm (median = 2.1 months; range, 1.3 to 12.3 months) and in the PLAT + GEM arm (median = 2.1 months; range, 1.6 to 8.3 months). The sponsor indicated that the ORRs at the milestones of 6 months, 12 months, and 18 months were not available.51
The results of an ORR subgroup analyses were consistent with those of overall analysis across all prespecified subgroups.
Consistent results were also observed in the sensitivity analysis (i.e., when ORR was judged by investigators) with ORRs of 66.0% versus 43.0, respectively (nominal P < 0.0001).31
Table 20: ORR and Best Overall Response According to RECIST 1.1 by BICR (Response-Evaluable Set)
Outcomes | EV + P | PLAT + GEM |
|---|---|---|
Patients with an evaluable response, N | N = 437 | N = 441 |
Number of patients with an objective response, n | 296 | 196 |
ORR, % (95% CI) | 67.7 (63.1 to 72.1) | 44.4 (39.7 to 49.2) |
Treatment-group difference vs. control, % (95% CI) | 23.3 (||||| ||||||| |) | |
2-sided P value (threshold for statistical significance is 0.05) | < 0.00001a | |
Best overall response, n (%) | ||
Complete response | 127 (29.1) | 55 (12.5) |
Partial response | 169 (38.7) | 141 (32.0) |
Stable disease | 82 (18.8) | 149 (33.8) |
Progressive disease | 38 (8.7) | 60 (13.6) |
Not evaluable | 0 | 4 (0.9) |
No assessment | 21 (4.8) | 32 (7.3) |
Times to response (months) | ||
Median times to response (months) | 2.1 | 2.1 |
Range | 1.3 to 12.3 | 1.6 to 8.3 |
BICR = blinded independent central review; CI = confidence interval; EV + P = enfortumab vedotin plus pembrolizumab; ORR = objective response rate; PLAT + GEM = platinum-based chemotherapy (cisplatin or carboplatin) plus gemcitabine; RECIST 1.1 = Response Evaluation Criteria in Solid Tumours Version 1.1.
aFamily-wise type I error was tightly controlled using a sequential testing strategy.
Sources: Clinical Study Report for EV-302 (Table 26)31 and the sponsor’s Summary of Clinical Evidence.14
Duration of Response by Blinded Independent Central Review
The results for DOR are presented in Table 21. The median DOR was not reached in the EV + P arm. The median DOR was 7.0 months (95% CI, 6.2 to 10.2 months) in the PLAT + GEM arm. The proportions of responders who progressed or died were 33.4% in the EV + P arm and 60.7% in the PLAT + GEM arm. Based on the Kaplan-Meier curves (Figure 9), the estimated rates of patients who maintained their responses at 6 months were 85.9% in the EV + P arm and 60.6% in the PLAT + GEM arm; at 12 months, the estimated rates of patients who maintained their responses were 67.3% in the EV + P arm and 35.2% in the PLAT + GEM arm; and at 18 months the estimated rates of patients who maintained their responses were 59.6% in the EV + P arm compared to 19.3% in the PLAT + GEM arm.
Table 21: DOR According to RECIST by BICR (Response-Evaluable Analysis Set)
Outcomes | EV + P | PLAT + GEM |
|---|---|---|
Response-evaluable set according to BICR | ||||| ||||||| | | ||||| ||||||| | |
Number of responders (confirmed CR or PR), N | N = ||||| | N = ||||| |
Responders who progressed or died, n/N (%) | ||||| ||||||| | | ||||| ||||||| | |
Duration of response, months | ||
Median (95% CI) | NE (20.2 to NE) | 7.0 (6.2 to 10.2) |
First quartile to third quartile | ||||| ||||||| | | ||||| ||||||| | |
Range | ||||| ||||||| | | ||||| ||||||| | |
Responders (%) without PD or death at | ||
6 months (95% CI) | ||||| ||||||| | | ||||| ||||||| | |
Treatment effect, % (95% CI) | ||||| ||||||| | | |
12 months (95%, CI) | 67.3 (||||| |||||||) | 35.2 (||||| |||||||) |
Treatment effect, % (95% CI) | ||||| ||||||| | | |
18 months (95%, CI) | 59.6 (||||| |||||||) | 19.3 (||||| |||||||) |
Treatment effect, % (95% CI) | ||||| ||||||| | | |
CDA-AMC = Canada’s Drug Agency; BICR = blinded independent central review; CI = confidence interval; CR = complete response; DOR = duration of response; EV + P = enfortumab vedotin plus pembrolizumab; NE = not estimable; PD = progressive disease; PLAT + GEM = platinum-based chemotherapy (cisplatin or carboplatin) plus gemcitabine; PR = partial response; RECIST = Response Evaluation Criteria in Solid Tumours Version 1.1.
aBetween-group differences were provided by the sponsor on June 20, 2024. For additional context, the 95% CIs for the between-group differences in the outcome measures requested by CDA-AMC are provided without adjustment for multiplicity. These are not formal methods for assessing the statistical significance of between-group differences. Furthermore, the sponsor indicated that a between-group comparison of DOR is not appropriate because the DOR was only evaluated for patients who attained an objective response, who are a subset of the intention-to-treat population, and treatment arms are not balanced by randomization.50
Sources: Clinical Study Report for EV-302 (Table 29)31 and the sponsor’s Summary of Clinical Evidence.14
Figure 7: Kaplan-Meier Plot of DOR According to RECIST 1.1 by BICR (Response-Evaluable Analysis Set) [Redacted]

BICR = blinded independent central review; DOR = duration of response; RECIST 1.1 = Response Evaluation Criteria in Solid Tumours Version 1.1.
No subgroup analysis was conducted for DOR.
Similar results were observed in the sensitivity analysis of DOR by investigator assessment.
EORTC QLQ-C30
The findings of HRQoL outcomes (EORTC QLQ-C30 GHS) are presented in Table 22 and Table 23. At baseline, 1 or more components of the EORTC QLQ-C30 were completed by ||||| |||| of patients in the EV + P arm and ||||| |||| of patients in the PLAT + GEM arm.31 At baseline, the mean GHS scores were ||||| |||| points in the EV + P arm and ||||| |||| points in the PLAT + GEM arm. At week 26, the mean GHS scores were ||||| |||| points in the EV + P arm and ||||| ||| points in the PLAT + GEM arm. The changes from baseline were ||||| ||||||||| |||| in the EV + P arm and ||||| |||| in the PLAT + GEM arm. The between-group difference (EV + P minus PLAT + GEM) at week 26 was ||||| |||| (95% CI, ||||| |||||||. The GHS scores were generally similar at all time points (from week 4 to week 71) and within-group or intergroup comparisons showed no clinical meaningful changes over time (Table 23).
No subgroup nor sensitivity analysis was conducted for EORTC QLQ-C30.
Other Patient-Reported and HRQoL Outcomes
Other patient-reported and HRQoL outcomes include time to pain progression, change from baseline in worst pain, and EQ-5D-5L. Pain progression was defined as an increase of 2 or more points from baseline for question 3 of the Brief Pain Inventory–Short Form (worst pain over the last 24 hours) or the start of new opioid pain medication (question 7) maintained for 2 or more consecutive assessments. The analysis revealed that time to pain progression was not statistically significantly different with EV + P versus PLAT + GEM (HR = 0.916; 95% CI, 0.720 to 1.166; 2-sided P value = 0.48374). For change from baseline in worst pain at week 26, the least squares mean was numerically greater in the EV + P arm compared to the PLAT + GEM arm ||||| |||| points in EV + P arm versus ||||| | points in PLAT + GEM arm). The between-group treatment difference was ||||| |||| points; 95% CI, ||||| ||||||||| ||||||||| ||||).50 Patients in both groups reported an impaired health status based on mean EQ VAS scores of ||||| || points in the EV + P arm and ||||| points in the PLAT + GEM arm. The EQ VAS scores were generally similar at all time points and no meaningful changes were observed over time (within-group change or intergroup comparisons). In addition, no notable within-group changes over time or intergroup differences were observed for the utility scores.
Table 22: EORTC QLQ-C30 GHS Scores and Change From Baseline at Week 26 (PRO Full Analysis Set)
GHS scores assessment time points | EV + P (N = 376) | PLAT + GEM (N = 355) |
|---|---|---|
Baseline | ||
n | ||||| |||| | ||||| |||| |
Baseline, mean score (SD) | ||||| |||| | ||||| |||| |
Week 26 | ||
n | ||||| |||| | ||||| |||| |
Mean score (SD) | ||||| |||| | ||||| |||| |
Change from baseline at week 26 | ||||| |||| | ||||| |||| |
n | ||||| |||| | ||||| |||| |
Mean change from baseline (SD) at week 26 | ||||| |||| | ||||| |||| |
Between-group difference of changes from baseline (treatment effect), % (95% CI) | ||||| |||| | |
CDA-AMC = Canada’s Drug Agency; CI = confidence interval; EORTC QLQ-C30 = European Organisation for Research and Treatment of Cancer Quality of Life Core 30; EV + P = enfortumab vedotin plus pembrolizumab; GHS = Global Health Status; PLAT = platinum-based chemotherapy (cisplatin or carboplatin); PRO = patient-reported outcome.
aBetween-group differences were provided by the sponsor on June 20, 2024. For additional context, the 95% CIs for the between-group differences in the outcome measures requested by CDA-AMC are provided without adjustment for multiplicity. These are not formal methods for assessing statistical significance of between-group differences.50
Sources: Clinical Study Report for EV-30231 and the sponsor’s Summary of Clinical Evidence.14
Table 23: EORTC QLQ-C30 GHS Scores and Change From Baseline up to Week 71 (PRO Full Analysis Set)
Outcomes (GHS scores, as reported) | EV + P (N = 376) | PLAT + GEM (N = 355) | ||
|---|---|---|---|---|
Score | Change from baseline | Score | Change from baseline | |
Baseline, mean score (SD) [patients] | ||||| |||| | ||||| |||| | ||||| |||| | ||||| |||| |
Week 4, mean score (SD) [patients] | ||||| |||| | ||||| |||| | ||||| |||| | ||||| |||| |
Treatment effect, % (95% CI) | ||||| |||| | |||
Week 8, mean score (SD) [patients] | ||||| |||| | ||||| |||| | ||||| |||| | ||||| |||| |
Treatment effect, % (95% CI) | ||||| |||| | |||
Week 12, mean score (SD) [patients] | ||||| |||| | ||||| |||| | ||||| |||| | ||||| |||| |
Treatment effect, % (95% CI) | ||||| |||| | |||
Week 20, mean score (SD) [patients] | ||||| |||| | ||||| |||| | ||||| |||| | ||||| |||| |
Treatment effect, % (95% CI) | ||||| |||| | |||
Week 26, mean score (SD) [patients] | ||||| |||| | ||||| |||| | ||||| |||| | ||||| |||| |
Treatment effect, %, (95% CI) | ||||| |||| | |||
Week 38, mean score (SD) [patients] | ||||| |||| | ||||| |||| | ||||| |||| | ||||| |||| |
Treatment effect, % (95% CI) | ||||| |||| | |||
Week 47, mean score (SD) [patients] | ||||| |||| | ||||| |||| | ||||| |||| | ||||| |||| |
Treatment effect, % (95% CI) | ||||| |||| | |||
Week 59, mean score (SD) [patients] | ||||| |||| | ||||| |||| | ||||| |||| | ||||| |||| |
Treatment effect, % (95% CI) | ||||| |||| | |||
Week 71, mean score (SD) [patients] | ||||| |||| | ||||| |||| | ||||| |||| | ||||| |||| |
Treatment effect, % (95% CI) | ||||| |||| | |||
CDA-AMC = Canada’s Drug Agency; CI = confidence interval; EORTC QLQ-C30 = European Organisation for Research and Treatment of Cancer Quality of Life Core 30; EV + P = enfortumab vedotin plus pembrolizumab; GHS = Global Health Status; PLAT + GEM = platinum-based chemotherapy (cisplatin or carboplatin) plus gemcitabine; PRO = patient-reported outcome; SD = standard deviation.
aBetween-group difference were provided by the sponsor on June 20, 2024. For additional context, the 95% CIs for the between-group differences in the outcome measures requested by CDA-AMC are provided without adjustment for multiplicity. These are not formal methods for assessing statistical significance of between-group differences.50
Sources: Clinical Study Report for EV-30231 and the sponsor’s Summary of Clinical Evidence.14
Harms
Only those harms identified in the sponsor’s evidence summary review protocol are reported. Table 24 provides detailed harms data.
Table 24: Key Harms Data (Safety Analysis Set)
Adverse events | EV + P N = 440 (385.56 patient-years) | PLAT + GEM N = 433 (147.82 patient-years) |
|---|---|---|
Any TEAEs, n (%) [events per patient-year] | 439 (99.8) [19.302] | 427 (98.6) [34.054] |
TEAEs in ≥ 10% of patients from either arm | ||
Peripheral sensory neuropathy | 229 (52.0) | 44 (10.2) |
Pruritus | 182 (41.4) | 29 (6.7) |
Diarrhea | 166 (37.7) | 69 (15.9) |
Fatigue | 155 (35.2) | 170 (39.3) |
Alopecia | 152 (34.5) | 34 (7.9) |
Maculopapular rash | 146 (33.2) | 15 (3.5) |
Decreased appetite | 145 (33.0) | 112 (25.9) |
Weight decreased | 145 (33.0) | 38 (8.8) |
Constipation | 116 (26.4) | 147 (33.9) |
Nausea | 116 (26.4) | 178 (41.1) |
Anemia | 108 (24.5) | 267 (61.7) |
Dysgeusia | 93 (21.1) | 37 (8.5) |
Urinary tract infection | 91 (20.7) | 83 (19.2) |
Asthenia | 77 (17.5) | 88 (20.3) |
Pyrexia | 77 (17.5) | 67 (15.5) |
Increased alanine transaminase | 76 (17.3) | 33 (7.6) |
Dry skin | 76 (17.3) | 6 (1.4) |
Hyperglycemia | 72 (16.4) | 11 (2.5) |
Increased aspartate transaminase | 69 (15.7) | 27 (6.2) |
COVID-19 | 63 (14.3) | 21 (4.8) |
Peripheral edema | 60 (13.6) | 48 (11.1) |
Arthralgia | 58 (13.2) | 21 (4.8) |
Dyspnea | 58 (13.2) | 51 (11.8) |
Hematuria | 58 (13.2) | 39 (9.0) |
Cough | 54 (12.3) | 23 (5.3) |
Back pain | 53 (12.0) | 34 (7.9) |
Abdominal pain | 51 (11.6) | 27 (6.2) |
Vomiting | 51 (11.6) | 69 (15.9) |
Dry eye | 50 (11.4) | 5 (1.2) |
Hypothyroidism | 46 (10.5) | 3 (0.7) |
Insomnia | 45 (10.2) | 24 (5.5) |
Macular rash | 44 (10.0) | 6 (1.4) |
Neutropenia | 43 (9.8) | 181 (41.8) |
Increased blood creatinine | 39 (8.9) | 50 (11.5) |
Thrombocytopenia | 19 (4.3) | 153 (35.3) |
Leukopenia | 17 (3.9) | 47 (10.9) |
Decreased neutrophil count | 16 (3.6) | 56 (12.9) |
Decreased platelet count | 4 (0.9) | 64 (14.8) |
SAEs, n (%) [events per patient-year] | 220 (50.0) [1.141] | 169 (39.0) [2.219] |
SAEs in ≥ 2% of patients from either arm | ||
Acute kidney injury | 23 (5.2) | 11 (2.5) |
Urinary tract infection | 16 (3.6) | 31 (7.2) |
Diarrhea | 14 (3.2) | 2 (0.5) |
Pneumonia | 10 (2.3) | 5 (1.2) |
Pneumonitis | 9 (2.0) | 0 |
Pyrexia | 9 (2.0) | 10 (2.3) |
Hematuria | 7 (1.6) | 10 (2.3) |
Febrile neutropenia | 4 (0.9) | 12 (2.8) |
Anemia | 3 (0.7) | 17 (3.9) |
Thrombocytopenia | 0 | 13 (3.0) |
TEAEs leading to discontinuation of any study drug, n (%) [events per patient-year] | 175 (39.8) [0.508] | 93 (21.5) [0.663] |
Peripheral sensory neuropathy | 49 (11.1) | 1 (0.2) |
Pneumonitis | 9 (2.0) | 0 |
Maculopapular rash | 7 (1.6) | 0 |
Immune-mediated lung disease | 6 (1.4) | 0 |
Paresthesia | 6 (1.4) | 0 |
Acute kidney injury | 5 (1.1) | 10 (2.3) |
Diarrhea | 5 (1.1) | 1 (0.2) |
Anemia | 2 (0.5) | 12 (2.8) |
Fatigue | 2 (0.5) | 6 (1.4) |
Thrombocytopenia | 1 (0.2) | 6 (1.4) |
Increased blood creatinine | 0 | 8 (1.8) |
Neutropenia | 0 | 7 (1.6) |
TEAEs leading to discontinuation of enfortumab vedotin, n (%) [events per patient-year] | 153 (34.8) [0.397] | NA |
Peripheral sensory neuropathy | 49 (11.1) | NA |
Maculopapular rash | 7 (1.6) | NA |
Paresthesia | 6 (1.4) | NA |
TEAEs leading to discontinuation of pembrolizumab, n (%) [events per patient-year] | 117 (26.6) [0.303] | NA |
Pneumonitis | 9 (2.0) | NA |
Immune-mediated lung disease | 6 (1.4) | NA |
Acute kidney disease | 5 (1.1) | NA |
Diarrhea | 5 (1.1) | NA |
TEAE leading to death, n (%) | 19 (4.3) | 14 (3.2) |
TEAE leading to death in ≥ 2 patients from any arm | ||
Acute respiratory failure | 2 (0.5) | 0 |
Sepsis | 1 (0.2) | 2 (0.5) |
General physical health deterioration | 0 | 2 (0.5) |
Peritonitis | 0 | 2 (0.5) |
AESIs for enfortumab vedotin in ≥ 2% of patients, n (%) | ||
Skin reactions | 304 (69.1) | 68 (15.7) |
Absolute risk difference, % (95% CI)a | ||||| |||| | |
Peripheral neuropathy | 293 (66.6) | 60 (13.9) |
Hyperglycemia | 85 (19.3) | 15 (3.5) |
Absolute risk difference, % (95% CI)a | ||||| |||| | |
Ocular disorders | 128 (29.1) | 16 (3.7) |
Infusion-related reactions | 13 (3.0) | 9 (2.1) |
AESIs for pembrolizumab in ≥ 2% of patients, n (%) | ||
Any AESI for pembrolizumab | 193 (43.9) | 21 (4.8) |
Colitis | 12 (2.7) | 0 |
Hepatitis | 14 (3.2) | 2 (0.5) |
Absolute risk difference, % (95% CI)a | ||||| |||| | |
Hyperthyroidism | 20 (4.5) | 2 (0.5) |
Hypothyroidism | 47 (10.7) | 3 (0.7) |
Pneumonitis | 42 (9.5) | 1 (0.2) |
Severe skin reactions | 75 (17.0) | 2 (0.5) |
AESI = adverse event of special interest; CDA-AMC = Canada’s Drug Agency; CI = confidence interval; EV + P = enfortumab vedotin plus pembrolizumab; NA = not applicable; PLAT + GEM = platinum-based chemotherapy (cisplatin or carboplatin) plus gemcitabine; SAE = serious adverse event; TEAE = treatment-emergent adverse event.
aBetween-group differences were provided by the sponsor on June 20, 2024. For additional context, the 95% CIs for the between-group differences in the outcome measures requested by CDA-AMC are provided without adjustment for multiplicity. These are not formal methods for assessing statistical significance of between-group differences.50
Sources: Clinical Study Report for EV-30231 and the sponsor’s Summary of Clinical Evidence.14
Adverse Events
After a median follow-up of 17.2 months (95% CI, 16.5 to 17.9 months), 99.8% of patients in the EV + P arm and 98.6% of the PLAT + GEM arm experienced at least 1 TEAE (Table 24). The most common AEs (≥ 40% in either of the groups) were peripheral sensory neuropathy (EV + P versus PLAT + GEM: 52.0% versus 10.2%), pruritus (41.4% versus 6.7%), anemia (24.5% versus 61.7%), neutropenia (9.8 versus 41.8%), and nausea (26.4 versus 41.1%). In addition, grade 3 to 5 TEAEs were reported for 73.0% of patients in EV + P arm and 78.8% of patients in the PLAT + GEM arm31 (Table 25). Other AEs observed more in the EV + P arm than in the PLAT + GEM arm were skin and subcutaneous tissue disorders (83.2% versus 35.9%, respectively), eye disorders (34.5% versus 6.0%), infections and infestations (60.2% versus 37%), and nervous system disorders (74.8% versus 33.3%). However, fewer patients reported blood and lymphatic system disorders in the EV + P arm compared with those in the PLAT + GEM arm (35.7% versus 78.5%) (Table 26)
Table 25: Grade 3 or Greater TEAEs (Safety Analysis Set)
AEs | EV + P (N = 440) | PLAT + GEM (N = 433) |
|---|---|---|
AE occurred in ≥ 2% of patients in either treatment arm, n (%) | ||
Overall | ||||| |||| | ||||| |||| |
Maculopapular rash | ||||| |||| | ||||| |||| |
Hyperglycemia | ||||| |||| | ||||| |||| |
Anemia | ||||| |||| | ||||| |||| |
Acute kidney injury | ||||| |||| | ||||| |||| |
Hyponatremia | ||||| |||| | ||||| |||| |
Neutropenia | ||||| |||| | ||||| |||| |
Urinary tract infection | ||||| |||| | ||||| |||| |
Diarrhea | ||||| |||| | ||||| |||| |
Fatigue | ||||| |||| | ||||| |||| |
Peripheral sensory neuropathy | ||||| |||| | ||||| |||| |
Decreased weight | ||||| |||| | ||||| |||| |
Pulmonary embolism | ||||| |||| | ||||| |||| |
Decreased neutrophil count | ||||| |||| | ||||| |||| |
Asthenia | ||||| |||| | ||||| |||| |
Pneumonia | ||||| |||| | ||||| |||| |
Increased alanine transaminase | ||||| |||| | ||||| |||| |
Hypophosphatemia | ||||| |||| | ||||| |||| |
Increased lipase | ||||| |||| | ||||| |||| |
Hematuria | ||||| |||| | ||||| |||| |
Nausea | ||||| |||| | ||||| |||| |
Febrile neutropenia | ||||| |||| | ||||| |||| |
Leukopenia | ||||| |||| | ||||| |||| |
Thrombocytopenia | ||||| |||| | ||||| |||| |
Decreased white blood cell count | ||||| |||| | ||||| |||| |
Decreased platelet count | ||||| |||| | ||||| |||| |
AE = adverse event; EV + P = enfortumab vedotin plus pembrolizumab; PLAT + GEM = platinum-based chemotherapy (cisplatin or carboplatin) plus gemcitabine; TEAE = treatment-emergent adverse event.
aReported in either treatment arm. Preferred terms are sorted by descending order of incidence in the EV + P arm.
Source: Clinical Study Report for Study EV-302.31
Table 26: Treatment-Emergent Adverse Events by System Organ Class (Safety Analysis Set)
AE (system organ class) | EV + P (N = 440) | PLAT + GEM (N = 433) |
|---|---|---|
AEs reported in more patients in EV + P arm than in PLAT + GEM arm, n (%) | ||
Endocrine disorders | ||||| |||| | ||||| |||| |
Eye disorders | ||||| |||| | ||||| |||| |
Gastrointestinal disorders | ||||| |||| | ||||| |||| |
Hepatobiliary disorders | ||||| |||| | ||||| |||| |
Immune system disorders | ||||| |||| | ||||| |||| |
Infections and infestations | ||||| |||| | ||||| |||| |
Injury, poisoning, and procedural complications | ||||| |||| | ||||| |||| |
Investigations | ||||| |||| | ||||| |||| |
Metabolism and nutrition disorders | ||||| |||| | ||||| |||| |
Musculoskeletal and connective tissue disorders | ||||| |||| | ||||| |||| |
Neoplasms benign, malignant and unspecified (including cysts and polyps) | ||||| |||| | ||||| |||| |
Nervous system disorders | ||||| |||| | ||||| |||| |
Psychiatric disorders | ||||| |||| | ||||| |||| |
Renal and urinary disorders | ||||| |||| | ||||| |||| |
Reproductive system and breast disorders | ||||| |||| | ||||| |||| |
Respiratory, thoracic, and mediastinal disorders | ||||| |||| | ||||| |||| |
Skin and subcutaneous tissue disorders | ||||| |||| | ||||| |||| |
AEs reported in fewer patients in EV + P arm than in PLAT + GEM arm, n (%) | ||
Blood and lymphatic system disorders | ||||| |||| | ||||| |||| |
Ear and labyrinth disorders | ||||| |||| | ||||| |||| |
General disorders and administration-site conditions | ||||| |||| | ||||| |||| |
Vascular disorders | ||||| |||| | ||||| |||| |
AE = adverse event; EV + P = enfortumab vedotin plus pembrolizumab; PLAT + GEM = platinum-based chemotherapy (cisplatin or carboplatin) plus gemcitabine.
Source: Clinical Study Report for Study EV-302.31
Serious Adverse Events
After a median follow-up of 17.2 months, 50.0% of patients in the EV + P arm and 39.0% of patients in the PLAT + GEM arm experienced at least 1 SAE (Table 26). The exposure-adjusted rates of SAEs were 1.141 events per patient-year in the EV + P arm and 2.219 events per patient-year in the PLAT + GEM arm. The most commonly reported SAEs (≥ 3%) that occurred more often in the EV + P arm than in the PLAT + GEM arm were acute kidney injury (EV + P versus PLAT + GEM: 5.2% versus 2.5%), and diarrhea (3.2% versus 0.5%). The most commonly reported SAEs (≥ 3%) that occurred less often in the EV + P arm than in the PLAT + GEM arm were urinary tract infections (3.6% versus 7.2%), anemia (0.7% versus 3.9%), and thrombocytopenia (0% versus 3.0%). Similar proportions of patients in each arm experienced any leading to death (4.3% in the EV + P arm versus 3.2% in the PLAT + GEM arm).
Withdrawals Due to Adverse Events
Withdrawals From Study Due to Adverse Events
After a median follow-up of 17.2 months, study discontinuation was reported for 33.0% of patients in the EV + P arm and for 54.3% of patients in the PLAT + GEM arm; most of these events were related to death (EV + P: 29.9%, PLAT + GEM: 50.9%). Patient withdrawal (reason not specified) was uncommon (EV + P: 2.7%, PLAT + GEM: 3.2%) and loss to follow-up was very uncommon (EV + P: 0.5%, PLAT + GEM: 0.2%) (Table 9).
Withdrawals From Treatment Due to Adverse Events
After a median follow-up of 17.2 months, in the EV + P arm, 39.8% patients discontinued the treatment due to AEs versus 21.5% patients in the PLAT + GEM arm. The exposure-adjusted rates of withdrawal from the treatment due to AEs were 0.508 events per patient-year in the EV + P arm and 0.663 events per patient-year in the PLAT + GEM arm.
The most common TEAEs leading to discontinuation of EV were peripheral sensory neuropathy (11.1%), maculopapular rashes (1.6%), and paresthesia (1.4%).
The most common reasons for discontinuing pembrolizumab were pneumonitis (2.0%), immune-mediated lung disease (1.4%), acute kidney disease (1.1%), and diarrhea (1.1%).
The most common TEAEs leading to discontinuation of PLAT + GEM were anemia (2.8%), acute kidney injury (2.3%), and increased blood creatinine (1.8%).
Notable Harms (Adverse Events of Special Interest)
After a median follow-up of 17.2 months, the most common AESIs (occurring in > 25% of patients) associated with enfortumab vedotin were skin reactions (EV + P versus PLAT + GEM: 69.1% versus 15.7%), peripheral neuropathy (66.6% versus 13.9%), and ocular disorders (29.1% versus 3.7%). Most of these events were grade 2 or lower and nonserious; no fatal AESIs were recorded.31 The most commonly reported AESIs (occurring in > 5% of patients) associated with pembrolizumab were severe skin reactions (EV + P versus PLAT + GEM: 17.0% versus 0.5%, respectively), hypothyroidism (10.7% versus 0.7%), and pneumonitis (9.5% versus 0.2%). Most of these events were also grade 2 or lower, nonserious, and were resolving or had resolved by the data cut-off; 1 patient experienced a grade 5 (fatal) event of pneumonitis.31
Critical Appraisal
Internal Validity
EV-302 was a phase III, open-label RCT. Appropriate methods for randomization via interactive response technology and treatment allocation were used. Patients were randomized based on the following 3 stratification factors: cisplatin eligibility, PD-L1 expression, and liver metastases. The outcomes assessed are clinically relevant. Standard statistical analysis methods were used. Although 2 patients (0.4%) in the EV + P arm and 11 patients (2.5%) in the PLAT + GEM arm did not receive the treatment overall, the risks of selection bias, confounding bias, and detection bias are considered low. However, several potential limitations are noteworthy.
The EV-302 trial had an open-label design, which could potentially increase the risk of bias in the reporting of outcomes that are subjective in measurement and interpretation, such as HRQoL and some AEs. The primary end point of OS is an objective end point, and unlikely to be affected by biases of open-label study designs. Response-based outcomes (PFS, ORR, and DOR) were evaluated using RECIST 1.1 by a BICR that did not have knowledge of the treatment assignment, which also limits potential bias related to the open-label study design.
The use of concomitant medications was slightly imbalanced between the 2 arms. Medications such as analgesics, antibacterials, and antihistamines for systemic use were more commonly used in the EV + P arm than in the PLAT + GEM arm; However, antithrombotic agents, antiemetics, and antinauseants, as well as corticosteroids for systemic use, were used less commonly in the EV + P arm than in the PLAT + GEM arm. Furthermore, a significant number of patients were not included in the analysis of HRQoL outcomes (EORTC QLQ-C30 at week 26; ||||| |||| patients in EV + P arm and ||||| |||| patients in PLAT + GEM arm were not included in the analysis).31 Although differences in the methods of administration and dosing of the intervention and comparator, as well as their known treatment-related toxicities, support an open-label study design as blinding may not be effective, patient or investigator knowledge of treatment assignment could present a risk of bias in PROs, such as pain reduction, HRQoL, and some of the harms outcomes, although the direction and the magnitude of the impact are uncertain.
Concomitant cancer-related procedures were reported slightly more commonly in the EV + P arm than in the PLAT + GEM arm (e.g., surgical resection: ||||| | versus ||||| ||). However, because of the small proportions of patients involved, this was not expected to be a source of substantial bias in the findings.
Important protocol deviations occurred slightly more frequently in the PLAT + GEM than in the EV + P arm (34 [5.6%] versus 16 [3.6%], respectively). Although no per-protocol analysis was performed, the proportion of the patients with important protocol deviations was relatively low and unlikely to have significantly affected the efficacy or safety analyses.
Assessments data for ORR, DOR, change from baseline in worst pain score, EORTC QLQ-C30, and EQ-5D-5L were not inputted for some patients (Table 21 and Table 22). The amount of missing data was high for some outcomes and could bias the reported findings (e.g., ||||| ||||||||| |||| for EV + P versus PLAT + GEM arms, respectively, were included in the EORTC QLQ-C30 analysis at week 26). For ORR and DOR, less than 1% of the data were missing in both the EV + P and PLAT + GEM arms, and this is therefore unlikely to have an impact on ORR and DOR results.
Acceptable methods to account for multiplicity were used in the EV-302 trial for dual-primary outcomes (PFS and OS) and some secondary outcomes (ORR, time to pain progression and change from baseline in worst pain score) used a graphical approach with sequential testing. However, other secondary outcomes, including DOR and EORTC QLQ-C30, were not controlled for multiplicity, and the results should therefore be interpreted with consideration of type I error.
Predefined subgroup results were generally aligned with the overall analysis for OS, PFS, and ORR. However, subgroups were not confirmatory in nature because the numbers of patients were small, and the analyses were not adjusted for multiplicity or missing data.
External Validity
The clinical experts consulted for this review noted the inclusion and exclusion criteria for the EV-302 trial were generally similar to the criteria for selecting eligible patients with locally advanced or metastatic UC for EV + P treatment in the Canadian clinical setting, except that patients with central nervous system metastases would be eligible if their disease was under control.
In addition, the clinical experts indicated that, in clinical practice, measurable disease by investigator assessment according to RECIST 1.1 is usually not a necessary criterion for selecting patients for treatment, as the treatment response can be assessed based on clinical response, such as symptom reduction. Radiologic response is also critical in assessing response to treatment, but it does not need to be specifically according to RECIST 1.1.
Furthermore, about 3% of patients in each arm had an ECOG PS of 2 at enrolment. The clinical experts consulted for this review indicated that this underrepresents the patients with an ECOG PS of 2 who received anticancer treatment in clinical practice. The clinical experts emphasized that treatment with EV + P should be based on the judgment of the treatment oncologist and not be too prescriptive with respect to restricting it to patients with ECOG PS of 2 or lower.
The clinical experts noted that, compared with the patients in a Canadian clinical setting, the patients in the EV-302 study appeared to be slightly younger (i.e., median age of 68 years) and the proportion of the patients with prior systemic therapy in an adjuvant or neoadjuvant setting appeared to be lower. They also noted that only 47 patients (5.3%) from 11 Canadian sites were enrolled in the EV-302 study. However, based on the demographic and disease characteristics of patients and the dosed regimen used in the EV-302 study, the clinical experts did not identify a major concern about generalizability to the Canadian clinical practice.
GRADE Summary of Findings and Certainty of the Evidence
Methods for Assessing the Certainty of the Evidence
For pivotal studies and RCTs identified in the sponsor’s systematic review, GRADE was used to assess the certainty of the evidence for outcomes considered most relevant to inform CDA-AMC expert committee deliberations, and a final certainty rating was determined as outlined by the GRADE Working Group (Balshem et al. [2011]32 and Santesso et al. [2020]33).
High certainty: We are very confident that the true effect lies close to that of the estimate of the effect.
Moderate certainty: We are moderately confident in the effect estimate — The true effect is likely to be close to the estimate of the effect, but there is a possibility that it is substantially different. We use the word “likely” for evidence of moderate certainty (e.g., “X intervention likely results in Y outcome”).
Low certainty: Our confidence in the effect estimate is limited — The true effect may be substantially different from the estimate of the effect. We use the word “may” for evidence of low certainty (e.g., “X intervention may result in Y outcome”).
Very low certainty: We have very little confidence in the effect estimate — The true effect is likely to be substantially different from the estimate of effect. We describe evidence of very low certainty as “very uncertain.”
In the GRADE approach, evidence from RCTs starts as high-certainty evidence and can be rated down for concerns related to study limitations (internal validity or risk of bias), inconsistency across studies, indirectness, imprecision of effects, and publication bias.
When possible, certainty was rated in the context of the presence of an important (nontrivial) treatment effect; if this was not possible, certainty was rated in the context of the presence of any treatment effect (i.e., the clinical importance is unclear). In all cases, the target of the certainty of evidence assessment was based on the point estimate and where it was located relative to the threshold for a clinically important effect (when a threshold was available) or to the null.
Results of GRADE Assessments
Table 2 presents the GRADE summary of findings for EV + P versus PLAT + GEM for the treatment of patients with locally advanced or metastatic UC.
Long-Term Extension Studies
The sponsor did not submit any evidence from long-term extension studies of EV + P in patients with locally advanced or metastatic UC.
Indirect Evidence
The sponsor did not submit any indirect evidence regarding EV + P in patients with locally advanced or metastatic UC, as the EV-302 study provides direct evidence compared to standard-of-care platinum-based chemotherapy.
Studies Addressing Gaps in the Systematic Review Evidence
The EV-302 study provides direct head-to-head evidence comparing EV + P to standard-of-care platinum-based chemotherapy for adult patients with locally advanced or metastatic UC who have not received prior systemic therapy for locally advanced or metastatic UC. The sponsor therefore did not identify any important gaps in the evidence and did not submit additional evidence in this section.
Discussion
Summary of Available Evidence
The CDA-AMC Clinical Review was based on evidence from 1 pivotal trial (EV-302) and included input from patient groups, clinician groups, clinical experts, and drug programs. The EV-302 trial was a multinational, open-label, phase III RCT that compared the efficacy and harms of EV + P versus PLAT + GEM in the treatment of patients with locally advanced or metastatic UC. The EV-302 trial assessed the efficacy and safety outcomes of EV + P versus PLAT + GEM over a median follow-up of 17.2 months (95% CI, 16.5 to 17.9; range, 0.07 to 37.16).
A total of 886 patients in 180 sites across North America, Europe, South America, Australia, Asia, and the Middle East, including 47 patients from Canada, were randomized (1:1) to receive EV + P (n = 442) or PLAT + GEM (n = 444). The mean age was 67.9 years (SD = 9.2 years). Male patients accounted for 76.7% of the study population (n = 680) and the majority of patients (67.5%) were white (n = 598) or of Asian ethnicity (n = 191, 21.6%). Most patients had an ECOG PS of 0 or 1 (n = 858, 96.9%). Patients who were cisplatin-ineligible at randomization accounted for 45.6% of the study population (n = 404). The dual-primary efficacy outcomes were PFS according to RECIST 1.1 by BICR and OS. PFS was defined as the time from randomization to the first instance of disease progression or death from any cause. OS was defined as the time from randomization to death from any cause. The secondary outcome end points included ORR according to RECIST 1.1 by BICR, time to pain progression, change from baseline in worst pain, DOR, EORTC QLQ-C30, EQ-5D-5L, and safety. At the data cut-off (August 8, 2023), the median follow-up was 17.3 months (95% CI, 16.4 to 18.2; range, 0.26 to 37.16) in the EV+ P arm and 16.9 months (95% CI, 16.1 to 18.5; range, 0.07 to 36.21) in the PLAT + GEM arm. The median treatment duration was 9.43 months in the EV + P arm and 4.14 months in the PLAT + GEM arm.
Interpretation of Results
Efficacy
After a median follow-up of 17.2 months, PFS by BICR showed a statistically significant and clinically meaningful improvement in the EV + P arm compared with the PLAT + GEM arm. The relative hazard of developing a disease-progression event in the EV + P arm was clinically meaningfully reduced by 55% compared to the PLAT + GEM arm (HR = 0.450). Patients in the EV+ P arm also demonstrated a clinically meaningful longer median PFS compared with those in the PLAT + GEM arm (treatment-group difference = 6 months). According to the clinical experts consulted for this review, compared with the PLAT + GEM used as the first-line treatment, EV + P used as the first-line treatment showed a clinically meaningful higher PFS rate starting from 12 months and sustained to 18 months. Subgroup analyses and sensitivity analyses of PFS appeared to be consistent with those in the primary analysis.
The analysis of OS revealed a statistically significant and clinically meaningful improvement in OS with EV + P versus PLAT + GEM. The relative hazard of death in the EV + P arm was clinically meaningfully reduced by 54.2% compared to the PLAT + GEM arm (HR = 0.468). The median OS in the EV + P arm was 15.4 months longer than in the PLAT + GEM arm, a difference that was considered clinical meaningful by the clinical experts consulted for this review. Furthermore, according to the clinical experts, compared with PLAT + GEM first-line treatment, EV + P used as first-line treatment showed a clinically meaningful higher OS rate starting from 12 months and sustained to 18 months. Subgroup analyses and sensitivity analyses of OS appeared to be consistent with the primary analysis.
After an overall median follow-up of 17.2 months, 23.3% more patients in EV + P arm attained the ORR than did those in the PLAT + GEM arm, which the clinical experts consulted for this review considered to be a clinically meaningful improvement. Subgroup analyses showed consistent ORR benefits favouring EV + P across all prespecified subgroups.
The analysis of DOR by BICR was not formally tested, although, after an overall median follow-up of 17.2 months, the median DOR was longer in the EV + P arm compared to the PLAT + GEM arm (not reached versus 7.0 months, respectively) and a smaller proportion of patients had progressed or died in the EV + P arm (33.4% versus 60.7%). Estimated rates of patients who maintained their responses were higher in the EV + P arm compared to the PLAT + GEM arm (i.e. ||||| |||| higher at 6 months ||||| ||||% higher at 12 months and ||||| ||||% higher at 18 months). The results of the sensitivity analysis by investigator were consistent with those of the primary analysis, favouring the EV + P arm. According to the clinical experts consulted for this review, the DOR improvements in EV + P was clinical meaningful compared with PLAT + GEM first-line treatment.
The patient-reported and HRQoL outcomes were identified as important by patients. The findings of EORTC QLQ-C30 assessed at week 26 showed that no apparent worsening in HRQoL at week 26. No clinically meaningful between-group (EV + P versus PLAT + GEM) or intragroup differences were observed. The clinical experts consulted for this review emphasized that they did not expect to see a significant improvement in QoL with the anticancer treatment for this population. Other patient-reported and HRQoL outcomes, including time to pain progression, change from baseline in worst pain scores, and EQ-5D-5L also did not show clinically meaningful intragroup and intergroup differences from week 8 to week 71. A significant number of patients were not included in the analyses of PROs and HRQoL outcomes, which is an important limitation and a source of uncertainty.
The clinical experts consulted for this review indicated that the EV + P combination is a relatively new treatment regimen for this population, and only a limited number of Canadian oncologists have experience using EV + P to treat locally advanced or metastatic UC. In addition, the duration of the EV + P treatment in the EV-302 trial was relatively short, and future PFS data are needed to better understand the efficacy of subsequent treatments (e.g., subsequent PLAT + GEM chemotherapy and immunotherapy).
Harms
The harms outcome was based on the data cut-off of August 8, 2023, which represented a median follow-up of 17.2 months. The overall rates of AEs were similar in both the EV + P and PLAT + GEM arms. However, some AEs (e.g., peripheral sensory neuropathy and pruritus) occurred more often in the EV + P arm than in the PLAT + GEM arm, whereas anemia, neutropenia, and nausea were more frequent with PLAT + GEM. Fewer patients in the EV + P arm than in the PLAT + GEM arm reported grade 3 to 5 TEAEs. However, more patients in EV + P arm experienced SAEs compared with those in PLAT + GEM arm. The clinical experts consulted for this review indicated that, overall, the type and distribution of AEs observed in the EV-302 trial were not unexpected compared with clinical practice. In addition, they noted that the proportion of patients who discontinued treatment because of AEs was higher in the EV + P arm compared to the PLAT + GEM arm. Peripheral sensory neuropathy was the most common AE that caused treatment discontinuation in EV + P arm. Anemia was the most common AEs that caused treatment discontinuation in PLAT + GEM arm. TEAEs leading to death appeared to be similar across the 2 arms. The clinical experts consulted for this review indicated that, of the reported AESIs for enfortumab vedotin, skin reactions and hyperglycemia are the most clinically important. The incidences of skin reactions and hyperglycemia were higher in EV + P arm than in the PLAT + GEM arm. The clinical experts consulted for this review also noted that hepatitis is the most clinically important AESI for pembrolizumab. In the EV-302 trial, the incidence of hepatitis was clinically meaningfully higher in the EV + P arm than in the PLAT + GEM arm.
In summary, according to the clinical experts consulted for this review, the harms profile of EV + P as reported in the EV-302 trial was generally consistent with previously known AEs associated with EV + P in the treatment of patients with locally advanced or metastatic UC; and no new safety signals or adverse drug reactions were identified. Overall, most AEs were predictable, acceptable, and clinically manageable in most patients.
Conclusion
The EV-302 trial demonstrated that EV + P had a clinically meaningful benefit compared to PLAT + GEM in improving PFS, OS, and ORR for the treatment of patients locally advanced or metastatic UC. Based on the EORTC QLQ-C30 GHS results, EV + P may result in little to no clinically important difference in patient HRQoL compared with PLAT + GEM, which was expected for this population. The safety profile of EV + P appeared to differ from that of PLAT + GEM and was consistent with the known safety profiles of enfortumab vedotin monotherapy and pembrolizumab monotherapy, which are predictable, acceptable, and clinically manageable in most patients. No new safety signals were identified in the EV-302 trial.
References
1.Shah MV, McGovern A, Hepp Z. Targeted literature review of the burden of illness in UC (PCN108). Value in Health. 2018;21(S3):S32-S33.
2.Locally advanced/metastatic bladder cancer clinical practice guidelines (Clinical Practice Guideline GU–014 Version 4). Edmonton (AB): Cancer Care Alberta; 2023: https://www.albertahealthservices.ca/assets/info/hp/cancer/if-hp-cancer-guide-gu014-ambc.pdf. Accessed 2024 Feb 12.
3.Canadian Cancer Statistics Advisory Committee in collaboration with the Canadian Cancer Society, Statistics Canada and the Public Health Agency of Canada. Canadian cancer statistics 2023. Toronto (ON): Canadian Cancer Society; 2023: https://cancer.ca/Canadian-Cancer-Statistics-2023-EN. Accessed 2023 Nov 13.
4.American Cancer Society. Key statistics for bladder cancer. 2024; https://www.cancer.org/cancer/types/bladder-cancer/about/key-statistics.html. Accessed 2024 Mar 13.
5.Canadian Cancer Society. Survival statistics for bladder cancer. https://cancer.ca/en/cancer-information/cancer-types/bladder/prognosis-and-survival/survival-statistics. Accessed 2023 Nov 13.
6.Canadian Cancer Society. What is bladder cancer? https://cancer.ca/en/cancer-information/cancer-types/bladder/what-is-bladder-cancer. Accessed 2023 Nov 13.
7.Kamat AM, Hahn NM, Efstathiou JA, et al. Bladder cancer. Lancet. 2016;388(10061):2796-2810. PubMed
8.American Cancer Society. Bladder cancer staging: Bladder cancer stages. 2019; https://www.cancer.org/cancer/types/bladder-cancer/detection-diagnosis-staging/staging.html. Accessed 2024 Mar 5.
9.Drug Reimbursement Review: Avelumab (Bavencio) for urothelial carcinoma. Ottawa (ON): CADTH; 2021: https://www.cadth.ca/avelumab-bavencio-urothelial-carcinoma-details. Accessed 2024 Mar 11.
10.Drug Reimbursement Review: Enfortumab vedotin. Ottawa (ON): CADTH; 2021: https://www.cadth.ca/enfortumab-vedotin. Accessed 2024 Mar 5.
11.Drug Reimbursement Review: Keytruda for metastatic urothelial carcinoma. Ottawa (ON): CADTH; 2018: https://www.cadth.ca/keytruda-metastatic-urothelial-carcinoma-details. Accessed 2024 Mar 11.
12.Canadian cancer statistics: A 2022 special report on cancer prevalence. Toronto (ON): Canadian Cancer Society; 2022: https://cancer.ca/Canadian-Cancer-Statistics-2022-EN. Accessed 2024 Mar 13.
13.Alimohamed N, Grewal S, Wirtz HS, et al. Understanding treatment patterns and outcomes among patients with de novo unresectable locally advanced or metastatic urothelial cancer: A population-level retrospective analysis from Alberta, Canada. Curr Oncol. 2022;29(10):7587-7597. PubMed
14.Padcev + Keytruda (enfortumab vedotin + pembrolizumab, EV + P) for the treatment of patients with locally advanced or metastatic urothelial cancer: Sponsor clinical evidence summary [internal sponsor's report]. In: Drug Reimbursement Review sponsor submission: Padcev (Enfortumab vedotin), 10 mg per mL (single-dose vials containing 20 mg and 30 mg of enfortumab vedotin), lyophilized powder for solution for intravenous infusion. Mississauga (ON): Seagen Canada Inc. (now part of Pfizer Canada ULC); 2024 May 22.
15.Warren M, Kolinsky M, Canil CM, et al. Canadian Urological Association/Genitourinary Medical Oncologists of Canada consensus statement: Management of unresectable locally advanced and metastatic urothelial carcinoma. Can Urol Assoc J. 2019;13(10):318-327. PubMed
16.Black PC, Alimohamed NS, Berman D, et al. Optimizing management of advanced urothelial carcinoma: A review of emerging therapies and biomarker-driven patient selection. Can Urol Assoc J. 2020;14(8):E373-E382. PubMed
17.Morgans AK, Galsky MD, Wright P, et al. Real-world treatment patterns and clinical outcomes with first-line therapy in patients with locally advanced/metastatic urothelial carcinoma by cisplatin-eligibility. Urol Oncol. 2023;41(8):357 e311-357 e321.
18.Provisional Funding Algorithm: Metastatic urothelial carcinoma. Ottawa (ON): CADTH; 2023: https://www.cadth.ca/metastatic-urothelial-carcinoma. Accessed 2024 Jan 19.
19.Systemic therapy for metastatic urothelial cancer: An endorsement of a portion of the European Association of Urology guideline on muscle-invasive and metastatic bladder cancer. Toronto (ON): Cancer Care Ontario; 2022: https://www.cancercareontario.ca/sites/ccocancercare/files/guidelines/full/pebc3-24f.pdf. Accessed 2024 Feb 12.
20.Kato M, Kobayashi T, Matsui Y, et al. Impact of the objective response to and number of cycles of platinum-based first-line chemotherapy for metastatic urothelial carcinoma on overall survival of patients treated with pembrolizumab. Int J Urol. 2021;28(12):1261-1267. PubMed
21.Chovanec M, Abu Zaid M, Hanna N, El-Kouri N, Einhorn LH, Albany C. Long-term toxicity of cisplatin in germ-cell tumor survivors. Ann Oncol. 2017;28(11):2670-2679. PubMed
22.Barabas K, Milner R, Lurie D, Adin C. Cisplatin: A review of toxicities and therapeutic applications. Vet Comp Oncol. 2008;6(1):1-18. PubMed
23.Carles J, Nogue M, Domenech M, et al. Carboplatin-gemcitabine treatment of patients with transitional cell carcinoma of the bladder and impaired renal function. Oncology. 2000;59(1):24-27. PubMed
24.Dogliotti L, Carteni G, Siena S, et al. Gemcitabine plus cisplatin versus gemcitabine plus carboplatin as first-line chemotherapy in advanced transitional cell carcinoma of the urothelium: Results of a randomized phase 2 trial. Eur Urol. 2007;52(1):134-141. PubMed
25.Freshwater T, Li H, Valiathan C, et al. Systematic literature review and meta-analysis of response to first-line therapies for advanced/metastatic urothelial cancer patients who are cisplatin ineligible. Am J Clin Oncol. 2019;42(10):802-809. PubMed
26.Holmsten K, Jensen NV, Mouritsen LS, et al. Vinflunine/gemcitabine versus carboplatin/gemcitabine as first-line treatment in cisplatin-ineligible patients with advanced urothelial carcinoma: A randomised phase II trial (VINGEM). Eur J Cancer. 2020;127:173-182. PubMed
27.Linardou H, Aravantinos G, Efstathiou E, et al. Gemcitabine and carboplatin combination as first-line treatment in elderly patients and those unfit for cisplatin-based chemotherapy with advanced bladder carcinoma: Phase II study of the Hellenic Co-operative Oncology Group. Urology. 2004;64(3):479-484. PubMed
28.Park I, Lee JL. Systemic treatment for advanced urothelial cancer: An update on recent clinical trials and current treatment options. Korean J Intern Med. 2020;35(4):834-853. PubMed
29.Real-world evidence study of metastatic urothelial carcinoma (MUC) in Alberta, Canada. March 2024 Update. Oncology Outcomes [sponsor provided reference]. 2024.
30.van der Heijden MS, Sonpavde G, Powles T, et al. Nivolumab plus gemcitabine-cisplatin in advanced urothelial carcinoma. N Engl J Med. 2023;389(19):1778-1789. PubMed
31.Clinical Study Report: EV-302. An open-label, randomized, controlled phase 3 study of enfortumab vedotin in combination with pembrolizumab versus chemotherapy alone in previously untreated locally advanced or metastatic urothelial cancer (data cut-off: 08Aug2023) [internal sponsor's report]. . Mississauga (ON): Seagen, Inc; 2023.
32.Balshem H, Helfand M, Schunemann HJ, et al. GRADE guidelines: 3. Rating the quality of evidence. J Clin Epidemiol. 2011;64(4):401-406. PubMed
33.Santesso N, Glenton C, Dahm P, et al. GRADE guidelines 26: Informative statements to communicate the findings of systematic reviews of interventions. J Clin Epidemiol. 2020;119:126-135. PubMed
34.American Joint Committee on Cancer cancer staging form supplement. Chicago (IL): American College of Surgeons; 2018: https://cancerstaging.org/references-tools/deskreferences/Documents/AJCC%20Cancer%20Staging%20Form%20Supplement.pdf. Accessed 2024 Mar 11.
35.Institut national d'excellence en santé et en services sociaux. Extrait de l’avis au ministre sur Bavencio (carcinome urothélial). Montreal (QC): INESSS; 2021: https://www.inesss.qc.ca/thematiques/medicaments/medicaments-evaluation-aux-fins-dinscription/extrait-davis-au-ministre/bavencio-5614. Accessed 2024 Mar 11.
36.Institut national d'excellence en santé et en services sociaux. Extrait de l’Avis au ministre sur Keytruda (cancer urothélial). Montreal (QC): INESSS; 2019: https://www.inesss.qc.ca/thematiques/medicaments/medicaments-evaluation-aux-fins-dinscription/extrait-davis-au-ministre/keytruda-cancer-urothelial-4859.html. Accessed 2024 Mar 11.
37.Canadian Clinician Interviews for laUC or mUC. Seagen Canada Inc. [sponsor provided reference]. 2024.
38.Padcev (enfortumab vedotin): lyophilized powder for solution for intravenous infusion only, 20 mg and 30 mg single-use vials [draft product monograph]. Mississauga (ON): Seagen Canada Inc; 2023 Dec 22.
39.Powles T, Valderrama BP, Gupta S, et al. Enfortumab vedotin and pembrolizumab in untreated advanced urothelial cancer. N Engl J Med. 2024;390(10):875-888. PubMed
40.Astellas Pharma Global Development Inc. NCT04223856: Enfortumab vedotin and pembrolizumab vs. Chemotherapy alone in untreated locally advanced or metastatic urothelial cancer (EV-302). ClinicalTrials.gov. Bethesda (MD): U.S. National Library of Medicine: https://clinicaltrials.gov/study/NCT04223856. Accessed 2024 Mar 1.
41.CADTH Reimbursement Recommendation: Enfortumab vedotin (Padcev). Can J Health Technol. 2022;2(1). https://www.cadth.ca/sites/default/files/DRR/2022/PC0251REC-Padcev%20Final-meta.pdf. Accessed 2024 Feb 6.
42.Osoba D, Rodrigues G, Myles J, Zee B, Pater J. Interpreting the significance of changes in health-related quality-of-life scores. J Clin Oncol. 1998;16(1):139-144. PubMed
43.Herdman M, Gudex C, Lloyd A, et al. Development and preliminary testing of the new five-level version of EQ-5D (EQ-5D-5L). Qual Life Res. 2011;20(10):1727-1736. PubMed
44.McClure NS, Sayah FA, Xie F, Luo N, Johnson JA. Instrument-defined estimates of the minimally important difference for EQ-5D-5L index scores. Value Health. 2017;20(4):644-650. PubMed
45.Pickard AS, Neary MP, Cella D. Estimation of minimally important differences in EQ-5D utility and VAS scores in cancer. Health Qual Life Outcomes. 2007;5(1):70. PubMed
46.Bellmunt J, von der Maase H, Mead GM, et al. Randomized phase III study comparing paclitaxel/cisplatin/gemcitabine and gemcitabine/cisplatin in patients with locally advanced or metastatic urothelial cancer without prior systemic therapy: EORTC Intergroup Study 30987. J Clin Oncol. 2012;30(10):1107-1113. PubMed
47.De Santis M, Bellmunt J, Mead G, et al. Randomized phase II/III trial assessing gemcitabine/carboplatin and methotrexate/carboplatin/vinblastine in patients with advanced urothelial cancer who are unfit for cisplatin-based chemotherapy: EORTC study 30986. J Clin Oncol. 2012;30(2):191-199. PubMed
48.Rosenberg JE, Ballman KA, Halabi S, et al. Randomized Phase III trial of gemcitabine and cisplatin with bevacizumab or placebo in patients with advanced urothelial carcinoma: Results of CALGB 90601 (Alliance). J Clin Oncol. 2021;39(22):2486-2496. PubMed
49.Galsky MD, Arija JAA, Bamias A, et al. Atezolizumab with or without chemotherapy in metastatic urothelial cancer (IMvigor130): A multicentre, randomised, placebo-controlled phase 3 trial. Lancet. 2020;395(10236):1547-1557. PubMed
50.Seagen Canada Inc. response to June 20, 2024 CDA-AMC request for additional information regarding Padcev (enfortumab vedotin) CDA-AMC review: Padcev® (enfortumab vedotin) pre-NOC New Indication Submission for the treatment of patients with locally advanced or metastatic urothelial cancer: Mississauga (ON): Seagen Canada Inc.; 2024 Jul 4.
51.Seagen Canada Inc. response to July 4, 2024 CDA-AMC request for additional information regarding Padcev (enfortumab vedotin) CDA-AMC review: Padcev® (enfortumab vedotin) pre-NOC New Indication Submission for the treatment of patients with locally advanced or metastatic urothelial cancer: Mississauga (ON): Seagen Canada Inc.; 2024 Jul 5.
Pharmacoeconomic Review
Abbreviations
AE
adverse event
BCC
Bladder Cancer Canada
BIA
budget impact analysis
DAC
Drug Advisory Committee
EV + P
enfortumab vedotin plus pembrolizumab
ICER
incremental cost-effectiveness ratio
KM
Kaplan-Meier
LY
life-year
OS
overall survival
PLAT + GEM
platinum-based chemotherapy (cisplatin or carboplatin) plus gemcitabine
PFS
progression-free survival
QALY
quality-adjusted life-year
RDI
relative dose intensity
ToT
time on treatment
UC
urothelial cancer
WTP
willingness-to-pay
Executive Summary
The executive summary comprises 2 tables (Table 1 and Table 2) and a conclusion.
Item | Description |
|---|---|
Drug product | Enfortumab vedotin (Padcev), lyophilized powder for solution for IV infusion |
Indication | Proposed: in combination with pembrolizumab, for the treatment of patients with locally advanced or metastatic urothelial carcinoma |
Health Canada approval status | NOC |
Health Canada review pathway | Priority review, Project Orbis |
NOC date | August 20, 2024 |
Reimbursement request | As per indication |
Sponsor | Seagen Canada Inc. (now part of Pfizer Canada ULC) |
Submission history | Previously reviewed: Yes Locally advanced or metastatic urothelial cancer Indication: For the treatment of patients with locally advanced or metastatic urothelial cancer who have previously received a programmed death receptor-1 or programmed death-ligand 1 inhibitor and who: have received a platinum-containing chemotherapy in the neoadjuvant/adjuvant, locally advanced or metastatic setting. Recommendation date: January 6, 2022 Recommendation: Reimburse with clinical criteria and/or conditions |
NOC = Notice of Compliance.
Table 2: Summary of Economic Evaluation
Component | Description |
|---|---|
Type of economic evaluation | Cost-utility analysis Partitioned survival model |
Target population | Histologically confirmed locally advanced or metastatic urothelial cancer without prior systemic therapy, including those who had received neoadjuvant chemotherapy (or adjuvant chemotherapy after cystectomy) with recurrence > 12 months from treatment completion |
Treatments | EV + P |
Dose regimen | Enfortumab vedotin: 1.25 mg/kg (up to a maximum of 125 mg for patients ≥ 100 kg) on days 1 and 8 of a 21-day cycle until disease progression or unacceptable toxicity Pembrolizumab: 2 mg/kg (up to a maximum of 200 mg) on day 1 of a 21-day cycle |
Submitted price | Enfortumab vedotin: $1,181 per 20 mg vial Enfortumab vedotin: $1,772 per 30 mg vial |
Submitted treatment cost | Enfortumab vedotin: $15,747 per 28 days EV + P: $24,547 per 28 days |
Comparator | Platinum-based chemotherapy (gemcitabine plus carboplatin or gemcitabine plus cisplatin) |
Perspective | Canadian publicly funded health care payer |
Outcomes | QALYs, LYs |
Time horizon | 15 years |
Key data source | EV-302 trial, a phase III, randomized, open-label trial |
Submitted results | ICER = $103,466 per QALY gained (incremental costs: $165,909; incremental QALYs: 1.60; incremental LYs: 2.16) |
Key limitations |
|
CDA-AMC reanalysis results |
|
CDA-AMC = Canada’s Drug Agency; EV + P = enfortumab vedotin plus pembrolizumab; ICER = incremental cost-effectiveness ratio; LY = life-year; OS = overall survival; PFS = progression-free survival; QALY = quality-adjusted life-year; ToT = time on treatment.
Conclusions
The CDA-AMC Clinical Review noted evidence from the EV-302 trial demonstrating that enfortumab vedotin in combination with pembrolizumab (EV + P) was associated with a clinically meaningful benefit compared to platinum chemotherapy plus gemcitabine (PLAT + GEM) in improving progression-free survival (PFS) and overall survival (OS) for the treatment of patients with locally advanced or metastatic urothelial cancer (UC). However, this combination may result in little to no clinically significant difference in general health-related quality of life when compared to platinum-based chemotherapy. The safety profile of EV + P aligns with the known safety profiles of enfortumab vedotin and pembrolizumab as monotherapies. These safety profiles were generally predictable, acceptable, and manageable in most patients, with no new safety concerns identified in the EV-302 trial.
In the CDA-AMC base case, EV + P was more effective (1.24 incremental life-years [LYs] and 0.94 incremental quality-adjusted life-years [QALYs]) and associated with greater total costs ($273,140 in incremental costs) compared with platinum-based chemotherapy, resulting in an incremental cost-effectiveness ratio (ICER) of $290,563 per QALY gained. Incremental QALYs were driven largely by the mortality benefit associated with EV + P (an additional 1.24 LYs for patients receiving EV + P relative to platinum-based chemotherapy). Incremental costs were driven by larger treatment acquisition costs associated with EV + P generating an additional $290,541 in drug treatment costs per patient. This increased cost was slightly offset by a reduction of $18,514 in drug costs associated with subsequent therapies as only patients who receive platinum-based chemotherapy could go on to receive enfortumab vedotin or pembrolizumab upon progression. Based on the CDA-AMC base-case analysis, a 78% price reduction in both pembrolizumab and enfortumab vedotin would be required for the combination to be considered cost-effective at a willingness-to-pay (WTP) threshold of $50,000 per QALY gained. This would reduce per-patient costs of EV + P from $24,547 per 28 days to $5,400.
Uncertainty remains regarding the long-term survival impact for those who receive EV + P. Scenario analyses conducted show the impact of more optimistic or pessimistic extrapolations of OS lead to ICERs ranging from $242,606 to $323,784 per QALY gained.
Input Relevant to the Economic Review
This section is a summary of the feedback received from the patient groups, clinician groups, and drug plans that participated in the review process.
CDA-AMC received patient group input from Bladder Cancer Canada (BCC), which collected data from a survey of 7 patients and 2 caregivers, 7 of whom resided in Canada (Alberta, British Columbia, and Ontario). Respondents had treatment experience with gemcitabine, cisplatin, carboplatin, paclitaxel, radiation, transurethral resection of bladder tumour procedures, radical cystectomy, and neobladder reconstruction. Six respondents had received platinum-based chemotherapy, while the other 3 had received enfortumab vedotin as their first IV treatment. Of the 7 respondents who had treatment experience with EV + P, 4 participated in further telephone interviews. The most common side effects of current therapies were fatigue (67%) and loss of appetite, neuropathy, and hair loss (44% each). Fatigue and neuropathy were most frequently cited as the most difficult side effects to tolerate. When asked to rate whether their current therapies were able to manage their cancer symptoms, the average score was 7 out of 10 (10 being “strongly agree”), with only 1 respondent giving a score below 5. Two respondents noted that while enfortumab vedotin was effective with soft-tissue tumours, it failed to control bone metastases. When asked to rate the tolerability of enfortumab vedotin from 1 (completely tolerable) to 10 (completely intolerable), the average response was 6; however, 4 respondents rated it a 1 while the other 3 rated it as 8 or higher. When asked to rate how their life changed on enfortumab vedotin compared to other therapies on a scale of 1 (much worse) to 5 (much better), maintaining quality of life (4.3), drug side effects (4.1), cancer symptoms (3.7), and controlling disease progression (3.3) were all ranked as better than their other therapies, while preventing recurrence (2.9) was slightly worse. Respondents also rated how side effects associated with enfortumab vedotin affected aspects of their lives on a scale of 1 (much worse) to 5 (much better). Ability to sleep received an average rating of 3.0, ability to work 2.3, ability to spend time with family and/or friends 2.0, ability to perform household chores 1.9, and ability to care for children 1.3. When queried on whether they would recommend enfortumab vedotin to other patients, 6 responded they would, while 1 was uncertain due to lack of efficacy, and 1 caregiver did not think enfortumab vedotin should have been the first line of therapy for their loved 1 due to bone metastases. One patient in rural Alberta noted that a drug that could be taken at home or at a regional treatment centre would be advantageous compared to having to travel to a major city for treatment.
CDA-AMC received input from 2 clinician groups: BCC and the Ontario Health (Cancer Care Ontario) Genitourinary Cancer Drug Advisory Committee (DAC). BCC’s input was based on an online survey of 5 responding clinicians, while the DAC collected information from 7 clinicians through videoconferencing. Both groups reported the current first line of treatment includes platinum-based chemotherapy and avelumab. BCC added that, for patients who progress on chemotherapy, the standard subsequent treatment is pembrolizumab, and once patients progress on immunotherapy (avelumab or pembrolizumab) the standard of care for second-line treatment is enfortumab vedotin monotherapy or erdafitinib (for fibroblast growth factor receptor–altered cancers). Both groups stated that EV + P would become the first-line standard of care, with the DAC noting that patients deemed eligible for immunotherapy-based regimens are best suited for treatment with EV + P, and that any patients with UC should be eligible regardless of histology. BCC noted that it is not currently possible to identify which patients will benefit most from EV + P therapy due to the absence of identified biomarkers, but that patients with active autoimmune disease or an organ transplant would not be able to receive pembrolizumab.
The public drug plans noted that they would implement weight-based dosing for pembrolizumab, similar to other cancer sites. The plans also noted that the sponsor’s projected budget impact of $321 million over 3 years is concerning in terms of sustainability.
Two of these concerns were addressed in the sponsor’s model: the cost and health-utility decrements due to the most common adverse event (fatigue) weight-based dosing of pembrolizumab.
Economic Review
Economic Evaluation
Summary of Sponsor’s Economic Evaluation
Overview
The sponsor submitted a cost-utility analysis of EV + P compared with platinum-based chemotherapy, i.e., gemcitabine plus carboplatin or gemcitabine plus cisplatin.1 The target population is for the treatment of patients with histologically confirmed locally advanced or metastatic UC who had not received prior systemic therapy, including those who had received neoadjuvant chemotherapy (or adjuvant chemotherapy after cystectomy) with recurrence more than 12 months from treatment completion.
Enfortumab vedotin is available as a powder for solution for IV infusion (10 mg/mL, 20 mg or 30 mg per vial).2 The recommended dose is 1.25 mg/kg (up to a maximum of 125 mg for patients ≥ 100 kg) administered on days 1 and 8, in combination with pembrolizumab 2 mg/kg (up to a maximum of 200 mg) on day 1 of every 21-day cycle.
At the submitted price of $1,181 per 20 mg vial and $1,772 per 30 mg vial, the per-cycle (21 day) cost of enfortumab vedotin was estimated to be $9,254, assuming a relative dose intensity (RDI) of ████% and perfect vial sharing. This was based on the RDI reported in the EV-302 trial.3 When combined with pembrolizumab the total regimen cost was $15,932 per 21-day cycle. The total 21-day cycle regimen costs for gemcitabine plus cisplatin and gemcitabine plus carboplatin were $1,372 and $1,888, respectively. The sponsor considered no drug wastage and a 100% RDI to calculate other first-line treatments (pembrolizumab, gemcitabine, cisplatin, and carboplatin).
The submitted model reported both QALYs and LYs over a lifetime time horizon (15 years) in the modelled population. The base-case analysis was conducted from the perspective of the Canadian public health care payer. Both costs and health outcomes were discounted at an annual rate of 1.5%.
Model Structure
The sponsor submitted a partitioned survival model, including 3 health states: preprogression, postprogression, and death (Appendix 3; Figure 1). The modelled cycle length was 1 week. All patients began in the preprogression health state, in which they were assumed to be stable or responding to therapy, as defined by the PFS measure assessed in the EV-302 trial (Response Evaluation Criteria in Solid Tumours Version 1.1). During each cycle, patients in the preprogression health state remained in the state, transitioned to death, or transitioned to the postprogression health state. The proportion of patients in the postprogression health state was calculated by subtracting the proportion of patients alive and progression-free (based on the PFS curve) from the proportion of patients alive (based on the OS curve). Patients in the postprogression health state either remained in this state or transitioned to death.
Model Inputs
The modelled patient cohort comprised adult patients with histologically confirmed locally advanced or metastatic UC who had not received prior systemic therapy, including those who had received neoadjuvant chemotherapy (or adjuvant chemotherapy after cystectomy) with recurrence more than 12 months from treatment completion. The median age of patients in the model was 67.9 years, with a mean weight of 75.9 kg and a body surface area of 1.88 m2.
Key clinical efficacy inputs (OS and PFS) were derived from the EV-302 trial (data cut-off was August 8, 2023).4 PFS and OS outcomes were extrapolated beyond the trial duration by fitting parametric survival models to the trial data (the maximum duration of follow-up for OS data was approximately ██ months). Model selection was based on statistical fit (by Akaike information criterion and Bayesian information criterion), visual inspection of goodness of fit to observed data, and clinical plausibility. The sponsor fitted independent survival models to the enfortumab vedotin and platinum-based chemotherapy arms. For the enfortumab vedotin arm, the PFS data were fitted using the generalized gamma model, while the log-logistic model was applied to the platinum-based chemotherapy arm. The log-logistic model was also chosen for the long-term extrapolation of OS for both treatment arms. Survival estimates were corrected for the all-cause mortality reported for the Canadian population in 2022. The sponsor used the median PFS as a proxy for time on treatment (ToT) in the EV + P arm. In contrast, the Kaplan-Meier (KM) curve from the EV-302 trial was used to represent the treatment duration for the platinum-based chemotherapy.
Health-state utilities were derived from the EV-302 trial generated based on EQ-5D-5L data and Canadian-specific tariffs. Age-related utility decrements were applied in the model to account for the natural decline in the quality of life associated with age using a published algorithm.5 The sponsor considered health state–based utilities reported in published studies in a scenario analysis. A one-time QALY decrement was applied in the first model cycle to account for adverse events (AEs). Utility decrements and duration of AEs were based on previous submissions to health technology agencies and published studies.6-9
The model included costs related to drug acquisition, administration, monitoring, AEs, subsequent therapy, and terminal care. The drug acquisition cost for enfortumab vedotin was applied in the model based on the median PFS for EV + P. Although patients received 200 mg of pembrolizumab every 21 days in the EV-302 trial, the sponsor assumed weight-based dosing for pembrolizumab at a dose of 2 mg/kg (up to a maximum of 200 mg) intravenously on day 1 of every 21-day cycle to reflect the use of pembrolizumab in Canadian practice.
The costs associated with platinum-based chemotherapy were based on the distribution observed in the EV-302 trial (54.5% gemcitabine plus cisplatin and 45.5% gemcitabine plus carboplatin) and 30.4% of these patients would receive avelumab maintenance therapy. Unit costs were obtained from CDA-AMC pharmacoeconomic reports.10-12 Treatment administration costs were based on levels of toxicity that require physician monitoring in the Schedule of Benefits for Physician Services.
Weekly monitoring and disease management costs were applied based on progression status, and a one-time terminal-care cost was also applied at the end of life. The cost of subsequent therapies for each treatment arm was calculated as a weighted average, considering the distribution of second-line treatments received in the EV-302 trial, the costs per cycle (including drug acquisition and administration), and the median treatment duration as informed by published literature. AE costs were included and assumed to occur only during the first treatment cycle. The costs of managing AEs were estimated by multiplying the AE incidence reported in the EV-302 trial and the price weights obtained from the Ontario Case Costing Initiatives. The one-time terminal-care cost of $45,900.64 applied to the model was informed by a real-world study analyzing the cost of phase-specific cancer care in Ontario.13 Summary of Sponsor’s Economic Evaluation Results.
All analyses were run probabilistically (1,000 iterations for the base-case and scenario analyses). The deterministic and probabilistic results were similar. The probabilistic findings are presented in the following section. Additional results from the sponsor’s submitted economic evaluation base case are presented in Appendix 3.
Base-Case Results
In the sponsor’s base-case analysis, EV + P was associated with an incremental cost of $165,909 and 1.60 additional QALYs compared with platinum-based chemotherapy over the lifetime horizon, resulting in an ICER of $103,466 per QALY (Table 3). EV + P had a 0% probability of being the most cost-effective strategy at a WTP threshold of $50,000 per QALY. More than half (72%) of incremental QALYs associated with EV + P compared with platinum-based chemotherapy accrued after 3 years and were based solely on the sponsor’s extrapolation of trial data.
Table 3: Summary of the Sponsor’s Economic Evaluation Results
Drug | Total costs ($) | Incremental costs ($) | Total QALYs | Incremental QALYs | ICER vs. SOC ($ per QALY) |
|---|---|---|---|---|---|
PBC | 97,355 | Reference | 1.64 | Reference | Reference |
EV + P | 263,264 | 165,909 | 3.25 | 1.60 | 103,466 |
EV + P = enfortumab vedotin plus pembrolizumab; ICER = incremental cost-effectiveness ratio; PBC = platinum-based chemotherapy; QALY = quality-adjusted life-year; SOC = standard of care; vs. = versus.
Source: Sponsor’s pharmacoeconomic submission.
Sensitivity and Scenario Analysis Results
The sponsor provided scenario analyses to explore the impact of various factors, including adopting a shorter time horizon, using alternative parametric survival models for PFS and OS data and treatment-waning assumptions, different discount rates, and varying health-utility values. It also assessed the impact of changing assumptions regarding ToT estimation for enfortumab vedotin, pembrolizumab, and avelumab, as well as the proportion of patients receiving avelumab maintenance. No analysis exploring a societal perspective was performed.
None of the scenario analyses found that EV + P was cost-effective at a WTP threshold of $50,000 per QALY, and conclusions remained robust despite alternative inputs and assumptions. The cost-effectiveness results were most sensitive to the approaches used to estimate ToT and the type of parametric survival models for OS prediction.
CDA-AMC Appraisal of the Sponsor’s Economic Evaluation
CDA-AMC identified several key limitations to the sponsor’s analysis that have notable implications on the economic analysis:
Uncertainty in the long term comparative efficacy of EV + P versus platinum-based chemotherapy: To estimate the long-term PFS and OS, the sponsor’s pharmacoeconomic model relies on extrapolations of PFS and OS from the EV-302 trial data. In the intention-to-treat analysis of the EV-302 trial, patients with locally advanced or metastatic UC who were treated with EV + P demonstrated median improvements in PFS and OS of 6.2 months and 15.4 months, respectively, compared to chemotherapy alone. In the submitted pharmacoeconomic report, the extrapolated long-term gains in PFS and OS were approximately 26 and 28 months, respectively. Approximately 72% of the QALYs derived from EV + P are based on extrapolation of trial evidence. The extrapolation assumptions are influenced by the end of the trial cut-off, which has a small sample size and a high censoring, further compounding this uncertainty. Additionally, several limitations were noted with the sponsor’s chosen extrapolation.
First, the sponsor’s base case assumes the hazard rate for mortality continuously decreases over time for patients who receive EV + P. By assuming mortality hazard rates decrease over time, the proportion of patients alive at 10 years is predicted to be 16% for those who receive EV + P. At 20 years, 7% of patients who received EV + P are still alive. The clinical experts consulted for this review noted that such OS benefits were too optimistic given currently available data. Likewise, the sponsor notes in its submission that it does not anticipate health benefits beyond 15 years, which also suggests that the chosen survival extrapolation is too optimistic. Based on clinical expert feedback for this review, the hazard rate for EV + P can be expected to increase over time as more patients experience disease progression and treatment options postprogression become less effective. At 15 years the proportion of patients alive was expected to be at or close to 0%. This also aligns with the time horizon selected by the sponsor.
Second, the sponsor assumes that the risk of death remains permanently lower for the cohort receiving EV + P compared with those receiving platinum-based chemotherapy. The clinical experts described this assumption as overly optimistic and noted that it does not consider the current treatment pathway. Over time, some patients who initially receive platinum-based chemotherapy will receive avelumab, pembrolizumab, or enfortumab vedotin, whereas patients who progress on EV + P will only have chemotherapy options available to them. In the long term, the surviving cohort for those who initially received platinum-based chemotherapy will likely represent individuals who responded well to chemotherapy or are on subsequent pembrolizumab or enfortumab vedotin. As the costs associated with subsequent pembrolizumab or enfortumab vedotin has been included in the analysis, it is important that its potential benefit is also captured. Therefore, it is anticipated that long-term mortality hazard rates for those who started on EV + P and those who started on platinum-based chemotherapy will be similar. This is also in line with general expectations for how relative hazards should look over time for most drugs in oncology.14
Overall, the clinical experts consulted by the review team considered the extrapolated OS to be overly optimistic. Because EV + P is not intended to cure locally advanced or metastatic UC, and less-effective treatment options are available postprogression, the survival benefit gap between EV + P and usual care will likely diminish over time.
This limitation was addressed by using the Weibull distribution for extrapolating OS for both EV + P and platinum-based chemotherapy. These functions were selected as they ensure the number of patients alive at 15 years is 0%. A treatment-waning effect was also applied using the sponsor-provided functionality. Over the 5 years when extrapolation starts (36 months to 96 months) the relative hazard wanes such that the mortality risk at 96 months is the same for all surviving patients regardless of the initial therapy received. This captures the long-term impact of subsequent therapies, such as immunotherapies, that some patients who initially receive platinum-based chemotherapy will receive.
CDA-AMC used the log-normal function to extrapolate PFS and the sponsor-provided functionality to apply a waning effect to PFS.
Three scenario analyses were conducted to test the impact of applied assumptions:
Assumption of a faster rate of treatment waning for OS, such that mortality rates would be equivalent for those alive at 5 years (2 years after extrapolation starts). The PFS base-case curves were maintained.
Assumption of no treatment waning for both OS and PFS, meaning patients who receive EV + P have a permanently lower mortality risk compared with those who received platinum-based chemotherapy.
Use of the generalized gamma to extrapolate OS for both EV + P and platinum-based chemotherapy. This extrapolation of survival generates more optimistic survival expectations for both treatment arms in the model. PFS base case curves were maintained.
Inappropriate assumptions applied to estimate treatment duration for EV + P: The sponsor used median PFS to estimate treatment duration for EV + P and ToT discontinuation data for chemotherapy. This approach undermines the validity of the comparison due to the different statistical properties of the metrics. Using median PFS fails to capture the distribution of treatment durations and does not account for variability within the dataset. It assumes that the likelihood of discontinuing therapy is equal over time. Additionally, using median PFS assumes a homogeneous population for which the median accurately represents the central tendency, which may not be true in the event of significant patient variability. Clinical expectations are that some individuals will perform well and remain on therapy for an extended period, skewing the averages.
Using median PFS as a proxy for ToT ignores the available data from the trial, which accurately details what treatment discontinuation is expected to be over the first 24 months on treatment. Because the trial provides this information, the model imposes an unnecessary assumption regarding what treatment discontinuation is. Beyond the trial data, treatment discontinuation for enfortumab vedotin is likely to be linked to PFS. Based on the product monograph treatment with enfortumab vedotin should be continued until unacceptable toxicity or disease progression. Over time, as a patient’s dose is titrated to manage toxicities, the expectation is progression will be the main determining factor for time on enfortumab vedotin. In the sponsor’s base case, patients who receive EV + P are expected to remain progression-free for an average of 2.94 years; however, the sponsor estimates that patients will only receive approximately 9 months of EV + P. This suggests patients live more than 2 years progression-free without treatment, an assumption that does not match the trial evidence or the anticipated clinical use of enfortumab vedotin which is given until progression.
Finally, the sponsor applies the calculation in the model incorrectly. The sponsor assumes all patients remain on therapy until progression and then discontinue at 12 months (median PFS). Patients will remain on therapy beyond 12 months (up to 2 years for pembrolizumab and until disease progression or unacceptable toxicity for enfortumab vedotin).
Overall, by using median PFS to estimate time on therapy, treatment costs are underestimated, and the model produces an output that is not clinically valid.
CDA-AMC derived estimates of ToT for each cycle using KM curves for time to discontinuation. For the trial period, CDA-AMC estimated ToT by applying hazard ratios to the PFS curves. As PFS and ToT are strongly correlated, it is anticipated that the hazard ratio for discontinuing treatment will closely follow the hazard ratio for progression.
The selected hazard ratios were chosen such that the ToT curves for pembrolizumab and enfortumab vedotin fit the KM data provided by the sponsor. By applying a hazard ratio of 1.34 to PFS, time to discontinuation matches the KM data from the trial for pembrolizumab. As rates of discontinuation were higher for enfortumab vedotin, a hazard ratio of 1.60 was applied to PFS to derive ToT for enfortumab vedotin. At 2 years, discontinuation for pembrolizumab is 100% based on treatment-stopping rules. For enfortumab vedotin, treatment continues until disease progression, death, or unacceptable toxicity. The curves used in the base case are provided in Figure 2 of Appendix 4.
This approach leverages the high correlation between PFS and ToT, ensures consistency and comparability across treatment groups, and aligns with clinical practice, in which treatment typically continues until disease progression.
Underestimation of drug costs due to assuming no wastage: The sponsor assumes perfect vial sharing, implying no enfortumab vedotin is wasted. As the drug comes in relatively small 20 mg and 30 mg vials, it is likely that there will be wastage once a vial is used.
Given the small vial sizes, the RDI will likely reduce drug costs as smaller doses can be achieved by using fewer vials. For example, a patient weighing 80 kg will require 100 mg of enfortumab vedotin, based on a recommended dose of 1.25 mg/kg. This dose requires 5 × 20 mg vials (5 × 20 mg = 100 mg). If the dose is decreased by 10%, only 90 mg is required; this can be achieved using 3 × 30 mg vials. As the cost per milligram for a 30 mg vial is close to that of a 20 mg vial, lower spending is required to achieve this new lower dose. Because the trial evidence shows that the RDI is ██% for individuals receiving enfortumab vedotin, it is likely fewer vials will be required to match the required dose. The Clinical Study Report also indicates that ███% of enfortumab vedotin doses were missed during the COVID-19 pandemic. Based on feedback from clinical experts, it is likely that some patients will miss a treatment administration with enfortumab vedotin for various reasons. Although the approved dose is 1.25 mg per kg, it is anticipated that the per-administration cost of enfortumab vedotin will be lower than what is stated in the product monograph. The calculated RDI in the sponsor’s model is uncertain because a reduced dose will have a different impact on cost compared with missed administrations. These issues were not considered separately by the sponsor.
Finally, the sponsor did not apply a treatment cap to enfortumab vedotin costs. Based on the product monograph, the maximum dose a patient can receive is 125 mg.
CDA-AMC maintained the assumptions regarding RDI but assumed wastage would occur. A treatment cap was also applied to ensure the maximum received dose of enfortumab vedotin would not exceed 125 mg per administration.
Additionally, the following key assumptions were made by the sponsor and have been appraised by the CDA-AMC review team (refer to Table 4).
Table 4: Key Assumption of the Submitted Economic Evaluation (Not Noted as a Limitation to the Submission)
Sponsor’s key assumption | CDA-AMC comment |
|---|---|
Transparency in health-utility values estimation | Uncertain. The sponsor derived health-state utility values from the EV-302 trial. The submitted pharmacoeconomic report did not describe how these values were estimated and how missing data were handled, as missing data can be highly prevalent after disease progression and can significantly affect the estimated utility values. However, the impact of health-utility values on the cost-effectiveness results is expected to be minimal. |
CDA-AMC = Canada’s Drug Agency.
CDA-AMC Reanalyses of the Economic Evaluation
Base-Case Results
The CDA-AMC base case was derived, in consultation with clinical experts, by making changes in model parameter values and assumptions. CDA-AMC used Weibull models to extrapolate long-term OS data, applied treatment waning for PFS, derived treatment duration for enfortumab vedotin and pembrolizumab individually using data on time to discontinuation from the trial, and assumed drug wastage for enfortumab vedotin.
Table 5: CDA-AMC Revisions to the Submitted Economic Evaluation
Stepped analysis | Sponsor’s value or assumption | CDA-AMC value or assumption |
|---|---|---|
Corrections to sponsor’s base case | ||
None | — | — |
Changes to derive the CDA-AMC base case | ||
1. Long-term comparative efficacy of EV + P vs. platinum-based chemotherapy | EV + P PFS: generalized gamma OS: log-logistic Platinum-based chemotherapy PFS: log-logistic OS: log-logistic | EV + P PFS: log-normal + waning OS: Weibull + waning Platinum-based chemotherapy PFS: log-logistic OS: Weibull |
2. ToT | EV + P: patients stay on treatment until progression and then 100% discontinue at 12 months (median PFS) Platinum-based chemotherapy: KM curve | EV + P: generated ToT curves using the provided KM data on time on therapy Enfortumab vedotin time-on-treatment curve: applied an HR of 1.60 to PFS to generate ToT curve Pembrolizumab ToT: applied an HR of 1.34 to PFS to generate ToT curve Platinum-based chemotherapy: KM curve |
3. Treatment costs | Enfortumab vedotin: 82.6% RDI with vial sharing, no treatment cap | EV: 82.6% RDI with no vial sharing, applied a treatment cap of 125 mg per administration |
CDA-AMC base case | ― | 1 + 2 + 3 |
CDA-AMC = Canada’s Drug Agency; EV + P = enfortumab vedotin plus pembrolizumab; HR = hazard ratio; KM = Kaplan-Meier; OS = overall survival; PFS = progression-free survival; RDI = relative dose intensity; ToT = time on treatment.
In the CDA-AMC base case, EV + P was associated with estimated total costs of $371,962 and 2.16 total QALYs, compared to $99,413 in total costs and 1.22 QALYs for patients receiving platinum-based chemotherapy. The ICER for EV + P compared to platinum-based chemotherapy was $289,935 per QALY, and the probability of cost-effectiveness at a WTP threshold of $50,000 per QALY was 0%. Approximately 52% of incremental QALYs associated with EV + P compared with platinum-based chemotherapy accrued after the 3-year point. Results of the stepped reanalysis are presented in Table 6, with full disaggregated results in Appendix 4.
Table 6: Summary of the Stepped Analysis of the CDA-AMC Reanalysis Results
Stepped analysis | Drug | Total costs ($) | Total QALYs | ICER ($ per QALY) |
|---|---|---|---|---|
Sponsor’s base case (probabilistic) | PBC | 97,355 | 1.64 | Reference |
EV + P | 263,264 | 3.25 | 103,466 | |
Sponsor’s base case (deterministic) | PBC | 97,522 | 1.61 | Reference |
EV + P | 263,559 | 3.25 | 103,347 | |
CDA-AMC reanalysis 1 | PBC | 98,037 | 1.22 | Reference |
EV + P | 266,721 | 2.18 | 177,357 | |
CDA-AMC reanalysis 2 | PBC | 97,522 | 1.64 | Reference |
EV + P | 408,854 | 3.25 | 193,784 | |
CDA-AMC reanalysis 3 | PBC | 98,046 | 1.64 | Reference |
EV + P | 268,123 | 3.25 | 105,862 | |
CDA-AMC base case (1 + 2 + 3) (deterministic) | PBC | 98,577 | 1.22 | Reference |
EV + P | 372,053 | 2.18 | 287,536 | |
CDA-AMC base case (1 + 2 + 3) (probabilistic) | PBC | 98,433 | 1.22 | Reference |
EV + P | 371,573 | 2.16 | 290,563 |
CDA-AMC = Canada’s Drug Agency; EV + P = enfortumab vedotin plus pembrolizumab; ICER = incremental cost-effectiveness ratio; PBC = platinum-based chemotherapy; QALY = quality-adjusted life-year.
Scenario Analysis Results
A series of scenario analyses were performed to determine the impact of alternative assumptions on the cost-effectiveness of EV + P:
No treatment waning was assumed.
A faster rate of treatment waning was assumed (OS mortality rate assumed to be equivalent after 5 years).
Alternate survival extrapolation (generalized gamma used for both platinum-based chemotherapy and EV + P).
The results of these analyses are presented in Appendix 4. The scenario analysis with faster treatment waning increased the ICER to $323,784 per QALY gained. Assuming no treatment waning reduced the ICER to $242,606 per QALY gained. Using the generalized gamma distribution to extrapolate OS had no impact on the results, with the ICER increasing only slightly to $290,805 per QALY gained. Although patients live longer in the scenario using the generalized gamma to extrapolate OS, this is applied to both arms, meaning the incremental difference in benefit is very similar.
A price-reduction analysis was conducted using both the sponsor's and CDA-AMC base cases. The price-reduction analysis is contingent on the price of pembrolizumab. Two price-reduction analyses were conducted. In the first analysis, the price of both pembrolizumab and enfortumab vedotin was reduced. In this analysis, if the price of both drugs was reduced by 78%, the combination therapy of EV + P would generate an ICER below $50,000 per QALY when compared to platinum-based chemotherapy. In the second analysis, the list price of pembrolizumab is assumed to remain fixed. In this analysis, no reduction in the price of enfortumab vedotin would make EV + P cost-effective at a $50,000 per QALY gained threshold. Price reductions to achieve all alternative thresholds are shown in Table 7 and Table 8.
Table 7: CDA-AMC Price-Reduction Analyses for Both Enfortumab Vedotin and Pembrolizumab
Analysis | Cost per 21-day cycle ($)a | ICERs for EV + P vs. PBC ($ per QALY) | ||
|---|---|---|---|---|
Price reduction | Enfortumab vedotin | Pembrolizumab | Sponsor base case | CDA-AMC reanalysis |
No price reduction | 10,466 | 6,678 | 103,466 | 290,563 |
10% | 9,419 | 6,010 | 91,792 | 259,516 |
20% | 8,372 | 5,343 | 80,117 | 228,469 |
30% | 7,326 | 4,675 | 68,443 | 197,422 |
40% | 6,279 | 4,007 | 56,769 | 166,375 |
50% | 5,233 | 3,339 | 45,095 | 135,328 |
60% | 4,186 | 2,671 | 33,420 | 104,281 |
70% | 3,140 | 2,003 | 21,746 | 73,234 |
80% | 2,093 | 1,336 | 10,072 | 42,187 |
90% | 1,047 | 668 | Dominant | 11,140 |
CDA-AMC = Canada’s Drug Agency; EV + P = enfortumab vedotin plus pembrolizumab; ICER = incremental cost-effectiveness ratio; PBC = platinum-based chemotherapy; QALY = quality-adjusted life-year; vs. = versus.
aAssuming weight-based dosing and vial sharing for pembrolizumab and no vial sharing for enfortumab vedotin.
Table 8: CDA-AMC Price-Reduction Analyses for Enfortumab Vedotin Only
Analysis | Cost per 21-day cycle ($)a | ICERs for EV + P vs. PBC ($ per QALY) | |
|---|---|---|---|
Price reduction | Enfortumab vedotin | Sponsor base case | CDA-AMC reanalysis |
No price reduction | 10,466 | 103,466 | 290,563 |
10% | 9,419 | 96,831 | 271,229 |
20% | 8,372 | 90,196 | 251,895 |
30% | 7,326 | 83,560 | 232,561 |
40% | 6,279 | 76,925 | 213,228 |
50% | 5,233 | 70,289 | 193,894 |
60% | 4,186 | 63,654 | 174,560 |
70% | 3,140 | 57,018 | 155,226 |
80% | 2,093 | 50,383 | 135,892 |
90% | 1,047 | 43,748 | 116,558 |
100% | 0 | 37,112 | 97,225 |
CDA-AMC = Canada’s Drug Agency; EV + P = enfortumab vedotin plus pembrolizumab; ICER = incremental cost-effectiveness ratio; PBC = platinum-based chemotherapy; QALY = quality-adjusted life-year; vs. = versus.
aAssuming no vial sharing for enfortumab vedotin.
Issues for Consideration
Enfortumab vedotin received a positive recommendation with a price-reduction condition from the pan-Canadian Oncology Drug Review Expert Review Committee on January 6, 2022, for the treatment of patients with locally advanced or metastatic UC who have previously received a PD-1 or PD-L1 inhibitor and who: have received platinum-containing chemotherapy in the neoadjuvant/adjuvant, locally advanced or metastatic setting or are not eligible for cisplatin-containing chemotherapy. The submitted prices for enfortumab vedotin vials were the same as this submission: $1,181 for a 20 mg vial and $1,772 for a 30 mg vial. Negotiations with the pan-Canadian Pharmaceutical Alliance concluded with a letter of intent.
Patients with progressive cancer despite receiving immunotherapy may be offered enfortumab vedotin monotherapy or, if their tumour has a FGFR alteration, erdafitinib may be offered. Erdafitinib is currently under review by CDA-AMC for the treatment of adult patients with unresectable locally advanced or metastatic UC and FGFR3 alterations who have had disease progression during or following a PD-1 or PD-L1 inhibitor. The impact of this treatment on the cost-effectiveness of EV + P is unknown.
Clinical experts consulted by the review team noted data from a randomized trial (Checkmate 901) that added concurrent and maintenance nivolumab to gemcitabine plus cisplatin have shown an OS benefit. Although not approved for this indication, nivolumab is available in Canada and is commonly used for many other cancers. As such, it could be considered a comparator for cisplatin-eligible patients. However, due to the lack of comparative efficacy data, the cost-effectiveness of EV + P compared to nivolumab is unknown.
Overall Conclusions
The CDA-AMC Clinical Review noted that the EV-302 trial demonstrates that EV + P has a clinically meaningful benefit compared to PLAT + GEM in improving PFS and OS for the treatment of patients with locally advanced or metastatic UC . However, this combination may result in little to no clinically significant difference in general health-related quality of life when compared to platinum-based chemotherapy. The safety profile of EV + P aligns with the known safety profiles of enfortumab vedotin and pembrolizumab as monotherapies. These safety profiles were generally predictable, acceptable, and manageable in most patients, with no new safety concerns identified in the EV-302 trial.
In our base case, EV + P is more effective (1.24 incremental LYs and 0.94 incremental QALYs) and associated with greater total costs ($273,140 in incremental costs) compared with platinum-based chemotherapy, resulting in an ICER of $290,563 per QALY gained. Incremental QALYs were driven largely by the mortality benefit associated with EV + P (i.e., an additional 1.24 LYs for patients receiving EV + P relative to platinum-based chemotherapy). Incremental costs were driven by larger treatment acquisition costs associated with EV + P, generating an additional $290,541 in drug treatment costs per patient. This increased cost was slightly offset by a reduction of $18,514 in drug costs associated with subsequent therapies as patients who receive platinum-based chemotherapy could go on to receive enfortumab vedotin or pembrolizumab upon progression. Based on the CDA-AMC base-case analysis, a 78% price reduction for both pembrolizumab and enfortumab vedotin would be required for the combination to be cost-effective at a WTP threshold of $50,000 per QALY gained. This would reduce per-patient costs of EV + P from $24,547 per 28 days to $5,400.
The first main difference between the CDA-AMC base case and the sponsor’s base case is the estimation of total treatment costs for EV + P ($312,727 versus $206,889, respectively). The sponsor assumes individuals are treated until progression or approximately 12 months, when everyone discontinues therapy. This contradicts evidence from the trial and assumes patients will remain progression-free and off treatment for years after discontinuing both enfortumab vedotin and pembrolizumab. Using evidence from the trial and assuming long-term progression will influence enfortumab vedotin discontinuation, the CDA-AMC base case provides a more plausible estimate of total treatment costs. The second main difference concerns extrapolation of OS. Based on the trial evidence, EV + P will likely extend life relative to platinum-based chemotherapy and both the CDA-AMC base case and the sponsor’s base case estimate an average extension in life of more than a year. The sponsor’s base case assumes the mortality benefit will continue to improve over time, whereas the CDA-AMC reanalysis assumes the mortality benefit will wane. As more patients who initially receive platinum-based chemotherapy will end up receiving immunotherapy as a subsequent therapy, it is likely that the difference in mortality rates will decrease over time.
Uncertainty remains regarding the long-term survival impact for those who receive EV + P. Scenario analyses show the impact of more optimistic or pessimistic extrapolations of OS lead to ICERs ranging from $242,606 to $323,784 per QALY gained.
References
1.Pharmacoeconomic evaluation [internal sponsor's report]. In: Drug Reimbursement Review sponsor submission: Padcev (enfortumab vedotin), 20 mg and 30 mg single-use vials, lyophilized powder for solution for intravenous infusion only. Toronto (ON): Seagen Canada Inc; 2024 May 22.
2.Padcev (enfortumab vedotin): 20 mg and 30 mg single-use vials for intravenous infusion only [product monograph]. Mississauga (ON): Seagen Canada Inc.; 2023 Dec 22.
3.Padcev + Keytruda (enfortumab vedotin + pembrolizumab, EV+P) for the treatment of patients with locally advanced or metastatic urothelial cancer: Sponsor clinical evidence summary [internal sponsor's report]. In: Drug Reimbursement Review sponsor submission: Padcev (Enfortumab vedotin), 10 mg per mL (single-dose vials containing 20 mg and 30 mg of enfortumab vedotin), lyophilized powder for solution for intravenous infusion. Toronto (ON): Seagen Canada Inc.; 2024 May 22.
4.Powles T, Valderrama BP, Gupta S, et al. Enfortumab vedotin and pembrolizumab in untreated advanced urothelial cancer. N Engl J Med. 2024;390(10):875-888. PubMed
5.Ara R, Brazier JE. Populating an economic model with health state utility values: Moving toward better practice. Value Health. 2010;13(5):509-518. PubMed
6.Clinical Study Report: EV-302, an open-label, randomized, controlled phase 3 study of enfortumab vedotin in combination with pembrolizumab versus chemotherapy alone in previously untreated locally advanced or metastatic urothelial cancer [internal sponsor's report]. Bothell (WA): Seagen Inc.; 2023.
7.National Institute for Health and Care Excellence. Avelumab for maintenance treatment of locally advanced or metastatic urothelial cancer after platinum-based chemotherapy (NICE technology appraisal guidance TA788) [accessed by sponsor]. 2022; https://www.nice.org.uk/guidance/ta788. Accessed 2024 Feb.
8.National Institute for Health and Care Excellence. Pembrolizumab for treating relapsed or refractory classical Hodgkin lymphoma after stem cell transplant or at least 2 previous therapies (NICE technology appraisal guidance TA772) [accessed by sponsor]. 2022; https://www.nice.org.uk/guidance/ta772. Accessed 2024 Feb.
9.National Institute for Health and Care Excellence. Pembrolizumab for adjuvant treatment of renal cell carcinoma (NICE technology appraisal guidance TA830) [accessed by sponsor]. 2022; https://www.nice.org.uk/guidance/ta830. Accessed 2024 Feb.
10.CADTH Reimbursement Review: Avelumab (Bavencio) [accessed by sponsor]. Ottawa (ON): CADTH; 2021: https://www.cadth.ca/sites/default/files/pcodr/Reviews2021/10225AvelumabUC_fnEGR_REDACT-ABBREV_EC23Mar2021_final.pdf.
11.CADTH Reimbursement Review: Nivolumab (Opdivo) [accessed by sponsor]. Can J Health Technol. 2022;2(12). https://www.cadth.ca/sites/default/files/DRR/2022/PC0272-Opdivo-combined.pdf.
12.CADTH Reimbursement Review: Pembrolizumab (Keytruda) [accessed by sponsor]. Can J Health Technol. 2023;3(4). https://www.cadth.ca/sites/default/files/DRR/2023/PC0280-Keytruda_combined.pdf.
13.de Oliveira C, Pataky R, Bremner KE, et al. Phase-specific and lifetime costs of cancer care in Ontario, Canada. BMC Cancer. 2016;16(1):809. PubMed
14.Coyle D, Haines A, Lee K. CADTH methods and guidelines: Extrapolating clinical evidence within economic evaluations. Can J Health Technol. 2023;3(5). https://www.cda-amc.ca/sites/default/files/attachments/2023-05/MH0011-Extrapolating%20Clinical%20Evidence%20Within%20Economic%20Evaluations_0.pdf. Accessed 2024 Aug 1. PubMed
15.Cancer Care Ontario. Drug formulary: PEMB regimen [accessed by sponsor]. 2020; https://www.cancercareontario.ca/en/drugformulary/regimens/monograph/65201. Accessed 2024 Feb 1.
16.Cancer Care Ontario. Drug formulary: CRBPGEMC regimen [accessed by sponsor]. 2022; https://www.cancercareontario.ca/en/drugformulary/regimens/monograph/45316. Accessed 2024 Feb 1.
17.Cancer Care Ontario. Drug formulary: CISPGEMC regimen [accessed by sponsor]. 2019; https://www.cancercareontario.ca/en/drugformulary/regimens/monograph/54311. Accessed 2024 Feb 1.
18.Cancer Care Ontario. Drug formulary: AVEL(MNT) regimen [accessed by sponsor]. 2023; https://www.cancercareontario.ca/en/drugformulary/regimens/monograph/68391. Accessed 2024 Feb 1.
19.DeltaPA. Ottawa (ON): IQVIA; 2023: https://www.iqvia.com/. Accessed 2024 Jun 12.
20.Cancer Care Ontario. Drug formulary: Carboplatin regimen [accessed by sponsor]. https://www.cancercareontario.ca/en/drugformulary/drugs/monograph/43796. Accessed 2024 Feb.
21.Keytruda (pembrolizumab): solution for infusion 100 mg/4 mL vial [product monograph]. Kirkland (QC): Merck Canada Inc.; 2024 May 29: https://pdf.hres.ca/dpd_pm/00075758.PDF. Accessed 2024 Jun 12.
22.Cancer Care Ontario. Drug formulary: PEMB (fixed) regimen. 2023; https://www.cancercareontario.ca/en/drugformulary/regimens/monograph/65201. Accessed 2024 Jun 12.
23.Outpatient cancer drug benefit program. Edmonton (AB): Alberta Health Services; 2024 Apr 8: https://www.albertahealthservices.ca/assets/programs/ps-1025651-drug-benefit-list.pdf. Accessed 2024 Jun 12.
24.Budget Impact Analysis [internal sponsor's report]. In: Drug Reimbursement Review sponsor submission: Padcev (enfortumab vedotin), 20 mg and 30 mg single-use vials, lyophilized powder for solution for intravenous infusion only. Toronto (ON): Seagen Canada Inc; 2024 May 22.
25.Statistics Canada. Projected population, by projection scenario, age and sex, as of July 1 (Table: 17-10-0057-01). 2022; https://www150.statcan.gc.ca/t1/tbl1/en/tv.action?pid=1710005701. Accessed 2023 Apr 4.
26.Canadian Cancer Society. Canadian cancer statistics 2023 [accessed by sponsor]. 2023; https://cancer.ca/en/research/cancer-statistics/canadian-cancer-statistics.
27.Canadian Cancer Statistics Advisory in collaboration with the Canadian Cancer Society, Statistics Canada and the Public Health Agency of Canada. Canadian cancer statistics: A 2022 special report on cancer prevalence [accessed by sponsor]. Toronto (ON): Canadian Cancer Society; 2022: https://cdn.cancer.ca/-/media/files/research/cancer-statistics/2022-statistics/2022-special-report/2022_prevalence_report_final_en.pdf.
28.Locally advanced/metastatic bladder cancer (Clinical Practice Guideline GU–014 Version 3) [accessed by sponsor]. Edmonton (AB): Cancer Care Alberta; 2023: https://www.albertahealthservices.ca/assets/info/hp/cancer/if-hp-cancer-guide-gu014-ambc.pdf.
29.Canadian Cancer Statistics Advisory Committee. Canadian Cancer Statistics 2018 [accessed by sponsor]. Toronto (ON): Canadian Cancer Society; 2018: https://www.cancer.ca/Canadian-Cancer-Statistics-2018-EN.pdf.
30.Institut national d'excellence en santé et services sociaux. Avis transmis au ministre en mars 2018: Keytruda – Cancer urothélial [accessed by sponsor]. Montreal (QC): INESSS; 2018.
31.Insititut national d'excellence en santé et services sociaux. Avis transmis au ministre en février 2021: Bavencio (Carcinome urothélial) [accessed by sponsor]. Montreal (QC): INESSS; 2021.
32.Alimohamed N, Grewal S, Wirtz HS, et al. Understanding treatment patterns and outcomes among patients with de novo unresectable locally advanced or metastatic urothelial cancer: A population-level retrospective analysis from Alberta, Canada. Curr Oncol. 2022;29(10):7587-7597. PubMed
33.Oda MH, Dos Santos DV, Farias AK, et al. Bladder urothelial carcinoma in a child: Case report and review of literature. Front Pediatr. 2019;7:385. PubMed
34.Brenner DR, Gillis J, Demers AA, et al. Projected estimates of cancer in Canada in 2024. CMAJ. 2024;196(18):E615-E623. PubMed
35.Canadian Cancer Society. Stages of bladder cancer. 2024; https://cancer.ca/en/cancer-information/cancer-types/bladder/staging. Accessed 2024 Aug 2.
36.National Cancer Institute. Bladder cancer stages. 2023; https://www.cancer.gov/types/bladder/stages. Accessed 2024 Aug 02.
37.Warren M, Kolinsky M, Canil CM, et al. Canadian Urological Association/Genitourinary Medical Oncologists of Canada consensus statement: Management of unresectable locally advanced and metastatic urothelial carcinoma. Can Urol Assoc J. 2019;13(10):318-327. PubMed
38.Burger M, Catto JW, Dalbagni G, et al. Epidemiology and risk factors of urothelial bladder cancer. Eur Urol. 2013;63(2):234-241. PubMed
39.Ghandour R, Singla N, Lotan Y. Treatment options and outcomes in nonmetastatic muscle invasive bladder cancer. Trends Cancer. 2019;5(7):426-439. PubMed
40.European Association of Urology. EAU Guidelines on non-muscle-invasive bladder cancer (TaT1 and CIS) Section 3: Epidemiology and aetiology. 2024; https://uroweb.org/guidelines/non-muscle-invasive-bladder-cancer/chapter/epidemiology-aetiology-and-pathology. Accessed 2024 Aug 2.
41.Bhindi B, Kool R, Kulkarni GS, et al. Canadian Urological Association guideline on the management of non-muscle-invasive bladder cancer - Full-text. Can Urol Assoc J. 2021;15(8):E424-E460. PubMed
42.Canadian Cancer Society. Survival statistics for bladder cancer. 2024; https://cancer.ca/en/cancer-information/cancer-types/bladder/prognosis-and-survival/survival-statistics. Accessed 2024 Aug 21.
43.CADTH Reimbursement Review: Enfortumab Vedotin (Padcev) [accessed by sponsor]. Can J Health Technol. 2022;2(5). https://www.cda-amc.ca/sites/default/files/DRR/2022/PC0251-Padcev.pdf.
44.Insititut national d'excellence en santé et services sociaux. Avis transmis au ministre en février 2022: Padcev (Carcinome urothélial). Montreal (QC): INESSS; 2022: https://www.inesss.qc.ca/fileadmin/doc/INESSS/Inscription_medicaments/Avis_au_ministre/Mars_2022/Padcev_2022_02.pdf. Accessed 2024 Aug 08.
45.Statistics Canada. Projected population, by projection scenario, age and sex, as of July 1 (x 1,000) (Table: 17-10-0057-01). 2022; https://www150.statcan.gc.ca/t1/tbl1/en/tv.action?pid=1710005701. Accessed 2024 Jul 31.
46.Statistics Canada. Population estimates on July 1, by age and gender (Table: 17-10-0005-01). 2022; https://www150.statcan.gc.ca/t1/tbl1/en/cv.action?pid=1710000501. Accessed 2024 Jul 31.
Appendix 1: Cost-Comparison Table
Please note that this appendix has not been copy-edited.
The comparators presented in the following table have been deemed to be appropriate based on feedback from clinical experts. Comparators may be recommended (appropriate) practice or actual practice. Existing Product Listing Agreements are not reflected in the table and as such, the table may not represent the actual costs to public drug plans.
Table 9: Cost-Comparison Table for Locally Advanced or Metastatic Urothelial Cancer
Treatment | Strength / concentration | Form | Price | Recommended dosage | Daily cost ($) | 28-day cost ($) |
|---|---|---|---|---|---|---|
Enfortumab vedotin plus pembrolizumab | ||||||
Enfortumab vedotin (Padcev) | 20 mg 30 mg | Powder for solution for IV infusion | 1,181.0000 1,772.0000 | 1.25 mg/kg (max 125 mg) IV days 1 and 8 every 21 days until progression or unacceptable toxicity.2 | 562.38 | 15,747 |
Pembrolizumab (Keytruda) | 100 mg | Solution for IV infusion | 4,400.0000 | 200 mg IV day 1 every 21 days until progression or unacceptable toxicitya | 419.05 | 11,733 |
Enfortumab vedotin plus pembrolizumab (fixed pembrolizumab dosing) | 981.43 | 27,480 | ||||
Enfortumab vedotin (Padcev) | 20 mg 30 mg | Powder for solution for IV infusion | 1,181.0000 1,772.0000 | 1.25 mg/kg (max 125) IV days 1 and 8 every 21 days until progression or unacceptable toxicity.2 | 562.38 | 15,747 |
Pembrolizumab (Keytruda) | 100 mg | Solution for IV infusion | 4,400.0000 | 2 mg/kg (max 200) IV day 1 every 21 days until progression or unacceptable toxicity.15 | 314.29 | 8,800 |
Enfortumab vedotin plus pembrolizumab (weight-based pembrolizumab dosing) | 876.67 | 24,547 | ||||
Gemcitabine plus platinum chemotherapy | ||||||
Gemcitabine (generics) | 1,000 mg 2,000 mg | Powder for solution for IV infusion | 270.0000 540.0000 | 1,000 mg/m2 IV days 1 and 8 every 21 days for up to 8 cycles or until progression or unacceptable toxicity.16 | 48.86 | 1,368 |
Carboplatin (generics) | 50 mg 150 mg 450 mg 600 mg | Solution for IV infusion | 70.0000 210.0000 599.9985 775.0020 | Target AUC 5 on day 1 every 21 days for up to 8 cycles or until progression or unacceptable toxicity.16 | Up to 46.13 | Up to 1,292 |
Gemcitabine plus carboplatin | Up to 94.99 | Up to 2,660 | ||||
Gemcitabine (generics) | 1,000 mg 2,000 mg | Powder for solution for IV infusion | 270.0000 540.0000 | 1,000 mg/m2 IV days 1 and 8 every 21 days for up to 8 cycles or until progression or unacceptable toxicity.17 | 48.86 | 1,368 |
Cisplatin (generics) | 50 mg 100 mg | Solution for IV infusion | 135.0000 270.0000 | 70 mg/m2 IV day 1 every 21 days for up to 8 cycles or until progression or unacceptable toxicity.17 | 18.32 | 513 |
Gemcitabine plus cisplatin | 67.18 | 1,881 | ||||
Maintenance after platinum chemotherapy | ||||||
Avelumab (Bavencio) | 200 mg | Solution for IV infusion | 1,325.0000 | For patients who did not progress during platinum chemotherapy: 10 mg/mL (max 800) IV day 1 every 14 days until progression or unacceptable toxicity.18 | 378.57 | 10,600 |
Note: All prices are from IQVIA Delta PA (accessed June 2024),19 unless otherwise indicated, and do not include dispensing fees. Dosing assumes a patient weight of 75 kg, a body surface area of 1.9 m2, and a glomerular filtration rate cap of 125 mL/minute.20 For pembrolizumab and platinum-based chemotherapy, which are used for many indications, CDA-AMC assumed vials would be shared between patients.
aA fixed dose of pembrolizumab 200 mg every 21 days was used in the clinical trial6 and is recommended in the product monograph.21 Public plans fund weight-based dosing of 2 mg/kg every 21 days or 4 mg/kg every 42 days.15,22,23
Appendix 2: Submission Quality
Please note that this appendix has not been copy-edited.
Description | Yes or No | Comments |
|---|---|---|
Population is relevant, with no critical intervention missing, and no relevant outcome missing | Yes | No comment. |
Model has been adequately programmed and has sufficient face validity | No | See the CDA-AMC appraisal section regarding the survival models used to extrapolate long-term PFS and OS data. |
Model structure is adequate for decision problem | Yes | No comment. |
Data incorporation into the model has been done adequately (e.g., parameters for probabilistic analysis) | No | See the CDA-AMC appraisal section regarding the methodological inconsistencies in treatment duration estimation and health state utility estimation. |
Parameter and structural uncertainty were adequately assessed; analyses were adequate to inform the decision problem | Yes | No comment. |
The submission was well organized and complete; the information was easy to locate (clear and transparent reporting; technical documentation available in enough details) | Yes | No comment. |
CDA-AMC = Canada’s Drug Agency.
Appendix 3: Additional Information on the Submitted Economic Evaluation
Please note that this appendix has not been copy-edited.
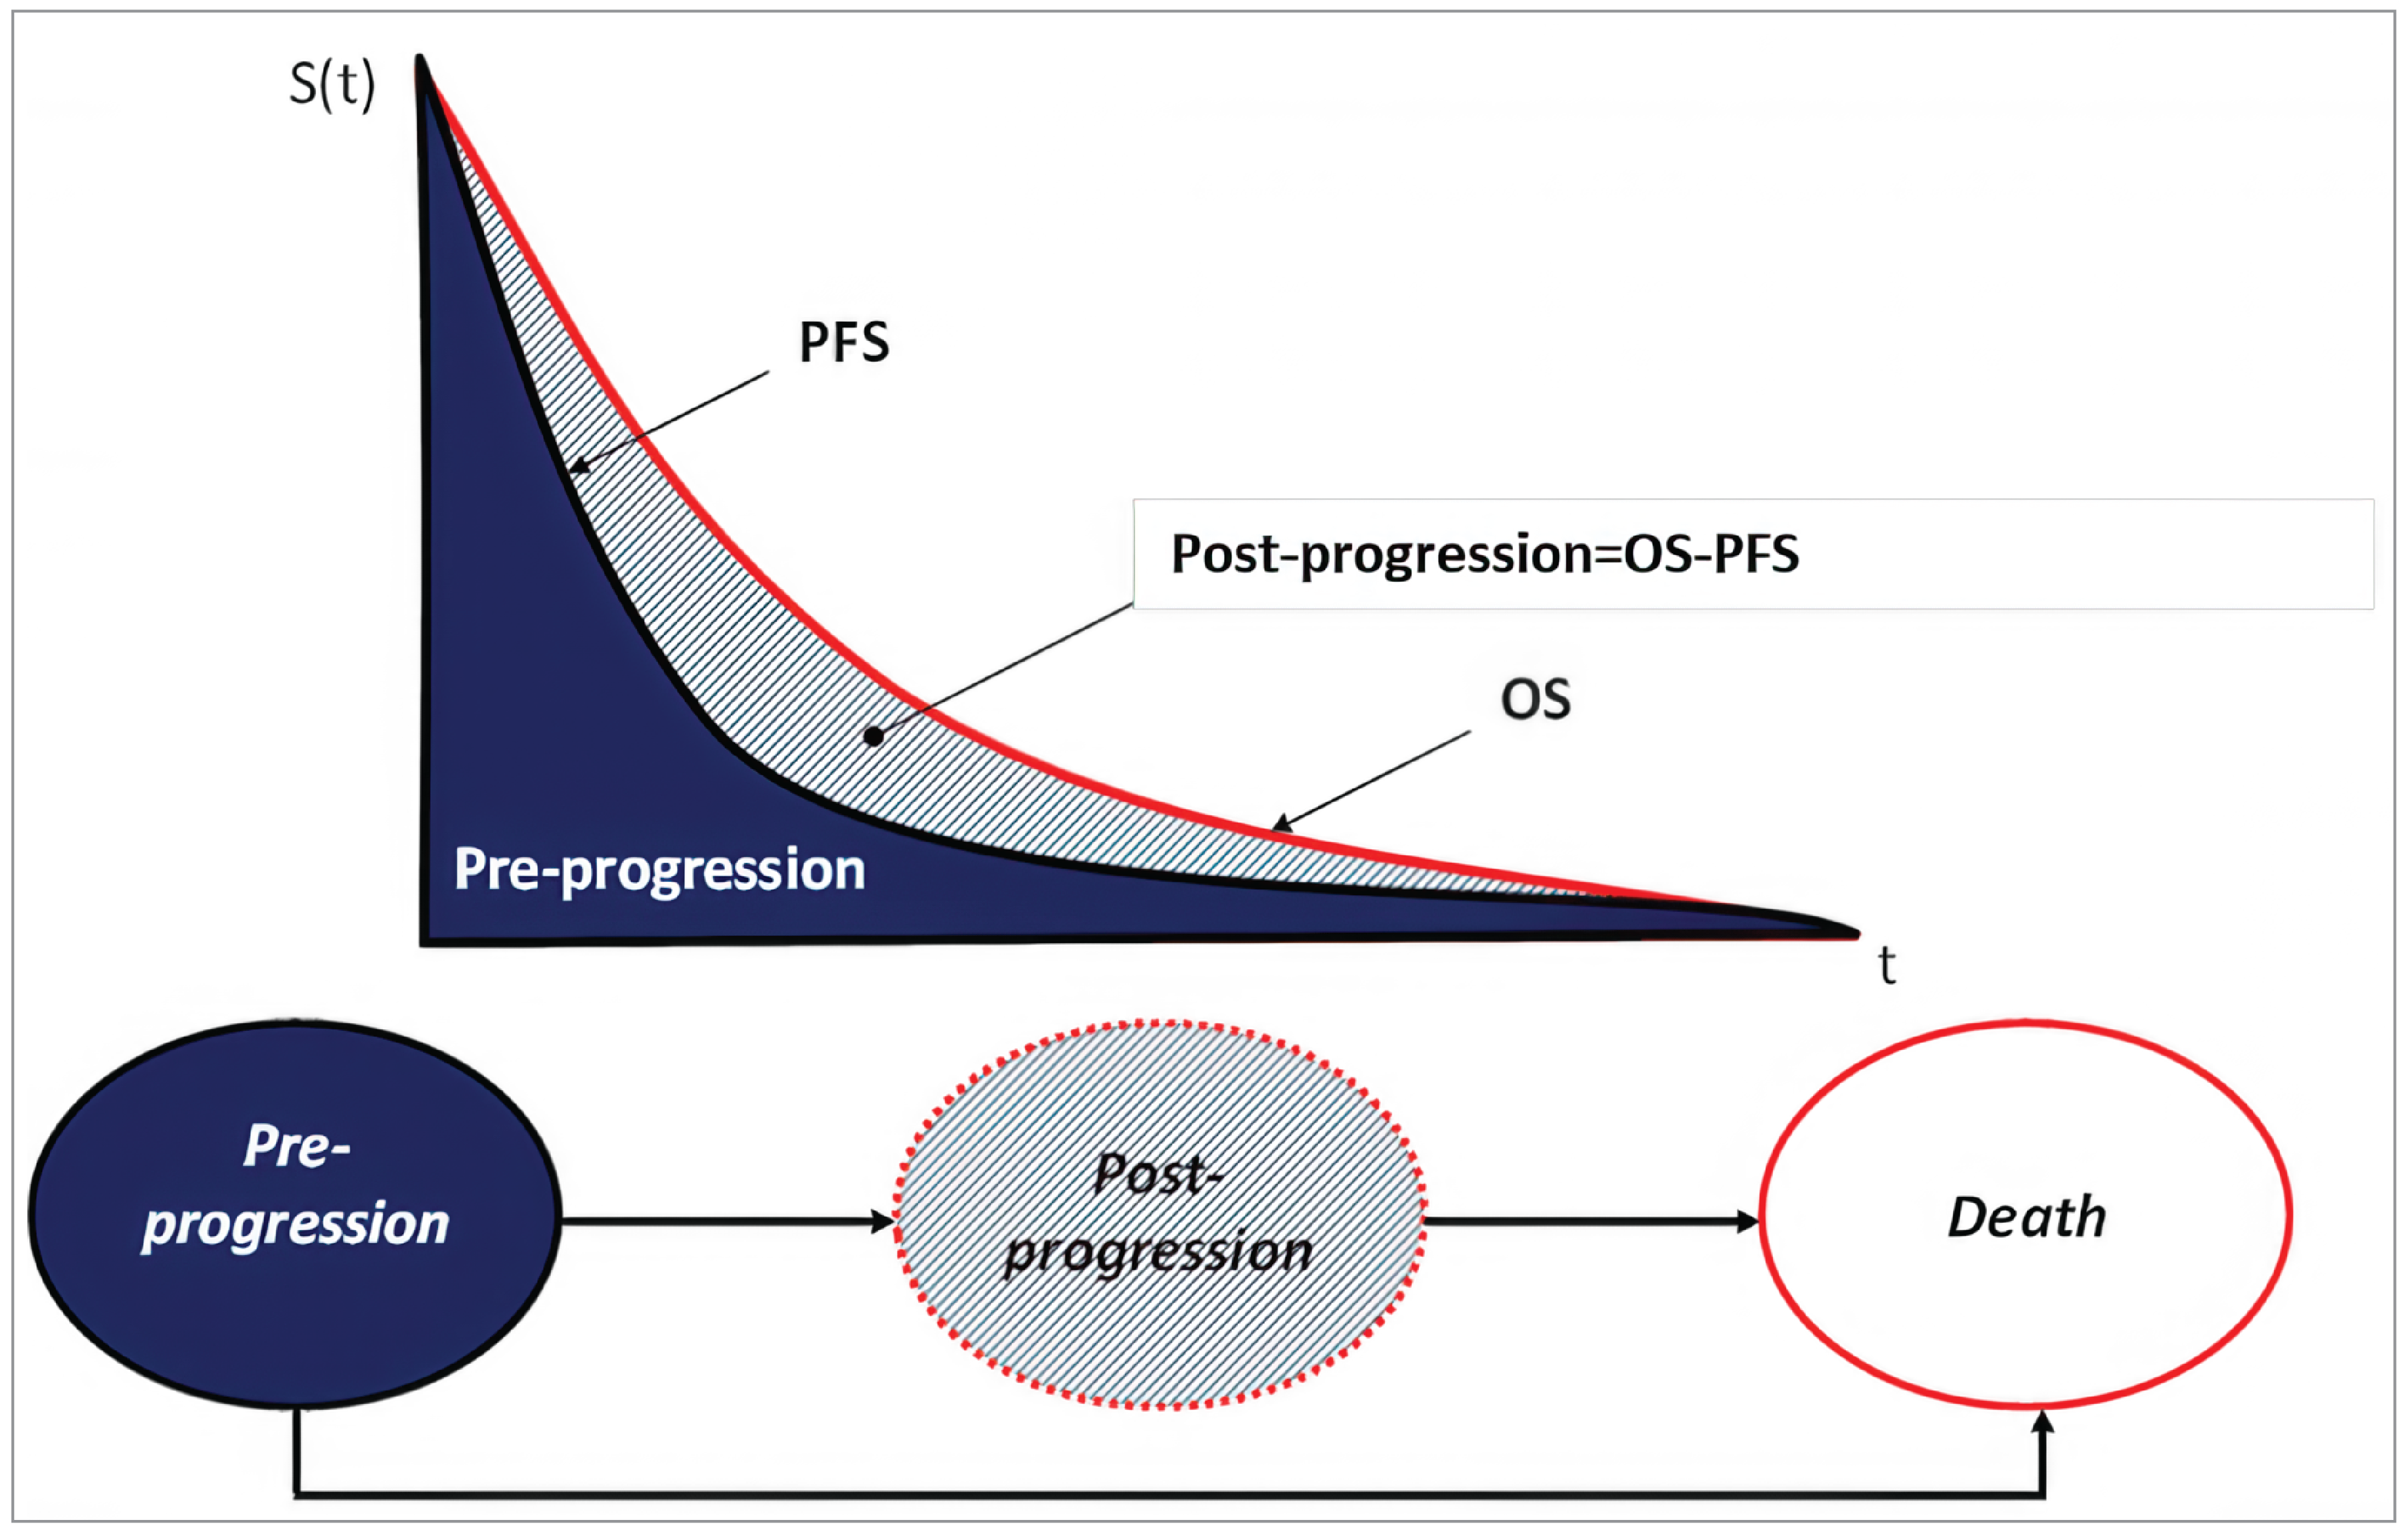
OS = overall survival; PFS = progression-free survival.
Source: Sponsor’s pharmacoeconomic submission.
Detailed Results of the Sponsor’s Base Case
Table 11: Disaggregated Results of the Sponsor’s Base-Case Analysis
Parameter | EV + P | PBC | Incremental |
|---|---|---|---|
Discounted LYs | |||
Total | 4.45 | 2.29 | 2.16 |
Progression-free | 2.82 | 0.81 | 2.02 |
Progressive disease | 1.62 | 1.48 | 0.14 |
Discounted QALYs | |||
Total | 3.25 | 1.64 | 1.60 |
Progression-free | 2.13 | 0.62 | 1.51 |
Progressive disease | 1.12 | 1.03 | 0.09 |
AE disutility | 0.00 | −0.01 | 0.01 |
Discounted costs | |||
Total | 263,264 | 97,355 | 165,909 |
Drug acquisition | 206,889 | 22,185 | 184,704 |
Drug administration | 1,075 | 593 | 481 |
Monitoring | 1,343 | 805 | 538 |
Subsequent therapy | 2,389 | 19,790 | −17,400 |
Adverse event management | 1,949 | 4,789 | −2,840 |
Disease management (health state–based) | 10,172 | 5,235 | 4,937 |
Terminal care | 39,446 | 43,957 | −4,511 |
ICER ($ per QALY) | 103,466 | ||
AE = adverse event; EV = enfortumab vedotin; ICER = incremental cost-effectiveness ratio; LY = life-year; PBC = platinum-based chemotherapy; P = pembrolizumab; QALY = quality-adjusted life-year.
Appendix 4: Additional Details on the CDA-AMC Reanalyses and Sensitivity Analyses of the Economic Evaluation
Please note that this appendix has not been copy-edited.
Detailed Results of CDA-AMC Base Case
Figure 2: Time-on-Treatment Curves Used in the CDA-AMC Base Case
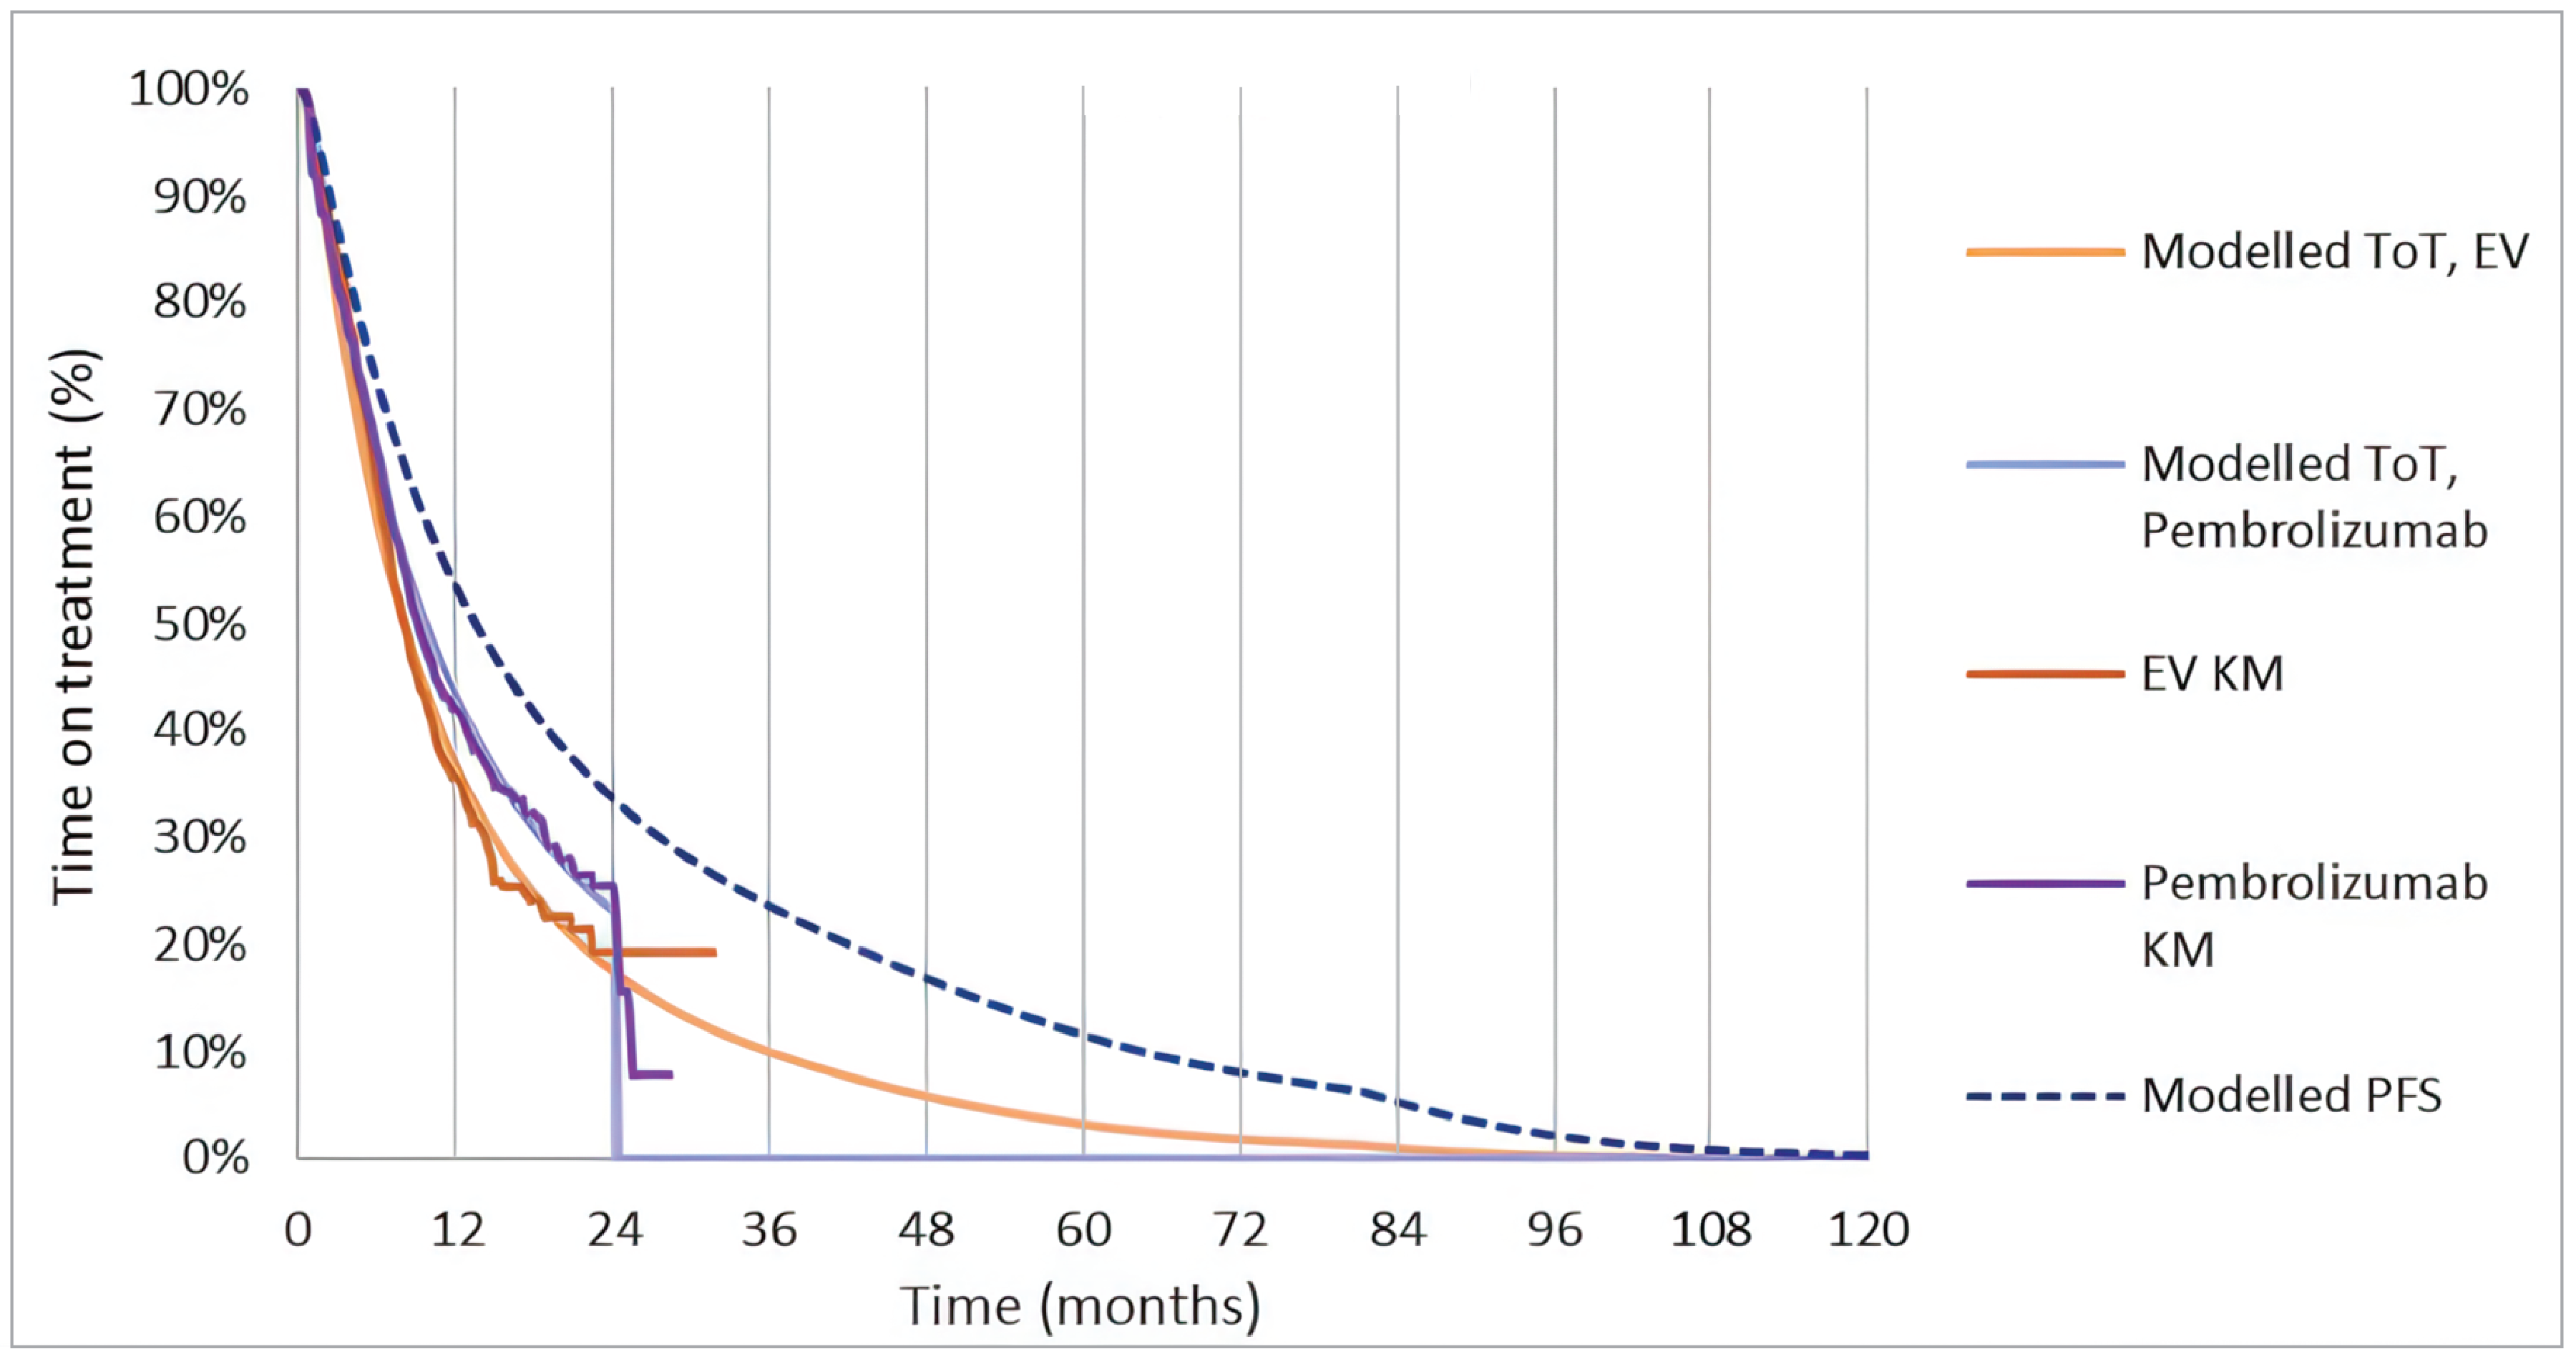
EV = enfortumab vedotin; KM = Kaplan-Meier; PFS = progression-free survival; ToT = time on treatment.
Source: Sponsor’s pharmacoeconomic model.
Table 12: Disaggregated Summary of the CDA-AMC Economic Evaluation Results
Parameter | EV + P | PBC | Incremental |
|---|---|---|---|
Discounted LYs | |||
Total | 2.91 | 1.67 | 1.24 |
Progression-free | 1.96 | 0.79 | 1.17 |
Progressive disease | 0.95 | 0.88 | 0.07 |
Discounted QALYs | |||
Total | 2.16 | 1.22 | 0.94 |
Progression-free | 1.50 | 0.61 | 0.89 |
Progressive disease | 0.67 | 0.62 | 0.05 |
AE disutility | −0.0034 | −0.00887 | > 0.01 |
Discounted costs | |||
Total | 371,573 | 98,433 | 273,140 |
Drug acquisition | 312,727 | 22,186 | 290,541 |
Drug administration | 1,692 | 593 | 1,098 |
Monitoring | 1,608 | 805 | 803 |
Subsequent therapy acquisition | 2,357 | 20,871 | −18,514 |
Subsequent therapy administration | 119 | 108 | 11 |
Adverse event management | 1,949 | 4,789 | −2,840 |
Disease management (health state–based) | 6,656 | 3,824 | 2,831 |
Terminal bare | 44,467 | 45,256 | −790 |
ICER ($ per QALY) | 290,563 | ||
AE = adverse event; CDA-AMC = Canada’s Drug Agency; EV = enfortumab vedotin; ICER = incremental cost-effectiveness ratio; LY = life-year; PBC = platinum-based chemotherapy; P = pembrolizumab; QALY = quality-adjusted life-year.
Figure 3: Extrapolation of OS for EV + P and PBC
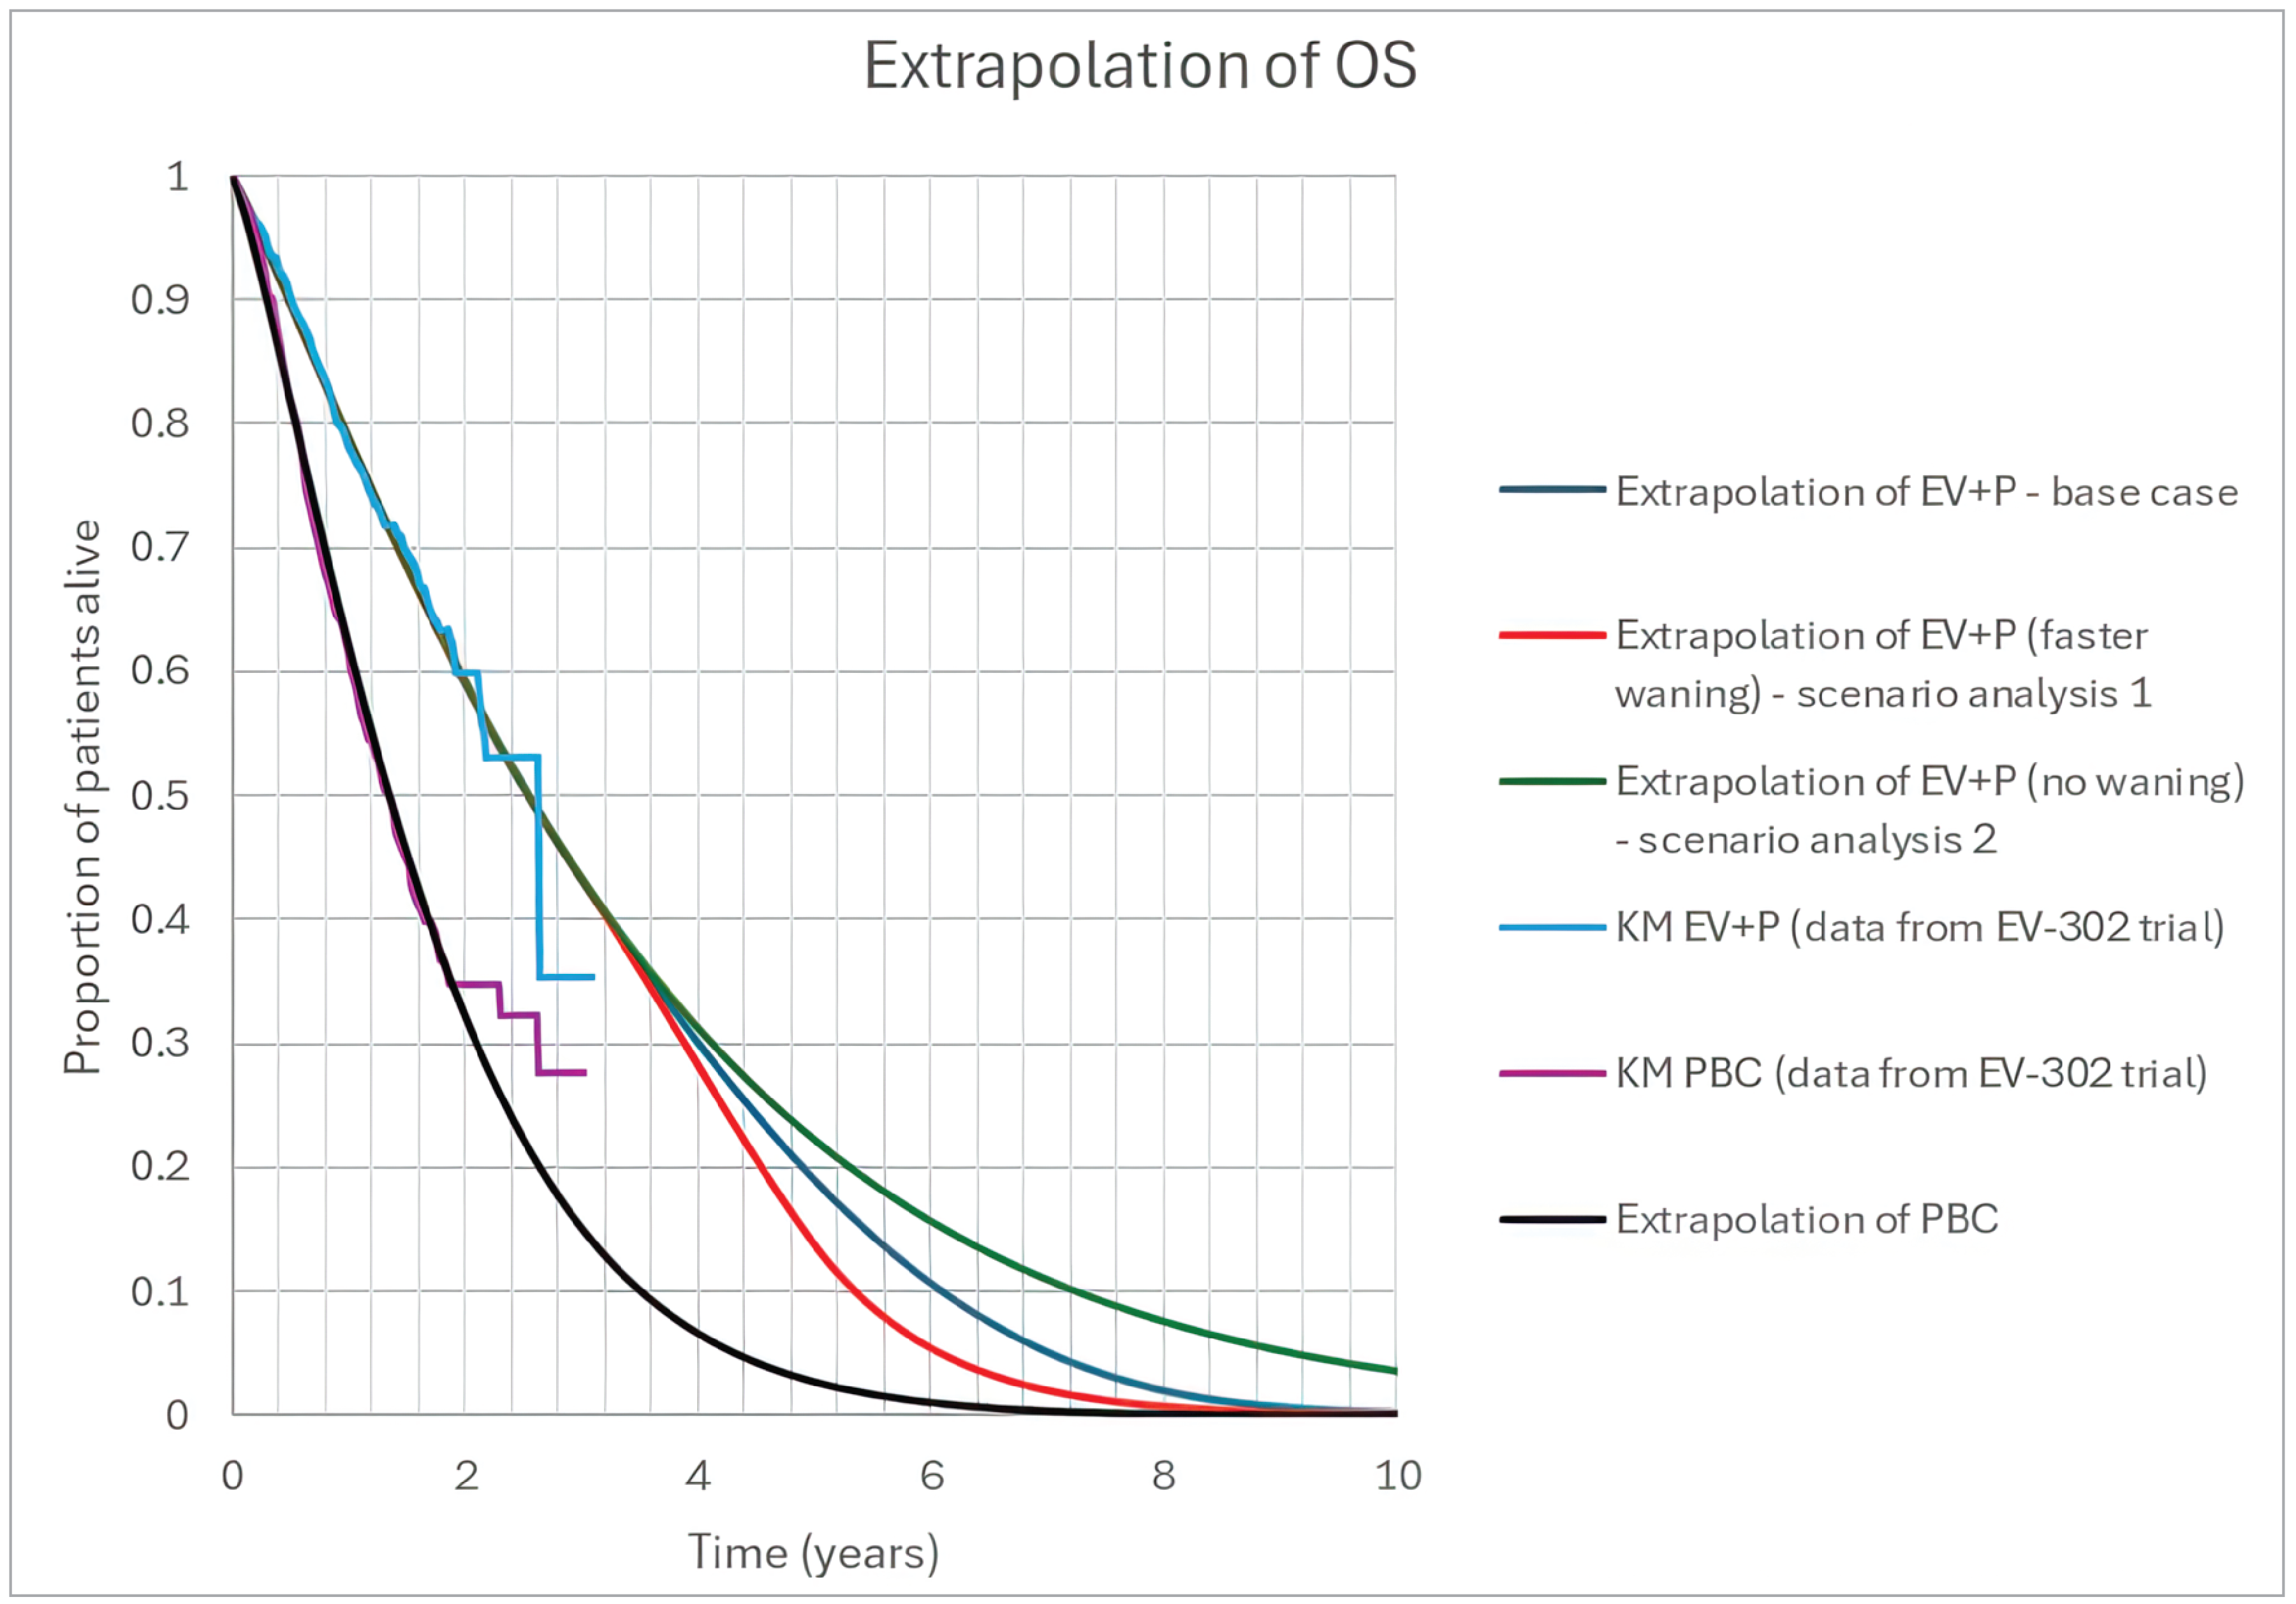
EV = enfortumab vedotin; KM = Kaplan-Meier; OS = overall survival; P = pembrolizumab; PBC = platinum-based chemotherapy.
Scenario Analyses
Table 13: Summary of Scenario Analyses Conducted on CDA-AMC Base Case
Scenario analysis | Drug | Total costs ($) | Total QALYs | ICER ($ per QALY) |
|---|---|---|---|---|
CDA-AMC base case | PBC | 98,433 | 1.22 | Reference |
EV + P | 371,573 | 2.16 | 290,563 | |
Scenario 1: Assume no treatment waning | PBC | 98,577 | 1.22 | Reference |
EV + P | 383,099 | 2.40 | 242,606 | |
Scenario 2: Assume faster treatment waning | PBC | 98,577 | 1.22 | Reference |
EV + P | 369,304 | 2.06 | 323,784 | |
Scenario 3: Alternate survival extrapolation | PBC | 98,694 | 1.38 | Reference |
EV + P | 374,850 | 2.33 | 290,805 |
CDA-AMC = Canada’s Drug Agency; EV = enfortumab vedotin; ICER = incremental cost-effectiveness ratio; P = pembrolizumab; PBC = platinum-based chemotherapy; QALY = quality-adjusted life-year; RDI = relative dose intensity.
Appendix 5: Submitted Budget Impact Analysis and CDA-AMC Appraisal
Please note that this appendix has not been copy-edited.
Table 14: Summary of Key Take-Aways
Key take-aways of the budget impact analysis |
|---|
|
BIA = budget impact analysis; CDA-AMC = Canada’s Drug Agency; EV = enfortumab vedotin; P = pembrolizumab; UC = urothelial cancer.
Summary of Sponsor’s Budget Impact Analysis
The sponsor submitted a BIA estimating the expected incremental budgetary impact of reimbursing EV + P for the treatment of adult patients with previously untreated locally advanced or metastatic UC.24 The BIA was conducted from the perspective of the pan-Canadian public drug plans over a 3-year time horizon (2025 through 2027; 2024 as the base year). The sponsor estimated the eligible population using an epidemiological approach. The sponsor’s pan-Canadian estimates reflect the aggregated results from provincial budgets, excluding Quebec. As all comparators were IV oncology therapies, the Non-Insured Health Benefits Program was not included. The sponsor’s base case included drug acquisition costs only, including subsequent therapies, while administration costs were considered in scenario. The derivation of the population is outlined in Figure 4, while key inputs to the BIA are documented in Table 15.
Figure 4: Sponsor’s Estimation of the Size of the Eligible Population
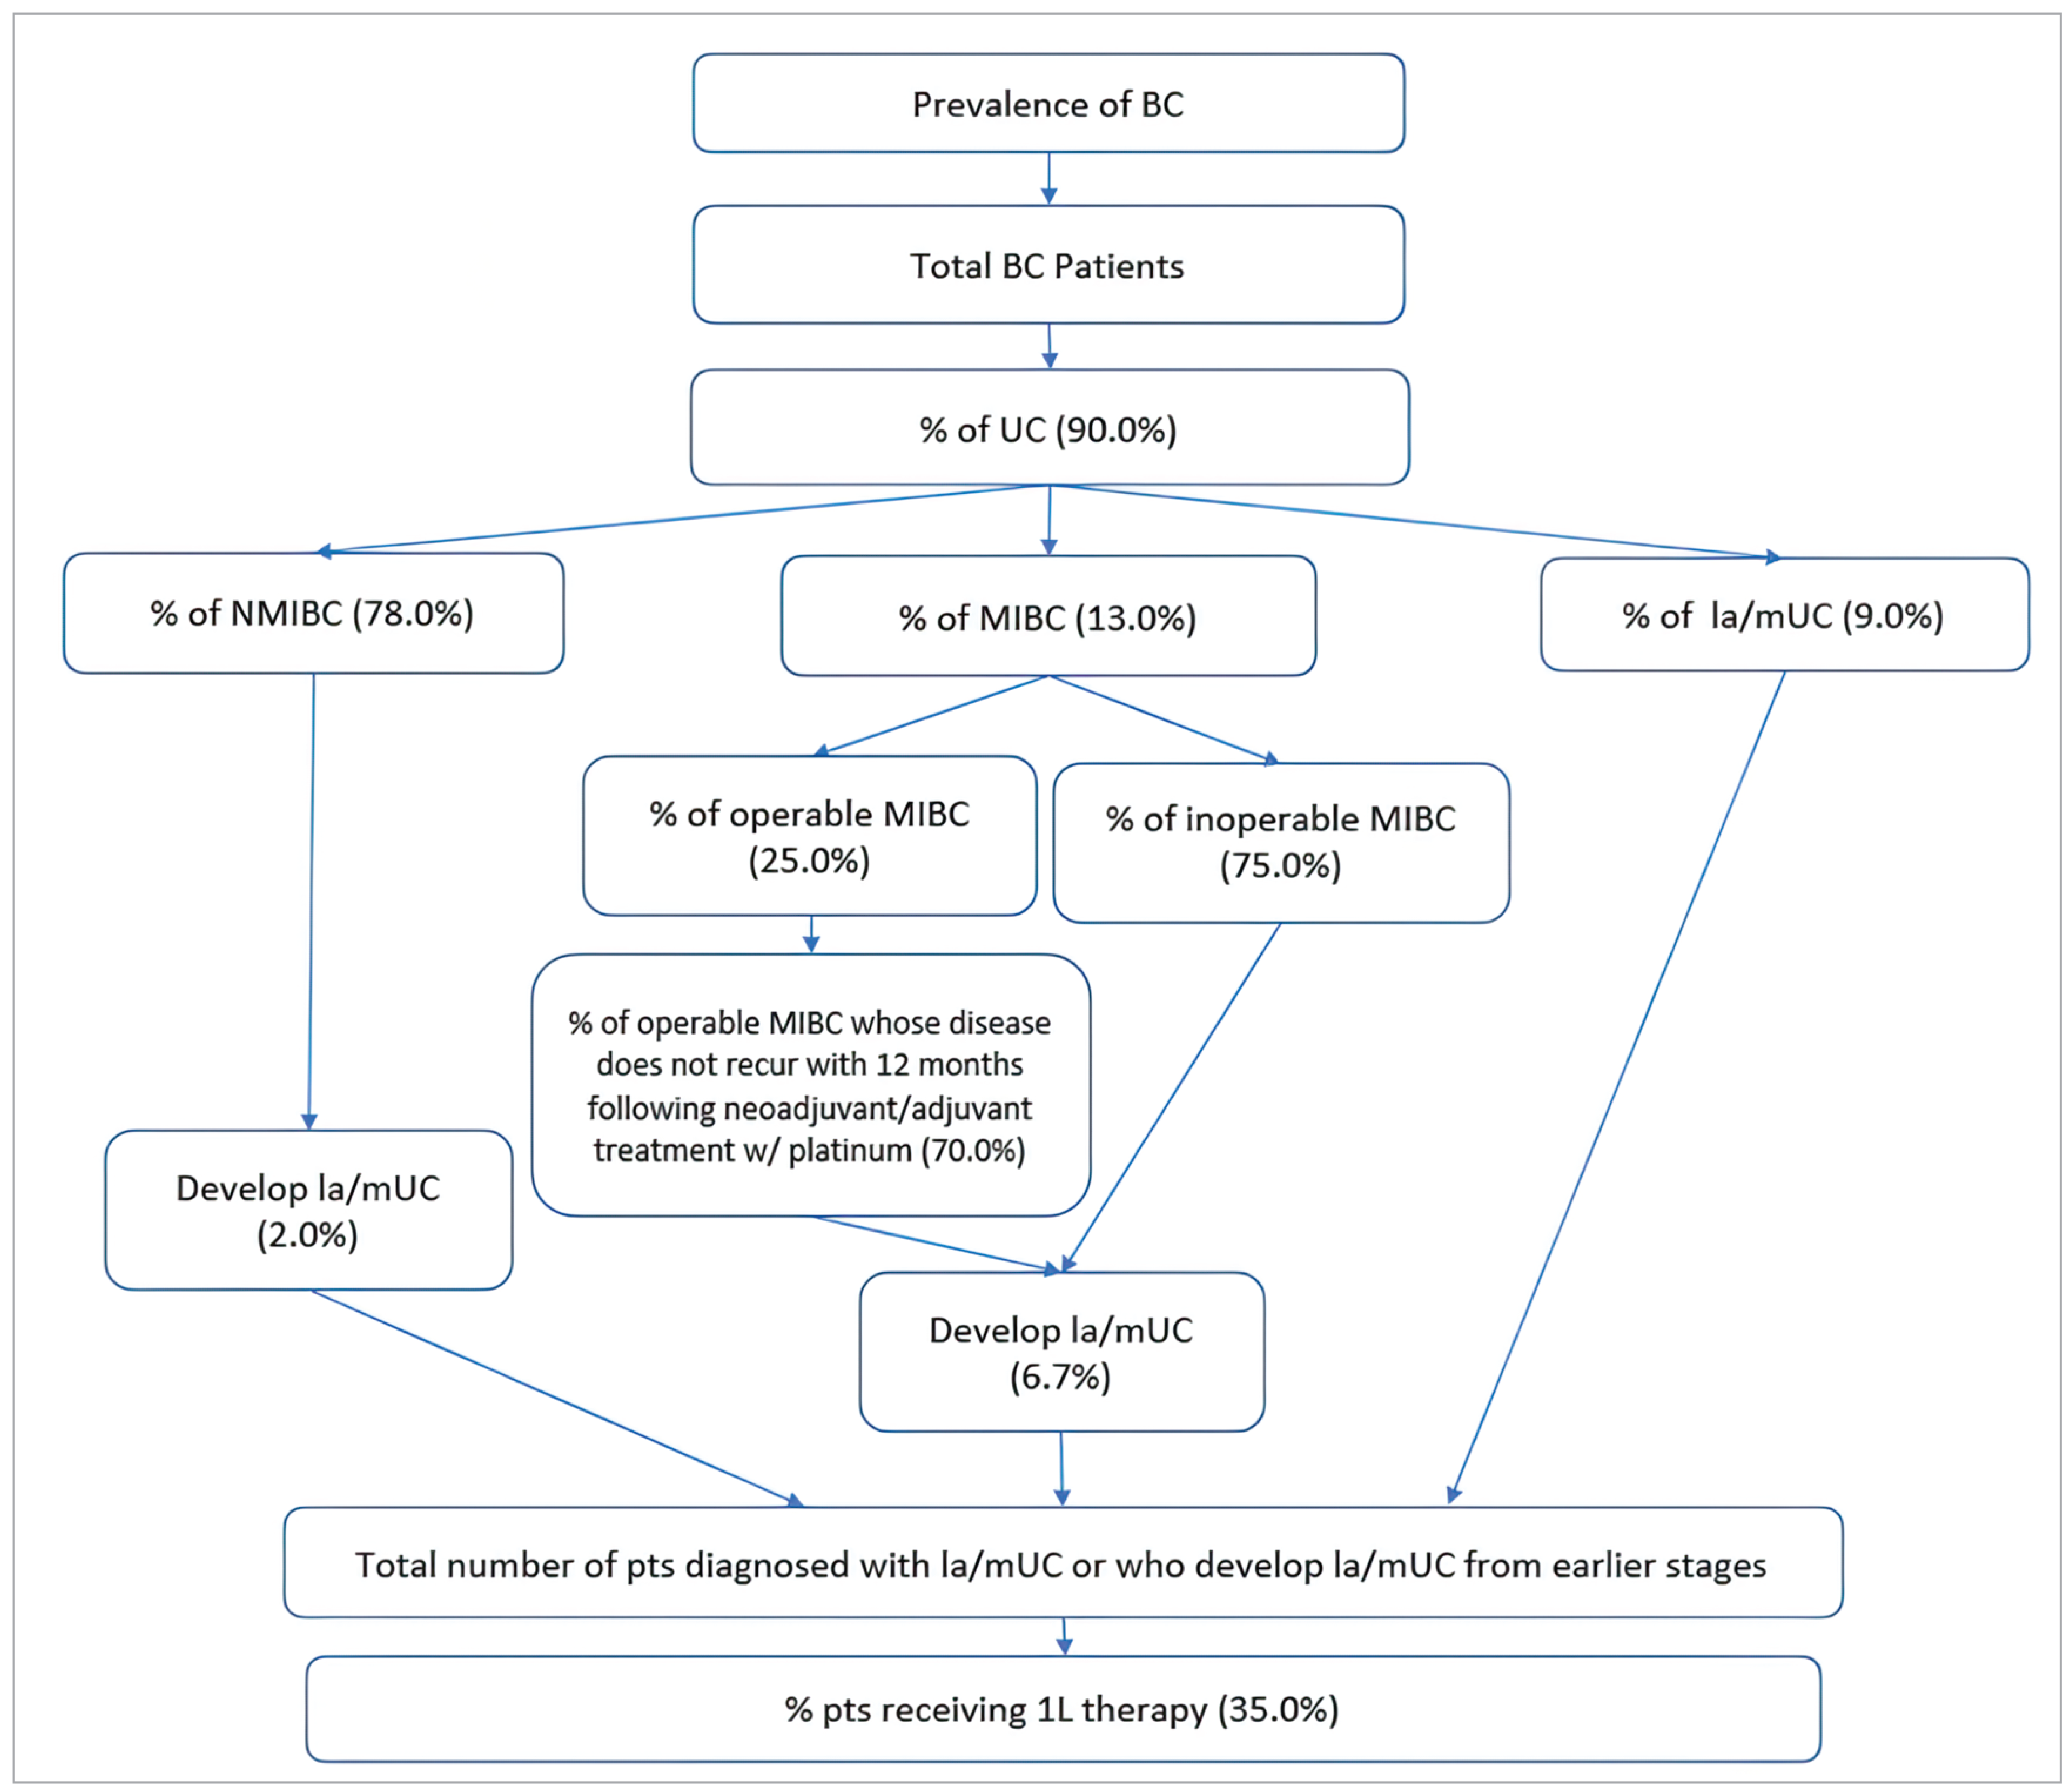
1L = first-line; BC = bladder cancer; la = locally advanced; MIBC = muscle invasive bladder cancer; mUC = metastatic urothelial cancer; NMIBC = nonmuscle invasive bladder cancer; UC = urothelial cancer.
Source: Sponsor’s pharmacoeconomic submission, budget impact analysis.24
Table 15: Summary of Key Model Parameters
Parameter | Sponsor’s estimate (reported as year 1 / year 2 / year 3 if appropriate) |
|---|---|
Target population | |
Population of participating jurisdictions | 25,682,400 / 26,097,500 / 26,501,80025 |
Prevalence of bladder cancer | |
Proportion of bladder cancer that is urothelial carcinoma | 90%28 |
Proportion UC diagnosed with locally advanced or metastatic UC | 9%29 |
Proportion UC diagnosed with MIBC | 13%29 |
Proportion with inoperable MIBC | 75%30 |
Proportion with operable MIBC | 25%30 |
Proportion with operable MIBC whose disease does not recur within 12 months of neoadjuvant or adjuvant platinum chemotherapy | 70%30 |
Proportion of inoperable MIBC and operable MIBC who progress to locally advanced or metastatic UC annually | 6.7%31 |
Proportion of UC diagnosed with NMIBC | 78%29 |
Proportion of NMIBC who develop locally advanced or metastatic UC annually | 2%31 |
Proportion diagnosed with locally advanced or metastatic UC or who develop locally advanced or metastatic UC who receive 1L systemic therapy | 35%32 |
Total # patients eligible for EV + P | 941 / 957 / 971 |
Market Uptake, reference scenario (3 years) | |
EV + P | 0% / 0% / 0% |
Gemcitabine + carboplatin | 50% / 50% / 50% |
Gemcitabine + cisplatin | 50% / 50% / 50% |
Market Uptake, new drug scenario (3 years) | |
EV + P | 50% / 60% / 70% |
Gemcitabine + carboplatin | 25% / 20% / 15% |
Gemcitabine + cisplatin | 25% / 20% / 15% |
Cost of treatment (per patient) | |
EV + P (81% RDI) | $217,448 (11 21-day cycles EV, 12.9 21-day cycles P) |
Gemcitabine + carboplatin (100% RDI) | $8,924 (4.9 21-day cycles) |
Gemcitabine + cisplatin (100% RDI) | $7,282 (4.9 21-day cycles) |
Avelumab (80% of platinum responders receive, 84.6% RDI) | $50,085 (12.6 14-day cycles) |
1L = first-line; EV = enfortumab vedotin; MIBC = muscle invasive bladder cancer; NMIBC = nonmuscle invasive bladder cancer; P = pembrolizumab; RDI = relative dose intensity; UC = urothelial cancer.
Summary of the Sponsor’s Budget Impact Analysis Results
Results of the sponsor’s analysis suggest that the reimbursement of EV + P for the treatment of adult patients with previously untreated locally advanced or metastatic UC will be associated with an incremental 3-year cost of $321,294,683 (year 1: $88,079,175, year 2: $106,937,245, year 3: $126,278,262). Of this, first-line drug costs are expected to increase by $334,395,802 over 3 years, while the cost of subsequent treatments is expected to decrease by $13,101,119 due to a decrease in the use of EV and P in later lines of therapy.
CDA-AMC Appraisal of the Sponsor’s Budget Impact Analysis
CDA-AMC identified several key limitations to the sponsor’s analysis that have notable implications on the results of the BIA:
Drug costs associated with EV + P are underestimated: The sponsor assumes every patient that receives EV + P will receive 11 cycles of EV and 12.90 cycles of pembrolizumab. This is based on the mean number of cycles received by patients in the EV-302 trial. However, the BIA covers a period of 3 years whereas median follow-up time in the trial was 17.2 months. As the period of the trial is shorter than 3 years, the mean number of treatment cycles from the trial will underestimate the mean number of treatment cycles that would be received by patients over 3 years. Additionally, data from the EV-302 trial suggests the distribution of treatment duration for both EV and pembrolizumab is skewed by patients remaining on treatment for a long period of time (i.e., mean treatment durations are higher than median). Given the skewness in treatment duration it is important to capture when costs occur, especially as pembrolizumab is only given for a maximum of 2 years.
For patients who enter the BIA in year 1, we extracted EV + P drug acquisition costs over 3 years from the CDA-AMC reanalysis of the submitted economic evaluation (total: $288,222).
For patients who enter the BIA in year 2, we extracted EV + P drug acquisition costs over 2 years from the CDA-AMC reanalysis of the submitted economic evaluation (total: $266,309).
For patients who enter the BIA in year 3, we extracted EV + P drug acquisition costs over 1 year from the CDA-AMC reanalysis of the submitted economic evaluation (total: $187,813).
As all initial therapy drug costs for platinum-based chemotherapy were incurred in the first year of therapy, the estimates used by the sponsor were not changed.
The total number of adult bladder cancer cases was underestimated: The sponsor estimated the prevalence of adult bladder cancer cases in CDA-AMC–participating jurisdictions in 2024 by dividing the number of bladder cancer cases reported in Canada in 2018 by the projected adult population of Canada in 2024.25 The distribution of prevalent bladder cancer cases by jurisdiction was assumed similar to provincial incidence rates reported in 2023, allowing for the estimation of prevalence rates by individual jurisdiction, including a pan-Canadian prevalence for all CDA-AMC–participating jurisdictions. However, in applying the number of bladder cancer cases in 2018 to the population in 2024, the sponsor has underestimated the prevalence in 2024. Additionally, the method used by the sponsor to estimate prevalence in adults does not account for the 0.1% to 0.4% of bladder cancer cases which occur in the first 2 decades of life,33 most of whom are outside of the indicated adult population for EV + P.2
We considered the total population of CDA-AMC–participating plans in its derivation of prevalence, inflated the number of cases reported for 2018 to 2024 using by the population ratio between those 2 years, and assumed that 99.6% of BC cases occur in adults.
Use of prevalence to derive eligible patients diagnosed with metastatic disease was inappropriate: The sponsor derived the population eligible for 1L systemic therapy using 5-year prevalence rates reported by the Canadian Cancer Society.27 For patients who develop locally advanced or metastatic UC from earlier stages, the initial use of prevalence followed by an annual rate at which patients progress to locally advanced or metastatic disease is appropriate. However, the use of 5-year prevalence may underestimate the total number of patients who develop locally advanced or metastatic UC each year as not all patients will progress within 5 years. If a patient has had UC for more than 5 years and develops locally advanced or metastatic UC, they would be excluded from the sponsor’s estimate.
The sponsor also uses prevalence to determine how many people currently have locally advanced or metastatic UC. All these patients are considered eligible for EV + P. However, for patients currently diagnosed with de novo locally advanced or metastatic UC some patients will have already made a treatment decision regarding 1L therapy and have either received platinum-based chemotherapy, have moved on to 2L or later systemic therapy, or have decided not to proceed with systemic therapy. When estimating the number of patients with de novo locally advanced or metastatic UC directly eligible for 1L systemic therapy, it is more appropriate to use the incidence rate34 rather than prevalence.
We were unable to adjust the analysis to include patients who progress to locally advanced or metastatic UC more than 5 years after their original UC diagnosis.
We estimated the number of patients with de novo locally advanced or metastatic UC eligible for 1L therapy using incidence rates rather than prevalence.
Proportion of patients diagnosed with locally advanced or metastatic UC is uncertain: The sponsor assumed that 9% of UC patients are diagnosed with de novo locally advanced or metastatic UC, 13% with MIBC UC (defined as MIBC that is not locally advanced or metastatic), and 78% with NMIBC based on the proportion of patients diagnosed at stage IV, stages II or III, and stages 0 or I, respectively, reported in a 2018 Canadian Cancer Society report.29 However, the population of interest is patients with locally advanced or metastatic disease, rather than only metastatic. As such, some patients with stage III disease at diagnosis may be included in the proportion diagnosed with de novo locally advanced or metastatic UC,35,36 increasing this proportion to approximately 13%.29 Likewise, another estimate from the 2019 Canadian urological consensus statement estimated that 15% of patients with bladder cancer have locally advanced or metastatic disease at presentation.37 However, given that EV-302 trial population included only patients with unresectable locally advanced disease,4 and that patients in clinical practice with resectable locally advanced UC would presumably receive a resection and adjuvant or neoadjuvant therapy, the true proportion of patients diagnosed with locally advanced or metastatic UC who would immediately be candidates for a 1L therapy would be between 9% and 15%.
When considering the proportions of patients diagnosed with non-locally advanced or metastatic MIBC and NMIBC, the most frequently cited estimate found in the literature was 75% of bladder cancer or urothelial carcinoma being diagnosed with noninvasive disease,38-41 consistent with clinical expert input obtained by CDA-AMC estimating that 70% to 75% of bladder cancers are diagnosed as noninvasive.
Finally, the sponsor assumes the distribution of patients with locally advanced or metastatic BC, NMIBC and MIBC at diagnosis is the same as the prevalent population (patients currently living with bladder cancer). For example, this means if we looked at all patients currently alive with bladder cancer in Canada, we would expect the percentage of patients who have metastatic bladder cancer to match the probability of having metastatic bladder cancer upon diagnosis. Given the high mortality of patients with locally advanced or metastatic UC relative to that of patients diagnosed at nonadvanced stages,32,42 the proportion of patients currently living with locally advanced or metastatic UC (prevalent population) may be lower than the proportion who have locally advanced or metastatic disease at diagnosis (i.e., the incident population). As such, the sponsor’s use of staging proportions at diagnosis to represent the proportion of patients currently living in each stage in the prevalent UC population might overestimate the prevalent population of patients with locally advanced or metastatic UC. This is made uncertain by the fact that individuals can be diagnosed with locally advanced or metastatic UC or develop it after diagnosis. The distribution of staging for patients currently living with bladder cancer is therefore uncertain.
In its base case reanalysis, CDA-AMC assumed 9% of patients have de novo locally advanced or metastatic UC, 16% are diagnosed with non-locally advanced or metastatic MIBC, and 75% are diagnosed with NMIBC.
In a scenario analysis, CDA-AMC assumed 15% of patients are diagnosed with locally advanced or metastatic UC, 12% are diagnosed with non-locally advanced or metastatic UC, and 75% are diagnosed with NMIBC.
In another scenario, CDA-AMC assumed that 5% of prevalent patients were diagnosed with de novo locally advanced or metastatic UC, 15% with MIBC, and 80% with NMIBC. The incidence of de novo locally advanced or metastatic UC was kept at 9%. As patients with locally advanced or metastatic UC have a higher mortality rate, this analysis assumes they make up a smaller proportion of the prevalent population.
Proportion of patients receiving systemic therapy is underestimated: The sponsor estimated that 35% of patients diagnosed with or developing locally advanced or metastatic UC would receive a 1L systemic therapy based on a retrospective cohort study of patients diagnosed with de novo locally advanced or metastatic UC from 2015 to 2019 in Alberta.32 As noted within this study, the treatment landscape has evolved to include avelumab as maintenance therapy since the studied cohort was treated. Additionally, pembrolizumab and enfortumab vedotin have since been funded individually as second-line therapies. As such, according to clinical expert input obtained by CDA-AMC, patients are more likely to be referred to medical oncologists in current practice than they were over the time frame of the Alberta study, leading to more patients receiving systemic therapies. According to expert input, up to 90% of patients treated in academic centres receive systemic therapy, with lower percentages for patients treated in other locations. Additionally, the Alberta study included only patients diagnosed with de novo locally advanced or metastatic UC; according to clinical expert input obtained by CDA-AMC, patients who progress to locally advanced or metastatic UC from earlier stages are more likely to have previously been referred to a medical oncologist and thus more likely to continue receiving treatment at later stages than those diagnosed with de novo locally advanced or metastatic disease. Previous Canadian reimbursement reviews for locally advanced or metastatic UC have assumed 65% of patients with locally advanced or metastatic UC will receive a 1L systemic therapy.31,43,44
Additionally, according to clinical expert input obtained by CDA-AMC, the funding of EV + P as an alternate 1L systemic treatment to platinum-based chemotherapy may lead to a small increase in the number of patients who receive a 1L therapy, as patients who may have been unable or unwilling to tolerate platinum therapy may instead elect to receive EV + P.
Based on clinical expert input and the present funding of multiple lines of systemic therapy, CDA-AMC assumed that 85% of patients progressing to locally advanced or metastatic UC from earlier stages will receive a 1L systemic therapy, while 40% of those diagnosed with de novo locally advanced or metastatic UC will do so.
We also conducted a scenario where 5% more patients with locally advanced or metastatic UC received a 1L systemic therapy, all of whom received EV + P.
Market uptake of EV + P is uncertain: The sponsor assumed that EV + P would capture 50% of the eligible and treated market share in year 1, 60% in year 2, and 70% in year 3 of its funding, with remaining patients receiving platinum-based chemotherapy. Clinical expert input obtained by CDA-AMC found these estimates to be reasonable in the first 2 years, but potentially underestimated by year 3 as EV + P was expected to become the new standard of care in Canadian practice.
CDA-AMC conducted a scenario assuming EV + P captured 85% of the 1L market in year 3.
CDA-AMC Reanalyses of the Budget Impact Analysis
CDA-AMC revised the sponsor’s base case by: adjusting treatment cost of EV + P to be consistent with the 1-, 2-, and 3- drug acquisition costs in the CDA-AMC base case reanalysis of the pharmacoeconomic evaluation; adjusting the prevalence and population assumptions; deriving de novo locally advanced or metastatic UC cases using incidence; adjusting the proportion of patients diagnosed with each stage of UC; and adjusting the proportion of patients receiving a 1L therapy. The changes are described in Table 16.
Table 16: CDA-AMC Revisions to the Submitted Budget Impact Analysis
Stepped analysis | Sponsor’s value or assumption | CDA-AMC value or assumption |
|---|---|---|
Changes to derive the CDA-AMC base case | ||
1. EV + P costs match pharmacoeconomic reanalysis | Y1 patients: $217,448 in Y1. Y2 patients: $217,448 in Y2. Y3 patients: $217,448 in Y3 | Y1 patients: $187,813 in Y1, $78,496 in Y2, $21,913 in Y3 ($288,222 total) Y2 patients: $187,813 in Y2, $78,496 in Y3. ($266,309 total) Y3 patients: $187,813 in Y3 ($187,813 total) |
2. Population and prevalence rates | Adult pan-Can population 2024: 25,265,700 BC cases 2018: 37,315 Pan-Can prevalence BC 2024: 0.1024% of adult populationb % BC that is UC: 90% Total UC cases 2024: 23,279 | Total pan-Can population 2024: 31,916,800 BC cases 2024: 41,226a Pan-Can prevalence BC 2024: 0.0895% of total populationb % BC that is UC: 90% % UC in adults: 99.6%c Total adult UC cases 2024: 25,616 |
3. De novo locally advanced or metastatic UC population source | 5-year prevalence BC | Incidence BC (0.03%)d |
4. UC stage at diagnosis | Locally advanced or metastatic UC: 9% MIBC: 13% NMIBC: 78% | Locally advanced or metastatic UC: 9% MIBC: 16% NMIBC: 75% |
5. Proportion of patients receiving 1L systemic therapy | Patients with locally advanced or metastatic UC: 35% receive systemic therapy | Patients progressing to locally advanced or metastatic UC: 85%recieve systemic therapy Patients diagnosed with de novo locally advanced or metastatic UC: 40% receive systemic therapy |
CDA-AMC base case | 1 through 5 | |
BC = bladder cancer; CDA-AMC = Canada’s Drug Agency; EV = enfortumab vedotin; MIBC = muscle invasive bladder cancer; NMIBC = nonmuscle invasive bladder cancer; P = pembrolizumab; pan-Can = CDA-AMC-participating jurisdictions; UC = urothelial cancer.
aInflated from number of BC cases reported in 2018 by the ratio of the 2024 to 2018 populations of Canada.45,46
bDerived by assuming the distribution of prevalent BC cases across jurisdictions is similar to the distribution of incident BC cases across jurisdictions.24,26
cBased on an estimate that 0.1% to 0.4% of urothelial carcinoma occurs in the first 2 decades of life.33
dDerived using the number of incident bladder cancer cases projected for 2024 divided by the population of Canada projected for 2024.25,34
The results of the CDA-AMC step-wise reanalysis are presented in summary format in Table 17 and a more detailed breakdown is presented in Table 18.
Based on the CDA-AMC base case, the 3-year budget impact associated with the reimbursement of EV + P for the treatment of adult patients with previously untreated locally advanced or metastatic UC is expected to be $329,107,647 (year 1: $67,775,713, year 2: $115,386,675, year 3: $145,945,258). All analyses are based on wholesale list prices and may not represent actual costs paid by public plans.
Table 17: Summary of the CDA-AMC Reanalyses of the Budget Impact Analysis
Stepped analysis | Three-year total ($) |
|---|---|
Submitted base case | $321,294,683 |
CDA-AMC reanalysis 1: EV + P costs | $362,482,842 |
CDA-AMC reanalysis 2: prevalence rate correction | $347,930,248 |
CDA-AMC reanalysis 3: de novo locally advanced or metastatic UC is incidence-based | $141,588,116 |
CDA-AMC reanalysis 4: stage at diagnosis proportions | $324,854,439 |
CDA-AMC reanalysis 5: proportion of patients receiving 1L systemic therapy | $453,175,985 |
CDA-AMC base case | $329,107,647 |
CDA-AMC = Canada’s Drug Agency; 1L = first line; EV + P = enfortumab vedotin plus pembrolizumab.
CDA-AMC conducted the following scenario analyses to address remaining uncertainty, using the CDA-AMC base case (results are provided in Table 18):
Assuming EV + P captures 85% of the eligible market in Year 3;
Assuming 15% of patients are diagnosed with de novo locally advanced or metastatic UC, 10% with MIBC, and 75% with NMIBC;
Assuming 5% of prevalent patients currently have de novo locally advanced or metastatic UC, 15% have MIBC, and 75% have NMIBC. Incidence of de novo locally advanced or metastatic UC was assumed to be 9% of total UC incidence.
Assuming the availability of EV + P leads to an additional 5% of total patients with locally advanced or metastatic UC receiving a 1L therapy, all of whom receive EV + P.
Table 18: Detailed Breakdown of the CDA-AMC Reanalyses of the Budget Impact Analysis
Stepped analysis | Scenario | Year 0 (current situation) ($) | Year 1 ($) | Year 2 ($) | Year 3 ($) | Three-year total ($) |
|---|---|---|---|---|---|---|
Submitted base case | Reference | $31,600,585 | $32,105,656 | $32,607,501 | $33,094,894 | $97,808,051 |
New drug | $31,600,585 | $120,184,831 | $139,544,746 | $159,373,156 | $419,102,734 | |
Budget impact | $0 | $88,079,175 | $106,937,245 | $126,278,262 | $321,294,683 | |
CDA-AMC base case | Reference | $29,110,043 | $29,350,372 | $29,592,385 | $29,827,598 | $88,770,355 |
New drug | $29,110,043 | $97,126,085 | $144,979,060 | $175,772,856 | $417,878,002 | |
Budget impact | $0 | $67,775,713 | $115,386,675 | $145,945,258 | $329,107,647 | |
CDA-AMC scenario 1: 85% EV + P share in year 3 | Reference | $29,110,043 | $29,350,372 | $29,592,385 | $29,827,598 | $88,770,355 |
New drug | $29,110,043 | $97,126,085 | $144,979,060 | $197,338,798 | $439,443,944 | |
Budget impact | $0 | $67,775,713 | $115,386,675 | $167,511,200 | $350,673,589 | |
CDA-AMC scenario 2: 15% diagnosed with locally advanced or metastatic UC | Reference | $33,412,022 | $33,690,576 | $33,971,105 | $34,243,872 | $101,905,553 |
New drug | $33,412,022 | $111,488,666 | $166,428,182 | $201,792,280 | $479,709,128 | |
Budget impact | $0 | $77,798,089 | $132,457,077 | $167,548,408 | $377,803,575 | |
CDA-AMC scenario 3: 5% locally advanced or metastatic UC prevalence, 9% locally advanced or metastatic UC incidence | Reference | $29,392,572 | $29,635,182 | $29,879,492 | $30,116,937 | $89,631,611 |
New drug | $29,392,572 | $98,068,578 | $146,385,717 | $177,478,019 | $421,932,314 | |
Budget impact | $0 | $68,433,396 | $116,506,225 | $147,361,082 | $332,300,703 | |
CDA-AMC scenario 3: 5% more patients treated at 1L and get EV + P | Reference | $29,110,043 | $29,350,372 | $29,592,385 | $29,827,598 | $88,770,355 |
New drug | $29,110,043 | $101,164,533 | $151,553,016 | $184,031,929 | $436,749,477 | |
Budget impact | $0 | $71,814,161 | $121,960,631 | $154,204,331 | $347,979,123 |
CDA-AMC = Canada’s Drug Agency; 1L = first line; BIA = budget impact analysis; EV = enfortumab vedotin; P = pembrolizumab; UC = urothelial cancer.
ISSN: 2563-6596
Canada’s Drug Agency (CDA-AMC) is a pan-Canadian health organization. Created and funded by Canada’s federal, provincial, and territorial governments, we’re responsible for driving better coordination, alignment, and public value within Canada’s drug and health technology landscape. We provide Canada’s health system leaders with independent evidence and advice so they can make informed drug, health technology, and health system decisions, and we collaborate with national and international partners to enhance our collective impact.
Disclaimer: CDA-AMC has taken care to ensure that the information in this document was accurate, complete, and up to date when it was published, but does not make any guarantee to that effect. Your use of this information is subject to this disclaimer and the Terms of Use at cda-amc.ca.
The information in this document is made available for informational and educational purposes only and should not be used as a substitute for professional medical advice, the application of clinical judgment in respect of the care of a particular patient, or other professional judgments in any decision-making process. You assume full responsibility for the use of the information and rely on it at your own risk.
CDA-AMC does not endorse any information, drugs, therapies, treatments, products, processes, or services. The views and opinions of third parties published in this document do not necessarily reflect those of CDA-AMC. The copyright and other intellectual property rights in this document are owned by the Canadian Agency for Drugs and Technologies in Health (operating as CDA-AMC) and its licensors.
Questions or requests for information about this report can be directed to Requests@CDA-AMC.ca.