Drugs, Health Technologies, Health Systems
Reimbursement Review
Talquetamab (Talvey)
Sponsor: Janssen Inc.
Therapeutic area: Relapsed or refractory multiple myeloma
This multi-part report includes:
Clinical Review
Pharmacoeconomic Review
Clinical Review
Abbreviations
AE
adverse event
ATT
average treatment effect in the treated
BCMA
B-cell maturation antigen
CAR
chimeric antigen receptor
CDA-AMC
Canada’s Drug Agency
CI
confidence interval
cilta-cel
ciltacabtagene autoleucel
CMRG
Canadian Myeloma Research Group
CR
complete response
CRS
cytokine release syndrome
DOR
duration of response
ECOG
Eastern Cooperative Oncology Group
EORTC QLQ-C30
European Organisation for Research and Treatment of Cancer Quality of Life Questionnaire Core 30
GHS
global health status
GRADE
Grading of Recommendations Assessment, Development, and Evaluation
HR
hazard ratio
HRQoL
health-related quality of life
ICANS
immune effector cell–associated neurotoxicity syndrome
IMiD
immunomodulatory drug
IMWG
International Myeloma Working Group
IPD
individual patient data
IPTW
inverse probability treatment weighting
IRC
independent review committee
ISS
International Staging System
ITC
indirect treatment comparison
Kd
carfilzomib-dexamethasone
LDH
lactate dehydrogenase
MM
multiple myeloma
MRD
minimal residual disease
OH-CCO
Ontario Health (Cancer Care Ontario)
ORR
overall response rate
OS
overall survival
Pd
pomalidomide-dexamethasone
PE
pharmacoeconomic
PFS
progression-free survival
PI
proteasome inhibitor
PR
partial response
R-ISS
Revised International Staging System
RP2D
recommended phase II dose
r/r MM
relapsed or refractory
RWPC
real-world physician’s choice of therapy
SC
subcutaneous
SMD
standardized mean difference
TEAE
treatment-emergent adverse event
TTNT
time to next treatment
VGPR
very good partial response
Executive Summary
An overview of the submission details for the drug under review is provided in Table 1.
Table 1: Background Information of Application Submitted for Review
Item | Description |
|---|---|
Drug product | Talquetamab (Talvey), 2 mg/mL or 40 mg/mL, single-dose vials containing 3 mg talquetamab in 1.5 mL solution or 40 mg talquetamab in 1 mL solution for SC injection |
Sponsor | Janssen Inc. |
Indication | For the treatment of adult patients with relapsed or refractory multiple myeloma who have received at least 3 prior lines of therapy, including a proteasome inhibitor, an immunomodulatory agent and an anti-CD38 monoclonal antibody, and have demonstrated disease progression on or after the last therapy. |
Reimbursement request | As per indication |
Health Canada approval status | NOC with conditions |
Health Canada review pathway | Standard review |
NOC date | April 30, 2024 |
Recommended dose | 0.4 mg/kg of body weight once weekly by SC injection after receiving step-up doses of 0.01 mg/kg and 0.06 mg/kg of body weight, or 0.8 mg/kg of body weight every 2 weeks by SC injection after receiving step-up doses of 0.01 mg/kg, 0.06 mg/kg, and 0.4 mg/kg of body weight |
NOC = Notice of Compliance; SC = subcutaneous.
Introduction
Multiple myeloma (MM) is a plasma cell cancer characterized by clonal proliferation of malignant plasma cells (B cells) and overproduction of the abnormal immunoglobulin monoclonal protein (M protein).1 In Canada in 2023, an estimated 3,900 individuals were diagnosed with MM and approximately 1,700 deaths due to MM occurred.2 The 5-year survival rate for people with MM is estimated to be approximately 50%,3 and although survival rates have improved in recent years due to advances in therapeutic options, MM remains incurable.4,5 The majority of patients with MM will experience relapse, and many patients will cease to experience response to commonly used therapies.6 Patients with relapsed or refractory r/r MM often undergo multiple rounds of treatment, with duration of remission, depth of response, progression-free survival (PFS), and overall survival (OS) decreasing with each subsequent line of therapy.7
The clinical expert and the clinician groups consulted for this review pointed out that the key treatment goals for patients with r/r MM are to delay progression, control the disease and associated symptoms, and prolong OS. Depending on drug sensitivity, patients can be treated with carfilzomib-dexamethasone (Kd) or pomalidomide-dexamethasone (Pd) in combination with isatuximab, carfilzomib-lenalidomide-dexamethasone, lenalidomide-dexamethasone, daratumumab-lenalidomide-dexamethasone, or daratumumab-bortezomib-dexamethasone. Alternative regimens with a different proteasome inhibitor (PI) or immunomodulator backbone can be used in the third and fourth lines. Cyclophosphamide may be added to some regimens, such as Pd, Kd, and lenalidomide-dexamethasone. According to the Provisional Funding Algorithm for Multiple Myeloma developed by CADTH,8 patients with drug resistance cannot be treated again with the same drug, except for dexamethasone, which is found in all regimens. There is no preferred therapy for r/r MM in the fourth-line setting or beyond, and at this stage of the disease patients may be treated with PIs, immunomodulatory drugs (IMiDs), and anti-CD38 monoclonal antibodies and in some cases receive more than 1 PI or IMiD, further limiting treatment options in later lines of therapy.
The objective of this report is to review and critically appraise the evidence submitted by the sponsor on the beneficial and harmful effects of talquetamab 0.4 mg/kg of body weight weekly or 0.8 mg/kg of body weight every 2 weeks, administered subcutaneously, for the treatment of adult patients with r/r MM who have received at least 3 prior lines of therapy, including a PI, an IMiD, and an anti-CD38 monoclonal antibody, and who have experienced disease progression on or after the last therapy.
Patient and Clinician Perspectives
The information in this section is a summary of the input provided by the patient and clinician groups who responded to the review team’s call for input and from the clinical expert consulted for this review.
Patient Input
The review team received 1 patient group submission from Myeloma Canada, which conducted surveys with both patients and caregivers from April 17 to May 10, 2024, across Canada and internationally via email and social media. Eighty-six responses to the survey were received. Of these, 38 responses (32 patients and 6 caregivers; all from Canada except 1 patient) were recorded based on the eligibility criteria. Of these 38 respondents, 32 were eligible for the treatment under review (27 patients and 5 caregivers) and 6 had experience with it (5 patients and 1 caregiver). Nineteen of those 32 eligible respondents indicated that they had received 3 prior lines of therapy, 9 indicated that they had received 4 lines, and 4 indicated that they had received 5 lines of therapy or more. In addition, 97% of the 32 respondents indicated that they or the people they cared for had received an autologous stem cell transplant to treat the myeloma.
Respondents to the survey indicated that infections were the most important aspect related to myeloma to control, followed by fatigue, kidney problems, and pain. The respondents noted that among the elements of daily activity and quality of life, the ability to travel was the most significantly impacted by the symptoms associated with myeloma, followed by the ability to exercise and to conduct volunteer activities. The respondents felt that interruption of life goals or accomplishments had the greatest impact on quality of life, followed by loss of sexual desire and by anxiety or worry. Patient and caregiver respondents identified the following factors as the most important to myeloma treatment: quality of life, manageable side effects, effectiveness of treatment (especially in experiencing remission and having a durable response), and treatment accessibility or portability (including fewer or minimal visits to the hospital or cancer centre).
In terms of treatment outcomes, 21 of the 31 respondents eligible for the treatment under review and provided response to the question rated improved quality of life as extremely important, 9 as very important, and 1 as somewhat important. In addition, 21 of the 32 respondents eligible for the treatment under review indicated that an estimated minimum 1 year of extended life at this stage of myeloma was extremely desirable, and 9 indicated it was very desirable. When asked about tolerance of the most common side effects in patients who had received talquetamab, respondents perceived immune effector cell–associated neurotoxicity syndrome (ICANS), cytokine release syndrome (CRS), and infections to be the least tolerable side effects, followed by diarrhea and neutropenia. Six respondents having experience with talquetamab rated oral-related and nail-related issues as the least bearable of the most frequently experienced talquetamab side effects, followed by skin-related issues and infections. Most of the 6 respondents noted that the overall side effects while receiving talquetamab were manageable.
Clinician Input
Input From Clinical Expert Consulted for This Review
The clinical expert consulted for this review noted that fourth-line treatment for MM is challenging because there are limited available therapies. Moreover, tolerability of treatment is important as patients with r/r MM that can cause them to feel weak. The clinical expert noted that talquetamab could be appropriate to be used as a fourth-line or later-line treatment, being a potential treatment for patients who have received prior B-cell maturation antigen (BCMA)-directed therapy (e.g., belantamab, ciltacabtagene autoleucel [cilta-cel], teclistamab, elranatamab) or for patients who have not previously received BCMA-targeted therapy. The clinical expert indicated that patients treated with talquetamab would also be eligible for subsequent BCMA-targeted therapy. The clinical expert noted that the patients best suited to talquetamab would be those who need a fourth-line or later-line treatment and have an adequate performance status and reasonable hematologic function. The clinical expert indicated that there is no biomarker to predict treatment response and no companion test is necessary; however, the treatment centre must have an appropriate setup for the monitoring and treatment of CRS and should have access to infectious disease consultative services. The clinical expert indicated that treatment response is typically measured biochemically every 4 weeks. The clinical expert noted that the treatment discontinuation factors include disease progression according to the International Myeloma Working Group (IMWG) response criteria9 and intolerable adverse events (AEs) (e.g., severe dysgeusia, severe myelosuppression). The clinical expert noted that treatment with talquetamab should be initiated and supervised by a specialist (a hematologist or a medical oncologist with appropriate training). The clinical expert indicated that the first few doses of talquetamab treatment should be administered at a site with knowledge and expertise in managing CRS and that the subsequent doses could be administered in a community setting.
Clinician Group Input
Input on the review of talquetamab was received from 2 clinician groups: the Canadian Myeloma Research Group (CMRG) and the Ontario Health (Cancer Care Ontario) (OH-CCO) Hematology Cancer Drug Advisory Committee. Thirty-two clinicians (25 from CMRG and 7 from the OH-CCO Hematology Cancer Drug Advisory Committee) provided input for this submission.
Both CMRG and the OH-CCO Hematology Cancer Drug Advisory Committee emphasized that the overall treatment goals are to delay progression, improve OS, control the disease and associated symptoms, minimize adverse effects, and improve quality of life. CMRG highlighted that myeloma remains incurable and that patients eventually cease to experience response to all available funded drugs. CMRG emphasized that the highest unmet need is in patients with advanced disease who have received multiple lines of treatment and have already received the 3 major classes of drugs — PIs, IMiDs, and anti-CD38 monoclonal antibodies — (referred to here as patients with “triple-class exposed disease” or “triple-class refractory disease”). Another unmet need noted by the OH-CCO Hematology Cancer Drug Advisory Committee is to achieve ease of administration with talquetamab (i.e., subcutaneous [SC] injection and no need for apheresis) and a target than other bispecific antibodies.
Both clinician groups agreed that talquetamab could be another option for patients with triple-class exposed disease. CMRG indicated that patients with a good performance status, minimal or no comorbidities, relatively low tumour burden, adequate organ function, and satisfactory blood counts are the most likely to have the best outcomes with talquetamab. CMRG noted that, overall, patients with poor disease-related prognostic factors, such as extramedullary myeloma and high-risk cytogenetics, should be eligible for talquetamab.
CMRG added that clinically meaningful responses usually correlate with at least a partial remission according to IMWG consensus criteria. Both CMRG and the OH-CCO Hematology Cancer Drug Advisory Committee agreed that treatment discontinuation should be based on ongoing efficacy or response, disease progression, and long-term tolerability or significant toxicities. Given that prior exposure to anti-BCMA therapy does not preclude responsiveness to talquetamab, CMRG suggested that patients who had received prior anti-BCMA therapy or bispecific antibody treatment should be allowed access to talquetamab. The OH-CCO Hematology Cancer Drug Advisory Committee also noted that talquetamab might be helpful for patients who have previously received anti-BCMA treatment.
Drug Program Input
Input was obtained from the drug programs that participate in the reimbursement review process. The following were identified as key factors that could potentially impact the implementation of a recommendation for talquetamab:
relevant comparators
considerations for initiation of therapy
considerations for discontinuation of therapy
considerations for prescribing of therapy
generalizability
funding algorithm
care provision issues
system and economic issues.
The clinical expert consulted for this review provided advice on the potential implementation issues raised by the drug programs. Refer to Table 4 for more details.
Clinical Evidence
Systematic Review
Description of Studies
One ongoing, phase I/II, single-arm, open-label, multicentre, dose escalation study, the MonumenTAL-1 study (total N = 501; N at either recommended phase II dose [RP2D] = 339), met the inclusion criteria for the systematic review conducted by the sponsor. The objectives of the MonumenTAL-1 study were to characterize the safety of talquetamab and the RP2Ds and schedule, to further characterize the safety of talquetamab at the RP2Ds (phase I), and to evaluate the efficacy of talquetamab at the RP2Ds (phase II) in adults with r/r MM. The trial enrolled adult patients with r/r MM who had not received prior T-cell redirection therapy (model cohort A [RP2D = 0.4 mg/kg weekly] and model cohort C [RP2D = 0.8 mg/kg every 2 weeks]) or who had received prior T-cell redirection therapy (model cohort B [either RP2D]). All patients had received at least 1 PI, 1 IMiD, and 1 anti-CD38 monoclonal antibody and had experienced disease progression on or after the last therapy. All patients had an Eastern Cooperative Oncology Group (ECOG) Performance Status of 0 or 1 in phase I and of less than or equal to 2 in phase II The 3 noncomparative cohorts were analyzed separately. Patients received 1 of the 2 RP2Ds: 0.4 mg/kg weekly SC on days 1, 8, 15, and 22 of a 28-day cycle (preceded by step-up doses of 0.01 mg/kg and 0.06 mg/kg) or 0.8 mg/kg every 2 weeks SC on days 1 and 15 of a 28-day cycle (preceded by step-up does of 0.01 mg/kg, 0.06 mg/kg, and 0.3 mg/kg). The outcomes relevant to this review included the primary outcome of overall response rate (ORR) by independent review committee (IRC) per IMWG criteria and secondary outcomes of OS, PFS, duration of response (DOR), complete response (CR) or better rate, and safety. Health-related quality of life (HRQoL) was measured in phase II only, via the European Organisation for Research and Treatment of Cancer Quality of Life Questionnaire Core 30 (EORTC QLQ-C30), as a secondary outcome.
The trial population had a mean age of 61 to 65 years and a mean duration since MM diagnosis of 7.2 to 7.7 years across the model cohorts. There were more male patients (55% to 57% across the cohorts) than female patients (43% to 46%). Most enrolled patients were white (86% to 90%); the next largest groups by ethnicity were Black or African American, and Asian. Most patients (56% to 60%) had an ECOG Performance Status of 1, and less than 10% of the patients had an ECOG Performance Status of 2 (indicating good overall performance status). Most patients had a Revised International Staging System (R-ISS) disease stage of II (62% to 70%), standard cytogenetic risk (59% to 71%), and triple-class (PI, IMiD, and anti-CD38 monoclonal antibody) refractory disease (69% to 84%). The proportions of patients who had penta-drug (≥ 2 PIs, 2 IMiDs, and 1 anti-CD38 monoclonal antibody) refractory disease were 29% in model cohort A, 23% in model cohort C, and 41% in model cohort B.
As model cohort B was not included in the PE models and was more exploratory than the other 2 cohorts, the results summary is focused on model cohorts A and C. The results for model cohort B are presented in the main body of this report.
Efficacy Results
The key efficacy results from the MonumenTAL-1 study are summarized in Table 2, in descending order of the importance of the outcomes, as suggested by the clinical expert consulted for this review. The efficacy outcomes for this review were from the most recent analyses (clinical cut-off date: January 17, 2023) for the all-treated analysis set among the patients who received the RP2D in the MonumenTAL-1 study.
Overall Survival
At the data cut-off date, the OS data were immature. The median OS was not reached in any model cohort. The 12-month OS rate was 76% (95% confidence interval [CI], 68% to 83%) in model cohort A and 77% (95% CI, 69% to 84%) in model cohort C.
Progression-Free Survival
The median PFS was 7.5 months (95% CI, 5.7 to 9.4 months) in model cohort A and 14.2 months (95% CI, 9.6 months to not estimable) in model cohort C. The 12-month PFS rate in model cohort A (35%; 95% CI, 27% to 43%) appears lower than in model cohort C (54%; 95% CI, 45% to 63%).
Overall Response Rate
At the data cut-off date, the ORR was experienced by 74% (95% CI, 66% to 81%) and 72% (95% CI, 64% to 79%) of patients in model cohort A and model cohort C, respectively, with a 1-sided P value of less than 0.0001 for both cohorts. The results of prespecified clinically relevant subgroup analyses showed that the ORR seemed higher among patients with no extramedullary plasmacytomas at baseline (model cohort A: 81.8%; 95% CI, 73.3% to 88.5%; model cohort C: 81.5%; 95% CI, 72.9% to 88.3%) than among those with 1 or more baseline extramedullary plasmacytomas (model cohort A: 48.5%; 95% CI, 30.8% to 66.5%; model cohort C: 43.2%; 95% CI, 27.1% to 60.5%). It was not the intent of the study to formally test for subgroup differences.
Duration of Response
At the data cut-off date, the median DOR was reached among patients who experienced a partial response [PR] or better in model cohorts A and B, but not in model cohort C. The median DOR was 9.5 months (95% CI, 6.7 to 13.3 months) in patients who experienced a PR or better in model cohort A (n = 106) and not estimable (95% CI, 13.0 months to not estimable) in patients who experienced a PR or better in model cohort C (n = 104). The event-free rate for DOR was, at 6 months, 67% in model cohort A and 82% in model cohort C; at 9 months, 52% in model cohort A and 76% in model cohort C; and at 12 months, 44% in model cohort A and 69% in model cohort C.
CR or Better Rate
At the data cut-off date, a CR or better was experienced by 34% of patients (95% CI, 26% to 42%) in model cohort A and 39% of patients (95% CI, 31% to 47%) in model cohort C.
Health-Related Quality of Life
HRQoL, assessed via the EORTC QLQ-C30, was only reported for phase II of the MonumenTAL-1 study. In cohort A (talquetamab 0.4 mg/kg weekly SC in patients who had not received prior T-cell redirection therapy), the proportions of patients who experienced at least a 10-point improvement from baseline through cycle 7 day 1 (i.e., the first 6 months) in pain, fatigue, global health status (GHS), and physical functioning subscales were ████ ████ ████ ███ ███, respectively. In cohort C (0.8 mg/kg every 2 weeks SC in patients who had not received prior T-cell redirection therapy), the proportions of patients who experienced at least a 10-point improvement from baseline through cycle 7 day 1 in pain, fatigue, GHS, and physical functioning subscales were ████ ████ ████ ███ ███, respectively.
Harms Results
All patients in the study reported at least 1 treatment-emergent AE (TEAE). The most frequently reported TEAEs were CRS (79% in model cohort A and 75% in model cohort C), dysgeusia (50% and 49%), anemia (45% and 46%), weight decrease (41% and 41%), pyrexia (39% and 28%), and neutropenia (35% and 28%). Serious TEAEs occurred to 53% and 48% of patients in model cohorts A and C, respectively. The most frequently reported serious TEAEs were CRS (17% in model cohort A and 10% in model cohort C), pyrexia (6% and 5%), and ICANS (4% and 4%). In general, the proportions of patients with overall or specific TEAEs and with specific serious TEAEs were similar between the 2 cohorts, with a higher rate in model cohort A than in model cohort C for serious TEAEs and for pyrexia and neutropenia of any severity.
Likewise, the rates of AEs of special interest were similar between model cohort A and model cohort C: neurologic TEAEs (86% and 86%), neurotoxicity events (31% and 30%), and ICANS (11% and 11%). The rate of CRS was 79% in model cohort A and 75% in model cohort C. The proportion of patients who experienced an infection of any severity was 59% in model cohort A and 66% in model cohort C.
Critical Appraisal
The primary limitation of the MonumenTAL-1 study was the absence of a comparator group to assess the efficacy and harms of talquetamab compared to placebo or an active treatment; therefore, the interpretation of the results is limited by the study’s single-arm design. The open-label design introduces a potential performance bias and a bias in the assessment of PFS, ORR, DOR, CR or better rate, HRQoL, and some AEs. The assessment bias was mitigated by using the IRC, which performed tumour assessment per the IMWG criteria9 for the tumour response outcomes. The ORR and the 95% CI excluded the predetermined thresholds for null hypotheses for all 3 model cohorts (30% for model cohorts A and C; 15% for model cohort B) (P < 0.0001), and this effect can be attributed to talquetamab despite the single-arm study design. Despite a lack of multiplicity adjustment10 for the ORR analyses, P values were small, suggesting that these were not false-positive results. ORR was examined in prespecified clinically relevant subgroups; however, the sample sizes for the subgroup analyses were small and the analyses were not adjusted for multiplicity, limiting the interpretation of the data. The review team noted the smaller sample size (N = 51) of model cohort B (patients who had received prior T-cell redirection therapy and either of the 2 recommended dosing regimens), further limiting the interpretation of the results for these patients. At the data cut-off date and across the model cohorts, ██ ██ ██ of the patients were lost to follow-up for OS and | ██ ██ of the patients withdrew consent to study participation. It appears that the impact of missing data on OS and PFS is minimal. The data for OS in all 3 model cohorts were immature; therefore, the treatment benefit of OS based on the analysis at the latest data cut-off date would have been subject to a certain degree of uncertainty. At the data cut-off date and across the model cohorts, ███ ██ ███ of the patients had received 1 or more subsequent antimyeloma therapies, which may influence the assessment of efficacy of talquetamab on OS and PFS. The clinical expert commented that it is reasonable to use of 10-point improvement from baseline value11 in the EORTC QLQ-C30 scores as the clinically meaningful improvement threshold in data analysis. The size of the HRQoL-evaluable population in phase II gradually decreased over time. At cycle 7 day 1, only ██ ██ ███ of all treated patients in cohort A, ██ ██ ██ in cohort C, and ██ ██ ██ in cohort B provided data for the EORTC QLQ-C30 assessment, which further increased risk of bias due to incomplete reporting or missing data for this outcome.
There is a lack of ethnic diversity in the MonumenTAL-1 study, as most patients were white (86% to 90% across the cohorts); the next largest groups by ethnicity were Black or African American (6% to 8%) and Asian (1% to 4%). Previous studies in the US have found that MM is twice as common in African American individuals than in white or Asian individuals.7,12 The clinical expert pointed out that the patients in the MonumenTAL-1 study were generally younger and had less severe disease than the patients with r/r MM seen in clinical practice in Canada. These factors may potentially impact the generalizability of the study results, although the extent of such influence is uncertain.
GRADE Summary of Findings and Certainty of the Evidence
Methods for Assessing the Certainty of the Evidence
For the pivotal studies and randomized controlled trials identified in the sponsor’s systematic review, the Grading of Recommendations Assessment, Development, and Evaluation (GRADE) framework was used to assess the certainty of the evidence for the outcomes considered most relevant to inform the review team’s expert committee deliberations, and a final certainty rating was determined as outlined by the GRADE Working Group.13,14 Although GRADE guidance is not available for noncomparative studies, the review team assessed pivotal single-arm trials for study limitations (which refers to internal validity or risk of bias), inconsistency across studies, indirectness, and publication bias to present these important considerations. Because the lack of a comparator arm does not allow for a conclusion to be drawn on the effect of the intervention versus any comparator, the certainty of evidence for single-arm trials started at very low certainty with no opportunity for rating up.
The selection of outcomes for GRADE assessment was based on the sponsor’s summary of clinical evidence, consultation with the clinical expert, and input received from patient and clinician groups and public drug plans. The following list of outcomes was finalized in consultation with expert committee members: OS, PFS, ORR, DOR, CR or better rate, EORTC QLQ-C30, and notable harms, for patients in model cohort A and model cohort C separately. The outcomes in model cohort B were not assessed using GRADE due to the small sample size and the exploratory nature of that cohort.
Results of GRADE Assessments
Table 2 presents the GRADE summary of findings for talquetamab in adult patients with r/r MM who have received at least 3 prior lines of therapy, including a PI, an IMiD, and an anti-CD38 monoclonal antibody, and have experienced disease progression on or after the last therapy.
Table 2: Summary of Findings for Talquetamab in Adult Patients With Refractory or Relapsed Multiple Myeloma
Outcome and follow-up | Patients (studies), N | Effect | Certainty | What happens |
|---|---|---|---|---|
OS | ||||
OS Median follow-up, months: 18.8 (range, 0.5a to 32.9) | 143 (1 single-arm trial: model cohort A) | Median OS, months: NE (95% CI, 25.6 to NE) OS probability:
| Very lowb | The evidence is very uncertain about the effect of talquetamab 0.4 mg/kg weekly SC on OS when compared with any comparator. |
OS Median follow-up, months: 12.7 (range, 0.2a to 26.1) | 145 (1 single-arm trial: model cohort C) | Median OS, months: NE (95% CI, 20.1 to NE) OS probability:
| Very lowb | The evidence is very uncertain about the effect of talquetamab 0.8 mg/kg q.2.w. SC on OS when compared with any comparator. |
PFS | ||||
PFS Median follow-up, months: 18.8 (range, 0.5a to 32.9) | 143 (1 single-arm trial: model cohort A) | Median PFS, months: 7.5 (95% CI, 5.7 to 9.4) PFS probability:
| Very lowb | The evidence is very uncertain about the effect of talquetamab 0.4 mg/kg weekly SC on PFS when compared with any comparator. |
PFS Median follow-up, months: 12.7 (range, 0.2a to 26.1) | 145 (1 single-arm trial: model cohort C) | Median PFS, months: 14.2 (95% CI, 9.6 to NE) PFS probability:
| Very lowb | The evidence is very uncertain about the effect of talquetamab 0.8 mg/kg q.2.w. SC on PFS when compared with any comparator. |
ORR | ||||
ORR (sCR, CR, VGPR, or PR) Median follow-up, months: 18.8 (range, 0.5a to 32.9) | 143 (1 single-arm trial: model cohort A) | ORR (sCR, CR, VGPR, or PR) events at data cut-off date: 741 per 1,000 (95% CI, 661 to 811 per 1,000) | Very lowb | The evidence is very uncertain about the effect of talquetamab 0.4 mg/kg weekly SC on ORR when compared with any comparator. |
ORR (sCR, CR, VGPR, or PR) Median follow-up, months: 12.7 (range, 0.2a to 26.1) | 145 (1 single-arm trial: model cohort C) | ORR (sCR, CR, VGPR, or PR) events at data cut-off date: 717 per 1,000 (95% CI, 637 to 789 per 1,000) | Very lowb | The evidence is very uncertain about the effect of talquetamab 0.8 mg/kg q.2.w. SC on ORR when compared with any comparator. |
DOR among patients who experience a PR or betterc | ||||
DOR Median follow-up, months: 18.9 (range, 2.7 to 32.9) | 106 (1 single-arm trial: model cohort A) | Median DOR, months: 9.5 (95% CI, 6.7 to 13.3) DOR event-free probability:
| Very lowb | The evidence is very uncertain about the effect of talquetamab 0.4 mg/kg weekly SC on DOR when compared with any comparator. |
DOR Median follow-up, months: 12.9 (range, 4.1 to 29.0) | 104 (1 single-arm trial: model cohort C) | Median DOR, months: NE (95% CI, 13.0 to NE) DOR event-free probability:
| Very lowb | The evidence is very uncertain about the effect of talquetamab 0.8 mg/kg q.2.w. SC on DOR when compared with any comparator. |
CR or better rate | ||||
CR or better (sCR or CR) Median follow-up, months: 18.8 (range, 0.5a to 32.9) | 143 (1 single-arm trial: model cohort A) | CR or better (sCR or CR) events at data cut-off date: 336 per 1,000 (95% CI, 259 to 419 per 1,000) | Very lowb | The evidence is very uncertain about the effect of talquetamab 0.4 mg/kg weekly SC on the CR or better rate when compared with any comparator. |
CR or better (sCR or CR) Median follow-up, months: 12.7 (range, 0.2a to 26.1) | 145 (1 single-arm trial: model cohort C) | CR or better (sCR or CR) events at data cut-off date: 386 per 1,000 (95% CI, 307 to 471 per 1,000) | Very lowb | The evidence is very uncertain about the effect of talquetamab 0.8 mg/kg q.2.w. SC on the CR or better rate when compared with any comparator. |
Health-related quality of lifed | ||||
Proportion of patients with a 10-point improvement in EORTC QLQ-C30 score Time point: cycle 7 day 1 | ██ (1 single-arm trial: phase II cohort A) | Pain: ███ per 1,000 Fatigue: ███ per 1,000 GHS: ███ per 1,000 Physical functioning: ███ per 1,000 | Very lowb,e | The evidence is very uncertain about the effect of talquetamab 0.4 mg/kg weekly SC on EORTC QLQ-C30 pain, fatigue, GHS, and physical functioning scores when compared with any comparator. |
Proportion of patients with a 10-point improvement in EORTC QLQ-C30 score Time point: cycle 7 day 1 | ██ (1 single-arm trial: phase II cohort C) | Pain: ███ per 1,000 Fatigue: ███ per 1,000 GHS: ███ per 1,000 Physical functioning: ███ per 1,000 | Very lowb,e | The evidence is very uncertain about the effect of talquetamab 0.8 mg/kg q.2.w. SC on EORTC QLQ-C30 pain, fatigue, GHS, and physical functioning scores when compared with any comparator. |
Notable harms | ||||
Notable harms Median follow-up, months: 18.8 (range, 0.5a to 32.9) | 143 (1 single-arm trial: phase I/II model cohort A) | CRS: 790 per 1,000 ICANS: 107 per 1,000 Infection: 587 per 1,000 | Very lowb | The evidence is very uncertain about the effect of talquetamab 0.4 mg/kg weekly SC on CRS, ICANS, and infection when compared with any comparator. |
Notable harms Median follow-up, months: 12.7 (range, 0.2a to 26.1) | 145 (1 single-arm trial: phase I/II model cohort C) | CRS: 745 per 1,000 ICANS: 110 per 1,000 Infection: 662 per 1,000 | Very lowb | The evidence is very uncertain about the effect of talquetamab 0.8 mg/kg q.2.w. SC on CRS, ICANS, and infection when compared with any comparator. |
CI = confidence interval; CR = complete response; CRS = cytokine release syndrome; DOR = duration of response; EORTC QLQ-C30 = European Organisation for Research and Treatment of Cancer Quality of Life Questionnaire Core 30; GHS = global health status; ICANS = immune effector cell–associated neurotoxicity syndrome; NE = not estimable; ORR = overall response rate; OS = overall survival; PFS = progression-free survival; PR = partial response; q.2.w. = every 2 weeks; SC = subcutaneous; sCR = stringent complete response; VGPR = very good partial response.
Notes: Study limitations (which refers to internal validity or risk of bias), indirectness, and publication bias were considered when assessing the certainty of the evidence. All serious concerns in these domains that led to the rating down of the level of certainty are documented in the table footnotes. The data presented in this table are based on analyses at the clinical cut-off date of January 17, 2023, for the all-treated analysis set and for patients who received the recommended phase II dose. Model cohort A included patients who had not received prior T-cell redirection therapy and who were treated at the recommended phase II dose of 0.4 mg/kg weekly SC in phase I and phase II of the MonumenTAL-1 study. Model cohort C included patients who had not received prior T-cell redirection therapy and who were treated at the recommended phase II dose of 0.8 mg/kg q.2.w. SC in phase I and phase II of the MonumenTAL-1 study.
aFollowing this value, there was a “+” symbol, denoting patients who died, in the sponsor’s submission.
bIn the absence of a comparator arm, conclusions about efficacy relative to any comparator cannot be drawn, and the certainty of evidence started at very low without the opportunity to rate up.
cDOR was calculated as the number of months from first documented response to progression or death due to any cause. The number of events referred to the number of patients who experienced a PR or better who experienced disease progression or died due to any cause.
dMeasured using EORTC QLQ-C30: 0 (best) to 100 (worst) for pain and fatigue; 0 (worst) to 100 (best) for GHS and physical functioning.
eRated down 2 levels for very serious risk of bias due to the open-label nature of the study and the subjective nature of the outcome (patient reported). There were substantial missing outcome data at cycle 7 day 1 (data were available for ██ ██ ██ patients compared to ███ patients at baseline for phase II cohort A, and data were available for ██ patients compared ██ ██ ██ patients at baseline for phase II cohort C for EORTC QLQ-C30 scales of pain, fatigue, GHS, and physical functioning).
Source: Clinical Study Report for MonumenTAL-1 (2023).15 The details included in the table are from the sponsor’s summary of clinical evidence.
Long-Term Extension Studies
There are no longer-term extension studies evaluating talquetamab for adults with r/r MM who have received at least 3 prior lines of therapy, including a PI, an IMiD, and an anti-CD38 monoclonal antibody, and who have experienced disease progression on the last therapy. Long-term follow-up of the MonumenTAL-1 trial is currently under way.16,17
Indirect Comparisons
The sponsor provided nonrandomized comparative studies, which are summarized and appraised in the section on studies addressing gaps in the evidence from the systematic review.
Studies Addressing Gaps in the Evidence From the Systematic Review
Description of Studies
Three nonrandomized studies compared talquetamab in the MonumenTAL-1 trial to real-world physician’s choice of therapy (RWPC) in the LocoMMotion and MoMMent trials, to teclistamab in the MajesTEC-1 trial, and to cilta-cel in the CARTITUDE-1 trial to evaluate differences in ORR, CR or better rate, very good partial response (VGPR) or better rate, DOR, PFS, time to next treatment (TTNT), and OS. Each study separately compared MonumenTAL-1 study cohorts A and C, which received different dosing schedules of talquetamab (0.4 mg/kg weekly SC and 0.8 mg/kg every 2 weeks SC), to their respective cohorts. All included patients met similar key eligibility criteria, including specific serum or urine M-protein levels, an ECOG Performance Status of 0 to 2, receipt of at least 3 prior lines of therapy, and documented disease progression within 12 months of the last therapy. Using individual patient data (IPD) from each arm, propensity scores were derived through multivariable logistic regression to reduce the impact of bias due to confounding. Comparative efficacy was assessed using logistic regression for binary outcomes and Cox proportional hazards models for time-to-event outcomes. Sensitivity analyses included various weighting methods and propensity score matching, with e-values reported to estimate the impact of residual confounding. The studies aimed to determine the comparative effectiveness of talquetamab versus RWPC, teclistamab, and cilta-cel in treating r/r MM.
Efficacy Results
The studies comparing talquetamab to RWPC demonstrated that talquetamab improved ORR, PFS, OS, and TTNT in patients with triple-class exposed r/r MM. For the talquetamab 0.4 mg/kg weekly SC dosage, the adjusted response rate ratio for ORR was 2.67 (95% CI, 1.90 to 3.74; P < 0.0001). For the talquetamab 0.8 mg/kg every 2 weeks SC dosage, the adjusted response rate ratio for ORR was 2.62 (95% CI, 1.86 to 3.69; P < 0.0001). For PFS, the adjusted hazard ratio (HR) for the 0.4 mg/kg weekly dosage was 0.52 (95% CI, 0.39 to 0.71; P < 0.0001) and for the 0.8 mg/kg every 2 weeks dosage it was 0.40 (95% CI, 0.29 to 0.56; P < 0.0001). TTNT had an adjusted HR of 0.48 (95% CI, 0.36 to 0.64; P < 0.0001) for the 0.4 mg/kg weekly dosage and 0.39 (95% CI, 0.29 to 0.54; P < 0.0001) for the 0.8 mg/kg every 2 weeks dosage. Additionally, the DOR results favoured the talquetamab 0.8 mg/kg every 2 weeks dosage (HR = 0.43; 95% CI, 0.26 to 0.72; P = 0.0015).
When comparing talquetamab to teclistamab, talquetamab was favoured in ORR and OS but not in DOR or PFS. For the talquetamab 0.4 mg/kg weekly SC dosage, the adjusted response rate ratio for ORR was ████ ████ ███ █████ █████ ████████. For the talquetamab 0.8 mg/kg every 2 weeks SC dosage, the adjusted response rate ratio for ORR was ████ ████ ███ █████ █████ █████████. However, the adjusted HR for DOR was ████ ████ ███ █████ █████ ████████ for the 0.4 mg/kg weekly SC dosage, indicating that teclistamab was favoured. The HRs for PFS and TTNT showed no exclusion of the null between the treatments, while the adjusted HRs for OS in the 0.4 mg/kg weekly SC cohort were ████ ████ ███ █████ █████ █████████ and in the 0.8 mg/kg every 2 weeks SC cohort were ████ ████ ███ █████ █████ █████████.
In the comparison of talquetamab to cilta-cel, cilta-cel was favoured in ORR. For the talquetamab 0.4 mg/kg weekly SC dosage, the adjusted response rate ratio for ORR was ████ ████ ███ █████ █████ █████████. For the talquetamab 0.8 mg/kg every 2 weeks SC dosage, the adjusted response rate ratio was ████ ████ ███ █████ █████ █████████. Cilta-cel was also favoured in DOR, with an adjusted HR of ████ ████ ███ █████ █████ █████████ for the talquetamab 0.4 mg/kg weekly SC dosage, while the talquetamab 0.8 mg/kg every 2 weeks SC dosage ████ ███ █ ████ ██ ██████ ███ ████ ████ █████ ███ ███ █████ █████ ████████. In terms of PFS, the adjusted HR was ████ ████ ███ █████ █████ █████████ for the 0.4 mg/kg weekly SC dosage and ████ ████ ███ █████ █████ █████████ for the 0.8 mg/kg every 2 weeks SC dosage. ███ ███ ███ ███ ████████ ███ █████ ████ ████████ ███ ██ ████ ████ ███ █████ █████ █████████ ███ ████ ████ ███ █████ █████ █████████. Cilta-cel delayed the TTNT, with adjusted ███ ██ ████ ████ ███ █████ █████ █████████ for the talquetamab 0.4 mg/kg weekly SC dosage and ████ ████ ███ █████ █████ █████████ for the talquetamab 0.8 mg/kg every 2 weeks SC dosage.
Additionally, the observed CR or better rate for talquetamab in the 0.4 mg/kg weekly SC cohort was █████, versus ████ in the RWPC cohort, with an adjusted response rate ratio of █████ ████ ███ █████ ███████ █████████. For the 0.8 mg/kg every 2 weeks SC cohort, the CR or better rate was 38.6%, versus 0.6% in the RWPC cohort, with an adjusted r/r of ██████ ████ ███ █████ ████████ █████████. When compared to cilta-cel, talquetamab showed lower CR or better rates (█████ and █████ versus cilta-cel’s █████), with adjusted response rate ratios of ████ ████ ███ █████ █████ █████████ and ████ (███ ███ █████ █████ ████████), respectively, indicating that patients receiving cilta-cel were significantly more likely to experience CR or better.
Harms Results
Harms were not assessed in the nonrandomized studies.
Critical Appraisal
The 3 nonrandomized studies of talquetamab versus RWPC, teclistamab, and cilta-cel used IPD with inverse probability treatment weighting (IPTW) and average treatment effect in the treated (ATT) weighting to mitigate heterogeneity in prognostic factors, matching the MonumenTAL-1 trial criteria and outcome definitions. Despite these efforts, significant limitations remain, such as the lack of a predefined protocol and the lack of a systematic review for comparator data selection, resulting in a risk of selection bias and selective reporting, as well as unaddressed quality issues in the included studies. Pooling data from the LocoMMotion and MoMMent trials in the RWPC comparison without accounting for variability may have introduced bias or obscured differences that may have existed across the studies. The identification of prognostic factors relied on expert opinion without a systematic approach, and important factors like cytogenetic risk were excluded due to missing data, increasing the risk of residual confounding. The imputation of data for cytogenic risk as “missing” in sensitivity analyses is not able to fully account for the impact of this prognostic variable, had it been measured. After weighting, imbalances in some key prognostic variables remained in the RWPC and cilta-cel comparisons. Unknown confounders, methodological differences across studies (for the RWPC comparison) and potential deviations from the proportional hazards assumption further complicate the interpretation of the findings. Generalizability issues arise from outdated RWPC interventions and the inherent limitations in the clinical trial data (including that patients in the MonumenTAL-1 study were younger and fitter than in other trials and lacked ethnic diversity). The absence of safety or HRQoL measures also limits a comprehensive understanding of the treatments’ comparative effectiveness and safety.
Conclusions
One ongoing, phase I/II, single-arm, open-label study (MonumenTAL-1) provided evidence on the efficacy and safety of talquetamab for patients with r/r MM who have received at least 3 prior lines of therapy. The evidence for the treatment effect of talquetamab from the MonumenTAL-1 trial is very uncertain due to the single-arm design, which is not intended to be confirmatory of efficacy. The findings for ORR were clinically meaningful and durable according to the clinical expert consulted by the review team and can be attributed to talquetamab (rather than natural history or other factors) despite the single-arm design. However, causal conclusions regarding time-to-event end points were not possible given the lack of a comparator group, though the clinical expert indicated that based on the natural history of the disease and experience in clinical practice, the OS and PFS findings observed in the MonumenTAL-1 study appear promising in patients who have not had prior exposure to a T-cell redirection therapy at either the 0.4 mg/kg weekly SC or 0.8 mg/kg every 2 weeks SC dosing. The results for HRQoL were inconclusive due to the trial’s open-label design and the considerable amount of missing outcome data. Notable harms in the MonumenTAL-1 study, including CRS, ICANS, and infections, were consistent with the known safety profile of the drug.
Three nonrandomized studies assessed the efficacy of talquetamab against RWPC, teclistamab, and cilta-cel, using IPD with IPTW and ATT weights to reduce the impact of confounding. All these comparisons were impacted by methodological limitations, including a lack of predefined systematic review protocol, no systematic procedure for the identification of comparator studies, lack of quality assessment, lack of clarity on the appropriateness of pooling data from the LocoMMotion and MoMMent trials for the RWPC comparison, and a risk of bias due to residual confounding (particularly for comparisons to RWPC and cilta-cel). Nonetheless, the evidence suggested a benefit of talquetamab for all measured outcomes compared to RWPC. Though this comparison was the most impacted by the aforementioned limitations, the magnitude of the estimated benefit across multiple outcomes seems unlikely to be fully accounted for by these limitations. The true magnitude of the difference is less clear, and the relevance of this comparison was diminished by the mix of treatments included in the RWPC arm, many of which may not be widely used in current practice. Results for talquetamab versus teclistamab were inconsistent across outcomes, in many cases with CIs crossing the null, which caused uncertainty about which drug might be favoured. The evidence suggested that cilta-cel may have ████ ██████████ ████ ████ ███ ███ than the 0.4 mg/kg weekly dosage of talquetamab. Potential differences between treatments were uncertain for the 0.8 mg/kg every 2 weeks cohort, where only tumour response results excluded the null. The effect estimates were ███ █████████ ██ ████████ █████ ███ ██████████ ██ ██ between talquetamab and cilta-cel for any dose comparison. No comparative evidence for HRQoL or harms was available.
Introduction
The objective of this report is to review and critically appraise the evidence submitted by the sponsor on the beneficial and harmful effects of talquetamab at 0.4 mg/kg of body weight, administered subcutaneously once weekly after receiving step-up doses of 0.01 mg/kg and 0.06 mg/kg of body weight, or at 0.8 mg/kg of body weight, administered subcutaneously every 2 weeks after receiving step-up doses of 0.01 mg/kg, 0.06 mg/kg, and 0.4 mg/kg of body weight, for the treatment of adult patients with r/r MM who have received at least 3 prior lines of therapy, including a PI, an IMiD, and an anti-CD38 monoclonal antibody, and have experienced disease progression on or after the last therapy.
Disease Background
The contents of this section have been informed by materials submitted by the sponsor and by clinical expert input. The following has been summarized and validated by the review team.
MM is a plasma cell cancer characterized by clonal proliferation of malignant plasma cells (B cells) and overproduction of the abnormal immunoglobulin M protein.1 Older individuals and males (as opposed to females) are more likely to develop MM, and it is twice as common in African American individuals than in Caucasian or Asian individuals in the US.7,12 In Canada in 2023, an estimated 3,900 individuals were diagnosed with MM and approximately 1,700 deaths due to MM occurred.2 The 5-year survival rate for people with MM is estimated to be approximately 50%,3 and although survival rates have improved in recent years due to advances in therapeutic options, MM remains incurable.4,5 The majority of patients with MM experience relapse, and many patients will cease to experience response to commonly used therapies.6 Patients with r/r MM often undergo multiple rounds of treatment, with the duration of remission, depth of response, PFS, and OS decreasing with each subsequent line of therapy.7
The most common symptoms of MM are fatigue and bone pain,7 with other symptoms including kidney conditions, recurrent infections, fever, and nervous system conditions.18 Disease stage, along with other factors, can impact MM prognosis. Commonly recognized factors that impact the prognosis of MM include beta2-microglobulin (high levels are associated with poor prognosis), serum albumin (low levels are associated with poor prognosis), lactate dehydrogenase (LDH) (high activity is predictive of poor prognosis), and chromosomal changes (shorter remission duration is associated with chromosome deletions or translocations).19 In addition to these factors, prognosis may be influenced by patient age, creatinine levels, and performance status. In general, patients older than 80 years, those with high creatinine levels, and those with poor overall function tend to have worse outcomes than younger individuals, those with lower creatinine levels, and those with better overall function.20
Diagnosis of MM typically occurs during a visit to a primary care physician, occurring either incidentally when laboratory tests for other conditions are ordered or, if MM is suspected, based on signs and symptoms.21 Diagnosis of MM is based on the presence of 1 or more myeloma-defining events, along with either 10% or more clonal bone marrow plasma cells or biopsy-proven plasmacytoma.7 Myeloma-defining events include the presence of end-organ damage known as the CRAB criteria (hypercalcemia, renal insufficiency, anemia, and bone lesions), along with 3 specific biomarkers: clonal bone marrow plasma cell percentage of 60% or more, free light chain ratio of 100 or more, and more than 1 focal lesion on MRI studies.7
Several systems are used for staging MM: the International Staging System (ISS), the R-ISS, and the Durie-Salmon staging system.1,22,23 The ISS is commonly used in Canada and uses blood tests that assess albumin levels and beta2-microglobulin levels to stage MM (advanced-stage MM is associated with lower albumin and higher beta2-microglobulin levels):22
Stage I: beta2-microglobulin less than 3.5 mg/L and serum albumin greater than or equal to 3.5 g/dL
Stage II: beta2-microglobulin less than 3.5 mg/L and serum albumin less than 3.5 g/dL, or beta2-microglobulin 3.5 mg/L to 5.5 mg/L, irrespective of serum albumin
Stage III: beta2-microglobulin greater than 5.5 mg/L.
The preferred staging system for MM is the R-ISS,23 which combines elements of tumour burden (ISS) and disease biology (presence of high-risk cytogenetic abnormalities or elevated LDH level) to create a unified prognostic index that helps in clinical care as well as in comparison of clinical trial data. R-ISS uses serum beta2-microglobulin, serum albumin, serum LDH, and bone marrow fluorescence in situ hybridization results to stratify patients into 3 risk groups:22,23
Stage I: beta2-microglobulin less than 3.5 mg/L; serum albumin greater than or equal to 3.5g/dL; normal LDH; and no del(17p), t(4;14), t(14;16) by fluorescence in situ hybridization
Stage II: neither stage I nor stage III
Stage III: beta2-microglobulin greater than or equal to 5.5 mg/L; elevated LDH; and/or del(17p), t(4;14), t(14;16) by fluorescence in situ hybridization.
According to the IMWG criteria, a patient is considered to have refractory MM when they do not experience response to therapy or experience disease progression within 60 days of their last line of therapy.24,25 A patient is considered to have relapsed MM if they experience disease progression after being previously treated and require a salvage therapy but do not meet the criteria for primary refractory MM or r/r MM.24,25 A patient is considered to have r/r MM if they have experienced a minimal response or better at some point during previous treatments but the disease is currently nonresponsive on salvage therapy or if they experience disease progression within 60 days of their last therapy.24,25
Standards of Therapy
The contents of this section have been informed by materials submitted by the sponsor and by clinical expert input. The following has been summarized and validated by the review team.
The clinical expert and clinician groups consulted for this review pointed out that the key treatment goals for patients with r/r MM are to delay progression, control the disease and associated symptoms, and prolong OS.26 The choice of therapy depends on eligibility for autologous stem cell transplant at diagnosis, patient age, comorbidities, weakness, cytogenetics, previous treatments, response to prior therapy, prior toxicities, and line of therapy.5,7
According to the American Society of Clinical Oncology and CCO Joint Clinical Practice Guideline, generally, the second-line treatment options available to a patient with r/r MM depend on their response to the therapy received in the first line, and the third-line treatment options depend on their response to the therapy received in the second line.27 According to the Provisional Funding Algorithm for Multiple Myeloma developed by CADTH,8 patients with drug resistance cannot be treated again with the same drug, except for dexamethasone, which is found in all regimens. Depending on drug sensitivity, patients can be treated with Kd or Pd in combination with isatuximab, carfilzomib-lenalidomide-dexamethasone, lenalidomide-dexamethasone, daratumumab-lenalidomide-dexamethasone, or daratumumab-bortezomib-dexamethasone. Alternative regimens with a different PI or immunomodulator backbone can be used in the third and fourth lines, depending on drug sensitivity. Cyclophosphamide may be added to some regimens, such as Pd, Kd, and lenalidomide-dexamethasone. There is no preferred standard of care for the treatment of r/r MM in the fourth line and beyond, and at this stage of the disease patients may be exposed to PIs, IMiDs, and anti-CD38 monoclonal antibodies, in some cases receiving more than 1 PI or IMiD, further limiting treatment options in later lines of therapy.8,27
Recent recommendations by the pan-Canadian Oncology Drug Review Expert Committee to reimburse drugs to treat triple-class exposed r/r MM (and have demonstrated disease progression on the last therapy) include Kd,28 Pd,29 selinexor-bortezomib-dexamethasone,30 cilta-cel,31 teclistamab,32 and elranatamab.33 According to the CADTH provisional funding algorithm for MM,8 selinexor-bortezomib-dexamethasone is recommended for third-line therapy and beyond in patients who are sensitive to bortezomib but not to anti-CD38 monoclonal antibodies and lenalidomide. In Canada, coverage for Pd with or without cyclophosphamide and for Kd with or without cyclophosphamide is determined on a case-by-case basis, while cilta-cel is under consideration for negotiation at the pan-Canadian Pharmaceutical Alliance.34
Drug Under Review
The key characteristics of talquetamab are summarized in Table 3, along with those of other options available for the treatment of adult patients with r/r MM in fourth-line therapy and beyond, as indicated in CADTH’s provisional funding algorithm.8
Talquetamab is indicated for the treatment of adult patients with r/r MM who have received at least 3 prior lines of therapy, including a PI, an IMiD, and an anti-CD38 monoclonal antibody, and have experienced disease progression on or after the last therapy. The reimbursement request aligns with the Health Canada indication.35
Talquetamab, a first-in-class bispecific antibody that targets a novel antigen, binds to both GPRC5D (on MM cells) and CD3 receptors (on T cells).36 Talquetamab recruits and activates CD3-positive T cells to induce killing of GPRC5D-expressing myeloma cells.36
Talquetamab is administered as a weekly or biweekly SC injection. The recommended dosage for talquetamab is 0.4 mg/kg of body weight once weekly after receiving step-up doses of 0.01 mg/kg and 0.06 mg/kg of body weight, or 0.8 mg/kg of body weight every 2 weeks after receiving step-up doses of 0.01 mg/kg, 0.06 mg/kg, and 0.4 mg/kg of body weight.35
Table 3: Key Characteristics of Pharmacotherapies for Multiple Myeloma
Characteristics | Talquetamab | Teclistamab | Cilta-cel | Selinexor | PIs (carfilzomib) | Immunomodulatory drugs (pomalidomide) |
|---|---|---|---|---|---|---|
Mechanism of action | A bispecific antibody targeting a novel antigen, binding to both GPRC5D (on MM cells) and CD3 receptors (on T cells). Talquetamab recruits and activates CD3-positive T cells to induce killing of GPRC5D-expressing myeloma cells. | A bispecific antibody targeting both BCMA (present on MM cells) and CD3 receptors (present on T cells). Teclistamab redirects CD3-positive T cells to BCMA-expressing myeloma cells to induce killing of tumour cells. | BCMA-directed genetically modified autologous CAR T-cell immunotherapy. | Compound that specifically blocks XPO1, a nuclear export protein that transports cargo proteins within the cell. XPO1 inhibition by selinexor leads to reduction of cancer cells. | Proteasome inhibition leads to accumulation of misfolded protein in endoplasmic reticulum, resulting in apoptosis and inhibition of cell proliferation. | Immunomodulatory and antineoplastic activity; inhibits proliferation and induces apoptosis of hematopoietic tumour cells. |
Indicationa | For the treatment of adult patients with relapsed or refractory multiple myeloma who have received at least 3 prior lines of therapy, including a proteasome inhibitor, an immunomodulatory drug and an anti-CD38 monoclonal antibody, and have demonstrated disease progression on or after the last therapy. | For treatment of adult patients with relapsed or refractory multiple myeloma who have received at least 3 prior lines of therapy, including a PI, an IMiD and an anti-CD38 mAb. | For the treatment of adult patients with MM, who have received at least 3 prior lines of therapy, including a PI, an IMiD and an anti-CD38 antibody, and who are refractory to their last treatment. | In combination with bortezomib and dexamethasone for the treatment of adult patients with MM who have received at least 1 prior therapy. | In combination with dexamethasone, for patients with relapsed MM who have received 1 to 3 prior lines of therapy. | In combination with dexamethasone for patients with MM for whom both bortezomib and lenalidomide have failed and who have received at least 2 prior regimens and demonstrated disease progression on the last regimen. |
Route of administration | SC injection | SC injection | IV infusion | Oral | IV infusion | Oral |
Recommended dosing | Weekly schedule: 0.4 mg/kg of body weight weekly after receiving step-up doses of 0.01 mg/kg and 0.06 mg/kg of body weight Biweekly schedule: 0.8 mg/kg of body weight every 2 weeks after receiving step-up doses of 0.01 mg/kg, 0.06 mg/kg, and 0.4 mg/kg of body weight | 1.5 mg/kg of body weight weekly after receiving step-up doses of 0.06 mg/kg and 0.3 mg/kg of body weight | Single infusion of 0.5 × 10⁶ to 1.0 × 10⁶ CAR-positive viable T cells per kilogram of body weight |
|
|
|
Serious adverse effects or safety issues | Cytokine release syndrome; neurologic toxicities, including ICANS; depressed level of consciousness; oral toxicities, including dysgeusia, dry mouth, dysphagia, and stomatitis; treatment-emergent grade 3 or 4 neutropenia, febrile neutropenia, or thrombocytopenia; hypogammaglobulinemia; serious infections | Cytokine release syndrome; neurologic toxicity, including ICANS; hypogammaglobinemia; cytopenias; injection-side infections | Cytokine Release syndrome; neurologic toxicities, including ICANS; hemophagocytic lymphohistiocytosis or macrophage activation syndrome | Fatigue; severe, or life-threatening hyponatremia; nausea; vomiting; diarrhea; anorexia or weight loss; thrombocytopenia; neutropenia; infections; dizziness; cataracts | Infusion reactions; TLS infections; cardiac disorders; venous thrombosis; hypertension; hemorrhage; thrombocytopenia; hepatoxicity; hepatitis B reactivation; posterior reversible encephalopathy syndrome; PML; acute renal failure; pulmonary toxicity | Neutropenia, thrombocytopenia; infections; DVT and pulmonary embolism; hepatoxicity, anaphylaxis; hepatitis B reactivation; severe rash (SJS, TEN, DRESS); tumour lysis syndrome |
Other | None | None | None | Currently under negotiations | Premedication for carfilzomib with the recommended dose of dexamethasone (at least 30 minutes prior) to reduce incidence and severity of infusion reactions | Antithrombotic prophylaxis recommended |
BCMA = B-cell maturation antigen; cilta-cel = ciltacabtagene autoleucel DRESS = drug reaction with eosinophilia and systemic symptoms; DVT = deep venous thrombosis; ICANS = immune effector cell–associated neurotoxicity syndrome; IMiD = immunomodulatory drug; Kd = carfilzomib-dexamethasone; mAb = monoclonal antibody; MM = multiple myeloma; PI = proteasome inhibitor; PML = progressive multifocal leukoencephalopathy; SC = subcutaneous; SJS = Stevens-Johnson syndrome; TEN = toxic epidermal necrolysis; TLS = tumour lysis syndrome.
aHealth Canada–approved indication.
Sources: Product monographs for talquetamab,35 teclistamab,37 ciltacabtagene autoleucel,38 selinexor,39 pomalidomide,32 and carfilzomib;40 Canadian Pharmacists Association.41
Patient Perspectives
Patient Group Input
This section was prepared by the review team based on the input provided by patient groups. The full original patient input(s) received by the review team have been included in this section of the report.
The review team received 1 patient group submission from Myeloma Canada, which conducted surveys with both patients and caregivers from April 17 to May 10, 2024, across Canada and internationally via email and social media. Eighty-six responses to the survey were received. Of these, 38 responses (32 patients and 6 caregivers; all from Canada except 1 patient) were recorded based on the eligibility criteria (patient has r/r MM and has received at least 3 prior lines of therapy, including a PI, an IMiD, and an anti-CD38 monoclonal antibody). Of these 38 respondents, 32 aligned with the proposed indication and would be eligible for the treatment under review (27 patients and 5 caregivers) and 6 had experience with the treatment (5 patients and 1 caregiver). Nineteen of those 32 eligible respondents indicated that they had received 3 prior lines of therapy, 9 indicated that they had received 4 lines, and 4 indicated that they had received 5 lines of therapy or more. In addition, 97% of the 32 respondents indicated that they or the people they cared for had received an autologous stem cell transplant to treat the myeloma.
Respondents to the survey indicated that infections were the most important aspect related to myeloma to control, followed by fatigue, kidney problems, and pain. The respondents noted that among the elements of daily activities and quality of life, the ability to travel was the most significantly impacted by the symptoms associated with myeloma, followed by the ability to exercise and to conduct volunteer activities. Sixteen of the 38 respondents identified travel costs as the most significant financial implication of myeloma treatment for the respondents and their households, followed by parking costs (n = 15); lost income or pension funds due to absence from work, disability, or early retirement (n = 10); drug costs (n = 10); and accommodation costs (n = 9). Respondents felt that interruption of life goals or accomplishments had the greatest impact on quality of life, followed by loss of sexual desire and anxiety or worry. Patient and caregiver respondents identified the following factors as the most important to myeloma treatment: quality of life, manageable side effects, effectiveness of treatment (especially experiencing remission and having a durable response), and treatment accessibility or portability (including fewer or minimal visits to the hospital or cancer centre).
In terms of treatment outcomes, 21 of the 31 respondents eligible for the treatment under review and provided response to the question rated improved quality of life as extremely important, 9 as very important, and 1 as somewhat important. In addition, 21 of the 32 respondents eligible for the treatment under review indicated that an estimated minimum 1 year of extended life at this stage of myeloma was extremely desirable, and 9 indicated it was very desirable. When asked about tolerance of the most common side effects in patients who had received talquetamab, respondents perceived ICANS, CRS, and infections to be the least tolerable side effects, followed by diarrhea and neutropenia.
Six respondents (5 patients and 1 caregiver) indicated having experience with talquetamab. Of these 6 respondents, 2 had experience with talquetamab as monotherapy and 4 had experience with talquetamab in combination with another drug. Five of the 6 respondents who had received or were currently receiving treatment with talquetamab for themselves or the people they cared for indicated that they were admitted to the hospital at some point in the initial step-up dosing period. The 6 respondents rated oral-related and nail-related issues as the least bearable of the most frequently experienced talquetamab side effects, followed by skin-related issues and infections. Most of the 6 respondents noted that the overall side effects while receiving talquetamab were manageable.
Clinician Input
Input From Clinical Expert Consulted by the Review Team
All review teams include at least 1 clinical specialist with expertise in the diagnosis and management of the condition for which the drug is indicated. Clinical experts are a critical part of the review team and are involved in all phases of the review process (e.g., providing guidance on the development of the review protocol, assisting in the critical appraisal of clinical evidence, interpreting the clinical relevance of the results, and providing guidance on the potential place in therapy). The following input was provided by 1 clinical specialist with expertise in the diagnosis and management of MM.
Unmet Needs
The clinical expert consulted for this review noted that fourth-line treatment for MM is challenging because there are limited available therapies. The clinical expert noted that cilta-cel is not currently available in Canada and that teclistamab is only available in Canada through a compassionate access program. The clinical expert indicated that patients with r/r MM are usually weak and that, therefore, tolerability of treatment is also important.
Place in Therapy
The clinical expert noted that talquetamab (a GPRC5D-targeted therapy) could be appropriate to be used as a fourth-line treatment for patients with r/r MM, being a potential treatment for patients who have received prior BCMA-directed therapy (e.g., belantamab, cilta-cel, teclistamab, or elranatamab) or for patients who have not previously received BCMA-targeted therapy. The clinical expert noted that patients treated with talquetamab would also be eligible for subsequent BCMA-targeted therapy.
Patient Population
The clinical expert noted that the patients best suited to talquetamab would be those who need a fourth-line treatment and have an adequate performance status and reasonable hematologic function based on complete blood count parameters. The clinical expert indicated that there is no biomarker to predict treatment response and no companion test is necessary; however, the treatment centre must have an appropriate setup for the monitoring and treatment of CRS. The clinical expert indicated that the treatment centre should also have access to infectious disease consultative services given the known risk of serious infection among patients with r/r MM who are treated with talquetamab. The clinical expert noted that although the MonumenTAL-1 study only included patients with an ECOG Performance Status of 2 or less, talquetamab could be used in patients with central nervous system disease that is controlled and in patients with plasma cell leukemia or amyloidosis.
Assessing the Treatment Response
The clinical expert indicated that treatment response is typically measured biochemically every 4 weeks. The clinical expert noted that meaningful outcomes would be improved survival, reduced disease-related symptoms, and improved patient-reported HRQoL.
Discontinuing Treatment
The clinical expert noted that the factors to be considered when deciding whether a patient should discontinue treatment with talquetamab include disease progression according to the standard IMWG response criteria9 and intolerable AEs (e.g., severe dysgeusia, severe myelosuppression).
Prescribing Considerations
The clinical expert noted that treatment with talquetamab should be initiated and supervised by a specialist (a hematologist or a medical oncologist with appropriate training). The clinical expert indicated that the first few doses of talquetamab treatment should be administered at a site with knowledge and expertise in managing CRS and that the subsequent doses could be administered in a community setting.
Clinician Group Input
This section was prepared by the review team based on the input provided by clinician groups. The full original clinician group input(s) received by the review team have been included in the input section of this report.
Input on the review of talquetamab was received from 2 clinician groups: CMRG and the OH-CCO Hematology Cancer Drug Advisory Committee. Thirty-two clinicians (25 from CMRG and 7 from the OH-CCO Hematology Cancer Drug Advisory Committee) provided input for this submission.
Both CMRG and the OH-CCO Hematology Cancer Drug Advisory Committee emphasized that the overall treatment goals are to delay progression, improve OS, control the disease and associated symptoms, minimize adverse effects, and improve quality of life. CMRG highlighted that myeloma remains incurable and that patients eventually cease to experience response to all available funded drugs. CMRG emphasized that the highest unmet need is in patients with advanced disease who have received multiple lines of treatment and have already received the 3 major classes of drugs: PIs, IMiDs, and anti-CD38 monoclonal antibodies. Another unmet need noted by the OH-CCO Hematology Cancer Drug Advisory Committee is to achieve ease of administration with talquetamab (i.e., SC injection and no need for apheresis) and a different target than other bispecific antibodies.
Both clinician groups agreed that talquetamab could be another option for patients with triple-class exposed or refractory disease. CMRG further stated that, currently, talquetamab would be used late in the lines of myeloma treatment (i.e., after failure of multiple drugs). CMRG added that talquetamab is not expected to impact the sequencing of drugs earlier in the disease course or lead to a major change in treatment algorithms before the disease becomes triple-class exposed or refractory. Both clinician groups emphasized that the availability of talquetamab will complement access to the recently endorsed T-cell redirection therapies.
CMRG indicated that patients with a good performance status, minimal or no comorbidities, relatively low tumour burden, adequate organ function, and satisfactory blood counts are the most likely to have the best outcomes with talquetamab. CMRG further noted that, overall, patients with poor disease-related prognostic factors, such as extramedullary myeloma and high-risk cytogenetics, should be eligible for talquetamab.
The OH-CCO Hematology Cancer Drug Advisory Committee highlighted that treatment responses with talquetamab are assessed using standard myeloma response measures as well as CRS and ICANS toxicity grading scales. CMRG elaborated that responses are based on the M-protein markers in the serum and/or urine, bone marrow biopsy, and in some instances imaging studies (IMWG). CMRG added that clinically meaningful responses usually correlate with at least a partial remission by IMWG consensus criteria, including improvement in symptoms (cessation of bone destruction with less pain, fractures, and need for radiotherapy), improvement in energy, and better ability to perform activities of daily living. Both CMRG and the OH-CCO Hematology Cancer Drug Advisory Committee agreed that treatment discontinuation should be based on ongoing efficacy or response, disease progression, and long-term tolerability or significant toxicities.
Given that prior exposure to anti-BCMA therapy does not preclude responsiveness to talquetamab, CMRG suggested that patients who had received prior anti-BCMA therapy or bispecific antibody treatment should be allowed access to talquetamab. The OH-CCO Hematology Cancer Drug Advisory Committee also noted that talquetamab might be helpful for patients who have previously received anti-BCMA treatment.
Drug Program Input
The drug programs provide input on each drug being reviewed through the review team’s reimbursement review processes by identifying issues that may impact the drug programs’ ability to implement a recommendation. The implementation questions and corresponding responses from the clinical expert consulted for this review are summarized in Table 4.
Table 4: Summary of Drug Plan Input and Clinical Expert Response
Drug program implementation questions | Clinical expert response |
|---|---|
Relevant comparators | |
MonumenTAL-1 is a phase I/II, open-label, multicentre, single-arm trial. Publicly funded relevant comparators include pomalidomide-dexamethasone with or without cyclophosphamide, carfilzomib-dexamethasone with or without cyclophosphamide, and selinexor-dexamethasone-bortezomib. Question to the clinical expert: How does the efficacy and safety of talquetamab compare to the publicly funded comparators? | This is addressed in the Clinical Review Report. |
There are relevant comparators under review or active negotiation at the time of this input (cilta-cel, teclistamab, and elranatamab). | This is a comment from the drug plans to inform pERC deliberations. |
Considerations for initiation of therapy | |
Phase II of the MonumenTAL-1 trial included 3 cohorts. Cohort B included patients who had previously been exposed to T-cell redirection therapies. Question to the clinical expert: 1. Should patients previously treated with BCMA-targeted therapy (e.g., cilta-cel, teclistamab, or elranatamab) be eligible for talquetamab, a GPRC5D-targeted therapy? 2. Should patients treated with talquetamab be eligible for BCMA-targeted therapy? | The clinical expert consulted for this review indicated that patients previously treated with BCMA-targeted therapy would be eligible for talquetamab and, likewise, patients treated with talquetamab would be eligible for BCMA-targeted therapy. |
Considerations for discontinuation of therapy | |
Patients with prolonged treatment interruptions may require readministration of step-up dosing, as per the product monograph. | This is a comment from the drug plans to inform pERC deliberations. |
Considerations for prescribing of therapy | |
Talquetamab must be administered according to a step-up dosing schedule to minimize the risk and severity of CRS and ICANS, with 2 options: weekly and biweekly. Weekly dosing option:
Biweekly dosing option:
Questions to the clinical expert: 1. When would the weekly dosing be appropriate compared to the biweekly dosing? 2. Is there evidence to support switching between the 2 dosing options once treatment has already been initiated? | The clinical expert commented that they would predict that most patients will eventually be on the biweekly dosing schedule after the initial step-up doses, for convenience. The review team and the clinical expert noted that there is no evidence on efficacy or safety for switching between the 2 dosing options once treatment with talquetamab has already been initiated. |
Talquetamab is administered via subcutaneous injection. IV access may still be required during treatment in case supportive care is required after administration. Question to the clinical expert: CRS and ICANS can occur with talquetamab. Can talquetamab be safely administered in the outpatient setting? | The clinical expert noted that, in their opinion, it is not yet deemed safe to administer the T-cell receptor therapy in an outpatient setting at most treatment sites. The clinical expert indicated that outpatient administration of talquetamab would require the treatment centre to have a day-hospital setup. |
The product monograph of talquetamab recommends that patients should remain in the proximity of a health care facility and be monitored for 48 hours after administration of all doses within the talquetamab step-up phase for signs and symptoms of CRS and ICANS. Alternatively, consider monitoring patients in hospital for 48 hours after each step-up dose. There would be an additional step-up dose given if the biweekly treatment regimen is chosen, prolonging the monitoring requirements. Jurisdictions may encounter capacity issues due to these monitoring and supportive care requirements. | This is a comment from the drug plans to inform pERC deliberations. |
Teclistamab and elranatamab are under consideration for funding for a similar indication. Question to the clinical expert: Should the reimbursement criteria for talquetamab be aligned with those for teclistamab and elranatamab? | The clinical expert commented that it would be reasonable for the reimbursement criteria for talquetamab to generally be aligned with those for teclistamab and elranatamab, if talquetamab is also recommended for reimbursement. |
Generalizability | |
The trial included patients with ECOG Performance Status ≤ 2. Question to the clinical expert: Should talquetamab be used in patients with the following:
| The clinical expert noted that patients with CNS disease that is controlled and patients with plasma cell leukemia or amyloidosis should be eligible for treatment with talquetamab. |
Question to the clinical expert: At the time of funding, should patients receiving alternative therapies (e.g., selinexor-bortezomib-dexamethasone) be eligible to switch to talquetamab? | The clinical expert noted that patients should not switch treatments if their current regimen is effective and not causing intolerable side effects. |
Funding algorithm (oncology only) | |
The drug plans noted that MM is a complex therapeutic space with multiple lines of therapy, subpopulations, and competing products. | This is a comment from the drug plans to inform pERC deliberations. |
As talquetamab is a novel GPRC5D-targeted drug, there may be interest in sequencing it with BCMA-targeted therapies. Question to the clinical expert: Under what circumstances would talquetamab be prescribed over cilta-cel or teclistamab or elranatamab? | The clinical expert noted that talquetamab would likely be prescribed over cilta-cel, teclistamab, or elranatamab in patients who have had a prior BCMA-directed therapy. |
Care provision issues | |
Talquetamab vial sizes are 3 mg in 1.5 mL solution (used for step-up doses 1 and 2) and 40 mg in 1 mL solution (used for all remaining doses). Drug wastage would be incurred due to the step-up and mg/kg dosing. There is a risk of medication error with 2 different concentrations. The drug may need to be initiated in the inpatient setting, in which case the drug cost would be outside of the drug program budget in some provinces. | This is a comment from the drug plans to inform pERC deliberations. |
CRS and ICANS can occur with talquetamab. The funding of tocilizumab needs to be incorporated as part of any implementation to ensure that sites have tocilizumab available to manage CRS and ICANS. Other therapies (i.e., anakinra) may be required to treat ICANS. | This is a comment from the drug plans to inform pERC deliberations. |
System and economic issues | |
There is concern about feasibility of adoption (budget impact and capacity), but there is uncertainty on what the uptake for talquetamab will be. | This is a comment from the drug plans to inform pERC deliberations. |
Confidential pricing exists for selinexor and carfilzomib. Generic pomalidomide is available. | This is a comment from the drug plans to inform pERC deliberations. |
BCMA = B-cell maturation antigen; cilta-cel = ciltacabtagene autoleucel; CNS = central nervous system; CRS = cytokine release syndrome; ECOG = Eastern Cooperative Oncology Group; ICANS = immune effector cell–associated neurotoxicity syndrome; MM = multiple myeloma; pERC = pan-Canadian Oncology Drug Review Expert Review Committee.
Clinical Evidence
The objective of the Clinical Review Report is to review and critically appraise the clinical evidence submitted by the sponsor on the beneficial and harmful effects of talquetamab administered subcutaneously at a dosage of 0.4 mg/kg of body weight once weekly after receiving step-up doses of 0.01 mg/kg and 0.06 mg/kg of body weight or at a dosage of 0.8 mg/kg of body weight every 2 weeks after receiving step-up doses of 0.01 mg/kg, 0.06 mg/kg, and 0.4 mg/kg of body weight for the treatment of adult patients with r/r MM who have received at least 3 prior lines of therapy, including a PI, an IMiD, and an anti-CD38 monoclonal antibody, and have experienced disease progression on or after the last therapy. The focus will be placed on comparing talquetamab to relevant comparators and identifying gaps in the current evidence.
A summary of the clinical evidence included by the sponsor in the review of talquetamab is presented in 4 sections, with the review team’s critical appraisal of the evidence included at the end of each section. The first section, the systematic review, includes the pivotal studies and randomized controlled trials that were selected according to the sponsor’s systematic review protocol. The review team’s assessment of the certainty of the evidence in this first section using the GRADE approach follows the critical appraisal of the evidence. The second section would include sponsor-submitted long-term extension studies, but no studies were available for this submission. The third section would include indirect evidence submitted by the sponsor, but no indirect evidence was included in this submission. The fourth section includes additional studies that were considered by the sponsor to address important gaps in the systematic review evidence.
Included Studies
Clinical evidence from the following studies is included in the review and appraised in this document:
1 pivotal study (phase I/II study) identified in the systematic review
3 studies addressing gaps in the systematic review evidence.
Systematic Review
The contents of this section have been informed by materials submitted by the sponsor. The following has been summarized and validated by the review team.
Description of Studies
One pivotal study (MonumenTAL-1) met the inclusion criteria for the sponsor’s systemic review. The characteristics of the MonumenTAL-1 study are summarized in Table 5.
Table 5: Details of Study Included in the Systematic Review (MonumenTAL-1)
Characteristic | Phase I (part 1 and 2) | Phase II (part 3) |
|---|---|---|
Design and population | ||
Study design | Phase I/II, single-arm, open-label, multicentre, dose escalation study | |
Locations | 47 centres in 11 countries in Asia, North America, and Europe: Belgium, China,a France, Germany, Israel, Japan,a the Netherlands, Poland, Republic of Korea, Spain, and US | |
Patient enrolment dates | First patient enrolled: January 3, 2018 End date: Not applicable; study is ongoing | |
Data cut-off date | Data cut-off date for this submission (clinical cut-off date; date of last observation for last participant recorded as part of the database for updated analysis): January 17, 2023 | |
Randomized (N) | Randomization was not used in the study; patients received treatment if they met the eligibility criteria Total N of all treated patients = 501 | |
Key inclusion criteria | Documented initial diagnosis of MM according to IMWG diagnostic criteria25
Measurable disease:
If central laboratory assessments were not available, relevant local laboratory measurements had to exceed the minimum required level by at least 25%. Patients with documented evidence of progressive disease within the previous 6 months and whose disease was refractory or nonresponsive to the most recent line of therapy afterward | Documented initial diagnosis of MM according to IMWG diagnostic criteria25
Measurable disease:
If central laboratory assessments were not available, relevant local laboratory measurements had to exceed the minimum required level by at least 25%.
|
Key exclusion criteria | Prior grade 3 or higher CRS (per Lee criteria, 201442) related to any T-cell redirection therapy (e.g., CD-3 redirection technology or CAR T-cell therapy) or any prior GPRC5D-targeting therapy. Antitumour therapy before the first dose of the study drug. Received a cumulative dose of corticosteroids equivalent to ≥ 140 mg of prednisone within the 14-day period before the first dose of the study drug (does not include pretreatment medication). Received either of the following:
Plasma cell leukemia (> 2.0 × 10⁹/L plasma cells by standard differential), Waldenström macroglobulinemia, POEMS syndrome, or primary amyloid light chain amyloidosis. Phase II only — the following cardiac conditions:
| |
Drugs | ||
Intervention | Dose escalation (part 1):
Dose expansion (part 2):
| Cohorts A and B: talquetamab 0.4 mg/kg SC on days 1, 8, 15, and 22 of a 28-day cycle, with the first treatment dose preceded by step-up doses of 0.01 mg/kg and 0.06 mg/kg Cohort C: talquetamab 0.8 mg/kg SC on days 1 and 15 of a 28-day cycle, with the first treatment dose preceded by step-up doses of 0.01 mg/kg, 0.06 mg/kg, and 0.3 mg/kg |
Comparator(s) | Not applicable | |
Study duration | ||
Screening phase | 28 days before the first dose of the study drug. | |
Treatment phase | Began with the first administration of the study drug and continued until the completion of the end-of-treatment visit. An end-of-treatment visit was completed ≤ 30 days (+ 7 days) after the last dose of the study drug or before the start of a new anticancer therapy, whichever came first. | |
Follow-up phase | Part 1 (except patients enrolled in cohorts that supported a putative RP2D for part 2): the posttreatment follow-up phase started from the time the decision was made to stop the study treatment and continued for up to 16 weeks after the last dose of the study drug or until the patient had died, had withdrawn consent, was lost to follow-up, or started a new anticancer therapy. Part 1 patients in a cohort that supported a putative RP2D and all part 2 patients: the posttreatment follow-up phase started from the time the decision was made to stop the study treatment. Survival status and information on subsequent anticancer therapy were obtained every 16 weeks (± 2 weeks) until the end of the study, unless the patient had died, had withdrawn consent, or had been lost to follow-up. AEs were followed for up to 100 days after the last dose of the study drug, or longer if required. | Part 3: After disease progression was documented, survival status and information on PROs (in part 3), secondary primary malignancies (in part 3), and subsequent anticancer therapy were obtained every 16 weeks until the end of the study, unless the patient had died, had been lost to follow-up, or had withdrawn consent. AEs were followed for up to 30 days after the last dose of the study drug, or longer if required. |
Outcomes | ||
Primary end pointc |
|
|
Secondary and exploratory end pointsc | Secondary end points:
Exploratory end points:
| Secondary end points:
Exploratory end points:
|
Publication status | ||
Publications | Chari et al. (2022)36 ClinicalTrials.gov identifier: NCT03399799 (phase I), NCT04634552 (phase II) | |
AE = adverse event; CAR = chimeric antigen receptor; CR = complete response; CRS = cytokine release syndrome; DLT = dose-limiting toxicity; DOR = duration of response; ECOG = Eastern Cooperative Oncology Group; FLC = free light chain; HRQoL = health-related quality of life; IMiD = immunomodulatory drug; IMWG = International Myeloma Working Group; mAb = monoclonal antibody; MM = multiple myeloma; MRD = minimal residual disease; ORR = overall response rate; OS = overall survival; PFS = progression-free survival; PI = proteasome inhibitor; POEMS = polyneuropathy, organomegaly, endocrinopathy, monoclonal protein, and skin changes; PR = partial response; PRO = patient-reported outcome; q.2.w. = every 2 weeks; RP2D = recommended phase II dose; SAE = serious adverse event; SC = subcutaneous; sCR = stringent complete response; TTR = time to response; VGPR = very good partial response.
aPatients who were enrolled in the China and Japan cohorts were declared out of scope for the 2023 Clinical Study Report of the MonumenTAL-1 study, and data relating to those patients were not reported in this submission.
bCriterion for progressive disease on or within 12 months of therapy does not apply to patients who received CAR T-cell therapy as the last line of therapy.
cFor patients in phase I, disease response was assessed by the investigator using 2011 IMWG response criteria.25 For patients who received RP2Ds in either phase of the study, the independent review committee provided the primary assessment of disease response using 2016 IMWG response criteria.9
Sources: Clinical Study Report for MonumenTAL-1 (2023);15 clinical protocol for MonumenTAL-1.43 Details included in the table are from the sponsor’s summary of clinical evidence.
The MonumenTAL-1 study is a phase I/II, single-arm, open-label, multicentre, dose escalation study of talquetamab in adults with r/r MM. The primary objectives of the 3-part MonumenTAL-1 study were to characterize the safety of talquetamab and the RP2Ds and schedule (phase I dose escalation [i.e., part 1]); to further characterize the safety of talquetamab at the RP2Ds (phase I dose expansion [i.e., part 2]); and to evaluate the efficacy of talquetamab at the RP2Ds (phase II [i.e., part 3]). The most recent data cut-off date was January 17, 2023. Patients from 47 centres across 11 countries in Asia, Europe, and North America were included in the study. Randomization was not implemented in accordance with the single-arm study design.15
In the MonumenTAL-1 study, 501 patients were treated with talquetamab, and patients received talquetamab until disease progression, unacceptable toxicity, withdrawal of consent, death, or the end of the study (defined as 2 years after the last participant had received the initial dose of talquetamab or when the last participant had completed the last study assessment, whichever occurred first).15 The results of this clinical review were reported for 3 populations from phase I and phase II of the MonumenTAL-1 study who were treated with the RP2D of talquetamab of either 0.4 mg/kg weekly SC or 0.8 mg/kg every 2 weeks SC (Figure 1):
Model cohort A (N = 143): all treated patients assigned to the RP2D of 0.4 mg/kg weekly SC in either phase I or phase II cohort A, who had not received prior T-cell redirection therapies such as chimeric antigen receptor (CAR) T-cell therapy or bispecific antibodies. This group corresponds to model cohort A in the pharmacoeconomic (PE) report and model.
Model cohort C (N = 145): all treated patients assigned to the RP2D of 0.8 mg/kg every 2 weeks SC in either phase I or phase II cohort C, who had not received prior T-cell redirection therapy. This group corresponds to model cohort C in the PE report and model.
Prior T-cell redirection (N = 51): all treated patients assigned to the 0.4 mg/kg weekly SC RP2D in phase II cohort B or to RP2D (either 0.4 mg/kg weekly SC or 0.8 mg/kg every 2 weeks SC) in phase I who had received prior T-cell redirection therapy. This group was not included in the PE model but was narratively addressed in the PE report.44
Populations
Inclusion and Exclusion Criteria
The patients eligible for inclusion in the MonumenTAL-1 study were those aged 18 years or older who had a documented diagnosis of MM according to IMWG diagnostic criteria25 and an ECOG Performance Status of 0 or 1 (phase I) or 0 to 2 (phase II). All patients were required to have measurable disease. All patients in phase II had been treated with at least 3 prior therapies and had been previously exposed to a PI, an IMiD, and an anti-CD38 monoclonal antibody. Patients were excluded from the MonumenTAL-1 study if they had previously experienced grade 3 or higher CRS related to a T-cell redirection therapy or prior GPRC5D-targeting therapy. Patients were excluded if they had received any of the following antitumour therapies before the first dose of the study drug: gene-modified adoptive cell therapy within 3 months, epigenetic therapy, monoclonal antibody treatment or cytotoxic therapy within 21 days, PI therapy or radiotherapy within 14 days, IMiD therapy within 7 days, CAR T-cell therapy or T-cell redirection therapy at any time (for phase II cohort A and cohort C only), and T-cell redirection therapy within 3 months (for phase II cohort B only).
Patients were also excluded if they had received a cumulative dose of corticosteroids equivalent to 140 mg or more of prednisone within the 14-day period before the first dose of the study drug, had received an allogeneic stem cell transplant within the past 6 months, or had received an autologous stem cell transplant 12 weeks or less before the first dose of the study drug.43
Figure 1: MonumenTAL-1 Study Analysis Populations
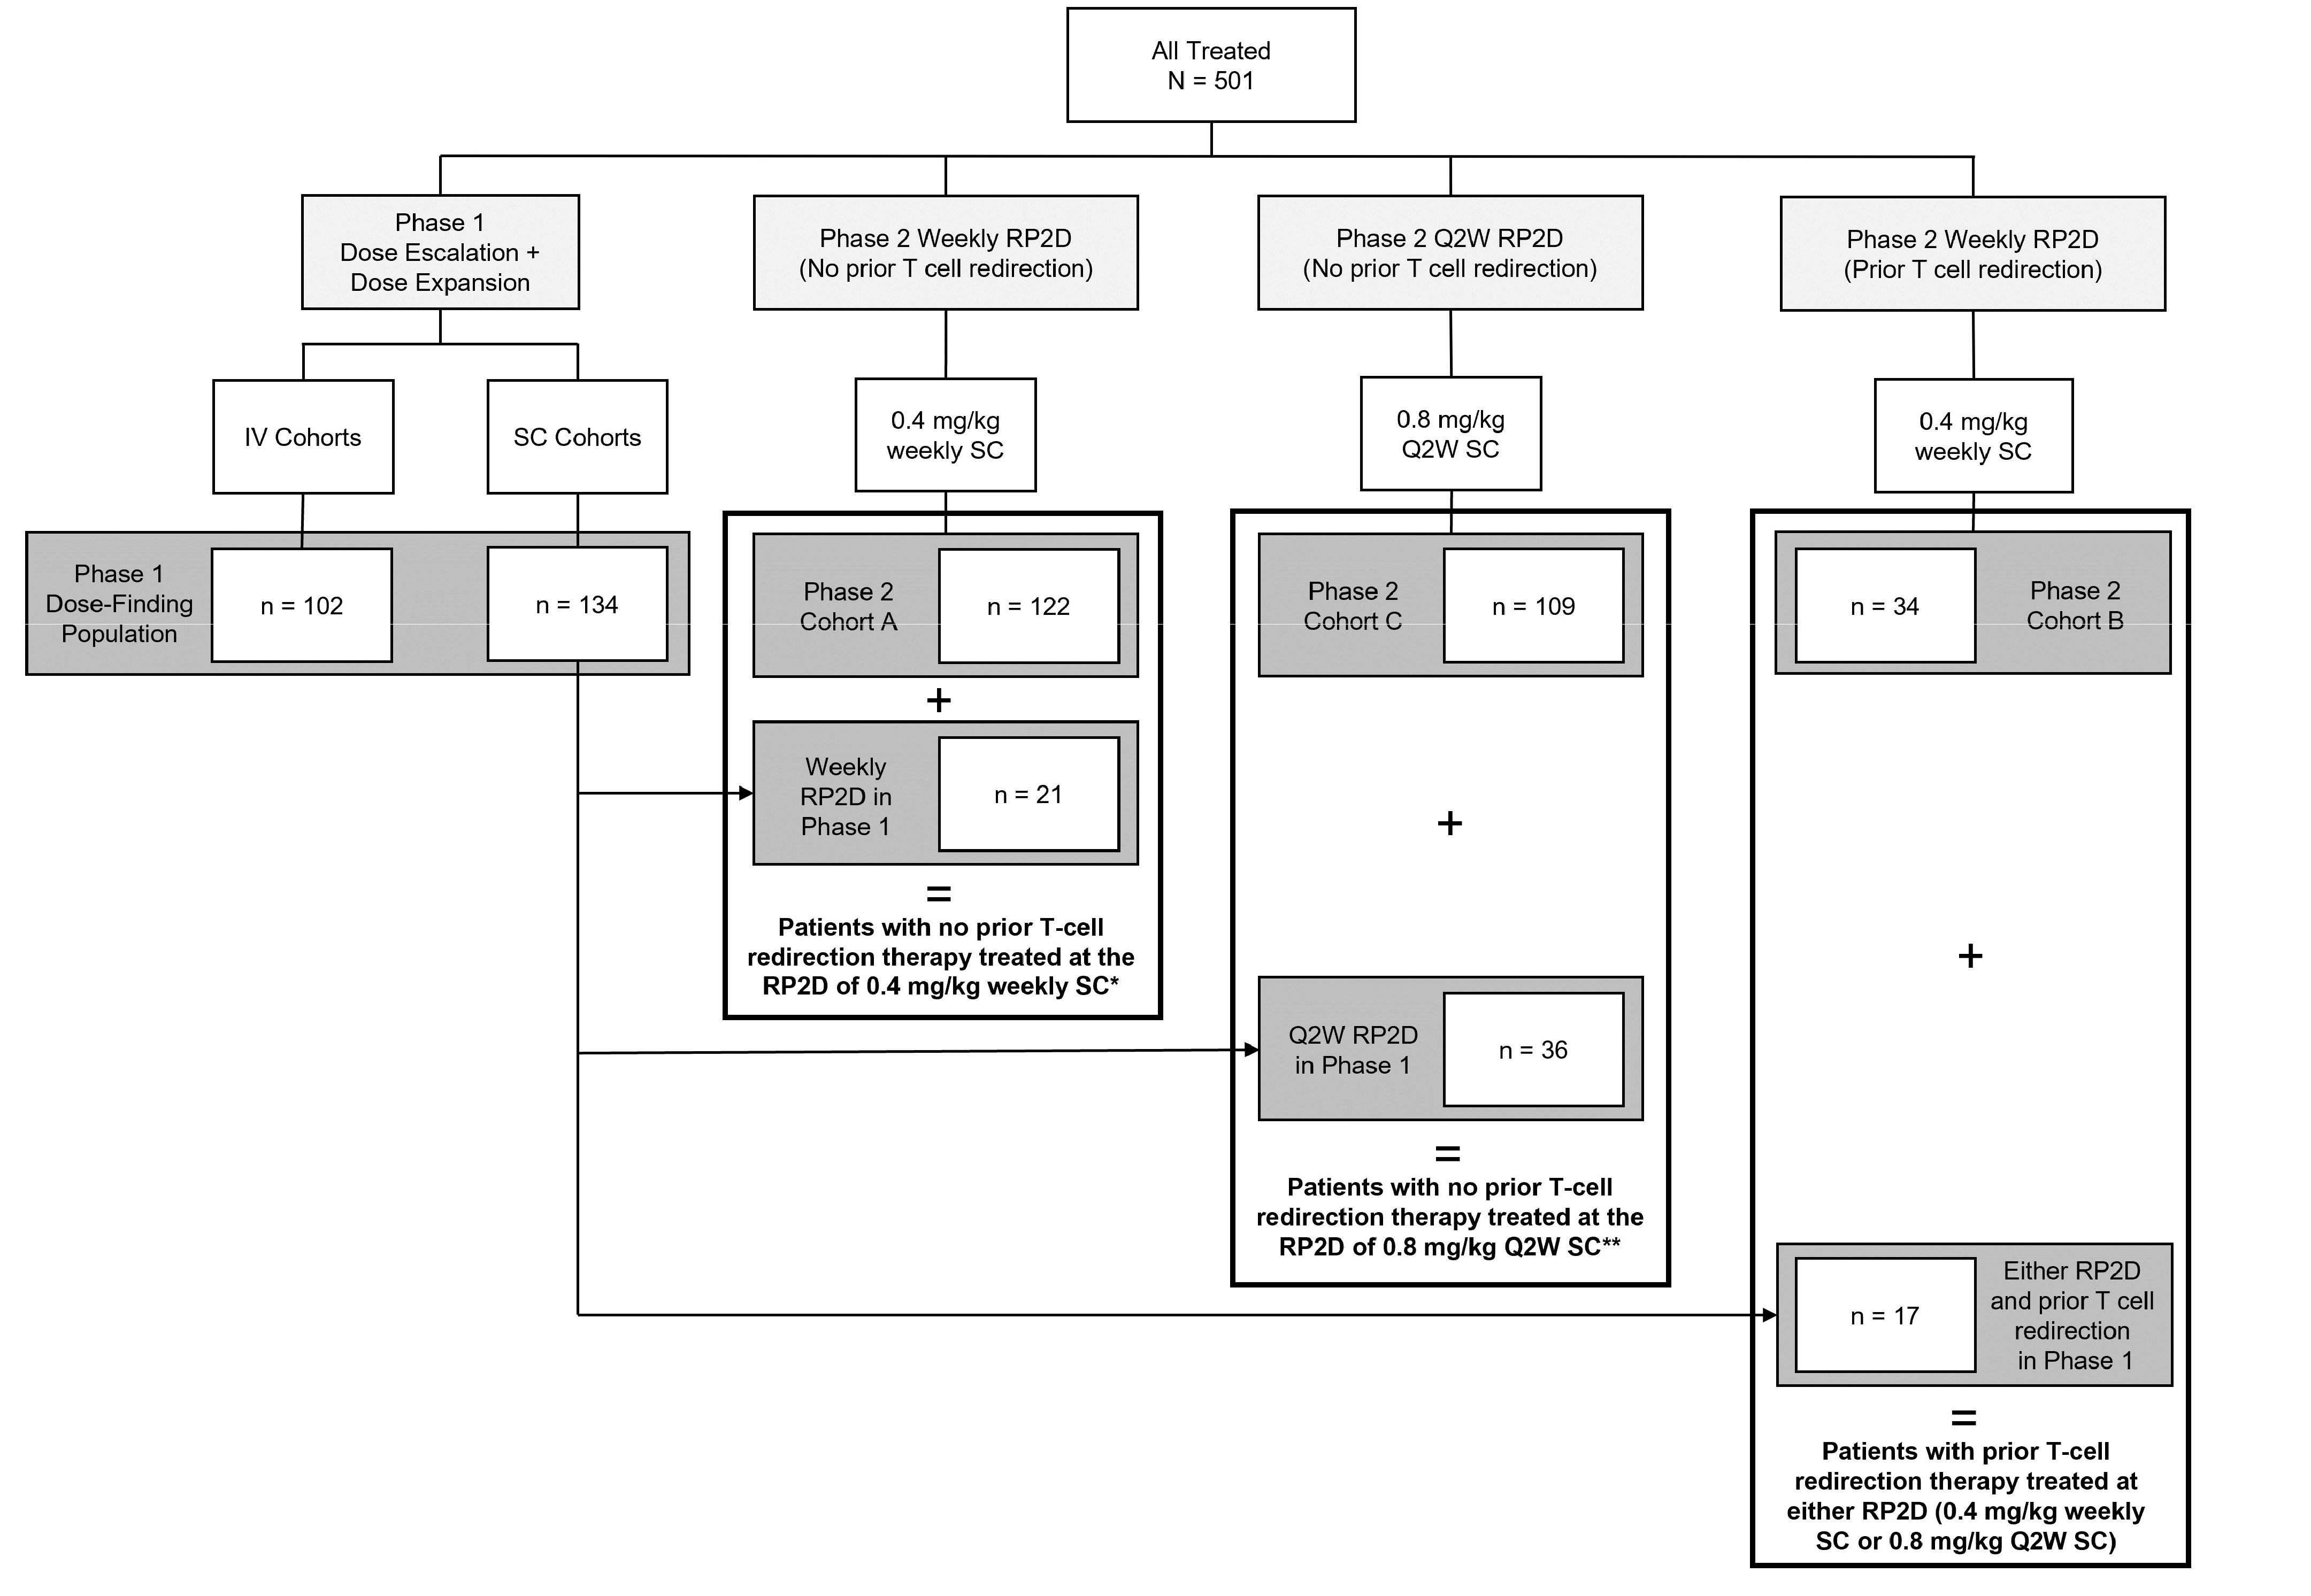
Q2W = every 2 weeks; RP2D = recommended phase II dose; PE = pharmacoeconomic; SC = subcutaneous.
Notes: The group labelled with “*” corresponds to model cohort A in the PE report and model. The group labelled with “**” corresponds to model cohort C in the PE report and model.
Source: Sponsor’s submission.45
Interventions
Phase I (Part 1 and Part 2)
During dose escalation (part 1 of phase I), the talquetamab dosing schedules were as follows: IV from 0.001 mg/kg to 0.00338 mg/kg every 2 weeks, IV from 0.0015 mg/kg to 0.18 mg/kg weekly, SC from 0.015 mg/kg to 0.8 mg/kg weekly, SC 0.8 mg/kg or 1.2 mg/kg every 2 weeks, or SC at 1.6 mg/kg monthly.43
Dose escalation for biweekly IV treatment was initiated at the minimum anticipated biologic effect level–based starting dose of 0.0005 mg/kg, while dose escalation for weekly IV treatment was initiated at the dose deemed safe during the dose escalation assessment for biweekly IV dosing. Dose escalation for the SC treatment began at a cleared dose level that was approved by the study evaluation team. Most IV doses and all SC doses were preceded by step-up dosing.43
During dose expansion (part 2 of phase I), patients received talquetamab at 0.405 mg/kg SC weekly on days 1, 8, and 15 of a 21-day cycle (preceded by step-up doses of 0.01 mg/kg and 0.06 mg/kg) or at 0.8 mg/kg SC every 2 weeks on days 1 and 15 of a 28-day cycle (preceded by step-up doses of 0.01 mg/kg, 0.06 mg/kg, and 0.3 mg/kg).15
In phase I, patients could switch from a weekly to a biweekly or monthly dosing schedule if they experienced PR or better, had received at least 4 cycles of therapy, and had the sponsor’s approval. Dose modifications, including delays and reductions, were used to manage talquetamab-related toxicities at the investigator’s discretion.15
Phase II (Part 3)
Safety, efficacy, pharmacokinetic, and pharmacodynamic data from phase I (parts 1 and 2) were used to inform the 2 selected RP2Ds of 0.4 mg/kg SC weekly and 0.8 mg/kg SC every 2 weeks. The RP2D of 0.405 mg/kg (phase I) was adjusted to 0.4 mg/kg for operational convenience and is used herein to refer to the associated dose in both phase I and phase II.15 Cohorts A and B received 0.4 mg/kg SC weekly on days 1, 8, 15, and 22 of a 28-day cycle (preceded by step-up doses of 0.01 mg/kg and 0.06 mg/kg). Cohort C received 0.8 mg/kg SC every 2 weeks on days 1 and 15 of a 28-day cycle (preceded by step-up does of 0.01 mg/kg, 0.06 mg/kg, and 0.3 mg/kg).15
In phase II, patients in cohort A or B could switch from weekly to biweekly dosing if they experienced CR or better for at least 6 months and had the sponsor’s approval.15
In all patients treated at the RP2Ds, talquetamab was administered until disease progression, unacceptable toxicity, withdrawal of consent, death, or the end of the study.15
Pretreatment Therapy
Patients in the MonumenTAL-1 study received pretreatment medication of glucocorticoid, antihistamine, and antipyretic at cycle 1 dose 1 and at all step-up doses. Histamine-2 receptor antagonists and antiemetics were administered as clinically indicated.15,43
Concomitant Therapy
Permitted Medications
Patients in the MonumenTAL-1 study received full supportive care during the study. Examples of supportive therapies included standard supportive care therapies (antiemetics, antidiarrheals, anticholinergics, antispasmodics, antipyretics, antihistamines, analgesics, antibiotics and other antimicrobials, histamine receptor antagonists or proton pump inhibitors, and other medications intended to treat symptoms or signs of disease) as clinically indicated, as well as bisphosphonates, growth factor support, erythropoietin-stimulating drugs, platelet-stimulating factor, antibiotics or other anti-infective drugs, corticosteroids, and best supportive care to prevent potential toxicities.43
Subsequent Anticancer Therapy
In parts 1 and 2, information on subsequent anticancer therapy (type of therapy and start date) administered up to 16 weeks after the last dose of talquetamab was recorded, according to the study protocol. In part 3, unless a patient experienced intolerance to talquetamab, subsequent antimyeloma therapy was not started before disease progression was established per the IMWG criteria9,25 and confirmed by the sponsor. After confirmation of progressive disease, the choice of subsequent therapy was at the discretion of the investigator.43
Outcomes
A list of efficacy end points assessed in this Clinical Review Report is provided in Table 6, followed by descriptions of the outcome measures. Summarized end points are based on outcomes included in the sponsor’s summary of clinical evidence as well as any outcomes identified as important to this review according to the clinical expert consulted for this review and input from the patient and clinician groups and public drug plans. Using the same considerations, the review team selected the end points that were considered to be most relevant to inform the expert committee deliberations and finalized this list of end points in consultation with members of the expert committee. Select efficacy and notable harms outcomes that were considered important for informing the expert committee deliberations were assessed using GRADE.
Table 6: Outcomes Summarized From the Study Included in the Systematic Review
Outcome measure | Time point | Type of outcome |
|---|---|---|
OS | At data cut-off (January 17, 2023) and at 6, 9, and 12 months. | Secondary outcome for parts 1, 2, and 3 |
PFS | At data cut-off (January 17, 2023) and at 6, 9, and 12 months. | Secondary outcome for parts 1, 2, and 3 |
ORR (sCR, CR, VGPR, or PR) | On day 1 (or within 3 days before day 1) of each cycle before dosing until progressive disease. | Primary outcome for part 3 Secondary outcome for parts 1 and 2 |
DOR | At data cut-off (January 17, 2023) and at 6, 9, and 12 months. | Secondary outcome for parts 1, 2, and 3 |
CR or better (CR or sCR) rate | On day 1 (or within 3 days before day 1) of each cycle before dosing until progressive disease. | Secondary outcome for parts 1, 2, and 3 |
EORTC QLQ-C30 | Measured at screening, step-up dose 1, day 1 of each odd-numbered cycle, end of treatment, then every 16 weeks. Presented at cycle 7 day 1. | Secondary outcome for part 3 |
AEs and SAEs | Continued to 100 days (part 1 and part 2) or 30 days (part 3) after the last dose of the study drug or until the start of subsequent anticancer therapy, if earlier. | Primary outcome for part 2 Secondary outcome for part 3 |
AE = adverse event; CR = complete response; DOR = duration of response; EORTC QLQ-C30 = European Organisation for Research and Treatment of Cancer Quality of Life Questionnaire Core 30; ORR = overall response rate; OS = overall survival; PFS = progression-free survival; PR = partial response; SAE = serious adverse event; sCR = stringent complete response; VGPR = very good partial response.
Note: ORR and CR or better rate were defined according to the International Myeloma Working Group criteria and were based on the independent review committee assessment.
Sources: Clinical Study Report for MonumenTAL-1 (2023);15 clinical protocol for MonumenTAL-1.43 Details included in the table are from the sponsor’s summary of clinical evidence.
OS was defined as the time from the date of the first dose of the study drug to the date of the patient’s death. If the patient was alive or their vital status was unknown, then the patient’s data were censored at the date the patient was last known to be alive. If the patient had died, the date and cause of death were collected and documented on the electronic case report form, if or when available.
Disease evaluations were performed at the start of each cycle, as specified in the relevant time and event schedules.43 Disease evaluations were performed by a central laboratory, unless otherwise specified, until disease progression. In phase I, response to treatment was evaluated by study investigators according to the 2011 IMWG response criteria25 (for patients treated at a candidate or putative RP2D, response was additionally assessed by an IRC using the 2016 IMWG response criteria9).43 In phase II, response to treatment was evaluated by the IRC and validated using a computerized algorithm (although the IRC assessment was used as the primary assessment). Response was additionally assessed by the investigator using the 2016 IMWG response criteria.9,43
PFS was defined as the time from the date of the first dose of the study drug to the date of first documented disease progression, as defined in the IMWG criteria,9 or death due to any cause, whichever occurred first. For patients who had experienced progression and were alive, data were censored at the last disease evaluation before the start of any subsequent antimyeloma therapy. Disease progression and survival were assessed according to the relevant time and event schedules.43
ORR was defined as the proportion of patients who have a PR or better (i.e., stringent CR, CR, VGPR, or PR) according to the IMWG criteria.9
DOR was calculated among patients who experienced a PR or better, from the date of initial documentation of a response to the date of first documented evidence of progressive disease (as defined by the IMWG criteria)9 or death due to progressive disease, whichever occurred first. Relapse from CR was not considered as disease progression. For patients who had not experienced progression, data were censored at the last disease evaluation before the start of any subsequent antimyeloma therapy.
The CR or better rate was defined as the proportion of patients who experienced a CR or better (i.e., CR or stringent CR) according to the IMWG criteria.9
Patient-reported outcome measures were administered according to the relevant time and event schedules43 to assess the patient’s HRQoL (symptoms, functioning, and general well-being) after treatment and the change from baseline. The patient-reported outcome measures were completed by the patient. The EORTC QLQ-C30 version 3 includes 30 items, comprising 5 functional scales (physical, role, emotional, cognitive, and social), 1 GHS scale, 3 symptom scales (pain, fatigue, and nausea/vomiting), and 6 single symptom items (dyspnea, insomnia, appetite loss, constipation, diarrhea, and financial difficulties). The recall period is 1 week (“past week”), and responses are reported using verbal and numeric rating scales. The instrument contains 28 items using a Likert scale, with 4 response options: “not at all,” “a little,” “quite a bit,” and “very much” (scored 1 to 4). Two additional items use response options 1 to 7: 1 indicates “very poor,” and 7 indicates “excellent.” The item and scale scores are transformed to a 0 to 100 scale according to the algorithm in the EORTC QLQ-C30 scoring manual, version 3. A higher score represents greater HRQoL, better functioning, and more (worse) symptoms (Table 7). The sponsor used a 10-point change for improvement from baseline through cycle 7 day 1 (i.e., the first 6 months) in the EORTC QLQ-C30 scores as the clinically meaningful improvement threshold, based on the literature.11,15,43,45,46 Compliance rates for the patient-reported outcome instruments at each scheduled visit were provided based on the number and percentage of expected and received complete questionnaires.47
AEs were reported by the patient (or, when appropriate, by a caregiver, a surrogate, or the patient’s legally acceptable representative).
The considerations that informed the selection of the efficacy outcomes to be summarized and assessed using GRADE include the following:
Survival outcomes, which were identified by the patient and clinician group input and were specified by the clinical expert consulted for this review to include OS and PFS.
ORR, which was identified as important by the patient and clinician group input (as response to treatment).
DOR, which was identified as important by the patient group input and by the clinical expert consulted for this review.
CR or better rate, which was identified as important by the patient group input and by Canadian Drug Expert Committee representatives and presenters.
HRQoL outcomes, which were identified by the patient and clinician group input and were specified by the clinical expert to include the EORTC QLQ-C30 measure.
CRS and ICANS, which were identified as important safety outcomes by the clinical expert and by the patient and clinician group input.
Table 7: Summary of Outcome Measures and Related Measurement Properties
Outcome measure | Type | Conclusions about measurement properties | MID |
|---|---|---|---|
EORTC QLQ-C30 | A cancer-specific, patient-reported standardized questionnaire that is commonly used in oncology clinical trials to evaluate HRQoL. The core questionnaire consists of 30 questions that are scored to create 5 multi-item functional scales (physical, role, emotional, cognitive, social), 3 multi-item symptom scales (fatigue, nausea and vomiting, pain), 6 single-item symptom scales (dyspnea, insomnia, appetite loss, constipation, diarrhea, financial difficulties), and a global health status/QoL scale.48,49 Most items have 4 response options (“not at all,” “a little,” “quite a bit,” “very much”), with scores on these items ranging from 1 to 4. For the global health status/QoL scale, a 7-point Likert-type scale is used, with anchors between 1 (very poor) and 7 (excellent).49 Thus, a decline in score on the symptom scale would reflect an improvement, whereas an increase in score on the function and QoL scales would reflect an improvement.49 | Osborne et al.11 conducted a systematic literature review of validated HRQoL tools in MM. For the EORTC QLQ-C30, the sample included patients with newly diagnosed MM, relapsed MM, mixed disease stages of MM and mixed treatment experiences, and prior treatment with HSCT.11 For the purposes of this review, data specific to patients only treated with HSCT were not reported. Validity: For construct validity, the subscales for pain, fatigue, physical functioning, and global health status/QoL were considered able to discriminate between patients whose disease improved versus patients whose disease remained stable or deteriorated (N = 239, with mixed disease stages and mixed treatment experiences, including 69 patients [29%] with relapsed MM or disease progression).50 All subscales, with the exception of the single-item diarrhea scale, were considered able to discriminate between patients with newly diagnosed MM according to their performance and response status (N = 484).51 Reliability: For internal consistency, the Cronbach alpha ranged from 0.54 to 0.89 for all subscales in patients with newly diagnosed MM, mixed disease stages and mixed treatment experiences, and prior treatment with HSCT.51-54 Responsiveness: The responsiveness of the subscales to change over time varied depending on the sample population studied.11 To assess responsiveness, Kvam et al.55 used the global rating of change to identify whether patients with mixed disease stages and mixed treatment experiences changed over time. Of note, 69 patients (29%) had relapsed or progressive diseasea.55 For the global health status/QoL scale, the SRMb in patients who reported improvement and deterioration over a period of 3 months was 0.32 and 0.57, respectively (N = 239). In patients rating their QoL as unchanged, the SRM was negligible.55 | From the systemic review of validated HRQoL tools in MM conducted by Osborne et al.,11 the following estimated MIDs were reported for patients with mixed disease stages and mixed treatment experiences:
|
EORTC QLQ-C30 = European Organisation for Research and Treatment of Cancer Quality of Life Questionnaire Core 30; HRQoL = health-related quality of life; HSCT = hematopoietic stem cell transplant; MID = minimal important difference; MM = multiple myeloma; QoL = quality of life; SRM = standardized response mean.
aThe European Society for Blood and Marrow Transplantation criteria for response were used to determine the patients’ disease phase.
bTo assess the magnitude of the difference in scores between patients whose disease improved, deteriorated, and remained stable, SRMs were calculated and compared against the Cohen rule of thumb for interpreting the magnitude of mean differences in HRQoL scores: 0.20 represents a small change, 0.50 a moderate change, and more than 0.80 a large change.
cThe MIDs were estimated using an anchor-based approach, anchored to a structured QoL interview (response options were “improved,” “deteriorated,” or “unchanged”).
dThe MIDs were estimated using an anchor-based approach, anchored to a structured QoL interview (response options were “improved,” “deteriorated,” or “unchanged”).
Statistical Analysis
Clinical Study End Points
The statistical analyses for the study end points are presented in Table 8.
Table 8: Statistical Analysis of Efficacy and Safety End Points in MonumenTAL-1 Study
End point | Statistical model | Adjustment factors | Handling of missing data | Sensitivity analyses |
|---|---|---|---|---|
OS | Kaplan-Meier method | None | Patients who remained alive or had unknown vital status were censored at the date the patient was last known to be alive. | Censored patients who died due to COVID-19 before disease progression. |
PFS | Kaplan-Meier method | None | For patients who did not experience progression and were alive, data were censored at the last disease evaluation before the start of any subsequent antimyeloma therapy. | Censored patients who died due to COVID-19 before disease progression. |
ORR (sCR, CR, VGPR, or PR); CR or better rate (sCR or CR) | Rate and 2-sided 95% exact CI | None | Patients for whom disease response was not evaluable were classified as not experiencing a PR or better. | Response based on computerized algorithm and investigator assessment (as opposed to IRC assessment used in the main analyses). Supplementary analyses:
|
DOR | Kaplan-Meier method | None | For patients who did not experience progression, data were censored at the last disease evaluation before the start of any subsequent antimyeloma therapy. | Response based on computerized algorithm and investigator assessment (as opposed to IRC assessment used in the main analyses). |
EORTC QLQ-C30 |
| None | Data assumed to be missing at random for the mixed model for repeated measures. For the time-to-deterioration analysis, participants who had not met the definition of worsening were censored at the last PRO assessment. Participants without baseline or postbaseline assessments were censored at the date of the first dose of the study drug. | None |
Safety end points | Categorical variables were summarized by cohort using frequency counts and percentages. | None | NR | None |
CI = confidence interval; CR = complete response; DOR = duration of response; EORTC QLQ-C30 = European Organisation for Research and Treatment of Cancer Quality of Life Questionnaire Core 30; IRC = independent review committee; MCT = meaningful change threshold; NR = not reported; ORR = overall response rate; OS = overall survival; PFS = progression-free survival; PR = partial response; PRO = patient-reported outcome; sCR = stringent complete response; SD = standard deviation; VGPR = very good partial response.
aThe dependent variable was change from baseline in score, and the independent variables were baseline value and time as fixed effects and patient as a random effect.
Source: Clinical protocol for MonumenTAL-1.43 The details included in the table are from the sponsor’s summary of clinical evidence.
Sample Size and Power Calculation
Phase I (parts 1 and 2) of the MonumenTAL-1 trial did not include any formal statistical hypothesis testing.43 In part 1, each dosing cohort required at least 1 participant, with at least 6 patients enrolled at each RP2D.15 In part 2, a maximum of 40 patients were treated at each RP2D to further assess safety and evaluate the preliminary antitumour activity of talquetamab.15
In phase II (part 3) of the MonumenTAL-1 trial, the sample size requirements were determined as follows:43
Cohort A: A target sample size of approximately 120 patients was determined using an assumed ORR of at least 45% for patients treated with talquetamab. This provided a power of approximately 90% or greater to conclude that the ORR is higher than 30% at the 1-sided significance level of 0.025.
Cohort B: A target sample size of at least 60 patients and up to approximately 100 patients was determined by using an assumed ORR of at least 35% for patients treated with talquetamab. Initially, calculations revealed that 38 patients would provide a power of approximately 80% or greater to conclude that the ORR is higher than 15% at the 1-sided significance level of 0.025. The target sample size was further increased to at least 60 patients to determine the ORR with more precision (i.e., tighter CIs).
Cohort C: A target sample size of approximately 100 patients was determined by using an assumed ORR of at least 45% for patients treated with talquetamab. This provided a power of more than 85% to conclude that the ORR is higher than 30% at the 1-sided significance level of 0.025.
According to the sponsor, for this single-arm trial, multiplicity adjustment(s) were not used in the analyses of ORR in the MonumenTAL-1 study.47
Interim Analyses
A formal interim analysis was not planned for phase I nor for cohorts A and B in phase II.43 For cohort B in phase II, the null hypothesis that ORR was at most 15% was tested using a 2-stage design against the alternative hypothesis that ORR was at least 35%. The first stage occurred when approximately 21 patients enrolled in cohort B were response evaluable and the response for the last patient in the first stage could be assessed. Once at least 3 responses were observed in the first stage, additional patients were enrolled to obtain at least 34 patients who were response evaluable across both stages. This was followed by an increase in sample size to at least 60 patients to calculate the ORR with more precision (i.e., tighter CIs).45
Subgroup Analyses
Within each model cohort, the results of the MonumenTAL-1 study were also reported by subgroup. Prespecified subgroups included the following:
sex (male or female)
age (< 65 years, 65 to < 75 years, or ≥ 75 years)
baseline renal function (≤ 60 mL/min/1.73 m2 or > 60 mL/min/1.73 m2 for efficacy outcomes; and < 30 mL/min/1.73 m2, 30 to < 60 mL/min/1.73 m2, 60 to < 90 mL/min/1.73 m2, or ≥ 90 mL/min/1.73 m2 for safety outcomes)
for safety only: hepatic function (normal or impaired)
race (African American, Black, white, or other)
baseline ECOG Performance Status (0 or ≥ 1)
number of lines of prior therapy (< 4 or ≥ 4)
disease refractory to prior therapy (last line of prior therapy, PI and IMiD, triple class [PI, IMiD, and anti-CD38 monoclonal antibody], or penta-drug [at least 2 PIs, at least 2 IMiDs, and 1 anti-CD38 monoclonal antibody])
prior autologous stem cell transplant (yes or no)
type of myeloma (immunoglobulin G or non–immunoglobulin G)
baseline ISS (I, II, or III); baseline ISS was derived based on the combination of serum beta2-microglobulin and albumin
baseline R-ISS (I, II, or III); baseline R-ISS was derived based on the combination of serum beta2-microglobulin and albumin, genetic risk, and LDH level
cytogenetic risk (high risk or standard risk); high risk was defined by patients having t (4; 14); t (14; 16) and/or 17p deletion
bone marrow percentage of plasma cells (≤ 30%, > 30% to < 60%, or ≥ 60%)
baseline tumour GPRC5D expression (≥ median value or < median value)
baseline extramedullary plasmacytomas (0 or ≥ 1)
prior antibody drug conjugate (yes or no)
prior lines of therapy and refractory status (≥ 4 lines of therapy and triple refractory).
Analysis Populations
The key analysis populations are presented in Table 9.
Table 9: Analysis Populations of MonumenTAL-1 Study
Population | Definition | Application |
|---|---|---|
All-treated analysis set | Patients who received at least 1 dose of the study drug. The all-treated analysis set was considered as the primary analysis set. The analysis population applies to each of the 3 cohorts that received the RP2D:
| Efficacy, HRQoL, and safety summaries |
Per-protocol analysis set | All treated patients who meet all eligibility criteria. If the per-protocol analysis set composed > 90% of the all-treated analysis set, no analysis by per-protocol population was performed. | Efficacy summaries (only if the per-protocol analysis set composed ≤ 90% of the all-treated analysis set) |
Response-evaluable (RP2D) analysis set | All patients treated at 1 of the RP2Ds who had a confirmed diagnosis of MM and measurable disease at baseline or the screening visit, which is defined as either:
Patients who did not have measurable disease at baseline or screening but were assessed as experiencing CR or better, or progressive disease, or PR by the IRC were included. In addition, patients must have received at least 1 administration of the study medication and have had adequate postbaseline disease assessments before the start of subsequent therapy. | Efficacy summaries |
CR = complete response; FLC = free light chain; HRQoL = health-related quality of life; IRC = independent review committee; MM = multiple myeloma; PR = partial response; q.2.w. = every 2 weeks; RP2D = recommended phase II dose; SC = subcutaneous.
Note: The analysis populations outlined in the table apply to each of the 3 model cohorts that received the RP2D: patients with no prior T-cell redirection therapy treated at the RP2D of 0.4 mg/kg weekly SC; patients with no prior T-cell redirection therapy treated at the RP2D of 0.8 mg/kg q.2.w. SC; and patients with prior T-cell redirection therapy treated at either RP2D (0.4 mg/kg weekly SC or 0.8 mg/kg q.2.w. SC).
Source: Clinical protocol for MonumenTAL-1.43 The details included in the table are from the sponsor’s summary of clinical evidence.
Results
Patient Disposition
A summary of patient disposition in the MonumenTAL-1 study is given in Table 10. In total, 681 patients were screened, and 501 patients who met the inclusion and exclusion criteria and initiated treatment with talquetamab on or before April 20, 2022, were included in the MonumenTAL-1 study analyses.57 A total of 180 patients did not meet the screening criteria, mainly because of not meeting the clinical laboratory (hematology or chemistry) values (n = 78).57 At the January 17, 2023, data cut-off date, 62 patients (43.4%) in model cohort A and 41 patients (28.3%) in model cohort C had discontinued the study, mainly due to death (33.6% and 22.1% in model cohorts A and C, respectively). In total, 110 patients (76.9%) in model cohort A and 85 patients (58.6%) in model cohort C discontinued talquetamab due to progressive disease (58.0% and 34.5% in model cohorts A and C, respectively), physician decision (8.4% and 8.3%), AEs (5.6% and 8.3%), patient refusal (3.5% and 4.1%), and death (1.4% and 3.4%).
Table 10: Summary of Patient Disposition in MonumenTAL-1 Study
Patient disposition | 0.4 mg/kg weekly SC and no prior T-cell redirection therapy (model cohort A) | 0.8 mg/kg q.2.w. SC and no prior T-cell redirection therapy (model cohort C) | 0.4 mg/kg weekly SC or 0.8 mg/kg q.2.w. SC and prior T-cell redirection therapy (model cohort B) |
|---|---|---|---|
Screened, N | ███ | ||
Patients who did not meet screening criteria, N | ███ | ||
Patients who started treatment with talquetamab, N | 501 | ||
All treated at RP2D, N | 339 | ||
Analysis set: All treated at RP2D, N | 143 | 145 | 51 |
Duration of follow-up (months) | |||
Mean (SD) | 14.96 (7.215) | 11.02 (4.992) | 11.64 (5.931) |
Median (range)a | 18.79 (0.5a to 32.9) | 12.71 (0.2a to 26.1) | 14.75 (1.0a to 29.0) |
Study discontinuation, n (%) | |||
Discontinued study | 62 (43.4) | 41 (28.3) | 21 (41.2) |
Death | 48 (33.6) | 32 (22.1) | 20 (39.2) |
Death due to COVID-19 | 3 (2.1) | 1 (0.7) | 0 |
Withdrawal by patient | | █████ | | █████ | ██ |
Start of subsequent anticancer therapy | 4 (2.8) | 2 (1.4) | 0 |
Lost to follow-up | 4 (2.8) | 1 (0.7) | 1 (2.0) |
Study drug (talquetamab) discontinuation, n (%) | |||
Discontinued talquetamab | ███ ██████ | ██ ██████ | ██ ██████ |
Progressive disease | ██ ██████ | ██ ██████ | ██ ██████ |
Death | 2 (1.4) | 5 (3.4) | 0 |
Death due to COVID-19 | 1 (0.7) | 1 (0.7) | 0 |
Physician decision | ██ █████ | ██ █████ | | █████ |
Adverse events | | █████ | ██ █████ | | █████ |
Adverse event of COVID-19 | ██ | ██ | ██ |
Patient refused further treatmentc | | █████ | | █████ | ██ |
q.2.w. = every 2 weeks; RP2D = recommended phase II dose; SC = subcutaneous; SD = standard deviation.
Note: The data presented in this table were based on analyses at the clinical cut-off date of January 17, 2023, for the all-treated analysis set and patients who received the RP2D.
aBased on Kaplan-Meier product limit estimate.
bFollowing this value, there was a “+” symbol, denoting patients who died, in the sponsor’s submission.
c“Patient refused further treatment” includes “withdrawal by patient” from phase I RP2D.
Sources: Clinical Study Report for MonumenTAL-1 (2023);15 sponsor’s submission.57 The details included in the table are from the sponsor’s summary of clinical evidence.
Baseline Characteristics
A summary of the baseline patient demographics in the MonumenTAL-1 study is given in Table 11, and baseline patient disease characteristics are given in Table 12.
In model cohorts A and C of the MonumenTAL-1 study (i.e., patients with no prior T-cell redirection therapy), the median age of the patients was 67.0 years (range, 38 to 86 years), with 43.4% and 45.5% of the patients in those 2 model cohorts, respectively, aged younger than 65 years. There were more male patients (54.5% and 57.2%) than female patients (42.8% and 45.5%). Most patients were white (86.2% and 89.5%); the next largest categories by ethnicity were Black or African American (6.2% and 8.4%) and Asian (0.7% and 4.1%). Most patients had an ECOG Performance Status of 1 (55.9% and 60.1%), and less than 10% of patients had an ECOG Performance Status of 2, indicating good overall performance status.
In model cohorts A and C, the most common immunoglobulin isotypes were immunoglobulin G (53.1%) and immunoglobulin A (16.1% and 17.9%). The median time from diagnosis of MM to enrolment in the study was approximately 6.5 years (range, 0.8 to 25.4 years). Thirty-three patients (23.1%) in model cohort A and 37 patients (25.5%) in model cohort C had 1 or more extramedullary plasmacytomas at baseline. Of the 132 patients and 128 patients with baseline cytogenetic data reported in model cohorts A and C, 31.1% and 28.9% had at least 1 high-risk cytogenetic feature, including del(17p) (22.0% and 19.5%), t(4;14) (9.1% and 10.9%), and t(14;16) (3.8% and 4.7%). In patients with available baseline ISS or R-ISS data, most had ISS stage I disease (43.4% and 44.4% in model cohorts A and C, respectively), ISS stage II disease (37.1% and 31.3%), or R-ISS stage II disease (70.3% and 62.3%).
At baseline, all patients in the study populations had had disease that was refractory at some point to prior MM therapy. Most patients (94%) in model cohorts A and C had disease that was refractory to their last line of therapy. Approximately three-quarters (74.1%) of the patients in model cohort A and 69.0% of the patients in model cohort C had disease that was triple-class refractory (PI, IMiD, and anti-CD38 monoclonal antibody) (Appendix 1, Table 24).
Table 11: Summary of Baseline Characteristics in MonumenTAL-1 Study
Characteristic | 0.4 mg/kg weekly SC and no prior T-cell redirection therapy (model cohort A, N = 143) | 0.8 mg/kg q.2.w. SC and no prior T-cell redirection therapy (model cohort C, N = 145) | 0.4 mg/kg weekly SC or 0.8 mg/kg q.2.w. SC and prior T-cell redirection therapy (model cohort B, N = 51) |
|---|---|---|---|
Age (years) | |||
< 65, n (%) | 65 (45.5) | 63 (43.4) | 33 (64.7) |
65 to < 75, n (%) | 57 (39.9) | 50 (34.5) | 14 (27.5) |
≥ 75, n (%) | 21 (14.7) | 32 (22.1) | 4 (7.8) |
Mean (SD) | 65.0 (8.95) | 65.1 (10.32) | 61.1 (8.64) |
Median (range) | 67.0 (46 to 86) | 67.0 (38 to 84) | 61.0 (38 to 78) |
Sex, n (%) | |||
Male | 78 (54.5) | 83 (57.2) | 31 (60.8) |
Female | 65 (45.5) | 62 (42.8) | 20 (39.2) |
Race, n (%) | |||
Asian | 1 (0.7) | 6 (4.1) | 1 (2.0) |
Black or African American | 12 (8.4) | 9 (6.2) | 3 (5.9) |
Native Hawaiian or other Pacific Islander | 0 | 1 (0.7) | 0 |
White | 128 (89.5) | 125 (86.2) | 47 (92.2) |
Multiple | 0 | 1 (0.7) | 0 |
Unknown | 0 | 1 (0.7) | 0 |
Not reported | 2 (1.4) | 2 (1.4) | 0 |
Baseline ECOG Performance Status, n (%) | |||
0 | 44 (30.8) | 56 (38.6) | 22 (43.1) |
1 | 86 (60.1) | 81 (55.9) | 28 (54.9) |
2 | 13 (9.1) | 8 (5.5) | 1 (2.0) |
ECOG = Eastern Cooperative Oncology Group; q.2.w. = every 2 weeks; SC = subcutaneous; SD = standard deviation.
Note: The data presented in this table were based on analyses at the clinical cut-off date of January 17, 2023, for the all-treated analysis set and patients who received the recommended phase II dose.
aBased on data from 141 patients.
Source: Clinical Study Report for MonumenTAL-1 (2023).15 The details included in the table are from the sponsor’s summary of clinical evidence.
Table 12: Baseline Disease Characteristics of Patients in MonumenTAL-1 Study
Characteristic | 0.4 mg/kg weekly SC and no prior T-cell redirection therapy (model cohort A, N = 143) | 0.8 mg/kg q.2.w. SC and no prior T-cell redirection therapy (model cohort C, N = 145) | 0.4 mg/kg weekly SC or 0.8 mg/kg q.2.w. SC and prior T-cell redirection therapy (model cohort B, N = 51) |
|---|---|---|---|
Type of myeloma by immunofixation or serum FLC assay, n (%) | |||
Immunoglobulin G | 76 (53.1) | 77 (53.1) | 18 (35.3) |
Immunoglobulin A | 23 (16.1) | 26 (17.9) | 9 (17.6) |
Immunoglobulin M | 1 (0.7) | 0 | 0 |
Immunoglobulin D | 0 | 2 (1.4) | 0 |
Immunoglobulin E | 0 | 0 | 0 |
Light chain | 42 (29.4) | 38 (26.2) | 24 (47.1) |
Kappa | 20 (14.0) | 15 (10.3) | 11 (21.6) |
Lambda | 19 (13.3) | 17 (11.7) | 13 (25.5) |
FLC-kappaa | 2 (1.4) | 4 (2.8) | 0 |
FLC-lambdab | 1 (0.7) | 2 (1.4) | 0 |
Biclonal | 1 (0.7) | 2 (1.4) | 0 |
Negative immunofixation | 0 | 0 | 0 |
Type of measurable disease per IMWG criteria, n (%) | |||
Serum only | 60 (42.0) | 71 (49.0) | 15 (29.4) |
Serum and urine | 23 (16.1) | 12 (8.3) | 4 (7.8) |
Urine only | 20 (14.0) | 21 (14.5) | 13 (25.5) |
Serum FLC | 36 (25.2) | 38 (26.2) | 19 (37.3) |
Not evaluable | 4 (2.8) | 3 (2.1) | 0 |
ISS staging,c n (%) | |||
Patients, N | 143 | 144 | 51 |
I | 62 (43.4) | 64 (44.4) | 24 (47.1) |
II | 53 (37.1) | 45 (31.3) | 18 (35.3) |
III | 28 (19.6) | 35 (24.3) | 9 (17.6) |
R-ISS staging,d n (%) | |||
Patients, N | 138 | 138 | 47 |
I | 27 (19.6) | 33 (23.9) | 8 (17.0) |
II | 97 (70.3) | 86 (62.3) | 33 (70.2) |
III | 14 (10.1) | 19 (13.8) | 6 (12.8) |
Time from MM diagnosis to first dose (years) | |||
Mean (SD) | 7.22 (3.68) | 7.38 (4.71) | ████ ██████ |
Median (range) | 6.69 (1.4 to 20.8) | 6.38 (0.8 to 25.4) | ████ ████ ██ █████ |
Number of lytic bone lesions, n (%) | |||
Patients, N | 143 | 143 | ██ |
None | 23 (16.1) | 27 (18.9) | | ██████ |
1 to 3 | 23 (16.1) | 31 (21.7) | ██ ██████ |
4 to 10 | 46 (32.2) | 34 (23.8) | ██ ██████ |
More than 10 | 51 (35.7) | 51 (35.7) | ██ ██████ |
Number of extramedullary plasmacytomas, n (%) | |||
Patients, N | 143 | 145 | 51 |
0 | 110 (76.9) | 108 (74.5) | 35 (68.6) |
≥ 1 | 33 (23.1) | 37 (25.5) | 16 (31.4) |
Percentage of plasma cells, bone marrow biopsy/aspirate,e n (%) | |||
Patients, N | 138 | 141 | ██ |
< 5 | 54 (39.1) | 37 (26.2) | ██ ██████ |
≥ 5 to ≤ 30 | 52 (37.7) | 46 (32.6) | ██ ██████ |
> 30 to < 60 | 15 (10.9) | 26 (18.4) | | ██████ |
≥ 60 | 17 (12.3) | 32 (22.7) | | ██████ |
Cytogenetic risk, n (%) | |||
Patients, N | 132 | 128 | 44 |
Standard risk | 91 (68.9) | 91 (71.1) | 26 (59.1) |
High risk | 41 (31.1) | 37 (28.9) | 18 (40.9) |
del(17p) | 29 (22.0) | 25 (19.5) | 15 (34.1) |
t(4;14) | 12 (9.1) | 14 (10.9) | 4 (9.1) |
t(14;16) | 5 (3.8) | 6 (4.7) | 1 (2.3) |
Bone marrow cellularity by biopsy, n (%) | |||
Patients, N | 47 | 75 | 30 |
Hypercellular | 14 (29.8) | 24 (32.0) | 6 (20.0) |
Normocellular | 14 (29.8) | 30 (40.0) | 14 (46.7) |
Hypocellular | 9 (19.1) | 7 (9.3) | 7 (23.3) |
Indeterminate | 10 (21.3) | 14 (18.7) | 3 (10.0) |
Tumour GPRC5D expression (%) | |||
Patients, N | 135 | 122 | 43 |
Mean (SD) | 95.43 (6.84) | 93.08 (9.48) | 81.95 (20.62) |
Median (range) | 98.1 (61.9 to 100.0) | 96.6 (48.7 to 100.0) | 86.6 (17.5 to 99.8) |
FLC = free light chain; IMWG = International Myeloma Working Group; ISS = international staging system; MM = multiple myeloma; q.2.w. = every 2 weeks; R-ISS = Revised International Staging System; SC = subcutaneous; SD = standard deviation.
Note: The data presented in this table were based on analyses at the clinical cut-off date of January 17, 2023, for the all-treated analysis set and patients who received the recommended phase II dose.
aIncludes patients without a positive immunofixation but with evidence of FLC-kappa by FLC testing.
bIncludes patients without a positive immunofixation but with evidence of FLC-lambda by FLC testing.
cISS staging is derived based on serum beta2-microglobulin and albumin.
dR-ISS staging is derived based on the combination of serum beta2-microglobulin and albumin, genetic risk, and lactate dehydrogenase level.
eThe maximum value from the bone marrow biopsy or bone marrow aspirate is selected if both the results are available.
Source: Clinical Study Report for MonumenTAL-1 (2023).15 The details included in the table are from the sponsor’s summary of clinical evidence.
Exposure to Study Treatments
Patient exposure to study treatments in the MonumenTAL-1 study is presented in Table 13. At the time of analysis, which used the data cut-off date of January 17, 2023, patients in model cohort A received a median of ███ ██████ ███████ ████ ██ ████ ████████ and patients in model cohort C received a median of ███ ██████ ███████ ████ ██ ████ ███████ of talquetamab.
The median dose intensity across all treatment cycles was █████ ██████████ ███████ ████ ██ █████ ███████████ in model cohort A and █████ ██████████ ███████ █████ ██ █████ ███████████ in model cohort C. The median number of doses received was ██ ███████ █ ██ ████ in model cohort A and ██ ███████ █ ██ ███ in model cohort C.
Table 13: Summary of Patient Exposure in MonumenTAL-1 Study
Treatment exposure | 0.4 mg/kg weekly SC and no prior T-cell redirection therapy (model cohort A, N = 143) | 0.8 mg/kg q.2.w. SC and no prior T-cell redirection therapy (model cohort C, N = 145) | 0.4 mg/kg weekly SC or 0.8 mg/kg q.2.w. SC and prior T-cell redirection therapy (model cohort B, N = 51) |
|---|---|---|---|
Duration (months), mean (SD) | ████ ██████ | ████ ██████ | ████ ██████ |
Duration (months), median (range) | ███ ████ ████ | ███ ████ ████ | ███ ████ ████ |
Dose intensity, all treatment cycles (mcg/kg/week)a | |||
Patients, N | ███ | ███ | ██ |
Mean (SD) | █████ ██████ | █████ ██████ | █████ ███████ |
Median (range) | ██████ █████ ██ ██████ | ██████ ██████ ██ ██████ | ██████ █████ ██ ██████ |
Number of doses | |||
Patients, N | 143 | 145 | 51 |
Mean (SD) | █████ ███████ | █████ ███████ | █████ ███████ |
Median (range) | ███ ███ ██ ████ | ███ █████ ████ | ███ ████ ████ |
q.2.w. = once every 2 weeks; SC = subcutaneous; SD = standard deviation.
Note: The data presented in this table were based on analyses at the clinical cut-off date of January 17, 2023, for the all-treated analysis set and patients who received the recommended phase II dose.
aDose intensity (mcg/kg/week) was calculated as the sum of total treatment doses (mcg/kg) received (excluding step-up doses before cycle 1) divided by the protocol-specified cycle length in weeks on talquetamab after the step-up dosing period.
Source: Clinical Study Report for MonumenTAL-1 (2023).15 The details included in the table are from the sponsor’s summary of clinical evidence.
Pretreatment Medications
All pretreatment medications (required and optional) administered at any time during the study are summarized in Table 14. In the MonumenTAL-1 study, all patients received corticosteroids and antipyretics (anilides), while most (94.5% to 100% across analysis cohorts) also received antihistamines (histamine-1 receptor antagonists). The use of corticosteroids as pretreatment medications decreased over the duration of treatment, while the use of anilides and histamine-1 receptor antagonists generally remained stable over time.15
Table 14: Pretreatment Medications in MonumenTAL-1 Study
Pretreatment medication by preferred ATC class | 0.4 mg/kg weekly SC and no prior T-cell redirection therapy (model cohort A, N = 143) | 0.8 mg/kg q.2.w. SC and no prior T-cell redirection therapy (model cohort C, N = 145) | 0.4 mg/kg weekly SC or 0.8 mg/kg q.2.w. SC and prior T-cell redirection therapy (model cohort B, N = 51) |
|---|---|---|---|
Anilides, n (%) | ███ ██████ | ███ ███████ | ██ ███████ |
Glucocorticoids, n (%) | ███ ██████ | ███ ███████ | ██ ███████ |
Histamine-1 receptor antagonists, n (%) | ███ ██████ | ███ ██████ | ██ ███████ |
Serotonin antagonists, n (%) | ██ ██████ | ██ ██████ | ██ ██████ |
Histamine-2 receptor antagonists, n (%) | ██ ██████ | ██ ██████ | ██ ██████ |
Phenothiazine derivatives, n (%) | ██ █████ | ██ █████ | | █████ |
Proton pump inhibitors, n (%) | ██ █████ | | █████ | ██ |
Leukotriene receptor antagonists, n (%) | | █████ | ██ ██████ | | ██████ |
Substituted alkylamines, n (%) | ██ | | █████ | ██ |
Dihydropyridine derivatives, n (%) | ██ | | █████ | ██ |
Heparin group, n (%) | ██ | | █████ | ██ |
Piperazine derivatives, n (%) | | █████ | | █████ | ██ |
Bisphosphonates, n (%) | | █████ | ██ | ██ |
Preparations inhibiting uric acid production, n (%) | | █████ | | █████ | ██ |
Propionic acid derivatives, n (%) | ██ | | █████ | ██ |
Propulsives, n (%) | | █████ | ██ | ██ |
Salt solutions, n (%) | | █████ | | █████ | ██ |
Solutions affecting the electrolyte balance, n (%) | | █████ | | █████ | ██ |
ATC = Anatomical Therapeutic Chemical; q.2.w. = every 2 weeks; SC = subcutaneous.
Note: The data presented in this table were based on analyses at the clinical cut-off date of January 17, 2023, for the all-treated analysis set and patients who received the recommended phase II dose.
Source: Clinical Study Report for MonumenTAL-1 (2023).15
Concomitant Medications
Most patients treated with the RP2D received concomitant medication during treatment (█████ in model cohort A, and ████ of in model cohort C). The most frequently used concomitant medications were ███████████ ███ ███████████ █████████ ███████ █████████████ ██████████ ██████ ███ █████ ██ █████ ███████ █ ███ ██ ██████████████ ████████ ██ ████████ ██████ ███ ███████ ███ ██████ ████ ██████████ ██████ ███ ██████ (Table 15).
Table 15: Concomitant Medication Use in MonumenTAL-1 Study
Concomitant medication by preferred ATC class/drug | 0.4 mg/kg weekly SC and no prior T-cell redirection therapy (model cohort A, N = 143) | 0.8 mg/kg q.2.w. SC and no prior T-cell redirection therapy (model cohort C, N = 145) | 0.4 mg/kg weekly SC or 0.8 mg/kg q.2.w. SC and prior T-cell redirection therapy (model cohort B, N = 51) |
|---|---|---|---|
Patients with 1 or more concomitant medications, n (%) | ███ ██████ | ███ ███████ | ██ ███████ |
Most common concomitant medications in ≥ 50% of patients by ATC class, n (%) | |||
Nucleosides and nucleotides (excluding reverse transcriptase inhibitors) | ███ ██████ | ███ ██████ | ██ ██████ |
Acyclovir | ██ ██████ | ███ ██████ | ██ ██████ |
Valaciclovir | ██ ██████ | ██ ██████ | ██ ██████ |
Anilides | ███ ██████ | ███ ██████ | ██ ██████ |
Paracetamol | ███ ██████ | ███ ██████ | ██ ██████ |
Proton pump inhibitors | ██ ██████ | ██ ██████ | ██ |
Omeprazole | ██ ██████ | ██ ██████ | ██ |
Pantoprazole | ██ ██████ | ██ ██████ | ██ |
Combinations of sulfonamides and trimethoprim, including derivatives | ██ ██████ | ██ | ██ |
Glucocorticoids | ██ ██████ | ██ | ██ ██████ |
Dexamethasone | ██ ██████ | ██ | ██ ██████ |
Natural opium alkaloids | ██ ██████ | ██ | ██ |
Oxycodone | ██ ██████ | ██ | ██ |
Salt solutions | ██ | ██ | ██ ██████ |
Sodium chloride | ██ | ██ | ██ ██████ |
Interleukin inhibitors | ██ | ██ | ██ ██████ |
Tocilizumab | ██ | ██ | ██ ██████ |
ATC = Anatomical Therapeutic Chemical; q.2.w. = every 2 weeks; SC = subcutaneous.
Note: The data presented in this table were based on analyses at the clinical cut-off date of January 17, 2023, for the all-treated analysis set and patients who received the recommended phase II dose.
Source: Clinical Study Report for MonumenTAL-1 (2023).15
Subsequent Antimyeloma Treatment
For the patients who had not received prior T-cell redirection therapy, the median TTNT was ███ ██████ and ████ ██████ in patients treated at 0.4 mg/kg weekly SC (model cohort A) or at 0.8 mg/kg every 2 weeks SC (model cohort C), respectively. The median TTNT was ███ months in patients who had received prior T-cell redirection therapy treated at either RP2D (0.4 mg/kg weekly SC or 0.8 mg/kg every 2 weeks SC) (model cohort B).15 Subsequent antimyeloma therapy was recorded for ██ ████████ ███████ in model cohort A and ██ ████████ ███████ in model cohort C (Table 16).
Table 16: Subsequent Antimyeloma Therapies in MonumenTAL-1 Study
Subsequent antimyeloma therapy | 0.4 mg/kg weekly SC and no prior T-cell redirection therapy (model cohort A, N = 143) | 0.8 mg/kg q.2.w. SC and no prior T-cell redirection therapy (model cohort C, N = 145) | 0.4 mg/kg weekly SC or 0.8 mg/kg q.2.w. SC and prior T-cell redirection therapy (model cohort B, N = 51) |
|---|---|---|---|
Patients with 1 or more subsequent antimyeloma therapies, n (%) | ██ ██████ | ██ ██████ | ██ ██████ |
Subsequent radiotherapy, n (%) | ██ ██████ | ██ █████ | | █████ |
Therapeutic class/pharmacologic class, n (%) | |||
Antineoplastic drugs | ██ ██████ | ██ ██████ | ██ ██████ |
Other antineoplastic drugs | ██ ██████ | ██ ██████ | ██ ██████ |
Alkylating drugs | ██ ██████ | ██ ██████ | ██ ██████ |
Monoclonal antibodies and antibody drug conjugates | ██ ██████ | ██ ██████ | | ██████ |
Plant alkaloids and other natural products | ██ █████ | ██ █████ | | █████ |
Antineoplastic drugs | ██ █████ | | █████ | ██ |
Cytotoxic antibiotics and related substances | | █████ | | █████ | | █████ |
Antimetabolites | | █████ | | █████ | | █████ |
Protein kinase inhibitors | | █████ | | █████ | ██ |
Corticosteroids for systemic use | ██ ██████ | ██ ██████ | ██ ██████ |
Immunosuppressants | ██ ██████ | ██ █████ | | ██████ |
Investigational drugs | | █████ | ██ | | █████ |
All other therapeutic products | ██ | | █████ | ██ |
q.2.w. = every 2 weeks; SC = subcutaneous.
Note: The data presented in this table were based on analyses at the clinical cut-off date of January 17, 2023, for the all-treated analysis set and patients who received the recommended phase II dose.
Source: Clinical Study Report for MonumenTAL-1 (2023).15
Efficacy
Efficacy outcomes for this review were from the most recent analyses in the MonumenTAL-1 study (clinical cut-off date of January 17, 2023) for the all-treated analysis set among the patients who received the RP2D. Key efficacy outcomes are summarized in Table 17. The median follow-up periods for the all-treated analysis set were 18.8 months (range, 0.5+ to 32.9 months) for model cohort A, 12.7 months (range, 0.2+ to 26.1 months) for model cohort C, and 14.8 months (range, 1.0+ to 29.0 months) for model cohort B (“+” denotes patients who died).47
Survival
Overall Survival
At the data cut-off date, the OS data were immature. The median OS was not reached in any model cohort. The 12-month OS rate was greater than 75% among patients who had not received prior T-cell redirection therapy: 76.4% (95% CI, 68.3% to 82.7%) in model cohort A and 77.4% (95% CI, 69.1% to 83.7%) in model cohort C. The main reason for censoring was being in follow-up without an event at the data cut-off date █████ ███ █████ in model cohorts A and C, respectively); the next most common reason was loss to follow-up ████ ███ █████.
Progression-Free Survival
At the data cut-off date, the median PFS was reached in all 3 model cohorts and was 7.5 months (95% CI, 5.7 to 9.4 months) in model cohort A and 14.2 months (95% CI, 9.6 months to not estimable) in model cohort C. █████ of the patients in model cohort A and █████ of the patients in model cohort C were progression-free and alive at 12 months.
In model cohort A, of the reported PFS events, █████ were progressive disease and ████ were death without progressive disease. Reasons for progressive disease in more than 10% of patients were ████████ ██ █████ █████████ ████████ ████████ ██ █████ ████ █████ █████ █████ ████████ ███ ██████████████ █████████████ ████████ ███ ████ ██████ ████████ ███ ████████ ██ ██████████████ ████████████ ████ ███████.
In model cohort C, of the reported PFS events, █████ were progressive disease and █████ were death without progressive disease. Reasons for progressive disease in more than 10% of patients were ████████ ██ █████ █████████ ████████ ████████ ██ █████ ███ ████████ ███ ██████████████ █████████████ ████████ ███ ████ ██████ ████████ ███ █████████ ██████████████ ████████████ ████ ███████.
The Kaplan-Meier plots for OS and PFS for model cohorts A and C are included in Appendix 1.
Tumour Response to Treatment
Overall Response Rate
In the MonumenTAL-1 study, ORR was the primary outcome for phase II and the secondary outcome for phase I.15
In model cohort A, ORR was experienced by 106 patients (74.1%; 95% CI, 66.1% to 81.1%). The P value for declaring that the ORR was higher than 30% was less than 0.0001. Most patients with reduced dosing frequency or dose reductions after an initial response maintained the response after the change:
|██████ ████████ switched from 0.4 mg/kg weekly SC to 0.8 mg/kg every 2 weeks SC after experiencing a response of CR or better for 6 months, per protocol; however, monthly doses were maintained. ███ of these patients experienced disease progression or died by the January 17, 2023, clinical cut-off date.15
|█████████ patients reduced the total monthly dose after a response (██ by reducing dose frequency to every 2 weeks or monthly, ██ by reducing the dose administered each week, and 2 by doing both), usually due to TEAEs. Ten of these patients experienced disease progression or died by the January 17, 2023, clinical cut-off date.15
In model cohort C, ORR was experienced by 104 patients (71.7%; 95% CI, 63.7% to 78.9%). The P value for declaring that the ORR was higher than 30% was less than 0.0001.
The results of prespecified clinically relevant subgroup analyses for ORR showed that in model cohorts A and C, talquetamab delivered consistent ORR by cytogenetic risk at baseline and across other clinically relevant subgroups, except among participants with baseline plasmacytomas. The ORR appeared higher (not tested statistically) among patients with no extramedullary plasmacytomas at baseline (n = 110) (██████ ███ ███ █████ ██ █████ in model cohort A; ██████ ███ ███ █████ ██ █████ in model cohort C) than among those with 1 or more baseline extramedullary plasmacytomas (n = 33) (██████ ███ ███ █████ ██ █████ in model cohort A; ██████ ███ ███ █████ ██ █████ in model cohort C) (Appendix 1, Figure 45, Figure 46).
The detailed treatment responses by category per the IRC (stringent CR, CR, VGPR, and PR, and so forth) and the forest plots of ORR subgroup analyses are given in Table 25 (Appendix 1).
Duration of Response
At the data cut-off date, the median DOR was reached among patients who experienced a PR or better in model cohorts A and B, but not in model cohort C.
Among patients who experienced a PR or better in model cohort A (n = 106), the median follow-up was 18.9 months (range, 2.7 to 32.9 months), with █████ patients having had at least 6 months of follow-up, █████ patients having had at least 9 months of follow-up, and █████ patients having had at least 12 months of follow-up. The median DOR was 9.5 months (95% CI, 6.7 to 13.3 months). The estimated probability of remaining in response at 6 months was █████ ████ ███ █████ ██ ██████ among the 48 patients who experienced CR or better, █████ ████ ███ █████ ██ ██████ among the 37 patients who experienced VGPR as the best response, and █████ ████ ███ ████ ██ ██████ among the 21 patients who experienced PR as the best response.15
Among patients who experienced a PR or better in model cohort C (n = 104), the median follow-up was 12.9 months (range, 4.1 to 26.1 months), with █████ patients having had at least 6 months of follow-up, █████ patients having had at least 9 months of follow-up, and █████ patients having had at least 12 months of follow-up. With █████ of patients who experienced a PR or better having been censored, DOR data were not yet mature. The estimated probability of remaining in response at 6 months was █████ ████ ███ █████ ██ ██████ among the 56 patients who experienced CR or better, █████ ████ ███ ██████ ██████ among the 32 patients who experienced VGPR as the best response, and █████ ████ ███ █████ ██████ among the 16 patients who experienced PR as the best response.15
CR or Better Rate
At the data cut-off date, a CR or better was experienced by 34% of patients (95% CI, 26% to 42%) in model cohort A and 39% of patients (95% CI, 31% to 47%) in model cohort C.
Results Summary of Additional Analyses to Tumour Response Outcomes
For all 3 model cohorts in the MonumenTAL-1 study, the sensitivity analyses and supplemental analyses of OS, PFS, ORR, DOR, and CR or better rate demonstrated similar results to the primary analyses.15
Table 17: Summary of Key Efficacy Results From MonumenTAL-1 Study
Efficacy outcome | 0.4 mg/kg weekly SC and no prior T-cell redirection therapy (model cohort A, N = 143) | 0.8 mg/kg q.2.w. SC and no prior T-cell redirection therapy (model cohort C, N = 145) | 0.4 mg/kg weekly SC or 0.8 mg/kg q.2.w. SC and prior T-cell redirection therapy (model cohort B, N = 51) |
|---|---|---|---|
Survival outcomes | |||
Follow-up duration for OS and PFS (months), median (range) | 18.8 (0.5a to 32.9) | 12.7 (0.2a to 26.1) | 14.8 (1.0a to 29.0) |
OS per IRC assessment | |||
OS events, n (%) | 48 (33.6) | 33 (22.8) | 20 (39.2) |
Censored, n (%) | 95 (66.4) | 112 (77.2) | 31 (60.8) |
Reason for censoring, n (%) | |||
Data cut-off (ongoing) | ██ ██████ | ███ ██████ | ██ ██████ |
Lost to follow-up | | █████ | | █████ | | █████ |
Kaplan-Meier estimate for OS (months) | |||
Median (95% CI) | NE (25.6 to NE) | NE (20.1 to NE) | NE (11.6 to NE) |
6-month OS probability, % (95% CI) | 88.5 (81.9 to 92.8) | 85.2 (78.2 to 90.1) | 80.4 (66.6 to 88.9) |
9-month OS probability, % (95% CI) | 81.0 (73.4 to 86.7) | 83.0 (75.8 to 88.3) | 72.5 (58.0 to 82.7) |
12-month OS probability, % (95% CI) | 76.4 (68.3 to 82.7) | 77.4 (69.1 to 83.7) | 62.9 (47.5 to 74.9) |
PFS per IRC assessment | |||
PFS events, n (%) | 98 (68.5) | 64 (44.1) | 34 (66.7) |
Patients with progressive disease, n (%)b,c | ██ ██████ | ██ ██████ | ██ ██████ |
Reason for progressive diseased | |||
Serum M protein | ██ ██████ | ██ ██████ | | ██████ |
Urine M protein | | █████ | | █████ | | ██████ |
Serum FLCe | ██ ██████ | ██ ██████ | | ██████ |
Bone lesion (new) | ██ ██████ | ██ ██████ | | ██████ |
Extramedullary plasmacytomas (increase in size) | | ██████ | | ██████ | | ██████ |
Extramedullary plasmacytomas (new) | ██ ██████ | ██ ██████ | | ██████ |
Patients who died without progressive diseasec | | █████ | | ██████ | | █████ |
Censored, n (%) | ██ ██████ | ██ ██████ | ██ ██████ |
Reason for censoring, n (%)f | |||
Data cut-off (ongoing) | ██ ██████ | ██ ██████ | ██ ██████ |
Start of subsequent antimyeloma therapy before disease progression or death | | ██████ | ██ ██████ | | ██████ |
Withdrawal of consent to study participation | | █████ | | █████ | | █████ |
Kaplan-Meier estimate for PFS (months) | |||
Median (95% CI) | 7.5 (5.7 to 9.4) | 14.2 (9.6 to NE) | 5.1 (3.4 to 12.3) |
6-month PFS probability, % (95% CI) | 57.9 (49.2 to 65.6) | 63.5 (54.9 to 70.9) | 44.1 (30.2 to 57.2) |
9-month PFS probability, % (95% CI) | 43.8 (35.3 to 51.9) | 58.9 (50.2 to 66.6) | 40.1 (26.6 to 53.2) |
12-month PFS probability, % (95% CI) | ███ █████ ████ | ███ █████ ████ | ███ █████ ████ |
Tumour response to treatment | |||
ORR (sCR + CR + VGPR + PR)g | |||
ORR, n (%) | 106 (74.1) | 104 (71.7) | 33 (64.7) |
95% CI | (66.1 to 81.1) | (63.7 to 78.9) | (50.1 to 77.6) |
1-sided P value | < 0.0001f | < 0.0001f | < 0.0001f |
DORh | |||
Analysis set: patients experiencing a PR or better in all-treated analysis set, N | 106 | 104 | 33 |
Follow-up duration for DOR (months), median (range) | 18.9 (2.7 to 32.9) | 12.9 (4.1 to 26.1) | 15.3 (4.9 to 29.0) |
DOR events, n (%) | 65 (61.3) | 28 (26.9) | 17 (51.5) |
Censored, n (%) | 41 (38.7) | 76 (73.1) | 16 (48.5) |
Kaplan-Meier estimate for DOR (months) | |||
Median (95% CI) | 9.5 (6.7 to 13.3) | NE (13.0 to NE) | 11.9 (4.8 to NE) |
Range | (1a to 31a) | (0a to 22a) | (2 to 22a) |
6-month event-free probability for DOR, % (95% CI) | 67.2 (57.2 to 75.3) | 82.2 (73.2 to 88.4) | 66.3 (47.4 to 79.7) |
9-month event-free probability for DOR, % (95% CI) | 51.5 (41.4 to 60.6) | 76.3 (66.5 to 83.7) | 56.6 (37.9 to 71.6) |
12-month event-free probability for DOR, % (95% CI) | 43.5 (33.8 to 52.8) | 69.3 (57.8 to 78.2) | 48.2 (29.4 to 64.7) |
CR or better (sCR + CR) ratei | |||
CR or better, n (%) | 48 (33.6) | 56 (38.6) | 18 (35.3) |
95% CI | (25.9 to 41.9) | (30.7 to 47.1) | (22.4 to 49.9) |
CI = confidence interval; CR = complete response; DOR = duration of response; FLC = free light chain; IMWG = International Myeloma Working Group; IRC = independent review committee; NE = not estimable; ORR = overall response rate; OS = overall survival; PFS = progression-free survival; PR = partial response; q.2.w. = every 2 weeks; SC = subcutaneous; sCR = stringent complete response; VGPR = very good partial response.
Notes: The data presented in this table were based on analyses at the clinical cut-off date of January 17, 2023, for the all-treated analysis set and patients who received the recommended phase II dose. Progressive disease was assessed by the IRC, based on IMWG consensus criteria (2016).
aFollowing this value, there was a “+” symbol, denoting patients who died, in the sponsor’s submission.
bA patient may show progressive disease based on more than 1 criterion.
cPercentages were based on the number of patients with a PFS event.
dPercentages were based on the number of patients with a progressive disease event.
eOnly applicable to patients without measurable serum and urine M-protein levels.
fPercentages were based on the number of patients censored in the all-treated analysis set.
gStatistical testing was not adjusted for multiple comparisons.
hResponse was assessed by the IRC, based on IMWG consensus criteria (2016).9 Percentages were calculated with the number of patients in the all-treated analysis set as a denominator. Exact 95% CIs were provided.
iDOR was calculated as the number of months from first documented response to progression or death due to any cause. Number of events referred to the number of patients experiencing a PR or better who developed disease progression or died due to any cause.
Sources: Clinical Study Report for MonumenTAL-1 (2023);15 sponsor’s submission.47
Health-Related Quality of Life
European Organisation for Research and Treatment of Cancer Quality of Life Questionnaire Core 30
HRQoL outcomes, assessed with the EORTC QLQ-C30, were only reported for phase II (i.e., part 3) of the MonumenTAL-1 study, and no HRQoL outcomes were assessed in phase I.15,43,45 Scales of pain, fatigue, GHS, and physical functioning in the EORTC QLQ-C30 were considered important by the clinical expert consulted for this review and thus are reported in this section. Data on improvements of at least 10 points (the threshold of a meaningful improvement used by the sponsor)11,46 in selected EORTC QLQ-C30 scales from baseline through cycle 7 day 1 (i.e., the first 6 months) are summarized in Table 18 for phase II cohort A, in Table 19 for phase II cohort C, and in Table 27 (Appendix 1) for phase II cohort B. In the all-treated analysis set and across the 3 cohorts, between █████ ███ █████ of patients experienced improvements of at least 10 points in GHS and physical functioning after the first cycle of talquetamab. Between █████ ███ █████ had at least a 10-point improvement after cycle 7. Similarly, between █████ ███ █████ of patients reported at least 10-point reductions in pain and fatigue symptoms after the first treatment cycle. Between █████ ███ █████ reported reductions of at least 10 points after cycle 7 across the 3 cohorts in phase II of the MonumenTAL-1 study.58
A narrative summary of time to improvement (defined as an increase in score that was at least half of the standard deviation from baseline values) by the sponsor showed that the medians were between 0.3 months and 2.3 months for the selected EORTC QLQ-C30 scales across the 3 cohorts (Appendix 1, Table 28). Time-to-event analysis of the time to worsening for HRQoL showed a median between ███ ██████ ██ ████ ██████ for the selected EORTC QLQ-C30 scales across the 3 cohorts (Appendix 1, Table 28).15
Phase II Cohort A
In this patient population (patients in the phase II trial treated with talquetamab 0.4 mg/kg weekly SC who had received no prior T-cell redirection therapy), compliance in completing the EORTC QLQ-C30 was 97.5% at baseline (119 questionnaires received out of the 122 expected) and ranged from 78.3% to 92.3% at postbaseline assessments through cycle 15 day 1. The proportions of patients who experienced at least a 10-point improvement from baseline through cycle 7 day 1 (i.e., the first 6 months) in pain, fatigue, GHS, and physical functioning subscales were ████ ████ ████ ███ ███, respectively (Table 18).
Phase II Cohort C
In this patient population (patients in the phase II trial treated with talquetamab 0.8 mg/kg every 2 weeks SC who had received no prior T-cell redirection therapy), compliance in completing the EORTC QLQ-C30 was 97.2% at baseline (106 questionnaires received out of the 109 expected) and ranged from 69.2% to 93.7% at postbaseline assessments through cycle 15 day 1. Patients in phase II cohort C reported improvements in GHS and physical functioning compared to baseline, with the improvement likely due to the on-target, off-tumour effects, which seem to improve with time (Appendix 1, Figure 47).15
Phase II Cohort B
In this patient population (patients in the phase II trial treated at either RP2D who had received prior T-cell redirection therapy), compliance in completing the EORTC QLQ-C30 was 91.2% at baseline (31 questionnaires received out of the 34 expected) and ranged from 77.8% to 93.8% at postbaseline assessments through cycle 13 day 1. The proportions of patients who experienced at least a 10-point improvement from baseline through cycle 7 day 1 (i.e., the first 6 months) in pain, fatigue, GHS, and physical functioning subscales were ████ ████ ████ ███ ███, respectively (Appendix 1, Table 27).15
Table 18: Improvement of at Least 10 Points From Baseline in EORTC QLQ-C30 Scales in Phase II for Patients Receiving 0.4 mg/kg Weekly SC With No Prior T-Cell Redirection Therapy
EORTC QLQ-C30 Scale | Cycle 1 day 1 | Cycle 3 day 1 | Cycle 5 day 1 | Cycle 7 day 1 | ||||
|---|---|---|---|---|---|---|---|---|
n | Experienced meaningful change, n (%) | n | Experienced meaningful change, n (%) | n | Experienced meaningful change, n (%) | n | Experienced meaningful change, n (%) | |
Analysis set: all-treated analysis set | 108 | NA | 96 | NA | 73 | NA | 54 | NA |
Pain score | ███ | ███████ | ██ | ███████ | ██ | ███████ | ██ | ██ █████ |
Fatigue | ███ | ███████ | ██ | ███████ | ██ | ███████ | ██ | ██ █████ |
Global health status | ███ | ███████ | ██ | ███████ | ██ | ███████ | ██ | ██ █████ |
Physical functioning | ███ | ███████ | ██ | ███████ | ██ | ███████ | ██ | ██ █████ |
EORTC QLQ-C30 = European Organisation for Research and Treatment of Cancer Quality of Life Questionnaire Core 30; NA = not applicable; SC = subcutaneous.
Note: The data presented in this table were based on analyses at the clinical cut-off date of January 17, 2023. Based on the literature, 10 points was used as the threshold for a meaningful change. Meaningful change indicates meaningful improvement.
Source: Sponsor’s submission.58
Table 19: Improvement of at Least 10 Points From Baseline in EORTC QLQ-C30 Scales in Phase II for Patients Receiving 0.8 mg/kg q.2.w. SC With No Prior T-Cell Redirection Therapy
EORTC QLQ-C30 Scale | Cycle 1 day 1 | Cycle 3 day 1 | Cycle 5 day 1 | Cycle 7 day 1 | ||||
|---|---|---|---|---|---|---|---|---|
n | Experienced meaningful change, n (%) | n | Experienced meaningful change, n (%) | n | Experienced meaningful change, n (%) | n | Experienced meaningful change, n (%) | |
Analysis set: all-treated analysis set | 90 | NA | 73 | NA | 68 | NA | 60 | NA |
Pain score | ██ | ███████ | ██ | ███████ | ██ | ███████ | ██ | ██ █████ |
Fatigue | ██ | ███████ | ██ | ███████ | ██ | ███████ | ██ | ██ █████ |
Global health status | ██ | ███████ | ██ | ███████ | ██ | ███████ | ██ | ██ █████ |
Physical functioning | ██ | ███████ | ██ | ███████ | ██ | ███████ | ██ | ██ █████ |
EORTC QLQ-C30 = European Organisation for Research and Treatment of Cancer Quality of Life Questionnaire Core 30; NA = not applicable; q.2.w. = every 2 weeks; SC = subcutaneous.
Note: The data presented in this table were based on analyses at the clinical cut-off date of January 17, 2023. Based on the literature, 10 points was used as the threshold for meaningful change. Meaningful change indicates meaningful improvement.
Source: Sponsor’s submission.58
Harms
Refer to Table 20 for harms data for the MonumenTAL-1 study (all-treated analysis set), presented from the most recent safety analyses (clinical cut-off date of January 17, 2023).
Adverse Events
All patients in the study reported at least 1 TEAE. The most frequently reported TEAEs were CRS (79.0% in model cohort A and 74.5% in model cohort C), dysgeusia (50.3% and 49.0%), anemia (44.8% and 45.5%), weight decrease (41.3% and 41.4%), pyrexia (39.2% and 27.6%), and neutropenia (35.0% and 28.3%).
Serious AEs
Seventy-six patients (53.1%) in model cohort A and 70 patients (48.3%) in model cohort C reported at least 1 serious TEAE. The most common serious TEAEs occurring in at least 2% of patients were CRS (16.8% and 10.3% in model cohorts A and C, respectively), pyrexia (5.6% and 4.8%), and ICANS (4.1% and 3.7%).
Withdrawal Due to AEs
TEAEs led to discontinuation of talquetamab for 7 patients (4.9%) in model cohort A and 12 patients (8.3%) in model cohort C. In model cohort A, the TEAEs that led to treatment discontinuation for more than 1 patient were ICANS (1.6%) and skin exfoliation (████).15 In model cohort C, the only TEAE that led to treatment discontinuation for more than 1 patient was dysgeusia (1.4%), and study drug-related TEAEs leading to treatment discontinuation occurred in 4.8% of patients.15
Mortality
A TEAE with the outcome of death occurred in 5 patients (3.5%) in model cohort A and 6 patients (4.1%) in model cohort C. One patient (0.7%) in each of these 2 cohorts died due to COVID-19.
Notable Harms
CRS
In model cohort A, at least 1 event of CRS (any grade) was reported for 113 patients (79.0%), with the majority of CRS events occurring early during treatment (33.6% following step-up dose 1, 49.0% following step-up dose 2, and 26.6% following cycle 1 day 1). Using American Society for Transplantation and Cellular Therapy grading, the maximum severity of CRS was grade 1 (62.2% of patients), grade 2 (14.7%), or grade 3 (2.1%); no patients experienced grade 4 or grade 5 CRS. Forty-six patients (32.2%) experienced multiple CRS events, and the grade of CRS worsened at any subsequent event for 6 patients (4.2%).
In model cohort C, at least 1 event of CRS (any grade) was reported for 108 patients (74.5%), with the majority of CRS events occurring early during treatment (26.2% following step-up dose 1, 40.7% following step-up dose 2, and 34.5% following step-up dose 3). Using American Society for Transplantation and Cellular Therapy grading, the maximum severity of CRS was grade 1 (57.2%), grade 2 (16.6%), or grade 3 (0.7%); no patients experienced grade 4 or grade 5 CRS. Forty-six patients (31.7%) experienced multiple CRS events, and the grade of CRS worsened at any subsequent event for 6 patients (4.1%).
Neurologic TEAEs
In model cohort A, at least 1 neurologic TEAE was reported in 123 patients (86.0%), and the most commonly reported neurologic TEAEs (reported in at least 5% of patients) by preferred term were dysgeusia (50.3%), ageusia (19.6%), headache (18.9%), ICANS (10.7%, based on phase II only), dizziness (7.0%), taste disorder (7.0%), and insomnia (7.7%).15
In model cohort C, at least 1 neurologic TEAE was reported in 124 patients (85.5%), and the most commonly reported neurologic TEAEs (reported in at least 5% of patients) by preferred term were dysgeusia (49.0%), ageusia (20.7%), headache (20.7%), dizziness (14.5%), ICANS (11.0%, based on phase II only), paresthesia (5.5%), insomnia (11.0%), and anxiety (5.5%).15
Neurotoxicity
In model cohort A, at least 1 neurotoxicity TEAE was reported for 44 patients (30.8%), and the most commonly reported neurotoxicity TEAEs (reported in at least 5% of patients) by preferred terms were ICANS (10.7%, based on phase II only) and headache (9.1%). Grade 3 ICANS was reported for 2 patients (1.4%). No grade 4 or 5 neurotoxicity TEAEs were reported. Serious neurotoxicity events were reported for 4.2% of patients.
In model cohort C, at least 1 neurotoxicity TEAE was reported for 43 patients (29.7%), and the most commonly reported neurotoxicity TEAEs (reported in at least 5% of patients) by preferred terms were ICANS (11.0%, based on phase II only) and headache (9.0%). Grade 3 neurotoxicity events were reported for 4.8% of patients, including ICANS (3.7%), headache (0.7%), insomnia (0.7%), and nystagmus (0.7%). A single grade 4 neurotoxicity event of ICANS was reported (0.9% of patients), and no grade 5 neurotoxicity events were reported. Serious neurotoxicity events were reported for 4.8% of patients, including ICANS (3.7%), headache (0.7%), insomnia (0.7%), and nystagmus (0.7%).
Infection
In model cohort A, at least 1 infection TEAE (any grade) was reported for 84 patients (58.7%). The most frequently reported infections that were reported in more than 5% of patients were upper respiratory tract infection (12.6%), COVID-19 (10.5%), nasopharyngitis (9.8%), urinary tract infection (9.8%), bronchitis (8.4%), and pneumonia (7.7%). The maximum severity of infections was grade 3 or 4 for 19.6% of patients, with the following Grade 3 or 4 infections each in more than 1 patient: pneumonia (3.5%), urinary tract infection (2.1%), COVID-19 (1.4%), and sepsis (1.4%). Three patients (2.1%) had a grade 5 infection, including 1 patient each with COVID-19 pneumonia, fungal sepsis, and septic shock. Infections were reported as serious TEAEs in 18.9% of patients.
In model cohort C, at least 1 infection TEAE (any grade) was reported for 96 patients (66.2%). The most frequently reported infections that were reported in more than 5% of patients were COVID-19 (23.4%), upper respiratory tract infection (9.0%), nasopharyngitis (6.9%), and pneumonia (6.2%). The maximum severity of infections was grade 3 or 4 for 14.5% of participants, with grade 3 or 4 infections of COVID-19 (2.1%), pneumonia (2.1%), and cellulitis (1.4%) reported in more than 1 patient. Two patients (1.4%) had a grade 5 infection: 1 patient each with COVID-19 pneumonia and “infection” (unknown etiology).
Table 20: Summary of Harms Results From MonumenTAL-1 Study
Adverse events | 0.4 mg/kg weekly SC and no prior T-cell redirection therapy (model cohort A, N = 143) | 0.8 mg/kg q.2.w. SC and no prior T-cell redirection therapy (model cohort C, N = 145) | 0.4 mg/kg weekly SC or 0.8 mg/kg q.2.w. SC and prior T-cell redirection therapy (model cohort B, N = 51) |
|---|---|---|---|
Patients with 1 or more TEAEs | 143 (100.0) | 145 (100.0) | 51 (100.0) |
Maximum toxicity grade, n (%) | |||
Grade 1 | 4 (2.8) | 1 (0.7) | 0 |
Grade 2 | 28 (19.6) | 31 (21.4) | 5 (9.8) |
Grade 3 | 64 (44.8) | 57 (39.3) | 22 (43.1) |
Grade 4 | 42 (29.4) | 50 (34.5) | 24 (47.1) |
Grade 5 | 5 (3.5) | 6 (4.1) | 0 |
MedDRA system organ class/preferred term, n (%) | |||
Immune system disorders | |||
CRS | 113 (79.0) | 108 (74.5) | 39 (76.5) |
Nervous system disorders | |||
Dysgeusia | 72 (50.3) | 71 (49.0) | 31 (60.8) |
Ageusia | NR | 30 (20.7) | NR |
Headache | NR | 30 (20.7) | NR |
Blood and lymphatic system disorders | |||
Anemia | 64 (44.8) | 66 (45.5) | 25 (49.0) |
Thrombocytopenia | 39 (27.3) | 43 (29.7) | 19 (37.3) |
Lymphopenia | 40 (28.0) | 42 (29.0) | NR |
Neutropenia | 50 (35.0) | 41 (28.3) | 28 (54.9) |
Investigations | |||
Weight decreased | 59 (41.3) | 60 (41.4) | 15 (29.4) |
Skin and SC tissue disorders | |||
Skin exfoliation | 40 (28.0) | 58 (40.0) | 23 (45.1) |
Dry skin | 32 (22.4) | 48 (33.1) | 17 (33.3) |
Nail disorder | 32 (22.4) | 31 (21.4) | 14 (27.5) |
Pruritus | 31 (21.7) | 32 (22.1) | 16 (31.4) |
Rash | 31 (21.7) | NR | NR |
Gastrointestinal disorders | |||
Dry mouth | 38 (26.6) | 58 (40.0) | 26 (51.0) |
Diarrhea | 36 (25.2) | 40 (27.6) | NR |
Dysphagia | 34 (23.8) | 36 (24.8) | 12 (23.5) |
Nausea | 29 (20.3) | NR | NR |
Constipation | NR | NR | 12 (23.5) |
General disorders and administration site conditions | |||
Fatigue | 35 (24.5) | 40 (27.6) | 23 (45.1) |
Pyrexia | 56 (39.2) | 40 (27.6) | 16 (31.4) |
Asthenia | 39 (27.3) | NR | NR |
Metabolism and nutrition disorders | |||
Decreased appetite | NR | 38 (26.2) | 11 (21.6) |
Hypokalemia | NR | 30 (20.7) | NR |
Infections and infestations | |||
COVID-19 | NR | 34 (23.4) | NR |
Respiratory, thoracic, and mediastinal disorders | |||
Cough | NR | NR | 16 (31.4) |
Most common serious TEAEs (≥ 2% of patients), n (%) | |||
Patients with 1 or more serious TEAEs | 76 (53.1) | 70 (48.3) | 29 (56.9) |
CRS | 24 (16.8) | 15 (10.3) | 6 (11.8) |
Pyrexia | 8 (5.6) | 7 (4.8) | NR |
ICANS (patients contributing to the analysis for ICANS), Na | 122 | 109 | 34 |
ICANSa | 5 (4.1) | 4 (3.7) | 1 (2.9) |
Pneumonia or COVID-19 | 4 (2.8) | 5 (3.4) | 2 (3.9) |
TEAE leading to discontinuation of study drug, n (%) | |||
Patients with 1 or more TEAEs leading to discontinuation of study drug | 7 (4.9) | 12 (8.3) | 4 (7.8) |
Death, n (%) | |||
TEAE with outcome death | 5 (3.5) | 6 (4.1) | 0 |
Death due to COVID-19 | 1 (0.7) | 1 (0.7) | 0 |
Patients with 1 or more AEs of clinical interest, n (%) | |||
CRS | 113 (79.0) | 108 (74.5) | 39 (76.5) |
Neurologic AE | 123 (86.0) | 124 (85.5) | 43 (84.3) |
Neurotoxicity events | 44 (30.8) | 43 (29.7) | 11 (21.6) |
ICANSa | 13 (10.7) | 12 (11.0) | 1 (2.9) |
Infection | 84 (58.7) | 96 (66.2) | 37 (72.5) |
AE = adverse event; CRS = cytokine release syndrome; ICANS = immune effector cell–associated neurotoxicity syndrome; MedDRA = Medical Dictionary for Regulatory Activities; NR = not reported; q.2.w. = every 2 weeks; SC = subcutaneous; TEAE = treatment-emergent adverse event.
Note: The data presented in this table were based on analyses at the clinical cut-off date of January 17, 2023, for the all-treated analysis set and patients who received the recommended phase II dose.
aPhase I started before the American Society for Transplantation and Cellular Therapy consensus criteria for ICANS were implemented, and ICANS could not be identified or excluded prospectively for patients in phase I. Thus, all percentages for ICANS in this section are based on phase II cohorts only.
Source: Clinical Study Report for MonumenTAL-1 (2023).15 The details included in the table are from the sponsor’s summary of clinical evidence.
Critical Appraisal
Internal Validity
The primary limitation of the MonumenTAL-1 study was the absence of a comparator group to assess the efficacy and harms of talquetamab compared to another relevant treatment (e.g., PIs, IMiDs, or other drugs used to treat r/r MM in Canada); therefore, the interpretation of the results is limited by the single-arm design. A single-arm study design is usually used to provide preliminary evidence of the efficacy of a treatment and to collect safety data (e.g., dose finding) and is not intended to be confirmatory for efficacy.59 According to the FDA, ORR is a direct measure of anticancer activity that may be attributed to the study drug and is evaluable with a single-arm design.60 For other end points it is difficult to make causal conclusions, in particular to what extent the observed effects were attributable to talquetamab, because it is impossible to distinguish between the effects of talquetamab and a placebo effect or the natural history of the disease in the absence of a frame of reference for comparison. The open-label design introduces a potential performance bias and bias in the assessment of PFS, ORR, DOR, CR or better rate, HRQoL, and subjective AEs. This potential for bias was mitigated by using the IRC, which performed tumour assessment per the IMWG criteria9 for the response outcomes.
The sample size and power calculations (in phase II) were based on ORR, which had a prespecified hypothesis that was tested; analyses for all the other outcomes were descriptive. In the MonumenTAL-1 study, values of ORR and the 95% CI excluded the predetermined thresholds for the null hypotheses (30% for model cohorts A and C and 15% for model cohort B) for all 3 model cohorts (P values < 0.0001). Despite the lack of multiplicity adjustment10 for the ORR analyses, the P values were small, suggesting that these were not false-positive results. The review team noted the smaller sample size (N = 51) of model cohort B (patients who had received prior T-cell redirection therapy and who received either of the 2 recommended dosing regimens), further limiting the interpretation of results for these patients. Combining the 2 doses into 1 group in model cohort B does not allow for interpretation of dose-specific effects. According to the sponsor, the phase II prior T-cell redirection therapy cohort was designed at the same time as cohort A and therefore used the 0.4 mg/kg weekly dosing schedule. The phase I patients who had received prior T-cell redirection therapy were not from a specific cohort but were pooled based on prior T-cell redirection therapy; this pooled group therefore included patients receiving both the 0.4 mg/kg and the 0.8 mg/kg dose. Censoring rules for OS and PFS were prespecified and seem appropriate in the MonumenTAL-1 study. At the data cut-off date and across the model cohorts, ██ ██ ██ of the patients were lost to follow-up for OS and | ██ ██ of the patients withdrew consent to study participation. The impact of missing data on OS and PFS appears to be minimal. Patients with missing data or who were lost to follow-up were considered as not experiencing a PR or better for the response analyses, which is considered a conservative approach in this setting.
All planned efficacy and safety outcomes, including sensitivity analyses and supplementary analyses, were performed and reported in accordance with the prespecified statistical plan. Stopping rules were prespecified in the protocol. ORR was examined in prespecified clinically relevant subgroups; however, the sample sizes for the subgroup analyses were small and the analyses were exploratory in nature rather than designed to formally detect differences between subgroups.
The OS data in all 3 model cohorts were immature; therefore, the treatment benefit of OS based on the analysis at the latest data cut-off date would have been subject to a certain degree of uncertainty. At the data cut-off date and across model cohorts A and C, 39% to 58% of the patients received 1 or more subsequent antimyeloma therapy, with a median TTNT ranging from 9.2 months to 16.3 months, which may influence the assessment of the efficacy of talquetamab in relation to OS. In the analysis of PFS, patients were censored at the start of subsequent therapy.
The EORTC QLQ-C30 has been validated in patients with MM and showed evidence of reliability and responsiveness. The clinical expert consulted for this review commented that it is reasonable to use the literature-reported 10-point improvement from baseline value11 in the EORTC QLQ-C30 scores as the clinically meaningful improvement threshold in data analysis. The size of the HRQoL-evaluable population in phase II gradually decreased over time. At cycle 7 day 1, only ██ ██ ███ of all treated patients in cohort A, ██ ██ ██ in cohort C, and ██ ██ ██ in cohort B provided data for the EORTC QLQ-C30 assessment. Thus, the results of the EORTC QLQ-C30 assessment were subject to bias due to incomplete reporting or missing data and, as EORTC QLQ-C30 score is a subjective outcome and due to the open-label study design, beyond the limitations of the study’s single-arm design.
External Validity
The review team noted some differences between the dosing of talquetamab used in the MonumenTAL-1 study and the recommended dosing in the final product monograph. In the product monograph for talquetamab,35 0.4 mg/kg is specified as step-up dose 3, following 2 preceding step-up doses of 0.01 mg/kg and 0.06 mg/kg. However, in the MonumenTAL-1 study, when 0.8 mg/kg SC every 2 weeks was the target dose (phase I part 2 dose expansion or phase II part 3 cohort C), 3 step-up doses of 0.01 mg/kg, 0.06 mg/kg, and 0.3 mg/kg were used, with 0.3 mg/kg as step-up dose 3.15,43 According to the sponsor, the change in the last step-up dose for the 0.8 mg/kg every 2 weeks SC dosing regimen from 0.3 mg/kg (as employed in the MonumenTAL-1 study) to 0.4 mg/kg was recommended to simplify drug labelling and harmonize the 2 RP2D dosing schedules (i.e., 0.4 mg/kg weekly SC and 0.8 mg/kg every 2 weeks SC).47 The sponsor reported that the final population pharmacokinetic modelling report showed that the simulated talquetamab serum concentration-time profiles were comparable between the studied step-up dose schedule (0.01 mg/kg, 0.06 mg/kg, and 0.3 mg/kg) and the proposed step-up dose schedule (0.01 mg/kg, 0.06 mg/kg, and 0.4 mg/kg) for the 0.8 mg/kg every 2 weeks SC dosing regimen, suggesting a similar safety and efficacy profile for the proposed dosing regimen as for the dosing regimen evaluated in the MonumenTAL-1 study. The sponsor further indicated that the safety profile of the proposed step-up dose schedule for the 0.8 mg/kg every 2 weeks SC regimen, particularly the CRS profile, has been established in the 0.4 mg/kg weekly SC cohort, as these proposed step-up doses (0.01 mg/kg, 0.06 mg/kg, and 0.4 mg/kg) are the same as the step-up doses in combination with the first treatment dose for the 0.4 mg/kg weekly SC dosing regimen, which was evaluated in the MonumenTAL-1 study.47 The review team regards the sponsor’s explanations regarding the difference in the third step-up dose for the 0.8 mg/kg every 2 weeks SC dosing regimen of talquetamab as reasonable.
The inclusion and exclusion criteria and baseline characteristics of the MonumenTAL-1 study were generalizable to adults with r/r MM in clinical practice in Canada. However, there is a lack of ethnic diversity as most patients in the MonumenTAL-1 study were white (86% to 90%), with the next largest groups by ethnicity being Black or African American (6% to 8%) and Asian (1% to 4%). Previous studies in the US found that MM is twice as common in African American individuals than in Caucasian or Asian individuals.7,12 The clinical expert pointed out that the patients in the MonumenTAL-1 study were younger (the mean age of patients who had and had not received prior T-cell redirection therapy was 65 years and 61 years, respectively) and had less severe disease than patients with r/r MM seen in clinical practice in Canada. The fact that the patient population in the MonumenTAL-1 study is not very diverse in ethnicity, is younger in age, and has milder disease severity than the general population of patients with r/r MM may impact the generalizability of the study results, although the extent of such influence is uncertain.
Dose adjustments were allowed in the trial, and the dose adjustment methods were outlined in the protocol. The clinical expert consulted for this review noted that the dose adjustments or modifications described in the MonumenTAL-1 study are also anticipated in a clinical practice setting to manage AEs while maintaining drug benefit. According to the inputs from the patient and clinician groups and the clinical expert, the MonumenTAL-1 study included outcomes that were regarded as relevant and important to patients, clinicians, and drug plans, including the survival, treatment response, HRQoL, and safety outcomes.
GRADE Summary of Findings and Certainty of the Evidence
Methods for Assessing the Certainty of the Evidence
For the pivotal studies and randomized controlled trials identified in the sponsor’s systematic review, GRADE was used to assess the certainty of the evidence for the outcomes considered most relevant to inform the review team’s expert committee deliberations, and a final certainty rating was determined as outlined by the GRADE Working Group:13,14
High certainty: We are very confident that the true effect lies close to that of the estimate of the effect.
Moderate certainty: We are moderately confident in the effect estimate — The true effect is likely to be close to the estimate of the effect, but there is a possibility that it is substantially different. We use the word “likely” for evidence of moderate certainty (e.g., “X intervention likely results in Y outcome”).
Low certainty: Our confidence in the effect estimate is limited — The true effect may be substantially different from the estimate of the effect. We use the word “may” for evidence of low certainty (e.g., “X intervention may result in Y outcome”).
Very low certainty: We have very little confidence in the effect estimate — The true effect is likely to be substantially different from the estimate of effect. We describe evidence of very low certainty as “very uncertain.”
Although GRADE guidance is not available for noncomparative studies, the review team assessed pivotal single-arm trials for study limitations (which refers to internal validity or risk of bias), inconsistency across studies, indirectness, and publication bias to present these important considerations. Because the lack of a comparator arm does not allow for a conclusion to be drawn on the effect of the intervention versus any comparator, the certainty of evidence for single-arm trials started at very low certainty with no opportunity for rating up.
Results of GRADE Assessments
Table 2 presents the GRADE summary of findings for talquetamab in adult patients with r/r MM who have received at least 3 prior lines of therapy, including a PI, an IMiD, and an anti-CD38 monoclonal antibody, and have experienced disease progression on or after the last therapy. The selected outcomes for GRADE assessment include OS, PFS, ORR, DOR, CR or better rate, EORTC QLQ-C30, and notable harms for patients in model cohort A and model cohort C separately. The outcomes in model cohort B were not assessed using GRADE due to the small sample size and the exploratory nature of that population cohort.
Long-Term Extension Studies
The contents of this section have been informed by materials submitted by the sponsor. The following has been summarized and validated by the review team.
There are no longer-term extension studies evaluating talquetamab for adults with r/r MM who have received at least 3 prior lines of therapy, including a PI, an IMiD, and an anti-CD38 monoclonal antibody, and who have experienced disease progression on the last therapy. Long-term follow-up of the MonumenTAL-1 trial is currently under way.16,17
Indirect Evidence
The sponsor provided nonrandomized comparative studies, which are summarized and appraised in the section on studies addressing gaps in the evidence from the systematic review.
Studies Addressing Gaps in the Systematic Review Evidence
The contents of this section have been informed by materials submitted by the sponsor. The following has been summarized and validated by the review team. The sponsor submitted evidence within the indirect treatment comparisons section of the submission that used IPD from included studies. These are therefore considered nonrandomized comparisons, thus the reference to them as such.
Objectives for the Summary of Studies Addressing Gaps
The objective of the submitted nonrandomized studies is to generate evidence comparing talquetamab to other key comparators in the PE model. The 3 nonrandomized studies presented in this section were commissioned and submitted by the sponsor as, at the time of this submission, there were no direct randomized comparisons of talquetamab to relevant comparators in Canada for the treatment of adult patients with triple-class exposed r/r MM with at least 3 prior lines of therapy who experienced disease progression on the last therapy.
Description of Studies Addressing Gaps
Sponsor-Submitted Nonrandomized Studies
Three nonrandomized studies were submitted that compared the efficacy of talquetamab to RWPC, teclistamab, and cilta-cel in patients with r/r MM who have received at least 3 prior lines of therapy. Studies were selected for inclusion in the comparisons if they assessed treatment for r/r MM, included patients (or a subset of patients) with triple-class exposed r/r MM who had received at least 3 prior lines of therapy, and reported sufficient efficacy outcome data. A systematic literature review was not conducted to identify studies informing the nonrandomized comparisons; however, key comparators were identified using the CADTH Provisional Algorithm.8 IPD from studies of talquetamab and the key comparators in the PE model (RWPC, teclistamab, and cilta-cel) were compared using IPTW, with the aim of balancing patient characteristics across groups. A summary of the study selection criteria is presented in Table 21.
Table 21: Study Selection Criteria and Methods for Nonrandomized Comparisons Submitted by the Sponsor
Characteristics | Selection criteria |
|---|---|
Population | Patients with MM diagnosis per IMWG Patients (or a subset of patients) with TCE r/r MM (with prior exposure to PI, IMiD, and anti-CD38 mAb) |
Intervention | Any therapy for r/r MM |
Comparator | Any |
Outcome | Efficacy
|
Study designs | RCTs, nonrandomized clinical trials, observational studies, database studies |
Publication characteristics | Data on file and full-text publications |
Exclusion criteria | None |
Databases searched | None |
Selection process | Best-available data for key r/r MM comparators were selected |
Data extraction process | Data were extracted by a single reviewer and confirmed by a second reviewer |
Quality assessment | Quality assessment was not performed |
CR = complete response; DOR = duration of response; IMiD = immunomodulatory drug; IMWG = International Myeloma Working Group; mAb = monoclonal antibody; MM = multiple myeloma; ORR = overall response rate; OS = overall survival; PFS = progression-free survival; PI = proteasome inhibitor; RCT = randomized controlled trial; r/r MM = relapsed or refractory multiple myeloma; TCE = triple-class exposed; TTNT = time to next treatment; VGPR = very good partial response.
Source: The details included in the table are from the sponsor’s summary of clinical evidence.
Design of the Comparisons
Objectives
The following sponsor-submitted nonrandomized studies were conducted to generate relative efficacy data in support of the PE model:
talquetamab (model cohort A and model cohort C) versus RWPC
talquetamab (model cohort A and model cohort C) versus teclistamab
talquetamab (model cohort A and model cohort C) versus cilta-cel.
Study Selection Methods
Best-available data, rather than a comprehensive systematic literature review, were used to select studies for the sponsor-submitted nonrandomized studies. Key comparators were identified using the CADTH Provisional Algorithm. Studies were included if they assessed treatment for r/r MM in patients who had received at least 3 prior lines of therapy and reported sufficient efficacy outcome data. As a full systematic review was not conducted, no information is available regarding the search strategy or methods used to screen articles. Data extraction was performed by a single reviewer and confirmed by a second reviewer to ensure accuracy and consistency. Quality assessment was not performed in this review. Consequently, no studies were excluded based on quality criteria, and potential risk of bias or quality issues in the comparator arms are unknown.
Analysis Methods for the Sponsor-Submitted Nonrandomized Studies
Talquetamab in MonumenTAL-1 Study Versus RWPC in LocoMMotion and MoMMent Studies61,62
The study comparing talquetamab to RWPC used IPD from each treatment and IPTW methods, with ATT weights, to compare differences in ORR, CR or better rate, VGPR or better rate, DOR, PFS, TTNT, and OS. The 2 MonumenTAL-1 study cohorts, which received talquetamab at different dosing schedules (0.4 mg/kg weekly SC and 0.8 mg/kg every 2 weeks SC), were separately compared to the RWPC cohort derived from pooled data from 2 prospective cohort studies (LocoMMotion and MoMMent). Patients that received the following regimens were included in the LocoMMotion and MoMMent studies: pomalidomide-cyclophosphamide-dexamethasone; Pd; carfilzomib-cyclophosphamide-dexamethasone; Kd; carfilzomib-lenalidomide-dexamethasone; lenalidomide-dexamethasone; daratumumab-bortezomib-dexamethasone; belantamab mafodotin; panobinostat, bortezomib, and dexamethasone; elotuzumab, pomalidomide, and dexamethasone; ixazomib, lenalidomide, and dexamethasone; bortezomib, bendamustine, and dexamethasone; carfilzomib, pomalidomide, and dexamethasone; cyclophosphamide and dexamethasone; daratumumab, pomalidomide, and dexamethasone; melphalan and dexamethasone; and idecabtagene vicleucel.61,62 Only patients from the RWPC cohort meeting the key eligibility criteria for phase II of the MonumenTAL-1 trial were included in the comparative effectiveness analyses. These criteria included having measurable disease defined by the IMWG criteria, at least 3 prior lines of therapy, documented evidence of progressive disease by IMWG criteria on or within 12 months of the patient’s last line of therapy, an ECOG Performance Status of 0 to 2, and no prior T-cell redirection therapy.61,62
IPD were available for physician’s choice of therapy from the LocoMMotion and MoMMent studies and are outlined in Table 22.63,64 Using IPD from the MonumenTAL-1 study and the LocoMMotion study combined with the MoMMent study, analyses were conducted using IPTW methods with ATT weights to compare the efficacy of talquetamab versus RWPC. The clinical cut-off dates were January 17, 2023, for the MonumenTAL-1 trial; October 27, 2022, for the LocoMMotion study; and March 13, 2023, for the MoMMent study. The median follow-up was 16.3 months in the MonumenTAL-1 study for both cohorts (18.8 months for the 0.4 mg/kg weekly cohort and 12.7 months for the 0.8 mg/kg every 2 weeks cohort), 26.4 months in the LocoMMotion study, and 9.3 months in the MoMMent study. The 2 MonumenTAL-1 study cohorts, which received talquetamab at different dosing schedules, were separately compared to the RWPC cohort.61,62
The clinical experts consulted by the sponsor identified a priori a list of potential baseline factors that were important prognostic factors in the setting of later-line r/r MM (Table 22).61,62 Multiple imputation by chained equations was used to impute missingness. Propensity scores were derived with a multivariable logistic regression using each cohort (the MonumenTAL-1 study versus the RWPC cohort) as the dependent variable and selected baseline prognostic variables as explanatory factors. To estimate the ATT population, patient weights were derived from the propensity scores using weighting formulas for the desired target population. The patients in the MonumenTAL-1 study were assigned a weight of 1, and the patients in the RWPC cohort were reweighted in terms of observed characteristics to become similar to the MonumenTAL-1 study population. Weightings were scaled such that they improved the balance of prognostic variables and summed to the original number of participants in the RWPC cohort. Baseline characteristics after weighting were provided for included IPD but were not broken down by analysis subsets.
The comparative efficacy of talquetamab versus RWPC was determined in terms of ORR, CR or better rate, VGPR or better rate, DOR, PFS, TTNT, and OS. Estimates of comparative efficacy were derived for both the unadjusted comparison (i.e., talquetamab versus RWPC before IPTW) and the adjusted comparison (i.e., with IPTW). For binary outcomes (i.e., ORR, CR or better rate, and VGPR or better rate), weighted logistic regression was used to estimate odds ratios, response rate ratios, and rate differences with the respective 95% CIs. For time-to-event outcomes (i.e., DOR, PFS, OS, and TTNT), a weighted Cox proportional hazards model was used to estimate HRs and respective 95% CIs.61,62 Assessment of the assumption of proportional hazards for survival outcomes was based on visual inspection of the log-cumulative hazard plot, visual inspection of the Schoenfeld residuals plot, and performance of the Grambsch-Therneau test.
Sensitivity analyses included ATT with all variables, multivariable regression, average treatment effect in the overlap, average treatment effect, and ECOG Performance Status matching. E-values were also reported as a measure for estimating the impact of unmeasured confounders.
Talquetamab in MonumenTAL-1 Study Versus Teclistamab in MajesTEC-1 Study65
The study comparing talquetamab to teclistamab used IPTW methods with ATT weights to compare differences in ORR, CR or better rate, VGPR or better rate, DOR, PFS, TTNT, and OS. The 2 MonumenTAL-1 study cohorts, which received talquetamab at different dosing schedules (0.4 mg/kg weekly SC and 0.8 mg/kg every 2 weeks SC), were separately compared to the teclistamab cohort, which was formed by the MajesTEC-1 phase I/II single-arm trial. Only patients from the MajesTEC-1 study meeting the key eligibility criteria for phase II of the MonumenTAL-1 trial were included in the comparative effectiveness analyses. These criteria include having measurable disease defined by the IMWG criteria, at least 3 prior lines of therapy, documented evidence of progressive disease by IMWG criteria on or within 12 months of the patient’s last line of therapy, an ECOG Performance Status of 0 to 2, and no prior T-cell redirection therapy.65
Using IPD from both the MonumenTAL-1 trial and the MajesTEC-1 trial, comparisons were conducted using IPTW methods with ATT weights to compare the efficacy of talquetamab versus teclistamab in patients with triple-class exposed r/r MM. The MonumenTAL-1 study clinical cut-off date was January 17, 2023, with a median follow-up of 18.8 months for the 0.4 mg/kg weekly SC cohort and 12.8 months for the 0.8 mg/kg every 2 weeks SC cohort. The MajesTEC-1 study clinical cut-off date was January 4, 2023, with a median follow-up of 22.8 months. The 2 MonumenTAL-1 study cohorts, which received talquetamab at different dosing schedules, were separately compared with the all-treated population in the MajesTEC-1 trial.65
To allow for the MajesTEC-1 cohort to be reweighted to align with the MonumenTAL-1 study cohort, IPTW with ATT was chosen as the statistical method for the main analysis, which included all known prognostic factors with sufficient data as identified by the sponsor’s clinical experts.65 Propensity scores were derived through a multivariable logistic regression, using each cohort (the MonumenTAL-1 study versus the MajesTEC-1 study) as the dependent variable and selected baseline prognostic variables as explanatory factors. Missing data were imputed using multiple imputation by chained equations. To estimate the ATT population, patient weights were derived from the propensity scores using weighting formulas for the desired target population. The patients in the MonumenTAL-1 study were assigned a weight of 1, and the patients in the MajesTEC-1 cohort were reweighted to become similar to the MonumenTAL-1 study population. Weightings were scaled such that they improved the balance of prognostic variables and summed to the original number of participants in the MajesTEC-1 cohort. Baseline characteristics after weighting were provided for included IPD but were not broken down by analysis subsets.
The comparative efficacy of talquetamab versus teclistamab was determined in terms of ORR, CR or better rate, VGPR or better rate, DOR, PFS, TTNT, and OS. Estimates of comparative efficacy were derived for both the unadjusted comparison (i.e., talquetamab versus teclistamab before IPTW) and the adjusted comparison (i.e., with IPTW). For binary outcomes (e.g., ORR, CR or better rate, and VGPR or better rate), an unweighted logistic regression including the selected baseline characteristics as prognostic variables was used to estimate the odds ratio, and rate difference with the respective 95% CIs. For the time-to-event outcomes (e.g., DOR, PFS, OS, and TTNT), an unweighted Cox proportional hazards model including the selected baseline characteristics as prognostic variables was used to estimate the HR and its respective 95% CI. For all time-to-event analyses, observed and weighted survival curves were reported, including the number of participants at risk over time.65 Assessment of the assumption of proportional hazards for survival outcomes was based on visual inspection of the log-cumulative hazard plot, visual inspection of the Schoenfeld residuals plot, and performance of the Grambsch-Therneau test.
Sensitivity analyses included ATT with all variables, multivariable regression, average treatment effect in the control, average treatment effect in the overlap, average treatment effect, and ECOG Performance Status matching. E-values were also reported as a measure for estimating the impact of unmeasured confounders.
Talquetamab in MonumenTAL-1 Study Versus Cilta-Cel in CARTITUDE-1 Study66
The nonrandomized study comparing talquetamab to cilta-cel used IPTW methods with ATT weights to compare differences in ORR, CR or better rate, VGPR or better rate, DOR, PFS, TTNT, and OS. The 2 MonumenTAL-1 study cohorts, which received talquetamab at different dosing schedules (0.4 mg/kg weekly SC and 0.8 mg/kg every 2 weeks SC), were separately compared to the cilta-cel cohort, which was formed from the CARTITUDE-1 phase I/II single-arm trial.
Both the MonumenTAL-1 and CARTITUDE-1 trials included patients diagnosed with MM according to IMWG criteria, requiring measurable disease and specific serum or urine M-protein levels. The MonumenTAL-1 trial enrolled patients with an ECOG Performance Status of 0 to 2 and required patients to have received at least 3 prior lines of therapy, including a PI, an IMiD, and an anti-CD38 monoclonal antibody. The CARTITUDE-1 trial had similar inclusion criteria but required patients to have disease that was double refractory to an IMiD and a PI or to have received at least 3 prior lines of therapy. Both trials mandated documented evidence of disease progression within 12 months of the last line of therapy, based on IMWG criteria, and included patients with disease progression within 6 months whose disease was refractory or nonresponsive to their most recent therapy. Additionally, both trials required patients to meet certain clinical laboratory values and had similar exclusion criteria.66
Using IPD from the MonumenTAL-1 trial and from the CARTITUDE-1 trial, IPTW methods with ATT weights were used to compare the efficacy of talquetamab versus cilta-cel in patients with triple-class exposed r/r MM. The MonumenTAL-1 study clinical cut-off date was January 17, 2023, with a median follow-up of 18.8 months for the 0.4 mg/kg weekly SC cohort and 12.8 months for the 0.8 mg/kg every 2 weeks SC cohort. The CARTITUDE-1 trial clinical cut-off date was January 2022, with a median follow-up time of 29.0 months. The 2 MonumenTAL-1 study cohorts, which received talquetamab at different dosing schedules, were separately compared with the intention-to-treat population in the CARTITUDE-1 trial.66
IPTW with ATT was chosen as the statistical method for the main analysis, which included all prognostic factors with sufficient data, as identified by the sponsor’s clinical expert (Table 22).66 Propensity scores were derived through a multivariable logistic regression, using each cohort (the MonumenTAL-1 study versus the CARTITUDE-1 study) as the dependent variable and selected baseline prognostic variables as explanatory factors. Missing data were imputed using multiple imputation by chained equations. To estimate the ATT population, patient weights were derived from the propensity scores using weighting formulas for the desired target population. The patients in the MonumenTAL-1 study were assigned a weight of 1, and the patients in the CARTITUDE-1 study were reweighted to become similar to the MonumenTAL-1 study population. Weightings were scaled such that they improved the balance of prognostic variables and summed to the original number of participants in the CARTITUDE-1 study cohort. Baseline characteristics after weighting were provided for included IPD but were not broken down by analysis subsets.
The comparative effectiveness of talquetamab versus cilta-cel was determined in terms of ORR, CR or better rate, VGPR or better rate, DOR, PFS, TTNT, and OS. Estimates of comparative effectiveness were derived for both the unadjusted comparison (i.e., talquetamab versus cilta-cel before IPTW) and the adjusted comparison (i.e., with IPTW). For binary outcomes (e.g., ORR, CR or better rate, and VGPR or better rate), a weighted logistic regression was used to estimate odds ratios with the respective 95% CIs and rate differences. Response rate ratios were estimated using the same approach. For the time-to-event outcomes (e.g., DOR, PFS, OS, and TTNT), a weighted Cox proportional hazards model was used to estimate HRs and respective 95% CIs. For all time-to-event analyses, observed and weighted survival curves were reported, including the number of participants at risk over time.66
Sensitivity analyses included ATT with all variables, multivariable regression, average treatment effect in the overlap, average treatment effect, average treatment effect in the control, and performance status matching. E-values were also reported as a measure for estimating the impact of unmeasured confounders.
Table 22: Sponsor-Submitted Indirect Treatment Comparison Analysis Methods
Methods | Talquetamab (MonumenTAL-1) vs. RWPC (LocoMMotion and MoMMent)61,62 | Talquetamab (MonumenTAL-1) vs. teclistamab (MajesTEC- 1)65 | Talquetamab (MonumenTAL-1) vs. cilta-cel (CARTITUDE-1)66 |
|---|---|---|---|
Analysis methods | IPTW with ATT weighting | ||
Data sources | Main analysis: Talquetamab: IPD from the MonumenTAL-1 study (all-treated analysis set included 143 participants in the 0.4 mg/kg weekly SC cohort and 145 participants in the 0.8 mg/kg q.2.w. SC cohort) RWPC: IPD from LocoMMotion and MoMMent studies (177 participants)63,64 Subgroup analysis (≥ 4 prior lines of therapy) Talquetamab: IPD from the MonumenTAL-1 study (117 participants in the 0.4 mg/kg weekly SC cohort and 113 participants in the 0.8 mg/kg q.2.w. SC cohort) RWPC: IPD from LocoMMotion and MoMMent studies (131 participants) | Main analysis: Talquetamab: IPD from the MonumenTAL-1 study (all-treated analysis set included 143 participants in the 0.4 mg/kg weekly SC cohort and 145 participants in the 0.8 mg/kg q.2.w. SC cohort) Teclistamab: IPD from the MajesTEC-1 study (all-treated analysis set included 165 participants)39 Subgroup analysis (≥ 4 prior lines of therapy) Talquetamab: IPD from the MonumenTAL-1 study (117 participants in the 0.4 mg/kg weekly SC cohort and 113 participants in the 0.8 mg/kg q.2.w. SC cohort) Teclistamab: IPD from the MajesTEC-1 study (122 participants) | Main analysis: Talquetamab: IPD from the MonumenTAL-1 study (all-treated analysis set included 143 participants in the 0.4 mg/kg weekly SC cohort and 145 participants in the 0.8 mg/kg q.2.w. SC cohort) Cilta-cel: IPD from the CARTITUDE-1 study (113 participants)67 Subgroup analysis (≥ 4 prior lines of therapy) Talquetamab: IPD from the MonumenTAL-1 study (117 participants in the 0.4 mg/kg weekly SC cohort and 113 participants in the 0.8 mg/kg q.2.w. SC cohort) Cilta-cel: IPD from the CARTITUDE-1 study (93 participants) |
Outcomes | Response outcomes: ORR, CR or better rate, VGPR or better rate Time-to-event outcomes: DOR, PFS, OS, and TTNT | ||
Model estimation |
|
|
|
Covariates included | Main analysis
Sensitivity analysis
|
|
|
Assessment of balance/assessment of distribution or overlap in propensity score or patient weights | SMD was used to assess the degree of imbalance between the groups. Values > 0.2 were considered to indicate important differences. Additionally, balance between the MonumenTAL-1 study cohort and the RWPC cohort was evaluated by comparing unweighted and weighted propensity score distributions. | SMD was used to assess the degree of imbalance between the groups. Values > 0.2 were considered to indicate important differences. Additionally, balance between the MonumenTAL-1 study cohort and the MajesTEC-1 study cohort was evaluated by comparing unweighted and weighted propensity score distributions. | SMD was used to assess the degree of imbalance between the groups. Values > 0.2 were considered to indicate important differences. Additionally, balance between the MonumenTAL-1 study cohort and the CARTITUDE-1 study cohort was evaluated by comparing unweighted and weighted propensity score distributions. |
Sensitivity analyses |
|
|
|
Scenario analyses | NA | NA | NA |
Subgroup analysis |
|
|
|
ATE = average treatment effect; ATO = average treatment effect in the overlap; ATT = average treatment effect in the treated; CI = confidence interval; cilta-cel = ciltacabtagene autoleucel; CR = complete response; DOR = duration of response; ECOG = Eastern Cooperative Oncology Group; HR = hazard ratio; IPD = individual patient data; IPTW = inverse probability treatment weighting; ISS = International Staging System; MM = multiple myeloma; NA = not applicable; ORR = overall response rate; OS = overall survival; PFS = progression-free survival; q.2.w. = every 2 weeks; r/r MM = relapsed or refractory multiple myeloma; RWPC = real-world physician’s choice of therapy; SC = subcutaneous; SMD = standardized mean difference; TTNT = time to next treatment; VGPR = very good partial response; vs. = versus.
Sources: Janssen Research & Development, data on file;61 Einsele et al.(2024);62 Janssen Research & Development, data on file;65 Janssen Research & Development, data on file.66 The details included in the table are from the sponsor’s summary of clinical evidence.
Results of the Nonrandomized Comparisons
Summary of Included Studies: Sponsor-Submitted Nonrandomized Comparisons Supporting PE Model
Talquetamab in MonumenTAL-1 Study Versus RWPC in LocoMMotion and MoMMent Studies61,62
The MonumenTAL-1 study is an ongoing phase I/II, open-label, multicentre clinical trial as described in earlier sections of this report. The LocoMMotion study (N = 248) is a prospective, multinational, observational study of RWPC treatments in patients with r/r MM who have received at least 3 prior lines of therapy or who have disease that is double refractory to an IMiD and a PI. It enrolled 248 participants from 76 sites across Europe and the US between August 2019 and October 2020, with a clinical cut-off date in October 2022 and a median follow-up of 26.4 months. The primary end point is ORR, with secondary end points including CR, VGPR, stringent CR, DOR, PFS, TTNT, and OS. The MoMMent study (N = 54), similar to the LocoMMotion study, is a prospective observational study documenting RWPC and outcomes in patients with triple-class exposed disease, with 2 periods: patients who received an PI, an IMiD, and an anti-CD38 monoclonal antibody (period 1); patients who additionally received BCMA-targeted therapy (period 2). Recruitment began in November 2021 across 51 sites in Europe, with a clinical cut-off date in March 2023 and a median follow-up of 9.3 months. The primary end point is ORR, with secondary end points mirroring those in the LocoMMotion study.
A total of 177 participants (58.6%) from the LocoMMotion and MoMMent studies met the MonumenTAL-1 study inclusion criteria and were eligible for analysis. The selected prognostic factors were refractory status, ISS stage, time to progression on the last regimen, presence of extramedullary plasmacytoma, number of prior lines of therapy, years since MM diagnosis, average duration of prior lines of therapy, age, hemoglobin levels, LDH levels, creatinine clearance, ECOG Performance Status, sex, type of MM, prior stem cell transplant, race, and cytogenetic profile. In the main analyses, no variables required imputation for the MonumenTAL-1 study population. For the RWPC cohort, the following proportions of the prognostic factors required imputation: ISS stage (19.8%), LDH levels (17.5%), type of MM (23.7%), and race (20.3%). Cytogenetic profile was excluded from the main analyses due to a high degree of missingness (44.1% missing). Additionally, race was not included in the main analyses due to extreme weights after imputation. However, both race and cytogenetic profile were adjusted for in a sensitivity analysis. Imputation was not done for cytogenetic profile; instead, “missing” was added as a categorical variable in the sensitivity analysis, including all variables, with multiple imputation by chained equations used to impute missingness for race.
Before weighting, both the 0.4 mg/kg weekly SC cohort and the 0.8 mg/kg every 2 weeks SC cohort in the MonumenTAL-1 study exhibited several baseline differences compared to the RWPC cohort. Compared with the 0.4 mg/kg cohort, more patients receiving RWPC had triple-refractory disease (22.9% versus 10.3%) and fewer had penta-refractory disease (21.4% versus 33.3%). Also, a higher percentage of patients receiving RWPC were in ISS stage III (23.7% versus 17.1%) and a lower percentage had extramedullary plasmacytomas (11.5% versus 23.9%). Fewer patients receiving RWPC had experienced disease progression in less than 3 months on their last regimen (16.8% versus 30.8%), and a smaller proportion were younger than 65 years (31.3% versus 43.6%). Similarly, compared with the 0.8 mg/kg cohort, the RWPC cohort had more patients with triple-refractory disease (22.9% versus 16.8%) and fewer patients with penta-refractory disease (21.4% versus 28.3%), along with a higher proportion of patients in ISS stage I (37.4% versus 42.5%). Also, fewer patients receiving RWPC had extramedullary plasmacytomas (11.5% versus 24.8%), fewer had experienced disease progression in less than 3 months on their last regimen (16.8% versus 30.1%), and fewer were younger than 65 years (31.3% versus 41.6%).
After ATT weighting, the balance between the MonumenTAL-1 study cohorts and the RWPC cohort improved. For the 0.4 mg/kg cohort, the standardized mean difference (SMD) for refractory status dropped to 0.141 and for ISS stage to 0.119. The overall balance improved, with the mean SMD decreasing from 0.209 to 0.093 and the percentage of SMDs that were less than or equal to 0.1 increasing from 20% to 47%. For the 0.8 mg/kg cohort, the SMD for refractory status reduced to 0.123 and for ISS stage to 0.058. The mean SMD decreased from 0.214 to 0.089, and the percentage of SMDs that were less than or equal to 0.1 increased from 7% to 53%.
A further summary of the characteristics of the studies used to generate the comparison is provided in Table 23.
Talquetamab in MonumenTAL-1 Study Versus Teclistamab in MajesTEC-1 Study65
A total of 165 participants from the MajesTEC-1 study met the MonumenTAL-1 study inclusion criteria and were eligible for the main analysis. The prognostic factors were refractory status, ISS stage, time to progression on the last regimen, presence of extramedullary plasmacytoma, number of prior lines of therapy, years since MM diagnosis, average duration of prior lines of therapy, age, hemoglobin levels, LDH levels, creatinine clearance, ECOG Performance Status, sex, type of MM, prior stem cell transplant, race, and cytogenetic profile. Low-risk imputation was used to impute missingness. For the MonumenTAL-1 study 0.4 mg/kg weekly SC cohort, no variables required imputation, and for the MonumenTAL-1 study 0.8 mg/kg every 2 weeks SC cohort, ISS stage required imputation (0.7% missing). For the MajesTEC-1 study, low-risk imputation was used to impute missingness for ISS stage (1.8% missing), years since MM diagnosis (0.6% missing), time to progression on last regimen (1.2% missing), and average duration of prior lines of therapy (0.6% missing). Although data were missing for cytogenetic profile in both MonumenTAL-1 study cohorts (7.7% missing in 0.4 mg/kg weekly and 11.7% missing in 0.8 mg/kg every 2 weeks) and the MajesTEC-1 study cohort (10.3% missing), an imputation was not done for cytogenetic profile; instead, “missing” was added as a categorical variable.
Before weighting, both the 0.4 mg/kg weekly SC cohort and the 0.8 mg/kg every 2 weeks SC cohort in the MonumenTAL-1 study exhibited several baseline differences compared to the MajesTEC-1 study cohort. More patients were in ISS stage III in the MonumenTAL-1 study 0.4 mg/kg cohort (19.6% versus 12.1% in the MajesTEC-1 study cohort). Additionally, fewer patients in the MonumenTAL-1 study 0.4 mg/kg cohort had extramedullary plasmacytomas (23.1% versus 17%) and were younger than 65 years (45.5% versus 52.1%). Similar trends were observed for the MonumenTAL-1 study 0.8 mg/kg cohort, which had more patients in ISS stage III (24.1% versus 12.1% in the MajesTEC-1 study cohort) and a higher proportion of patients with extramedullary plasmacytomas (25.5% versus 17%). Differences in refractory status showed more patients with triple-class refractory disease in the MonumenTAL-1 study 0.8 mg/kg cohort than in the MajesTEC study cohort (16.6% versus 12.1%), and age distribution also varied, with more patients aged 65 years or older in the MonumenTAL-1 study 0.8 mg/kg cohort (56.6% versus 47.9%).
After ATT weighting, the balance between the MonumenTAL-1 study cohorts and the MajesTEC-1 study cohort improved. For the 0.4 mg/kg cohort, the SMD for refractory status dropped to 0.064 and for ISS stage to 0.036. The overall mean SMD decreased from 0.107 to 0.032, and the percentage of SMDs that were less than or equal to 0.1 increased from 41% to 100%. In the 0.8 mg/kg cohort, similar improvements were seen, with the SMD for refractory status reducing to 0.083 and for ISS stage to 0.054. The overall mean SMD decreased from 0.117 to 0.034, and the percentage of SMDs that were less than or equal to 0.1 increased from 47% to 100%. A further summary of the characteristics of the studies used to generate the indirect treatment comparison (ITC) are provided in Table 23.
Talquetamab in MonumenTAL-1 Study Versus Cilta-Cel in CARTITUDE-1 Study66
The CARTITUDE-1 study intention-to-treat population had 113 participants, with 93 participants in the subgroup analysis for those who had received at least 4 prior lines of therapy. The participant numbers for each analysis are detailed in Table 22: the main analysis included 113 participants in the CARTITUDE-1 study, 143 in the MonumenTAL-1 study 0.4 mg/kg weekly cohort, and 145 in the MonumenTAL-1 study 0.8 mg/kg every 2 weeks cohort; the subgroup analysis included 93 participants from the CARTITUDE-1 study, 117 from the MonumenTAL-1 study 0.4 mg/kg weekly cohort, and 113 from the MonumenTAL-1 study 0.8 mg/kg every 2 weeks cohort.
The prognostic factors were refractory status, ISS stage, time to progression on the last regimen, presence of extramedullary plasmacytoma, number of prior lines of therapy, years since MM diagnosis, average duration of prior lines of therapy, age, hemoglobin levels, LDH levels, creatinine clearance, ECOG Performance Status, sex, type of MM, prior stem cell transplant, race, and cytogenetic profile. For the MonumenTAL-1 study 0.4 mg/kg weekly SC cohort, no variables required imputation, and for the MonumenTAL-1 study 0.8 mg/kg every 2 weeks SC cohort, low-risk imputation was used to impute missingness for ISS stage (0.7% missing in the 0.8 mg/kg every 2 weeks cohort). For the CARTITUDE-1 study, ISS stage had 4.4% missing data (at apheresis). Imputation was done by using ISS stage (at infusion) whenever available; if this variable was missing as well, then low-risk imputation was used to impute the remaining missingness.
Before weighting, the MonumenTAL-1 study 0.4 mg/kg weekly SC cohort (143 participants) and the 0.8 mg/kg every 2 weeks SC cohort (145 participants) displayed several baseline differences compared to the CARTITUDE-1 study intention-to-treat cohort (113 participants). The MonumenTAL-1 study 0.4 mg/kg weekly cohort had a higher percentage of patients in ISS stage III (19.6% versus 12.4% in the CARTITUDE-1 study) and a lower percentage in stage I (43.4% versus 59.3%), more patients with extramedullary plasmacytomas (23.1% versus 14.2%), and a higher proportion of patients who had experienced disease progression in less than 3 months on their last regimen (30.8% versus 41.6%). Similarly, the MonumenTAL-1 study 0.8 mg/kg every 2 weeks cohort had more patients in ISS stage III (24.1% versus 12.4% in the CARTITUDE-1 study) and fewer in stage I (44.8% versus 59.3%), more patients with extramedullary plasmacytomas (25.5% versus 14.2%), and fewer patients aged 65 years or older (56.6% versus 38.1%).
After ATT weighting, these differences were reduced in both cohorts. In the 0.4 mg/kg weekly cohort, the SMD for refractory status decreased from 0.453 to 0.051, for ISS stage from 0.329 to 0.095, and for extramedullary plasmacytomas from 0.231 to 0.134. The overall mean SMD improved from 0.275 to 0.094. For the 0.8 mg/kg every 2 weeks cohort, the SMD for refractory status dropped from 0.656 to 0.220, for ISS stage from 0.349 to 0.122, and for extramedullary plasmacytomas from 0.288 to 0.006. The overall mean SMD improved from 0.261 to 0.144, with the percentage of SMDs greater than 0.1 decreasing from 82% to 47% and the percentage of SMDs greater than 0.2 decreasing from 71% to 6%.
A further summary of the characteristics of the studies used to generate the observational comparisons is provided in Table 23.
Table 23: Assessment of Homogeneity Across Studies Informing Sponsor-Submitted Observational Comparisons for PE Model
Characteristics | Description and handling of potential effect modifiers |
|---|---|
Disease severity | Talquetamab in MonumenTAL-1 study vs. RWPC in LocoMMotion and MoMMent studies: After weighting, most baseline characteristics achieved a standardized mean difference of < 0.1, except in the following characteristics:
Sex: a higher proportion of females in the RWPC cohort (51.6%) than in the MonumenTAL-1 study (45.5%). Talquetamab in MonumenTAL-1 study vs. teclistamab in MajesTEC-1 study: After ATT weighting, all baseline characteristics had a standardized mean difference of < 0.1. Talquetamab in MonumenTAL-1 study vs. cilta-cel in CARTITUDE-1 study: The following baseline characteristics had a standardized mean difference of > 0.1 after weighting:
|
Treatment history | All patients included had received prior treatment for MM. Details related to the number of prior lines of therapy, previous treatment exposure, and whether the patient had experienced disease progression on their last line of therapy are outlined in the trial eligibility criteria row. |
Trial eligibility criteria | Main differences across the arms in talquetamab in MonumenTAL-1 study vs. RWPC in LocoMMotion and MoMMent studies: Diagnosis MonumenTAL-1 study: enrolled patients had an ECOG Performance Status of 0 to 1 (phase I) or 0 to 2 (phase II), and measurable disease was required. LocoMMotion and MoMMent studies: enrolled patients had an ECOG Performance Status of 0 to 1; there was no explicitly defined requirement for measurable disease. Prior treatment MonumenTAL-1 study: required at least 3 prior lines of therapy, including a PI, an IMiD, and an anti-CD38 monoclonal antibody. LocoMMotion study: required at least 3 prior lines of therapy or disease that was double refractory to a PI and an IMiD, with exposure to an anti-CD38 monoclonal antibody. MoMMent study: required at least 3 prior lines of therapy, including exposure to a PI, an IMiD, and an anti-CD38 monoclonal antibody. Disease progression MonumenTAL-1 study: required documented progressive disease within 12 months of the last line of therapy or within 6 months if disease was refractory. LocoMMotion and MoMMent studies: required documented progressive disease on or after the last regimen, within 6 months if disease was refractory. Other Certain clinical laboratory values (e.g., for tests evaluating platelet count or creatinine clearance) were required to be met for patients to be included in the MonumenTAL-1 trial; however, the LocoMMotion study and the MoMMent study did not have such a requirement. Exclusion criteria The MonumenTAL-1 trial had specific exclusion criteria; the LocoMMotion study and the MoMMent study had no specific exclusion criteria. Talquetamab in MonumenTAL-1 study vs. teclistamab in MajesTEC-1 study: Diagnosis The MonumenTAL-1 trial enrolled patients with an ECOG Performance Status of 0 or 1 in phase I or of 0 to 2 in phase II. In the MonumenTAL-1 trial, patients were required to have measurable disease. Parts 2 and 3 required patients to have serum M-protein levels ≥ 1.0 g/dL or urine M-protein level ≥ 200 mg/24 hours or to have light chain MM without measurable disease in the serum or the urine (serum immunoglobulin FLC ≥ 10 mg/dL and an abnormal serum immunoglobulin kappa lambda FLC ratio). The MajesTEC-1 trial enrolled patients with an ECOG Performance Status of 0 or 1. The MajesTEC-1 trial enrolled patients with relapsed or refractory measurable MM who had received prior treatment of ≥ 2 lines of antimyeloma therapy. Prior treatment Patients in phase II of the MonumenTAL-1 trial were required to have received at least 3 prior lines of therapy for the treatment of MM. Patients were required to have received treatment with a PI, an IMiD, and an anti-CD38 monoclonal antibody as part of a previous line of therapy (prior exposure could be from different monotherapy or combination lines of therapy).
Patients in phase II of the MajesTEC-1 trial were required to have received ≥ 3 prior lines of therapy for MM including a PI, an IMiD, and anti-CD38 monoclonal antibody.
Disease progression Both trials required documented progressive disease within 12 months of the last line of therapy or within 6 months if disease was refractory. Other Certain clinical laboratory values (e.g., for tests evaluating platelet count\ and creatinine clearance) were required to be met for patients to be included in both trials. Exclusion criteria Both trials had similar exclusion criteria. Talquetamab in MonumenTAL-1 study vs. cilta-cel in CARTITUDE-1 study: Diagnosis
Prior treatment Patients in the MonumenTAL-1 trial were required to have received at least 3 prior lines of therapy for the treatment of MM. Patients must have received treatment with a PI, an IMiD, and an anti-CD38 monoclonal antibody as part of a previous line of therapy (prior exposure can be from different monotherapy or combination lines of therapy).
Disease progression In both trials, patients had to have documented evidence of progressive disease based on the investigator’s determination of response per the IMWG 2016 criteria9 on or within 12 months of their last line of therapy. Other Certain clinical laboratory values (e.g., for tests evaluating platelet count and creatinine clearance) were required to be met for patients to be included in both trials. Exclusion criteria Both trials had similar exclusion criteria. |
Definitions of end points | ORR: The MonumenTAL-1,15 LocoMMotion,61-63 MoMMent,61,62,64 MajesTEC-1,39,65 and CARTITUDE-1 studies66,67 defined ORR as the proportion of participants who experienced PR or better according to the IMWG criteria.9 For the MonumenTAL-1, MajesTEC-1, and CARTITUDE-1 studies, response after the start of subsequent therapy or re-treatment with talquetamab (MonumenTAL-1 study), teclistamab (MajesTEC-1 study), or cilta-cel (CARTITUDE-1 study) was not considered; it is unclear if it was considered in the LocoMMotion and MoMMent studies. For the MonumenTAL-1, MajesTEC-1, and CARTITUDE-1 studies, ORR was adjudicated by a relevant review committee. CR or better rate: The MonumenTAL-1,15 LocoMMotion,61-63 MoMMent,61,62,64 MajesTEC-1,39,65 and CARTITUDE-1 studies66,67 defined the CR or better rate as the proportion of participants who experienced a CR or better (sCR + CR) according to the IMWG criteria.9 CR or better rate was adjudicated by a relevant review committee in all studies. VGPR or better rate: The MonumenTAL-1,15 LocoMMotion,61-63 MoMMent,61,62,64 MajesTEC-1,39,65 and CARTITUDE-1 studies66,67 defined the VGPR or better rate as the proportion of participants who experienced a VGPR or better according to the IMWG criteria.9 VGPR or better rate was adjudicated by a relevant review committee in all studies. DOR: The MonumenTAL-1,15 LocoMMotion,61-63 MoMMent,61,62,64 MajesTEC-1,39,65 and CARTITUDE-1 studies66,67 defined DOR according to the IMWG criteria9 as the time from initial documentation of PR or better to the date of disease progression or death due to any cause, whichever occurred first. Participants who had not experienced disease progression and were alive at the data cut-off date were censored at the last disease evaluation before the start of any subsequent antimyeloma therapy or at the last follow-up date, whichever occurred first. DOR was adjudicated by a relevant review committee in all studies. PFS: The MonumenTAL-1,15 LocoMMotion,61-63 MoMMent,61,62,64 MajesTEC-1,39,65 and CARTITUDE-1 studies66,67 defined PFS as the duration from the index date to the time of progressive disease per the IMWG criteria9 or death from any cause, whichever occurred first. Participants who had not experienced disease progression and were alive at the data cut-off date were censored at the last disease evaluation before the start of any subsequent antimyeloma therapy. PFS was adjudicated by a relevant review committee in all studies. The index date was defined as the date of the first dose for the MonumenTAL-1 and MajesTEC-1 trials, as the date of RWPC treatment initiation for the LocoMMotion and MoMMent studies, and as the date of apheresis in the CARTITUDE-1 trial. OS: The MonumenTAL-1,15 LocoMMotion,61-63 MoMMent,61,62,64 MajesTEC-1,39,65 and CARTITUDE-1 studies66,67 defined OS as the time from the index date to the date of the participant’s death due to any cause. Participants who were still alive or whose vital status was unknown were censored at the date last known to be alive. The index date was defined as the date of the first dose for the MonumenTAL-1 and MajesTEC-1 trials, as the date of RWPC treatment initiation for the LocoMMotion and MoMMent studies, and as the date of apheresis in the CARTITUDE-1 trial. TTNT: The MonumenTAL-1,15 LocoMMotion,61-63 MoMMent,61,62,64 MajesTEC-1,39,65 and CARTITUDE-1 studies66,67 defined TTNT as the time from the index date to the initiation of the next therapy line or death, whichever occurred first. Participants who were still alive and did not initiate a next therapy line at the time of the data cut-off date were censored at the last date they were known to be alive. The index date was defined as the date of the first dose for the MonumenTAL-1 and MajesTEC-1 trials, as the date of RWPC treatment initiation for the LocoMMotion and MoMMent studies, and as the date of apheresis in the CARTITUDE-1 trial. |
Timing of end point evaluation | Talquetamab in MonumenTAL-1 study vs. RWPC in LocoMMotion and MoMMent studies: For the MonumenTAL-1 trial, a clinical cut-off date of January 17, 2023, was used. The median follow-up was 16.3 months.15,61,62 For the LocoMMotion study, eligible patients were enrolled between August 2019 and October 2020 and were assessed for safety and efficacy over a 24-month period, with a data cut-off date of October 27, 2022. The median follow-up was 26.4 months.61,62 For the MoMMent study, eligible patients were enrolled starting November 2021, and the study is currently ongoing. Patients were assessed for safety and efficacy over a 24-month period, with a data cut-off date of March 13, 2023. The median follow-up was 9.3 months.61,62 Talquetamab in MonumenTAL-1 study vs. teclistamab in MajesTEC-1 study: For the MonumenTAL-1 trial, a clinical cut-off date of January 17, 2023, was used. The median follow-up was 18.8 months for the 0.4 mg/kg weekly SC cohort and 12.8 months for the 0.8 mg/kg q.2.w. SC cohort.65 For the MajesTEC-1 trial, a clinical cut-off date of January 4, 2023, was used. The median follow-up was 22.8 months.65 Talquetamab in MonumenTAL-1 study vs. cilta-cel in CARTITUDE-1 study: For the MonumenTAL-1 trial, a clinical cut-off date of January 17, 2023, was used. The median follow-up was 18.8 months for the 0.4 mg/kg weekly SC cohort and 12.8 months for the 0.8 mg/kg q.2.w. SC cohort.66 For the CARTITUDE-1 trial, a clinical cut-off date of January 2022 was used. The median follow-up was 29.0 months.66 |
Withdrawal frequency | Talquetamab in MonumenTAL-1 study vs. RWPC in LocoMMotion and MoMMent studies: NR Talquetamab in MonumenTAL-1 study vs. teclistamab in MajesTEC-1 study: NR Talquetamab in MonumenTAL-1 study vs. cilta-cel in CARTITUDE-1 study: NR |
Clinical trial setting | For the MonumenTAL-1 study, patients were recruited from 47 centres in 11 countries (Belgium, China, France, Germany, Israel, Japan, the Netherlands, Poland, the Republic of Korea, Spain, and the US). For the LocoMMotion study, patients were enrolled at 76 sites across 9 European countries and the US. For the MoMMent study, patients were enrolled at 46 sites across 7 European countries. For the MajesTEC-1 trial, patients were recruited from study centres from the US, Belgium, Canada, France, Germany, Italy, the Netherlands, Spain, Sweden, and the UK. For the CARTITUDE-1 trial, patients were recruited from 16 study centres in the US. |
Study design | The MonumenTAL-1 trial is an ongoing phase I/II, multicentre, open-label clinical trial. The LocoMMotion study was a prospective noninterventional study. The MoMMent study is an ongoing prospective noninterventional study. The MajesTEC-1 trial is an ongoing phase I/II, multicentre, open-label, single-arm clinical trial. The CARTITUDE-1 trial is a phase Ib/II, multicentre, open-label, single-arm clinical trial. |
ATT = average treatment effect in the treated; BCMA = B-cell maturation antigen; cilta-cel = ciltacabtagene autoleucel; CR = complete response; DOR = duration of response; ECOG = Eastern Cooperative Oncology Group; FLC = free light chain; HSCT = hematopoietic stem cell transplant; IMiD = immunomodulatory drug; IMWG = International Myeloma Working Group; ISS = international staging system; MM = multiple myeloma; NR = not reported; ORR = overall response rate; OS = overall survival; PE = pharmacoeconomic; PFS = progression-free survival; PI = proteasome inhibitor; PR = partial response; q.2.w. = every 2 weeks; RWPC = real-world physician’s choice of therapy; SC = subcutaneous; sCR = stringent complete response; TTNT = time to next treatment; VGPR = very good partial response; vs. = versus.
Sources: Sponsor’s submissions;61,65,66 Einsele et al.(2024).62f
Efficacy Results
Efficacy For Nonrandomized Studies Included in PE Model
Talquetamab in MonumenTAL-1 Study Versus RWPC in LocoMMotion and MoMMent Studies
The results of the nonrandomized studies conducted using IPTW with ATT weights to compare talquetamab versus RWPC suggest talquetamab is associated with better response and survival outcomes in patients with triple-class exposed r/r MM who received at least 3 previous lines of therapy. The comparisons demonstrate that talquetamab (at either dose) results in better ORR, PFS, OS, and TTNT. RWPC resulted in a numerically comparable DOR point estimate without excluding the null from the CI compared to 0.4 mg/kg weekly SC talquetamab; however, 0.8 mg/kg every 2 weeks SC talquetamab resulted in better DOR.61,62 Details for each outcome are presented in the following subsections.
Overall Response Rate
The observed ORR for talquetamab in the 0.4 mg/kg weekly SC cohort was 74.1%, versus 37.3% in the RWPC cohort. After reweighting, the RWPC ORR was 27.8%. The adjusted response rate ratio for talquetamab versus RWPC was 2.67 (95% CI, 1.90 to 3.74; P < 0.0001), suggesting that treatment with talquetamab increased the likelihood of experiencing ORR. Figure 2 provides further details.
The observed ORR for talquetamab in the 0.8 mg/kg every 2 weeks SC cohort was 71.7%, versus 37.3% in the RWPC cohort. After reweighting, the RWPC ORR was 27.3%. The adjusted response rate ratio for talquetamab versus RWPC was 2.62 (95% CI, 1.86 to 3.69; P < 0.0001), suggesting that treatment with talquetamab increased the likelihood of experiencing ORR. Figure 2 provides further details.61,62
The results of the sensitivity analyses for the 2 cohorts, including the analysis that adjusted for all variables, aligned with the main analyses.61,62

Duration of Response
The unadjusted HR in the 0.4 mg/kg weekly SC cohort for DOR was 0.92 (95% CI, 0.61 to 1.39; P = 0.6957) for talquetamab versus RWPC. Results from the main analysis using IPTW with ATT weights showed an HR of 0.77 (95% CI, 0.49 to 1.23; P = 0.2766) (Figure 3). The results of the sensitivity analyses, including the analysis that adjusted for all variables, aligned with the main analyses.61,62
The unadjusted and ATT-weighted Kaplan-Meier plots for the main analysis of DOR for the 0.4 mg/kg weekly SC cohort are presented in Figure 4. For the MonumenTAL-1 study population, the median DOR for the 0.4 mg/kg weekly SC cohort was 9.49 months (95% CI, 6.67 to 13.34 months). In the unadjusted RWPC population, the median DOR was 9.00 months (95% CI, 5.75 to 14.42 months) compared to ████ ██████ ████ ███ █████ ██████ in the adjusted main analysis.61
The unadjusted HR in the 0.8 mg/kg every 2 weeks SC cohort for DOR was 0.45 (95% CI, 0.27 to 0.75; P = 0.0021) for talquetamab versus RWPC. Results from the main analysis using IPTW with ATT weights showed an HR of 0.43 (95% CI, 0.26 to 0.72; P = 0.0015) (Figure 3). The results of the sensitivity analyses, including the analysis that adjusted for all variables, aligned with the main analyses.61,62
The unadjusted and ATT-weighted Kaplan-Meier plots for the main analysis of DOR for the 0.8 mg/kg every 2 weeks SC cohort are presented in Figure 5.61,62

Figure 4: Unadjusted and Adjusted (ATT-Weighted) Kaplan-Meier Plots of DOR for the 0.4 mg/kg Weekly SC Cohort [Redacted]

Figure 5: Unadjusted and Adjusted (ATT-Weighted) Kaplan-Meier Plots of DOR for the 0.8 mg/kg q.2.w. SC Cohort [Redacted]

Progression-Free Survival
The unadjusted HR in the 0.4 mg/kg weekly SC cohort for PFS was 0.70 (95% CI, 0.53 to 0.92; P = 0.0093) for talquetamab versus RWPC. Results from the main analysis using IPTW with ATT weights showed an HR of 0.52 (95% CI, 0.39 to 0.71; P < 0.0001), suggesting talquetamab increases the time to progression or death (Figure 6). The results of the sensitivity analyses, including the analysis that adjusted for all variables, aligned with the main analyses.61,62
The unadjusted and ATT-weighted Kaplan-Meier plots for the main analysis of PFS for the 0.4 mg/kg weekly SC cohort are presented in Figure 7.61,62
The unadjusted HR in the 0.8 mg/kg every 2 weeks SC cohort for PFS was 0.49 (95% CI, 0.36 to 0.67; P < 0.0001) for talquetamab versus RWPC. Results from the main analysis using IPTW with ATT weights showed an HR of 0.40 (95% CI, 0.29 to 0.56; P < 0.0001), suggesting that treatment with talquetamab increased the time to progression or death (Figure 6). The results for the sensitivity analyses, including the analysis that adjusted for all variables, aligned with the main analyses.61,62
The unadjusted and ATT-weighted Kaplan-Meier plots for the main analysis of PFS for the 0.8 mg/kg every 2 weeks SC cohort are presented in Figure 8.61,62

Figure 7: Unadjusted and Adjusted (ATT-Weighted) Kaplan-Meier Plots of PFS for the 0.4 mg/kg Weekly SC Cohort [Redacted]

Figure 8: Unadjusted and Adjusted (ATT-Weighted) Kaplan-Meier Plots of PFS for the 0.8 mg/kg q.2.w. SC Cohort [Redacted]

Overall Survival
The unadjusted HR for OS in the 0.4 mg/kg weekly SC cohort was 0.50 (95% CI, 0.35 to 0.70; P < 0.0001) for talquetamab versus RWPC. Results from the main analysis using IPTW with ATT weights showed an HR of 0.36 (95% CI, 0.25 to 0.53; P < 0.0001), suggesting that treatment with talquetamab reduced the time to death compared with RWPC (Figure 9). The results for the sensitivity analyses, including the analysis that adjusted for all variables, aligned with the main analyses.61,62
The unadjusted and ATT-weighted Kaplan-Meier plots for the main analysis of OS for the 0.4 mg/kg weekly SC cohort are presented in Figure 10.61,62
The unadjusted HR for OS in the 0.8 mg/kg every 2 weeks SC cohort was 0.44 (95% CI, 0.30 to 0.66; P < 0.0001) for talquetamab versus RWPC. Results from the main analysis using IPTW with ATT weights showed an HR of 0.37 (95% CI, 0.23 to 0.60; P < 0.0001), suggesting that treatment with talquetamab reduced the time to death (Figure 9). The results for the sensitivity analyses, including the analysis that adjusted for all variables, aligned with the main analyses.61,62
The unadjusted and ATT-weighted Kaplan-Meier plots for the main analysis of OS for the 0.8 mg/kg every 2 weeks SC cohort are presented in Figure 11.61,62

Figure 10: Unadjusted and Adjusted (ATT-Weighted) Kaplan-Meier Plots of OS for the 0.4 mg/kg Weekly SC Cohort [Redacted]

Figure 11: Unadjusted and Adjusted (ATT-Weighted) Kaplan-Meier Plots of OS for the 0.8 mg/kg q.2.w. SC Cohort [Redacted]

CR or Better Rate
The observed CR or better rate for talquetamab in the 0.4 mg/kg weekly SC cohort was 33.6%, versus 0.6% in the RWPC cohort. After reweighting, the RWPC CR or better rate was 0.4%. The adjusted response rate ratio for talquetamab versus RWPC was 78.05 (95% CI, 8.11 to 751.03; P = 0.0002). The observed CR or better rate for talquetamab in the 0.8 mg/kg every 2 weeks SC cohort was 38.6%, versus 0.6% in the RWPC cohort. After reweighting, the RWPC CR or better rate was 0.4%. The adjusted response rate ratio for talquetamab versus RWPC was 101.14 (95% CI, 9.19 to 1,113.06; P = 0.0002). The results of the sensitivity analyses for the 2 cohorts, including the analysis that adjusted for all variables, aligned with the main analyses, with the results remaining significantly in favour of talquetamab. As CR or better was not reported for patients receiving RWPC within the 4 or more prior lines of therapy subgroup, no analyses were conducted to compare talquetamab to RWPC for this subgroup.
Time to Next Treatment
The unadjusted HR in the 0.4 mg/kg weekly SC cohort for TTNT was 0.62 (95% CI, 0.48 to 0.81; P = 0.0003) for talquetamab versus RWPC. Results from the main analysis using IPTW with ATT weights showed an HR of 0.48 (95% CI, 0.36 to 0.64; P < 0.0001), suggesting that treatment with talquetamab increased the time to starting a subsequent treatment (Figure 12). The results for the sensitivity analyses, including the analysis that adjusted for all variables, aligned with the main analyses.61,62
The unadjusted and ATT-weighted Kaplan-Meier plots for the main analysis of TTNT for the 0.4 mg/kg weekly SC cohort are presented in Figure 13.61,62
The unadjusted HR in the 0.8 mg/kg every 2 weeks SC cohort for TTNT was 0.48 (95% CI, 0.36 to 0.64; P < 0.0001) for talquetamab versus RWPC. Results from the main analysis using IPTW with ATT weights showed an HR of 0.39 (95% CI, 0.29 to 0.54; P < 0.0001), suggesting that treatment with talquetamab increased the time to starting a subsequent treatment by 61% compared with RWPC (Figure 12).61,62
The unadjusted and ATT-weighted Kaplan-Meier plots for the main analysis of TTNT for the 0.8 mg/kg every 2 weeks SC cohort are presented in Figure 14.61,62

Figure 13: Unadjusted and Adjusted (ATT-Weighted) Kaplan-Meier Plots of TTNT for the 0.4 mg/kg Weekly SC Cohort [Redacted]

Figure 14: Unadjusted and Adjusted (ATT-Weighted) Kaplan-Meier Plots of TTNT for the 0.8 mg/kg q.2.w. SC Cohort [Redacted]

Talquetamab in MonumenTAL-1 Study Versus Teclistamab in MajesTEC-1 Study
The results of the nonrandomized study conducted using IPTW with ATT weights to compare talquetamab versus teclistamab indicates that, in most outcomes, neither drug was more favourable than the other. In certain outcomes, specifically ORR and OS, the results suggest that talquetamab may be more favourable. However, it was noted that teclistamab showed a more favourable DOR than 0.4 mg/kg weekly talquetamab, and in all other outcomes the null was included in the CI.
Overall Response Rate
The observed ORR for talquetamab in the 0.4 mg/kg weekly SC cohort was ████% versus █████ in the teclistamab cohort. After reweighting, the ORR for teclistamab was ████%. The adjusted response rate ratio for talquetamab versus teclistamab was ████ ████ ███ █████ █████ █████████, suggesting that treatment with talquetamab increased the likelihood of experiencing ORR (Figure 15).65
The observed ORR for talquetamab in the 0.8 mg/kg every 2 weeks SC cohort was ██████ versus █████ in the teclistamab cohort. After reweighting, the ORR for teclistamab was ██████ The adjusted response rate ratio for talquetamab versus teclistamab was ████ ████ ███ █████ █████ █████████, suggesting that treatment with talquetamab increased the likelihood of experiencing ORR (Figure 15). The results of the sensitivity analyses were similar to those of the primary analyses.65

Duration of Response
The unadjusted HR in the 0.4 mg/kg weekly SC cohort for DOR was ████ ████ ███ █████ █████ ████████) for talquetamab versus teclistamab. Results from the main analysis using IPTW with ATT weights showed an HR of ████ ████ ███ █████ █████ ██████████ (Figure 16).65
The unadjusted and ATT-weighted Kaplan-Meier plots for the main analysis of DOR for the 0.4 mg/kg weekly SC cohort are presented in Figure 17.65
The unadjusted HR in the 0.8 mg/kg every 2 weeks SC cohort for DOR was ████ ████ ███ █████ █████ ████████ for talquetamab versus teclistamab. Results from the main analysis using IPTW with ATT weights showed an HR of 1 ███ ████ ███ █████ █████ █████████████████ ███. The results of the sensitivity analyses are aligned with the main analyses.65
The unadjusted and ATT-weighted Kaplan-Meier plots for the main analysis of DOR for the 0.8 mg/kg every 2 weeks SC cohort are presented in Figure 18.65

Figure 17: Unadjusted and Adjusted (ATT-Weighted) Kaplan-Meier Plots of DOR for the 0.4 mg/kg Weekly SC Cohort [Redacted]

Figure 18: Unadjusted and Adjusted (ATT-Weighted) Kaplan-Meier Plots of DOR for the 0.8 mg/kg q.2.w. SC Cohort [Redacted]

Progression-Free Survival
The unadjusted HR in the 0.4 mg/kg weekly SC cohort for PFS was ████ ████ ███ █████ █████ █████████ for talquetamab versus teclistamab. Results from the main analysis using IPTW with ATT weights showed an HR of ████ ████ ███ █████ █████ █████████ (Figure 19). The results of the sensitivity analyses are aligned with the main analyses. The results of the 4 or more prior lines of therapy subgroup analyses aligned with the primary analyses.65
The unadjusted and ATT-weighted Kaplan-Meier plots for the main analysis of PFS for the 0.4 mg/kg weekly SC cohort are presented in Figure 20.65
The unadjusted HR in the 0.8 mg/kg every 2 weeks SC cohort for PFS was ████ ████ ███ █████ █████ █████████ for talquetamab versus teclistamab. Results from the main analysis using IPTW with ATT weights showed an HR of ████ ████ ███ █████ █████ █████████ (Figure 19).65
The unadjusted and ATT-weighted Kaplan-Meier plots for the main analysis of PFS for the 0.8 mg/kg every 2 weeks SC cohort are presented in Figure 21.65

Figure 20: Unadjusted and Adjusted (ATT-Weighted) Kaplan-Meier Plots of PFS for the 0.4 mg/kg Weekly SC Cohort [Redacted]

Figure 21: Unadjusted and Adjusted (ATT-Weighted) Kaplan-Meier Plots of PFS for the 0.8 mg/kg q.2.w. SC Cohort [Redacted]

Overall Survival
The unadjusted HR in the 0.4 mg/kg weekly SC cohort for OS was ████ ████ ███ █████ █████ ████████ for talquetamab versus teclistamab. Results from the main analysis using IPTW with ATT weights showed an HR of ████ ████ ███ █████ █████ ████████, suggesting that treatment with talquetamab increased the time to death (Figure 22). The results of the sensitivity analyses are aligned with the main analyses, favouring talquetamab over teclistamab for OS. The results of the 4 or more prior lines of therapy subgroup analyses are aligned with the primary analyses.65
The unadjusted and ATT-weighted Kaplan-Meier plots for the main analysis of OS for the 0.4 mg/kg weekly SC cohort are presented in Figure 23.65
The unadjusted HR in the 0.8 mg/kg every 2 weeks SC cohort for OS was ████ ████ ███ █████ █████ █████████ for talquetamab versus teclistamab. Results from the main analysis using IPTW with ATT weights showed an HR of ████ ████ ███ █████ █████ █████████, suggesting that treatment with talquetamab increased the time to death compared to teclistamab (Figure 22). The results of the sensitivity analyses are aligned with the main analyses.65
The unadjusted and ATT-weighted Kaplan-Meier plots for the main analysis of OS for the 0.8 mg/kg every 2 weeks SC cohort are presented in Figure 24.65

Figure 23: Unadjusted and Adjusted (ATT-Weighted) Kaplan-Meier Plots of OS for the 0.4 mg/kg Weekly SC Cohort [Redacted]

Figure 24: Unadjusted and Adjusted (ATT-Weighted) Kaplan-Meier Plots of OS for the 0.8 mg/kg q.2.w. SC Cohort [Redacted]

CR or Better Rate
The observed CR or better rate for talquetamab in the 0.4 mg/kg weekly SC cohort was 33.6%, versus 45.5% in the teclistamab cohort. After reweighting, the CR or better rate for teclistamab was 41.1%. The adjusted response rate ratio for talquetamab versus teclistamab was ████ ████ ███ █████ █████ █████████. The observed CR or better rate for talquetamab in the 0.8 mg/kg every 2 weeks SC cohort was 38.6%, versus 45.5% in the teclistamab cohort. After reweighting, the CR or better rate for teclistamab was █████. The adjusted response rate ratio for talquetamab versus teclistamab was ████ ████ ███ █████ █████ █████████. The results of the sensitivity analyses for the 2 cohorts were similar to those of the main analyses, with no significant difference in the CR or better rate between treatment with talquetamab or teclistamab. The results of the 4 or more prior lines of therapy subgroup analyses for the 2 cohorts are aligned with the primary analyses.
Time to Next Treatment
The unadjusted HR in the 0.4 mg/kg weekly SC cohort for TTNT was ████ ████ ███ █████ █████ █████████ for talquetamab versus teclistamab. Results from the main analysis using IPTW with ATT weights showed an HR of ████ ████ ███ █████ █████ ████████ (Figure 25). The results of the sensitivity analyses are aligned with the main analyses, with the null included in the 95% CI between talquetamab and teclistamab. The results of the 4 or more prior lines of therapy subgroup analyses are aligned with the primary analyses.65
The unadjusted and ATT-weighted Kaplan-Meier plots for the main analysis of TTNT for the 0.4 mg/kg weekly SC cohort are presented in Figure 26.65 The unadjusted HR in the 0.8 mg/kg every 2 weeks SC cohort for TTNT was ████ ████ ███ █████ █████ █████████. Results from the main analysis using IPTW with ATT weights showed an HR of ████ ████ ███ █████ █████ █████████ for talquetamab versus teclistamab (Figure 25). The results of the sensitivity analyses are aligned with the main analyses. The results of the 4 or more prior lines of therapy subgroup analyses aligned with the primary analyses.65
The unadjusted and ATT-weighted Kaplan-Meier plots for the main analysis of TTNT for the 0.8 mg/kg every 2 weeks SC cohort are presented in Figure 27.65

Figure 26: Unadjusted and Adjusted (ATT-Weighted) Kaplan-Meier Plots of TTNT for the 0.4 mg/kg Weekly SC Cohort [Redacted]

Figure 27: Unadjusted and Adjusted (ATT-Weighted) Kaplan-Meier Plots of TTNT for the 0.8 mg/kg q.2.w. SC Cohort [Redacted]

Talquetamab in MonumenTAL-1 Study Versus Cilta-Cel in CARTITUDE-1 Study
The results of the nonrandomized study conducted using IPTW with ATT weights to compare talquetamab versus cilta-cel suggest that cilta-cel is associated with better response outcomes in patients with triple-class exposed r/r MM who have received at least 3 previous lines of therapy. The comparisons suggest that cilta-cel resulted in better ORR compared to either dosage of talquetamab. Compared to 0.4 mg/kg weekly SC talquetamab, cilta-cel resulted in better DOR, PFS, and TTNT; however, the null was included in the 95% CI in these outcomes compared to the 0.8 mg/kg every 2 weeks SC dosage of talquetamab. Talquetamab (at either dosage) and cilta-cel resulted in OS that did not exclude the null from the 95% CI. Details for each outcome are presented in the following subsections.
Overall Response Rate
The observed ORR for talquetamab in the 0.4 mg/kg weekly SC cohort was 74.1%, versus 84.1% in the cilta-cel cohort. After reweighting, the ORR for cilta-cel was 90.5%. The adjusted response rate ratio for talquetamab compared to cilta-cel was ████ ████ ███ █████ █████ █████████, suggesting that patients treated with cilta-cel were more likely to experience overall response (Figure 28).66 The observed ORR for talquetamab in the 0.8 mg/kg every 2 weeks SC cohort was 71.7%, versus 84.1% in the cilta-cel cohort. After reweighting, the ORR for cilta-cel was ██████. The adjusted response rate ratio for talquetamab compared to cilta-cel was ████ ████ ███ █████ █████ ████████), suggesting that patients treated with cilta-cel were ████ ██████ to experience overall response (Figure 28).66

Duration of Response
The unadjusted HR in the 0.4 mg/kg weekly SC cohort for DOR was ████ ████ ███ █████ █████ █████████ for talquetamab versus cilta-cel. Results from the main analysis using IPTW with ATT weights showed an HR of ████ ████ ███ █████ █████ █████████, suggesting that cilta-cel █████████ the time to progression or death compared to talquetamab (Figure 29). The results of the sensitivity analyses align with the main analysis. The results of the 4 or more prior lines of therapy subgroup analyses differed from the results of the primary analysis; the main ATT-adjusted and the average treatment effect in the control and performance status–matched sensitivity subgroup analyses did not exclude the null from the 95% CI.
The unadjusted and ATT-weighted Kaplan-Meier plots for the main analysis of DOR for the 0.4 mg/kg weekly SC cohort are presented in Figure 30.66
The unadjusted HR in the 0.8 mg/kg every 2 weeks SC cohort for DOR was ████ ████ ███ █████ █████ █████████ for talquetamab versus cilta-cel. Results from the main analysis using IPTW with ATT weights showed an HR of ████ ████ ███ █████ █████ █████████ (Figure 29). The results of the sensitivity analyses align with the main analysis. The results of the 4 or more prior lines of therapy subgroup analyses are aligned with the results of the primary analysis.66
The unadjusted and ATT-weighted Kaplan-Meier plots for the main analysis of DOR for the 0.8 mg/kg every 2 weeks SC cohort are presented in Figure 31.66

Figure 30: Unadjusted and Adjusted (ATT-Weighted) Kaplan-Meier Plots of DOR for the 0.4 mg/kg Weekly SC Cohort [Redacted]

Figure 31: Unadjusted and Adjusted (ATT-Weighted) Kaplan-Meier Plots of DOR for the 0.8 mg/kg q.2.w. SC Cohort [Redacted]

Progression-Free Survival
The unadjusted HR in the 0.4 mg/kg weekly SC cohort for PFS was ████ ████ ███ █████ █████ █████████ for talquetamab versus cilta-cel. Results from the main analysis using IPTW with ATT weights showed an HR of ████ ████ ███ █████ █████ █████████, suggesting that cilta-cel █████████ the time to progression or death compared to talquetamab (Figure 32). The results of the sensitivity analyses are aligned with the main analyses. The results of the 4 or more prior lines of therapy subgroup analyses are aligned with the primary analyses.66
The unadjusted and ATT-weighted Kaplan-Meier plots for the main analysis of PFS for the 0.4 mg/kg weekly SC cohort are presented in Figure 33.66
The unadjusted HR in the 0.8 mg/kg every 2 weeks SC cohort for PFS was ████ ████ ███ █████ █████ ████████ for talquetamab versus cilta-cel. Results from the main analysis using IPTW with ATT weights showed an HR of ████ ████ ███ █████ █████ ████████ (Figure 32).66
The unadjusted and ATT-weighted Kaplan-Meier plots for the main analysis of PFS for the 0.8 mg/kg every 2 weeks SC cohort are presented in Figure 34.66

Figure 33: Unadjusted and Adjusted (ATT-Weighted) Kaplan-Meier Plots of PFS for the 0.4 mg/kg Weekly SC Cohort [Redacted]

Figure 34: Unadjusted and Adjusted (ATT-Weighted) Kaplan-Meier Plots of PFS for the 0.8 mg/kg q.2.w. SC Cohort [Redacted]

Overall Survival
The unadjusted HR for OS in the 0.4 mg/kg weekly SC cohort was ████ ████ ███ █████ █████ █████████ for talquetamab versus cilta-cel. Results from the main analysis using IPTW with ATT showed an HR of ████ ████ ███ █████ █████ █████████ (Figure 35). The results of the sensitivity analyses are aligned with the main analyses, with the null being crossed in all cases. The results for the 4 or more prior lines of therapy subgroup analyses are also aligned with the primary analyses.66
The unadjusted and ATT-weighted Kaplan-Meier plots for the main analysis of OS for the 0.4 mg/kg weekly SC cohort are presented in Figure 36.66
The unadjusted HR for OS in the 0.8 mg/kg every 2 weeks cohort was ████ ████ ███ █████ █████ █████████ for talquetamab versus cilta-cel. Results from the main analysis using IPTW with ATT weights showed an HR of ████ ████ ███ █████ █████ █████████ (Figure 35). The results of the sensitivity analyses are aligned with the main analyses, with the null being crossed in all cases. The results of the 4 or more prior lines of therapy subgroup analyses are aligned with the primary analyses.66
The unadjusted and ATT-weighted Kaplan-Meier plots for the main analysis of OS for the 0.8 mg/kg every 2 weeks SC cohort are presented in Figure 37.66

Figure 36: Unadjusted and Adjusted (ATT-Weighted) Kaplan-Meier Plots of OS for the 0.4 mg/kg Weekly SC Cohort [Redacted]

Figure 37: Unadjusted and Adjusted (ATT-Weighted) Kaplan-Meier Plots of OS for the 0.8 mg/kg q.2.w. SC Cohort [Redacted]

CR or Better Rate
The observed CR or better rate for talquetamab in the 0.4 mg/kg weekly SC cohort was █████, versus █████ in the cilta-cel cohort. After reweighting, the CR or better rate for cilta-cel was █████. The adjusted response rate ratio for talquetamab compared to cilta-cel was ████ ████ ███ █████ █████ █████████. The results of the sensitivity analyses are aligned with the main analysis. The observed CR or better rate for talquetamab in the 0.8 mg/kg every 2 weeks SC cohort was █████, versus █████ in the cilta-cel cohort. After reweighting, the CR or better rate for cilta-cel was █████. The adjusted response rate ratio for talquetamab compared to cilta-cel was ████ ████ ███ █████ █████ █████████, suggesting that patients treated with cilta-cel were significantly more likely to experience a CR or better. The results of the sensitivity analyses were similar to the main analysis.
Time to Next Treatment
The unadjusted HR in the 0.4 mg/kg weekly SC cohort for TTNT was ████ ████ ███ █████ █████ █████████ for talquetamab versus cilta-cel. Results from the main analysis using IPTW with ATT weights showed an HR of ████ ████ ███ █████ █████ █████████ (Figure 38). The results of the sensitivity analyses are aligned with the main analyses, with cilta-cel being favoured. The results of the 4 or more prior lines of therapy subgroup analyses are also aligned with the primary analyses.66
The unadjusted and ATT-weighted Kaplan-Meier plots for the main analysis of TTNT for the 0.4 mg/kg weekly SC cohort are presented in Figure 39.66
The unadjusted HR in the 0.8 mg/kg every 2 weeks SC cohort for TTNT was ████ ████ ███ █████ █████ █████████ for talquetamab versus cilta-cel. Results from the main analysis using IPTW with ATT weights showed an HR of ████ ████ ███ █████ █████ █████████ (Figure 38). The results of the sensitivity analyses differed from those of the main analysis, with the results for the multivariable logistic regression, the weighted for average treatment effect in the overlap, the weighted for average treatment effect, and the performance status–matched sensitivity analyses all favouring cilta-cel.66
The unadjusted and ATT-weighted Kaplan-Meier plots for the main analysis of TTNT for the 0.8 mg/kg every 2 weeks SC cohort are presented in Figure 40.66

Figure 39: Unadjusted and Adjusted (ATT-Weighted) Kaplan-Meier Plots of OS for the 0.4 mg/kg Weekly SC Cohort [Redacted]

Figure 40: Unadjusted and Adjusted (ATT-Weighted) Kaplan-Meier Plots of TTNT for the 0.8 mg/kg q.2.w. SC Cohort [Redacted]

Critical Appraisal of Sponsor-Submitted Nonrandomized Comparisons Informing the PE Model
The 3 comparative studies submitted by the sponsor employed similar approaches in using IPD with IPTW and ATT to reduce the extent of confounding due to heterogeneity in prognostic factors between any 2 data sources being assessed in a given comparative study. The studies included only patients who matched the inclusion and exclusion criteria of the MonumenTAL-1 study and compared outcomes that were defined similarly, and the studies successfully reduced the baseline clinical heterogeneity of most of the identified prognostic factors. However, some prognostic factors maintained discrepancy at a level of more than 0.1 SMD, especially in the comparison versus cilta-cel. In addition to using similar methods, the studies share similar limitations, as well as unique limitations per study, that affect the interpretation of the results. In addition, the limitations that are inherent within the MonumenTAL-1 trial also apply here; these limitations include the interim nature of the results and the immature OS data.
In all 3 studies, the choice of comparator data was not sufficiently justified. There was no systematic review approach to identify potential studies that may be eligible for these comparisons, and it was unclear if a protocol was established a priori to inform the analytical approach to the analysis and the conduct of the studies. These limitations increase the risk of selection bias and the possibility of missing important evidence that could have led to different results. This limitation is particularly important for the comparison against RWPC as a number of observational studies exist in the literature that could have been assessed for inclusion. Furthermore, no assessment of risk of bias from each study was reported and no attempt was described to deal with poor-quality data arising from said risk assessment.
In addition, a unique limitation to the comparison against RWPC is the pooling of data from the LocoMMotion and MoMMent studies without consideration of potential variability and error between the studies. This may have introduced bias to the analysis, and important differences across the studies might have been obscured in the pooling. However, the direction of such potential bias is unclear. Furthermore, although the study attempted to reduce clinical and methodological heterogeneity through statistical approaches and matching of the inclusion criteria and the end point definitions, certain heterogeneities cannot be adjusted for, such as the differences in the study design: the MonumenTAL-1 study is a clinical trial and the LocoMMotion and MoMMent studies are cohort studies. Variations in study design can lead to significant differences in the manner of enrolling, assessing, monitoring, and following-up with patients. These variations, in turn, can lead to variations in unobserved factors as well as measurement and human error — all factors that cannot be adjusted. In addition, the MonumenTAL-1 study had a shorter follow-up period than all the other studies. The magnitude and the direction of bias introduced by the differences in the study design are unclear.
Shared among the 3 studies is the approach to identifying prognostic factors for assessment and weighting. A list of possible prognostic factors that require adjustment was established in consultation with the sponsor’s clinical expert. Overall, the clinical expert consulted by Canada’s Drug Agency (CDA-AMC) concurred with the assessment of the sponsor’s expert. However, there was no systematic approach to establishing the prognostic factors beyond expert opinion, for example by consulting the available literature. The lack of evidence-informed prognostic choice may increase the uncertainty of the results by potentially missing important prognostic variables, leading to confounding, or by including variables that are not strongly related to the treatment assignment, which can cause overfitting and reduce generalizability.
Across the 3 studies, an important prognostic factor that was not adequately addressed due to missing data was the cytogenetic risk. Both the sponsor’s clinical experts and the clinical expert consulted by CDA-AMC considered it an important prognostic factor; however, it was not included in the main analyses due to a high level of missingness. A sensitivity analysis was conducted to assess the impact of missing data. However, that sensitivity analysis can only provide information on the potential effect of the missing data, rather than adjusting for cytogenetic risk as a prognostic factor. The limitations related to missing cytogenetic risk data were most pronounced in the comparison against RWPC. Based on the existing data, there seems to be a larger proportion of patients with a “high-risk” cytogenic profile in the MonumenTAL-1 study than in the RWPC data or in the data from the CARTITUDE-1 study. Finally, it was unclear how missing outcome values were handled. It is unclear how this discrepancy, coupled with the large proportion of missing data, could affect the direction of the results.
Across the 3 studies, unknown or unmeasured factors cannot be adjusted for, including those previously noted as being affected by large missingness in data. Although e-values were presented — and some of these values suggest that any unmeasured confounders would need to have a relatively large effect to fully explain away the observed effect size — e-values have important limitations that reduce68 their utility in this regard. Specifically, e-values cannot account for other sources of bias, such as measurement error, selection bias, or information bias. They also rely on assumptions including effect homogeneity, and a single unmeasured confounder (or a composite of all unmeasured confounding variables or those unaccounted for). Additionally, interpretation of e-values is challenged when there is no frame of reference (i.e., values of known confounding variables) and the e-value for the bound of the CI closest to the null is not provided to understand the extent of residual confounding that would be needed for the CI to cross the null.
Visual inspection of the log-cumulative hazard plots and Schoenfeld residuals plots across the 3 studies indicated potential deviation from the proportional hazards assumption. However, the Grambsch-Therneau test for the proportional hazards assumption was conducted and found to be nonsignificant. The observed possible discrepancies in the approach to assess the assumption reduced certainty that the assumption had been met but did not conclusively reject the possibility that the assumption had been met. It was also unclear what number of events were driving the OS outcome. Based on the MonumenTAL-1 study interim results for OS, there is a concern that a low number of events may lead to unstable estimates.
The generalizability of the study comparing against RWPC is limited due to the changes in the treatment landscape. According to the clinical expert consulted by CDA-AMC, it is highly unlikely that any patient would be given the interventions pooled together in the RWPC cohort. This is largely due to the availability of new treatment approaches. This reduces the clinical value of the comparative results. Although the comparisons against cilta-cel and teclistamab are relevant, the data sources come from clinical trials, which pose their own limitations for generalizability to the patient population living in Canada. However, the clinical expert consulted by CDA-AMC did not identify any unusual clinical characteristics that would set the patients in these studies apart from those treated in general practice.
Finally, no safety or HRQoL measures were reported, and no clear justification was available. This reduces the review team’s ability to balance understanding of the comparative efficacy and safety of the treatments.
Discussion
Summary of Available Evidence
One ongoing, pivotal, phase I/II, noncomparative study, the MonumenTAL-1 study (total N = 501; N at either RP2D = 339), met the inclusion criteria for the sponsor-conducted systematic review. In the 3 model cohorts, patients received 1 of the 2 RP2Ds: 0.4 mg/kg SC weekly on days 1, 8, 15, and 22 of a 28-day cycle (preceded by step-up doses of 0.01 mg/kg and 0.06 mg/kg) or 0.8 mg/kg SC every 2 weeks on days 1 and 15 of a 28-day cycle (preceded by step-up does of 0.01 mg/kg, 0.06 mg/kg, and 0.3 mg/kg). The objectives of the MonumenTAL-1 study were to characterize the safety of talquetamab and the RP2Ds and schedule, to further characterize the safety of talquetamab at the RP2Ds (phase I), and to evaluate the efficacy of talquetamab at the RP2Ds (phase II) in adults with r/r MM. The trial enrolled adults with r/r MM who had not received prior T-cell redirection therapy (model cohort A [RP2D = 0.4 mg/kg weekly] and model cohort C [RP2D = 0.8 mg/kg every 2 weeks]) or who had received prior T-cell redirection therapy (model cohort B [either RP2D]). All patients had an ECOG Performance Status of 1 or less in phase I and of 2 or less in phase II. The outcomes relevant to this review included the primary outcome of ORR by IRC per the IMWG criteria and secondary outcomes of OS, PFS, DOR, CR or better rate, and harms. HRQoL was measured in phase II only, via the EORTC QLQ-C30, as a secondary outcome. The trial population had a mean age of 61 to 65 years and a mean MM duration of 7.2 to 7.7 years across the model cohorts. There were more male patients (55% to 57% across the cohorts) than female patients (43% to 46%). Most enrolled patients were white (86% to 90%); the next largest groups by ethnicity were Black or African American, and Asian. Most patients had an ECOG Performance Status of 1 (56% to 60%), and less than 10% of the patients had an ECOG Performance Status of 2 (indicating good overall performance status). Most patients had an R-ISS disease stage of II (62% to 70% across the cohorts), standard cytogenetic risk (59% to 71%), and triple-class (PI, IMiD, and anti-CD38 monoclonal antibody) refractory disease (69% to 84%). The proportions of patients who had penta-drug (≥ 2 PIs, 2 IMiDs, and 1 anti-CD38 monoclonal antibody) refractory disease were 29% in model cohort A, 23% in model cohort C, and 41% in model cohort B.
In the absence of direct randomized comparisons between talquetamab and relevant comparators, 3 nonrandomized studies comparing 2 talquetamab cohorts in the MonumenTAL-1 trial (0.4 mg/kg weekly SC and 0.8 mg/kg every 2 weeks SC) to RWPC in the LocoMMotion and MoMMent studies, to teclistamab in the MajesTEC-1 study, and to cilta-cel in the CARTITUDE-1 study were submitted. Each of the studies used IPD from both arms and IPTW methods with ATT weights to reduce the impact of confounding in comparing ORR, CR or better rate, VGPR or better rate, DOR, PFS, TTNT, and OS. All patients included met similar key eligibility criteria, including specific serum or urine M-protein levels, an ECOG Performance Status of 0 to 2, at least 3 prior lines of therapy, and documented disease progression within 12 months of the last therapy. The studies aimed to determine the comparative effectiveness of talquetamab versus RWPC, teclistamab, and cilta-cel in treating r/r MM. No evidence was provided on the impact of talquetamab on HRQoL and harms compared to other relevant treatments. Comparisons to elranatamab were unavailable, which is understandable given that the drug was recently reviewed by the pan-Canadian Oncology Drug Review Expert Review Committee.33
Interpretation of Results
Efficacy
The findings of the MonumenTAL-1 study need to be interpreted with consideration of the single-arm design, which typically cannot support causal conclusions about the effect of a drug versus any comparator. However, ORR is a surrogate end point that can be evaluated as a direct measure of anticancer activity in a single-arm design60 by considering the magnitude of the effect and the proportion of CRs. Evidence for time-to-event end points (i.e., PFS, OS) is not possible to robustly evaluate in a single-arm design; therefore, the interpretation of findings for these end points from the MonumenTAL-1 study is informed primarily by expert opinion.
The MonumenTAL-1 study reached its primary outcome at the data cut-off (January 17, 2023) in the 3 model cohorts, demonstrating an ORR of 65% to 74% among patients with or without prior T-cell redirection therapy, at either of the RP2Ds. These analyses were uncontrolled for multiplicity. The clinical expert consulted for this review considered that the results were clinically meaningful. In both model cohorts A and C, subgroup analysis results for ORR appeared generally consistent with the primary analysis, but the ORR appeared higher among patients with no extramedullary plasmacytomas at baseline than among those with 1 or more baseline extramedullary plasmacytomas. This is an exploratory finding, but the clinical expert consulted for this review indicated that it may align with their observation in clinical practice. A CR or better rate was experienced in 34% to 39% of patients across the 3 model cohorts, which was considered clinically meaningful. Among patients experiencing a PR or better and at the data cut-off, the median DOR was reached in model cohorts A and B (with 39% to 49% of the patients censored) but not in model cohort C. The probability of patients remaining in response at 12 months was 44% in model cohort A, 69% in model cohort C, and 48% in model cohort B. The clinical expert considered these DOR results to demonstrate that the overall response was durable.
At the most recent data cut-off date, the OS data were immature, with medians and CIs not being reached. Also, for PFS, the upper bound of 95% CI in model cohort C is not estimable. The clinical expert commented that due to the lack of a control group, a causal conclusion about the clinically meaningful benefit on the 12-month OS rates (63% to 77% across the 3 model cohorts) is compromised. Moreover, whether the observed ORRs would be transferable to a meaningful treatment effect on OS or PFS remains unknown. HRQoL is an important outcome to patients and clinicians; however, interpretation of the EORTC QLQ-C30 results is limited, due to the lack of a control group, potential bias related to the open-label design, and the large amount of missing outcome data over time.
The studies comparing talquetamab to RWPC demonstrated that talquetamab improved ORR, PFS, OS, and TTNT in patients with triple-class exposed r/r MM. Additionally, the DOR showed a reduction in the risk of progression or death for the 0.8 mg/kg every 2 weeks SC dose.
When comparing talquetamab to teclistamab, talquetamab showed █████████ ███████ ██ ███ ███ ██ ███ ███ ██ ███ ██ ███. However, the adjusted HR for DOR was ████ ████ ███ █████ █████ █████████ for the 0.4 mg/kg weekly SC dose, indicating an increased risk for progression or death compared to teclistamab. The HRs for PFS and TTNT showed no exclusion of the null between the treatments, while the adjusted HRs for OS indicated a significant reduction in the risk of death for talquetamab.
In the comparison of talquetamab to cilta-cel, cilta-cel was ████ ██████ ██ ███████ ██ ███████ ████████. Cilta-cel also ███████ ███ ████ ██ ███████████ ██ █████ when compared against the 0.4 mg/kg weekly SC dose, while the 0.8 mg/kg every 2 weeks SC dose showed no significant difference. In terms of PFS, the adjusted HR was ████ ████ ███ █████ █████ █████████ for the 0.4 mg/kg weekly SC dose and ████ ████ ███ █████ █████ █████████ for the 0.8 mg/kg every 2 weeks SC dose. For OS, there was ██ ███████████ ██████████ between the treatments, with adjusted HRs of ████ ████ ███ █████ █████ █████████ ███ ████ ████ ███ █████ █████ █████████. Cilta-cel █████████████ ███████ the TTNT when compared with the 0.4 mg/kg weekly SC group but not with the 0.8 mg/kg every 2 weeks SC group.
The 3 nonrandomized studies of talquetamab compared with RWPC, teclistamab, and cilta-cel used IPD with IPTW and ATT to reduce the impact of confounding arising from the lack of randomization, matching the MonumenTAL-1 trial criteria and outcome definitions. Despite these efforts, significant limitations remain, such as the lack of systematic review for comparator data selection and the lack of clarity regarding an a priori protocol, increasing the risk of selection bias, as well as unaddressed quality issues in included studies. Pooling data from the LocoMMotion and MoMMent studies in the RWPC comparison without accounting for variability may introduce bias. The identification of prognostic factors relied on expert opinion without a systematic approach, and important factors like cytogenetic risk were excluded due to missing data, introducing increased risk of bias due to residual confounding. Additionally, even after weighting there were meaningful imbalances in known prognostic variables in the comparisons between talquetamab and both RWPC and cilta-cel. Additionally, unknown confounders and potential deviations from the proportional hazards assumption further complicate the findings. Generalizability issues arise from outdated RWPC interventions and the inherent limitations of clinical trial data. The absence of safety or HRQoL measures also limits a comprehensive understanding of the treatments’ comparative effectiveness and safety.
The evidence from the nonrandomized comparisons suggests that there is a benefit of talquetamab compared to RWPC. A benefit of talquetamab over RWPC seems plausible and given the large magnitude of effect for several outcomes (particularly CR or better rate and OS), it seems unlikely that bias and residual confounding can fully explain the result. However, the exact magnitude of benefit is not certain, and the relevance of the comparison is diminished by the mix of treatments included in the RWPC arm, many of which may not be relevant to current practice. The comparison of talquetamab versus teclistamab showed inconsistent results across outcomes ███ █████ ████ █████ ████ ███ ██████████ ███ █████, which resulted in uncertainty about which drug might be favoured. Finally, there is a consistency of effect in cilta-cel versus talquetamab for most outcomes when compared against the 0.4 mg/kg weekly cohort. The results suggest that cilta-cel has ████ ██████████ ████ ██ ██ ███████ ████ ███ ███ outcomes than talquetamab at a dosage of 0.4 mg/kg weekly. The potential difference between treatments was less evident for the 0.8 mg/kg every 2 weeks cohort, where only tumour response results excluded the null. The effect estimates for both dosages were ███ █████████ ██ ████ █ ██████████ █████ ███████ ███████████ ██ █████████ █████ ██ ████████ ███ ██.
The clinician group and the clinical expert consulted for this review pointed out that there are limited available options for patients with r/r MM receiving the fourth or later lines of therapy and that many of these patients would eventually cease to experience response to the available funded drugs. Being the first GPRC5D-targeted drug for r/r MM, talquetamab may help meet some of the unmet needs, because it would be an additional treatment option with a different mechanism of action. The clinical expert also noted that 23% to 41% of patients across the model cohorts in the MonumenTAL-1 study had penta-refractory disease and that the findings may have generalizability among these heavily treated patients. In the opinion of the clinical expert, it is likely that most patients would eventually be on the 0.8 mg/kg every 2 weeks SC dosing schedule after the initial step-up doses due to convenience. Both the clinical expert and the clinician group indicated that talquetamab could be used for patients who had and had not received prior anti-BCMA therapy.
Harms
Input from the patient and clinician groups and from the clinical expert consulted for this review all highlighted the importance of a tolerable treatment. The patient group considered ICANS, CRS, and infection as the most important harms associated with talquetamab treatment. The most common TEAEs were CRS (79% in model cohort A and 75% in model cohort C), dysgeusia (50% and 49%), and anemia (45% and 46%). Serious TEAEs occurred in approximately half the patients in model cohorts A and C, and the most frequently reported event was CRS (17% and 10%). TEAEs with the outcome of death occurred in 4% of the patients in model cohorts A and C, of which 1 patient (0.7%) in each cohort died due to COVID-19. The AEs of special interest were CRS (79% and 75% in model cohorts A and C), patients with 1 or more neurologic TEAEs (86% in both cohorts), neurotoxicity events (31% and 30% in model cohorts A and C), ICANS (11% in both cohorts), and infection of any severity (59% and 66% in model cohorts A and C). Rates of infections of grade 3 or 4 were 20% in model cohort A and 15% in model cohort C. The common reported TEAEs associated with talquetamab are related to T-cell activation (e.g., CRS). However, due to the lack of a comparator in the MonumenTAL-1 study, no causal association can be drawn for talquetamab regarding the risk of any particular harm or whether talquetamab is a more tolerable treatment than other treatment options. The clinical expert noted that patients in the pivotal study may have been healthier and younger than the broader population of patients in Canada who could receive talquetamab in practice. These patients enrolled in the MonumenTAL-1 study may be better able to tolerate an AE and be willing to remain on the study drug, thereby lowering the number of patients who withdrew from treatment compared to clinical practice. The clinical expert indicated that the reported AEs were reasonable for what is known about r/r MM and the study treatments (talquetamab and concomitant medications) and that with appropriate care the AEs would be manageable for most patients, as was described in the MonumenTAL-1 study.
The product monograph requires that patients “remain within proximity of a healthcare facility” and be monitored for 48 hours after all doses within the step-up dose regimen for either RP2D, in particular for CRS and/or ICANS.35
Conclusion
One ongoing, phase I/II, single-arm, open-label study (MonumenTAL-1) provided evidence regarding the efficacy and safety of talquetamab for patients with r/r MM who had received at least 3 prior lines of therapy. The evidence for the treatment effect of talquetamab from the MonumenTAL-1 trial is very uncertain due to the single-arm design, which is not intended to be confirmatory for efficacy. The findings for ORR were clinically meaningful and durable according to the clinical expert consulted by the review team and can be attributed to talquetamab (rather than natural history or other factors) despite the single-arm design. However, causal conclusions regarding time-to-event end points were not possible given the lack of comparator group, though the clinical expert indicated that based on the natural history of the disease and the experience in clinical practice, the OS and PFS findings observed in the MonumenTAL-1 study appear promising in patients without prior exposure to a T-cell redirection therapy at either the 0.4 mg/kg weekly SC or the 0.8 mg/kg once every 2 weeks SC dosage. The results for HRQoL were inconclusive due to the open-label design and considerable missing outcome data. Notable harms in the MonumenTAL-1 study, including CRS, ICANS, and infections, were consistent with the known safety profile of the drug.
Three nonrandomized studies assessed the efficacy of talquetamab compared with RWPC, teclistamab, and cilta-cel, using IPD with IPTW and ATT weights to reduce the impact of confounding. All these comparisons were impacted by methodological limitations, including lack of a predefined systematic review protocol, no systematic procedure for the identification of comparator studies, lack of quality assessment, lack of clarity on the appropriateness of pooling the LocoMMotion and MoMMent studies for the RWPC comparison, and a risk of bias due to residual confounding (particularly for comparisons to RWPC and cilta-cel). Nonetheless, the evidence suggested a benefit of talquetamab for all measured outcomes compared to RWPC. Though this comparison was the most impacted by the aforementioned limitations, the large magnitude of estimated benefit across multiple outcomes seems unlikely to be fully accounted for by these limitations. The true magnitude of the difference is less clear, and the relevance of this comparison was diminished by the mix of treatments included in the RWPC arm, many of which may not be widely used in current practice. Results for talquetamab versus teclistamab were inconsistent across outcomes, in many cases with CIs crossing the null, which caused uncertainty about which drug might be favoured. Finally, the evidence suggested that cilta-cel may have ████ ██████████ ████ ████ ███ ███ than the 0.4 mg/kg weekly dosage of talquetamab. Potential differences between treatments were uncertain for the 0.8 mg/kg every 2 weeks cohort, where only tumour response results excluded the null. The effect estimates were ███ █████████ ██ ████████ █████ ███ ██████████ ██ ██ between talquetamab and cilta-cel for any dose comparison. No comparative evidence for HRQoL or harms was available.
References
1.Kyle RA, Rajkumar SV. Criteria for diagnosis, staging, risk stratification and response assessment of multiple myeloma. Leukemia. 2009;23(1):3-9. PubMed
2.Canadian Cancer Statistics Advisory Committee, Canadian Cancer Society, Statistics Canada, Public Health Agency of Canada. Canadian cancer statistics 2023. Canadian Cancer Society; 2023: https://cdn.cancer.ca/-/media/files/research/cancer-statistics/2023-statistics/2023_PDF_EN.pdf. Accessed May, 2024.
3.Canadian Cancer Society. Survival statistics for multiple myeloma. https://cancer.ca/en/cancer-information/cancer-types/multiple-myeloma/prognosis-and-survival/survival-statistics. Accessed May, 2023.
4.Podar K, Leleu X. Relapsed/refractory multiple myeloma in 2020/2021 and beyond. Cancers (Basel). 2021;13(20):5154. PubMed
5.Mikhael J, Ismaila N, Cheung MC, et al. Treatment of multiple myeloma: ASCO and CCO joint clinical practice guideline. J Clin Oncol. 2019;37(14):1228-1263. PubMed
6.Kurtin SE. Relapsed or relapsed/refractory multiple myeloma. J Adv Pract Oncol. 2013;4(Suppl 1):5-14.
7.Rajkumar SV. Multiple myeloma: 2022 update on diagnosis, risk stratification, and management. Am J Hematol. 2022;97(8):1086-1107. PubMed
8.CADTH. Reimbursement Review: Provisional funding algorithm for multiple myeloma. 2023: https://www.cadth.ca/sites/default/files/DRR/2023/PH0031%20Multiple%20Myeloma_Algorithm-Secured.pdf. Accessed May, 2024.
9.Kumar S, Paiva B, Anderson KC, et al. International Myeloma Working Group consensus criteria for response and minimal residual disease assessment in multiple myeloma. Lancet Oncol. 2016;17(8):e328-e346. PubMed
10.European Medicines Agency (EMA)/Committee for Medicinal Products for Human Use (CHMP). Reflection paper on establishing efficacy based on single-arm trials submitted as pivotal evidence in a marketing authorisation: Considerations on evidence from single-arm trials. Amsterdam (NL)2023: https://www.ema.europa.eu/en/documents/scientific-guideline/reflection-paper-establishing-efficacy-based-single-arm-trials-submitted-pivotal-evidence-marketing-authorisation_en.pdf. Accessed August 30, 2024.
11.Osborne TR, Ramsenthaler C, Siegert RJ, Edmonds PM, Schey SA, Higginson IJ. What issues matter most to people with multiple myeloma and how well are we measuring them? A systematic review of quality of life tools. Eur J Haematol. 2012;89(6):437-457. PubMed
12.Bird SA, Boyd K. Multiple myeloma: an overview of management. Palliat Care Soc Pract. 2019;13:1178224219868235. PubMed
13.Santesso N, Glenton C, Dahm P, et al. GRADE guidelines 26: informative statements to communicate the findings of systematic reviews of interventions. J Clin Epidemiol. 2020;119:126-135. PubMed
14.Balshem H, Helfand M, Schünemann HJ, et al. GRADE guidelines: 3. Rating the quality of evidence. J Clin Epidemiol. 2011;64(4):401-406. PubMed
15.Janssen Inc. Update to Clinical Study Reports Dated 09 November 2022 and 14 November 2022: 64407564MMY1001. A phase 1/2, first-in-human, open-label, dose escalation study of talquetamab, a humanized GPRC5D x CD3 bispecific antibody, in subjects with relapsed or refractory multiple myeloma [internal sponsor's report]. June 22, 2023.
16.Janssen Research Development. NCT03399799: Dose escalation study of talquetamab in participants with relapsed or refractory multiple myeloma MonumenTAL-1. ClinicalTrials.gov. ClinicalTrials.gov. Bethesda (MD): U.S. National Library of Medicine; 2024: https://trialsearch.who.int/Trial2.aspx?TrialID=NCT03399799. Accessed February 2024.
17.Janssen Research Development. NCT04634552: A study of talquetamab in participants with relapsed or refractory multiple myeloma MonumenTAL-1. ClinicalTrials.gov. ClinicalTrials.gov. Bethesda (MD): U.S. National Library of Medicine; 2024: https://trialsearch.who.int/Trial2.aspx?TrialID=NCT04634552. Accessed February 2024.
18.Canadian Cancer Society. Symptoms of multiple myeloma. https://cancer.ca/en/cancer-information/cancer-types/multiple-myeloma/signs-and-symptoms. Accessed May 2023.
19.Myeloma Canada. Multiple myeloma patient handbook. 2014; https://myeloma.ca/pixms/uploads/serve/ckeditor/mmph_en-2.pdf. Accessed May 2023.
20.Canadian Cancer Society. Prognosis and survival for multiple myeloma. https://cancer.ca/en/cancer-information/cancer-types/multiple-myeloma/prognosis-and-survival. Accessed May 2023.
21.Mayo Clinic. Multiple myeloma. https://www.mayoclinic.org/diseases-conditions/multiple-myeloma/diagnosis-treatment/drc-20353383. Accessed May 2023.
22.Canadian Cancer Society. Stages of multiple myeloma. https://cancer.ca/en/cancer-information/cancer-types/multiple-myeloma/staging. Accessed May 2023.
23.Greipp PR, San Miguel J, Durie BG, et al. International staging system for multiple myeloma. J Clin Oncol. 2005;23(15):3412-3420. PubMed
24.Bhatt P, Kloock C, Comenzo R. Relapsed/refractory multiple myeloma: A review of available therapies and clinical scenarios encountered in myeloma relapse. Curr Oncol. 2023;30(2):2322-2347. PubMed
25.Rajkumar SV, Harousseau JL, Durie B, et al. Consensus recommendations for the uniform reporting of clinical trials: report of the International Myeloma Workshop Consensus Panel 1. Blood. 2011;117(18):4691-4695. PubMed
26.Sonneveld P. Management of multiple myeloma in the relapsed/refractory patient. Hematology Am Soc Hematol Educ Program. 2017;2017(1):508-517. PubMed
27.Mikhael J. Treatment options for triple-class refractory multiple myeloma. Clin Lymphoma Myeloma Leuk. 2020;20(1):1-7. PubMed
28.CADTH. Pan-Canadian Oncology Drug Review. Provincial funding summary for carfilzomib (Kyprolis) for multiple myeloma (relapsed). 2019: https://www.cadth.ca/sites/default/files/pcodr/pcodr_profund_carfilzomib_kyprolis_mm_rel.pdf. Accessed February 20, 2024.
29.CADTH. Pan-Canadian Oncology Drug Review. Provincial funding summary for pomalidomide (Pomalyst) for multiple myeloma. 2019: https://www.cadth.ca/sites/default/files/pcodr/pcodr_profund_pomalidomide_pomalyst_mm.pdf. Accessed February 20, 2024.
30.CADTH. Drug Reimbursement Expert Review Committee final recommendation: selinexor (Xpovio - FORUS Therapeutics Inc.). Can J Health Technol. 2022;2(8). https://www.cadth.ca/sites/default/files/DRR/2022/PC0276%20Xpovio%20-%20Final%20CADTH%20Recommendation_KT_KAS_KT_GP-meta.pdf. Accessed February, 2024.
31.CADTH. Drug Reimbursement Expert Review Committee final recommendation: ciltacabtagene autoleucel (Carvykti - Janssen Inc.). Can J Health Technol. 2023;3(8). https://www.cadth.ca/sites/default/files/DRR/2023/PG0302-Carvykti_combined.pdf. Accessed February, 2024.
32.CADTH. Drug Reimbursement Expert Review Committee final recommendation: teclistamab (TECVAYLI - Janssen Inc.) [DRAFT]. Ottawa (ON): CADTH; March, 2024: https://www.cadth.ca/sites/default/files/DRR/2024/PC0332%20Tecvayli%20-%20DRAFT%20Recommendation.pdf. Accessed July 8, 2024.
33.CADTH. Drug Reimbursement Expert Review Committee final recommendation: elranatamab (Elrexfio - Pfizer Canada ULC). Can J Health Technol. 2024;4(6). https://www.cadth.ca/sites/default/files/DRR/2024/PC0315_Final_Recommendation.pdf. Accessed July 8, 2024.
34.pan-Canadian Pharmaceutical Alliance (pCPA). Carvykti (ciltacabtagene autoleucel) [accessed by sponsor]. 2023; https://www.pcpacanada.ca/negotiation/22363. Accessed February, 2024.
35.Janssen Inc. Talvey (talquetamab): 3 mg/1.5 mL (2 mg/mL), 40 mg/1.0 mL (40 mg/mL) solution for subcutaneous injection [product monograph]. Toronto (ON)April 30, 2024.
36.Chari A, Minnema MC, Berdeja JG, et al. Talquetamab, a T-cell-redirecting GPRC5D bispecific antibody for multiple myeloma. N Engl J Med. 2022;387(24):2232-2244. PubMed
37.Janssen Inc. Tecvayli (teclistamab injection): 153 mg/ 1.7 mL (90 mg/mL) and 30 mg / 3 mL (10 mg/mL) solution for subcutaneous injection [product monograph]. July 26, 2023: https://pdf.hres.ca/dpd_pm/00071837.PDF. Accessed April, 2024.
38.Janssen Inc. Carvykti (ciltacabtagene autoleucel): cell suspensionin infusion bag, 0.5-1.0x10⁶ CAR-positive viable T-cells per kg body weight with a maximum of 1x10⁸ CAR-positive viable T-cells, for intravenous infusion [product monograph]. 2023: https://pdf.hres.ca/dpd_pm/00069527.PDF. Accessed February, 2024.
39.Usmani SZ, Garfall AL, van de Donk N, et al. Teclistamab, a B-cell maturation antigen × CD3 bispecific antibody, in patients with relapsed or refractory multiple myeloma (MajesTEC-1): a multicentre, open-label, single-arm, phase 1 study. Lancet. 2021;398(10301):665-674. PubMed
40.Van De Donk N, Rasche L, Touzeau C, et al. Health-related quality of life in patients with relapsed/refractory multiple myeloma treated with talquetamab, a G protein-coupled receptor family C group 5 member D X CD3 bispecific antibody, from Monumental-1. HemaSphere. 2023;7(Supplement 2):34.
41.Van De Donk NWCJ, Krishnan A, Oriol A, et al. Talquetamab, a G protein-coupled receptor family C group 5 member D (GPRC5D)xCD3 bispecific antibody, in relapsed/refractory multiple myeloma (RRMM): Updated results of a phase 1, first-in-human study. Clinical Lymphoma, Myeloma and Leukemia. 2021;21(Supplement 2):S16-S17.
42.Lee DW, Gardner R, Porter DL, et al. Current concepts in the diagnosis and management of cytokine release syndrome. Blood. 2014;124(2):188-195. PubMed
43.Janssen Research and Development. Clinical Protocol: 64407564MMY1001. A phase 1/2, first-in-human, open-label, dose escalation study of talquetamab, a humanized GPRC5D x CD3 bispecific antibody, in subjects with relapsed or refractory multiple myeloma [internal sponsor's report]. Toronto (ON)December 7, 2021.
44.Janssen Inc. Cost-effectiveness analysis of talquetamab in the treatment of patients with relapsed or refractory multiple myeloma. Pharmacoeconomic report [internal sponsor's report]. In: Drug Reimbursement Review sponsor submission: Talvey (talquetamab), 3 mg/1.5 mL (2 mg/mL), 40 mg/1.0 mL (40 mg/mL) solution for subcutaneous injection. Toronto (ON)2024.
45.Janssen Inc. Talquetamab for the treatment of relapsed/refractory multiple myeloma [internal sponsor's report]. In: Drug Reimbursement Review sponsor submission: Talvey (talquetamab), 3 mg/1.5 mL (2 mg/mL), 40 mg/1.0 mL (40 mg/mL) solution for subcutaneous injection. Toronto (ON)2024.
46.Cocks K, King MT, Velikova G, Fayers PM, Brown JM. Quality, interpretation and presentation of European Organisation for Research and Treatment of Cancer quality of life questionnaire core 30 data in randomised controlled trials. Eur J Cancer. 2008;44(13):1793-1798. PubMed
47.Janssen Inc. Janssen Inc. response to Canada's Drug Agency request for additional information regarding Talvey (talquetamab) review on June 12, 2024 [internal additional sponsor's information]. Toronto (ON)June 20, 2024.
48.Aaronson NK, Ahmedzai S, Bergman B, et al. The European Organization for Research and Treatment of Cancer QLQ-C30: A quality-of-life instrument for use in international clinical trials in oncology. J Natl Cancer Inst. 1993;85(5):365-376. PubMed
49.Fayers PM, Aaronson NK, Bjordal K, Groenvold M, Curran D, Bottomley A. The EORTC QLQ-C30 scoring manual (3rd Edition). Brussels (BE): European Organisation for Research and Treatment of Cancer; 2001: https://www.eortc.org/app/uploads/sites/2/2018/02/SCmanual.pdf. Accessed November 6, 2023.
50.Kvam AK, Wisloff F, Fayers PM. Minimal important differences and response shift in health-related quality of life: A longitudinal study in patients with multiple myeloma. Health Qual Life Outcomes. 2010;8(1):79. PubMed
51.Wisloff F, Eika S, Hippe E, et al. Measurement of health-related quality of life in multiple myeloma. Nordic Myeloma Study Group. Br J Haematol. 1996;92(3):604-613. PubMed
52.Danaher EH, Ferrans C, Verlen E, et al. Fatigue and physical activity in patients undergoing hematopoietic stem cell transplant. Oncol Nurs Forum. 2006;33(3):614-624. PubMed
53.Molassiotis A, Wilson B, Blair S, Howe T, Cavet J. Unmet supportive care needs, psychological well-being and quality of life in patients living with multiple myeloma and their partners. Psychooncology. 2011;20(1):88-97. PubMed
54.Ringdal K, Ringdal GI, Kaasa S, et al. Assessing the consistency of psychometric properties of the HRQoL scales within the EORTC QLQ-C30 across populations by means of the Mokken Scaling Model. Qual Life Res. 1999;8(1-2):25-43. PubMed
55.Kvam AK, Fayers PM, Wisloff F. Responsiveness and minimal important score differences in quality-of-life questionnaires: A comparison of the EORTC QLQ-C30 cancer-specific questionnaire to the generic utility questionnaires EQ-5D and 15D in patients with multiple myeloma. Eur J Haematol. 2011;87(4):330-337. PubMed
56.Kvam AK, Fayers P, Wisloff F. What changes in health-related quality of life matter to multiple myeloma patients? A prospective study. Eur J Haematol. 2010;84(4):345-353. PubMed
57.Janssen Inc. Janssen Inc. response to Canada's Drug Agency request for additional information regarding Talvey (talquetamab) review on May 23, 2024 [internal additional sponsor's information]. Toronto (ON)May 30, 2024.
58.Janssen Inc. Talquetamab for the treatment of relapsed/refractory multiple myeloma: Final CADTH clinical summary [internal sponsor's report]. In: Drug Reimbursement Review sponsor submission: Talvey (talquetamab), 3 mg/1.5 mL (2 mg/mL), 40 mg/1.0 mL (40 mg/mL) solution for subcutaneous injection. Toronto (ON)2024 Apr 30.
59.Evans SR. Clinical trial structures. J Exp Stroke Transl Med. 2010;3(1):8-18. PubMed
60.Clinical trial endpoints for the approval of cancer drugs and biologics: Guidance for industry. Silver Spring (MD): U.S. Food and Drug Administration (FDA); 2018: https://www.fda.gov/media/71195/download. Accessed June 30, 2024.
61.Janssen Research & Development. Adjusted comparison of talquetamab in MonumenTAL-1 versus real-world physician’s choice in LocoMMotion and MoMMent for the treatment of patients with multiple myeloma with prior exposure to a proteasome inhibitor, an immunomodulatory imide and an anti-CD38 monoclonal antibody (September 2023 Update) [internal sponsor's report]. In: Drug Reimbursement Review sponsor submission: Talvey (talquetamab), 3 mg/1.5 mL (2 mg/mL), 40 mg/1.0 mL (40 mg/mL) solution for subcutaneous injection. 2023.
62.Einsele H, Moreau P, Bahlis N, et al. Comparative efficacy of talquetamab vs. Current treatments in the locommotion and momment studies in patients with triple-class-exposed relapsed/refractory multiple myeloma. Adv Ther. 2024. PubMed
63.Mateos MV, Weisel K, De Stefano V, et al. LocoMMotion: a prospective, non-interventional, multinational study of real-life current standards of care in patients with relapsed and/or refractory multiple myeloma. Leukemia. 2022;36(5):1371-1376. PubMed
64.Janssen Pharmaceutica. NCT05160584: A study of real-life current standards of care in participants with relapsed and/or refractory multiple myeloma (MoMMent). ClinicalTrials.gov. 2024: https://www.clinicaltrials.gov/study/NCT05160584?cond=NCT05160584&rank=1. Accessed February, 2024.
65.Janssen Research & Development. Adjusted comparison of talquetamab in MonumenTAL-1 versus teclistamab in MajesTEC-1 for the treatment of patients with multiple myeloma with prior exposure to a proteasome inhibitor, an immunomodulatory imide drug and an anti-CD38 monoclonal antibody [internal sponsor's report]. In: Drug Reimbursement Review sponsor submission: Talvey (talquetamab), 3 mg/1.5 mL (2 mg/mL), 40 mg/1.0 mL (40 mg/mL) solution for subcutaneous injection. 2023.
66.Janssen Research & Development. Adjusted comparison of talquetamab in MonumenTAL-1 versus cilta-cel in CARTITUDE 1 for the treatment of patients with multiple myeloma with prior exposure to a proteasome inhibitor, an immunomodulatory imide drug and an anti-CD38 monoclonal antibody [internal sponsor's report]. In: Drug Reimbursement Review sponsor submission: Talvey (talquetamab), 3 mg/1.5 mL (2 mg/mL), 40 mg/1.0 mL (40 mg/mL) solution for subcutaneous injection. 2023.
67.Berdeja JG, Madduri D, Usmani SZ, et al. Ciltacabtagene autoleucel, a B-cell maturation antigen-directed chimeric antigen receptor T-cell therapy in patients with relapsed or refractory multiple myeloma (CARTITUDE-1): a phase 1b/2 open-label study. Lancet. 2021;398(10297):314-324. PubMed
68.Ioannidis JPA, Tan YJ, Blum MR. Limitations and misinterpretations of E-values for sensitivity analyses of observational studies. Ann Intern Med. 2019;170(2):108-111. PubMed
Appendix 1: Detailed Outcome Data
Please note that this appendix has not been copy-edited.
Additional Data of MonumenTAL-1 Study
Table 24: Summary of Refractory Status to Prior MM Therapy for Patients in MonumenTAL-1 Study
Refractory status, n (%) | 0.4 mg/kg weekly SC and no prior T-cell redirection therapy (N = 143) | 0.8 mg/kg q.2.w. SC and no prior T-cell redirection therapy (N = 145) | 0.4 mg/kg weekly SC or 0.8 mg/kg q.2.w. SC and prior T-cell redirection therapy (N = 51) |
|---|---|---|---|
Refractory at any point to prior therapy | 143 (100.0) | 145 (100.0) | 51 (100.0) |
Refractory status | |||
Any PI | 114 (79.7) | 120 (82.8) | 46 (90.2) |
Any IMiD | 133 (93.0) | 130 (89.7) | 49 (96.1) |
Any anti-CD38 antibody | 133 (93.0) | 134 (92.4) | 49 (96.1) |
Double (PI + IMiD) | 110 (76.9) | 108 (74.5) | 44 (86.3) |
Triple (PI + IMiD + anti-CD38 antibody) | 106 (74.1) | 100 (69.0) | 43 (84.3) |
Penta (2 PI, 2 IMiD, anti-CD38 antibody) | 42 (29.4) | 34 (23.4) | 21 (41.2) |
Refractory to last line of prior therapy | 134 (93.7) | 137 (94.5) | 31 (60.8) |
Refractory to | |||
Bortezomib | 64 (44.8) | 78 (53.8) | 36 (70.6) |
Carfilzomib | 88 (61.5) | 72 (49.7) | 35 (68.6) |
Ixazomib | 24 (16.8) | 20 (13.8) | 6 (11.8) |
Lenalidomide | 114 (79.7) | 102 (70.3) | 43 (84.3) |
Pomalidomide | 108 (75.5) | 98 (67.6) | 39 (76.5) |
Thalidomide | 11 (7.7) | 18 (12.4) | 5 (9.8) |
Daratumumab | 127 (88.8) | 129 (89.0) | 48 (94.1) |
Isatuximab | 12 (8.4) | 13 (9.0) | 4 (7.8) |
Selinexor | 13 (9.1) | 14 (9.7) | 7 (13.7) |
Melphalan flufenamide | 2 (1.4) | 2 (1.4) | 0 |
Belantamab | 18 (12.6) | 13 (9.0) | 4 (7.8) |
CAR T-cell therapy | 0 | 0 | 5 (9.8) |
Elotuzumab | 13 (9.1) | 25 (17.2) | 13 (25.5) |
Panobinostat | 2 (1.4) | 4 (2.8) | 4 (7.8) |
Bispecific antibody treatment | 0 | 0 | 17 (33.3) |
IMiD = immunomodulatory imide drug; PI = proteasome inhibitor; q.2.w. = once every 2 weeks; RP2D = recommended phase II dose; SC = subcutaneous.
Note: Data presented in this table were based on analyses at clinical cut-off date of January 17, 2023 for all treated analysis set and patients that received RP2D. Refractory to each medication referred to refractory to any medication-containing line.
Source: Clinical Study Report for MonumenTAL-1 (2023).15 Details included in the table are from the sponsor’s summary of clinical evidence.
Figure 41: Kaplan-Meier Plot for OS for Patients With No Prior T-Cell Redirection Therapy Treated at the RP2D of 0.4 mg/kg Weekly SC (All Treated Analysis Set; January 17, 2023, Clinical Cut-off) [Redacted]

Figure 42: Kaplan-Meier Plot for OS for Patients With No Prior T-Cell Redirection Therapy Treated at the RP2D of 0.8 mg/kg q.2.w. SC (All-Treated Analysis Set; January 17, 2023, Clinical Cut-Off) [Redacted]

Figure 43: Kaplan-Meier Plot for PFS per IRC Assessment for Patients With No Prior T-Cell Redirection Therapy Treated at the RP2D of 0.4 mg/kg Weekly SC (All-Treated Analysis Set; January 17, 2023, Clinical Cut-Off) [Redacted]

Figure 44: Kaplan-Meier Plot for PFS per IRC Assessment for Patients With No Prior T-Cell Redirection Therapy Treated at the RP2D of 0.8 mg/kg q.2.w. SC (All-Treated Analysis Set; January 17, 2023, Clinical Cut-Off) [Redacted]

Figure 45: Forest Plot of ORR Subgroup Analyses Patients With No Prior T-Cell Redirection Therapy Treated at the RP2D of 0.4 mg/kg Weekly SC per IRC Assessment (All-Treated Analysis Set; January 17, 2023, Clinical Cut-Off) [Redacted]

Figure 46: Forest Plot of ORR Subgroup Analyses for Patients With No Prior T-Cell Redirection Therapy Treated at the RP2D of 0.8 mg/kg q.2.w. SC per IRC Assessment (All-Treated Analysis Set; January 17, 2023, Clinical Cut-Off) [Redacted]

Table 25: Overall Best Confirmed Response per IRC in MonumenTAL-1 Study (January 17, 2023, Clinical Cut-Off)
Response, n (%) | Patients that received RP2D | |||||
|---|---|---|---|---|---|---|
0.4 mg/kg weekly SC and no prior T-cell redirection therapy (model cohort A) | 0.8 mg/kg q.2.w. SC and no prior T-cell redirection therapy (model cohort C) | 0.4 mg/kg weekly SC or 0.8 mg/kg q.2.w. SC and prior T-cell redirection therapy (model cohort B) | ||||
n (%) | 95% CI | n (%) | 95% CI | n (%) | 95% CI | |
Analysis set: all treated | 143 | 145 | 51 | |||
VGPR or better (sCR + CR + VGPR) | 85 (59.4%) | (50.9% to 67.6%) | 88 (60.7%) | (52.2% to 68.7%) | 28 (54.9%) | (40.3% to 68.9%) |
CR or better (sCR + CR) | 48 (33.6%) | (25.9% to 41.9%) | 56 (38.6%) | (30.7% to 47.1%) | 18 (35.3%) | (22.4% to 49.9%) |
Response category | ||||||
sCR | 34 (23.8%) | (17.1% to 31.6%) | 43 (29.7%) | (22.4% to 37.8%) | 15 (29.4%) | (17.5% to 43.8%) |
CR | 14 (9.8%) | (5.5% to 15.9%) | 13 (9.0%) | (4.9% to 14.8%) | 3 (5.9%) | (1.2% to 16.2%) |
VGPR | 37 (25.9%) | (18.9% to 33.9%) | 32 (22.1%) | (15.6% to 29.7%) | 10 (19.6%) | (9.8% to 33.1%) |
PR | 21 (14.7%) | (9.3% to 21.6%) | 16 (11.0%) | (6.4% to 17.3%) | 5 (9.8%) | (3.3% to 21.4%) |
MR | 2 (1.4%) | (0.2% to 5.0%) | 0 | (NE to NE) | 0 | (NE to NE) |
Stable disease | 24 (16.8%) | (11.1% to 23.9%) | 27 (18.6%) | (12.6% to 25.9%) | 14 (27.5%) | (15.9% to 41.7%) |
Progressive disease | 6 (4.2%) | (1.6% to 8.9%) | 9 (6.2%) | (2.9% to 11.5%) | 3 (5.9%) | (1.2% to 16.2%) |
NE | 5 (3.5%) | (1.1% to 8.0%) | 5 (3.4%) | (1.1% to 7.9%) | 1 (2.0%) | (0.0% to 10.4%) |
CI = confidence interval; CR = complete response; IRC = independent review committee; MR = minimal response; NE = not evaluable; PR = partial response; q.2.w. = once every 2 weeks; RP2D = recommended phase II dose; SC = subcutaneous; sCR = stringent complete response; VGPR = very good partial response.
Note: Response was assessed by IRC, based on IMWG consensus criteria (2016).9 Percentages are calculated with the number of patients in the all-treated analysis set as denominator. Exact 95% confidence intervals are provided.
Source: Clinical Study Report for MonumenTAL-1 (2023).15
Minimal Residual Disease Negativity
Minimal residual disease (MRD) negative status, defined as the proportion of patients who experienced MRD-negative status to a threshold of 10-5 at any time point after initial dose of talquetamab and before progressive disease or starting subsequent therapy, was assessed in patients experiencing a PR or better in the all-treated analysis set. MRD-negative status to a threshold of 10-6 was also reported. In the analysis set if patients with CR or better per IRC assessment, MRD negativity rate of 10-5 was reported (Table 26).15,43 Overall, the proportion of patients who experienced MRD-negative status increased with continued talquetamab treatment.15
Patients With No Prior T-cell Redirection Therapy Treated at the RP2D of 0.4 mg/kg Weekly SC (Model Cohort A)
In the all-treated analysis set, 30.8% of patients (95% CI, 23.3%, 39.0%) experienced MRD negativity at 10-5 and 21.0% (95% CI, 14.6%, 28.6%) experienced MRD negativity at 10-6. Among the 48 patients with CR or better per IRC assessment, 54.2% (95% CI, 39.2%, 68.6%) experienced MRD negativity at 10-5.
Patients With No Prior T-cell Redirection Therapy Treated at the RP2D of 0.8 mg/kg Every 2 Weeks SC (Model Cohort C)
In the all-treated analysis set, 29.7% of patients (95% CI, 22.4%, 37.8%) experienced MRD negativity at 10 to 5 and 20.7% (95% CI, 14.4%, 28.2%) experienced MRD negativity at 10-6. Among the 56 patients with CR or better per IRC assessment, 42.9% (95% CI, 29.7%, 56.8%) experienced MRD negativity at 10-5.
Patients With Prior T-Cell Redirection Therapy Treated at Either RP2D (0.4 mg/kg Weekly SC or 0.8 mg/kg Every 2 Weeks SC) (Model Cohort B)
In the all-treated analysis set, 17.6% of patients (95% CI, 8.4%, 30.9%) experienced MRD negativity at 10 to 5 and 11.8% (95% CI, 4.4%, 23.9%) experienced MRD negativity at 10-6. Among the 18 patients with CR or better per IRC assessment, 33.3% (95% CI, 13.3%, 59.0%) experienced MRD negativity at 10-5.
Table 26: Summary of Overall MRD Negativity Rate in Bone Marrow in MonumenTAL-1 Study (January 17, 2023, Clinical Cut-Off)
Outcome, n (%) | Patients that received RP2D | ||
|---|---|---|---|
0.4 mg/kg weekly SC and no prior T-cell redirection therapy (model cohort A) | 0.8 mg/kg q.2.w. SC and no prior T-cell redirection therapy (model cohort C) | 0.4 mg/kg weekly SC or 0.8 mg/kg q.2.w. SC and prior T-cell redirection therapy (model cohort B) | |
Analysis set: all treated | 143 | 145 | 51 |
MRD negativity rate (10-5) | |||
n (%) | 44 (30.8) | 43 (29.7) | 9 (17.6) |
95% CI of MRD-negative rate | (23.3 to 39.0) | (22.4 to 37.8) | (8.4 to 30.9) |
MRD negativity rate (10-6) | |||
n (%) | 30 (21.0) | 30 (20.7) | 6 (11.8) |
95% CI of MRD-negative rate | (14.6 to 28.6) | (14.4 to 28.2) | (4.4 to 23.9) |
Analysis set: Patients experiencing CR or better per IRC in the all-treated analysis set | 48 | 56 | 18 |
MRD negativity rate (10-5) | |||
n (%) | 26 (54.2) | 24 (42.9) | 6 (33.3) |
95% CI of MRD-negative rate | (39.2 to 68.6) | (29.7 to 56.8) | (13.3 to 59.0) |
CI = confidence interval; CR = complete response; IRC = independent review committee; MRD = minimal residual disease; q.2.w. = once every 2 weeks; RP2D = recommended phase II dose; SC = subcutaneous.
Source: Clinical Study Report for MonumenTAL-1 (2023).15
EORTC QLQ-C30
Patients Enrolled in the MonumenTAL-1 Phase II Trial With No Prior T-cell Redirection Therapy and Treated With Talquetamab 0.4 mg/kg Weekly SC (Phase II Cohort A)
Patients in this cohort reported the following changes in score during talquetamab treatment (with mean [standard deviation] changes from baseline):15███████████ █████████ ████ █████ ██ █████ █ ███ █ █████ ████████ ████ █████████ ████ ██████ ██ █████ ███████████ ███████ █████ ██ ███ █ ███████ ████ ██████ ██ █████ ███████████████████ █████████ ███████ ██ █████ █ ███ █ ████ ███████ ███ █████ █ ███ █ ████ ████████ ████ █████████ ██████ ██ █████ █ ███ █ ███████ █████ ██ ███ █ ███████ ████ ██████ ██ █████ ███████████████████ █████████ ██████ ██████ ██████ ██ █████ █ ███ █ █████ ████████ ████ █████████ ██████ ███████ █████ ██ ███ █ ███████ ███ ██████ ██ ████ ███████████████████ █████████ ████████ ███████████ ██ █████ █ ███ █ █████ ███████ ███ █████ █ ███ █ █████ ████████ ████ █████████ ██████ ██ █████ █ ███ █ ███████ █████ ██ ███ █ ███████ ███ ██████ ██ ████ █████████
Table 27: Improvement of at Least 10 Points From Baseline in EORTC QLQ-C30 Scales in Phase II for Patients Treated at Either RP2D (0.4 mg/kg Weekly SC or 0.8 mg/kg q.2.w. SC) With Prior T-Cell Redirection Therapy
EORTC QLQ-C30 Scale | MonumenTAL-1 phase II RP2D: 0.4 mg/kg weekly SC or 0.8 mg/kg q.2.w. SC | |||||||
|---|---|---|---|---|---|---|---|---|
Cycle 1 day 1 | Cycle 3 day 1 | Cycle 5 day 1 | Cycle 7 day 1 | |||||
n | Experienced meaningful change, n (%) | n | Experienced meaningful change, n (%) | n | Experienced meaningful change, n (%) | n | Experienced meaningful change, n (%) | |
Analysis set: all treated analysis set | 30 | NA | 24 | NA | 18 | NA | 15 | NA |
Pain score | 30 | ███████ | ██ | ███████ | ██ | ███████ | ██ | ███████ |
Fatigue | 30 | ███████ | ██ | ███████ | ██ | ███████ | ██ | ███████ |
Global health status | 30 | ███████ | ██ | ███████ | ██ | ███████ | ██ | ███████ |
Physical functioning | 30 | ███████ | ██ | ██ | ██ | ███████ | ██ | ███████ |
EORTC QLQ-C30 = European Organisation for Research and Treatment of Cancer Quality of Life Questionnaire Core 30; RP2D = recommended phase II dose; SC = subcutaneous.
Note: Data presented in this table were based on analyses at clinical cut-off date of January 17, 2023. Based on the literature, 10 points was used as the threshold for meaningful change. Meaningful change indicates meaningful improvement.
Source: Sponsor’s submission.58
Figure 47: Mean Change From Baseline in EORTC QLQ-C30 Subscales for Pain, Fatigue, GHS, and Physical Functioning Among Patients Enrolled in the MonumenTAL-1 Phase II Trial With No Prior T-Cell Redirection Therapy and Treated With Talquetamab (A) 0.4 mg/kg Weekly SC or (B) 0.8 mg/kg q.2.w. SC
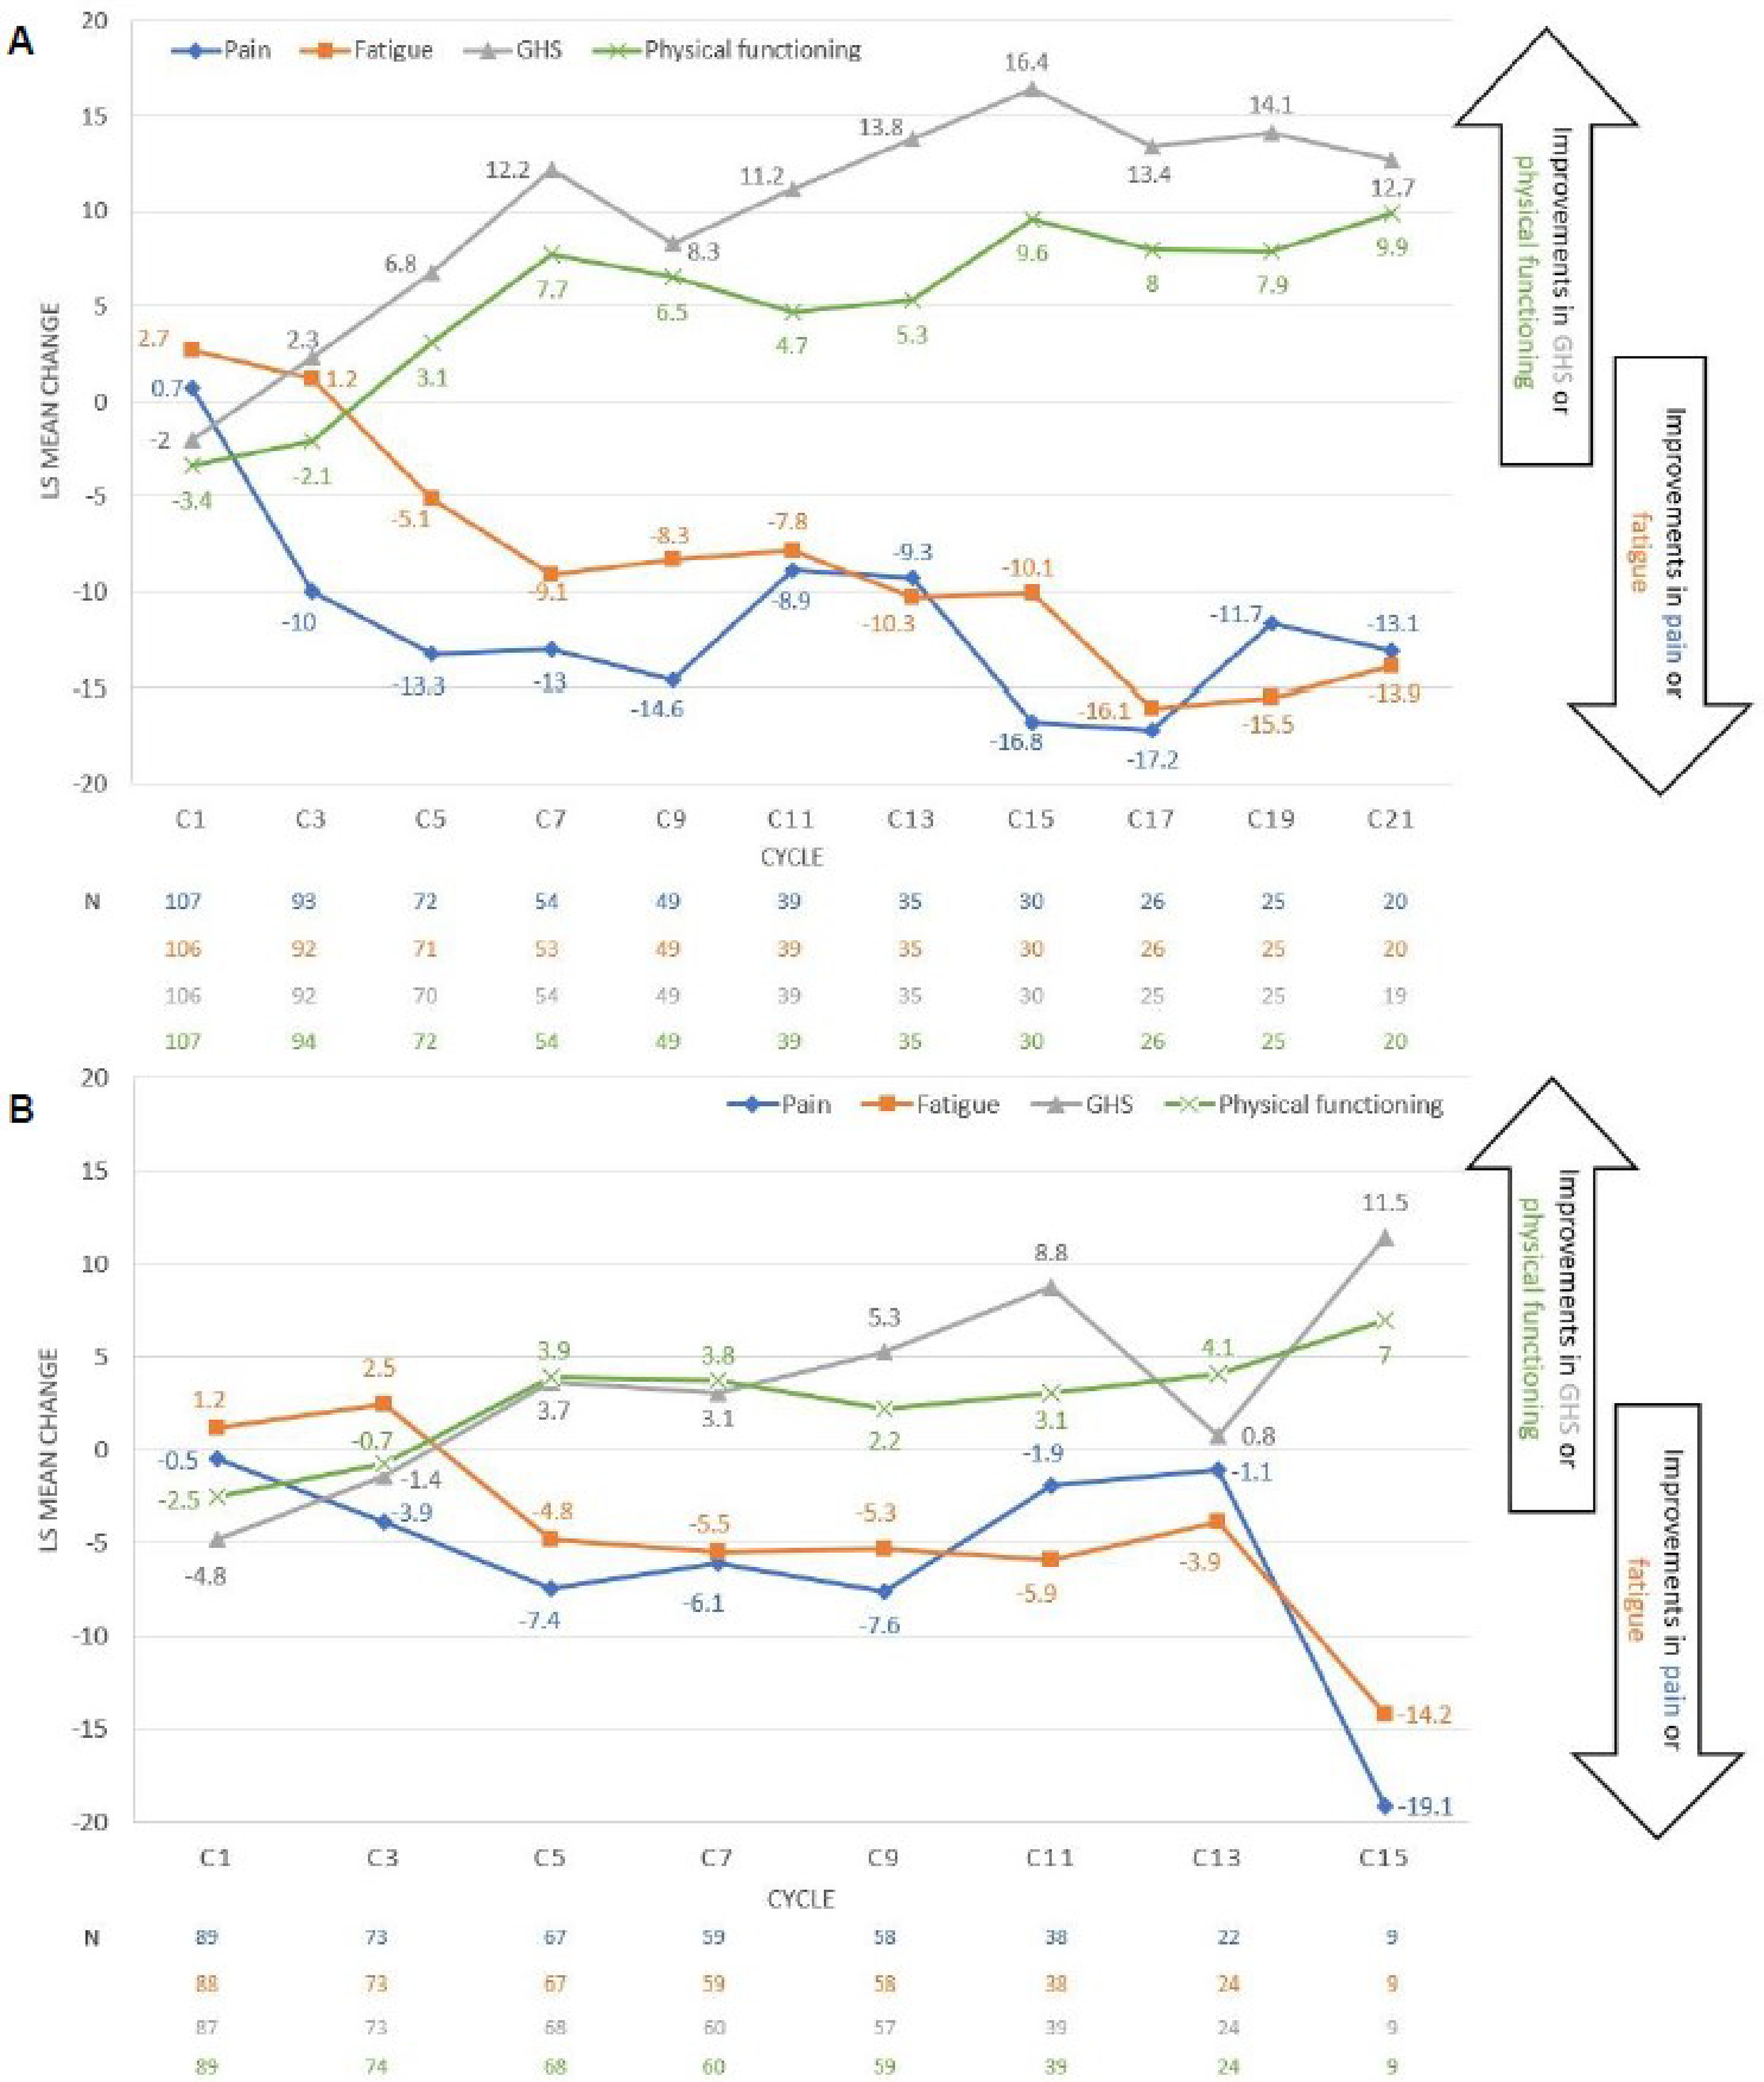
C = cycle; EORTC QLQ-C30 = European Organisation for Research and Treatment of Cancer Quality of Life Questionnaire Core 30; GHS = global health status; LS = least squares; SC = subcutaneous.
Source: Sponsor’s submission.58
Table 28: Time to Improvement and Time to Worsening in Selected EORTC QLQ-C30 Scales in Phase II Cohort
EORTC QLQ-C30 scale | 0.4 mg/kg weekly SC and no prior T-cell redirection therapy (all treated phase II cohort A, N = 122) | 0.8 mg/kg q.2.w. SC and no prior T-cell redirection therapy (all treated phase II cohort C, N = 109) | 0.4 mg/kg weekly SC or 0.8 mg/kg q.2.w. SC and prior T-cell redirection therapy (all treated phase II cohort B, N = 34) |
|---|---|---|---|
Time to improvement | |||
Pain score | |||
n | ██ | ██ | ██ |
Mean (SD), months | ███ █████ | ███ █████ | ███ █████ |
Median (range), months | ███ ████ █ █████ | ███ ████ █ █████ | ███ ████ ██ ████ |
Fatigue | |||
n | ██ | ██ | ██ |
Mean (SD), months | ███ █████ | ███ █████ | ███ █████ |
Median (range), months | ███ ███ ██ █████ | ███ ███ ███████ | ███ ████ ██ ████ |
Global health status | |||
n | ██ | ██ | ██ |
Mean (SD), months | ███ █████ | ███ █████ | ███ █████ |
Median (range), months | ███ ███ ██ █████ | ███ ███ ██ █████ | ███ █████ █████ |
Physical functioning | |||
n | ██ | ██ | ██ |
Mean (SD), months | ███ █████ | ███ █████ | ███ █████ |
Median (range), months | ███ ███ ██ █████ | ███ ████ ██ ████ | ███ █████ █████ |
Time to worsening | |||
Pain score | |||
Events, n (%) | ██ ██████ | ██ ██████ | ██ ██████ |
Censored, n (%) | ██ ██████ | ██ ██████ | ██ ██████ |
Kaplan-Meier estimate, median months (95% CI) | ███ █████ ████ | ███ █████ ████ | ███ █████ ███ |
3-month event-free probability, % (95% CI) | ████ ████ █████ | ████ ████ █████ | ████ ████ █████ |
6-month event-free probability, % (95% CI) | ████ ████ █████ | ████ ████ █████ | ████ ████ █████ |
9-month event-free probability, % (95% CI) | ████ ████ █████ | ████████ █████ | ████ ████ █████ |
Fatigue | |||
Events, n (%) | ██ ██████ | ██ ██████ | ██ ██████ |
Censored, n (%) | ██ ██████ | ██ ██████ | ██ ██████ |
Kaplan-Meier estimate, median months (95% CI) | ███ █████ █████ | ████ █████ ███ | ███ █████ ███ |
3-month event-free probability, % (95% CI) | ████ ████ █████ | ████ ████ █████ | ████ ████ █████ |
6-month event-free probability, % (95% CI) | ████ ████ █████ | ████ ████ █████ | ████ ████ █████ |
9-month event-free probability, % (95% CI) | ████ ████ █████ | ████ ████ █████ | ████ ████ █████ |
Global health status | |||
Events, n (%) | ██ ███████ | ██ ██████ | ██ ██████ |
Censored, n (%) | ██ ███████ | ██ ██████ | ██ ██████ |
Kaplan-Meier estimate, median months (95% CI) | ███ █████ ████ | ███ █████ ████ | ███ █████ ███ |
3-month event-free probability, % (95% CI) | ████ ████ █████ | ████ ████ █████ | ████ ████ █████ |
6-month event-free probability, % (95% CI) | ████ ████ █████ | ████ ██████████ | ████ ████ █████ |
9-month event-free probability, % (95% CI) | ████ ████ █████ | ████ ████ █████ | ████ ████ █████ |
Physical functioning | |||
Events, n (%) | ██ ██████ | ██ ██████ | ██ ██████ |
Censored, n (%) | ██ ██████ | ██ ██████ | ██ ██████ |
Kaplan-Meier estimate, median months (95% CI) | ███ █████ ████ | ███ █████ ███ | ███ █████ ███ |
3-month event-free probability, % (95% CI) | ████ ████ █████ | ████ ████ █████ | ████ ████ █████ |
6-month event-free probability, % (95% CI) | ████ ████ █████ | ████ ████ █████ | ████ ████ █████ |
9-month event-free probability, % (95% CI) | ████ ████ █████ | ████ ████ █████ | ████ ████ █████ |
EORTC QLQ-C30 = European Organisation for Research and Treatment of Cancer Quality of Life Questionnaire Core 30; NE = not evaluable; q.2.w. = every 2 weeks; RP2D = recommended phase II dose; SC = subcutaneous; SD = standard deviation.
Note: Data presented in this table were based on analyses at clinical cut-off date of January 17, 2023. Improvement was defined as an increase in score that was at least half of SD from baseline values. Worsening was defined as a decrease in score that was at least half of SD from baseline values, where SD was calculated from the scores at baseline.
Source: Sponsor’s submission.15
Appendix 2: Literature-Identified ITC
Please note that this appendix has not been copy-edited.
Additional ITCs were identified via a targeted literature search; these ITCs were not included in the PE model because the comparators are irrelevant to the treatment landscape in Canada. As such, an overview of these is presented here and will not be further discussed.
The sponsor's targeted literature search identified 4 ITCs involving talquetamab from the MonumenTAL-1 trial. These comparisons were made against physician's choice cohorts from CASTOR, POLLUX, EQUULEUS, and APOLLO trials; RWPC from the Flatiron Health database; selinexor-dexamethasone (Sd) from the STORM Part 2 trial; and belantamab mafodotin from the DREAMM-2 trial. Patients in these studies had triple-class exposed r/r MM and had undergone at least 3 prior lines of therapy. The ITCs were unanchored, and common comparator dosing was not applicable. End point definitions adhered to the IMWG criteria, focusing on ORR, CR, VGPR, DOR, PFS, OS, and TTNT.
Objectives from literature-identified nonrandomized studies and matching-adjusted indirect comparisons were to generate comparative efficacy evidence of talquetamab versus physician’s choice (POLLUX, CASTOR, EQUULEUS, APOLLO), RWPC using the Flatiron Health database, selinexor-dexamethasone (STORM Part 2), and belantamab mafodotin (DREAMM-2). The results from the literature-identified comparisons were not used to support the PE model.
The comparator studies varied in design: CASTOR and POLLUX were phase III, randomized, multicentre studies; EQUULEUS was a phase Ib nonrandomized trial; APOLLO was a phase III multicentre randomized study; RWPC data came from the Flatiron Health database; STORM Part 2 was a phase IIb multicentre, open-label, single-arm study; and DREAMM-2 was a phase II multicentre, open-label, two-arm trial. Data cut-offs for these studies ranged from 2017 to 2022. End point definitions and evaluation timings were consistent with IMWG criteria to ensure standardized outcome measures across the studies.
Details of methods and results from these ITCs are limited, mostly available as conference abstracts. Key characteristics like disease severity, treatment history, trial eligibility criteria, dosing of comparators, and definitions of end points were assessed to ensure homogeneity across studies. The data showed consistent definitions and timing of end point evaluations, although some outcomes like ORR, CR, and VGPR were not assessed in all ITCs. The clinical trial settings and recruitment locations varied widely, encompassing a broad range of countries and health care systems.
Pharmacoeconomic Review
Abbreviations
BIA
budget impact analysis
CDA-AMC
Canada’s Drug Agency
cilta-cel
ciltacabtagene autoleucel
CUA
cost-utility analysis
ICER
incremental cost-effectiveness ratio
IMiD
immunomodulatory drug
KCd
carfilzomib-cyclophosphamide-dexamethasone
Kd
carfilzomib-dexamethasone
mAb
monoclonal antibody
MM
multiple myeloma
OS
overall survival
PCd
pomalidomide-cyclophosphamide-dexamethasone
Pd
pomalidomide-dexamethasone
PFS
progression-free survival
PI
proteasome inhibitor
QALY
quality-adjusted life-year
r/r
relapsed or refractory
SVd
selinexor-bortezomib-dexamethasone
TTTD
time to treatment discontinuation
WTP
willingness to pay
Executive Summary
The executive summary comprises 2 tables (Table 1 and Table 2) and a conclusion.
Item | Description |
|---|---|
Drug product | Talquetamab (Talvey), 2 mg/mL or 40 mg/mL, single-dose vials containing 3 mg talquetamab in 1.5 mL solution or 40 mg talquetamab in 1 mL solution for SC injection |
Indication | For the treatment of adult patients with relapsed or refractory multiple myeloma who have received at least 3 prior lines of therapy, including a proteasome inhibitor, an immunomodulatory agent and an anti-CD38 monoclonal antibody, and have demonstrated disease progression on or after the last therapy |
Health Canada approval status | NOC with conditions |
Health Canada review pathway | Standard review |
NOC date | April 30, 2024 |
Reimbursement request | As per indication |
Sponsor | Janssen Inc. |
Submission history | Previously reviewed: No |
NOC = Notice of Compliance.
Table 2: Summary of Economic Evaluation
Component | Description |
|---|---|
Type of economic evaluation | Cost-utility analysis PSM |
Target population | Adult patients with r/r, with ≥ 3 prior lines of therapy including a PI, an IMiD, and an anti-CD38 mAb, and who have experienced disease progression on or after the last therapy. |
Treatment | Talquetamab |
Dose regimen | Weekly dosing schedule: step-up dosing of 0.01 mg/kg on day 1 and 0.06 mg/kg on day 4, followed by the first treatment dose of 0.4 mg/kg on day 7. Subsequent treatment dosage of 0.4 mg/kg once weekly thereafter. Biweekly dosing schedule: step-up dosing of 0.01 mg/kg on day 1, 0.06 mg/kg on day 4, and 0.4 mg/kg on day 7, followed by the first treatment dose of 0.8 mg/kg on day 10. Subsequent treatment dosage of 0.8 mg/kg every 2 weeks thereafter. |
Submitted price | 2 mg/mL: $545.00 per single-use vial 40 mg/mL: $7,300.00 per single-use vial |
Submitted treatment cost | Weekly dosing schedule: $31,154 (cycle 1) and $29,129 (cycle 2 onward) per patient per 28 days. Biweekly dosing schedule: $36,878 (cycle 1) and $27,184 (cycle 2 onward) per patient per 28 days. |
Comparators |
|
Perspective | Canadian publicly funded health care payer |
Outcomes | QALYs, life-years |
Time horizon | Lifetime (30 years) |
Key data sources |
|
Submitted results | Talquetamab, weekly dosing schedule (cohort A):
Talquetamab, biweekly dosing schedule (cohort C):
|
Key limitations |
|
CDA-AMC reanalysis results |
|
CDA-AMC = Canada’s Drug Agency; cilta-cel = ciltacabtagene autoleucel; ICER = incremental cost-effectiveness ratio; IMiD = immunomodulatory drug; KCd = carfilzomib-cyclophosphamide-dexamethasone; Kd = carfilzomib-dexamethasone; mAb = monoclonal antibody; OS = overall survival; PCd = pomalidomide-cyclophosphamide-dexamethasone; Pd = pomalidomide-dexamethasone; PI = proteasome inhibitor; PSM = partitioned survival model; QALY = quality-adjusted life-year; r/r = relapsed or refractory; SVd = selinexor-bortezomib-dexamethasone; vs. = versus; WTP = willingness to pay.
Conclusions
The phase I/II, single-arm, open-label MonumenTAL-1 study provided evidence regarding the efficacy and safety of talquetamab for patients with relapsed or refractory (r/r) who had received at least 3 prior lines of therapy. The pivotal trial was not designed to assess differences in efficacy between the weekly and biweekly dosing schedules. Due to the lack of a comparator group, causal conclusions about time-to-event end points could not be drawn. Using the Grading of Recommendations Assessment, Development and Evaluation approach, the Canada’s Drug Agency (CDA-AMC) Clinical Review assessed the evidence from the MonumenTAL-1 study on the treatment effect of talquetamab versus any comparator as very uncertain. However, the clinical expert noted that based on the natural history of the disease and experience in clinical practice, the overall survival (OS) and progression-free survival (PFS) results observed in the MonumenTAL-1 study appear promising for patients who have not had prior exposure to T-cell redirection therapies, whether treated weekly or biweekly. The CDA-AMC Clinical Review also highlighted several limitations in the sponsor’s comparisons of the MonumenTAL-1 study data with the LocoMMotion and MoMMent studies, as well as with the MajesTEC-1 study and the CARTITUDE-1 study, which hindered the ability to interpret relative treatment effects between talquetamab, physician’s choice, teclistamab, and ciltacabtagene autoleucel (cilta-cel). Despite these limitations, the review concluded that the evidence suggests a potential benefit of talquetamab compared to physician’s choice, though the true magnitude of this benefit remains unclear. Additionally, the review found inconsistent results for talquetamab versus teclistamab, leading to uncertainty about which drug might be preferred. It also suggested that cilta-cel may be more favourable than talquetamab. This clinical uncertainty is reflected in the submitted economic analysis, given that the sponsor extrapolated OS and PFS for the lifetime horizon of the model using parametric distributions fitted to clinical data from these studies.
CDA-AMC conducted base-case reanalyses to assess the cost-effectiveness of talquetamab when used on a weekly dosing schedule and a biweekly dosing schedule. The CDA-AMC base-case reanalyses were derived by adopting the exponential distribution to extrapolate OS for talquetamab. The CDA-AMC base-case results align with those of the sponsor’s submitted analysis, indicating that talquetamab is not cost-effective at a willingness-to-pay (WTP) threshold of $50,000 per quality-adjusted life-year (QALY) gained, relative to physician’s choice. In the CDA-AMC reanalysis of talquetamab on a weekly dosing schedule, talquetamab is associated with an incremental cost-effectiveness ratio (ICER) of $315,994 per QALY gained compared with physician’s choice. Likewise, in the CDA-AMC reanalysis of talquetamab on a biweekly dosing schedule, talquetamab is associated with an ICER of $332,182 per QALY gained compared with physician’s choice. To be considered cost-effective at a WTP threshold of $50,000 per QALY gained relative to physician’s choice, talquetamab would require a price reduction of 92% for the weekly dosing schedule and 86% for the biweekly dosing schedule. With this price reduction, the per-patient 28-day drug acquisition costs for talquetamab would be $1,999 for the first cycle and $1,863 for each subsequent cycle if administered weekly, and $4,059 for the first cycle and $3,120 for each subsequent cycle if administered biweekly. In both reanalyses, talquetamab was less costly and more effective than teclistamab but less costly and less effective than cilta-cel.
CDA-AMC calculated a weighted ICER based on clinical expert input, which indicated that 90% of talquetamab-treated patients would receive biweekly dosing and the remaining 10% would receive weekly dosing. The weighted CDA-AMC base case suggests that talquetamab has an ICER of $330,563 per QALY gained relative to physician’s choice. If the biweekly dosing schedule is preferred in clinical practice, an 87% price reduction would be necessary for talquetamab to be cost-effective compared to physician’s choice at a WTP threshold of $50,000 per QALY gained. In addition, CDA-AMC conducted scenario analyses to evaluate the impact of adopting a biweekly dosing schedule for teclistamab on the cost-effectiveness of talquetamab. In these scenarios, talquetamab was no longer less costly and more effective than teclistamab. Instead, talquetamab was associated with incremental costs and QALYs relative to teclistamab, resulting in an ICER of $262,786 per QALY gained for patients on a weekly dosing schedule and $164,551 per QALY gained for patients on a biweekly dosing schedule.
The CDA-AMC base-case results rely on a substantial and sustained OS benefit favouring talquetamab, projecting that patients treated with talquetamab gain 2 additional life-years compared to those treated with physician’s choice. However, in the absence of robust, long-term, head-to-head clinical evidence, the extent of this survival benefit is highly uncertain. Should the long-term effectiveness of talquetamab be lower than predicted, the ICER would be higher than in the CDA-AMC analyses, requiring larger price reductions to achieve cost-effectiveness. Moreover, a comparison of the duration of follow-up in the MonumenTAL-1 trial to the model’s time horizon (33 months versus 30 years) indicates that most of the QALY and life-year benefit realized by patients treated with talquetamab in the CDA-AMC analyses were accrued in the posttrial period of the model and based on extrapolation. Finally, the sponsor did not consider selinexor-bortezomib-dexamethasone (SVd) as a relevant comparator in the economic analysis; therefore, the cost-effectiveness of talquetamab relative to SVd is unknown.
Input Relevant to the Economic Review
This section is a summary of the feedback received from the patient groups, clinician groups, and drug plans that participated in the CDA-AMC review process.
Patient input was received from Myeloma Canada through a survey of patients (n = 27) and caregivers (n = 5). The majority of respondents were living in Canada (n = 31), and 6 among them had experience with talquetamab. The most important outcomes for patients included delaying disease progression and achieving durable remission, with the ultimate objectives of improving survival; reducing side effects from treatments; preserving independence to minimize the burden on caregivers; and maintaining quality of life. Overall, patients’ disease experience was influenced by the physical symptoms associated with MM (e.g., fatigue and loss of sexual desire) and the psychosocial effects associated with the disease (i.e., anxiety associated with disease progression and the interruption of life goals due to absence from work and/or early retirement). Nineteen patient respondents indicated that they had received 3 prior lines of therapy, 9 respondents indicated having received 4 prior lines of therapy, and 4 respondents indicated having received 5 or more prior lines of therapy. Patients emphasized the need for therapies to control various aspects of multiple myeloma (MM), including pain, fatigue, kidney complications, decreased mobility, gastrointestinal issues, and secondary cancers. Among the patients who had experience with talquetamab, 5 indicated that they were hospitalized during the initial dosing titration period. Hospitalization time ranged between 3 and 10 nights, with the most frequently reported length of stay falling between 9 and 10 nights. While on treatment with talquetamab, patients experienced a range of side effects, including respiratory infections, fungal infections, cytokine release syndrome, and immune effector cell–associated neurotoxicity syndrome. Input from patients currently receiving talquetamab was positive, with several patients indicating that talquetamab was effective in controlling the disease.
Registered clinician input was received from 2 groups: the Canadian Myeloma Research Group and the Ontario Health (Cancer Care Ontario) Hematology Cancer Drug Advisory Committee. The current pathway of care in the fourth-line setting consists of pomalidomide-dexamethasone (Pd), carfilzomib-dexamethasone (Kd), SVd, and palliative care. The clinician input stated that bispecific antibodies such as teclistamab and elranatamab are not currently funded but have been endorsed by CDA-AMC. Similarly, CAR T-cell therapy is not yet publicly funded and is undergoing negotiations. The input stated that bispecific and CAR T-cell therapies are positioned to address the unmet need in patients with triple-class exposed or refractory myeloma; however, talquetamab is a new therapeutic against a novel target that may overcome resistance mechanisms in other therapies such as the newer B-cell maturation antigen–directed treatments. Clinician input suggested that talquetamab would provide an additional option for patients with triple-class exposed disease. Talquetamab is not expected to impact the sequencing of drugs earlier in the disease course or cause a significant change in treatment algorithms before the disease becomes triple-class exposed or refractory, as it is anticipated to be used after the failure of multiple agents. However, talquetamab is expected to shift the current treatment paradigm for patients with advanced disease by providing an additional, more accessible T-cell redirection therapy for disease that is refractory to the most commonly used agents.
Participating drug plans were interested in understanding how talquetamab compared with currently funded options, including SVd. The drug plans inquired whether patients previously treated with B-cell maturation antigen–targeted therapy (e.g., cilta-cel, teclistamab, and elranatamab) should be eligible for talquetamab, and vice versa. The drug plans noted that the pivotal trial was not designed to compare the safety and efficacy of the weekly and biweekly dosing regimens. The drug plans were further interested in clarifying whether patients would be allowed to switch between a weekly and biweekly dosing schedule after treatment initiation. Finally, the drug plans indicated that jurisdictions may encounter capacity issues due to the supportive care recommended within the first 48 hours following talquetamab initial dose administration. The drug plans also highlighted the risk of cytokine release syndrome and immune effector cell–associated neurotoxicity syndrome with treatment and that tocilizumab would need to be incorporated as part of implementation to ensure that sites can manage these adverse events.
Several of these concerns were addressed in the sponsor’s model:
The impact of disease and treatment on a patient’s quality of life was captured with utility values. Adverse events were incorporated as disutilities within the analysis.
For the 2 priming doses and the first treatment dose, hospitalization is required for at least 48 hours from the start of injection. Therefore, the model assumed a 6-day hospital stay in the first model cycle, the cost of which was reflected in the drug administration costs for talquetamab.
CDA-AMC was unable to address the following concerns raised in the input received:
SVd was not included in the analysis as a comparator.
In addition, CDA-AMC addressed some of these concerns as follows:
Given the uncertainty regarding which talquetamab dosing schedule was likely to be preferred in clinical practice, CDA-AMC conducted base-case reanalyses to assess the cost-effectiveness of talquetamab when used on a weekly dosing schedule (cohort A) and a biweekly dosing schedule (cohort C).
Economic Review
Economic Evaluation
Summary of Sponsor’s Economic Evaluation
Overview
The sponsor submitted a cost-utility analysis (CUA) of talquetamab compared with a basket of combination therapies (henceforth referred to as “physician’s choice”), teclistamab, and cilta-cel.1 Aligned with Health Canada’s indicated population, the modelled population comprised adult patients with r/r who have received at least 3 prior lines of therapy, including a proteasome inhibitor (PI), an immunomodulatory drug (IMiD), and an anti-CD38 monoclonal antibody (mAb), and who have experienced disease progression on or after the last therapy.1
Talquetamab is available as a solution for subcutaneous injection in 2 mg/mL and 40 mg/mL vials.2 For the weekly dosing schedule, the recommended step-up dosing is 0.01 mg/kg on day 1 and 0.06 mg/kg on day 4, followed by the first treatment dose of 0.4 mg/kg on day 7. Subsequent treatment dosing is 0.4 mg/kg once weekly thereafter.2 For the biweekly dosing schedule, the recommended step-up dosing is 0.01 mg/kg on day 1, 0.06 mg/kg on day 4, and 0.4 mg/kg on day 7, followed by the first treatment dose of 0.8 mg/kg on day 10. Subsequent treatment dosing is 0.8 mg/kg once biweekly thereafter.2 The submitted price of talquetamab is $545 for a 2 mg/mL vial and $7,300 for a 40 mg/mL vial, which at the recommended dose corresponds to a 28-day cost of $31,154 (cycle 1) and $29,129 (cycle 2 onward) per patient on a weekly dosing schedule.1 For patients receiving talquetamab on a biweekly dosing schedule, the recommended dose corresponds to a 28-day cost of $36,878 (cycle 1) and $27,184 (cycle 2 onward) per patient.1 The sponsor’s estimated drug acquisition costs assume 5.61% and 3.81% dose skipping as per the MonumenTAL-1 trial for weekly and biweekly dosing, respectively.1
Physician’s choice encompassed a mix of therapies commonly used in clinical practice in Canada. Physician’s choice was composed of 24% Kd; 11% carfilzomib-cyclophosphamide-dexamethasone (KCd); 28% Pd; and 38% pomalidomide-cyclophosphamide-dexamethasone (PCd).1 The sponsor estimated the 28-day per-patient drug acquisition costs as follows: Kd (cycle 1: $7,801; cycle 2+: $10,059), KCd (cycle 1: $7,822; cycle 2+: $10,080), PCd (cycle 1: $2,593; cycle 2+: $2,560), and Pd (cycle 1: $2,582; cycle 2+: $2,549). Hence, the weighted 28-day per-patient drug acquisition cost associated with physician’s choice was estimated to be $4,376 (cycle 1) and $5,127 (cycle 2+). Teclistamab drug acquisition costs were estimated as $28,269 (first month on treatment) and $25,526 (month 2 onward) per patient.1 Additionally, the sponsor applied a single cost at the time of cilta-cel infusion ($632,455) to the percentage of patients who received treatment in the CARTITUDE-1 trial weighted with cohort A (91%) and cohort C (92%) of the MonumenTAL-1 trial to derive the 1-time per-patient drug acquisition costs of $575,590 and $581,971 for each cohort, respectively.1 Vial sharing was not incorporated by the sponsor in the submitted base case and was explored in a scenario analysis.
The clinical outcomes modelled were OS, PFS, and time to treatment discontinuation (TTTD). The economic outcomes of interest were QALYs and life-years. The economic evaluation was conducted over a lifetime time horizon (30 years) from the perspective of the public health care payer in Canada. Costs and outcomes were discounted at 1.5% per annum.1
Model Structure
The sponsor submitted a partitioned survival model to capture all costs and outcomes associated with talquetamab and comparators. The model included 3 health states: progression-free, progressed disease, and death. Transitions between health states occurred on a weekly cycle length (Figure 1).1 The proportion of patients in progression-free, progressed disease, and death states was estimated over time based on the OS and PFS curves for each intervention, which were informed by the MonumenTAL-1, MajesTEC-1, LocoMMotion, MoMMent, and CARTITUDE-1 trials.1 The proportion of patients with progressed disease was estimated as the difference between the proportion of living patients (estimated from the OS curve) and the proportion of progression-free patients (estimated from the PFS curve). PFS was defined as the time from randomization to either progression or death due to any cause. Patients began in the progression-free health state, where they were assumed to initiate fourth-line treatment, and over time could progress to either the progressed disease health state or transition to the death state. Consistent with the natural history of r/r, it was assumed that disease progression is irreversible; hence, patients in the progressed disease health state could either remain in this health state or transition to the death state (i.e., patients could not return to the progression-free health state).
Model Inputs
Baseline patient characteristics were derived from the MonumenTAL-1 trial, a phase III, open-label dose escalation trial investigating the efficacy and safety of talquetamab among patients with r/r who have received at least 3 prior lines of therapy, including a PI, an IMiD, and an anti-CD38 mAb, and who have experienced disease progression on or after the last therapy. The relevant trial subgroups were cohort A (n = 143) and cohort C (n = 145),1 which included patients who had no prior exposure to T-cell redirection therapies but who were administered different talquetamab dosing schedules. Cohort A received 0.4 mg/kg of talquetamab on a weekly dosing schedule after step-up dosing, and cohort C received 0.8 mg/kg of talquetamab on a biweekly dosing schedule after step-up dosing. Patient characteristics derived from the enrolled patient population of cohort A and cohort C of the MonumenTAL-1 trial were used to inform the drug dosage regimens and the age-specific and gender-specific distribution of the general population mortality risk.
Clinical efficacy parameters used to characterize talquetamab, physicians’ choice, teclistamab, and cilta-cel (including OS, PFS, and TTTD) were derived from various data sources.3 Inputs for talquetamab were based on the MonumenTAL-1 trial (data cut-off: January 17, 2023; median follow-up: 19 months [cohort A] and 13 months [cohort C]). Data from the prospective noninterventional LocoMMotion study (data cut-off: October 2022; median follow-up: 26 months) and MoMMent study (data cut-off: March 2023; median follow-up: 9 months) were used to derive inputs for physician’s choice. Inputs for teclistamab were informed by the MajesTEC-1 trial (data cut-off: January 2023; median follow-up: 23 months), while inputs for cilta-cel were informed by the CARTITUDE-1 trial (data cut-off: January 2022; median follow-up: 29 months). The sponsor submitted indirect treatment comparisons assessing the comparative efficacy of talquetamab relative to physician’s choice, teclistamab, and cilta-cel in patients with triple-class exposed r/r who have experienced disease progression on the last therapy. Patients from the LocoMMotion, MoMMent, MajesTEC-1, and CARTITUDE-1 studies were weighted to be comparable with the MonumenTAL-1 study’s enrolled trial population using inverse probability of treatment weighting. Separate indirect treatment comparisons were conducted for each comparator, leveraging individual patient-level data from cohort A and cohort C of the MonumenTAL-1 trial.3 Parametric survival modelling was used to extrapolate OS, PFS, and TTTD beyond the time points available in the studies. Distributions were selected based on the clinical plausibility of long-term survival projections, visual inspection of the model fit, and the Akaike and Bayesian information criteria.
The sponsor extrapolated the clinical efficacy parameters for patients treated with talquetamab using standard parametric models that were independently fit to the MonumenTAL-1 study Kaplan-Meier data. In cohort A, an exponential distribution was selected to extrapolate PFS and a gamma distribution was used to extrapolate OS. Similarly, in cohort C, a Weibull distribution was selected to extrapolate PFS and a gamma distribution was applied to OS. For physician’s choice, a log-normal distribution was selected to extrapolate OS and PFS. For cilta-cel, an exponential distribution was selected to extrapolate OS and PFS. For teclistamab, the sponsor modelled clinical efficacy as the weighted sum of 2 subgroups, defined according to response status at the 8-week mark (i.e., a response-based approach). Hence, patients were stratified by disease response into subgroups based on progression or death hazard. All patients who died or experienced disease progression at or before week 8 were categorized into the progressive disease or death subgroup, and the remaining patients (including those not evaluable) were placed in the PR, stable disease [SD], and NE subgroup of patients who achieved a partial response (PR) or better, had SD, or had disease not evaluable (NE). The sponsor selected a Weibull distribution to extrapolate PFS and OS in the PR, SD, and NE subgroup of patients who achieved a PR or better, had SD, or had disease NE and a log-normal distribution to extrapolate OS in the progressive disease or death subgroup. In the progressive disease or death subgroup, PFS was modelled using the observed Kaplan-Meier data from the MajesTEC-1 study, as no extrapolation was required. For patients treated with talquetamab, TTTD was modelled using an exponential distribution in cohort A and a Weibull distribution in cohort C. For the TTTD extrapolation of comparator therapies, a log-normal distribution was selected for patients treated with physician’s choice, a Weibull distribution was selected for the PR, SD, NE subgroup of patients who achieved a PR or better, had SD, or had disease NE and were treated with teclistamab, and Kaplan-Meier data were selected for patients in the progressive disease or death subgroup.
Health state–specific utility values were derived from an analysis of EQ-5D-5L index data collected from patients in the MonumenTAL-1 trial, with UK-specific utility weights. The model used utility values mapped from the fifth-line scores onto the third-line value set using a published algorithm. Utility values for the preprogression and postprogression health states were estimated separately for cohort A and cohort C (Table 15). Although utility values were otherwise treatment independent, the sponsor applied an off-treatment utility increment to patients in the progression-free health state who had received CAR T-cell infusion; the utility increment was estimated based on the CARTITUDE-1 study. The submitted model included a scenario analysis that adopted time-dependent utilities, which were estimated at each 28-day treatment cycle to reflect data from the MonumenTAL-1 study and were applied to all patients in the progression-free health state (irrespective of treatment). Disutilities related to adverse events observed in the MonumenTAL-1 study were sourced from published literature, and their respective durations for each cohort were based on pivotal trial data.
Costs captured in the model included primary and subsequent treatment costs (including drug acquisition and drug administration), co-medication acquisition and administration costs, routine follow-up care costs, adverse event management costs, and terminal care costs. Drug acquisition costs for talquetamab were based on the sponsor’s submitted price. The dosing modelled for talquetamab was aligned with that described in the overview section (weekly or biweekly), and dose skipping observed in the trial was included for cohort A (5.61%) and cohort C (3.81%). Drug acquisition costs for physician’s choice therapies were sourced from the Ontario Drug Formulary and CADTH published reviews, with dosing schedules based on the therapies’ corresponding clinical trials. Dosing for teclistamab was assumed to follow a weekly schedule, and dose skipping as observed in the MajesTEC-1 study was included (7.2%). Costs of cilta-cel included a 1-time per-patient cost associated with the CAR T-cell procedure, in addition to costs associated with re-treatment, premedication, bridging therapy, administration, and monitoring. Routine follow-up care and monitoring costs were assumed to vary by health state and treatment received. These costs included hematologist visits, complete blood counts, biochemistry, quantitative immunoglobulin, serum protein electrophoresis, renal function tests, vital signs, and serum calcium corrected for albumin. Costs associated with adverse events included management of anemia, fatigue, cytokine release syndrome, diarrhea, febrile neutropenia, hyperglycemia, hypertension, viral infections, leukopenia, pneumonia, pyrexia, sepsis, and thrombocytopenia. Follow-up, monitoring, and adverse event costs were sourced from the Ontario Schedule of Benefits, the Ontario Case Costing Initiative, the Ontario Schedule of Benefits for Laboratory Services, and published literature.1,4-6 Costs of subsequent treatment were applied as a one-off cost upon disease progression to patients reported to receive subsequent treatment based on each comparator’s respective trial. All patients who transitioned to death were assumed to incur terminal care costs in the last cycle before death.
Summary of Sponsor’s Economic Evaluation Results
All analyses were run probabilistically (5,000 iterations for the base case). The deterministic and probabilistic results were similar. The probabilistic findings are presented in this section.
Base-Case Results
The use of talquetamab on a weekly dosing schedule (cohort A) was associated with an incremental cost of $435,026 and an incremental QALY gain of 1.40 compared with physician’s choice, resulting in an ICER of $310,522 per QALY gained. Compared with teclistamab, talquetamab was less costly and more effective (incremental costs: –$63,768; incremental QALYs: 0.34). Compared with cilta-cel, talquetamab was less costly and less effective (incremental costs = –$194,997; incremental QALYs = –1.09).
The use of talquetamab on a biweekly dosing schedule (cohort C) was associated with an incremental cost of $455,704 and an incremental QALY gain of 1.81 compared with physician’s choice, resulting in an ICER of $252,339 per QALY gained. Compared with teclistamab, talquetamab was less costly and more effective (incremental costs: –$11,320; incremental QALYs: 1.17). Compared with cilta-cel, talquetamab was less costly and less effective (incremental costs: –$163,322; incremental QALYs = –0.25).
The sponsor’s analysis predicted that the use of talquetamab on a weekly dosing schedule (cohort A) was associated with a longer duration of life than physician’s choice or teclistamab and with a shorter duration of life than cilta-cel (i.e., incremental life-years: 2.05, 0.50, and –1.32, respectively). Given the duration of follow-up for cohort A in the MonumenTAL-1 trial (i.e., median follow-up: 19 months; maximum follow-up: 33 months) in contrast to the model’s lifetime horizon (i.e., 30 years), 46% of the incremental QALYs experienced by patients receiving talquetamab on a weekly dosing schedule relative to physician’s choice were derived from the period beyond which there is observed trial data (i.e., the extrapolated period).
The sponsor’s analysis predicted that the use of talquetamab on a biweekly dosing schedule (cohort C) was associated with a longer duration of life than physician’s choice or teclistamab and with a shorter duration of life than cilta-cel (i.e., incremental life-years: 2.66, 1.71, and –0.11, respectively). Given the duration of follow-up for cohort C in the MonumenTAL-1 trial (i.e., median follow-up: 13 months; maximum follow-up: 26 months) in contrast to the model’s lifetime horizon (i.e., 30 years), the majority (62%) of the incremental QALYs experienced by patients receiving talquetamab on a biweekly dosing schedule relative to physician’s choice were derived from the period beyond which there is observed trial data (i.e., the extrapolated period).
The probability that talquetamab was cost-effective at a $50,000 per QALY gained WTP threshold was 0% for both the weekly and biweekly dosing schedules. The sponsor’s submitted analysis is based on the publicly available prices for all drug treatments. Additional results from the sponsor’s submitted economic evaluation base case are presented in Appendix 3.
Table 3: Summary of the Sponsor’s Economic Evaluation Results (Cohort A — Weekly Dosing)
Drug | Total costs ($) | Incremental costs ($) | Total QALYs | Incremental QALYs | ICER ($/QALY) |
|---|---|---|---|---|---|
Talquetamab vs. physician’s choice | |||||
Physician’s choice | 121,859 | Reference | 1.06 | Reference | Reference |
Talquetamab | 556,885 | 435,026 | 2.47 | 1.40 | 310,522 |
Talquetamab vs. teclistamab | |||||
Teclistamab | 620,653 | Reference | 2.12 | Reference | Reference |
Talquetamab | 556,885 | –63,768 | 2.47 | 0.34 | Dominant |
Talquetamab vs. cilta-cel | |||||
Cilta-cel | 751,882 | Reference | 3.55 | Reference | Reference |
Talquetamab | 556,885 | –194,997 | 2.47 | –1.09 | Less costly and less effective. ICER for cilta-cel vs. talquetamab is $178,896.a |
Cilta-cel = ciltacabtagene autoleucel; ICER = incremental cost-effectiveness ratio; QALY = quality-adjusted life-year; vs. = versus.
Note: The submitted analyses are based on the publicly available prices of comparator treatments.
aThis represents the ICER if cilta-cel were funded as a replacement for talquetamab. Cilta-cel costs an additional $194,997 but generates an additional 1.09 QALYs relative to talquetamab, resulting in an ICER of $178,896 per QALY gained.
Source: Sponsor’s pharmacoeconomic submission.1
Table 4: Summary of the Sponsor’s Economic Evaluation Results (Cohort C — Biweekly Dosing)
Drug | Total costs ($) | Incremental costs ($) | Total QALYs | Incremental QALYs | ICER ($/QALY) |
|---|---|---|---|---|---|
Talquetamab vs. physician’s choice | |||||
Physician’s choice | 126,271 | Reference | 1.28 | Reference | Reference |
Talquetamab | 581,975 | 455,704 | 3.08 | 1.81 | 252,339 |
Talquetamab vs. teclistamab | |||||
Teclistamab | 593,294 | Reference | 1.92 | Reference | Reference |
Talquetamab | 581,975 | –11,320 | 3.08 | 1.17 | Dominant |
Talquetamab vs. cilta-cel | |||||
Cilta-cel | 745,297 | Reference | 3.33 | Reference | Reference |
Talquetamab | 581,975 | –163,322 | 3.08 | –0.25 | Less costly and less effective. ICER for cilta-cel vs. talquetamab is $662,930.a |
Cilta-cel = ciltacabtagene autoleucel; ICER = incremental cost-effectiveness ratio; QALY = quality-adjusted life-year; vs. = versus.
Note: The submitted analyses are based on the publicly available prices of comparator treatments.
aThis represents the ICER if cilta-cel were funded as a replacement for talquetamab. Cilta-cel costs an additional $163,322 but generates an additional 0.25 QALYs relative to talquetamab, resulting in an ICER of $662,930 per QALY gained.
Source: Sponsor’s pharmacoeconomic submission.1
Sensitivity and Scenario Analysis Results
The sponsor assessed several model parameters and assumptions in deterministic scenario analyses using cohort C, including the following: teclistamab dose switching from weekly to biweekly dosing; no drug wastage; alternative time horizons; time-dependent utility values, alternative postprogression utility values; alternative treatment mix composing physician’s choice; combining the overall MonumenTAL-1 study population (both weekly and biweekly dosing); and various alternative PFS, OS, and TTTD extrapolations for all comparators. Relative to physician’s choice, the ICER for talquetamab was most sensitive to the adoption of a 3% discounting rate and the selection of an exponential distribution to extrapolate OS for talquetamab, resulting in ICERs of $274,789 and $332,679, respectively. Talquetamab consistently remained less costly and less effective than cilta-cel across all scenarios. Talquetamab dominated teclistamab in all cases except for scenarios assuming biweekly dosing for patients treated with teclistamab and no drug wastage, resulting in ICERs of $107,773 and $19,529, respectively.
The sponsor conducted a scenario analysis from a societal perspective. This analysis included additional costs associated with travel time and lost productivity. In this analysis, relative to physician’s choice, the ICER for talquetamab was $263,843 per QALY gained. This was similar to the sponsor’s base-case analysis using a health care payer perspective.
CDA-AMC Appraisal of the Sponsor’s Economic Evaluation
CDA-AMC identified several key limitations to the sponsor’s analysis that have notable implications for the economic analysis:
The long-term comparative efficacy of talquetamab on OS is uncertain. The sponsor derived clinical efficacy data for patients receiving physician’s choice from the LocoMMotion and MoMMent studies, which are prospective noninterventional and observational studies of real-world treatments administered among patients with r/r. Individual patient-level data from the LocoMMotion and MoMMent studies were weighted to be comparable with the enrolled population of the MonumenTAL-1 trial across baseline covariates using inverse probability of treatment weighting. These data were then used to estimate OS for physician’s choice. However, in the absence of randomized evidence, uncertainty remains regarding the differences in OS between talquetamab and current treatment options. The sponsor extrapolated OS data for patients receiving physician’s choice from the LocoMMotion and MoMMent studies using a log-normal distribution and extrapolated OS data for patients receiving talquetamab from the MonumenTAL-1 study using a gamma distribution. The clinical expert consulted by CDA-AMC noted that the sponsor’s extrapolation of OS for talquetamab, which predicted that 5% of patients would be alive at the 15-year mark, lacked face validity. The clinical expert suggested it was more reasonable to expect that 2% of patients or less may survive 15 years posttreatment initiation in the fourth-line setting. The expert also highlighted the high uncertainty of survival beyond the 5-year mark due to the lack of robust data.
CDA-AMC selected an exponential distribution to extrapolate long-term OS for talquetamab in cohort A and cohort C, which resulted in more clinically plausible survival projections.
The generalizability of the modelled population to clinical practice in Canada is unclear. CDA-AMC notes that there is uncertainty regarding the expected survival benefit in a setting in Canada following the implementation of talquetamab in a population that expands beyond the selective patient population recruited within the clinical trial. The clinical data used to populate the submitted economic model was restricted to patients from cohort A and cohort C of the MonumenTAL-1 trial, which only included patients who had not had prior exposure to T-cell redirection therapies such as CAR T-cell or bispecific antibodies. Cohort B from the MonumenTAL-1 trial included patients who had previously received T-cell redirection therapies but had a small sample size. According to the CDA-AMC Clinical Review, the evidence submitted to CDA-AMC did not include indirect comparative evidence between talquetamab and any comparator for patients who had prior exposure to T-cell redirection therapies, which represents a gap in the available evidence. If talquetamab were to become available in clinical practice, where patients are likely to have more diverse clinical and demographic profiles, the magnitude of the clinical benefit is uncertain.
CDA-AMC was unable to address this limitation owing to the lack of clinical data.
The modelling approach may overestimate comparative efficacy. Results from the sponsor’s model suggested that talquetamab was associated with longer survival after progression. The sponsor’s base case predicted that talquetamab extended life-years gained in the progression-free state (0.57 years) as well as in the progressed disease state (1.48 years) relative to physician’s choice in cohort A, indicating that treatment with talquetamab is associated with reductions in the rate of postprogression mortality. Similarly, in cohort C, talquetamab extended life-years gained in the progression-free state (1.31 years) and the progressed disease state (1.34 years) relative to physician’s choice. Specifically, the sponsor’s modelling approach predicts that 73% and 50% of the incremental survival attributed to talquetamab relative to physician’s choice in cohort A and C, respectively, is due to a benefit that begins after the treatment has stopped controlling the disease (i.e., the postprogression period). As the postprogression mortality transition is not modelled directly in the partitioned survival model approach, it is not possible to establish whether this effect is supported by the trial data or is an artifact of the modelling choice. Moreover, the analysis submitted by the sponsor is subject to a high degree of uncertainty given that a substantial proportion of the clinical benefit realized by patients treated with talquetamab is derived from the period beyond which there is observed trial data (46% in cohort A; 62% in cohort C).
CDA-AMC was unable to determine the extent to which the implied postprogression benefit was due to the effect of treatment or due to structural bias within the partitioned survival model and could not address this in reanalysis.
The dosing schedule for talquetamab in clinical practice is uncertain. Based on the product monograph, talquetamab may be administered on a weekly (0.4 mg/kg) or biweekly (0.8 mg/kg) dosing schedule, which corresponds to the dosing schedule followed by patients in cohort A and cohort C, respectively, from the MonumenTAL-1 study. However, the pivotal trial was not designed to assess differences in efficacy between dosing schedules. According to the clinical expert consulted by CDA-AMC, the biweekly dosing schedule is more likely to be preferred in clinical practice. Less frequent dosing would result in benefits due to reduced health care resource utilization and improved availability of chair time resources. It would also confer quality of life benefits to patients due to less frequent subcutaneous injections being required for treatment. Lastly, the clinical expert consulted by CDA-AMC noted that although the biweekly dosing schedule may seem more effective, further research is required to confirm this.
Given the uncertainty regarding which talquetamab dosing schedule is likely to be preferred in clinical practice, CDA-AMC conducted base-case reanalyses to assess the cost-effectiveness of talquetamab when used on a weekly dosing schedule (cohort A) and a biweekly dosing schedule (cohort C).
CDA-AMC estimated a weighted base case assuming that 90% of patients treated with talquetamab would receive biweekly dosing and the remaining 10% would receive weekly dosing, aligned with clinical expert feedback obtained by CDA-AMC.
The dosing schedule for teclistamab in clinical practice is uncertain. The sponsor for teclistamab indicated an intention to submit its product to Health Canada specifying a biweekly dosing schedule.7 The drug plans were interested in clarifying whether patients may be allowed to switch from a weekly to a biweekly dosing schedule, as observed in the MajesTEC-1 trial. Furthermore, input from the clinician expert indicated that patients treated with teclistamab in Canada are likely to switch to biweekly dosing under specific response and safety profiles (i.e., due to side effects, toxicity, or patient choice). Biweekly dosing has important implications for the total drug acquisition costs of teclistamab, as well as reduced health care resource use related to treatment administration.
CDA-AMC explored a scenario that assumed a biweekly dosing schedule for teclistamab.
The selection of all relevant comparators is not supported by current clinical practice. The sponsor omitted the SVd regimen from the economic analysis. During the review process, the participating drug plans and clinical experts consulted by CDA-AMC indicated that the SVd regimen is prescribed in Canada for the treatment of adult patients with triple-class exposed r/r who have experienced disease progression on or after the last therapy. The sponsor indicated that it was infeasible to derive a reliable indirect treatment comparison between talquetamab and SVd given that the breakdown of patient populations between the MonumenTAL-1 and BOSTON trials by line of therapy is substantially different and the overlapping population by line of therapy between the trials is negligible. The cost-effectiveness of talquetamab versus SVd is, therefore, unknown.
CDA-AMC could not address this limitation owing to the lack of comparative effectiveness data.
The proportion of patients receiving subsequent treatment and the duration of subsequent treatment is uncertain. Subsequent treatment, consisting of a basket of physician’s choice treatments, was modelled as a one-off cost once patients enter the postprogression health state. The efficacy of subsequent treatment was assumed to be captured within the extrapolated OS and PFS data in the economic model, as previously described. For talquetamab, physician’s choice, and teclistamab, each treatment’s respective trial data were used to estimate the proportion of patients receiving subsequent treatment. This was done by estimating the proportion of patients who had a record of a treatment line that started at or after PFS progression out of the total number of patients who progressed. Hence, the proportion of patients receiving subsequent treatment was estimated as follows: the MonumenTAL-1 study (85.4% in cohort A; 76.8% in cohort C); the MajesTEC-1 study (65.8%); and the LocoMMotion and MoMMent studies (76.8%). The sponsor also derived the expected time on subsequent treatment by estimating transition probabilities between being on and off subsequent treatment and death. The clinical expert consulted by CDA-AMC indicated that the proportion of patients receiving subsequent therapy and the duration of subsequent treatment both appeared to be overestimated. Data from Canada indicate that most patients who experience progression will receive a subsequent line of treatment.8 The primary reason for attrition through treatment lines is death before progression (which the sponsor had already accounted for), although this data only extends to 3 lines of therapy. In the absence of robust head-to-head data, the impact that talquetamab may have on the use of subsequent lines of therapy remains uncertain.
CDA-AMC notes that varying assumptions about subsequent therapy parameters do not affect the estimated cost-effectiveness of talquetamab. Additionally, should patients who are treated with talquetamab remain progression-free longer than those receiving physician’s choice, fewer patients may need subsequent therapy. While this could lead to potential cost savings in subsequent therapy, the extent of these savings remains uncertain.
Additionally, the following key assumptions were made by the sponsor and have been appraised by CDA-AMC (refer to Table 5).
Table 5: Key Assumptions of the Submitted Economic Evaluation
Sponsor’s key assumption | CDA-AMC comment |
|---|---|
In the submitted model, the sponsor assumed that 5.61% and 3.81% of doses in cohorts A and C, respectively, would be skipped in alignment with the dose skipping proportion observed in the MonumenTAL-1 trial. The proportion of doses skipped is assumed to be equivalent for talquetamab, physician’s choice of treatment, bridging therapy (for CAR T-cell treatment), and subsequent treatments. Dose skipping for teclistamab was assumed to be 7.17%, as observed in the MajesTEC-1 trial. | Acceptable. CDA-AMC notes that it is uncertain whether the trial-based proportion of doses skipped may reflect real-world clinical practice as the doses received by patients may be different from the planned dosing schedule for several reasons (i.e., expected vs. observed doses). The assumption that the dose skipping proportion observed for talquetamab could be applied to patients receiving treatments with varying administration routes is highly uncertain. CDA-AMC notes that the majority of physician’s choice therapies for which a dose skipping assumption was made have an oral route of administration (e.g., dexamethasone, cyclophosphamide, pomalidomide). For oral therapies, pharmacies in Canada are likely to fill and dispense prescriptions in full. Therefore, it is unlikely that any unused tablets would result in lower prescription costs as it is improbable that they would be recuperated. CDA-AMC notes that applying talquetamab’s dose skipping proportion across comparators (e.g., physician’s choice, bridging therapy, and subsequent treatments) resulted in conservative cost estimates for comparators. |
The sponsor accounted for 100% drug wastage in drug costs (i.e., no vial sharing). | Acceptable. While options to minimize wastage exist in real-world clinical settings, talquetamab is classified as a single-dose vial and is therefore presented in the base case including wastage. |
Grade 1 to 2 CRS events were assumed to include costs of tocilizumab plus a 5-day inpatient hospital stay. Grade 3+ CRS events were assumed to include costs of tocilizumab plus a 2-day ICU stay and a 10.5-day inpatient hospital stay. | Uncertain. Clinical experts consulted by CDA-AMC noted that grade 1 CRS events should be resolved with an outpatient visit and not require hospital stays or tocilizumab. Grade 2 and 3+ CRS events appeared to be characterized appropriately. CDA-AMC notes that the sponsor’s assumption resulted in slightly higher AE management costs but did not impact the cost-effectiveness results. |
AE = adverse event; CDA-AMC = Canada’s Drug Agency; CRS = cytokine release syndrome; ICU = intensive care unit; vs. = versus.
CDA-AMC Reanalyses of the Economic Evaluation
Base-Case Results
The CDA-AMC base case was based on clinical expert input. CDA-AMC conducted base-case reanalyses to assess the cost-effectiveness of talquetamab when used on a weekly dosing schedule (cohort A) and a biweekly dosing schedule (cohort C). The CDA-AMC base-case reanalyses were derived by adopting the exponential distribution to extrapolate OS for talquetamab.
Table 6: CDA-AMC Revisions to the Submitted Economic Evaluation
Stepped analysis | Sponsor’s value or assumption | CDA-AMC value or assumption |
|---|---|---|
Change to derive the CDA-AMC base case | ||
1. OS extrapolation for talquetamab | Cohort A: gamma distribution Cohort C: gamma distribution | Cohort A: exponential distribution Cohort C: exponential distribution |
CDA-AMC base case | ― | Reanalysis 1 |
CDA-AMC = Canada’s Drug Agency; OS = overall survival.
The CDA-AMC reanalysis of cohort A estimated that the use of talquetamab on a weekly dosing schedule was associated with an incremental cost of $435,516 and an incremental QALY gain of 1.38 compared with physician’s choice, resulting in an ICER of $315,994 per QALY gained. Compared with teclistamab, talquetamab was less costly and more effective (incremental costs: –$62,790; incremental QALYs: 0.32). Compared with cilta-cel, talquetamab was less costly and less effective (incremental costs = –$194,940; incremental QALYs = –1.12).
The CDA-AMC reanalysis of cohort C estimated that the use of talquetamab on a biweekly dosing schedule was associated with an incremental cost of $452,471 and an incremental QALY gain of 1.36 compared with physician’s choice, resulting in an ICER of $332,182 per QALY gained. Compared with teclistamab, talquetamab was less costly and more effective (incremental costs: –$15,002; incremental QALYs: 0.72). Compared with cilta-cel, talquetamab was less costly and less effective (incremental costs: –$166,443; incremental QALYs = –0.70).
The CDA-AMC reanalysis of cohort A predicted that the use of talquetamab on a weekly dosing schedule was associated with a longer duration of life than physician’s choice and teclistamab, as well as a shorter duration of life than cilta-cel (i.e., incremental life-years: 2.01, 0.47, and –1.37, respectively). Given the duration of follow-up for cohort A in the MonumenTAL-1 trial (i.e., median follow-up: 19 months; maximum follow-up: 33 months) in contrast to the model’s lifetime horizon (i.e., 30 years), a substantial proportion of incremental QALYs experienced by patients receiving talquetamab weekly relative to physician’s choice (46%) was derived through extrapolation.
The CDA-AMC reanalysis of cohort C predicted that the use of talquetamab on a biweekly dosing schedule was associated with a longer duration of life than physician’s choice and teclistamab, as well as a shorter duration of life than cilta-cel (i.e., incremental life-years: 2.00, 1.04, and –0.77, respectively). Given the duration of follow-up for cohort C in the MonumenTAL-1 trial (i.e., median follow-up: 13 months; maximum follow-up: 26 months) in contrast to the model’s lifetime horizon (i.e., 30 years), the majority of the incremental QALYs experienced by patients receiving talquetamab biweekly relative to physician’s choice (57%) was derived through extrapolation.
The probability that talquetamab was cost-effective relative to physician’s choice at a WTP threshold of $50,000 per QALY gained was 0% in CDA-AMC reanalyses of both cohort A (weekly dosing schedule) and cohort C (biweekly dosing schedule).
Table 7: Summary of the Stepped Analysis of the Pairwise CDA-AMC Reanalysis Results (Cohort A — Weekly Dosing)
Stepped analysis | Drug | Total costs ($) | Total QALYs | ICER for talquetamab vs. comparatora ($/QALY) |
|---|---|---|---|---|
Sponsor’s base case (Deterministic) | Physician’s choice | 121,894 | 1.06 | 314,511 vs. talquetamab |
Talquetamab | 555,728 | 2.44 | Reference | |
Teclistamab | 613,676 | 2.08 | Talquetamab is dominant | |
Cilta-cel | 752,632 | 3.52 | Talquetamab is less costly and less effective | |
CDA-AMC reanalysis 1: OS extrapolation | Physician’s choice | 121,894 | 1.06 | 317,132 vs. talquetamab |
Talquetamab | 555,664 | 2.42 | Reference | |
Teclistamab | 613,676 | 2.08 | Talquetamab is dominant | |
Cilta-cel | 752,632 | 3.52 | Talquetamab is less costly and less effective | |
CDA-AMC base case (Deterministic) | Physician’s choice | 121,894 | 1.06 | 317,132 vs. talquetamab |
Talquetamab | 555,664 | 2.42 | Reference | |
Teclistamab | 613,676 | 2.08 | Talquetamab is dominant | |
Cilta-cel | 752,632 | 3.52 | Talquetamab is less costly and less effective | |
CDA-AMC base case (probabilistic) | Physician’s choice | 121,845 | 1.07 | 315,994 vs. talquetamab |
Talquetamab | 557,361 | 2.45 | Reference | |
Teclistamab | 620,151 | 2.13 | Talquetamab is dominant | |
Cilta-cel | 752,302 | 3.56 | Talquetamab is less costly and less effective. ICER for cilta-cel vs. talquetamab: $174,258 per QALY gained.b |
CDA-AMC = Canada’s Drug Agency; cilta-cel = ciltacabtagene autoleucel; ICER = incremental cost-effectiveness ratio; OS = overall survival; QALY = quality-adjusted life-year; vs. = versus.
Note: The CDA-AMC reanalysis is based on publicly available prices of the comparator treatments. The results of all steps are presented deterministically unless otherwise indicated; the cumulative CDA-AMC base case is always presented both deterministically and probabilistically.
aResults are not presented sequentially due to heterogeneity between comparator trials. ICERs reflect pairwise comparisons between talquetamab and each comparator. For instance, the sponsor’s submitted ICER for talquetamab versus physician’s choice is $314,511 per QALY gained.
bThis represents the ICER if cilta-cel were funded as a replacement for talquetamab. Cilta-cel costs an additional $194,940 but generates an additional 1.12 QALYs.
Table 8: Summary of the Stepped Analysis of the Pairwise CDA-AMC Reanalysis Results (Cohort C — Biweekly Dosing)
Stepped analysis | Drug | Total costs ($) | Total QALYs | ICER for talquetamab vs. comparatora ($/QALY) |
|---|---|---|---|---|
Sponsor’s base case (Deterministic) | Physician’s choice | 126,271 | 1.27 | 258,131 vs. talquetamab |
Talquetamab | 578,274 | 3.02 | Reference | |
Teclistamab | 586,622 | 1.87 | Talquetamab is dominant | |
Cilta-cel | 745,716 | 3.30 | Talquetamab is less costly and less effective | |
CDA-AMC reanalysis 1: OS extrapolation | Physician’s choice | 126,271 | 1.27 | 332,679 vs. talquetamab |
Talquetamab | 573,954 | 2.61 | Reference | |
Teclistamab | 586,622 | 1.87 | Talquetamab is dominant | |
Cilta-cel | 745,716 | 3.30 | Talquetamab is less costly and less effective | |
CDA-AMC base case (Deterministic) | Physician’s choice | 126,271 | 1.27 | 332,679 vs. talquetamab |
Talquetamab | 573,954 | 2.61 | Reference | |
Teclistamab | 586,622 | 1.87 | Talquetamab is dominant | |
Cilta-cel | 745,716 | 3.30 | Talquetamab is less costly and less effective | |
CDA-AMC base case (probabilistic) | Physician’s choice | 126,237 | 1.28 | 332,182 vs. talquetamab |
Talquetamab | 578,708 | 2.64 | Reference | |
Teclistamab | 593,709 | 1.93 | Talquetamab is dominant | |
Cilta-cel | 745,151 | 3.34 | Talquetamab is less costly and less effective. ICER for cilta-cel vs. talquetamab: $238,602 per QALY gained.b |
CDA-AMC = Canada’s Drug Agency; cilta-cel = ciltacabtagene autoleucel; ICER = incremental cost-effectiveness ratio; OS = overall survival; QALY = quality-adjusted life-year; vs. = versus.
Note: The CDA-AMC reanalysis is based on publicly available prices of the comparator treatments. The results of all steps are presented deterministically unless otherwise indicated; the cumulative CDA-AMC base case is always presented both deterministically and probabilistically.
aResults are not presented sequentially due to heterogeneity between comparator trials. ICERs reflect pairwise comparisons between talquetamab and each comparator. For instance, the sponsor’s submitted ICER for talquetamab versus physician’s choice is $258,131 per QALY gained.
bThis represents the ICER if cilta-cel were funded as a replacement for talquetamab. Cilta-cel costs an additional $166,443 but generates an additional 0.70 QALYs.
Scenario Analysis Results
CDA-AMC undertook price reduction analyses based on the sponsor’s results and the CDA-AMC base case.
The CDA-AMC reanalysis of cohort A suggests that talquetamab would require a price reduction of 92% for the weekly dosing schedule to be considered cost-effective at a WTP threshold of $50,000 per QALY gained relative to physician’s choice. With this price reduction, the per-patient 28-day drug acquisition costs for talquetamab (administered weekly) would be $1,999 for the first cycle and $1,863 for each subsequent cycle.
The CDA-AMC reanalysis of cohort C suggests that talquetamab would require a price reduction of 86% for the biweekly dosing schedule to be considered cost-effective at a WTP threshold of $50,000 per QALY gained relative to physician’s choice. With this price reduction, the per-patient 28-day drug acquisition costs for talquetamab (administered biweekly) would be $4,059 for the first cycle and $3,120 for each subsequent cycle.
Table 9: CDA-AMC Price Reduction Analyses (Cohort A — Weekly Dosing)
Price reduction | Unit drug cost ($) | ICERs for talquetamab vs. physician’s choice ($/QALY) | ||
|---|---|---|---|---|
2 mg | 40 mg | Sponsor’s base case | CDA-AMC reanalysis | |
No price reduction | 545 | 7,300 | 310,522 | 315,994 |
10% | 491 | 6,570 | 279,493 | 286,641 |
20% | 436 | 5,840 | 251,159 | 257,691 |
30% | 382 | 5,110 | 222,825 | 228,741 |
40% | 327 | 4,380 | 194,491 | 199,791 |
50% | 273 | 3,650 | 166,157 | 170,840 |
60% | 218 | 2,920 | 137,823 | 141,890 |
70% | 163 | 2,190 | 109,489 | 112,940 |
80% | 109 | 1,460 | 81,155 | 83,990 |
90% | 55 | 730 | 52,821 | 55,039 |
100% | 0 | 0 | Talquetamab is dominant | Talquetamab is dominant |
CDA-AMC = Canada’s Drug Agency; ICER = incremental cost-effectiveness ratio; QALY = quality-adjusted life-year; vs. = versus.
Table 10: CDA-AMC Price Reduction Analyses (Cohort C — Biweekly Dosing)
Price reduction | Unit drug cost ($) | ICERs for talquetamab vs. physician’s choice ($/QALY) | ||
|---|---|---|---|---|
2 mg | 40 mg | Sponsor base case | CDA-AMC reanalysis | |
No price reduction | 545 | 7,300 | 252,339 | 332,182 |
10% | 491 | 6,570 | 228,373 | 299,882 |
20% | 436 | 5,840 | 203,578 | 267,065 |
30% | 382 | 5,110 | 178,782 | 234,249 |
40% | 327 | 4,380 | 153,987 | 201,432 |
50% | 273 | 3,650 | 129,191 | 168,615 |
60% | 218 | 2,920 | 104,396 | 135,798 |
70% | 163 | 2,190 | 79,600 | 102,981 |
80% | 109 | 1,460 | 54,804 | 70,164 |
90% | 55 | 730 | 30,009 | 37,347 |
100% | 0 | 0 | Talquetamab is dominant | Talquetamab is dominant |
CDA-AMC = Canada’s Drug Agency; ICER = incremental cost-effectiveness ratio; QALY = quality-adjusted life-year; vs. = versus.
CDA-AMC conducted scenario analyses to evaluate the impact of adopting a biweekly dosing schedule for teclistamab on the cost-effectiveness of talquetamab. In these scenarios, talquetamab was no longer less costly and more effective than teclistamab. Instead, talquetamab was associated with incremental costs and QALYs relative to teclistamab, resulting in an ICER of $262,786 per QALY gained for patients on a weekly dosing schedule (cohort A) and $164,551 per QALY gained for patients on a biweekly dosing schedule (cohort C).
CDA-AMC calculated a weighted ICER based on clinical expert input, which indicated that 90% of patients treated with talquetamab would receive biweekly dosing and the remaining 10% would receive weekly dosing (Table 18). The weighted CDA-AMC base case suggests that talquetamab has an ICER of $330,563 per QALY gained relative to physician’s choice. If the biweekly dosing schedule is preferred in clinical practice, an 87% price reduction would be necessary for talquetamab to be cost-effective compared to physician’s choice at a WTP threshold of $50,000 per QALY gained.
Issues for Consideration
CDA-AMC notes that hospitalization is required for at least 48 hours from the start of injection for the 2 step-up doses (day 1 and day 3) and the first treatment dose (day 5) of talquetamab. To account for this, the model assumed a 5-day hospital stay in the first cycle, the cost of which was reflected in the drug administration costs for talquetamab. The drug plans indicated that some jurisdictions may encounter capacity issues due to the supportive care recommended during the initial dose administration of talquetamab.
Based on the product monograph, talquetamab may be administered on a weekly (0.4 mg/kg) or biweekly (0.8 mg/kg) dosing schedule. The clinical expert consulted by CDA-AMC indicated that the majority of patients with triple-class exposed r/r are likely to prefer a biweekly dosing schedule owing to the reduced frequency of subcutaneous injections. CDA-AMC further notes that the economic model submitted by the sponsor was not programmed with the functionality to explore assumptions regarding the distribution of patients receiving weekly and biweekly dosing schedules. In light of this, CDA-AMC conducted base-case reanalyses to assess the cost-effectiveness of talquetamab when used on a weekly dosing schedule (cohort A) and a biweekly dosing schedule (cohort C).
Cilta-cel is currently under consideration for negotiation with the pan-Canadian Pharmaceutical Alliance. Should negotiations conclude with a letter of intent, the price of cilta-cel paid by the drug plans may be lower than incorporated in the sponsor’s model, which was based on the submitted price in the CDA-AMC review of cilta-cel.1
Overall Conclusions
The phase I/II, single-arm, open-label MonumenTAL-1 study provided evidence regarding the efficacy and safety of talquetamab for patients with r/r who had received at least 3 prior lines of therapy. The pivotal trial was not designed to assess differences in efficacy between the weekly and biweekly dosing schedules. Due to the lack of a comparator group, causal conclusions about time-to-event end points could not be drawn. Using the Grading of Recommendations Assessment, Development and Evaluation approach, the CDA-AMC Clinical Review assessed the evidence from the MonumenTAL-1 study on the treatment effect of talquetamab versus any comparator as very uncertain. However, the clinical expert noted that, based on the natural history of the disease and experience in clinical practice, the OS and PFS results observed in the MonumenTAL-1 study appear promising for patients without prior exposure to T-cell redirection therapies, whether treated weekly or biweekly. The CDA-AMC Clinical Review also highlighted several limitations in the sponsor’s comparisons of the MonumenTAL-1 study data with the LocoMMotion and MoMMent studies, as well as with the MajesTEC-1 study and the CARTITUDE-1 study, which hindered the ability to interpret relative treatment effects between talquetamab, physician’s choice, teclistamab, and cilta-cel. Despite these limitations, the review concluded that the evidence suggests a potential benefit of talquetamab compared to physician’s choice, though the true magnitude of this benefit remains unclear. Additionally, the review found inconsistent results for talquetamab versus teclistamab, leading to uncertainty about which drug might be preferred. It also suggested that cilta-cel may be more favourable than talquetamab. This clinical uncertainty is reflected in the submitted economic analysis, given that the sponsor extrapolated OS and PFS for the lifetime horizon of the model using parametric distributions fitted to clinical data from these studies.
In addition to the aforementioned limitations with the clinical evidence, CDA-AMC identified several limitations with the sponsor’s economic submission. These limitations included the following: uncertainty regarding the long-term comparative efficacy of talquetamab on OS; limited generalizability of the modelled population to clinical practice in Canada; overestimation of comparative efficacy in the sponsor's modelling approach; uncertainty regarding the dosing schedule for talquetamab in clinical practice; uncertainty regarding the dosing schedule for teclistamab in clinical practice; and omission of SVd as a relevant comparator in the current treatment landscape. CDA-AMC conducted base-case reanalyses to assess the cost-effectiveness of talquetamab when used on a weekly dosing schedule (cohort A) and a biweekly dosing schedule (cohort C). The CDA-AMC base-case reanalyses were derived by adopting the exponential distribution to extrapolate OS for talquetamab.
The CDA-AMC base-case results align with those of the sponsor’s submitted analysis, indicating that talquetamab is not cost-effective at a WTP threshold of $50,000 per QALY gained, relative to physician’s choice. In the CDA-AMC reanalysis of cohort A, the use of talquetamab on a weekly dosing schedule was associated with an incremental cost of $435,516 and an incremental QALY gain of 1.38 compared with physician’s choice, resulting in an ICER of $315,994 per QALY gained. In the CDA-AMC reanalysis of cohort C, the use of talquetamab on a biweekly dosing schedule was associated with an incremental cost of $452,471 and an incremental QALY gain of 1.36 compared with physician’s choice, resulting in an ICER of $332,182 per QALY gained. To be considered cost-effective at a WTP threshold of $50,000 per QALY gained relative to physician’s choice, talquetamab would require a price reduction of 92% for the weekly dosing schedule and 86% for the biweekly dosing schedule. With this price reduction, the per-patient 28-day drug acquisition costs for talquetamab would be $1,999 for the first cycle and $1,863 for each subsequent cycle if administered weekly, and $4,059 for the first cycle and $3,120 for each subsequent cycle if administered biweekly. In both reanalyses, talquetamab was less costly and more effective than teclistamab but less costly and less effective than cilta-cel.
CDA-AMC calculated a weighted ICER based on clinical expert input, which indicated that 90% of patients treated with talquetamab would receive biweekly dosing and the remaining 10% would receive weekly dosing. The weighted CDA-AMC base case suggests that talquetamab has an ICER of $330,563 per QALY gained relative to physician’s choice. If the biweekly dosing schedule is preferred in clinical practice, an 87% price reduction would be necessary for talquetamab to be cost-effective compared to physician’s choice at a WTP threshold of $50,000 per QALY gained. In addition, CDA-AMC conducted scenario analyses to evaluate the impact of adopting a biweekly dosing schedule for teclistamab on the cost-effectiveness of talquetamab. In these scenarios, talquetamab was no longer less costly and more effective than teclistamab. Instead, talquetamab was associated with incremental costs and QALYs relative to teclistamab, resulting in an ICER of $262,786 per QALY gained for patients on a weekly dosing schedule (cohort A) and $164,551 per QALY gained for patients on a biweekly dosing schedule (cohort C).
The CDA-AMC base-case results rely on a substantial and sustained OS benefit favouring talquetamab, projecting that patients treated with talquetamab gain 2 additional life-years compared to those treated with physician’s choice. However, in the absence of robust, long-term, head-to-head clinical evidence, the extent of this survival benefit is highly uncertain. Should the long-term effectiveness of talquetamab be lower than predicted, the ICER would be higher than the CDA-AMC analyses, requiring larger price reductions to achieve cost-effectiveness. Moreover, a comparison of the duration of follow-up in the MonumenTAL-1 trial to the model’s time horizon (33 months versus 30 years) indicates that most of the QALY and life-year benefits experienced by patients treated with talquetamab in the CDA-AMC analyses were accrued in the posttrial period of the model on the basis of extrapolation. Finally, the sponsor did not consider SVd as a relevant comparator in the economic analysis; therefore, the cost-effectiveness of talquetamab relative to SVd is unknown.
References
1.Janssen Inc. Pharmacoeconomic evaluation [internal sponsor's report]. In: Drug Reimbursement Review sponsor submission: Talvey (talquetamab), 3 mg/1.5 mL (2 mg/mL), 40 mg/1.0 mL (40 mg/mL) solution for subcutaneous injection. May 1, 2024.
2.Janssen Inc. Talvey (talquetamab): 3 mg/1.5 mL (2 mg/mL), 40 mg/1.0 mL (40 mg/mL) solution for subcutaneous injection [product monograph]. April 30, 2024.
3.Janssen Inc. Sponsor's NMA report [internal sponsor's report]. In: Drug Reimbursement Review sponsor submission: Talvey (talquetamab), 3 mg/1.5 mL (2 mg/mL), 40 mg/1.0 mL (40 mg/mL) solution for subcutaneous injection. May 1, 2024.
4.Ontario Ministry of Health. Schedule of benefits for physician services under the Health Insurance Act: (June 29, 2023 (effective July 24, 2023)) [sponsor supplied reference]. 2023.
5.Ontario Ministry of Health. Schedule of benefits for laboratory services [sponsor supplied reference]. 2023. https://www.health.gov.on.ca/en/pro/programs/ohip/sob/lab/sob_lab_2023.pdf
6.Ontario Health and Long-Term Care. Ontario Case Costing Initiative (OCCI) [sponsor supplied reference]. 2017. https://data.ontario.ca/dataset/ontario-case-costing-initiative-occi
7.Canada's Drug Agency. Drug Reimbursement Review pharmacoeconomic report: Teclistamab (tecvayli) for relapsed or refractory multiple myeloma. 2024. Accessed July 18, 2024. https://www.cadth.ca/teclistamab
8.McCurdy A, Mian H, LeBlanc R, et al. Redefining attrition in multiple myeloma (MM): a Canadian Myeloma Research Group (CMRG) analysis. Blood Cancer J. 2023;13(1):111. doi:10.1038/s41408-023-00883-x PubMed
9.Ontario Ministry of Health, Ontario Ministry of Long-Term Care. Ontario drug benefit formulary/comparative drug index. 2024. Accessed June, 2024. https://www.formulary.health.gov.on.ca/formulary/
10.DeltaPA. IQVIA; 2023. Accessed June, 2024. https://www.iqvia.com/
11.Janssen Inc. Budget Impact Analysis [internal sponsor's report]. In: Drug Reimbursement Review sponsor submission: Talvey (talquetamab), 3 mg/1.5 mL (2 mg/mL), 40 mg/1.0 mL (40 mg/mL) solution for subcutaneous injection. May 1, 2024.
12.Canadian Cancer Statistics Advisory Committee, Canadian Cancer Society, Statistics Canada, Public Health Agency of Canada. Canadian cancer statistics 2023. Canadian Cancer Society; 2023. Accessed April, 2024. https://cdn.cancer.ca/-/media/files/research/cancer-statistics/2023-statistics/2023_PDF_EN.pdf
13.Canadian Cancer Statistics Advisory Committee, Canadian Cancer Society, Statistics Canada, Public Health Agency of Canada. Canadian cancer statistics: A 2022 special report on cancer prevalence. Canadian Cancer Society; 2022. Accessed July 18, 2024. https://cdn.cancer.ca/-/media/files/research/cancer-statistics/2022-statistics/2022-special-report/2022_prevalence_report_final_en.pdf?rev=7755f9f350e845d58e268a59e3be608e&hash=3F3F30CADD8CAF0049636B5A41EDBB13&_gl=1*617m39*_gcl_au*MTAyMzE4NDQwNC4xNzA4NTM5NDky
14.Canadian Cancer Statistics Advisory Committee, Canadian Cancer Society, Statistics Canada, Public Health Agency of Canada. Canadian cancer statistics 2021. Canadian Cancer Society; 2021. Accessed July 18, 2024. https://cdn.cancer.ca/-/media/files/research/cancer-statistics/2021-statistics/2021-pdf-en-final.pdf?rev=2b9d2be7a2d34c1dab6a01c6b0a6a32d&hash=01DE85401DBF0217F8B64F2B7DF43986&_ga=2.14982646.1178938591.1637792559-449671364.1634158755
Appendix 1: Cost Comparison Table
Please note that this appendix has not been copy-edited.
The comparators presented in the Table 11 have been deemed to be appropriate based on feedback from clinical experts and drug plans. Comparators may be recommended (appropriate) practice or actual practice. Existing Product Listing Agreements are not reflected in the table and as such, the table may not represent the actual costs to public drug plans.
Table 11: CDA-AMC Cost Comparison Table for Patients With r/r Who Have Received at Least 3 Prior Therapies
Treatment | Strength / concentration | Form | Price ($) | Recommended dosage | Daily cost ($) | 28-day cycle cost ($) |
|---|---|---|---|---|---|---|
Talquetamab (Talvey) | 2 mg/mL 40 mg/mL | Solution for subcutaneous injection | 545.0000 7,300.0000 | Weekly dosing schedule Step-up dosing: 0.01 mg/kg on day 1 and 0.06 mg/kg on day 4, followed by first treatment dose of 0.4 mg/kg on day 7. Subsequent treatment doses of 0.4 mg/kg once weekly thereafter. Biweekly dosing schedule Step-up dosing 0.01 mg/kg on day 1, 0.06 mg/kg on day 4, 0.4 mg/kg on day 7, followed by first treatment dose of 0.8 mg/kg on day 10. Subsequent treatment doses of 0.8 mg/kg once biweekly thereafter. | Weekly dosing schedule Cycle 1: 1,120.71 Cycle 2+: 1,042.86 Biweekly dosing schedule Cycle 1: 1,381.43 Cycle 2+: 1,042.86 | Weekly dosing schedule Cycle 1: 31,380 Cycle 2+: 29,200 Biweekly dosing schedule Cycle 1: 38,680 Cycle 2+: 29,200 |
Teclistamab (Tecvayli) | 30 mg 153 mg | Solution for subcutaneous injection | 1,322.0000 6,741.0000 | Step-up dosing schedule: 0.06 mg/kg on day 1; 0.3 mg/kg on day 3; 1.5 mg/kg on day 5. Dosing schedule from week 2 onwards: 1.5 mg/kg once weekly. | Cycle 1: 973.31 Cycle 2 onwards: 886.39 | Cycle 1: 29,608 Cycle 2 onwards: 26,964 |
Carfilzomib + dexamethasone | ||||||
Carfilzomib | 10 mg 30 mg 60 mg | Powder in vial | 255.5500a 766.6590 1,533.3300 | 28-day cycles: Cycle 1: 20 mg/m2 on day 1; 70 mg/m2 on days 8 and 15 Cycle 2+: 70 mg/m2 on days 1, 8, 15 | Cycle 1: 273.81 Cycles 2+: 355.95 | Cycle 1: 7,667 Cycles 2+: 9,967 |
Dexamethasone | 0.5 mg 4 mg | Tablet | 0.1564 0.6112 | 28-day cycles: 20 mg on days 1, 2, 8, 9, 15, 16, 22, 23 | 0.87 | 24 |
Carfilzomib + dexamethasone regimen | Cycle 1: 274.68 Cycle 2+: 356.82 | Cycle 1: 7,691 Cycle 2+: 9,991 | ||||
Carfilzomib + cyclophosphamide + dexamethasone | ||||||
Carfilzomib | 10 mg 30 mg 60 mg | Powder in vial | 255.5500a 766.6590 1,533.3300 | 28-day cycles: Cycle 1: 20 mg/m2 on day 1; 70 mg/m2 on days 8 and 15 Cycle 2+: 70 mg/m2 on days 1, 8, 15 | Cycle 1: 273.81 Cycles 2+: 355.95 | Cycle 1: 7,667 Cycles 2+: 9,967 |
Cyclophosphamide | 25 mg 50 mg | Tablet | 0.3545 0.4773 | 28-day cycles: 300 mg/m2 on days 1, 8, 15 | 0.61 | 17 |
Dexamethasone | 0.5 mg 4 mg | Tablet | 0.1564 0.6112 | 28-day cycles: 40 mg on days 1, 8, 15, 22 | 0.87 | 24 |
Carfilzomib + cyclophosphamide + dexamethasone regimen | Cycle 1: 275.29 Cycles 2+: 357.44 | Cycle 1: 7,708 Cycles 2+: 10,008 | ||||
Dexamethasone + pomalidomide | ||||||
Dexamethasone | 0.5 mg 4 mg | Tablet | 0.1564 0.6112 | 28-day cycles: 20 to 40 mg on days 1, 8, 15, 22 | 0.44 to 0.87 | 12 to 24 |
Pomalidomide | 1 mg 2 mg 3 mg 4 mg | Capsule | 125.0000 | 28-day cycles: 4 mg on days 1 to 21 | 93.75 | 2,625 |
Dexamethasone + pomalidomide regimen | 94.19 to 94.62 | 2,637 to 2,649 | ||||
Cyclophosphamide + dexamethasone + pomalidomide | ||||||
Cyclophosphamide | 25 mg 50 mg | Tablet | 0.3545 0.4773 | 28-day cycles: 400 mg on days, 1, 8, 15 | 0.41 | 11 |
Dexamethasone | 0.5 mg 4 mg | Tablet | 0.1564 0.6112 | 28-day cycles: 20 to 40 mg on days 1, 8, 15, 22 | 0.44 to 0.87 | 12 to 24 |
Pomalidomide | 1 mg 2 mg 3 mg 4 mg | Capsule | 125.0000 | 28-day cycles: 4 mg on days 1 to 21 | 93.75 | 2,625 |
Cyclophosphamide + dexamethasone + pomalidomide regimen | 94.60 to 95.03 | 2,649 to 2,661 | ||||
Bortezomib + dexamethasone + selinexor | ||||||
Bortezomib | 3.5 mg | Powder in vial | 654.3100 a | 35-day cycles: 1.3 mg/m2 on days 1, 8, 15, 22. | 74.78 | 2,094 |
Dexamethasone | 0.5 mg 4 mg | Tablet | 0.1564 0.6112 | 35-day cycles: 40 mg on days 1, 8, 15, 22, 29. | 0.87 | 25 |
Selinexor | 20 mg | Tablet | 550.0000a | 35-day cycles: 100 mg on days 1, 8, 15, 22, 29. | 392.86 | 11,000 |
Bortezomib + dexamethasone + selinexor regimen | 468.51 | 13,118 | ||||
CAR T-cell therapy | ||||||
Ciltacabtagene autoleucel | 0.5 to 1.0 × 10⁶ CAR-positive viable T cells per kg, with a maximum of 1 × 10⁸ T-cells | Cell suspension in patient-specific single infusion bag | 632,455.0000b | One-time dosec | NA | NA |
CDA-AMC = Canada’s Drug Agency; r/r = relapsed or refractory.
Note: All prices are from the Ontario Drug Benefit Formulary (accessed June 2024),9 unless otherwise indicated, and do not include dispensing fees. Calculations assume a patient body weight of 75.64 kg and a body surface area of 1.87 m2, based on cohort A and cohort C from the MonumenTAL-1 trial.
aIQVIA DeltaPA database, accessed June 2024.10
bThe sponsor-submitted price reported in the CDA-AMC pharmacoeconomic review of cilta-cel.1
cCiltacabtagene autoleucel is delivered as a 1-time dose. Daily and annual costs were not calculated.
Appendix 2: Submission Quality
Please note that this appendix has not been copy-edited.
Description | Yes or no | Comments |
|---|---|---|
Population is relevant, with no critical intervention missing, and no relevant outcome missing | No | Selinexor, which was identified as a relevant comparator by clinical experts, was not included in the sponsor’s economic analysis. |
Model has been adequately programmed and has sufficient face validity | No | The sponsor’s use of a PSM introduces structural assumptions about the relationship between PFS and OS that likely do not accurately reflect causal relationships within the disease pathway. These assumptions may produce a postprogression survival bias that favours talquetamab. Due to the assumed independence between OS and PFS end points in a PSM, extrapolations for each end point may reflect within-trial trends in the rates of relapse and death. However, as the postprogression mortality transition is not modelled directly in the PSM approach, it is not possible to establish from the model whether this effect was supported by the trial data or was generated entirely during extrapolation. |
Model structure is adequate for decision problem | Yes | No comment |
Data incorporation into the model has been done adequately (e.g., parameters for probabilistic analysis) | Yes | No comment |
Parameter and structural uncertainty were adequately assessed; analyses were adequate to inform the decision problem | Yes | No comment |
The submission was well organized and complete; the information was easy to locate (clear and transparent reporting; technical documentation available in enough details) | No | Drug acquisition cost calculations were unclear and appeared across multiple sheets in the submitted model. Assumptions for cost calculations were not clear. |
OS = overall survival; PFS = progression-free survival; PSM = partitioned survival model.
Appendix 3: Additional Information on the Submitted Economic Evaluation
Please note that this appendix has not been copy-edited.
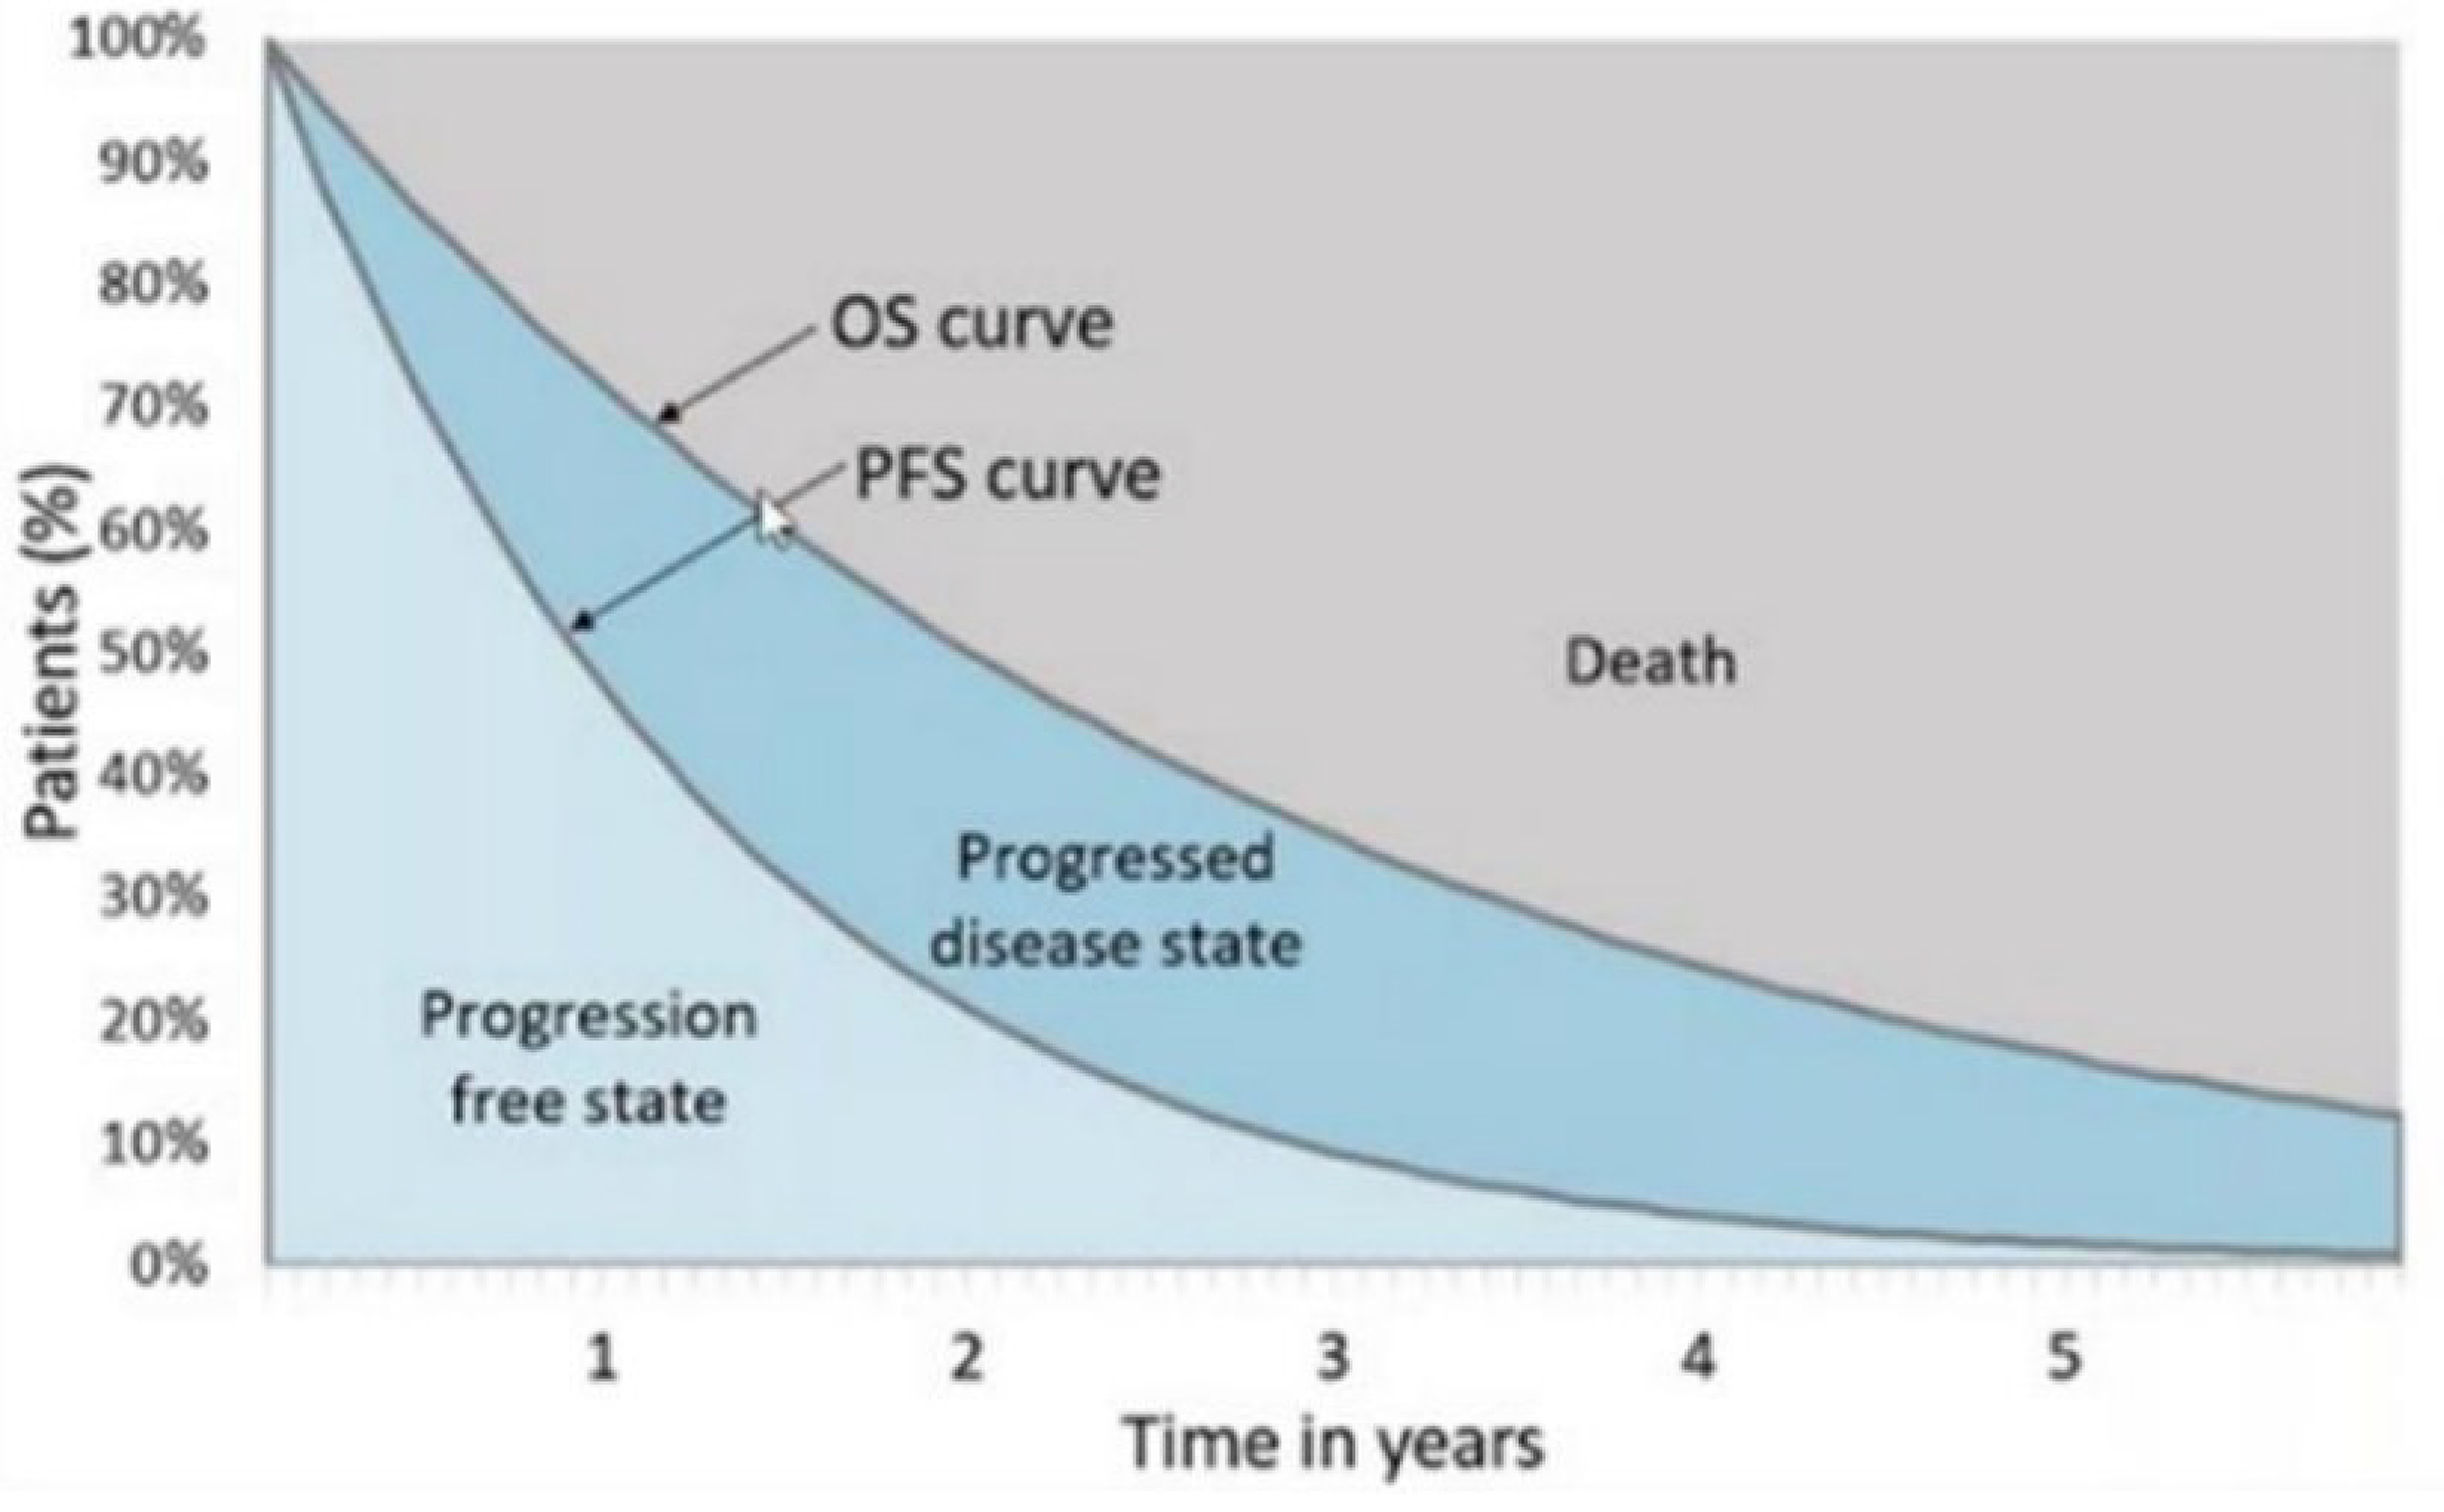
Detailed Results of the Sponsor’s Base Case
Table 13: Disaggregated Summary of the Sponsor’s Economic Evaluation Results (Cohort A)
Parameter | Talquetamab | Physician’s choice | Teclistamab | Cilta-cel |
|---|---|---|---|---|
Discounted life-years | ||||
Total | 3.59 | 1.55 | 3.09 | 4.92 |
Preprogression | 1.16 | 0.59 | 1.86 | 2.97 |
Postprogression | 2.44 | 0.96 | 1.23 | 1.95 |
Discounted QALYs | ||||
Total | 2.47 | 1.06 | 2.12 | 3.55 |
Preprogression | 0.80 | 0.41 | 1.29 | 2.24 |
Postprogression | 1.67 | 0.66 | 0.85 | 1.34 |
AE-related disutility | –0.01 | 0.00 | –0.01 | –0.02 |
Discounted costs ($) | ||||
Total | 556,885 | 121,859 | 620,653 | 751,882 |
Acquisition | 401,424 | 31,064 | 503,450 | 603,633 |
Administration | 10,857 | 464 | 12,366 | 0 |
Follow-up care and monitoring (pre- progression) | 4,045 | 2,068 | 6,510 | 11,337 |
AE management | 20,832 | 6,189 | 26,374 | 44,572 |
Follow-up care and monitoring (after progression) | 8,530 | 3,349 | 4,312 | 6,817 |
Subsequent treatment costs | 58,244 | 24,042 | 14,350 | 33,777 |
End of life costs | 52,954 | 54,684 | 53,291 | 51,747 |
AE = adverse event; cilta-cel = ciltacabtagene autoleucel; QALY = quality-adjusted life-year.
Note: CAR T administration costs were included within the drug acquisition costs for cilta-cel.
Source: Sponsor’s pharmacoeconomic submission.1
Table 14: Disaggregated Summary of the Sponsor’s Economic Evaluation Results (Cohort C)
Parameter | Talquetamab | Physician’s choice | Teclistamab | Cilta-cel |
|---|---|---|---|---|
Discounted life-years | ||||
Total | 4.54 | 1.88 | 2.82 | 4.64 |
Before progression | 1.96 | 0.65 | 1.75 | 3.02 |
After progression | 2.57 | 1.23 | 1.08 | 1.61 |
Discounted QALYs | ||||
Total | 3.08 | 1.28 | 1.92 | 3.33 |
Before progression | 1.35 | 0.45 | 1.20 | 2.25 |
After progression | 1.75 | 0.83 | 0.73 | 1.10 |
AE-related disutility | –0.01 | 0.00 | –0.01 | –0.02 |
Discounted costs ($) | ||||
Total | 581,975 | 126,271 | 593,294 | 745,297 |
Acquisition | 451,559 | 33,462 | 477,209 | 610,245 |
Administration | 11,646 | 495 | 12,167 | 0 |
Follow-up care and monitoring (pre- progression) | 6,870 | 2,284 | 6,113 | 11,518 |
AE management | 18,409 | 6,189 | 26,377 | 44,577 |
Follow-up care and monitoring (after progression) | 9,001 | 4,291 | 3,768 | 5,676 |
Subsequent treatment costs | 32,564 | 25,226 | 14,142 | 21,324 |
End of life costs | 51,926 | 54,323 | 53,519 | 51,958 |
AE = adverse event; cilta-cel = ciltacabtagene autoleucel; QALY = quality-adjusted life-year.
Note: CAR T administration costs were included within the drug acquisition costs for cilta-cel.
Source: Sponsor’s pharmacoeconomic submission.1
Table 15: Sponsor’s Submitted Health State Utility Values
Parameter | Cohort A | Cohort C |
|---|---|---|
Preinfusion period (CAR T-cell therapy only) | 0.693 | 0.686 |
PFS (non-CAR T-cell therapy, on treatment) | 0.693 | 0.686 |
PFS (CAR T-cell therapy, off-treatment increment) | 0.060 | 0.060 |
Postprogression survival | 0.686 | 0.679 |
PFS = progression-free survival.
Source: Sponsor’s pharmacoeconomic submission.1
Appendix 4: Additional Details on the CDA-AMC Reanalyses and Sensitivity Analyses of the Economic Evaluation
Please note that this appendix has not been copy-edited.
Detailed Results of CDA-AMC Base Case
Table 16: Disaggregated Summary of the CDA-AMC Economic Evaluation Results (Cohort A)
Parameter | Talquetamab | Physician’s choice | Teclistamab | Cilta-cel |
|---|---|---|---|---|
Discounted life-years | ||||
Total | 3.57 | 1.55 | 3.10 | 4.93 |
Before progression | 1.16 | 0.59 | 1.86 | 2.97 |
After progression | 2.44 | 0.96 | 1.23 | 1.95 |
Discounted QALYs | ||||
Total | 2.45 | 1.07 | 2.13 | 3.56 |
Before progression | 0.80 | 0.41 | 1.28 | 2.24 |
After progression | 1.65 | 0.66 | 0.86 | 1.35 |
AE-related disutility | –0.01 | 0.00 | –0.01 | –0.02 |
Discounted costs ($) | ||||
Total | 557,361 | 121,845 | 620,151 | 752,302 |
Acquisition | 401,513 | 30,980 | 502,856 | 603,749 |
Administration | 10,855 | 462 | 12,358 | 0 |
Follow-up care and monitoring (pre- progression) | 4,060 | 2,078 | 6,455 | 11,341 |
AE management | 20,848 | 6,188 | 26,410 | 44,593 |
Follow-up care and monitoring (after progression) | 8,429 | 3,365 | 4,386 | 6,879 |
Subsequent treatment costs | 58,626 | 24,059 | 14,363 | 33,975 |
End of life costs | 53,032 | 54,713 | 53,323 | 51,765 |
AE = adverse event; cilta-cel = ciltacabtagene autoleucel; QALY = quality-adjusted life-year.
Table 17: Disaggregated Summary of CDA-AMC Economic Evaluation Results (Cohort C)
Parameter | Talquetamab | Physician’s choice | Teclistamab | Cilta-cel |
|---|---|---|---|---|
Discounted life-years | ||||
Total | 3.88 | 1.88 | 2.84 | 4.65 |
Before progression | 1.96 | 0.66 | 1.74 | 3.03 |
After progression | 1.92 | 1.23 | 1.10 | 1.63 |
Discounted QALYs | ||||
Total | 2.64 | 1.28 | 1.93 | 3.34 |
Before progression | 1.35 | 0.45 | 1.19 | 2.26 |
After progression | 1.30 | 0.83 | 0.75 | 1.10 |
AE-related disutility | –0.01 | 0.00 | –0.01 | –0.02 |
Discounted costs ($) | ||||
Total | 578,708 | 126,237 | 593,709 | 745,151 |
Acquisition | 451,867 | 33,408 | 477,696 | 610,256 |
Administration | 11,673 | 493 | 12,194 | 0 |
Follow-up care and monitoring (pre- progression) | 6,879 | 2,295 | 6,087 | 11,537 |
AE management | 18,404 | 6,201 | 26,374 | 44,561 |
Follow-up care and monitoring (after progression) | 6,722 | 4,299 | 3,858 | 5,708 |
Subsequent treatment costs | 30,612 | 25,325 | 14,097 | 21,245 |
End of life costs | 52,550 | 54,215 | 53,404 | 51,843 |
AE = adverse event; cilta-cel = ciltacabtagene autoleucel; QALY = quality-adjusted life-year.
Scenario Analyses
Table 18: Scenario Analyses Conducted on the CDA-AMC Base Case
Stepped analysis | Drug | Total costs ($) | Total QALYs | ICER for talquetamab vs. comparatora ($/QALY) |
|---|---|---|---|---|
Talquetamab weekly dosing (cohort A) | ||||
CDA-AMC base case (Probabilistic) | Physician’s choice | 121,845 | 1.07 | 315,994 vs talquetamab |
Talquetamab | 557,361 | 2.45 | Reference | |
Teclistamab | 620,151 | 2.13 | Talquetamab is dominant. | |
Cilta-cel | 752,302 | 3.56 | Talquetamab is less costly and less effective. | |
CDA-AMC Scenario 1: Teclistamab Biweekly Dosing vs | Physician’s choice | 122,147 | 1.07 | 317,985 vs talquetamab |
Teclistamab | 475,743 | 2.12 | 262,786 vs talquetamab | |
Talquetamab | 557,969 | 2.44 | Reference | |
Cilta-cel | 751,435 | 3.54 | Talquetamab is less costly and less effective. | |
Talquetamab biweekly dosing (cohort C) | ||||
CDA-AMC base case (Probabilistic) | Physician’s choice | 126,237 | 1.28 | 332,182 vs talquetamab |
Talquetamab | 578,708 | 2.64 | Reference | |
Teclistamab | 593,709 | 1.93 | Talquetamab is dominant. | |
Cilta-cel | 745,151 | 3.34 | Talquetamab is less costly and less effective. | |
CDA-AMC Scenario 1: Teclistamab Biweekly Dosing | Physician’s choice | 126,449 | 1.27 | 330,381 |
Teclistamab | 458,341 | 1.91 | 164,551 vs talquetamab | |
Talquetamab | 577,818 | 2.64 | Reference | |
Cilta-cel | 745,349 | 3.33 | Talquetamab is less costly and less effective. | |
Weighted ICERb | ||||
CDA-AMC Base case | Physician’s choice | 125,798 | 1.26 | 330,563 vs talquetamab |
Talquetamab | 576,573 | 2.62 | Reference | |
Teclistamab | 596,354 | 1.95 | Talquetamab is dominant. | |
Cilta-cel | 745,866 | 3.36 | Talquetamab is less costly and less effective. | |
CDA-AMC Scenario 1: Teclistamab Biweekly Dosing | Physician’s choice | 126,019 | 1.25 | 329,141 vs talquetamab |
Teclistamab | 460,081 | 1.93 | 174,339 vs talquetamab | |
Talquetamab | 575,834 | 2.62 | Reference | |
Cilta-cel | 745,958 | 3.35 | Talquetamab is less costly and less effective. | |
ICER = incremental cost-effectiveness ratio; QALY = quality-adjusted life-year.
aResults are not presented sequentially due to heterogeneity between comparator trials. ICERs reflect pairwise comparisons between talquetamab and each comparator. For instance, the CDA-AMC base-case ICER for talquetamab vs. physician’s choice is $315,994 per QALY gained in cohort A.
bThe weighted ICER was calculated by assuming 90% of patients would receive biweekly dosing and the remaining 10% would receive weekly dosing of talquetamab.
Appendix 5: Submitted Budget Impact Analysis and CDA-AMC Appraisal
Please note that this appendix has not been copy-edited.
Table 19: Summary of Key Take-Aways
Key take-aways of the budget impact analysis |
|---|
|
Summary of Sponsor’s Budget Impact Analysis
The sponsor submitted a budget impact analysis (BIA) to estimate the incremental three-year budget impact of reimbursing talquetamab for the treatment of adult patients with r/r who have received at least 3 prior lines of therapy, including a PI, an IMiD, and an anti-CD38 mAb, who have experienced disease progression on or after the last therapy, as per the submitted reimbursement request.11 The analysis was performed from the perspective of the public drug plan formulary in Canada. The sponsor estimated the budget impact by comparing 2 scenarios: a reference scenario that estimated the total costs associated with the current standard of care (i.e., Kd, KCd, Pd, PCd, SVd, teclistamab, and cilta-cel) for the fourth-line treatment of adult patients with r/r who have experienced disease progression on or after the last therapy; and a new drug scenario, where talquetamab is funded in the fourth-line setting. The sponsor estimated the eligible population using an epidemiological approach, leveraging data from multiple sources in the scientific literature and assumptions based on clinical expert input. The dosing modelled for talquetamab reflected the biweekly dosing schedule in the product monograph. This biweekly dosing was chosen as the base-case schedule over weekly dosing, based on clinical expert feedback suggesting that biweekly dosing would be preferred in clinical practice. Key inputs to the BIA are documented in Table 20.
Key assumptions include:
Treatment duration was standardized to 1 year for all treatments. This assumes treatment duration on talquetamab is the same as all therapies for standard of care and teclistamab.
The sponsor applied biweekly dosing for talquetamab in the base case, as per the product monograph.2 Weekly dosing schedule was assumed in exploratory analyses.
The uptake for talquetamab was assumed to be 23% in year 1, 29% in year 2, and 29% in year 3.
Table 20: Summary of Key Model Parameters
Parameter | Sponsor’s estimate (reported as year 1 / year 2 / year 3 if appropriate) |
|---|---|
Target population | |
Prevalence of MM | |
Incidence of MM | 0.01912 |
5-year survival rate of MM | |
Transplant eligible population rate | 56%8 |
Transplant ineligible population rate | 44%8 |
Proportion of patients progressing until 3L therapy (transplant eligible) | 16%8 |
Proportion of patients progressing until 3L therapy (transplant ineligible) | 19%8 |
Proportion of 3L patients receiving 4L therapy that are eligible for treatment | 50% |
Number of patients eligible for drug under review | 582 / 598 / 615 |
Market uptake (3 years) | |
Uptake (reference scenario) Teclistamab Kd KCd Pd PCd SVd Cilta-cel | 62% / 67% / 67% 5% / 4% / 4% 5% / 3% / 3% 2% / 1% / 1% 3% / 2% / 2% 5% / 4% / 4% 18% / 18% / 18% |
Uptake (new drug scenario) Talquetamab Teclistamab Kd KCd Pd PCd SVd Cilta-cel | 23% / 29% / 29% 44% / 44% / 44% 5% / 3% / 3% 4% / 2% / 2% 1% / 1% / 1% 3% / 2% / 2% 3% / 1% / 1% 18% / 18% / 18% |
Cost of treatment (per patient, per year) wastage considered | |
Talquetamab Teclistamab Kd KCd Pd PCd SVd Cilta-cel | $294,040 in year 1 ($287,574 in year 1+) $261,523 in year 1 ($260,322 in year 1+) $129,077 in year 1 ($131,479 in year 1+) $129,358 in year 1 ($131,760 in year 1+) $34,443 $34,724 $156,081 $632,455 |
cilta-cel = ciltacabtagene autoleucel; KCd = carfilzomib + cyclophosphamide + dexamethasone; Kd = carfilzomib + dexamethasone; MM = multiple myeloma; NDMM = newly diagnosed multiple myeloma; PCd = pomalidomide + cyclophosphamide + dexamethasone; Pd = pomalidomide + dexamethasone; SVd = selinexor + bortezomib + dexamethasone.
Summary of the Sponsor’s BIA Results
The sponsor estimated that the budget impact of reimbursing talquetamab for the fourth-line treatment of adult patients with r/r who have experienced disease progression on or after the last therapy, as per its reimbursement request, would be $10,022,141 in year 1, $13,228,058 in year 2, and $13,665,738 in year 3, for a three-year total of $36,915,936.
CDA-AMC Appraisal of the Sponsor’s BIA
CDA-AMC identified several key limitations to the sponsor’s analysis that have notable implications on the results of the BIA:
Uncertain calculation of the BIA. The sponsor uses an epidemiological approach to calculate incident cases of MM) in the fourth-line setting. To do this, the sponsor takes 25-year prevalence rate in Canada to estimate the number of patients and assumes that 50% of patients would be alive at least 5 years post diagnosis. Data from a Canada-based study by McCurdy et al. (2023)8 that analyzed retrospective cohort data from patients with newly diagnosed MM who received at least 1 line of therapy was used to then determine transplant eligibility status and the proportion of patients progressing until subsequent therapy. The sponsor then assumes 50% of patients would be eligible for fourth-line treatment based on the CDA-AMC reimbursement review of teclistamab.
CDA-AMC notes that there are notable cost implications associated with a prevalence-based versus an incidence-based approach. Using a prevalence-based approach, it is conventional to assign an annual cost of therapy to the size of the cohort every year. When using an incidence-based approach, the full costs of therapy incurred over the time horizon of the BIA should be applied to each incident case. A prevalence-based approach is conventional when there is an expectation that the entry of a new drug will lead to patients switching to the new treatment from existing therapies. This means prevalent cases are relevant to the decision problem, not just new incident cases. Clinical expert feedback noted that there is no expectation that patients with r/r would switch from current to new therapies unless they experienced unacceptable toxicity or progression at which point, they become an incident patient. Hence, only patients who fail a third line of therapy or beyond (i.e., incident cases) are relevant to the decision problem. Finally, as time on therapy is different across the treatments considered in the analysis, a prevalence-based approach is also problematic as this is not reflected in the calculations. For example, CAR T-cell therapy is a 1-time cost, however, this is applied every year to the prevalent cohort in the sponsor’s model.
Given these reasons CDA-AMC re-estimated the costs per incident case in the BIA, because the sponsor assigned an annual cost of therapy to the size of the cohort every year using a prevalence-based approach. CDA-AMC extracted costs from the sponsor’s CUA model to estimate the talquetamab drug costs incurred for each incident case in the BIA. The CUA model was run with a 1-, 2-, and 3-year time horizon at a 0% discount rate. When considering a 3-year time horizon, the CUA model indicates an average drug acquisition cost of $495,459 for patients treated with talquetamab. Over the 3-year time horizon of the BIA, the average cost per patient for each incident case that receives talquetamab in year 1 is expected to be $495,459. When considering a 2-year time horizon, the CUA model indicates an average talquetamab drug acquisition cost of $435,792. Over the time horizon of the BIA, the average cost per patient for each incident case that receives talquetamab in year 2 is expected to be $435,792. Finally, when considering a 1-year time horizon, the CUA model indicates an average talquetamab drug acquisition cost of $310,227 Over the time horizon of the BIA, the average cost per patient for each incident case that receives teclistamab in year 3 is expected to be $310,227.
CDA-AMC updated the costs associated with talquetamab: incident cases in year 1 are assumed to experience 3 years of costs equating to $495,459; incident cases in year 2 are assumed to experience 2 years of costs equating to $435,792; and incident cases in year 3 are assumed to experience 1 year of costs equating to $310,227.
CDA-AMC updated the costs associated with teclistamab: incident cases in year 1 are assumed to experience 3 years of costs equating to $472,739; incident cases in year 2 are assumed to experience 2 years of costs equating to $394,242; and incident cases in year 3 are assumed to experience 1 year of costs equating to $273,778.
For regimens included in the physician’s choice basket of therapies, it was assumed that all patients would receive 6 months of treatment. The disaggregated cost for each treatment for each regimen in physician’s choice was not considered in the sponsor’s CUA model. CDA-AMC notes that because few patients remain on therapy with physician’s choice beyond 1 year, the absence of more precise cost information is unlikely to significantly impact the BIA.
Proportion of patients with newly diagnosed MM receiving therapy in 4L is uncertain. As mentioned, the sponsor’s estimation of market size estimated the number of patients with MM using a 25-year prevalence rate in Canada and then reduced the number of patients by 50% assuming half of patients would be alive at least 5 years post diagnosis. Subsequent calculations were used to determine transplant eligibility and progression. However, the sponsor’s reduction of 50% of the prevalent population was inappropriate as it considerably reduced the number of starting eligible patients (i.e., assuming only 50% of total prevalent patients were alive at baseline year of the model) without considering incident patients who could be diagnosed.
CDA-AMC attempted to estimate the eligible patient incident population using a different approach. CDA-AMC examined data from the Canadian Cancer Society showing that the 25-year prevalence of MM in Canada is 1 in 2,505 (or 0.04%).13 Applying this estimate to jurisdictions included in the CDA-AMC base case resulted in a total of 12,839 patients. This means there are 12,839 patients estimated to be alive with a MM diagnosis in 2024. To estimate how many patients will be eligible for talquetamab each year, an assumption must be made as to what percentage of these patients will fail a third line or later therapy each year. A Canada-based study by McCurdy et al. (2023) analyzed retrospective cohort data from patients with newly diagnosed MM who received at least 1 line of therapy from January 1, 2010 to December 31, 2020.8 McCurdy et al. categorized patients by transplant eligibility status and line of therapy. They further categorized patients receiving each therapy line based on whether they (1) were actively receiving treatment or were on remission off-treatment; (2) relapsed and went on to receive subsequent therapy; (3) progressed and opted to forego subsequent therapy; (4) died; or (5) were lost to follow-up.8 A summary of how this data were analyzed by CDA-AMC is provided in Table 23. A total of 5,548 patients were identified. Of those, 1,409 patients died before reaching the fourth-line setting. Of the remaining 4,139 patients, 251 are alive and actively receiving third line therapy, while 735 patients relapsed and went on to receive subsequent therapy in fourth-line setting and beyond. The study does not offer data regarding the distribution of patients in the fourth-line setting that are actively receiving therapy or have died. In the absence of data, CDA-AMC assumed that 50% of patients who received therapy in fourth line remained on active therapy. This assumption is based on the downward trend presented in the same study, which suggests that 10%, 17%, and 27% of patients treated in the first, second, and third line settings, respectively, die before reaching the subsequent line.8 Assuming a 50% mortality risk in the fourth-line setting, the total number of patients who are alive in the cohort decreases to 3,771 (4,139 – (0.5 * 735)). Of those, 6.6% (251/3,771) are actively receiving third line therapy, and 9.7% ((0.5 * 735) / 3,771) are actively receiving treatment in the fourth-line setting and beyond. From this, it is estimated that 2,054 patients (12,839* (0.16)) are actively receiving a third line or later therapy for MM in jurisdictions included in the CDA-AMC base case.
The final assumption is what proportion of these patients move on to the next line of therapy each year. Of those actively receiving therapy in the third line and beyond, some will die before failure or do not receive further treatment after failing. In the McCurdy study, in the third line setting, at the end of follow-up, 40% of patients had gone on to receive a subsequent line and 40% did not.8 If we assume this same ratio applies to patients on active therapy this would mean 50% of patients who receive a third line therapy will go on to receive a fourth line and 50% will not. As the average time on third line therapy and beyond is close to a year on average it is likely that most people who progress will do so within a year. Based on this, CDA-AMC assumed that 50% of patients actively receiving a third line or later therapy will fail and receive a subsequent line every year. This equates to 1,027 incident patients each year requiring a fourth-line or later therapy (50% of 2,054 is 1,027). It was assumed this number would be stable over the 3-year time horizon (that is, every year we would expect an additional 1,027 patients to require a fourth-line or later therapy).
This approach is uncertain for several reasons. First, the data in McCurdy et al. is not broken down in the 4L or later setting so assumptions had to be made regarding the size of the surviving cohort. Second, these data are based on a time period (2010 to 2020) whereby some patients likely did not receive daratumumab. Daratumumab in the first-line setting in Canada has become more prominent in recent years and survival time on this regimen is greater than alternative regimens. We would therefore expect that more patients would have been diagnosed in recent years to remain on active therapy in the first-line setting longer and therefore die on first-line treatment, meaning less patients in the fourth-line and latter settings. Finally, the prevalence estimate considers MM cases over the past 25 years while the data from McCurdy at el. examines 10 years’ worth of diagnoses. Although the expected surviving cohort from 10 to 25 years plus is likely to be small in a MM population, these patients may be more likely to be on later lines of therapy.
CDA-AMC conducted a reanalysis that revised the eligible patient population assuming 1,027 patients will require a fourth-line or later therapy each year.
Dosing schedule for talquetamab in clinical practice is uncertain. Based on the product monograph, talquetamab may be administered on a weekly (0.4 mg/kg, q.w.) or biweekly (0.8 mg/kg every 2 weeks) dosing schedule, corresponding to the dosing schedule followed by patients in cohort A and cohort C, respectively, from the MonumenTAL-1 study.2 However, the pivotal trial was not designed to assess differences in efficacy between dosing schedules. According to clinical experts consulted by CDA-AMC, the biweekly dosing schedule is more likely to be preferred in clinical practice. Less frequent dosing would result in benefits due to reduced health care resource utilization and improved availability of chair time resources. It would also confer quality of life benefits to patients due to less frequent subcutaneous injections required for treatment. Lastly, clinical experts consulted by CDA-AMC noted that while the biweekly dosing schedule may seem more effective, further research is required to confirm this.
Given the remaining uncertainty regarding dosing schedule of talquetamab likely to be used in clinical practice, CDA-AMC explored a scenario analysis assuming a weekly dosing schedule for talquetamab.
Dosing schedule for teclistamab in clinical practice is uncertain. The sponsor for teclistamab indicated the intention to submit their product to Health Canada using a biweekly dosing schedule.7 Notably, drug plans were interested in clarifying whether patients may be allowed to switch from a weekly to a biweekly dosing schedule, as observed in the MajesTEC-1 trial. Furthermore, input from clinical experts in Canada indicated that patients treated with teclistamab are likely to switch to biweekly dosing under specific response and safety profiles (i.e., due to side effects, toxicity, or patient choice). Biweekly dosing has important implications for the total drug acquisition costs of teclistamab, as well as reduced health care resource use related to treatment administration.
Given the remaining uncertainty regarding dosing schedule of teclistamab likely to be used in clinical practice, CDA-AMC explored a scenario analysis assuming a biweekly dosing schedule for teclistamab.
Market share of talquetamab is uncertain. The sponsor assumed that talquetamab would have a market share of 23%, 29% and 29% in Years 1, 2, and 3, respectively. Clinical expert feedback noted that the sponsor’s market share projections were likely reasonable, however they remain highly uncertain. Feedback received from registered clinician groups in Canada noted that talquetamab was expected to shift the current treatment paradigm given that it would provide an additional treatment option with an alternative mechanism of action for patients with advanced diseases who are refractory to the most commonly used agents.
CDA-AMC conducted a scenario reanalysis by adjusting the projected market shares of each drug, talquetamab and teclistamab, to be equal to 33% in year 1, 37% in year 2, and 37% in year 3.
CDA-AMC Reanalyses of the BIA
Table 21: CDA-AMC Revisions to the Submitted BIA
Stepped analysis | Sponsor’s value or assumption | CDA-AMC value or assumption |
|---|---|---|
Changes to derive the CDA-AMC base case | ||
1. Calculation of the budget impact |
|
|
2. Eligible patient population |
|
|
CDA-AMC base case | Reanalysis 1 + 2 | |
BIA = budget impact analysis; CDA-AMC = Canada’s Drug Agency.
The results of the CDA-AMC step-wise reanalysis are presented in summary format in Table 22 and a more detailed breakdown is presented in Table 24. The CDA-AMC reanalysis of the BIA suggests that the incremental expenditures associated with the reimbursement of talquetamab for the fourth-line treatment of adult patients with r/r who have experienced disease progression on or after the last therapy, as per its reimbursement request, would be $14,412,850 in year 1, $24,090,852 in year 2, and $25,628,370 in year 3, for a three-year cumulative total of $64,132,073.
Table 22: Summary of the CDA-AMC Reanalyses of the BIA
Stepped analysis | Three-year total ($) |
|---|---|
Submitted base case | 36,915,936 |
CDA-AMC reanalysis 1 | 37,370,465 |
CDA-AMC reanalysis 2 | 63,172,529 |
CDA-AMC base case | 64,132,073 |
BIA = budget impact analysis; CDA-AMC = Canada’s Drug Agency.
Table 23: Summary of Data Used From McCurdy et al.
Line of therapy | Transplant eligibility status | Total number of patientsa | Actively receiving treatment in the given lineb | Died on that line of therapyb |
|---|---|---|---|---|
1 | Transplant eligible | 3,111 | 1,151 (37%) | 156 (5%) |
Transplant ineligible | 2,437 | 463 (19%) | 414 (17%) | |
2 | Transplant eligible | 1,455 | 437 (30%) | 146 (10%) |
Transplant ineligible | 1,332 | 320 (24%) | 306 (23%) | |
3 | Transplant eligible | 787 | 126 (16%) | 157 (20%) |
Transplant ineligible | 657 | 125 (19%) | 230 (35%) | |
4 | Transplant eligible | 472 | NR | NR |
Transplant ineligible | 263 | NR | NR |
NR = not reported.
aValues in this column have been taken directly from McCurdy et al. (2023).
bValues in these columns have been calculated by applying the percentage from McCurdy et al. (2023) to the total number of patients for each line.
Source: McCurdy et al.8
CDA-AMC conducted the following scenario analyses to address remaining uncertainty, using the CDA-AMC base case (results are provided in Table 24):
Assuming a weekly dosing schedule for talquetamab.
Assuming a biweekly dosing schedule for teclistamab.
Assuming equal market shares of talquetamab and teclistamab (33% in year 1, 37% in year 2, and 37% in year 3).
Table 24: Detailed Breakdown of the CDA-AMC Reanalyses of the BIA
Stepped analysis | Scenario | Year 0 (current situation) ($) | Year 1 ($) | Year 2 ($) | Year 3 ($) | Three-year total ($) |
|---|---|---|---|---|---|---|
Submitted base case | Reference | 134,533,172 | 208,285,765 | 221,600,602 | 227,805,419 | 657,691,786 |
New drug | 134,533,172 | 218,307,906 | 234,828,660 | 241,471,156 | 694,607,722 | |
Budget impact | 0 | 10,022,141 | 13,228,058 | 13,665,738 | 36,915,936 | |
CDA-AMC base case | Reference | 230,593,241 | 316,765,249 | 402,066,218 | 458,481,637 | 1,177,313,104 |
New drug | 230,593,241 | 331,178,100 | 426,157,070 | 484,110,007 | 1,241,445,177 | |
Budget impact | 0 | 14,412,850 | 24,090,852 | 25,628,370 | 64,132,073 | |
CDA-AMC scenario 1: Weekly dosing schedule for talquetamab | Reference | 230,593,241 | 316,765,249 | 402,066,218 | 458,481,637 | 1,177,313,104 |
New drug | 230,593,241 | 336,697,386 | 432,306,507 | 488,592,142 | 1,257,596,035 | |
Budget impact | 0 | 19,932,137 | 30,240,288 | 30,110,505 | 80,282,930 | |
CDA-AMC scenario 2: Biweekly dosing schedule for teclistamab | Reference | 226,745,969 | 305,922,937 | 369,156,297 | 402,127,003 | 1,077,206,237 |
New drug | 226,745,969 | 323,570,993 | 403,565,160 | 446,093,493 | 1,173,229,646 | |
Budget impact | 0 | 17,648,057 | 34,408,862 | 43,966,490 | 96,023,409 | |
CDA-AMC scenario 3: Equal market shares for talquetamab and teclistamab | Reference | 230,593,241 | 316,765,249 | 402,066,218 | 458,481,637 | 1,177,313,104 |
New drug | 230,593,241 | 335,108,594 | 429,626,929 | 485,295,592 | 1,250,031,115 | |
Budget impact | 0 | 18,343,345 | 27,560,711 | 26,813,955 | 72,718,011 |
BIA = budget impact analysis; CDA-AMC = Canada’s Drug Agency.
ISSN: 2563-6596
Canada’s Drug Agency (CDA-AMC) is a pan-Canadian health organization. Created and funded by Canada’s federal, provincial, and territorial governments, we’re responsible for driving better coordination, alignment, and public value within Canada’s drug and health technology landscape. We provide Canada’s health system leaders with independent evidence and advice so they can make informed drug, health technology, and health system decisions, and we collaborate with national and international partners to enhance our collective impact.
Disclaimer: CDA-AMC has taken care to ensure that the information in this document was accurate, complete, and up to date when it was published, but does not make any guarantee to that effect. Your use of this information is subject to this disclaimer and the Terms of Use at cda-amc.ca.
The information in this document is made available for informational and educational purposes only and should not be used as a substitute for professional medical advice, the application of clinical judgment in respect of the care of a particular patient, or other professional judgments in any decision-making process. You assume full responsibility for the use of the information and rely on it at your own risk.
CDA-AMC does not endorse any information, drugs, therapies, treatments, products, processes, or services. The views and opinions of third parties published in this document do not necessarily reflect those of CDA-AMC. The copyright and other intellectual property rights in this document are owned by the Canadian Agency for Drugs and Technologies in Health (operating as CDA-AMC) and its licensors.
Questions or requests for information about this report can be directed to Requests@CDA-AMC.ca.