Drugs, Health Technologies, Health Systems
Reimbursement Review
Ciltacabtagene Autoleucel (Carvykti)
Sponsor: Janssen Inc.
Therapeutic area: Relapsed or refractory multiple myeloma
This multi-part report includes:
Clinical Review
Pharmacoeconomic Review
Ethics Review
Clinical Review
Abbreviations
ATC
average treatment effect on the controls
ATT
average treatment effect on the treated
CAR
chimeric antigen receptor
CCO
Cancer Care Ontario
CDA-AMC
Canada’s Drug Agency
CI
confidence interval
cilta-cel
ciltacabtagene autoleucel
CMRG
Canadian Myeloma Research Group
CPW
constant piecewise weighted
CR
complete response
CRS
cytokine release syndrome
DOR
duration of response
DPd
daratumumab-pomalidomide-dexamethasone
DRd
daratumumab-lenalidomide-dexamethasone
DVd
daratumumab-bortezomib-dexamethasone
ECOG PS
Eastern Cooperative Oncology Group performance status
ESS
effective sample size
FLC
free light chain
GRADE
Grading of Recommendations Assessment, Development, and Evaluation
HR
hazard ratio
HRQoL
health-related quality of life
ICANS
immune effector cell–associated neurotoxicity syndrome
IMiD
immunomodulatory drug
IMWG
International Myeloma Working Group
IPD
individual patient data
IPTW
inverse probability of treatment weighting
IsaKd
isatuximab-carfilzomib-dexamethasone
IsaPd
isatuximab-pomalidomide-dexamethasone
ISS
International Staging System
ITC
indirect treatment comparison
ITT
intention to treat
Kd
carfilzomib-dexamethasone
M protein
monoclonal protein
mAB
monoclonal antibody
MAIC
matching-adjusted indirect comparison
MGUS
monoclonal gammopathy of undetermined significance
MM
multiple myeloma
MRD
minimal residual disease
MySIm-Q
Multiple Myeloma Symptom and Impact Questionnaire
OH
Ontario Health
OR
odds ratio
ORR
overall response rate
OS
overall survival
Pd
pomalidomide-dexamethasone
PFS
progression-free survival
PI
proteasome inhibitor
PR
partial response
PVd
pomalidomide-bortezomib-dexamethasone
RCT
randomized controlled trial
RR
relative risk
RRMM
relapsed or refractory multiple myeloma
RVd
lenalidomide-bortezomib-dexamethasone
SAE
serious adverse event
sCR
stringent complete response
SOC
standard of care
SVd
selinexor-bortezomib-dexamethasone
TEAE
treatment-emergent adverse event
Vd
bortezomib-dexamethasone
VGPR
very good partial response
Executive Summary
An overview of the submission details for the drug under review is provided in Table 1.
Table 1: Background Information of Application Submitted for Review
Item | Description |
|---|---|
Drug product | Ciltacabtagene autoleucel (Carvykti), cell suspension in infusion bag, 0.5 × 10⁶ to 1.0 × 10⁶ CAR-positive viable T cells per kilogram of body weight, with a maximum of 1 × 10⁸ CAR-positive viable T cells, for IV infusion |
Sponsor | Janssen Inc. |
Indication | For the treatment of adult patients with multiple myeloma, who have received 1 to 3 prior lines of therapy including a proteasome inhibitor and an immunomodulatory agent, and who are refractory to lenalidomide |
Reimbursement request | As per indication |
Health Canada approval status | Under review |
Health Canada review pathway | Standard |
NOC date | July 19, 2024 |
Recommended dose | 0.5 × 10⁶ to 1.0 × 10⁶ CAR-positive viable T cells per kilogram of body weight, with a maximum dose of 1 × 10⁸ CAR-positive viable T cells per single infusion |
CAR = chimeric antigen receptor; NOC = Notice of Compliance.
Introduction
Multiple myeloma (MM) is a hematological malignancy characterized by clonal proliferation of malignant plasma cells (B-cells) driven by an oncologic event and consequent overproduction of the abnormal immunoglobulin monoclonal protein (M protein).1 The estimated number of newly diagnosed cases of MM in Canada was 4,000 in 2022 and 3,900 in 2023.2,3 Based on the reported MM prevalence in 2018 and the growing projected annual incidence rate, combined with a predicted 5-year survival rate, the projected prevalence of MM is estimated to be approximately 17,568 in Canada (excluding Quebec) in 2025.4 The majority of patients with MM will relapse, and many patients will develop disease that is refractory to commonly used therapies. Patients with relapsed or refractory MM (RRMM) often undergo multiple rounds of treatment, with the duration of remission, depth of response, progression-free survival (PFS), and overall survival (OS) decreasing with each subsequent line of therapy.5-8 According to the clinical experts and clinician groups, the main treatment goals for patients with RRMM are to prolong survival, improve symptoms, minimize toxicities, and improve health-related quality of life (HRQoL).Therapies for the treatment of patients with RRMM, and the sequencing of these treatments, depends on eligibility for autologous stem cell transplant at diagnosis, patient age, comorbidities, previous treatments, beforexicities, and line of therapy. Available treatment options for patients with RRMM in Canada include triplet therapy — consisting of proteasome inhibitors (PIs), immunomodulatory drugs (IMiDs), or monoclonal antibodies (mABs) — and chimeric antigen receptor (CAR) T-cell therapy (i.e., ciltacabtagene autoleucel [cilta-cel], which is under consideration for negotiation at the pan-Canadian Pharmaceutical Alliance).9,10
The objective of this report is to review and critically appraise the evidence submitted by the sponsor on the beneficial and harmful effects of cilta-cel, cell suspension in infusion bag, 0.5 × 10⁶ to 1.0 × 10⁶ CAR-positive viable T cells per kilogram of body weight, with a maximum of 1 × 10⁸ CAR-positive viable T cells, for IV infusion in the treatment of RRMM in adult patients.
Cilta-cel was previously reviewed by CADTH for the treatment of adult patients with RRMM who have received at least 3 prior lines of therapy, including a PI, an IMiD, and an anti-CD38 mAB, and whose disease is refractory to their last treatment.11
Perspectives of Patients, Clinicians, and Drug Programs
The information in this section is a summary of the input provided by the patient and clinician groups who responded to the Canada’s Drug Agency (CDA-AMC) call for input and from clinical expert(s) consulted for the purpose of this review.
Patient Input
CDA-AMC received 1 patient group submission, from Myeloma Canada. Myeloma Canada is a patient advocacy group that supports patients diagnosed with MM living in Canada.
Myeloma Canada collected data from patients with RRMM who had received 1 to 3 prior lines of therapy and whose disease was refractory to lenalidomide or who had experience with a CAR T-cell therapy, or from the caregivers of such patients, through a survey across Canada and internationally, via email and social media from April 5, 2024, to April 24, 2024. There were 53 eligible respondents; 51 lived in Canada (Alberta [3], British Columbia [12], Newfoundland and Labrador [2], Ontario [29], Quebec [5]), and 2 lived in France. There were 2 subsets of survey respondents: 1 subset comprised 37 patients or caregivers who met the criteria for the indication under review, and the other comprised 16 respondents who had CAR T-cell therapy experience, of which 8 patients or caregivers had experience with cilta-cel and 8 patients or caregivers had experience with a different CAR T-cell therapy.
In terms of MM disease complications, infections were considered the most important aspect to control, followed by kidney problems. Patients and/or caregivers also reported that MM had various impacts on their quality of life, such as limiting their ability to travel and their pursuit of life goals or accomplishments. Most patients and caregivers identified a need for effective MM treatment options, with manageable side effects and minimal impact on quality of life. Of the 37 patients or caregivers who met the criteria of the indication under review, 22 reported receiving 3 lines of therapy and 2 reported treatment with B-cell maturation antigen–targeted therapy. The experiences shared by patients or caregivers who received CAR T-cell therapy were generally positive. Of the 8 respondents who received cilta-cel, 5 rated the treatment extremely effective and the side effects extremely tolerable. Cytokine release syndrome (CRS) was perceived to be the most concerning side effect by patients who met the criteria for the indication under review. However, it was considered bearable for respondents who had received cilta-cel. Twenty-eight respondents out of the 37 found that an estimated minimum 1.25 years of extended life without needing active treatment to control myeloma was extremely desirable.
Myeloma Canada re-emphasized that cilta-cel is a therapy well understood by patients and caregivers but that it is also an expensive and resource-intensive therapy. The survey responses indicate that access to cilta-cel is currently difficult for patients in Canada, leading some patients to seek treatment outside the country.
Clinician Input
Input From Clinical Experts Consulted by CDA-AMC
Unmet Needs
According to the clinical experts, the most important goal of treating patients with RRMM is to control disease with minimal toxicities, given that there are no curative therapies currently. The clinical experts indicated that patients with MM commonly experience drug resistance to each line of therapy, with progressively shorter durations of response. Additionally, the clinical experts highlighted that a treatment-free interval would be valuable to improve quality of life for patients, given that the current treatments for MM often require weekly or even twice-weekly injections, which is an inconvenience for patients. Therefore, the clinical experts stated that more treatment options are needed that work through novel pathways and can enhance and prolong treatment response with fewer side effects and improved convenience.
Place in Therapy
The clinical experts indicated that cilta-cel would be an additional option for the management of patients with MM whose disease is refractory to lenalidomide or who have been exposed to lenalidomide. The clinical experts confirmed that the proposed place in therapy (i.e., second to fourth line) is reflective of anticipated clinical practice in Canada. In general terms, for patients who are eligible for transplant, the clinical experts considered an mAB-based therapy (e.g., isatuximab-carfilzomib-dexamethasone [IsaKd] or daratumumab-bortezomib-dexamethasone [DVd]) as the preferred second-line treatment for patients who experience relapse after lenalidomide-bortezomib-dexamethasone (RVd) in the first line. Thus, cilta-cel may be preferred in the third line or later. However, cilta-cel could be a preferred second-line treatment for a small percentage (about 10%) of patients, such as those with higher-risk genetics or disease who received daratumumab-RVd in the first line. For patients who are not eligible for transplant, the clinical experts would promote cilta-cel as a second-line treatment but noted that, in clinical practice, most patients (80% to 90%) would receive daratumumab-lenalidomide-dexamethasone (DRd) as the first-line treatment, which would mean they are not eligible for cilta-cel in the second line. Generally, the clinical experts would not limit access to cilta-cel by mandating trying other treatments first, given that exposure to cilta-cel earlier in a patient’s disease course typically results in healthier and less exhausted T cells.
Patient Population
The clinical experts confirmed that the patients included in the CARTITUDE-4 trial are generally reflective of the patient population with MM in clinical practice in Canada. According to the clinical experts, given there is no companion test required and no established biomarker to identify those who may be most likely to benefit from cilta-cel, patients best suited for the treatment with cilta-cel would be identified through the professional judgment of physicians. Currently, as per feedback from the clinical experts, highly specialized testing, such as additional detailed genetic testing, is not widely available and not likely to become so in the near future.
Assessing the Response to Treatment
The clinical experts stated that standard clinical assessments of urine, blood, scans, and bone marrow are used to document response or relapse. These assessments include urine and serum protein electrophoresis and immune fixation, serum free light chains (FLCs), complete blood count, creatinine, calcium, and imaging (MRI, CT, PET-CT). The clinical experts mentioned that patient visits and blood assessments are usually done monthly initially and are then reduced to every 3 months for patients in remission and without symptoms. Imaging can be done with the onset of new symptoms or annually.
Discontinuing Treatment
As cilta-cel is a 1-time treatment, the clinical experts indicated that stopping treatment is not applicable.
Prescribing Considerations
The clinical experts stated that cilta-cel should be administered in qualified institutions that are capable of properly handling patient cells, including their acquisition, storage, and shipment. Additionally, the clinical experts indicated that specialized centres administering CAR T-cell therapy are required to have processes in place to manage acute toxicities occurring, usually, within the first 28 days postinfusion; examples include CRS (which, if present, requires intensive care to be available) and neurotoxicity (which, if present, requires neurologic care to be available). The management of patients with MM undergoing CAR T-cell therapy requires ongoing monitoring of immunity, revaccination, and immunoglobulin therapy administration according to the clinical experts.
Clinician Group Input
CDA-AMC received input from 2 clinician groups: 1 submission from the Ontario Health (OH)-Cancer Care Ontario (CCO) Hematology Cancer Drug Advisory Committee, which provides timely evidence-based clinical and health system guidance on drug-related issues in support of CCO’s mandate, including the Provincial Drug Reimbursement Programs and the Systemic Treatment Program, and 1 submission from the Canadian Myeloma Research Group (CMRG), a Canada-wide network of researchers aiming to develop better treatments to extend the life of myeloma patients, enhancing the quality of life for those living with myeloma and related disorders, and working to find a cure for these diseases and other plasma cell disorders. Both groups gathered information via teleconference.
OH-CCO indicated that cilta-cel is an option as second-line treatment for patients who are eligible for transplant or likely as third-line treatment for patients who are not eligible for transplant as they would get daratumumab in the first line. CMRG also emphasized that the availability of cilta-cel in the proposed setting would pertain primarily to patients who have had 2 prior lines of treatment; they may or not may not have already received an anti-CD38 mAB as well in the current treatment environment. CMRG further commented that the highest unmet need in myeloma continues to be adequate treatment for patients who have experienced disease progression despite exposure to an effective drug (for example, patients whose disease is triple-class refractory to an IMiD, PI, and anti-CD38 mAB). As combinations of these 3 major drug classes are increasingly used in first-line and second-line treatment, patients are now developing resistance to multiple drug classes much earlier in the disease course. OH-CCO also mentioned that patients who had been exposed to anti-CD38 mAB particularly had poor outcomes.
OH-CCO considered that improved response, quality of life, disease-related symptoms, PFS, and OS are important outcomes. CMRG highlighted that cilta-cel produces unprecedented rates of response that are deeper than standard regimens; specifically, the rates of complete response (CR) and stringent CR (sCR) are on the order of 70% to 75%, compared to 20% with standard therapy.
Both groups agreed that cilta-cel should be delivered at tertiary hospitals or transplant centres with expertise in cellular therapy with an intensive care unit familiar with patients with cancer who are immunosuppressed and an outpatient facility experienced in handling complex and urgent hematologic problems.
Drug Program Input
Input was obtained from the drug programs that participate in the reimbursement review process. The following were identified as key factors that could potentially affect the implementation of a recommendation for cilta-cel: relevant comparators, considerations for initiation of therapy, considerations for prescribing of therapy, generalizability, funding algorithm, care provision issues, and system and economic issues.
The clinical experts consulted for the purpose of this review provided advice on the potential implementation issues raised by the drug programs. Refer to Table 4 for more details.
Clinical Evidence
Systematic Review
Description of Studies
One pivotal trial (the CARTITUDE-4 trial) was included in the systematic review. The CARTITUDE-4 trial is an ongoing phase III, open-label, randomized, multicentre study to evaluate the efficacy and safety of cilta-cel compared to physician’s choice of standard-of-care (SOC) therapies of either pomalidomide-bortezomib-dexamethasone (PVd) or daratumumab-pomalidomide-dexamethasone (DPd) in patients with RRMM who have received 1 to 3 prior lines of therapy. The CARTITUDE-4 trial enrolled adults who had a documented diagnosis of MM according to International Myeloma Working Group (IMWG) diagnostic criteria, had received 1 to 3 prior lines of therapy, including a PI and an IMiD, and whose disease was refractory to lenalidomide per IMWG consensus guidelines. A total of 419 eligible patients were randomized at a 1:1 ratio to receive either cilta-cel (n = 208) or standard therapy with PVd or DPd (n = 211). Randomization was stratified by physician’s choice of PVd or DPd, international staging system (ISS) disease stage at screening (I, II, or III), and number of prior lines of therapy (1 versus 2 to 3). The median age of all study participants was 61.0 years, with a range of 27 years to 80 years. The demographic characteristics and disease history were balanced between treatment groups. At baseline, most of the participants were at ISS disease stage I (64.0%), had had 2 lines of therapy (40.9%), and had at least 1 high-risk cytogenetic abnormality (61.2%), with gain/amp(1q) being the most-reported abnormality (47.0%) in all patients. The primary objective of the study was to compare the efficacy of cilta-cel with SOC of either PVd or DPd in terms of PFS in patients with relapsed and lenalidomide-refractory MM. The primary end point was PFS according to a computerized algorithm per IMWG criteria, and secondary and other end points included CR or better rate, very good partial response (VGPR) or better rate, overall response rate (ORR), minimal residual disease (MRD) negativity rate, OS, duration of response (DOR), and HRQoL. The study was funded by Janssen and Legend Biotech.
Efficacy Results
Only those efficacy outcomes identified as important for this review are reported. Efficacy and safety data were evaluated at a planned interim analysis with data cut-off date of November 1, 2022.
Progression-Free Survival
In the interim analysis, 65 patients (31.3%) in the cilta-cel treatment group and 122 patients (57.8%) in the SOC group experienced an event. With a median follow-up of 15.8 months in the cilta-cel group and 15.3 months in the SOC group, the median PFS was not reached (95% confidence interval [CI], 22.8 months to not estimable) for the cilta-cel group and was 11.8 months (95% CI, 9.7 months to 13.8 months) for the SOC group. The Kaplan-Meier estimate of PFS probabilities decreased from 75.9% (95% CI, 69.4% to 81.1%) ██ █████ ████ ███ █████ ██ ██████ in the cilta-cel group and 48.6% (95% CI, 41.5% to 55.3%) to █████ ████ ███ ████ ██ ██████ in the SOC group from 12 to 24 months. The PFS results were consistent across all prespecified and additional sensitivity analyses and subgroup results.
CR or Better Rate
The CR or better rate was higher in the cilta-cel group than in the SOC group (73.1% versus 21.8% for cilta-cel versus SOC; odds ratio [OR] = 10.3; 95% CI, 6.5 to 16.4; P < 0.0001).
VGPR or Better Rate
A total of 169 patients (81.3%) in the cilta-cel group and 96 patients (45.5%) in the SOC group reported a VGPR or better (OR = 5.9; 95% CI, 3.7 to 9.4; nominal P < 0.0001).
Overall MRD Negativity Rate
A higher proportion of patients in the cilta-cel group than in the SOC group were reported to have negative overall MRD by next-generation sequencing in bone marrow (60.6% versus 15.6% for cilta-cel versus SOC; OR = 8.7; 95% CI, 5.4 to 13.9; P < 0.0001).
Overall Survival
With a median follow-up of 16.0 months for the cilta-cel group and 15.9 months for the SOC group, median OS was not reached in the cilta-cel group and was 26.7 months (95% CI, 22.5 months to not estimable) in the SOC group. The Kaplan-Meier estimate of OS probabilities decreased from 84.1% (95% CI, 78.4% to 88.4%) to █████ ████ ███ █████ ██ ██████ in the cilta-cel group and from 83.6% (95% CI, 77.8% to 88.0%) ██ █████ ████ ███ █████ ██ ██████ in the SOC group from 12 to 24 months.
Duration of Response
With a median follow-up of 13.7 months for the cilta-cel group and 14.3 months for the SOC group, the median DOR was not reached in the cilta-cel group and was 16.6 months (95% CI, 28.9 months to not estimable) in the SOC group. Among patients who had a partial response (PR) or better (176 versus 142 for cilta-cel versus SOC), 143 patients (81.3%) in the cilta-cel group and 80 patients (56.3%) in the SOC group were censored. The Kaplan-Meier estimate of event-free probabilities decreased from 84.7% (95% CI, 78.1% to 89.4%) to █████ ████ ███ █████ ██ ██████ in the cilta-cel group and from 63.0% (95% CI, 54.2% to 70.6%) to █████ ████ ███ █████ ██ ██████ in the SOC group from 12 to 24 months.
Time to Worsening of Symptoms in the Multiple Myeloma Symptom and Impact Questionnaire Total Symptom Score
The median time to a sustained worsening of MM symptoms was longer for the cilta-cel group (23.7 months) than for the SOC group (18.9 months), with a hazard ratio (HR) of 0.42 (95% CI, 0.26 to 0.68; nominal P = 0.0003). The Kaplan-Meier estimate of event-free probabilities decreased from 84.6% (95% CI, 77.7% to 89.6%) to 79.8% (95% CI, 69.6% to 86.9%) in the cilta-cel group and from 65.6% (95% CI, 55.2% to 74.2%) to 51.9% (95% CI, 34.5% to 66.8%) in the SOC group from 12 to 18 months.
Harms Results
All patients in both treatment groups reported at least 1 treatment-emergent adverse event (TEAE) in the interim analysis (data cut-off: November 1, 2022). The most commonly reported adverse events (i.e., reported by at least 20% of patients in either group) were blood and lymphatic system disorders, including neutropenia (89.9% versus 85.1% for cilta-cel versus SOC); immune system disorders (77.5% versus 8.2%); gastrointestinal disorders (74.0% versus 55.8%); thrombocytopenia (54.3% versus 31.3%); and anemia (54.3% versus 26.0%). Serious adverse events (SAEs) were reported among 44.2% of patients in cilta-cel group and 38.9% of patients in the SOC group. Infections and infestations (24.0% versus 24.5%), including COVID-19 pneumonia (5.8% versus 4.3%), was the most reported SAE. Withdrawals due to TEAEs were reported among | ████████ █████ in the cilta-cel group and ██ ████████ ███████ in the SOC group. The sponsor and/or the clinical experts identified notable harms as including CRS, neurotoxicity (including immune effector cell–associated neurotoxicity syndrome [ICANS]), B-cell aplasia, hypogammaglobulinemia, and immune suppression. CRS was reported for 76.1% patients in the cilta-cel group (134 of 176 patients), with the majority (52.8%) being grade 1. Only 2 patients (1.1%) experienced grade 3 CRS, and no grade 4 or 5 CRS was reported. In total, 36 patients (20.5%) from the cilta-cel group experienced CAR T-cell neurotoxicity, including ICANS in 8 patients (4.5%). Among the 8 patients with ICANS, 6 patients (3.4%) had grade 1 events and 2 patients (1.1%) had grade 2 events. Hypogammaglobulinemia was observed in 88 of 202 patients (42.3%) in the cilta-cel group and 13 of 202 patients (6.3%) in the SOC group, with 15 patients (7.2%) in the cilta-cel group and 1 patient (0.5%) in the SOC group experiencing grade 3 or 4 hypogammaglobulinemia. Immune suppression was observed in 186 patients (89.4%) in the cilta-cel group and 182 patients (87.5%) in the SOC group. No data for B-cell aplasia were reported.
Critical Appraisal
In the CARTITUDE-4 trial, at baseline, higher proportions of patients received concomitant antimicrobial and antiviral medications, normal human immunoglobulin, serotonin (5-HT3) antagonists, paracetamol, and enoxaparin in the cilta-cel group than in the SOC group, some of which might have had an impact on the frequency of reported adverse events in the cilta-cel group. Additionally, patients in the cilta-cel group reported more frequent concomitant use of interleukin inhibitors than patients in the SOC group. According to the clinical experts, interleukin inhibitors are immunosuppressants, which could decrease T-cell function, which may bias the efficacy results against cilta-cel. Fewer patients received subsequent anticancer treatment in the cilta-cel group than in the SOC group; the review team agreed with the clinical experts that this would bias the study’s subsequent OS results against cilta-cel. A higher proportion of patients in the cilta-cel group discontinued and did not receive the study treatment than in the SOC group (██████ ███ ████ for cilta-cel versus SOC). The review team noted that the differential imbalance in the baseline characteristics of the patients who discontinued treatment between the 2 groups could have been a source of attrition bias against the cilta-cel group.
As the CARTITUDE-4 trial is ongoing, results were only available from the interim analysis (data cut-off: November 1, 2022), and the median PFS and median OS had not been reached in the cilta-cel group at the time of the interim analysis. Although results from the sponsor-conducted subsequent OS analysis (data cut-off: December 13, 2023) indicated a trend favouring OS benefit for the cilta-cel group compared to the SOC group, the median OS was still not yet reached at this time. Moreover, the statistical testing of the subsequent OS analysis was not controlled for the overall type I error; therefore, the results were descriptive and should be considered as supportive data. Many of the outcomes used in the CARTITUDE-4 trial (PFS, OS, CR or better rate, VGPR or better rate, ORR, and DOR) were identified as clinically important by patients and/or clinicians. However, VGPR or better rate and DOR were not part of the statistical testing strategy and thus were not adjusted for multiple testing; therefore, the ability to draw conclusions from these data may be limited.
It is uncertain to what extent the observed OS, patient-reported HRQoL, and disease symptom results from the CARTITUDE-4 trial could be generalized to clinical practice in Canada considering the limited representativeness of the study population due to restrictive eligibility criteria and comparators. The eligibility criteria for the CARTITUDE-4 trial excluded a small group of patients (less than 5%) with symptomatic MM who did not have measurable disease and patients with an Eastern Cooperative Oncology Group performance status (ECOG PS) of 2. The clinical experts opined that those patients would not necessarily be excluded from eligibility for cilta-cel. The clinical experts noted that patients who have confirmed relapsed disease, even if nonsecretory, may still benefit from therapy with cilta-cel. Those with an ECOG PS of 2, especially if the poor performance score is due to myeloma disease burden, may also benefit. Careful consideration of overall health and ability to withstand acute toxicities such as CRS would be important. The comparators used in the trial (i.e., PVd and DPd) may not be exactly reflective of the current clinical practice in Canada, and there was no study site in Canada in the CARTITUDE-4 trial. However, comparable triplet regimens are used; thus, findings are relevant to clinical practice in Canada. Patient and clinician groups indicated that prolonging PFS and OS, delaying progression, maintaining HRQoL, and controlling the symptoms of the disease were critical treatment considerations.
GRADE Summary of Findings and Certainty of the Evidence
For the pivotal CARTITUDE-4 trial identified in the sponsor’s systematic review, Grading of Recommendations Assessment, Development and Evaluation (GRADE) was used to assess the certainty of the evidence for the outcomes considered most relevant to inform expert committee deliberations, and a final certainty rating was determined as outlined by the GRADE Working Group.12,13 Following the GRADE approach, evidence from randomized controlled trials (RCTs) started as high-certainty evidence and could be rated down for concerns related to study limitations (which refer to internal validity or risk of bias), inconsistency across studies, indirectness, imprecision of effects, and publication bias.
The selection of outcomes for GRADE assessment was based on the sponsor’s summary of clinical evidence, consultation with clinical experts, and input received from patient and clinician groups and public drug plans. The following list of outcomes was finalized in consultation with expert committee members: PFS, CR or better rate, VGPR or better rate, overall MRD negativity rate, OS, DOR, HRQoL, and SAEs. As per feedback from the clinical experts, ORR was not used in the GRADE assessment as it represents patients with any type of response, which may not be as informative as the CR or better rate or the VGPR or better rate in providing clinically relevant information as an efficacy outcome.
Table 2: Summary of Findings for Cilta-Cel Versus SOC for Patients With RRMM
Outcome and follow-up | Patients (studies), N | Relative effect (95% CI) | Absolute effects (95% CI) | Certainty | What happens | ||
|---|---|---|---|---|---|---|---|
SOC | Cilta-cel | Difference | |||||
PFS | |||||||
Probability of being alive and progression-free at 12 months Follow-up (median): Cilta-cel: 15.8 months SOC: 15.3 months | 419 (1 RCT) | NR | 486 per 1,000 | 759 per 1,000 (694 to 811 per 1,000) | ███ ███ █████ ████ ██ ███ ███ ██████ | Moderatea | Cilta-cel likely results in a clinically important higher probability of patients being alive and progression-free at 12 months compared with SOC. |
Probability of being alive and progression-free at 24 months Follow-up (median): Cilta-cel: 15.8 months SOC: 15.3 months | 419 (1 RCT) | NR | ███ ███ █████ | ███ ███ █████ ████ ██ ███ ███ ██████ | NAb | Moderatea | Cilta-cel likely results in a clinically important higher probability of patients being alive and progression-free at 24 months compared with SOC. |
Overall best confirmed response | |||||||
The proportion of patients who experienced a CR or sCR Follow-up (median): Cilta-cel: 15.8 months SOC: 15.3 months | 419 (1 RCT) | OR = 10.3 (6.5 to 16.4) | 218 per 1,000 | 731 per 1,000 (665 to 790 per 1,000) | ███ ███ █████ ████ ██ ███ ███ ██████ | Highc | Cilta-cel results in an increase in CR or better rate compared with SOC. The clinical importance of the increase is unclear. |
The proportion of patients who experienced a CR, sCR, or VGPR Follow-up (median): Cilta-cel: 15.8 months SOC: 15.3 months | 419 (1 RCT) | ██ █ ███ ████ ██ ███ | ███ ███ █████ | ███ ███ █████ ████ ██ ███ ███ ██████ | ███ ███ █████ ████ ██ ███ ███ ██████ | Highc,d | Cilta-cel results in an increase in VGPR or better rate compared with SOC. The clinical importance of the increase is unclear. |
Overall MRD negativity rate at 10-5 in bone marrow | |||||||
The proportion of patients who experienced overall MRD-negative status (at 10-5) Follow-up (median): Cilta-cel: 10.9 months SOC: 12.3 months | 419 (1 RCT) | OR = 8.7 (5.4 to 13.9) | 156 per 1,000 | 606 per 1,000 (536 to 673 per 1,000) | ███ ███ █████ ████ ██ ███ ███ ██████ | Highc | Cilta-cel results in an increase in overall MRD negativity rate compared with SOC. The clinical importance of the increase is unclear. |
Overall survival | |||||||
Probability of being alive at 12 months Follow-up (median): Cilta-cel: 16.0 months SOC: 15.9 months | 419 (1 RCT) | NR | 836 per 1,000 | 841 per 1,000 (784 to 884 per 1,000) | ███ █████ ███ █████ ██ ██ ████ ███ ██████ | Moderatee | Cilta-cel likely results in little to no difference in the probability of being alive at 12 months. |
Probability of being alive at 24 months Follow-up (median): Cilta-cel: 16.0 months SOC: 15.9 months | 419 (1 RCT) | NR | ███ ███ █████ | ███ ███ █████ ████ ██ ███ ███ ██████ | NAa | Moderatee | Cilta-cel likely results in little to no difference in the probability of being alive at 24 months. |
Duration of response | |||||||
Probability of remaining in response (CR, sCR, VGPR, or PR) at 12 months Follow-up (median): Cilta-cel: 13.7 months SOC: 14.3 months | 419 (1 RCT) | NR | 630 per 1,000 | 847 per 1,000 (781 to 894 per 1,000) | ███ ███ █████ ████ ██ ███ ███ █████ | Highc | Cilta-cel results in an increase in the probability of remaining in response (CR, sCR, VGPR, or PR) at 12 months compared with SOC. The clinical importance of the increase is unclear. |
Probability of remaining in response (CR, sCR, VGPR, or PR) at 24 months Follow-up (median): Cilta-cel: 13.7 months SOC: 14.3 months | 419 (1 RCT) | NR | ███ ███ █████ | ███ ███ █████ ████ ██ ███ ███ ██████ | NAa | Highc,f | Cilta-cel results in an increase in the probability of remaining in response (CR, sCR, VGPR, or PR) at 24 months compared with SOC. The clinical importance of the increase is unclear. |
Health-related quality of life | |||||||
Probability of having subsequent improvement in the MySIm-Q total symptom score at 12 months Follow-up (median): Cilta-cel: 12.4 months SOC: 12.0 months | 419 (1 RCT) | NR | 656 per 1,000 | 846 per 1,000 (777 to 896 per 1,000) | ███ ███ █████ ███ ██ ███ ███ ██████ | Moderatec,g | Cilta-cel likely results in an increase in the probability of having subsequent improvement in the MySIm-Q total symptom score at 12 months compared with SOC. The clinical importance of the increase is unclear. |
Probability of having subsequent improvement in the MySIm-Q total symptom score at 18 months Follow-up (median): Cilta-cel: 12.4 months SOC: 12.0 months | 419 (1 RCT) | NR | ███ ███ █████ | ███ ███ █████ ████ ██ ███ ███ ██████ | ███ ███ █████ ███ ██ ███ ███ ██████ | Moderatec,g | Cilta-cel likely results in an increase in the probability of having subsequent improvement in the MySIm-Q total symptom score at 18 months compared with SOC. The clinical importance of the increase is unclear. |
SAEs | |||||||
Proportion of patients with at least 1 SAE Follow-up (median): Cilta-cel: NR SOC: NR | 416 (1 RCT) | NR | 389 per 1,000 | 442 per 1,000 (NR) | ██ ███ █████ ███ █████ ██ ███ ████ ███ █████ | Lowh | Cilta-cel may result in little to no difference in the proportion of patients with at least 1 SAE compared with SOC. |
CI = confidence interval; cilta-cel = ciltacabtagene autoleucel; CR = complete response; MID = minimal important difference; MRD = minimal residual disease; MySIm-Q = Multiple Myeloma Symptom and Impact Questionnaire; NA = not available; NR = not reported; OR = odds ratio; PFS = progression-free survival; PR = partial response; RCT = randomized controlled trial; RRMM = relapsed or refractory multiple myeloma; sCR = stringent complete response; SAE = serious adverse event; SOC = standard of care; VGPR = very good partial response.
Note: Study limitations (which refer to internal validity or risk of bias), inconsistency across studies, indirectness, imprecision of effects, and publication bias were considered when assessing the certainty of the evidence. All serious concerns in these domains that led to the rating down of the level of certainty are documented in the table footnotes.
aRated down 1 level for serious imprecision. There is no established between-group MID for PFS at 12 months, but the clinical experts considered that a 20% difference between groups in the probability of patients being alive and progression-free could be considered a threshold of clinical importance. The point estimate and the upper bound of the 95% CI for the between-group difference suggested a clinically important difference for cilta-cel vs. SOC based on a 20% threshold, while the lower bound of the 95% CI suggested no clinically important difference between the 2 groups. In the absence of available data for the between-group difference in PFS probabilities at 24 months, the judgment of imprecision was based on the point estimates per different groups using the null as the threshold. The clinical importance of the between-group difference was judged based on the input of the clinical experts and the observed trend of differences, which was consistent with that at 12 months.
bThe estimates of between-group difference were not available. The sponsor indicated that the 24-month PFS, OS, and DOR data were immature given that the median follow-up of study duration was 15.9 months at the interim analysis.
cImprecision was not rated down. There is no established MID, and the clinical experts could not provide a threshold of important difference, so the target of the certainty appraisal was any effect for the outcome.
dThe statistical testing for VGPR or better rate was not adjusted for multiplicity in the CARTITUDE-4 trial and should be considered as supportive evidence.
eRated down 1 level for serious imprecision. There is no established MID, and the clinical experts could not provide a threshold of important difference, so the target of the certainty appraisal was any effect for overall survival. At 12 months, the lower bound of the 95% CI for the between-group difference was below zero, while the upper bound was above zero, suggesting no clinically important difference between the 2 groups. At 24 months, given that the between-group difference in overall survival probabilities was not available due to the immaturity of the data, as indicated by the sponsor, the judgment of imprecision was based on the point estimates per different groups using the null as the threshold and the observed trend of differences, which was similar to that at 12 months.
fImprecision was not rated down. There is no established MID, and the clinical experts could not provide a threshold of important difference, so the target of the certainty appraisal was any effect for the outcome. In the absence of available data for the between-group difference in the probability of remaining in response (CR, sCR, VGPR, or PR) at 24 months, the judgment of imprecision was based on the point estimates per different groups using the null as the threshold.
gRated down 1 level for serious risk of bias. Consistently and notably higher proportions of patients in the cilta-cel group than in the SOC group received various concomitant therapies for the control of various clinical symptoms or disorders associated with the increased incidence of adverse events. Given that the frequency and/or severity of adverse events might significantly affect patients’ HRQoL, including daily functions, the imbalances in concomitant medications may bias the HRQoL results in favour of cilta-cel.
hRated down 2 levels for very serious imprecision. There is no established MID, and the clinical experts suggested that 10% is the threshold of important difference in the proportion of patients with at least 1 SAE. The point estimate and lower bound of the 95% CI for the between-group difference suggested no clinically important difference between the groups; the upper bound of the 95% CI for difference between groups suggested a clinically important harm of cilta-cel.
Source: 2023 primary Clinical Study Report for CARTITUDE-4 trial14 and sponsor-provided additional data.15,16 Details included in the table are from the sponsor’s summary of clinical evidence.17
Long-Term Extension Studies
No long-term extension studies were submitted for this review.
Indirect Comparisons
Description of Studies
Two reports of indirect treatment comparison (ITC) analyses were submitted by the sponsor. One ITC report was based on the inverse probability of treatment weighting (IPTW) analyses, in which individual patient data (IPD) from daratumumab trials including the CANDOR (carfilzomib-dexamethasone [Kd]), CASTOR (bortezomib-dexamethasone [Vd], DVd), and APOLLO (pomalidomide-dexamethasone [Pd]) trials were matched to the eligibility criteria of CARTITUDE-4 trial to inform the comparison to cilta-cel. Another ITC report presented unanchored matching-adjusted indirect comparison (MAIC) analyses, matching IPD from the cilta-cel group of the CARTITUDE-4 trial to the isatuximab-pomalidomide-dexamethasone (IsaPd) group of the ICARIA-MM trial and the selinexor-bortezomib-dexamethasone (SVd) group of the BOSTON trial. The comparative treatment effect on outcomes of interest was reported, including tumour response outcomes (ORR, VGPR or better, CR or better) and survival outcomes (PFS and OS). The base-case scenario for tumour response and PFS outcomes incorporated 4 variables in the IPTW analyses (refractory status, ISS disease stage, presence of plasmacytomas or extramedullary disease, time to progression on prior line) and 3 variables in the MAIC analyses (refractory status, cytogenetic risk, ISS disease stage). Assessment of OS was conducted via multivariable regression, with 14 prognostic variables used for adjustment.
In the IPTW analyses, the CARTITUDE-4 study data excluded patients with prior anti-CD38 mAB therapy, leading to a sample size of 155 patients for the comparative analyses. The comparator treatment populations consisted of the following cohorts: 44 patients treated with DVd (CASTOR trial), 46 patients treated with Vd (CASTOR trial), 46 patients treated with Kd (CANDOR trial), and 92 patients treated with Pd (APOLLO trial).
In the MAIC analysis, the CARTITUDE-4 study initially consisted of 208 patients who were treated with cilta-cel. The number of patients in the IsaPd and SVd cohorts was 154 and 53, respectively. Following MAIC adjustment, the cilta-cel effective sample size (ESS) was 26 for the comparison to IsaPd (ICARIA-MM trial) and 188 for the comparison to SVd (BOSTON trial).
Efficacy Results
Progression-Free Survival
IPTW-Based Analyses
The observed median PFS for cilta-cel was not reached. The observed median PFS for DVd, Vd, Kd, and Pd was 7.59 months (95% CI, 6.51 to 11.17 months), 4.93 months (95% CI, 3.98 to 6.57 months), 12.01 months (95% CI, 7.43 to 15.26 months), and 6.93 months (95% CI, 4.73 to 9.53 months), respectively. The median PFS using IPTW was 9.79 months (95% CI, 6.51 to 13.40 months) for DVd, 6.21 months (95% CI, 3.84 to 7.03 months) for Vd, 11.09 months (95% CI, 3.98 to 15.26 months) for Kd, and 8.34 months (95% CI, 2.14 to 9.26 months) for Pd.
Following IPTW adjustment, the conditional HR for PFS between cilta-cel and Kd was 0.27 (95% CI, 0.16 to 0.45), between cilta-cel and Pd was 0.19 (95% CI, 0.13 to 0.30), between cilta-cel and Vd was 0.11 (95% CI, 0.07 to 0.17), and between cilta-cel and DVd was 0.25 (95% CI, 0.15 to 0.41), all favouring cilta-cel.
Unanchored MAIC Analyses
The median adjusted PFS for cilta-cel was not reached. The median PFS for IsaPd and SVd was █████ ██████ ████ ███ ████ ██ ██████ and ████ ██████ ████ ███ ████ ██ ███████ respectively.
The MAIC-adjusted HR for PFS between treatment groups was 0.32 (95% CI, 0.15 to 0.70) in the cilta-cel versus IsaPd comparison and ████ ████ ███ ████ ██ █████ | in the cilta-cel versus SVd comparison.
Overall Survival
IPTW-Based Analyses
The observed median OS for cilta-cel and Kd was not reached. The observed median OS for DVd, Vd, and Pd was █████ ██████ ████ ███ █████ ██ ██████, █████ ██████ ████ ███ █████ ██ ███████ and █████ ██████ ████ ███ █████ ██ ███████ respectively.
Following adjustment, the conditional HR for OS between cilta-cel and Kd was ████ ████ ███ ████ ██ █████, between cilta-cel and Pd was ████ ████ ███ ████ ██ █████, between cilta-cel and Vd was ████ ████ ███ ████ ██ ████, and between cilta-cel and DVd was ████ ████ ███ ████ ██ ██████.
Unanchored MAIC Analyses
The median OS for cilta-cel was not reached. The median OS for IsaPd and SVd was ████ ██████ ████ ███ ████ ██ █████ and ████ ██████ ████ ███ ████ ██ ████ respectively. The adjusted HR for OS was ████ ████ ███ ████ ██ ████ in the cilta-cel versus IsaPd comparison and ████ ████ ███ ████ ██ █████ in the cilta-cel versus SVd comparison.
Overall Response Rate
IPTW-Based Analyses
The observed ORR in the treatment populations was 89.7% for cilta-cel, 76.1% for Kd, 42.4% for Pd, 54.4% for Vd, and 72.7% for DVd. The IPTW-estimated relative risk (RR) was 1.32 (95% CI, 0.99 to 1.74) for cilta-cel versus Kd, 2.00 (95% CI, 1.31 to 3.06) for cilta-cel versus Pd, 1.77 (95% CI, 1.19 to 2.65) for cilta-cel versus Vd, and 1.38 (95% CI, 0.86 to 2.20) for cilta-cel versus DVd.
Unanchored MAIC Analyses
Observed proportions in the treatment populations were 84.6% for cilta-cel, 60.4% for IsaPd, and █████ | for SVd. The MAIC-estimated RR wase 1.39 (95% CI, 1.19 to 1.63) for cilta-cel versus IsaPd, and ████ ████ ███ ████ ██ ████ for cilta-cel versus SVd.
CR or Better
IPTW-Based Analyses
The observed CR or better rate in the treatment populations was 78.1% for cilta-cel, 10.9% for Kd, 2.2% for Pd, 4.4% for Vd, and 11.4% for DVd. The IPTW-estimated RR was 6.48 (95% CI, 2.72 to 15.43) for cilta-cel versus Kd, 38.76 (95% CI, 8.55 to 175.8) for cilta-cel versus Pd, 15.60 (95% CI, 3.88 to 62.73) for cilta-cel versus Vd, and 9.36 (95% CI, 3.35 to 26.14) for cilta-cel versus DVd.
Unanchored MAIC Analyses
The observed CR or better rate in the treatment populations was 73.1% for cilta-cel, 4.5% for IsaPd, and ████ for SVd. The MAIC-estimated RR was 17.30 (95% CI, 8.29 to 36.11) for cilta-cel versus IsaPd and ████ ████ ███ ████ ██ ██████ for cilta-cel versus SVd.
VGPR or Better
IPTW-Based Analyses
The observed VGPR or better rate in the treatment populations was 85.2% for cilta-cel, 52.2% for Kd, 14.1% for Pd, 15.2% for Vd, and 40.9% for DVd. The IPTW-estimated RR was 1.81 (95% CI, 1.24 to 2.64) for cilta-cel versus Kd, 3.73 (95% CI, 1.52 to 9.15) for cilta-cel versus Pd, 5.13 (95% CI, 2.39 to 10.99) for cilta-cel versus Vd, and 2.51 (95% CI, 1.39 to 4.53) for cilta-cel versus DVd.
Unanchored MAIC Analyses
The observed VGPR or better rate in the treatment populations was 81.3% for cilta-cel, 31.8% for IsaPd, and █████ for SVd. The MAIC-estimated RR was 2.52 (95% CI, 1.95 to 3.25) for cilta-cel versus IsaPd and ████ ████ ███ ████ ██ █████ for cilta-cel versus SVd.
Harms Results
Sponsor-conducted ITCs did not evaluate the comparative safety of cilta-cel.
Critical Appraisal
The sponsor-conducted IPTW analyses demonstrated favourable benefits with cilta-cel relative to Kd, Pd, Vd, and DVd treatments, though important limitations were noted. Heterogeneity between the CARTITUDE-4 trial and the comparator trials was observed, both in terms of study eligibility criteria and baseline population characteristics. Reduced sample sizes were generated and used in the analyses, after matching and adjustment methods. Certain prognostic factors, such as cytogenetic risk and type of previous treatment regimen, were unavailable for the adjustment in the IPTW analyses. Further uncertainty is associated with the possibility of unknown, unmeasured, or unmeasurable confounders, which cannot be accounted for with propensity score methods. Regarding the assessment of survival outcomes, median PFS and OS were not reached for cilta-cel and there was evidence of a possible violation of proportional hazards assumptions for certain comparisons (i.e., possible visual violation observed for the DVd, Kd, and Pd comparisons [PFS outcome] and the Kd comparison [OS outcome]; statistical violation, based on the Grambsch-Therneau test, observed for the Vd comparison [PFS outcome]). Input from the clinical expert suggested that certain important treatments of interest for clinical practice in Canada (IsaKd) were missing in the ITC analyses. Moreover, comparative safety and HRQoL were not evaluated, despite being considered important outcomes for patients with MM. Considering all the above, it is likely that the IPTW estimates are subject to an unknown amount and direction of bias.
Limitations of the sponsor-conducted unanchored MAIC included restrictions in ESSs for cilta-cel, following MAIC adjustments, and notable heterogeneity in prognostic and effect-modifying factors across the individual studies. The exploration of between-study differences was further limited by missing information on patient characteristics across the trials. Generalizability issues are associated with diverse eligibility criteria between the comparator and cilta-cel cohorts, mainly the inclusion of patients with an ECOG PS of 0,1, or 2 in the BOSTON trial and the inclusion of patients with at least 2 previous lines of treatment in the ICARIA-MM trial. Thus, concerns remain that not all prognostic and effect-modifying factors were accounted for in the unanchored comparisons, leading to challenges for interpretation and high uncertainty in the MAIC findings.
Studies Addressing Gaps in the Evidence From the Systematic Review
No studies addressing gaps in the systematic review evidence were submitted for this review.
Conclusions
Evidence derived from an ongoing trial demonstrated that the infusion of cilta-cel, compared with SOC (i.e., PVd or DPd), has shown a clinically significant benefit in terms of PFS in patients with RRMM who have received 1 to 3 prior lines of therapy and whose disease is refractory to lenalidomide followed by at least 1 bridging therapy cycle of either PVd or DPd. The treatment benefit with cilta-cel was also consistently presented in terms of CR, sCR, and MRD-negative status. The OS benefit was uncertain based on the submitted evidence due to immaturity of the data, as were the reported treatment effects on PFS and DOR. Results relating to patients’ HRQoL, as measured by a disease-specific quality-of-life instrument, the MySIm-Q total symptom score, were prone to bias due to increased use of concomitant therapies to control side effects, which would have positively impacted the quality of life of patients in the cilta-cel group.
There is low-certainty evidence that cilta-cel, when compared with SOC, may result in little to no difference in the percentage of patients who experience SAEs. Overall, no new safety signals were identified in the CARTITUDE-4 trial; the observed safety profile of cilta-cel is aligned with clinical practice as per feedback from the clinical experts.
In the ITCs comparing cilta-cel to various currently available therapies (i.e., Kd, Pd, Vd, DVd, IsaPd, and SVd), cilta-cel demonstrated statistically significant improvements in terms of PFS (for all comparisons) and OS (for the comparisons versus Pd, Vd, DVd, and SVd). No statistically significant differences were shown in terms of OS in the comparisons of cilta-cel versus Kd and IsaPd. However, the comparative evidence derived from ITC was associated with notable limitations, including incomplete adjustment of important effect modifiers and concern of restricted generalizability to the clinical setting in Canada.
Introduction
The objective of this report is to review and critically appraise the evidence submitted by the sponsor on the beneficial and harmful effects of cilta-cel (Carvykti) cell suspension, administered via IV infusion at a dose of 0.5 × 10⁶ to 1.0 × 10⁶ CAR-positive viable T cells per kilogram of body weight, with a maximum of 1 × 10⁸ CAR-positive viable T cells, in the treatment of adult patients with MM who have received 1 to 3 prior lines of therapy, including a PI and an IMiD, and whose disease is refractory to lenalidomide.
Disease Background
Contents within this section have been informed by materials submitted by the sponsor and clinical expert input. The following has been summarized and validated by the CDA-AMC review team.
MM is a hematological malignancy characterized by clonal proliferation of malignant plasma cells (B-cells) driven by an oncologic event and consequent overproduction of the abnormal immunoglobulin M protein.1 The accumulation of malignant plasma cells within the bone marrow and of monoclonal protein throughout the body leads to signs, symptoms, and complications that are characteristic of MM (e.g., Carbapenem-resistant Acinetobacter baumannii complications: hypercalcemia, renal failure, anemia, or lytic bone lesions).18
The disease has a highly heterogeneous presentation and clinical course. Almost all cases of MM are preceded by the premalignant, asymptomatic state of monoclonal gammopathy of undetermined significance (MGUS) or an intermediate stage of smouldering MM. Patients with MGUS progress to MM or related malignancy at a rate of 1% per year, while smouldering MM is associated with a much faster rate of progression than MGUS.18
MM has historically been associated with the lowest patient HRQoL of all hematological cancers,15 especially with increased duration of disease, disease progression, and consequently increasing lines of therapy.19-24
It was estimated that 3,900 people in Canada would be diagnosed with MM and 1,700 would die from MM in 2023.3 Despite the improvement in the life expectancy of patients with MM over the last 2 decades, since the introduction of targeted therapies for MM, OS remains poor,25-27 with only about half of patients remaining alive at 5 years after diagnosis.28 As MM progresses, patient outcomes worsen with each subsequent line of therapy.5-8
According to the Canadian Cancer Statistics 2022 report produced by the Canadian Cancer Society, Statistics Canada, and the Public Health Agency of Canada, in collaboration with the provincial and territorial cancer registries, the 2-year, 5-year, and 25-year prevalence of MM was 4,960 cases, 9,570 cases, and 15,030 cases, respectively, as of January 1, 2018, translating to a prevalence between 0.01% and 0.04%.4 According to the same report, the number of newly diagnosed cases of MM in 2022 was estimated as 4,000 cases, while the predicted 5-year and 10-year net survival was 50% (95% CI, 49% to 52%) and 30% (95% CI, 28% to 32%), respectively.4 Based on the reported MM prevalence in 2018 and the growing projected annual incidence rate, combined with a predicted 5-year survival rate, the projected prevalence of MM is estimated to be approximately 17,568 in Canada (excluding Quebec) in 2025.4
Diagnosis of MM usually begins with a visit to a primary care physician, occurring when a blood test for another condition is ordered, or if MM is suspected based on symptoms.29,30 As other conditions can cause similar symptoms to MM, it is important for health care professionals to rule out other health conditions before diagnosing MM.29 The IMWG revised the diagnostic criteria for MM in 2016 due to the remarkable progress made in the diagnosis and treatment of MM, including novel treatment options and advances in laboratory and imaging techniques.18,31 The key revisions included the presence of 1 or more myeloma-defining events in addition to evidence of either 10% or more clonal plasma cell on bone marrow determined by an examination of a biopsy-proven plasmacytoma and the addition of 3 specific biomarkers: clonal plasma cells greater than 60% of plasma cells, serum FLC ratio greater than 100, and more than 1 focal lesion found via MRI.18
Standards of Therapy
Contents within this section have been informed by materials submitted by the sponsor and clinical expert input. The following has been summarized and validated by the CDA-AMC review team.
The treatment landscape for MM has changed significantly in recent years, with the emergence of new therapies in newly diagnosed and RRMM settings.32 According to clinical experts and clinician groups, the main treatment goals for patients with RRMM are to prolong survival, improve symptoms by extending remissions, minimize toxicities, and improve HRQoL.
According to the clinical experts and clinician groups consulted for the purpose of this review, in the first line of therapy, patients with MM are largely divided into those who are eligible for transplant and those who are not eligible for transplant. Patients who are eligible for transplant typically undergo induction therapy with either cyclophosphamide-bortezomib-dexamethasone or RVd, followed by autologous stem cell transplant and maintenance therapy with lenalidomide monotherapy until disease progression. Patients who are not candidates for autologous stem cell transplant receive 1 of several regimens, which include lenalidomide-based triplet therapy consisting of PIs, IMiDs, or mABs. Based on the inputs from the clinical experts and clinician groups, for patients who are not eligible for transplant, DRd is used preferentially across Canada; lenalidomide-dexamethasone and RVd are used less often than DRd.
In the second-line setting, for patients who are eligible for transplant and have experienced disease progression on lenalidomide, the clinical experts and clinician groups noted that, in the absence of prior exposure to daratumumab (an anti-CD38 mAB), IsaKd was stated to be the most commonly used treatment, followed by DVd; other potential treatment options include Kd, PVd, and SVd. For patients who are not eligible for transplant and whose disease is refractory to lenalidomide, potential combinations include Kd, SVd, or PVd. Most of these patients will have received a first-line anti-CD38 mAB combination, and thus combinations with anti-CD38 mABs are not used in the second line. In this situation, SVd may be a preferred second-line option because Kd could be used after disease progression, but the reverse is not true. For a small group of patients who are not eligible for transplant and who have not yet received an mAB as part of their first-line therapy and have experienced disease progression on lenalidomide, DVd or IsaKd are preferred, although PVd or SVd are also options. In the third-line setting, the clinical experts and clinician groups mentioned that IsaPd, Kd, Pd, and SVd are available treatment options. In the fourth-line setting, according to the clinical expert and clinician groups, treatment options — which include Kd, Pd, and SVd — have been extremely limited while cilta-cel has been under consideration for negotiation by the pan-Canadian Pharmaceutical Alliance. Typically, treatment options for later lines of therapy depend on a patient’s treatment history and response to previous lines of therapy. Thus, patients who become resistant to a previous regimen will be treated with a different regimen in later lines of therapy (with the exception of dexamethasone and cyclophosphamide, which can be used in multiple combination regimens).33
Drug Under Review
Key characteristics of cilta-cel are summarized in Table 3, with other treatments available for the treatment of adult patients with MM who have received 1 to 3 prior lines of therapy, including a PI and an IMiD, and whose disease is refractory to lenalidomide.
Table 3: Key Characteristics of Cilta-Cel, Daratumumab, Selinexor, Carfilzomib, and Pomalidomide
Characteristic | Cilta-cel | Daratumumab | Selinexor | Proteasome inhibitors (carfilzomib) | Immunomodulatory drugs (pomalidomide) |
|---|---|---|---|---|---|
Mechanism of action | BCMA-directed genetically modified autologous CAR T-cell immunotherapy. | An mAb that targets CD38 overexpressed on tumour cells in hematologic malignancies. Induces cell lysis via a variety of mechanisms, including ADCC, CDC, and ADCP. | A compound that specifically blocks XPO1, a nuclear export protein that transports cargo proteins within the cell. XPO1 inhibition by selinexor leads to reduction of cancer cells. | Proteasome inhibition leads to accumulation of misfolded protein in endoplasmic reticulum, resulting in apoptosis and inhibition of cell proliferation. | Immunomodulatory and antineoplastic activity; inhibits proliferation and induces apoptosis of hematopoietic tumour cells. |
Indicationa | For the treatment of adult patients with multiple myeloma, who have received 1 to 3 prior lines of therapy including a proteasome inhibitor and an immunomodulatory agent, and who are refractory to lenalidomide. | In combination with bortezomib and dexamethasone, for patients with MM who have received at least 1 prior therapy. | In combination with bortezomib and dexamethasone for the treatment of adult patients with MM who have received at least 1 prior therapy. | In combination with dexamethasone alone (Kd), for patients with relapsed MM who have received 3 prior lines of therapy. In combination with isatuximab and dexamethasone (IsaKd), for the treatment of adult patients with relapsed or refractory multiple myeloma who have received 1 to 3 prior lines of therapy. | In combination with dexamethasone for patients with MM for whom both bortezomib and lenalidomide have failed and who have received at least 2 prior regimens and demonstrated disease progression on the last regimen. |
Route of administration | IV infusion | IV infusion | Orally | IV infusion | Orally |
Recommended dose | Single infusion of 0.5 × 10⁶ to 1.0 × 10⁶ CAR-positive viable T cells per kilogram of body weight | DVd (3-week cycle)
|
|
|
|
Serious adverse effects or safety issues | Cytokine release syndrome, neurologic toxicities (including ICANS), hemophagocytic lymphohistiocytosis or macrophage activation syndrome | Infusion reactions, neutropenia, thrombocytopenia, hepatitis B reactivation | Fatigue, severe or life-threatening hyponatremia, nausea, vomiting, diarrhea, anorexia or weight loss, thrombocytopenia, neutropenia, infections, dizziness, cataracts | Infusion reactions, TLS infections, cardiac disorders, venous thrombosis, hypertension, hemorrhage, thrombocytopenia, hepatoxicity, hepatitis B reactivation, posterior reversible encephalopathy syndrome, PML, acute renal failure, pulmonary toxicity | Neutropenia, thrombocytopenia, infections, DVT and pulmonary embolism, hepatoxicity, anaphylaxis, hepatitis B reactivation, severe rash (SJS, TEN, DRESS), tumour lysis syndrome |
Other | Previously approved indication (“For the treatment of adult patients with MM, who have received at least 3 prior lines of therapy, including a PI, an IMiD, and an anti-CD38 mAB, and who are refractory to their last treatment”) received Reimburse with Conditions recommendation11 | Premedication with dexamethasone, antipyretics, and antihistamines is recommended; post-injection medication should be considered to prevent delayed infusion reactions, oral corticosteroid; antiviral prophylaxis should also be considered to prevent reactivation of herpes zoster | Currently under negotiation | Premedication for carfilzomib recommended with dexamethasone (at least 30 minutes prior) to reduce incidence and severity of infusion reactions | Antithrombotic prophylaxis recommended |
BCMA = B-cell maturation antigen; ADCC = antibody-dependent cellular cytotoxicity; ADCP = antibody-dependent cellular phagocytosis; CAR = chimeric antigen receptor; CDC = complement-dependent cytotoxicity; cilta-cel = ciltacabtagene autoleucel; DRESS = drug rash with eosinophilia and systemic symptoms; DVd = daratumumab-bortezomib-dexamethasone; DVT = deep venous thrombosis; ICANS = immune effector cell–associated neurotoxicity syndrome; IMiD = immunomodulatory drug; Kd = carfilzomib-dexamethasone; mAB = monoclonal antibody; MM = multiple myeloma; PI = proteasome inhibitor; PML = progressive multifocal leukoencephalopathy; SC = subcutaneous; SJS = Stevens-Johnson syndrome; TEN = toxic epidermal necrolysis; TLS = tumour lysis syndrome.
aHealth Canada–approved indication.
Sources: Product monographs for Carvykti,34 Darzalex,35 Xpovio,36 Pomalyst,37 Sarclisa,38 and Kypolis.39
Perspectives of Patients, Clinicians, and Drug Programs
Patient Group Input
This section was prepared by the CDA-AMC review team based on the input provided by patient groups. The full original patient input(s) have been included in the Patient, Clinician, and Drug Program Input section of this report.
CDA-AMC received 1 patient group submission, from Myeloma Canada. Myeloma Canada is a patient advocacy group that supports patients diagnosed with MM living in Canada.
Myeloma Canada collected data from patients with RRMM who had received 1 to 3 prior lines of therapy and whose disease was refractory to lenalidomide or who had experience with a CAR T-cell therapy, or from the caregivers of such patients, through a survey across Canada and internationally, via email and social media from April 5, 2024, to April 24, 2024. There were 53 eligible respondents; 51 lived in Canada (Alberta [3], British Columbia [12], Newfoundland and Labrador [2], Ontario [29], Quebec [5]), and 2 lived in France. There were 2 subsets of survey respondents: 1 subset comprised 37 patients or caregivers who met the criteria for the indication under review, and the other comprised 16 respondents who had CAR T-cell therapy experience, of which 8 patients or caregivers had experience with cilta-cel and 8 patients or caregivers had experience with a different CAR T-cell therapy.
In terms of MM disease complications, infections were considered the most important aspect to control, followed by kidney problems. Patients and/or caregivers also reported that MM had various impacts on their quality of life, such as limiting their ability to travel and their pursuit of life goals or accomplishments. Most patients and caregivers identified a need for effective MM treatment options, with manageable side effects and minimal impact on quality of life. Of the 37 patients or caregivers who met the criteria of the indication under review, 22 reported receiving 3 lines of therapy and 2 reported treatment with B-cell maturation antigen–targeted therapy. The experiences shared by patients or caregivers who received CAR T-cell therapy were generally positive. Of the 8 respondents who received cilta-cel, 5 rated the treatment extremely effective and the side effects extremely tolerable. CRS was perceived to be the most concerning side effect by patients who met the criteria for the indication under review. However, it was considered bearable for respondents who had received cilta-cel. Twenty-eight respondents out of the 37 found that an estimated minimum 1.25 years of extended life without needing active treatment to control myeloma was extremely desirable.
Myeloma Canada re-emphasized that cilta-cel is a therapy well understood by patients and caregivers but that it is also an expensive and resource-intensive therapy. The survey responses indicate that access to cilta-cel is currently difficult for patients in Canada, leading some patients to seek treatment outside the country.
Clinician Input
Input From Clinical Experts
All review teams include at least 1 clinical specialist with expertise in the diagnosis and management of the condition for which the drug is indicated. Clinical experts are a critical part of the review team and are involved in all phases of the review process (e.g., providing guidance on the development of the review protocol, assisting in the critical appraisal of clinical evidence, interpreting the clinical relevance of the results, and providing guidance on the potential place in therapy). The following input was provided by 2 clinical specialists with expertise in the diagnosis and management of MM.
Unmet Needs
According to the clinical experts, the most important goal of treating patients with RRMM is to control disease with minimal toxicities, given there are no curative therapies currently. The clinical experts indicated that patients with MM commonly experience drug resistance to each line of therapy, with progressively shorter durations of response. Additionally, the clinical experts highlighted that a treatment-free interval would be valuable to improve quality of life for patients, given that the current treatments for MM often require injections weekly or sometimes even twice a week, which is an inconvenience for patients. Therefore, the clinical experts stated that more treatment options are needed that work through novel pathways and can enhance and prolong responses with fewer side effects and improved convenience.
Place in Therapy
The clinical experts indicated that cilta-cel would be an additional option for the management of patients with MM whose disease is refractory to lenalidomide or who have been exposed to lenalidomide. The clinical experts confirmed that the proposed place in therapy (i.e., second to fourth line) is reflective of clinical practice in Canada. In general terms, for patients who are eligible for transplant, the clinical experts considered an mAB-based therapy (e.g., IsaKd or DVd) as the preferred second-line treatment for patients who experience relapse after RVd in the first line. Thus, cilta-cel may be preferred in the third line or later. However, cilta-cel could be the preferred second-line treatment for a small percentage (about 10%) of patients, such as those with higher-risk genetics or disease who received daratumumab-RVd in the first line. The clinical experts felt that a trial to compare efficacy and toxicities between anti-CD38 mAB-based second-line therapy or second-line therapy with cilta-cel would provide important data to inform this decision. For patients who are not eligible for transplant, the clinical experts would promote cilta-cel as a second-line treatment but noted that, in clinical practice, most patients (80% to 90%) would receive DRd as the first-line treatment, which would mean they are not eligible for cilta-cel in the second line. Generally, the clinical experts would not limit access to cilta-cel by mandating trying other treatments first, given that exposure to cilta-cel earlier in a patient’s disease course typically results in healthier and less exhausted T cells.
Patient Population
The clinical experts confirmed that the patients included in the CARTITUDE-4 trial are generally reflective of the patient population with MM in clinical practice in Canada. According to the clinical experts, given there is no companion test required and no established biomarker to identify those who may be most likely to benefit from cilta-cel, the patients best suited for the treatment with cilta-cel would be identified by the physicians. Currently, as per feedback from the clinical experts, highly specialized testing, such as additional detailed genetic testing, is not widely available and not likely to become so in the near future.
Assessing the Response to Treatment
The clinical experts stated that standard clinical assessments of urine, blood, scans, and bone marrow are used to document response or relapse. These assessments include development of urine and serum protein electrophoresis and immune fixation, serum FLCs, complete blood count, creatinine, calcium, and imaging (MRI, CT, PET-CT). The clinical experts mentioned that patient visits and blood assessments are usually done monthly initially and are then reduced to every 3 months for patients in remission and without symptoms. Imaging can be done with the onset of new symptoms or annually.
Discontinuing Treatment
As cilta-cel is a 1-time treatment, the clinical experts indicated that stopping treatment is not applicable.
Prescribing Considerations
The clinical experts stated that cilta-cel should be administered in qualified institutions that are capable of properly handling patient cells, including their acquisition, storage, and shipment. Additionally, the clinical experts indicated that specialized centres administering CAR T-cell therapy are required to have processes in place to manage acute toxicities occurring, usually, within the first 28 days postinfusion; examples include CRS (which, if present, requires intensive care to be available) and neurotoxicity (which, if present, requires neurologic care to be available). The management of patients with MM undergoing CAR T-cell therapy requires ongoing monitoring of immunity, revaccination, and immunoglobulin therapy administration according to the clinical experts.
Clinician Group Input
This section was prepared by the review team based on the input provided by clinician groups. The full original clinician group input(s) received have been included in the Patient, Clinician, and Drug Program Input section of this report.
CDA-AMC received input from 2 clinician groups: 1 submission from the OH-CCO Hematology Cancer Drug Advisory Committee, which provides timely evidence-based clinical and health system guidance on drug-related issues in support of CCO’s mandate, including the Provincial Drug Reimbursement Programs and the Systemic Treatment Program, and 1 submission from CMRG, a Canada-wide network of researchers aiming to develop better treatments to extend the life of myeloma patients, enhancing the quality of life for those living with myeloma and related disorders, and working to find a cure for these diseases and other plasma cell disorders. Both groups gathered information via teleconference.
OH-CCO indicated that cilta-cel is an option as second-line treatment for patients who are eligible for transplant or likely as third-line treatment for patients who are not eligible for transplant as they would get daratumumab in the first line. CMRG also emphasized that the availability of cilta-cel in the proposed setting would pertain primarily to patients who have had 2 prior lines of treatment; they may or not may not have already received an anti-CD38 mAB as well in the current treatment environment. CMRG further commented that the highest unmet need in myeloma continues to be adequate treatment for patients who have experienced disease progression despite exposure to effective drugs (for example, patients whose disease is triple-class refractory to an IMiD, PI, and anti-CD38 mAB. Combinations of these 3 major drug classes are increasingly used in first-line and second-line treatment, and patients are now developing resistance to multiple drug classes much earlier in the disease course. OH-CCO also mentioned that patients who had been exposed to anti-CD38 mAB particularly had poor outcomes.
OH-CCO considered that improved response, quality of life, disease-related symptoms, PFS, and OS are important outcomes. CMRG highlighted that cilta-cel produces unprecedented rates of response that are deeper than standard regimens; specifically, the rates of sCR and CR are on the order of 70% to 75%, compared to 20% with standard therapy.
Both groups agreed that cilta-cel should be delivered at tertiary hospitals or transplant centres with expertise in cellular therapy with an intensive care unit familiar with patients with cancer who are immunosuppressed and an outpatient facility experienced in handling complex and urgent hematologic problems.
Drug Program Input
The drug programs provide input on each drug being reviewed through reimbursement review processes by identifying issues that may impact their ability to implement a recommendation. The implementation questions and corresponding responses from the clinical experts consulted for the purpose of this review are summarized in Table 4.
Table 4: Summary of Drug Plan Input and Clinical Experts’ Response
Drug program implementation questions | Clinical expert response |
|---|---|
Relevant comparators | |
The CARTITUDE-4 trial compared cilta-cel vs. physician’s choice. Comparator therapies used in the CARTITUDE-4 trial included PVd or DPd. PVd is available as a comparator in Canada, but DPd is not funded. Other relevant comparators to cilta-cel funded in Canada depend on the prior therapies used; these may include isatuximab-based triplets (e.g., IsaPd and IsaKd), SVd, DVd, KRd, and doublets with Pd and Kd. | Comment from the drug programs to inform pERC deliberations. The clinical experts mentioned that, for patients who are eligible for transplant, the relevant comparators are an anti-CD38 mAB combination (daratumumab or isatuximab) with a PI (carfilzomib, or bortezomib). An anti-CD38 mAB–based combination would currently be used preferentially instead of pomalidomide or selinexor combinations. The current funded anti-CD38 mAB–PI combinations are IsaKd and DVd. For patients who are not eligible for transplant and who have already been treated with DRd, the options include SVd (preferred), Kd, and PVd or PCd. |
Considerations for initiation of therapy | |
Given this reimbursement request would substantially expand the eligibility of CAR T-cell therapy for patients with multiple myeloma, if capacity limitations exist, how would you prioritize which patients are offered cilta-cel? | The clinical experts suggested that provincial governments should increase their ability to provide CAR T-cell therapies to patients because the clinical experts considered them an effective therapy for a very difficult medical problem that causes a lot of morbidity and mortality. However, as patients with higher-risk disease (e.g., patients with stage III disease, high-risk genetic factors, older age, or baseline plasmacytomas or extramedullary disease) may have less benefit from cilta-cel in advanced settings (i.e., third or fourth line), the clinical experts would prioritize patients who are going to get the longest or the best responses in earlier disease course or treatment settings. The clinical experts stated that there is an rationale to believe that immune therapies may work better earlier in the disease course before the immune therapy has been compromised by multiple lines of therapy or by the disease itself and that, as certain chemotherapies may cause some damage to the T-cell activity, an immune therapy such as cilta-cel would theoretically work better if given earlier in the disease course. Additionally, the clinical experts mentioned that patients being considered for treatment would have had PI exposure and would have disease that is refractory to lenalidomide. The clinical experts would also prioritize patients who live in remote communities, often requiring frequent long-distance journeys to receive continual systemic treatment. Cilta-cel, as a 1-time treatment, may improve the quality of life for those patients, allowing them to spend more time in their communities. If difficult prioritization decisions need to be made, consideration could be given to ease of access to other effective BCMA-directed therapies, such as bispecific T-cell engagers. Patients who cannot receive these therapies could be prioritized above those who can. |
Patients enrolled in the CARTITUDE-4 trial were not permitted prior BCMA therapy (e.g., belantamab mafodotin, bispecific T-cell engagers). In clinical practice, should prior BCMA-directed therapy be an exclusion criterion to cilta-cel in the requested population? | As there is no evidence on this point, the clinical experts are not sure of the efficacy of cilta-cel in patients who have had a prior BCMA therapy. |
Is there any evidence to support re-treatment with CAR T-cell therapy? If yes, what is the appropriate time interval between initial CAR T-cell therapy and re-treatment? | The clinical experts indicated that there is no evidence about the effect of re-treating patients with CAR T-cell therapies. |
Considerations for continuation or renewal of therapy | |
NA | |
Considerations for discontinuation of therapy | |
NA | |
Considerations for prescribing of therapy | |
Access would be limited to jurisdictional capacity. The sponsor indicated that cilta-cel will be rolled out in 7 provinces. Currently, there are capacity limitations (e.g., health human resources, bed limitations). As more CAR T-cell therapy products are implemented, it is anticipated that the capacity may not be able to meet the demand. Out-of-province or out-of-country care may still be needed. There may be issues with access and prolonged stays in (or near) specialized centres, especially for patients from remote areas. Financial support for travel and accommodation would be needed. | Comment from the drug programs to inform pERC deliberations. The clinical experts stated that large increases in accredited specialized centres and staff are required to be able to offer this important therapy. In addition, a significant education initiative will be required with rollout at both specialized and nonspecialized centres (the latter may have to deal with complications through emergency department visits and so forth). |
Generalizability | |
Patients enrolled in the CARTITUDE-4 trial had an ECOG PS of 1 or less. Should patients with an ECOG PS of 2 be eligible for cilta-cel after 1 to 3 prior lines of systemic therapy? | The clinical experts would consider patients with an ECOG PS of 2 to be eligible for cilta-cel, as patients with ECOG PS of 2 are similar to patients with an ECOG PS of 1 or less in terms of responding to the treatment. Additionally, the clinical experts mentioned that ECOG PS scores may change along a patient’s disease course; therefore, there is no reason to exclude patients with an ECOG PS of 2 from treatment with cilta-cel. |
Funding algorithm (oncology only) | |
Drug may change the place in therapy of comparator drugs. | Comment from the drug programs to inform pERC deliberations. |
Drug may change the place in therapy of drugs reimbursed in previous lines. | Comment from the drug programs to inform pERC deliberations. |
Drug may change the place in therapy of drugs reimbursed in subsequent lines. | Comment from the drug programs to inform pERC deliberations. |
Complex therapeutic space with multiple lines of therapy, subpopulations, or competing products. | Comment from the drug programs to inform pERC deliberations. |
Care provision issues | |
There will be significant resource use for patient preparation, including leukapheresis, cell processing, and use of bridging and lymphodepleting chemotherapy. Specialized centres need to be trained and accredited by the manufacturer. There is a high resource burden in obtaining and maintaining certification (including developing various protocols and supporting yearly audits). There is a need to coordinate patient care and product preparation with an external manufacturer. Multiple CAR T-cell therapies are now being administered by specialized centres; managing various protocols for preparation and delivering each product type poses an administrative burden. | Comment from the drug programs to inform pERC deliberations. |
Is it safe to administer cilta-cel in the outpatient setting? | The clinical experts indicated that CRS and ICANS associated with cilta-cel need immediate diagnosis and management; therefore, they would not initially consider administering cilta-cel in the outpatient setting. The clinical experts mentioned that they would refer to the procedure of administering cilta-cel in the outpatient setting adopted by experienced centres in the US. For example, for patients with lymphoma undergoing CAR T-cell therapies, some centres are doing daily patient visits and/or close virtual monitoring for selected patients; a very robust out of hours (overnight and/or weekend) rapid admission process and staffing is needed to make that safe. |
Additional resources (nursing, hospital bed, ICU) would be needed to treat adverse events. Resources would also be required outside the cancer system and need to be coordinated with the hospital. | Comment from the drug programs to inform pERC deliberations. |
CAR T-cell therapies require the availability of and/or access to and potential increased utilization of supportive care drugs; examples include growth factor support, CRS drugs (e.g., tocilizumab), and antimicrobials. | Comment from the drug programs to inform pERC deliberations. |
System and economic issues | |
This requested indication presents a significant expansion to the eligible population for CAR T-cell therapy for patients with multiple myeloma. The potential budget impact is extremely large and would be a significant increase. Costs related to out-of-country access may need to be considered from a system perspective. | Comment from the drug programs to inform pERC deliberations. |
Cost of travel expenses for eligible patients would be needed. | Comment from the drug programs to inform pERC deliberations. |
In some jurisdictions, the cost of CAR T-cell therapy may be borne through multiple sources and/or budgets, not just the drug programs. | Comment from the drug programs to inform pERC deliberations. |
Cilta-cel received a conditionally positive recommendation for use in patients with multiple myeloma after 3 prior therapies. Negotiation is still active at the time of this input. | Comment from the drug programs to inform pERC deliberations. |
BCMA = B-cell maturation antigen; CAR = chimeric antigen receptor; cilta-cel = ciltacabtagene autoleucel; CRS = cytokine release syndrome; DPd = daratumumab-pomalidomide-dexamethasone; DRd = daratumumab-lenalidomide-dexamethasone; DVd = daratumumab-bortezomib-dexamethasone; ECOG PS = Eastern Cooperative Oncology Group performance status; ICANS = immune effector cell–associated neurotoxicity syndrome; ICU = intensive care unit; IsaKd = isatuximab-carfilzomib-dexamethasone; IsaPd = isatuximab-pomalidomide-dexamethasone; Kd = carfilzomib-dexamethasone; KRd = carfilzomib-lenalidomide-dexamethasone; NA = not applicable; PCd = pomalidomide-cyclophosphamide-dexamethasone; Pd = pomalidomide-dexamethasone; pERC = CADTH pan-Canadian Oncology Review Expert Review Committee; PI = proteasome inhibitor; PVd = pomalidomide-bortezomib-dexamethasone; SVd = selinexor-bortezomib-dexamethasone.
Clinical Evidence
The objective of this Clinical Review Report is to review and critically appraise the clinical evidence submitted by the sponsor on the beneficial and harmful effects of cilta-cel, cell suspension in infusion bag, 0.5 × 10⁶ to 1.0 × 10⁶ CAR-positive viable T-cells per kilogram of body weight, with a maximum of 1 × 10⁸ CAR-positive viable T cells, for IV infusion in the treatment of RRMM in patients who have received 1 to 3 prior lines of therapy, including a PI and an IMiD, and whose disease is refractory to lenalidomide The focus will be placed on comparing cilta-cel to SOC and identifying gaps in the current evidence.
A summary of the clinical evidence included by the sponsor in the review of cilta-cel is presented in 2 sections, with critical appraisal of the evidence included at the end of each section. The first section, the systematic review, includes the pivotal study that was selected according to the sponsor’s systematic review protocol. The assessment of the certainty of the evidence in this first section using the GRADE approach follows the critical appraisal of the evidence. The second section includes sponsor-submitted ITCs.
Included Studies
Clinical evidence from the following are included in the review and appraised in this document:
1 phase III, open-label, randomized, active-control RCT (the CARTITUDE-4 trial) identified in the systematic review
2 ITC reports with IPTW analyses for 4 comparators and MAIC analyses for 2 comparators.
Systematic Review
Contents within this section have been informed by materials submitted by the sponsor. The following has been summarized and validated by the CDA-AMC review team.
Description of Studies
The characteristics of the included studies are summarized in Table 5.
Table 5: Details of Studies Included in the Systematic Review
Detail | CARTITUDE-4 |
|---|---|
Designs and populations | |
Study design | Phase III, open-label, randomized, active-control RCT |
Locations | 81 centres in Europe (Belgium, Denmark, France, Germany, Greece, Italy, Netherlands, Poland, Spain, Sweden, and UK), North America (US), and other regions (Australia, Israel, Japan, and Republic of Korea) |
Patient enrolment dates | Start date: June 30, 2020 End date: Ongoing (data cut-off date for current analysis: November 1, 2022) |
Randomized (N) | 419 were enrolled and randomized; 208 received cilta-cel and 211 received SOC therapy with PVd or DPd |
Inclusion criteria |
|
Exclusion criteria |
|
Drugs | |
Intervention | Eligible participants randomized to receive cilta-cel underwent the following steps:
|
Comparator(s) | Participants randomized to the SOC group were to start either PVd or DPd within 7 days after randomization. PVd, 21-day cycles
DPd, 28-day cycles
|
Study duration | |
Screening phase | 28 days before randomization |
Treatment phase | Cilta-cel group: Begins with apheresis and ends with cilta-cel infusion. SOC group: Begins with first administration of PVd or DPd until confirmed progressive disease, death, intolerable toxicity, withdrawal of consent, or end of study. |
Follow-up phase | Cilta-cel group:
SOC group:
After confirmed progressive disease, participants in both groups were followed for survival status, subsequent antimyeloma therapies, response to subsequent antimyeloma therapies (including the date of subsequent progression), and second primary malignancies every 16 weeks until the end of the study (defined as when approximately 250 deaths had occurred). |
Outcomes | |
Primary end point | PFS |
Secondary and exploratory end points | Major secondary:
Other:
Exploratory:
|
Publication status | |
Publications | San-Miguel et al. (2023) NCT04181827 |
BCMA = B-cell maturation antigen; CAR = chimeric antigen receptor; cilta-cel = ciltacabtagene autoleucel; CR = complete response; DPd = daratumumab-pomalidomide-dexamethasone; ECOG = Eastern Cooperative Oncology Group; EORTC QLQ-C30 = European Organisation for Research and Treatment of Cancer Quality of Life Questionnaire Core 30; FLC = FLC; IMiD = immunomodulatory drug; IMWG = International Myeloma Working Group; MM = multiple myeloma; MRD = minimal residual disease; ORR = overall response rate; OS = overall survival; PFS = progression-free survival; PI = proteasome inhibitor; PR = partial response; PVd = pomalidomide-bortezomib-dexamethasone; RCT = randomized controlled trial; SC = subcutaneous; sCR = stringent complete response; SOC = standard of care; VGPR = very good partial response.
Source: 2023 primary Clinical Study Report for CARTITUDE-4 trial.14 Details included in the table are from the sponsor’s summary of clinical evidence.17
One pivotal trial (the CARTITUDE-4 trial) was included in the systematic review. The CARTITUDE-4 trial is a phase III, open-label, randomized, multicentre study to evaluate the efficacy and safety of cilta-cel compared to physician’s choice of SOC therapies (PVd or DPd) in patients with RRMM who have received 1 to 3 prior lines of therapy. The primary objective of the study was to compare the efficacy of cilta-cel with SOC (PVd or DPd) in terms of PFS in patients with relapsed and lenalidomide-refractory MM. The primary end point was PFS, and secondary and other outcomes included CR or better rate, VGPR or better rate, ORR, MRD negativity rate, OS, DOR, and HRQoL. The study was funded by Janssen and Legend Biotech. The CARTITUDE-4 trial enrolled adults who had a documented diagnosis of MM according to IMWG diagnostic criteria, had received 1 to 3 prior lines of therapy, including a PI and an IMiD, and whose disease was refractory to lenalidomide per IMWG consensus guidelines.
The CARTITUDE-4 trial is an ongoing trial. Patient enrolment started on June 30, 2020. One interim analysis and 1 final analysis were planned. The interim analysis was performed when approximately 188 PFS events (75% of the total planned PFS events) had been observed. The final analysis is expected after the accumulation of approximately 250 PFS events, which has not yet occurred at the time of this report. Therefore, this report is focused on the results from the interim analysis. The data cut-off date was November 1, 2022, for the interim analysis. A total of 419 patients were randomized at a 1:1 ratio to receive either cilta-cel (n = 208) or standard therapy with PVd or DPd (n = 211). Randomization was stratified by physician’s choice of PVd or DPd, ISS disease stage at screening (I,. II, or III), and number of prior lines of therapy (1 versus 2 to 3). These patients were recruited in 81 centres across 16 countries in Europe (Belgium, Denmark, France, Germany, Greece, Italy, Netherlands, Poland, Spain, Sweden, and UK), North America (US), and other regions (Australia, Israel, Japan, and Republic of Korea). The study had no sites in Canada.
The study consists of 3 phases: screening, treatment, and follow-up (Figure 1). Before the screening phase, the investigator determined if the patient would be treated with PVd or DPd as standard therapy based on the patient’s prior exposure to antimyeloma therapies. In the screening phase, patients provided written consent for study participation and were screened for eligibility within 28 days before randomization. After screening, patients in the cilta-cel group underwent apheresis, received a conditioning treatment regimen of cyclophosphamide and fludarabine, and then received the cilta-cel infusion, which was administered 5 to 7 days after the start of the conditioning regimen. Patients were monitored for safety and efficacy during the first 112 days after cilta-cel administration (postinfusion follow-up). During the posttreatment follow-up (starting on day 112), patients continued to be monitored for efficacy until confirmed progressive disease, death, or withdrawal of consent. Patients who were unable to receive PVd or DPd standard therapy or who were unable to be apheresed or to receive bridging therapy, conditioning regimen, or cilta-cel infusion were followed until confirmed progressive disease, start of a new antimyeloma therapy, withdrawal of consent, or end of study, whichever occurred first. In the SOC group, patients received PVd or DPd until confirmed progressive disease, death, intolerable toxicity, withdrawal of consent, or end of study. For both groups, after confirmed progressive disease, patients were followed up for survival status, subsequent antimyeloma therapies, and the occurrence of second primary malignancies every 16 weeks until the end of the study. At the end of the study, all patients who received cilta-cel will continue to be monitored for long-term safety under a separate study for up to 15 years after cilta-cel administration. Adverse events were reported until 30 days after the last dose of bridging therapy or until day 112 postinfusion of cilta-cel (whichever is later). This reporting continued regardless of whether progressive disease occurred during bridging therapy or before day 112, or if a subsequent antimyeloma therapy is started before day 112 for the cilta-cel group. For the SOC groups, adverse events were reported until 30 days after the last dose of any study treatment or until the start of subsequent antimyeloma therapy (whichever occurred earlier). Adverse events that were considered to be related to the study drug but occurred after the adverse event reporting period were reported until the end of the study.
Figure 1: CARTITUDE-4 Study Schematic
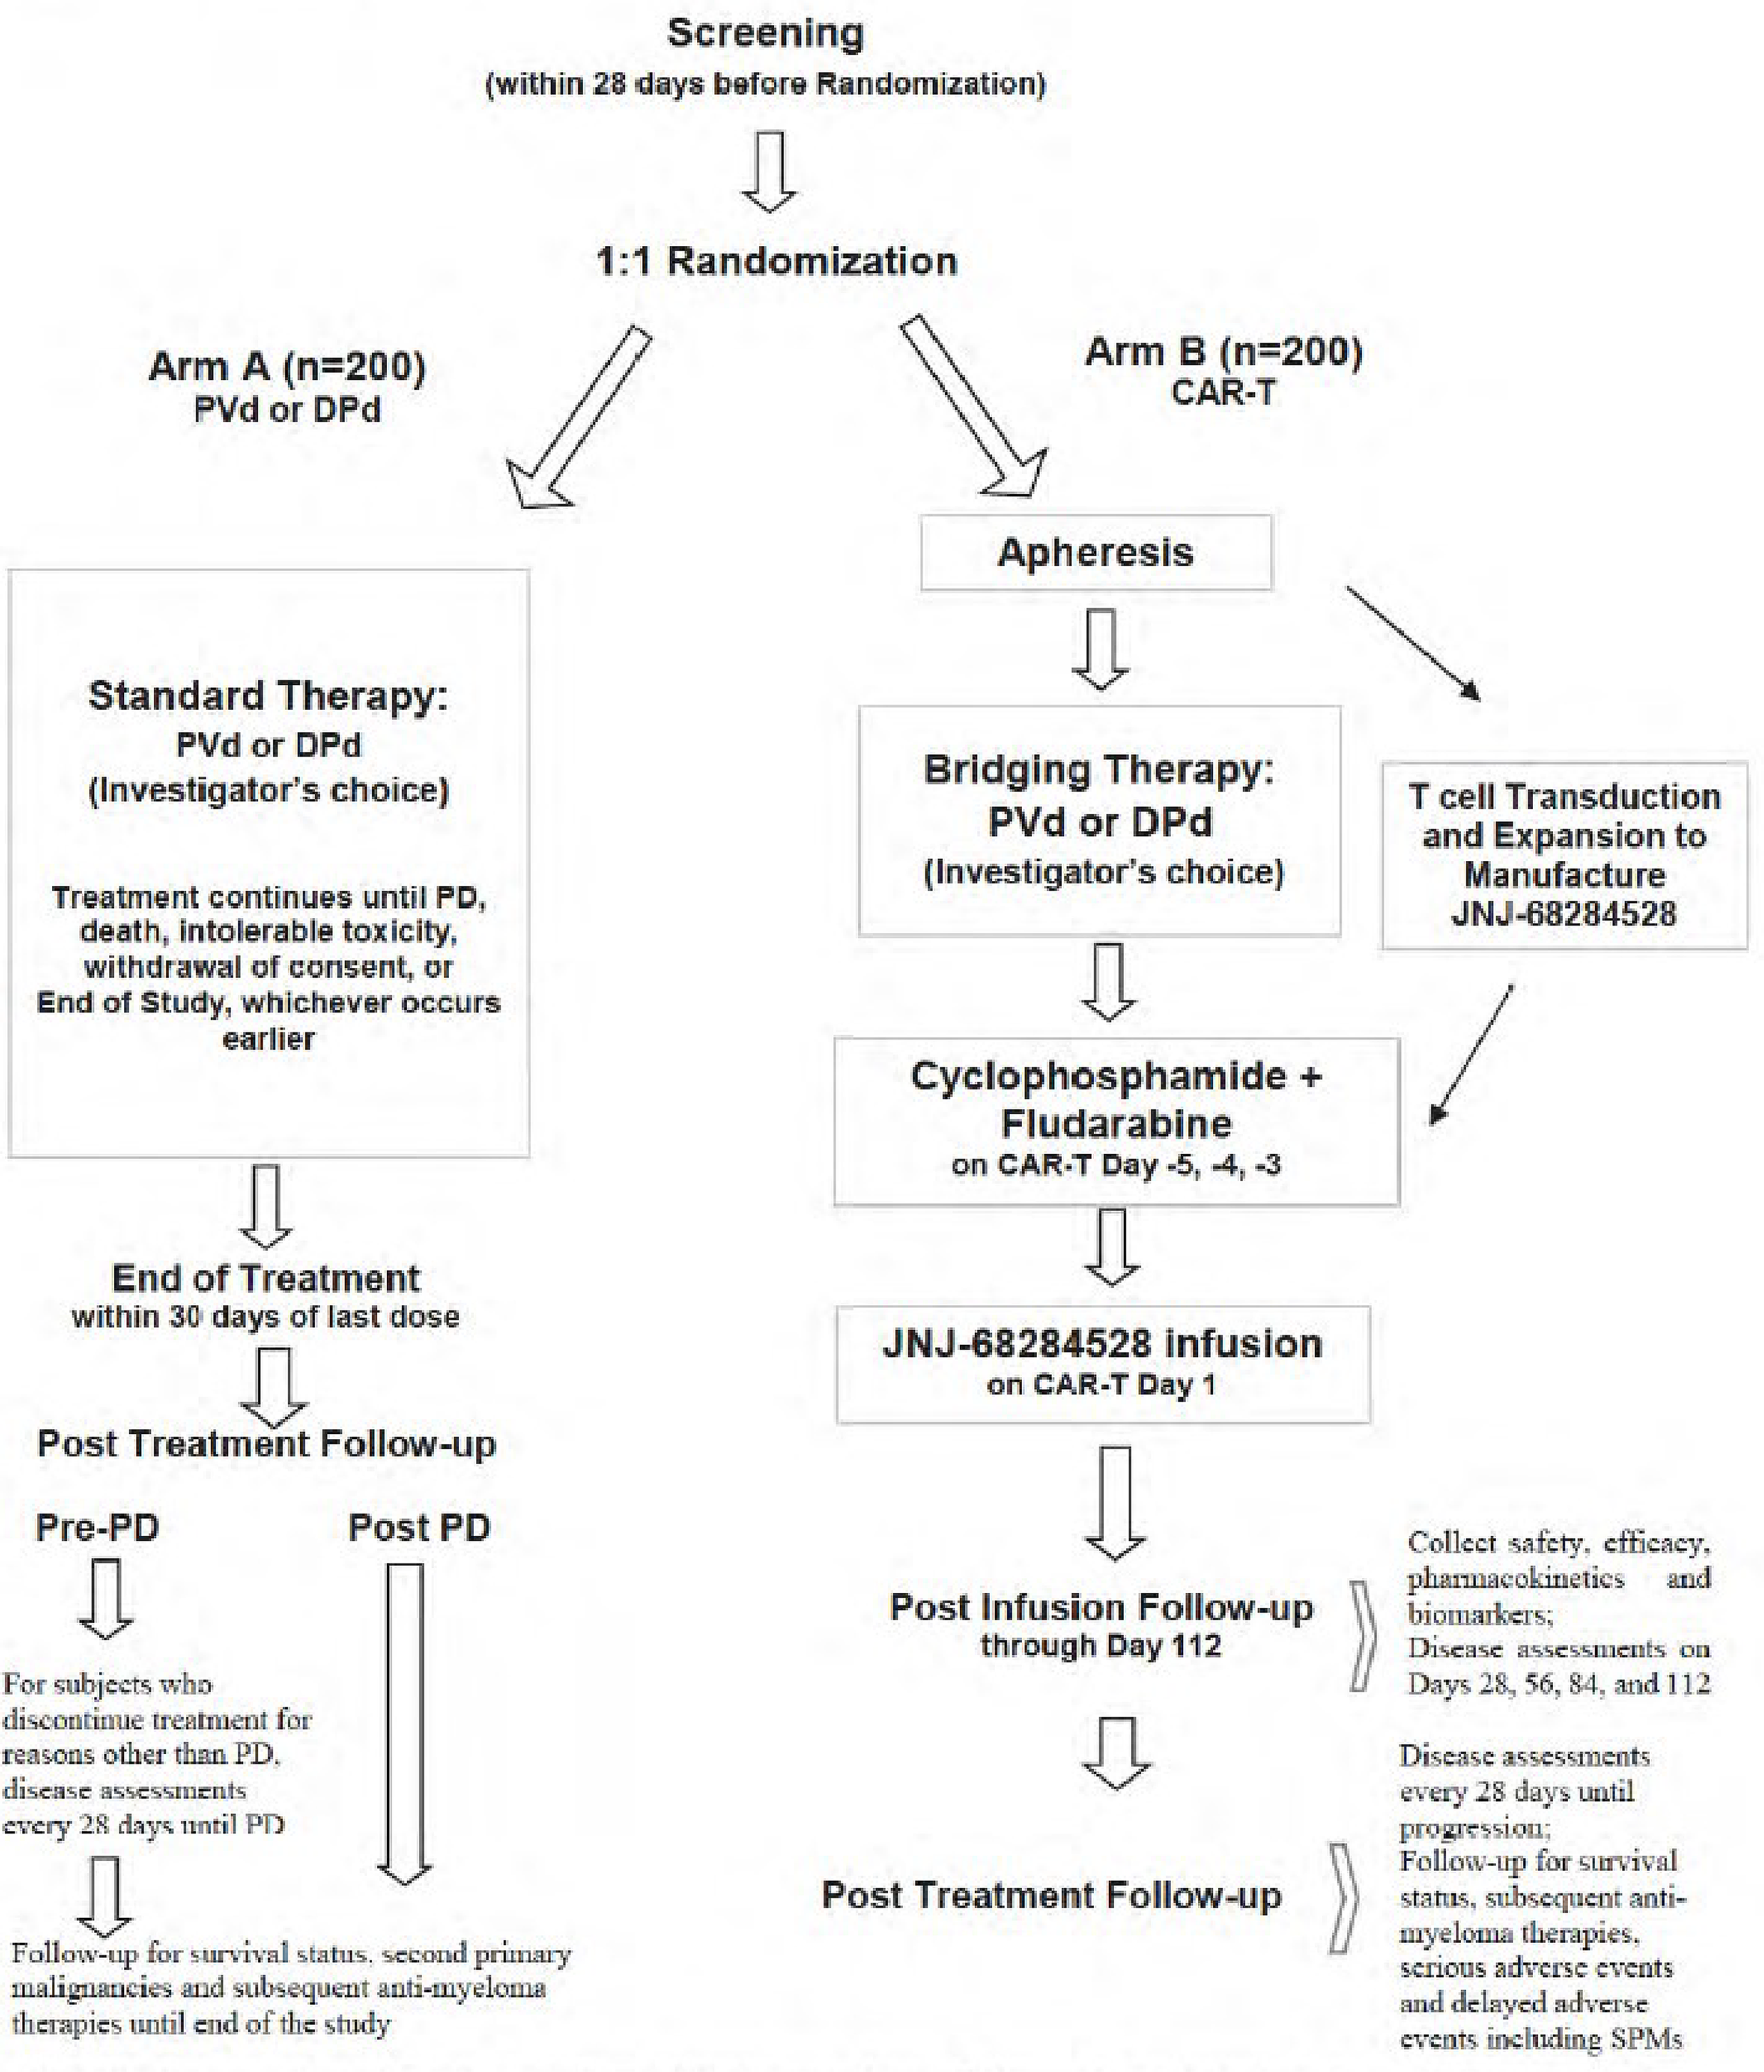
CAR-T = chimeric antigen receptor T-cell therapy; DPd = daratumumab-pomalidomide-dexamethasone; PD = progressive disease; PVd = pomalidomide-bortezomib- dexamethasone; SPM = secondary primary malignancy.
Source: Statistical analysis plan for the CARTITUDE-4 trial.41
Populations
Inclusion and Exclusion Criteria
Eligible patients were required to be aged 18 years or older, have a documented diagnosis of MM according to IMWG diagnostic criteria, and have an ECOG PS of 0 or 1. Other key eligibility criteria included the following: measurable disease at screening; received 1 to 3 prior lines of therapy, including a PI and an IMiD; documented evidence of progressive disease by IMWG criteria based on investigator’s determination on or within 6 months of their last regimen; and have disease that is refractory to lenalidomide per IMWG consensus guidelines. Patients were excluded from the CARTITUDE-4 trial if they had received prior CAR T-cell therapy or B-cell maturation antigen–targeted treatment.
Interventions
Patients in the cilta-cel group underwent apheresis, followed by at least 1 bridging therapy cycle of either PVd or DPd (with the number of cycles based on clinical status and cilta-cel manufacturing time) and lymphodepletion with IV 300 mg of cyclophosphamide per square metre of body surface area and IV 30 mg of fludarabine per square metre of body surface area daily for 3 days. Five to 7 days after the initiation of lymphodepletion, a single cilta-cel infusion (target dose, 0.75 × 10⁶ CAR-positive viable T cells per kilogram of body weight) was administered. Patients in the cilta-cel group who had confirmed disease progression during bridging therapy or lymphodepletion were assessed as having a progression event and could receive cilta-cel as subsequent therapy at the investigator’s discretion.
In the SOC group, DPd was administered in 28-day cycles, and PVd in 21-day cycles, until disease progression, death, intolerable toxicity, withdrawal of consent, or the end of the study. The treatment schedule for PVd was as follows:
For cycles 1 and 2:
Daratumumab subcutaneously: 1,800 mg (co-formulated with recombinant human hyaluronidase PH20) weekly, on days 1, 8, 15, and 22
Pomalidomide orally: 4 mg/day on days 1 to 21
Dexamethasone orally or IV: 40 mg weekly, on days 1, 8, 15, and 22, or could be split, with 20 mg given on days 1, 2, 8, 9, 15, 16, 22, and 23
For cycles 3 to 6:
Daratumumab subcutaneously: 1,800 mg (co-formulated with recombinant human hyaluronidase PH20) every 2 weeks, on days 1 and 15
Pomalidomide orally: 4 mg/day on days 1 to 21
Dexamethasone orally or IV: 40 mg weekly (could be split over 2 days)
For cycle 7 and onward:
Daratumumab subcutaneously: 1,800 mg (co-formulated with recombinant human hyaluronidase PH20) every 4 weeks on day 1
Pomalidomide orally: 4 mg/day on days 1 to 21
Dexamethasone orally or IV: 40 mg weekly (could be split over 2 days)
For all DPd cycles, on days of daratumumab administration, dexamethasone was given 1 to 3 hours before daratumumab.
The treatment schedule for PVd was as follows:
For cycles 1 to 8:
Pomalidomide orally: 4 mg on days 1 to 14
Bortezomib subcutaneously: 1.3 mg/m2 on days 1, 4, 8, and 11
Dexamethasone orally: 20 mg/day on days 1, 2, 4, 5, 8, 9, 11, and 12
For cycle 9 and onward:
Pomalidomide orally: 4 mg on days 1 to 14
Bortezomib subcutaneously: 1.3 mg/m2 on days 1 and 8
Dexamethasone orally: 20 mg/day on days 1, 2, 4, 5, 8, 9, 11, and 12
Crossover from the SOC group to the cilta-cel group was not permitted if patients had disease progression after standard treatment.
Throughout the study, investigators could prescribe concomitant medications or treatments deemed necessary to provide adequate supportive care, such as standard supportive care therapies (e.g., antiemetics, antidiarrheals, and anticholinergics), bisphosphonates, hematopoietic growth factor support and transfusions, antibiotics or anti-infective drugs, and chemotherapy drugs used to treat CAR T-cell–related toxicity. Unless prespecified in the study protocol, any chemotherapy, anticancer immunotherapy (other than cilta-cel), experimental therapies, other immunosuppressant drugs, or posttreatment medications to treat an adverse event were prohibited. Orthopedic surgery and radiotherapy were generally prohibited but could be allowed in the absence of disease progression. Additionally, RANKL inhibitors and pegylated myeloid growth factors were prohibited in the cilta-cel group.
Protocol Amendment
In the CARTITUDE-4 trial, 4 protocol amendments were reported. Protocol amendment 1, made March 20, 2020, removed eligibility for patients with any history of Parkinson disease or other neurodegenerative disorder from study enrolment. Protocol amendment 2, made July 2, 2021, added eligibility for patients with a history of autoimmune disease within 2 years and patients whose serum M protein level was between 0.5 g/dL and 1.0 g/dL. Protocol amendment 3, made June 14, 2022, informed investigators that patients receiving cilta-cel are possibly at higher risk of severe and/or fatal outcomes from COVID-19 infection than patients who are receiving SOC therapy and provided additional guidance for prevention and mitigation. Protocol amendment 4, made August 18, 2022, changed the number of PFS events required to trigger the interim analysis. Per health authority request, the interim analysis would take place after approximately 75% of the total PFS events had been observed.
Outcomes
A list of efficacy end points assessed in this Clinical Review Report is provided in Table 6, followed by descriptions of the outcome measures. Summarized end points are based on outcomes included in the sponsor’s summary of clinical evidence as well as any outcomes identified as important to this review according to the clinical experts consulted for the purpose of this review and input from patient and clinician groups and public drug plans. Using the same considerations, the review team selected the end points that were considered most relevant to inform the expert committee deliberations and finalized this list of end points in consultation with members of the expert committee. All summarized efficacy end points were assessed using GRADE. Select notable harms outcomes considered important for informing the expert committee deliberations were also assessed using GRADE.
Table 6: Outcomes Summarized From the CARTITUDE-4 Study Included in the Systematic Review
Outcome measure | Time point | Type of outcome |
|---|---|---|
Efficacy outcomes | ||
Progression-free survival | At 12 and 24 months | Primarya |
CR or better rate (sCR + CR) | NR | Major secondarya |
VGPR or better rate (sCR + CR + VGPR) | NR | Other |
Overall MRD-negative status | NR | Major secondarya |
Overall survival | At 12 and 24 months | Major secondarya |
Duration of response | At 12 and 24 months | Other |
Health-related quality of life outcomes | ||
Time to worsening of symptoms in the MySIm-Q total symptom score | At 12 and 18 months | Major secondarya |
Safety outcomes | ||
Serious adverse events | NR | Exploratory |
CR = complete response; MRD = minimal residual disease; MySIm-Q = Multiple Myeloma Symptom and Impact Questionnaire; NR = not reported; sCR = stringent complete response; VGPR = very good partial response.
aStatistical testing for these end points was adjusted for multiple comparisons (e.g., hierarchal testing).
Source: 2023 primary Clinical Study Report for CARTITUDE-4 trial.14 Details included in the table are from the sponsor’s summary of clinical evidence.17
Efficacy Outcomes
Progression-Free Survival
PFS was the primary end point for the CARTITUDE-4 trial and was defined as the time from randomization to the date of first documented evidence of confirmed disease progression (based on a validated computerized algorithm) or death due to disease progression, whichever occurred first. The initiation of subsequent antimyeloma therapy was considered an intercurrent event; patients who started subsequent antimyeloma therapies for MM without disease progression were censored at the last disease assessment before the start of subsequent therapies. PFS was considered important to patients and clinicians according to the clinical experts and patient and clinician group inputs. In addition, PFS was used to inform the pharmacoeconomic model submitted to CDA-AMC.
Patients were considered to have disease progression if there was an increase of 25% from the lowest confirmed response value in 1 or more of the following based on the IMWG response criteria:42
Serum M protein absolute increase (must be at least 0.5 g/dL)
Serum M protein increase of at least 1 g/dL, if the lowest monoclonal component was at least 5 g/dL
Urine M protein (absolute increase must be at least 200 mg per 24 hours)
In patients without measurable serum and urine M protein levels, the difference between involved and uninvolved FLC levels (absolute increase must be greater than 10 mg/dL)
In patients without measurable serum and urine M protein levels and without measurable involved FLC levels, bone marrow plasma cell percentage irrespective of baseline status (absolute increase must be at least 10%)
Definite increase in the size of existing bone lesions or soft tissue plasmacytomas
Definite development of new bone lesions or soft tissue plasmacytomas
At least a 50% increase in circulating plasma cells (minimum of 200 cells per microlitre) if this is the only measure of disease
Development of plasma cell leukemia
CR or Better Rate
The CR or better rate was a major secondary end point for the CARTITUDE-4 trial, which was defined as the proportion of patients who experienced a CR or sCR. The CR or better rate was considered important to clinicians according to the clinical experts and clinician group inputs. The definitions of CR and sCR were based on the IMWG response criteria:42
CR: Negative immunofixation on the serum and urine and disappearance of any soft tissue plasmacytomas and less than 5% plasma cells in bone marrow aspirates. In patients whose serum and urine M protein are not measurable, a normal FLC ratio is required.
sCR: CR as defined above plus a normal FLC ratio and an absence of clonal cells in bone marrow biopsy by immunohistochemistry (kappa-lambda ratio ≤ 4:1 or ≥ 1:2 for patients with kappa and lambda light chains, respectively, after counting ≥ 100 plasma cells).
VGPR or Better Rate
The VGPR or better rate was defined as the proportion of patients who experienced a VGPR or better (i.e., sCR, CR, or VGPR). Response to treatment was analyzed by a validated computerized algorithm. The VGPR or better rate was considered important to clinical experts. The definition of VGPR was based on the IMWG response criteria:42
Serum and urine M protein are detectable by immunofixation but not on electrophoresis or there is at least a 90% reduction in serum M protein plus a urine M protein level of less than 100 mg per 24 hours.
If the serum and urine M protein are not measurable, a reduction of at least 90% in the difference between involved and uninvolved FLC levels is required (i.e., a greater than 90% reduction in serum M protein plus a urine M protein of less than 100 mg per 24 hours).
Overall Response Rate
ORR was a major secondary end point for the CARTITUDE-4 trial and was defined as the proportion of patients who experienced a PR or better (i.e., sCR, CR, VGPR, or PR). Response to treatment was analyzed by a validated computerized algorithm. The definition of PR was based on the IMWG response criteria:42
At least a 50% reduction of serum M protein plus a reduction in 24-hour urinary M protein by at least 90% or to less than 200 mg per 24 hours
If the serum and urine M protein are unmeasurable, at least a 50% decrease in the difference between involved and uninvolved FLC levels in place of the M protein criteria
If the serum and urine M protein are unmeasurable and the serum free light assay is also unmeasurable, at least a 50% reduction in plasma cells in place of M protein, provided the baseline bone marrow plasma cell percentage was at least 30%.
In addition to these criteria, if soft tissue plasmacytomas were present at baseline, at least a 50% reduction in their size (sum of the products of the maximal perpendicular diameters of measured lesions) was also required.
Overall MRD Negativity Rate
Overall MRD negativity rate was a major secondary end point for the CARTITUDE-4 trial and was defined as the proportion of patients who have MRD-negative status (at 10-5) by bone marrow aspirate after the date of randomization and before the start of subsequent antimyeloma therapy. Achievement of MRD negativity has been associated with depth of clinical response and prolongation of PFS and OS.43 MRD status results were reported based on next-generation sequencing and postrandomization assessment. The overall MRD negativity rate was considered important to clinical experts.
Overall Survival
OS was assessed as a major secondary end point in the CARTITUDE-4 trial and was defined as the time from the date of randomization to the date of the patient’s death due to any cause. Patients who were lost to follow-up were censored at the time of loss to follow-up. Patients who died after consent withdrawal were considered as having an OS event. If the patient was alive at the cut-off date for the analysis or their survival status was unknown, then the patient’s data were censored at the date the patient was last known to be alive. The date they were last known to be alive was determined by the maximum collection or assessment date from among selected data domains within the clinical database. OS was considered important to clinicians according to the clinical experts and clinician group input. In addition, OS was used to inform the pharmacoeconomic model submitted to the drug agency.
Duration of Response
DOR was assessed among patients who experienced a PR or better from the date of initial documentation of a response of sCR, CR, VGPR, or PR until the date of first documented evidence of progressive disease based on the computerized algorithm, according to the IMWG response criteria, or until death due to any cause, whichever occurred first. Patients who had not experienced disease progression and were alive were censored at the last disease evaluation before the start of subsequent antimyeloma therapy. DOR was considered important to clinical experts.
Health-Related Quality of Life
Time to Worsening of Symptoms in the MySIm-Q Total Symptom Score
HRQoL, assessed using time to worsening of symptoms according to the MySIm-Q total symptom score, was a major secondary end point in the CARTITUDE-4 trial and was defined as the interval from the date of randomization to the start date of worsening in the MySIm-Q total symptom score. Worsening was defined as a worsening in the given minimal important difference threshold compared to baseline without subsequent improvement to a score above this level. The minimal important difference proposed by the sponsor was a decrease in score that is at least half of the standard deviation from the baseline values, where standard deviation was calculated from the scores at baseline combining both treatment groups. Death due to disease progression was considered as worsening. Patients whose data did not meet the definition of worsening (e.g., a patient experienced worsening by at least the minimal important difference but experienced an improvement and showed no worsening afterward) were censored at the last assessment date of the MySIm-Q. HRQoL was considered important to patients and clinicians according to the clinical experts and patient and clinician group inputs. Refer to Table 7 for details of the MySIm-Q. However, the MySIm-Q instrument is a newly developed questionnaire and specific for MM; no other assessment (e.g., quantitative measures) is available. Furthermore, there is only 1 statistical method, lacking distribution-based methods or anchor-based methods to confirm the MIDs.
Safety Outcomes
In the CARTITUDE-4 trial, adverse events were coded using the Medical Dictionary for Regulatory Activities and graded according to the National Cancer Institute Common Terminology Criteria for Adverse Events (Version 5.0), with the exception of CRS, which was evaluated according to the American Society for Transplantation and Cellular Therapy grading system. TEAEs were defined as adverse events with onset during the treatment phase or that were a consequence of a pre-existing condition that had worsened since baseline. Notable harms included CRS, neurotoxicity (including ICANS), B-cell aplasia, hypogammaglobulinemia, and immune suppression.
Table 7: Summary of Patient-Reported Outcome Measures and Their Measurement Properties
Outcome measure | Type | Conclusions about measurement properties | MID |
|---|---|---|---|
MySlm-Q | The MySIm-Q is a disease-specific patient-reported outcome assessment complementary to the EORTC QLQ-C30. It includes 17 items, resulting in a symptom subscale and an impact subscale. The recall period is the “past 7 days,” and responses are reported on a 5-point verbal rating scale. | The instrument is a newly developed questionnaire and specific for MM; no other assessment (e.g., quantitative measures) is available. Validity: The instrument was validated for content and face validity using hybrid interviews. The cultural appropriateness of the instrument was assessed by a translatability assessment, after which the questionnaire was finalized. The MySIm-Q was deployed for an in-trial psychometric validation.44 Reliabilities: Most items demonstrated strong reliability (item response theory slopes range: 1 to 4) for both symptom and impact constructs.44 Responsive: Responsive items were recommended for inclusion into the list of concepts, potentially responsive items were scrutinized further in concept elicitation interviews, and unresponsive items were excluded from further consideration. Psychometric evidence identified the items assessing the following symptoms as relevant and responsive: multiple aspects of pain, needing rest, trouble sleeping, feeling weak, appetite loss, worry, difficulty with self-care, limitations in usual activities, social impacts, feeling tense, depression, and anxiety.44 | The MID was suggested by the sponsor as a decrease in score that is at least half of the standard deviation from the baseline values, where the standard deviation was calculated from the scores at baseline combining both treatment groups. |
EORTC QLQ-C30 = European Organisation for Research and Treatment of Cancer Quality of Life Questionnaire Core 30; MID = minimal important difference; MM = multiple myeloma; MySIm-Q = Multiple Myeloma Symptom and Impact Questionnaire.
Statistical Analysis
Analysis of the clinical end points in the CARTITUDE-4 trial is summarized in Table 8.
Sample Size and Power Calculation
The sample size calculation was based on the assumption that cilta-cel can reduce the risk of progressive disease or death by 35% (i.e., an HR of 0.65 for cilta-cel versus SOC, which translated to a median PFS of 20 months for the cilta-cel group, assuming the median PFS for the SOC group was 13 months). Approximately 400 participants (200 per treatment group) were randomized. A total of 250 PFS events was required to achieve approximately 90% power to detect an HR of 0.65 with a log-rank test (2-sided alpha of 0.05). The sample size calculation took into consideration an estimated annual dropout rate of 5% and 1 interim analysis for PFS, to be performed once approximately 188 PFS events (i.e., 75% of the total planned PFS events) had been observed.
Statistical Test or Model
Analysis of the primary end point, PFS, was based on the intention-to-treat (ITT) analysis set, and the Kaplan-Meier method was used to estimate the distribution of overall PFS for each treatment group. Both treatment groups received the same bridging therapy for approximately 2 cycles (about 8 weeks) after randomization; no separation of the Kaplan-Meier curves was expected a priori. Given that a regular log-rank test would lead to a loss of power in such a scenario of nonproportional hazards, the prespecified primary analysis of the PFS end point used a constant piecewise weighted (CPW) log-rank test.
Prespecified primary analysis using the CPW log-rank test was performed by applying a weight of 0 for the first 8 weeks postrandomization and a weight of 1 afterward in the log-rank statistic. The P value from a stratified CPW log-rank test was reported. The HR for the cilta-cel group versus the SOC group and its 95% CI were estimated based on a stratified Cox regression model, with treatment as the sole explanatory variable. Stratification factors used in the stratified analyses included physician’s choice of PVd or DPd, ISS disease stage (I, II, or III), and number of prior lines of therapy (1 versus 2 or 3).
Multiple Testing Procedure
The null hypothesis of no difference between the 2 treatment groups was tested at the 0.05 significance level (overall). The exact significance level for superiority in the PFS interim analysis was determined by the observed number of events using the O’Brien-Fleming boundaries as implemented by the Lan-DeMets alpha spending method. Assuming 188 PFS events were observed at the interim analysis, the 2-sided alpha was to be spent in the interim analysis is 0.0193, and it would be 0.0442 for the final analysis. If the observed 2-sided P value was smaller than 0.0193 or 0.0442 at the interim or final analysis, respectively, the superiority of cilta-cel over PVd or DPd with respect to PFS would be established.
A hierarchical procedure was used to account for multiplicity incurred from testing the primary and secondary end points. Each hypothesis for secondary outcomes was only tested if the null hypotheses for the primary outcome and all preceding secondary outcomes were rejected. The secondary efficacy end points were tested in a hierarchal manner, with a 2-sided significance level of 0.05 (overall), in the following order:
CR or better rate
ORR
overall MRD negativity rate
OS
time to worsening of symptoms in the MySIm-Q total symptom score.
Data Imputation Methods
No data imputation methods were reported for the CARTITUDE-4 trial.
Subgroup Analyses
Subgroup analyses were performed on the primary efficacy end point of PFS in the ITT analysis set. Subgroups analyses did not take multiplicity into account. The following subgroups are considered relevant based on input from the clinical experts consulted for this review:
patients with 1 prior line of therapy
patients with ISS disease stage III
patients with high-risk cytogenetics
patients’ prior drug exposure
patients with presence of extramedullary plasmacytomas
patients’ baseline ECOG PS
refractory status of patients’ disease to class of drug.
Additionally, analyses of prespecified subgroups based on age, sex, race, geography, prior drug exposure, and additional clinical characteristics (e.g., type of myeloma, tumour burden, bone marrow plasma cell percentage, total CAR-positive viable T cells infused [ × 106 cells], baseline tumour B-cell maturation antigen expression, baseline renal and hepatic function) were conducted.
Sensitivity Analyses
In the CARTITUDE-4 trial, sensitivity and supplementary analyses were performed for PFS as follows:
Sensitivity analyses:
Standard “unweighted” stratified log-rank test
Progressive disease based on investigator assessment according to IMWG, with standard “unweighted” stratified log-rank test
Progressive disease based on investigator assessment according to IMWG, with stratified CPW log-rank test
In addition to the prespecified sensitivity analyses based on investigator assessment, the sponsor conducted an analysis of PFS based on Independent Review Committee assessment with stratified CPW log-rank test as requested by the FDA.
Supplementary analyses:
Not censored for start of subsequent antimyeloma therapies: The PFS was derived from the algorithm without censoring data due to the start of subsequent antimyeloma therapies for patients who have not experienced progressive disease. This analysis was performed in a similar manner to the primary analysis, and the PFS definition was similar to that used in the primary analysis, except that progression or death that occurred after the start of subsequent antimyeloma therapies for MM was not censored at the last disease assessment before the start of subsequent therapies. If there was no confirmed progressive disease, the patient was censored at the last disease assessment before loss to follow-up or withdrawal of consent to the study.
Restricted mean survival time: The proportional hazards assumption was checked via graphical method as well as via formal statistical testing (i.e., Grambsch-Therneau test). Only if the test of the proportional hazards assumption failed at a 2-sided significance level of 0.2, was the restricted mean survival time method performed.45 The restricted mean survival time was measured by the area under the Kaplan-Meier PFS curve up to the selected time point, which was calculated for each treatment group, where the selected time point was the smaller value of the longest PFS event time observed from either the cilta-cel group or the SOC group. The difference in restricted mean survival time and 95% CI was reported.
Censored for death due to COVID-19: The PFS definition used in this analysis is similar to that used in the primary analysis, except as relates to censoring data on death due to COVID-19. Death due to COVID-19 was considered as a PFS event. Instead, patients who died due to COVID-19 were censored at the last disease assessment before the death.
Secondary and Other Outcomes
A summary of statistical analysis of efficacy end points is provided in Table 8.
The CR or better rate, VGPR or better rate, ORR, MRD negativity rate, and time to worsening of symptoms in the MySIm-Q total symptom score were calculated for each treatment group in the ITT analysis set. For each outcome, the corresponding 95% Clopper-Pearson exact CI was provided. The stratified Cochran-Mantel-Haenszel estimate of the OR and its 95% CI and P value was used to test if the CR or better rate, VGPR or better rate, ORR, or MRD negativity rate was the same between the 2 treatment groups. The stratification factors used in these analyses (except for the analysis of the VGPR or better rate) included physician’s choice of PVd or DPd, ISS disease stage (I, II, or III), and number of prior lines of therapy (1 versus 2 or 3). Of note, the analysis of the VGPR or better rate was not included in the hierarchical testing procedure; thus, the results were considered supportive.
Four analyses for OS were planned. The first and second interim analyses for OS were to be performed at the same time as the interim and final analysis for PFS. The third interim analysis for OS was to be performed when approximately 200 OS events had occurred. The final OS analysis was to be performed when approximately 250 OS events had occurred, which also marks the end of study. If the median OS for the SOC group is 31 months and being in the cilta-cel group reduces the risk of death by 30% (HR = 0.7), this translates into a median OS of 44.3 months for the cilta-cel group. The alpha spending function for OS used the power (Kim-DeMets) spending function with a parameter of 2. For example, if the observed number of OS events is 114 at the time of the first interim analysis for PFS (i.e., approximately 188 PFS events), the alpha to be spent for OS is 0.0104 (2 sided). This report focuses on the OS results from the interim analysis (data cut-off date: November 1, 2022), as results from other analyses were not available at the time of this review. The analysis consisted of a stratified log-rank test for the comparison of the OS distribution between the 2 treatment groups, stratified by 3 factors: physician’s choice of PVd versus DPd, ISS disease stage at screening (I, II, or III), and number of prior lines of therapy (1 versus 2 or 3). The Kaplan-Meier method was used to estimate the distribution of overall OS for each treatment. The treatment effect (i.e., HR) and its 2-sided 95% CI were estimated using a stratified Cox regression model with treatment as the sole explanatory variable.
The analysis of DOR was based on patients in the ITT analysis set who experienced a response (PR or better). The distribution of DOR was estimated using the Kaplan-Meier method. Given that DOR was calculated for a subset of patents who had a PR or better, the ITT principle was not strictly followed, and no formal statistical comparison of DOR between the treatment groups was made.
The analysis of time to worsening of symptoms in the MySIm-Q total symptom score was performed in a similar manner as described for PFS.
Analysis Populations
A summary of the analysis populations used in the CARTITUDE-4 trial that are relevant to this review is provided in Table 9.
Table 8: Statistical Analysis of Efficacy End Points
End point | Statistical model | Adjustment factors | Handling of missing data | Sensitivity analyses |
|---|---|---|---|---|
Progression-free survival | Kaplan-Meier method |
| None | Planned sensitivity analyses:
|
CR or better rate | 2-sided 95% exact confidence interval |
| None | Disease response based on investigator assessment according to IMWG. |
VGPR or better rate | 2-sided 95% exact confidence interval | NA | None | Disease response based on investigator assessment according to IMWG. |
Overall response rate | 2-sided 95% exact confidence interval |
| None | Disease response based on investigator assessment according to IMWG. |
Overall MRD negativity rate | 2-sided 95% exact confidence interval |
| None | For MRD-negative rate, analysis was conducted with a 10-5 threshold. MRD negativity rate in participants who experienced CR or sCR at 12 ± 3 months was presented by investigator assessment as a sensitivity analysis. |
Overall survival | Kaplan-Meier method |
| None | Censoring for death due to COVID-19. |
Duration of response | Kaplan-Meier method | NA | None | Performed using disease response based on computerized algorithm, investigator assessment according to IMWG, or death due to any cause, whichever occurred first. |
Time to worsening in MySIm-Q total symptom score | Kaplan-Meier method | NA | None | Censoring for death due to COVID-19. |
CPW = constant piecewise weighted; CR = complete response; DPd = daratumumab-pomalidomide-dexamethasone; IMWG = International Myeloma Working Group; ISS = International Staging System; MRD = minimal residual disease; MySIm-Q = Multiple Myeloma Symptom and Impact Questionnaire; NA = not applicable; PVd = pomalidomide-bortezomib-dexamethasone; sCR = stringent complete response; VGPR = very good partial response; vs. = versus.
Source: 2023 primary Clinical Study Report for CARTITUDE-4 trial.14 Details included in the table are from the sponsor’s summary of clinical evidence.17
Table 9: Analysis Populations of the CARTITUDE-4 Trial
Population | Definition | Application |
|---|---|---|
ITT analysis set | Includes patients who were randomized in the study | Primary analysis set for efficacy and for summaries of study populations, disposition, demographics, and baseline characteristics |
Safety analysis set | Patients who received any part of the study treatment as of the clinical cut-off date of November 1, 2022 | Safety summaries |
ITT = intention to treat.
Source: 2023 primary Clinical Study Report for CARTITUDE-4 trial.14 Details included in the table are from the sponsor’s summary of clinical evidence.17
Results
Patient Disposition
A total of 516 patients were screened of which 97 (23.2%) were excluded at the screening phase. A total of 419 patients were randomized: 208 patients in the cilta-cel group and 211 patients in the SOC group. Of the 419 patients, 416 received the study treatment and comprised the safety analysis set (208 patients in the cilta-cel group and 208 patients in the SOC group); 3 patients were randomized to the SOC group but did not receive treatment. A lower percentage of patients in the cilta-cel group discontinued the study treatment than in the SOC group (15.4% versus 63.0% for cilta-cel versus SOC). The most common primary reasons for treatment discontinuation were progressive disease (14.4% versus 56.3% for cilta-cel versus SOC) and death (1.0% versus 2.4%). Of the 32 patients in the cilta-cel group who discontinued the study treatment, 30 patients (14.4% of the overall cilta-cel group) discontinued on or after bridging therapy and before the start of the conditioning regimen and 2 (1.0%) discontinued on or after the conditioning regimen and before cilta-cel infusion. The most commonly reason for treatment discontinuation among these 32 patients was progressive disease (30 patients [14.4% of the overall cilta-cel group]). As of the data cut-off date of November 1, 2022, a higher percentage of patients were still on the study treatment in the cilta-cel group than in the SOC group (81.3% versus 75.8%).
Table 10: Summary of Patient Disposition From CARTITUDE-4 Trial (All-Consented Set; Data Cut-Off: November 1, 2022)
Patient disposition | Cilta-cel (N = 208) | SOC (N = 211) |
|---|---|---|
Screened, N | 516 | |
Did not meet screening criteria, n (%) | 97 | |
Randomized, N | 208 | 211 |
Treated, n (%) | 208 (100.0) | 208 (98.6) |
Discontinued study treatment, n (%) | 32 (15.4) | 131 (63.0) |
Adverse events | 0 | 3 (1.4) |
Death | 2 (1.0) | 5 (2.4) |
Progressive disease | 30 (14.4) | 117 (56.3) |
Physician decision | 0 | 1 (0.5) |
Patients refused further study treatment | 0 | 5 (2.4) |
Discontinued study, n (%) | 39 (18.8) | 51 (24.2) |
Death | 39 (18.8) | 47 (22.3) |
Withdrawal by patient | 0 | 4 (1.9) |
Still on study, n (%) | 169 (81.3) | 160 (75.8) |
Postinfusion follow-up (cilta-cel group) or study treatment (SOC group) | 0 | 77 (36.5) |
Posttreatment follow-up | 143 (68.8) | 1 (0.5) |
Survival follow-up | 26 (12.5) | 82 (38.9) |
ITT analysis set, N | 208 | 211 |
Safety analysis set, N | 208 | 208 |
Cilta-cel = ciltacabtagene autoleucel; ITT = intention to treat; SOC = standard of care.
Source: 2023 primary Clinical Study Report for CARTITUDE-4 trial.14 Details included in the table are from the sponsor’s summary of clinical evidence.17
Major Protocol Deviations
In the CARTITUDE-4 trial at the interim analysis (data cut-off date: November 1, 2022), the incidence of important protocol deviations was slightly higher in the cilta-cel group than in the SOC group (█████ ███ ████ for cilta-cel versus SOC) (Table 11). Overall, commonly reported important protocol deviations were received wrong treatment or incorrect dose █████ ███ █████ and other █████ ███ ██████ which were reported more frequently in the cilta-cel group than in the SOC group.
Table 11: Summary of Important Protocol Deviations From CARTITUDE-4 Trial (ITT Analysis Set; Data Cut-Off: November 1, 2022)
Major protocol deviations | Cilta-cel (N = 208) | SOC (N = 211) |
|---|---|---|
Patients with major protocol deviation, n (%) | ██ █████ | | █████ |
Other | | █████ | | █████ |
Received wrong treatment or incorrect dose | | █████ | | █████ |
Received a disallowed concomitant treatment | | █████ | | █████ |
Entered but did not satisfy criteria | ██ | | █████ |
Cilta-cel = ciltacabtagene autoleucel; ITT = intention to treat; SOC = standard of care.
Source: 2023 primary Clinical Study Report for CARTITUDE-4 trial.14
Baseline Characteristics
At baseline, overall, the demographic characteristics were well balanced between the 2 treatment groups. The median age of all study participants was 61.0 years with a range of 27 to 80 years. Most of the study participants (57.3%) were male, while 42.7% were female. Most participants were white (74.9%), 8.6% of participants were Asian, 3.1% of participants were Black, 0.5% of participants were of another racial group, and 12.9% of participants did not report their racial group information. Participants were enrolled from 81 sites across 16 countries in Europe (61.3%), North America (15.3%), and other regions (23.4%). At baseline, most of the study participants (56.1%) had an ECOG PS of 0.
Overall, the baseline disease characteristics were balanced between the 2 treatment groups. At baseline, most of the participants were at ISS disease stage I (64.0%), had received 2 lines of therapy (40.9%), had at least 1 high-risk cytogenetic abnormality (61.2%), with gain/amp(1q) being the most commonly reported abnormality (47.0%) among all patients. Generally, the baseline disease history was balanced across the treatment groups.
The baseline characteristics outlined in Table 12 are limited to those that are most relevant to this review or were considered likely to affect the outcomes or interpretation of the study results by the review team.
Table 12: Summary of Baseline Characteristics From CARTITUDE-4 Trial (ITT Analysis Set; Data Cut-Off: November 1, 2022)
Characteristic | Cilta-cel (N = 208) | SOC (N = 211) |
|---|---|---|
Demographics | ||
Age (years) | ||
Mean (SD) | 59.7 (10.1) | 60.4 (9.1) |
Median (range) | 61.5 (27 to 78) | 61.0 (35 to 80) |
Sex, n (%) | ||
Female | 92 (44.2) | 87 (41.2) |
Male | 116 (55.8) | 124 (58.8) |
Race, n (%) | ||
Asian | 16 (7.7) | 20 (9.5) |
Black or African American | 6 (2.9) | 7 (3.3) |
White | 157 (75.5) | 157 (74.4) |
Not reported | 28 (13.5) | 26 (12.3) |
Other | 1 (0.5) | 1 (0.5) |
Ethnicity, n (%) | ||
Hispanic or Latino | 18 (8.7) | 10 (4.7) |
Not Hispanic or Latino | 152 (73.1) | 165 (78.2) |
Not reported | 38 (18.3) | 36 (17.1) |
Weight (kg) | ||
Mean (SD) | 78.5 (18.5) | 76.6 (15.3) |
Median (range) | 79.0 (40.4 to 147.3) | 77.1 (42.8 to 118.1) |
Body surface area (m2) | ||
Mean (SD) | 1.91 (0.3) | 1.9 (0.2) |
Median (range) | 1.9 (1.3 to 2.5) | 1.9 (1.3 to 2.4) |
ECOG PS,a n (%) | ||
0 | 114 (54.8) | 121 (57.3) |
1 | 93 (44.7) | 89 (42.2) |
2 | 1 (0.5) | 1 (0.5) |
Disease characteristics | ||
Type of myeloma by immunofixation, n (%) | ||
IgG | ███ ██████ | ███ ██████ |
IgA | ██ ██████ | ██ ██████ |
IgM | ██ | | █████ |
IgD | | █████ | | █████ |
IgE | ██ | ██ |
Light chain | ██ ██████ | ██ ██████ |
Kappa | ██ ██████ | ██ ██████ |
Lambda | ██ ██████ | ██ ██████ |
Biclonal | | █████ | | █████ |
Negative immunofixation | | █████ | | █████ |
Type of measurable disease, n (%) | ||
Serum only | ███ ██████ | ███ ██████ |
Serum and urine | ██ ██████ | ██ ██████ |
Urine only | ██ ██████ | ██ ██████ |
Serum free light chain only | ██ ██████ | ██ ██████ |
Not evaluable | | █████ | ██ |
ISS disease stage,b n (%) | ||
I | 136 (65.4) | 132 (62.6) |
II | 60 (28.8) | 65 (30.8) |
III | 12 (5.8) | 14 (6.6) |
Time from initial MM diagnosis to randomization (years) | ||
Mean (SD) | ████ █████ | ████ █████ |
Median (range) | ███ ████ ██ █████ | ███ ████ ██ █████ |
Number of lytic bone lesions, n (%) | ||
None | ██ ██████ | ██ ██████ |
1 to 3 | ██ ██████ | ██ ██████ |
4 to 10 | ██ ██████ | ██ ██████ |
More than 10 | ██ ██████ | ██ ██████ |
Presence of soft tissue plasmacytomas, n (%) | ||
Yes | 44 (21.2) | 35 (16.6) |
No | 164 (78.8) | 176 (83.4) |
Presence of evaluable bone marrow assessment, n (%) | ||
Yes | ███ ██████ | ███ ██████ |
No | | ██████ | | █████ |
Percentage of plasma cells, bone marrow biopsy or aspirate,c n (%) | ||
n | 206 | 208 |
≤ 30 | ███ ██████ | ███ ██████ |
> 30 to < 60 | ██ ██████ | ██ ██████ |
≥ 60 | 42 (20.4) | 43 (20.7) |
Cytogenetic risk,d n (%) | ||
n | 207 | 210 |
Standard risk | 69 (33.3) | 70 (33.3) |
High risk (any of the 4 markers abnormal) | 123 (59.4) | 132 (62.9) |
del17p | 49 (23.7) | 43 (20.5) |
t(4 to 14) | 30 (14.5) | 30 (14.3) |
t(14 to 16) | 3 (1.4) | 7 (3.3) |
gain/amp(1q) | 89 (43.0) | 107 (51.0) |
At least 2 of the 4 markers abnormal | 43 (20.8) | 49 (23.3) |
Excluding gain/amp(1q) | ██ ██████ | ██ ██████ |
Unknown | 15 (7.2) | 8 (3.8) |
Prior lines of therapy, n (%) | ||
1 | 68 (32.7) | 68 (32.2) |
2 | 83 (39.9) | 87 (41.2) |
3 | 57 (27.4) | 56 (26.5) |
Disease history | ||
Any comorbidities, n (%) | 202 (97.1) | 205 (97.2) |
Commonly reported comorbidities (≥ 10% of patients), n (%) | ||
Back pain | 34 (16.3) | 26 (12.3) |
Bone pain | ██ ██████ | ██ █████ |
Hypertension | ██ ██████ | ██ ██████ |
Anemia | 32 (15.4) | 39 (18.5) |
Insomnia | 21 (10.1) | 19 (9.0) |
Cilta-cel = ciltacabtagene autoleucel; ECOG PS = Eastern Cooperative Oncology Group performance status; FISH = fluorescence in situ hybridization; Ig = immunoglobulin; ISS = International Staging System; ITT = intention to treat; MM = multiple myeloma; SD = standard deviation; SOC = standard of care.
Notes: The ITT analysis set consists of the patients who were randomized in the study. Baseline measurement is defined as the last nonmissing measurement before the initiation of study treatment.
aThe latest nonmissing ECOG PS score on or before apheresis or cycle 1 day 1 is used. All patients met the inclusion criteria of having an ECOG PS score of 0 or 1 before randomization.
bISS disease stage is derived based on serum beta-2 microglobulin and albumin.
cMaximum value from bone marrow biopsy and bone marrow aspirate is selected if both results are available.
dCytogenetic risk abnormalities are based on central FISH testing, or local FISH and karyotype testing if central FISH testing not available.
Sources: 2023 primary Clinical Study Report for CARTITUDE-4 trial;14 sponsor-provided additional data.15
Exposure to Study Treatments
In the CARTITUDE-4 trial, at the interim analysis (data cut-off date: November 1, 2022), all 208 patients (100.0%) randomized to the cilta-cel group had received bridging therapy (PVd or DPd) (Table 13). Of those, 176 patients ███████ had received the conditioning regimen of cyclophosphamide and fludarabine infusion followed by cilta-cel infusion as study treatment. The median duration of study treatment for the SOC group was ███ ██████ ███████ ███ ██ ████ ██████ for the 26 patients who received PVd and ████ ██████ ███████ ███ ██ ████ ██████ for the 182 patients who received DPd. The median total relative dose intensity for individual drugs was as follows: bortezomib █████ ███████ █████ ██ ███████ in the cilta-cel group and █████ ███████ █████ ██ ███████ in the SOC group; pomalidomide: █████ ███████ █████ ██ ███████ in the cilta-cel group and █████ ███████ █████ ██ ██████ in the SOC group; daratumumab: █████ ███████ █████ ██ ███████ in the cilta-cel group and █████ ███████ █████ ██ ███████ in the SOC group; dexamethasone: █████ ███████ █████ ██ ███████ ██ the cilta-cel group and █████ ███████ █████ ██ ███████ in the SOC group.
Table 13: Summary of Patient Exposure From CARTITUDE-4 Trial (Safety Analysis Set; Data Cut-Off: November 1, 2022)
Exposure | Cilta-cel (N = 208) | SOC (N = 208) | |
|---|---|---|---|
PVd (n = 26) | DPd (n = 182) | ||
Duration (months), median (range) | NR | 4.8 (0.5 to 19.9) | 11.8 (0.5 to 25.2) |
Bridging therapy, n (%) | 208 (100.0) | NA | NA |
Cyclophosphamide and fludarabine infusion | 176 (84.6) | NA | NA |
Cilta-cel | 176 (84.6) | NA | NA |
Cilta-cel = ciltacabtagene autoleucel; DPd = daratumumab-pomalidomide-dexamethasone; NA = not applicable; NR = not reported; PVd = pomalidomide-bortezomib-dexamethasone; SD = standard deviation; SOC = standard of care.
Sources: 2023 primary Clinical Study Report for CARTITUDE-4 trial;14 sponsor-provided additional data.15
Prior Therapies
A summary of the types of prior therapies used in the ITT analysis set is provided in Table 14. ███ ██ ███ ███████ patients in the cilta-cel group and ███ ██ ███ ███████ patients in the SOC group had received 1 or more prior transplant. Generally, the most frequently reported prior systemic therapies (≥ 20% of patients in either treatment group) at baseline were similar between the treatment groups, except for melphalan ██████ ███ █████, which was reported more frequently in the SOC group, and thalidomide █████ █ ███ ████ ███, which was reported more frequently in the cilta-cel group.
Table 14: Summary of Prior Therapies From CARTITUDE-4 Trial (ITT Analysis Set; Data Cut-Off: November 1, 2022)
Prior therapies | Cilta-cel (N = 208) | SOC (N = 211) |
|---|---|---|
Patients with 1 or more prior transplant, n (%) | 171 (82.2) | 185 (87.7) |
Autologous | ███ ██████ | ███ ██████ |
Allogeneic | | █████ | | █████ |
Commonly reported prior systemic therapies for multiple myeloma (≥ 20% of patients), n (%) | ||
Antineoplastic drugs | 208 (100.0) | 211 (100.0) |
Bortezomib | 203 (97.6) | 205 (97.2) |
Melphalan | ███ ██████ | ███ ██████ |
Cyclophosphamide | ██ ██████ | ██ ██████ |
Carfilzomib | 77 (37.0) | 66 (31.3) |
Daratumumab | 51 (24.5) | 54 (25.6) |
Immunosuppressants | 208 (100.0) | 211 (100.0) |
Lenalidomide | 208 (100.0) | 211 (100.0) |
Thalidomide | 100 (48.1) | 82 (38.9) |
Corticosteroids for systemic use | ███ ██████ | ███ ███████ |
Dexamethasone | ███ ██████ | ███ ███████ |
Cilta-cel = ciltacabtagene autoleucel; ITT = intention to treat; SOC = standard of care.
Sources: 2023 primary Clinical Study Report for CARTITUDE-4 trial;14 sponsor-provided additional data.15
Refractory Status to Prior Therapies
The refractory status of patients’ disease to prior therapies by treatment group in the CARTITUDE-4 trial in the ITT set (data cut-off: November 1, 2022) is presented in Table 15. The refractory status to prior therapies was similar in the cilta-cel and SOC groups. All patients (100%) in the cilta-cel and SOC groups had disease that was refractory to a prior line of therapy at some point. The most reported therapies were PI (49.5% versus 45.5% for cilta-cel versus SOC), any PI plus an IMiD (49.5% versus 45.5%), and any anti-CD38 mAB (24.0% versus 21.8%). Most patients (98.6% in both groups) had disease that was refractory to their last line of prior therapy; all patients in both groups had disease that was refractory to lenalidomide.
Table 15: Summary of Refractory Status to Prior Multiple Myeloma Therapy From CARTITUDE-4 Trial (ITT Analysis Set; Data Cut-Off: November 1, 2022)
Refractory status to prior therapies | Cilta-cel (N = 208) | SOC (N = 211) |
|---|---|---|
Refractory at any point to prior therapy, n (%) | 208 (100.0) | 211 (100) |
Any PI | 103 (49.5) | 96 (45.5) |
PI + IMiD | 103 (49.5) | 96 (45.5) |
Any anti-CD38 mAB | 50 (24.0) | 46 (21.8) |
IMiD + anti-CD38 mAB | 50 (24.0) | 46 (21.8) |
PI + anti-CD38 mAB | 30 (14.4) | 33 (15.6) |
PI + IMiD + anti-CD38 mAB | 30 (14.4) | 33 (15.6) |
At least 2 PIs + at least 2 IMiDs + 1 anti-CD38 mAB | 2 (1.0) | 1 (0.5) |
Refractory to last line of prior therapy, n (%) | 205 (98.6) | 208 (98.6) |
Lenalidomide | 208 (100.0) | 211 (100.0) |
Bortezomib | 55 (26.4) | 48 (22.7) |
Carfilzomib | 51 (24.5) | 45 (21.3) |
Daratumumab | 48 (23.1) | 45 (21.3) |
Thalidomide | ██ █████ | ██ █████ |
Ixazomib | 15 (7.2) | 17 (8.1) |
Pomalidomide | 8 (3.8) | 9 (4.3) |
Isatuximab | | █████ | | █████ |
Elotuzumab | | █████ | | █████ |
Cilta-cel = ciltacabtagene autoleucel; IMiD = immunomodulatory drug; ITT = intention to treat; mAB = monoclonal antibody; PI = proteasome inhibitor; SOC = standard of care.
Source: 2023 primary Clinical Study Report for CARTITUDE-4 trial.14
Concomitant Medications
A summary of the concomitant medications used in the ITT analysis set is provided in Table 16. All patients (100%) in the cilta-cel and SOC groups received at least 1 concomitant medication. At baseline, generally, the most frequently reported concomitant medications (≥ 30% of patients in either treatment group) were used by a higher proportion of patients in the cilta-cel group than the SOC group, except for nucleosides and nucleotides excluding reverse transcriptase inhibitors ██████ ███ █████ for cilta-cel versus SOC, respectively), proton pump inhibitors ██████ ███ ███████ other viral vaccines ██████ ███ ███████ and potassium █████ ███ ███████, which were reported similarly between groups, and bisphosphonates ██████ ███ ██████ and osmotically acting laxatives██████ ███ ███████, which were reported less frequently in the cilta-cel group.
Table 16: Summary of Concomitant Medications From CARTITUDE-4 Trial (Safety Analysis Set; Data Cut-Off: November 1, 2022)
Concomitant medications | Cilta-cel (N = 208) | SOC (N = 208) |
|---|---|---|
Patients with 1 or more concomitant medications, n (%) | 208 (100.0) | 208 (100.0) |
Commonly reported concomitant medications (≥ 30% of patients), n (%) | ||
Nucleosides and nucleotides excluding reverse transcriptase inhibitors | ███ ██████ | ███ ██████ |
Aciclovir | ███ ██████ | ███ ██████ |
Valaciclovir | ██ ██████ | ██ ██████ |
Other viral vaccines | ███ ██████ | ███ ██████ |
COVID-19 vaccine | ███ ██████ | ███ ██████ |
Proton pump inhibitors | ███ ██████ | ███ ██████ |
Pantoprazole | ██ ██████ | ██ ██████ |
Omeprazole | ██ ██████ | ██ ██████ |
Colony-stimulating factors | ███ ██████ | ███ ██████ |
Filgrastim | ███ ██████ | ███ ██████ |
Combinations of sulfonamides and trimethoprim, including derivatives | ███ ██████ | ███ ██████ |
Sulfamethoxazole and trimethoprim | ███ ██████ | ███ ██████ |
Anilides | ███ ██████ | ███ ██████ |
Paracetamol | ███ ██████ | ███ ██████ |
Salicylic acid and derivatives | ███ ██████ | ███ ██████ |
Acetylsalicylic acid | ███ ██████ | ███ ██████ |
Heparin group | ███ ██████ | ██ ██████ |
Enoxaparin | ██ ██████ | ██ ██████ |
Fluoroquinolones | ███ ██████ | ██ ██████ |
Levofloxacin | ██ ██████ | ██ ██████ |
Combinations of penicillins, including beta-lactamase inhibitors | ███ ██████ | ██ ██████ |
Piperacillin-tazobactam | ██ ██████ | ██ ██████ |
Glucocorticoids | ██ ██████ | ██ ██████ |
Immunoglobulin human normal | ███ ██████ | ██ ██████ |
Benzodiazepine derivatives | ██ ██████ | ██ ██████ |
Preparations inhibiting uric acid production | ██ ██████ | ██ ██████ |
Allopurinol | ██ ██████ | ██ ██████ |
Serotonin (5ht3) antagonists | ███ ██████ | ██ ██████ |
Ondansetron | ██ ██████ | ██ ██████ |
Bisphosphonates | ██ ██████ | ██ ██████ |
Zoledronic acid | ██ ██████ | ██ ██████ |
Potassium | ██ ██████ | ██ ██████ |
Salt solutions | ██ ██████ | ██ ██████ |
Sodium chloride | ██ ██████ | ██ ██████ |
Propulsives | ██ ██████ | ██ ██████ |
Metoclopramide | ██ ██████ | ██ ██████ |
Plain sulfonamides | ██ ██████ | ██ ██████ |
Furosemide | ██ ██████ | ██ ██████ |
Magnesium | ██ ██████ | ██ ██████ |
Other antiepileptics | ██ ██████ | ██ ██████ |
Osmotically acting laxatives | ██ ██████ | ██ ██████ |
Interleukin inhibitors | ██ ██████ | | █████ |
Tocilizumab | ██ ██████ | | █████ |
Cilta-cel = ciltacabtagene autoleucel; SOC = standard of care.
Source: Sponsor-provided additional data.15
Subsequent Treatment
In the interim analysis of the ITT set (data cut-off date: November 1, 2022), fewer patients in the cilta-cel group received subsequent antimyeloma therapy than in the SOC group (█████ ███ ██████ (Table 17). With respect to the most reported subsequent treatment for MM (≥ 5% of patients in either group), higher proportions of patients were observed in the SOC group, except for cilta-cel (████ ███ |). This is because for patients in the cilta-cel group who experienced disease progression before receiving cilta-cel and went on to receive cilta-cel, the cilta-cel infusion was considered as part of their subsequent therapy.
Table 17: Summary of Subsequent Treatment From CARTITUDE-4 Trial (ITT Analysis Set; Data Cut-Off: November 1, 2022)
Subsequent treatment | Cilta-cel (N = 208) | SOC (N = 211) |
|---|---|---|
Patients with 1 or more subsequent antimyeloma therapy, n (%) | ██ ██████ | ███ ██████ |
Commonly reported subsequent treatment for multiple myeloma (≥ 5% of patients), n (%) | ||
Therapeutic class/pharmacologic class/drug | ||
Antineoplastic drugs | ██ ██████ | ███ ██████ |
Other antineoplastic drugs | ██ ██████ | ██ ██████ |
Carfilzomib | ██ █████ | ██ ██████ |
Bortezomib | | █████ | ██ ██████ |
Cisplatin | ██ █████ | ██ █████ |
Cilta-cela | ██ █████ | ██ |
CAR T cells (not otherwise specified) | ██ | ██ █████ |
Alkylating drugs | ██ ██████ | ██ ██████ |
Cyclophosphamide | ██ ██████ | ██ ██████ |
Monoclonal antibodies and antibody drug conjugates | ██ █████ | ██ ██████ |
Talquetamab | | █████ | ██ █████ |
Belantamab mafodotin | | █████ | ██ █████ |
Daratumumab | | █████ | ██ █████ |
Teclistamab | ██ | ██ █████ |
Plant alkaloids and other natural products | ██ █████ | ██ ██████ |
Etoposide | ██ █████ | ██ ██████ |
Cytotoxic antibiotics and related substances | ██ █████ | ██ ██████ |
Doxorubicin | ██ █████ | ██ ██████ |
Antimetabolites | ██ █████ | ██ █████ |
Fludarabine | ██ █████ | ██ █████ |
Corticosteroids for systemic use | ██ ██████ | ██ ██████ |
Dexamethasone | ██ ██████ | ██ ██████ |
Immunosuppressants | | █████ | ██ █████ |
Pomalidomide | | █████ | ██ █████ |
Investigational drug | ██ | ██ █████ |
CAR = chimeric antigen receptor; cilta-cel = ciltacabtagene autoleucel; ITT = intention to treat; SOC = standard of care.
aFor patients in the cilta-cel group who experienced disease progression before receiving cilta-cel and went on to receive cilta-cel, the cilta-cel infusion was considered as part of their subsequent therapy.
Source: 2023 primary Clinical Study Report for CARTITUDE-4 trial.14 Details included in the table are from the sponsor’s summary of clinical evidence.17
Efficacy
Progression-Free Survival
In the interim analysis (data cut-off date: November 1, 2022), the median duration of follow-up for PFS was 15.8 months (range, 0.2 months to 27.3 months) in the cilta-cel group and 15.3 months (range, 0 months to 25.4 months) in the SOC group (Table 18). Patients in the cilta-cel group had fewer PFS events, as assessed using a computerized algorithm, than in the SOC group. Sixty-five patients (31.3%) in the cilta-cel group and 122 patients (57.8%) in the SOC group experienced an event; among them, 48 (23.1%) experienced disease progression and 17 (8.2%) died in the cilta-cel group, and 118 (55.9%) experienced disease progression and 4 (1.9%) died in the SOC group. The median PFS was not reached (95% CI, 22.8 months to not estimable) for the cilta-cel group and was 11.8 months (95% CI, 9.7 months to 13.8 months) for the SOC group. The Kaplan-Meier estimate of PFS probability at 12 months was 75.9% (95% CI, 69.4% to 81.1%) for the cilta-cel group and 48.6% (95% CI, 41.5% to 55.3%) for the SOC group; the between-group difference was █████ ████ ███ █████ ██ ██████. At 24 months, the Kaplan-Meier estimate of PFS probability was █████ ████ ███ █████ ██ ██████ for the cilta-cel group and █████ ████ ███ ████ ██ ██████ for the SOC group; the between-group difference was not reported. The interim analysis showed an improvement in PFS for patients receiving cilta-cel compared with SOC (HR = 0.26; 95% CI, 0.18 to 0.38; P < 0.0001). This means that patients in the cilta-cel group were 74% less likely to experience of death or progression than patients in the SOC group. The Kaplan-Meier estimate of the PFS distribution among the interim analysis population is depicted in Figure 2.
The results for all planned sensitivity analysis — including PFS based on computerized algorithm analyzed by the standard unweighted stratified log-rank test (HR = 0.40; 95% CI, 0.29 to 0.55; nominal P < 0.0001), PFS based on investigator assessment of disease progression (HR = 0.39; 95% CI, 0.28 to 0.52; nominal P < 0.0001), standard unweighted stratified CPW (HR = 0.25; 95% CI, 0.18 to 0.37; nominal P < 0.0001), and PFS based on Independent Review Committee assessment of disease progression (HR = 0.26; 95% CI, 0.18 to 0.38; nominal P < 0.0001) — were consistent with the primary analysis across all prespecified and additional sensitivity analyses.46 Subgroup analyses of PFS based on a computerized algorithm in the primary analysis were consistent with the primary analysis across all prespecified subgroups. Refer to Appendix 1 for the detailed subgroup analyses data.
Figure 2: Kaplan-Meier Estimates of Progression-Free Survival in the Interim Analysis (ITT Analysis Set; Data Cut-Off: November 1, 2022)
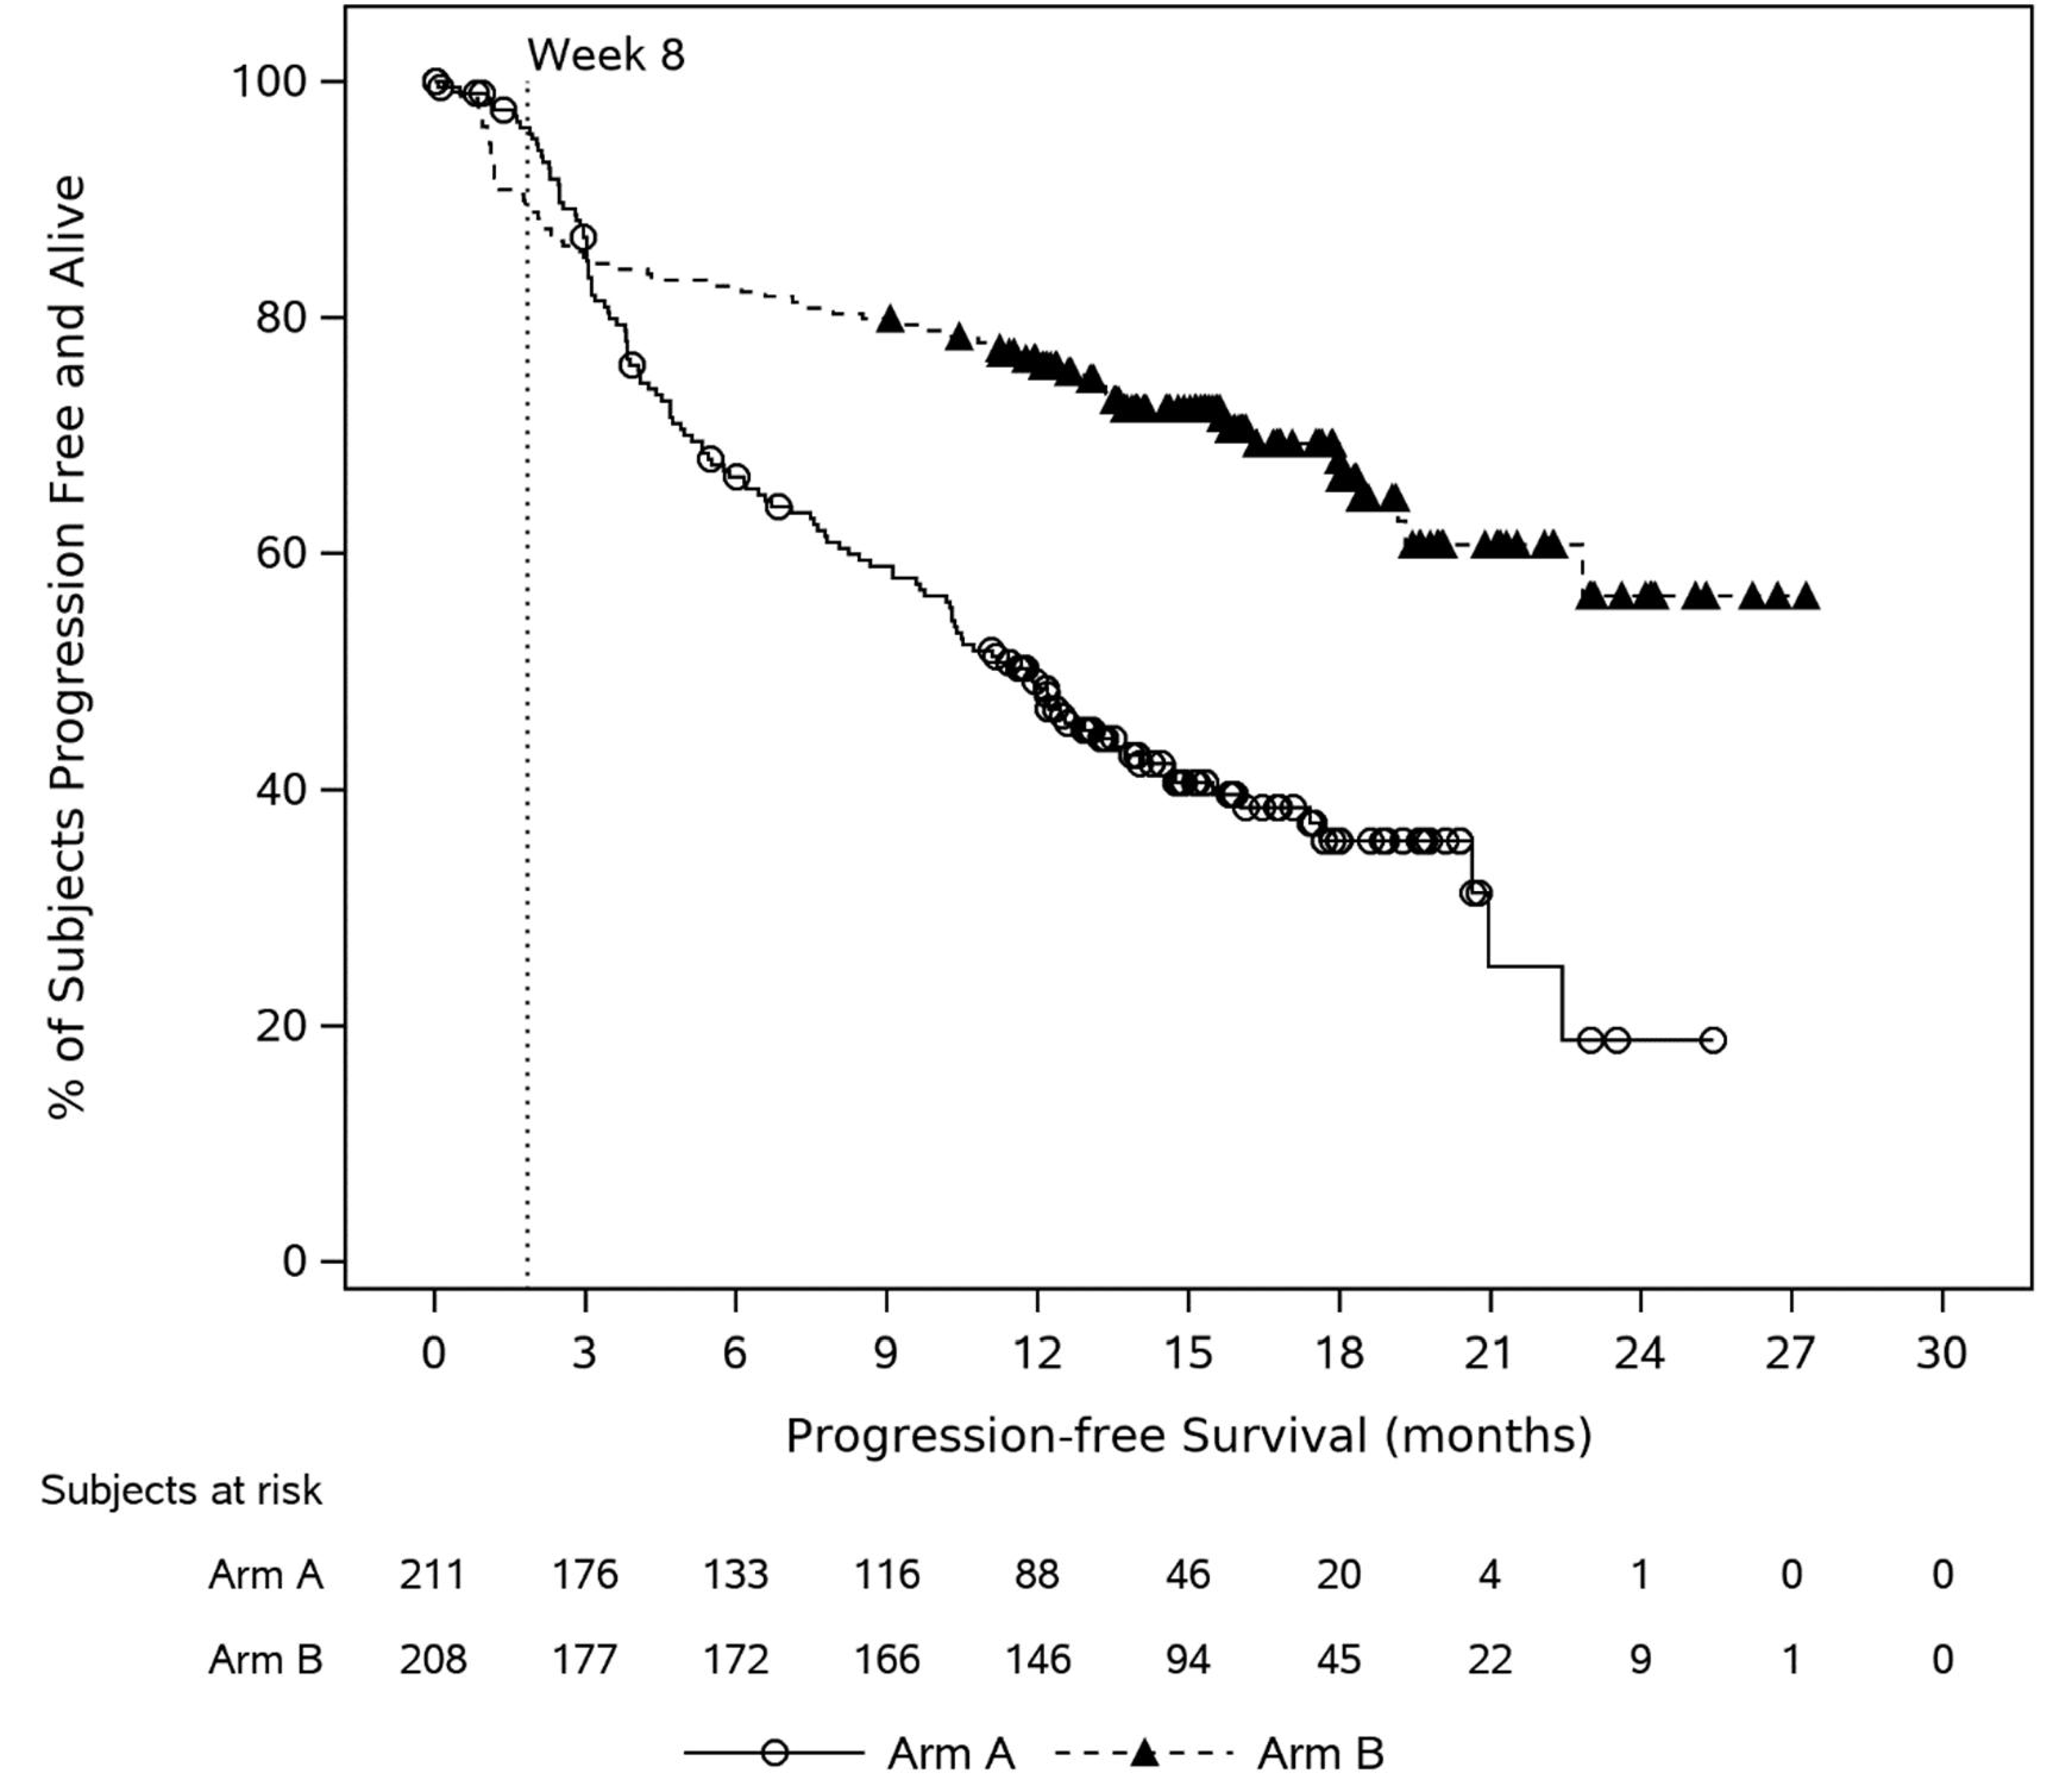
Cilta-cel = ciltacabtagene autoleucel; DPd = daratumumab-pomalidomide-dexamethasone; ITT = intention to treat; PVd = pomalidomide-bortezomib-dexamethasone.
Note: Arm A = PVd or DPd; Arm B = A sequence of apheresis, bridging therapy (PVd or DPd), conditioning regimen (cyclophosphamide and fludarabine), and cilta-cel infusion.
Source: 2023 primary Clinical Study Report for CARTITUDE-4 trial.14
CR or Better Rate
In the interim analysis (data cut-off date: November 1, 2022), the CR or better (sCR or CR) rate determined by computerized algorithm was higher in the cilta-cel group than in the SOC group (73.1% versus 21.8% for cilta-cel versus SOC) (Table 18). Among patients who experienced CR or better, 58.2% (95% CI, 51.2% to 65.0%) of patients in the cilta-cel group and 15.2% (95% CI, 10.6% to 20.7%) of patients in the SOC group had an sCR, and 14.9% (95% CI, 10.4% to 20.5%) of patients in the cilta-cel group and 6.6% (95% CI, 3.7% to 10.9%) of patients in the SOC group had a CR. The stratified Cochran–Mantel–Haenszel estimate of the OR was 10.3 (95% CI, 6.5 to 16.4; P < 0.0001). Similar results for CR or better rate were observed for the sensitivity analysis in which determination of response was based on investigator assessment.
VGPR or Better Rate
In the interim analysis (data cut-off date: November 1, 2022), ███ ███████ patients in the cilta-cel group and ██ ███████ patients in the SOC group reported a VGPR or better (i.e., sCR, CR, or VGPR). The stratified Cochran–Mantel–Haenszel estimate of OR was ███ (95% CI, ███ ██ ███; nominal P < 0.0001). Among patients who experienced a VGPR or better, 8.2% (95% CI, 4.8% to 12.8%) of patients in the cilta-cel group and 23.7% (95% CI, 18.1% to 30.0%) of patients in the SOC had a VGPR. Similar results for VGPR or better rate were observed for the sensitivity analysis in which determination of response was based on investigator assessment.
Overall Response Rate
In the interim analysis (data cut-off date: November 1, 2022), the ORR (sCR, CR, VGPR, or PR) determined by computerized algorithm was higher in the cilta-cel group than in the SOC group (84.6% versus 67.3% for cilta-cel versus SOC). The stratified Cochran–Mantel–Haenszel estimate of the OR was 3.0 (95% CI, 1.8 to 5.0; P < 0.0001). The sections on the CR or better rate and the VGPR or better rate outline how many patients experienced an sCR, CR, or VGPR; 3.4% (95% CI, 1.4% to 6.8%) of patients in the cilta-cel group and 21.8% (95% CI, 16.4% to 28.0%) of patients in the SOC group experienced a PR. Similar rates of overall response were observed for the sensitivity analysis in which determination of response was based on investigator assessment.
Overall MRD Negativity Rate
A higher proportion of patients were reported to have negative overall MRD in bone marrow determined by next-generation sequencing in the cilta-cel group than in the SOC group (60.6% versus 15.6% for cilta-cel versus SOC; OR = 8.7; 95% CI, 5.4 to 13.9; P < 0.0001) in the interim analysis (data cut-off: November 1, 2022).
Overall Survival
At the time of the interim analysis (data cut-off: November 1, 2022), the median OS had not been reached in the cilta-cel group and was 26.7 months (95% CI, 22.5 months to not estimable) in the SOC group. With a median follow-up of 16.0 months for the cilta-cel group and 15.9 months for the SOC group, there were 39 deaths observed in the cilta-cel group (18.8% of patients) and 47 deaths observed in the SOC group (22.3% of patients). The HR was 0.78 (95% CI, 0.50 to 1.20; P = 0.2551). The Kaplan-Meier estimate of OS probabilities decreased from 84.1% (95% CI, 78.4% to 88.4%) to █████ ████ ███ █████ ██ ██████ in the cilta-cel group and from 83.6% (95% CI, 77.8% to 88.0%) to █████ ████ ███ █████ ██ ██████ in the SOC group from 12 to 24 months. A supplementary OS analysis that censored patients who died due to COVID-19 showed results consistent with the primary OS analysis, with an HR of 0.64 (95% CI, 0.41 to 1.02; nominal P = 0.0598), favouring the cilta-cel group. The Kaplan-Meier estimate of the OS distribution among the interim analysis population is depicted in Figure 3.
While the median OS had not been reached at the time of the interim analysis (data cut-off: November 1, 2022), the sponsor provided a descriptive update of OS for the ITT analysis set (based on the survival sweep dated December 13, 2023, which was performed at the request of the European Medicines Agency), with a median follow-up of 28.7 months. The update indicated a trend favouring OS benefit for the cilta-cel group compared to the SOC group, with a HR of 0.57 (95% CI, 0.40 to 0.83). Although the median OS was not reached at this time, the estimated 24-month OS probabilities were 78.8% (95% CI, 72.6% to 83.8%) for the cilta-cel group and 66.2% (95% CI, 59.3% to 72.2%) for the SOC group.47 Please refer to Appendix 1 for the Kaplan-Meier estimate of the OS distribution based on the survival sweep.
Figure 3: Kaplan-Meier Plot for Overall Survival (ITT Analysis Set; Data Cut-Off: November 1, 2022)
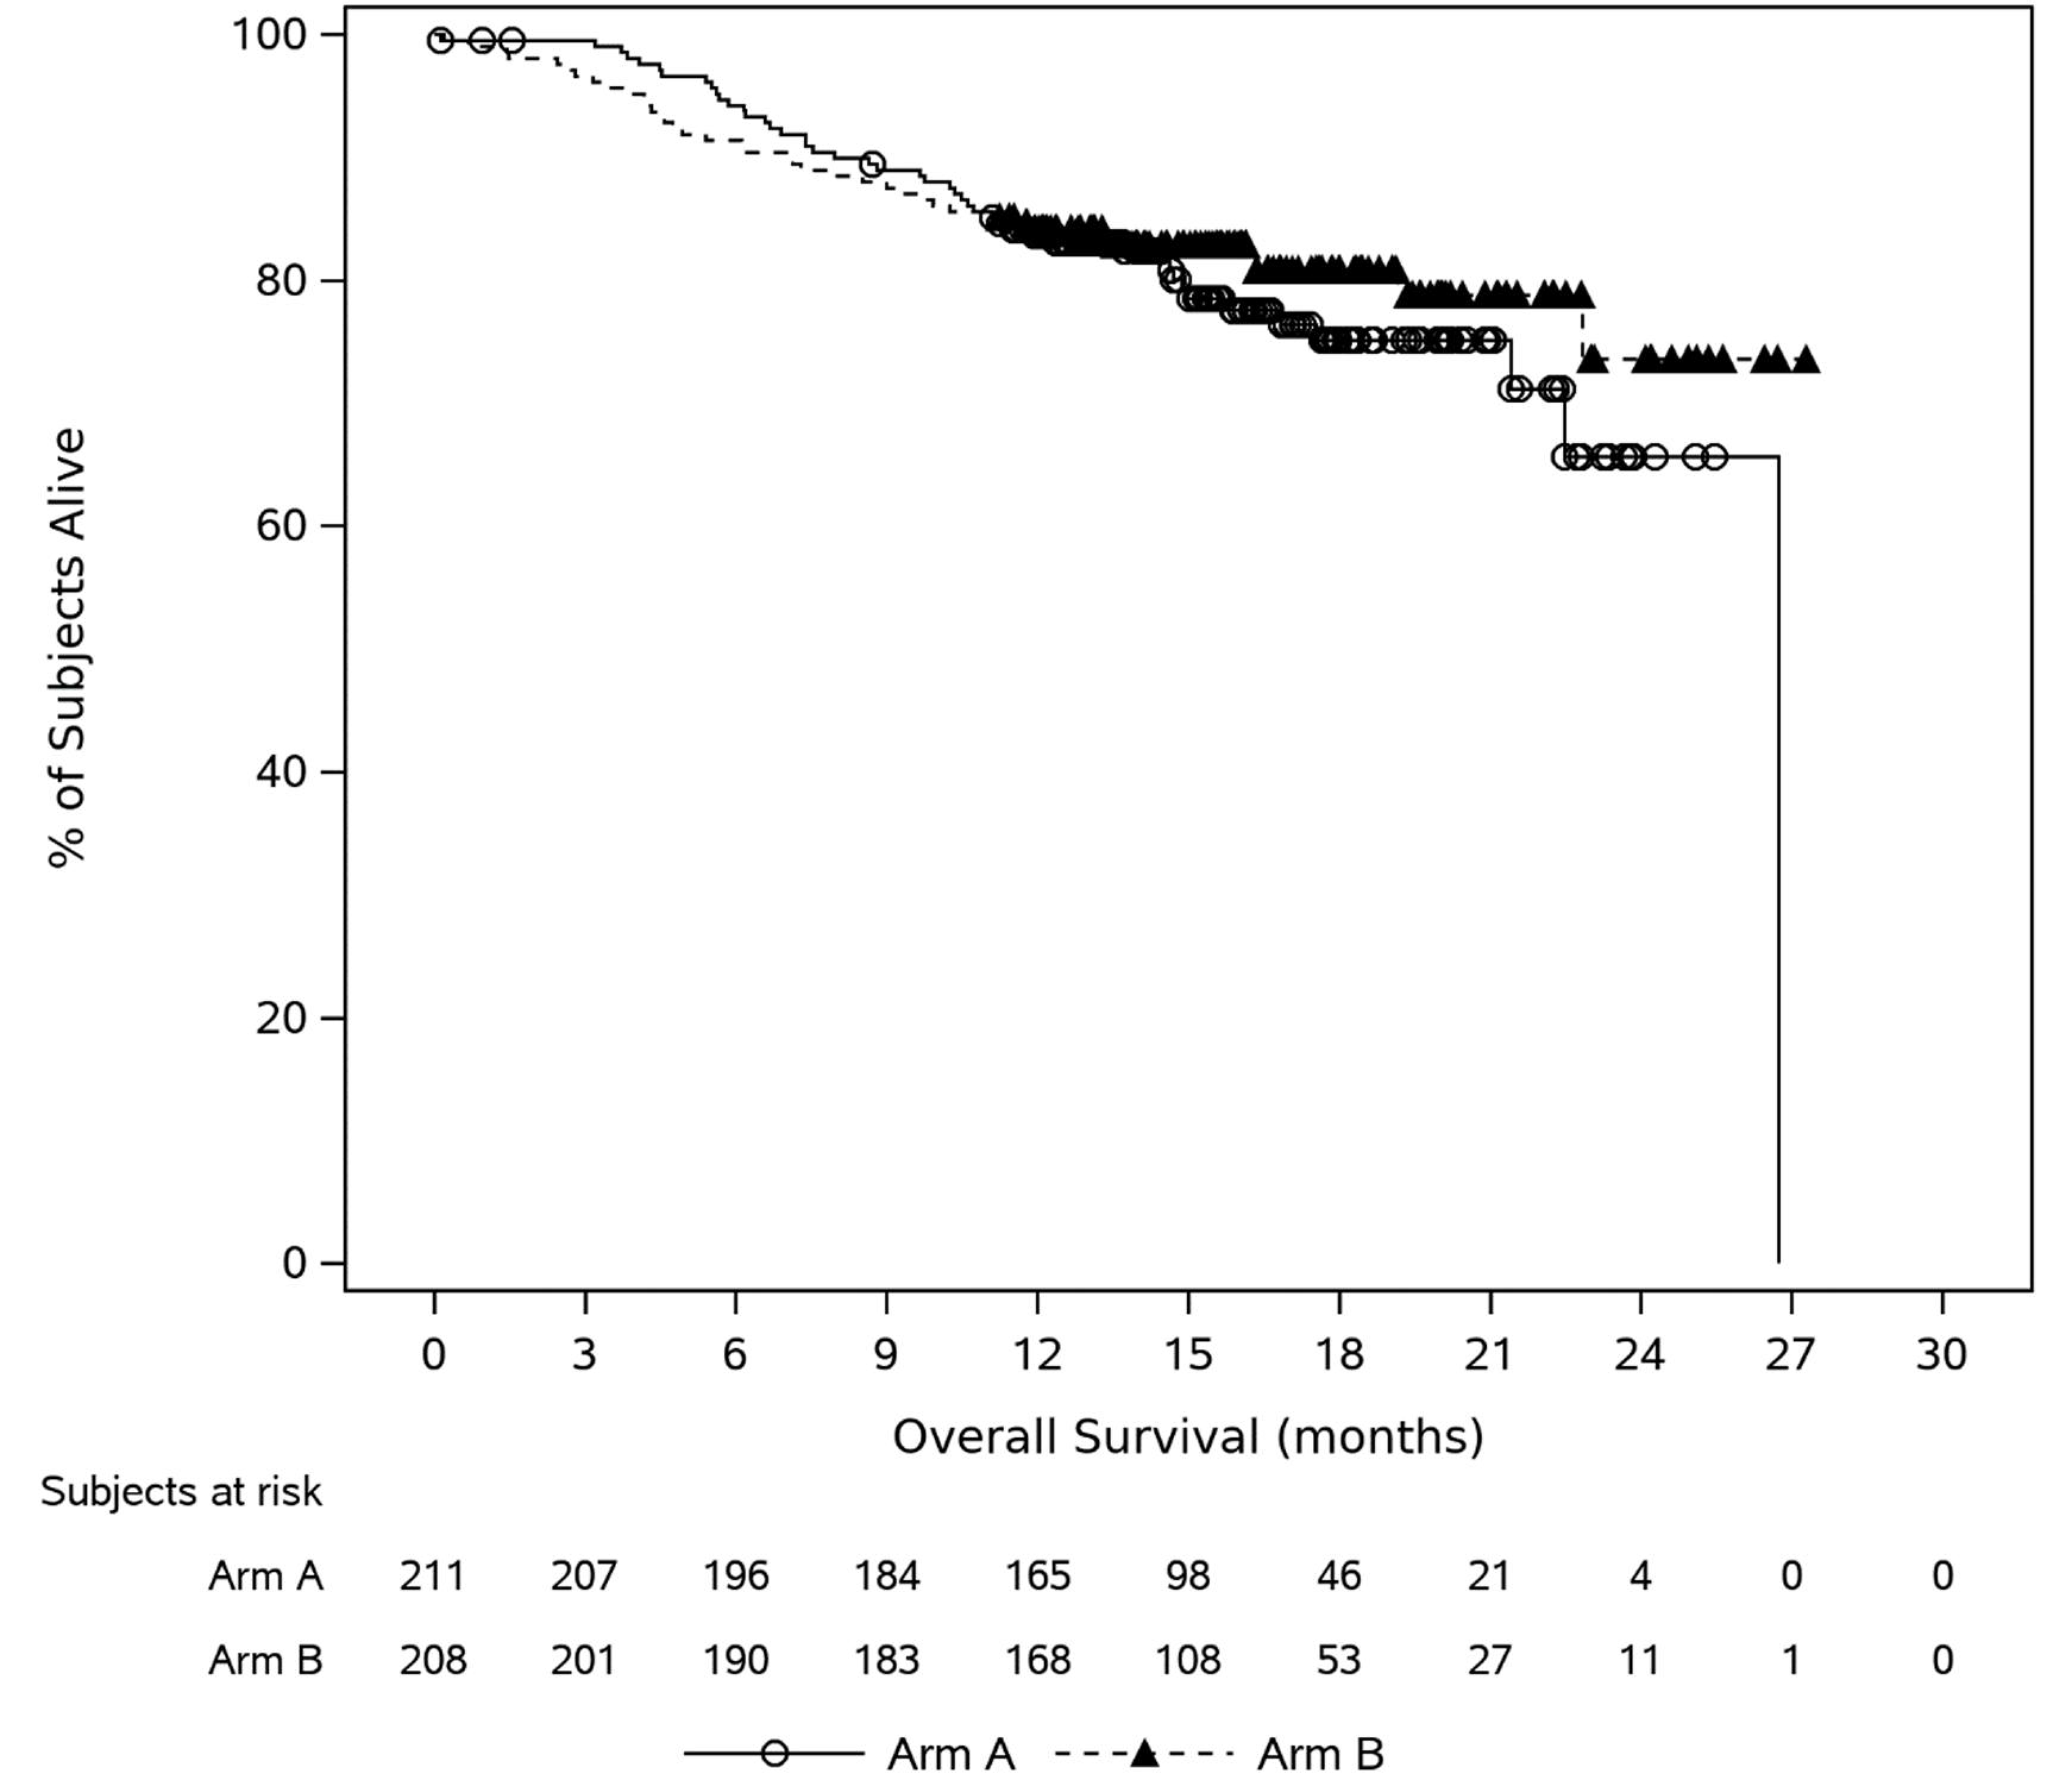
ITT = intention to treat.
Source: 2023 primary Clinical Study Report for CARTITUDE-4 trial.14
Duration of Response
At the time of the interim analysis (data cut-off: November 1, 2022), the median DOR had not been reached in the cilta-cel group and was ████ █████ █████ ██████ ██ ███ ██████████ in the SOC group. The median follow-up was13.7 months for the cilta-cel group and 14.3 months for the SOC group. Of the patients who experienced a PR or better (176 versus 142 for cilta-cel versus SOC), 143 patients (81.3%) in the cilta-cel group and 80 patients (56.3%) in the SOC group were censored. The Kaplan-Meier estimate of event-free probabilities decreased from 84.7% (95% CI, 78.1% to 89.4%) to █████ ████ ███ █████ ██ ██████ in the cilta-cel group and from 63.0% (95% CI, 54.2% to 70.6%) to █████ ████ ███ █████ ██ ██████ in the SOC group from 12 to 24 months. The Kaplan-Meier estimate of the DOR distribution among the interim analysis population is depicted in Figure 4.
Figure 4: Kaplan-Meier Plot for Duration of Response (Patients With a PR or Better; ITT Analysis Set; Data Cut-Off: November 1, 2022)
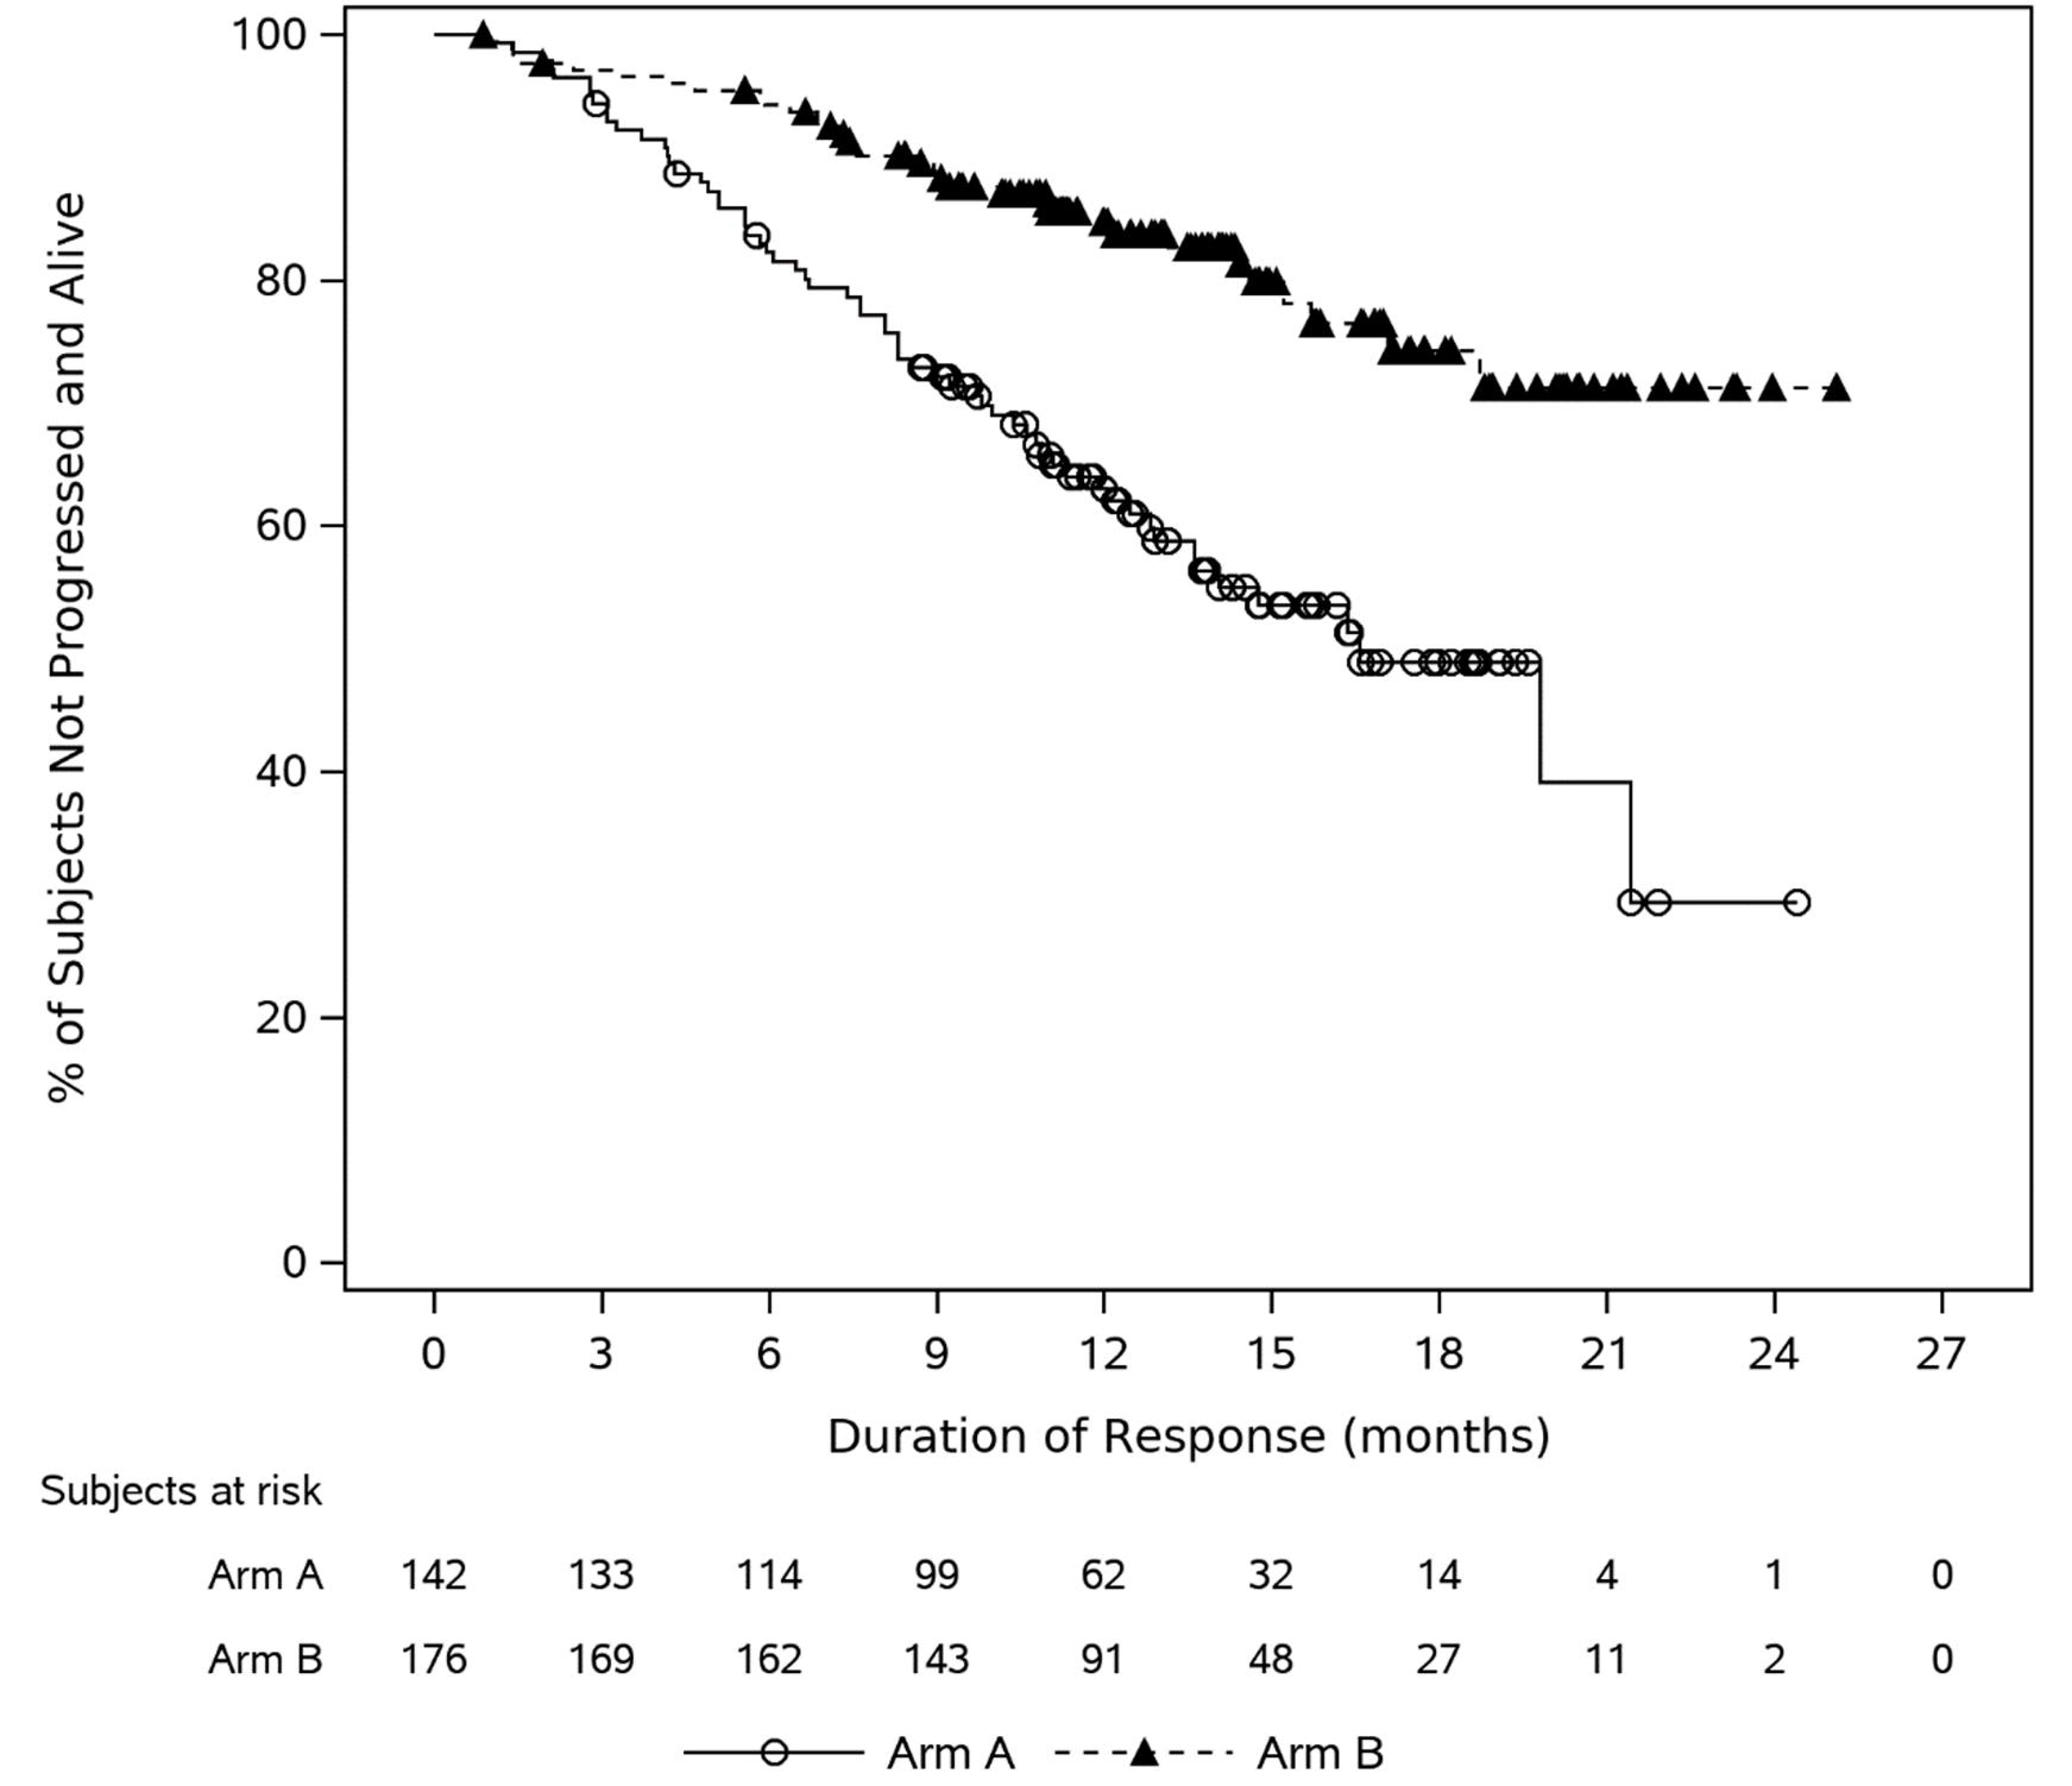
ITT = intention to treat; PR = partial response.
Source: 2023 primary Clinical Study Report for CARTITUDE-4 trial.14
Time to Worsening of Symptoms in MySIm-Q Total Symptom Score
At the time of the interim analysis (data cut-off: November 1, 2022), most participants (85.6% versus 78.2% for cilta-cel versus SOC) had been censored (Table 18). The median time to a sustained worsening of MM symptoms was longer for the cilta-cel group (23.7 months) than for the SOC group (18.9 months), with an HR of 0.42 (95% CI, 0.26 to 0.68; nominal P = 0.0003). The analysis of the time to worsening in MySIm-Q total symptom score was not tested formally at the current interim analysis because it follows OS in the hierarchical testing order and OS was not statistically significant at the time of the clinical cut-off (November 1, 2022). The Kaplan-Meier estimate of event-free probabilities decreased from 84.6% (95% CI, 77.7% to 89.6%) to █████ (95% CI, █████ ██ █████) in the cilta-cel group and from 65.6% (95% CI, 55.2% to 74.2%) to █████ (95% CI, █████ ██ █████) in the SOC group from 12 to 18 months. Kaplan-Meier curves for time to worsening in the MySIm-Q total symptom score are depicted in Figure 5.
Figure 5: Kaplan-Meier Plot for Time to Worsening in MySIm-Q: Total Symptom Subscale (ITT Analysis Set; Data Cut-Off: November 1, 2022) [Redacted]

ITT = intention to treat; MySIm-Q = Multiple Myeloma Symptom and Impact Questionnaire.
Source: 2023 primary Clinical Study Report for CARTITUDE-4 trial.14
Table 18: Summary of Key Efficacy Results From CARTITUDE-4 Trial (ITT Analysis Set; Data Cut-Off: November 1, 2022)
End points | Cilta-cel N = 208 | SOC N = 211 |
|---|---|---|
PFS | ||
Follow-up time (months), median (range) | 15.8 (0.2 to 27.3) | 15.3 (0 to 25.4) |
Patients with events, n (%) | 65 (31.3) | 122 (57.8) |
Disease progression | 48 (23.1) | 118 (55.9) |
Death | 17 (8.2) | 4 (1.9) |
Censored, n (%) | 143 (68.8) | 89 (42.2) |
Kaplan-Meier estimate of PFS (months), median (95% CI) | NE (22.8 to NE) | 11.8 (9.7 to 13.8) |
Kaplan-Meier estimate of PFS probability at 12 months, % (95% CI) | 75.9 (69.4 to 81.1) | 48.6 (41.5 to 55.3) |
Absolute difference in PFS probability between study groups at 12 months, % (95% CI) | ████ █████ ██ █████ | |
Kaplan-Meier estimate of PFS probability at 24 months, % (95% CI) | ███ ███ ██ ████ | ████ ████ ██ █████ |
Absolute difference in PFS probability between study groups at 24 months, % (95% CI) | NRa | |
HR (95% CI)b | 0.26 (0.18 to 0.38) | |
P valuec | < 0.0001 | |
Overall best confirmed response | ||
Follow-up time (months), median (range) | 15.8 (0.2 to 27.3) | 15.3 (0 to 25.4) |
Response rate by category | ||
sCR, n (%) | 121 (58.2) | 32 (15.2) |
95% CI | 51.2 to 65.0 | 10.6 to 20.7 |
CR, n (%) | 31 (14.9) | 14 (6.6) |
95% CI | 10.4 to 20.5 | 3.7 to 10.9 |
VGPR, n (%) | 17 (8.2) | 50 (23.7) |
95% CI | 4.8 to 12.8 | 18.1 to 30.0 |
PR, n (%) | 7 (3.4) | 46 (21.8) |
95% CI | 1.4 to 6.8 | 16.4 to 28.0 |
CR or better (sCR + CR), n (%) | 152 (73.1) | 46 (21.8) |
95% CI | 66.5 to 79.0 | 16.4 to 28.0 |
Absolute between-group difference, % (95% CI) | ████ █████ ██ █████ | |
OR (95% CI)d | 10.3 (6.5 to 16.4) | |
P valuee | < 0.0001 | |
VGPR or better (sCR + CR + VGPR), n (%) | ███ ██████ | ██ ██████ |
95% CI | ████ ██ ████ | ████ ██ ████ |
Absolute between-group difference, % (95% CI) | ████ █████ ██ █████ | |
OR (95% CI)d | ███ ████ ██ ████ | |
Nominal P valuee | < 0.0001 | |
Overall response (sCR + CR + VGPR + PR) | 176 (84.6) | 142 (67.3) |
95% CI | 79.0 to 89.2 | 60.5 to 73.6 |
Absolute between-group difference, % (95% CI) | ████ ████ ██ █████ | |
OR (95% CI)d | 3.0 (1.8 to 5.0) | |
P valuee | < 0.0001 | |
Overall MRD negativity rate at 10-5 in bone marrow | ||
Follow-up time (months), median (range) | 10.9 (0 to 25.8) | 12.3 (0 to 22.4) |
Overall MRD negativity rate (10-5), n (%) | 126 (60.6) | 33 (15.6) |
95% CIf | 53.6 to 67.3 | 11.0 to 21.3 |
Absolute between-group difference, % (95% CI) | ████ █████ ██ █████ | |
OR (95% CId) | 8.7 (5.4 to 13.9) | |
P valueg | < 0.0001 | |
OS | ||
Follow-up time (months), median (range) | 16.0 (0.2 to 27.3) | 15.9 (0.1 to 26.7) |
Patients with events, n (%) | 39 (18.8) | 47 (22.3) |
Censored, n (%) | 169 (81.3) | 164 (77.7) |
Kaplan-Meier estimate of OS (months), median (95% CI) | NE (NE to NE) | 26.7 (22.5 to NE) |
Kaplan-Meier estimate of OS probability at 12 months, % (95% CI) | 84.1 (78.4 to 88.4) | 83.6 (77.8 to 88.0) |
Absolute difference in OS probability between study groups at 12 months, % (95% CI) | ███ █████ ██ ████ | |
Kaplan-Meier estimate of OS probability at 24 months, % (95% CI) | ███ ███ ██ ████ | ███ ███ ██ ████ |
Absolute difference in OS probability between study groups at 24 months, % (95% CI) | NRa | |
HR (95% CI)b | 0.78 (0.50 to 1.20) | |
P valueh | 0.2551 | |
DOR | ||
Follow-up time (months), median (range) | 13.7 (0.9 to 25.1) | 14.3 (0.8 to 24.4) |
Patients who experienced PR or better contributing to the analysis, n | 176 | 142 |
Patients with events, n (%) | 33 (18.8) | 62 (43.7) |
Censored, n (%) | 143 (81.3) | 80 (56.3) |
Kaplan-Meier estimate of DOR (months), median (95% CI) | NE (NE to NE) | ████ █████ ██ ███ |
Kaplan-Meier estimate of event-free probability at 12 months, % (95% CI) | 84.7 (78.1 to 89.4) | 63.0 (54.2 to 70.6) |
Absolute difference in event-free probability between study groups at 12 months, % (95% CI) | ████ █████ ██ █████ | |
Kaplan-Meier estimate of event-free probability at 24 months, % (95% CI) | ███ ███ ██ ████ | ███ ███ ██ ████ |
Absolute difference in event-free probability between study groups at 24 months, % (95% CI) | NRi | |
HR (95% CI) | NRi | |
P value | NRi | |
Time to worsening in MySIm-Q total symptom score | ||
Follow-up time (months), median (range) | 12.4 (0 to 23.7) | 12.0 (0 to 23.0) |
Patients with events, n (%) | 30 (14.4) | 46 (21.8) |
Censored, n (%) | 178 (85.6) | 165 (78.2) |
Kaplan-Meier estimate of time to worsening (months), median (95% CI) | 23.7 (22.1 to NE) | 18.9 (16.8 to NE) |
12-month event-free rate, % (95% CI) | 84.6 (77.7 to 89.6) | 65.6 (55.2 to 74.2) |
Absolute difference in event-free probability between study groups at 12 months, % (95% CI) | ████ ████ ██ █████ | |
18-month event-free rate, % (95% CI) | ███ ███ ██ ████ | ███ ███ ██ ████ |
Absolute difference in event-free probability between study groups at 18 months, % (95% CI) | ████ ████ ██ █████ | |
HR (95% CI)b | 0.42 (0.26 to 0.68) | |
Nominal P valueh,j | 0.0003 | |
CI = confidence interval; cilta-cel = ciltacabtagene autoleucel; CPW = constant piecewise weighted; CR = complete response; DOR = duration of response; DPd = daratumumab-pomalidomide-dexamethasone; HR = hazard ratio; ISS = International Staging System; ITT = intention to treat; MRD = minimal residual disease; MySIm-Q = Multiple Myeloma Symptom and Impact Questionnaire; NE = not estimable; NR = not reported; OR = odds ratio; OS = overall survival; PFS = progression-free survival; PR = partial response; PVd = pomalidomide-bortezomib-dexamethasone; sCR = stringent complete response; SOC = standard of care; VGPR = very good partial response.
aThe median follow-up duration was 15.9 months at the interim analysis; thus, the 24-month PFS or OS data were immature.
bHR and 95% CI were from a Cox proportional hazards model with treatment as the sole explanatory variable and stratified by physician’s choice (PVd or DPd), ISS disease stage (I, II, III), and number of prior lines (1 vs. 2 or 3) as randomized, including only PFS events that occurred more than 8 weeks postrandomization. A HR less than 1 indicates an advantage for the cilta-cel group.
cP value was based on the CPW log-rank test (weight = 0 in the log-rank statistic for the first 8 weeks postrandomization, and 1 afterward), stratified by physician’s choice (PVd or DPd), ISS disease stage (I, II, III), and number of prior lines (1 vs. 2 or 3) as randomized.
dA Cochran-Mantel-Haenszel estimate of the common OR for stratified tables is used. An OR greater than 1 indicates an advantage for the cilta-cel group. The stratification factors are physician’s choice (PVd or DPd), ISS disease stage (I, II, III), and number of prior lines of therapy (1 vs. 2 or 3) as randomized.
eP value from the Cochran-Mantel-Haenszel chi-square test.
fExact 95% CI.
gP value from Fisher exact test.
hP value was based on the log-rank test stratified by physician’s choice (PVd or DPd), ISS disease stage (I, II, III), and number of prior lines (1 vs. 2 or 3) as randomized.
iDOR was calculated among responders (with a partial or better response) from the date of initial documentation of a response, which means the intention-to-treat principle was not strictly followed. With this, the statistical inference between 2 treatment arms with regarding to DOR is not recommended.
jThis end point was not tested formally at the current interim analysis because it followed OS in the hierarchical testing order and OS was not significant at the time of clinical cut-off due to immaturity of the data.
Sources: 2023 primary Clinical Study Report for CARTITUDE-4 trial;14 sponsor-provided additional data.15,16 Details included in the table are from the sponsor’s summary of clinical evidence.17
Harms
Harms data in the CARTITUDE-4 trial interim analysis (data cut-off: November 1, 2022) are summarized in Table 19.
Treatment-Emergent Adverse Events
In the CARTITUDE-4 trial, all patients from both groups experienced at least 1 TEAE. By system organ class, the most common TEAEs were blood and lymphatic system disorders, including neutropenia (89.9% versus 85.1% for cilta-cel versus SOC), anemia (54.3% versus 26.0%), and thrombocytopenia (54.3% versus 31.3% for cilta-cel versus SOC). Other common TEAEs were gastrointestinal disorders, affecting 154 patients (74.0%) in the cilta-cel group and 116 patients (55.8%) in the SOC group, including conditions such as nausea, diarrhea, constipation, and vomiting. The frequency of immune system disorders was notably higher in the cilta-cel group, where they were experienced by 157 patients (77.5%), than in the SOC group, where they were experienced by 17 patients (8.2%).
Serious Adverse Events
Ninety-two patients (44.2%) in the cilta-cel group and 81 patients (38.9%) in the SOC group reported at least 1 SAE. Infections and infestations (24.0% versus 24.5% for cilta-cel versus SOC), including COVID-19 pneumonia (5.8% versus 4.3%), were the most reported SAEs.
Withdrawals Due to Adverse Events
In the CARTITUDE-4 trial, TEAEs leading to withdrawal of any component of study treatment were reported for | ████████ ██████ in the cilta-cel group and ██ ████████ ███████ in the SOC group.
Mortality
TEAEs were reported as the primary cause of death for ██ ████████ ██████ in cilta-cel group and | ████████ ██████ in SOC group. The primary cause of death due to a TEAE was COVID-19 pneumonia for 7 patients (3.4%) in the cilta-cel group and 1 patient (0.5%) in the SOC group. Although the entirety of the trial overlapped with the COVID-19 pandemic, mitigation strategies were put into place via protocol amendment, and no further COVID-19–related mortality was observed following cilta-cel infusion.
Notable Harms
The sponsor and/or the clinical experts identified notable harms as including CRS, neurotoxicity (including ICANS), B-cell aplasia, hypogammaglobulinemia, and immune suppression. CRS was reported for 76.1% of patients in the cilta-cel group (134 of 176 patients who received cilta-cel as study treatment), with the majority being grade 1 (52.8% of the 176 patients who received cilta-cel as study treatment). Only 2 patients (1.1%) experienced grade 3 CRS, and no grade 4 or 5 CRS was reported. In total, 36 patients (20.5%) from the cilta-cel group experienced CAR T-cell neurotoxicity, including ICANS in 8 patients (4.5% of the 176 patients who received cilta-cel as study treatment). Among the 8 patients with ICANS, 6 patients (3.4% of the 176 patients who received cilta-cel as study treatment) had grade 1 events and 2 patients (1.1%) had grade 2 events. Hypogammaglobulinemia was observed in 88 of 208 patients (42.3%) in the cilta-cel group and 13 of 208 patients (6.3%) in the SOC group, with 15 patients (7.2%) in the cilta-cel group and 1 patient (0.5%) in the SOC group experiencing grade 3 or 4 hypogammaglobulinemia. Immune suppression was observed in ███ ████████ ███████ in the cilta-cel group and ███ ████████ ███████ in the SOC group. No data for B-cell aplasia were reported.
Table 19: Summary of Harms Results From CARTITUDE-4 Trial (Safety Analysis Set; Data Cut-Off: November 1, 2022)
Adverse events | Cilta-cel (N = 208) | SOC (N = 208) | ||||
|---|---|---|---|---|---|---|
Any grade | Grade 3 or 4 | Any grade | Grade 3 or 4 | |||
Most commonly reported TEAEs (≥ 20% of either treatment group)a, n (%) | ||||||
Patients with ≥ 1 TEAE | 208 (100.0) | 201 (96.6) | 208 (100.0) | 196 (94.2) | ||
Blood and lymphatic system disorders | 197 (94.7) | 196 (94.2) | 185 (88.9) | 179 (86.1) | ||
Neutropenia | 187 (89.9) | 187 (89.9) | 177 (85.1) | 171 (82.2) | ||
Anemia | 113 (54.3) | 74 (35.6) | 54 (26.0) | 30 (14.4) | ||
Thrombocytopenia | 113 (54.3) | 86 (41.3) | 65 (31.3) | 39 (18.8) | ||
Lymphopenia | 46 (22.1) | 43 (20.7) | 29 (13.9) | 25 (12.0) | ||
Immune system disorders | 157 (75.5) | 19 (9.1) | 17 (8.2) | 1 (0.5) | ||
Cytokine release syndrome | 134 (64.4) | 2 (1.0) | 1 (0.5) | 0 | ||
Hypogammaglobulinemia | 88 (42.3) | 15 (7.2) | 13 (6.3) | 1 (0.5) | ||
Gastrointestinal disorders | 154 (74.0) | 13 (6.3) | 116 (55.8) | 12 (5.8) | ||
Nausea | 101 (48.6) | 0 | 38 (18.3) | 2 (1.0) | ||
Diarrhea | 70 (33.7) | 8 (3.8) | 56 (26.9) | 5 (2.4) | ||
Constipation | 49 (23.6) | 1 (0.5) | 44 (21.2) | 2 (1.0) | ||
General disorders and administration site conditions | ███ ██████ | █████ | ███ ██████ | ██ ████ | ||
Fatigue | 60 (28.8) | 4 (1.9) | 68 (32.7) | 2 (1.0) | ||
Infections and infestations | 127 (61.1) | 56 (26.9) | 148 (71.2) | 51 (24.5) | ||
COVID-19 | 17 (8.2) | 3 (1.4) | 42 (20.2) | 4 (1.9) | ||
Musculoskeletal and connective tissue disorders | ███ ██████ | ██ █████ | ███ ██████ | ██ ████ | ||
Metabolism and nutrition disorders | 105 (50.5) | 27 (13.0) | 61 (29.3) | 12 (5.8) | ||
Respiratory, thoracic, and mediastinal disorders | 89 (42.8) | 8 (3.8) | 85 (40.9) | 9 (4.3) | ||
Skin and subcutaneous tissue disorders | 69 (33.2) | 0 | 57 (27.4) | 1 (0.5) | ||
Psychiatric disorders | 46 (22.1) | 3 (1.4) | 77 (37.0) | 11 (5.3) | ||
Insomnia | 23 (11.1) | 2 (1.0) | 52 (25.0) | 6 (2.9) | ||
SAEs, n (%) | ||||||
Patients with ≥ 1 SAE | 92 (44.2) | 67 (32.2) | 81 (38.9) | 70 (33.7) | ||
Infections and infestations | 50 (24.0) | 40 (19.2) | 51 (24.5) | 47 (22.6) | ||
COVID-19 pneumonia | 12 (5.8) | 10 (4.8) | 9 (4.3) | 9 (4.3) | ||
Patients who stopped treatment due to adverse events, n (%) | ||||||
Total number of patients with TEAE leading to withdrawal of any component of study treatment | | █████ | | █████ | ██ ██████ | ██ ████ | ||
Deaths, n (%) | ||||||
Total number of patients who died during study | 39 (18.8) | 46 (22.1) | ||||
Primary cause of death | ||||||
TEAE | ██ █████ | | █████ | ||||
Progressive disease | ██ █████ | ██ ██████ | ||||
Otherb | ██ █████ | ██ █████ | ||||
Notable harms | ||||||
Patients who received cilta-cel contributing the analyses of CRS and neurotoxicity, n | 176 | NA | ||||
CRS, n (%) | 134 (76.1) | 2 (1.1) | NA | |||
Neurotoxicity, n (%) | 36 (20.5) | 5 (2.8) | NA | |||
ICANS, n (%) | 8 (4.5) | 1 (0.6) | ||||
Patients contributing the analyses of the following outcomes, n | 208 | 208 | ||||
B-cell aplasia, n (%) | NR | NR | ||||
Hypogammaglobulinemia, n (%) | 88 (42.3) | 15 (7.2) | 13 (6.3) | 1 (0.5) | ||
Immune suppression, n (%) | ███ ██████ | ███ ██████ | ||||
Cilta-cel = ciltacabtagene autoleucel; CRS = cytokine release syndrome; ICANS = immune effector cell–associated neurotoxicity syndrome; NA = not applicable; NR = not reported; SAE = serious adverse event; SOC = standard of care; TEAE = treatment-emergent adverse event.
Notes: Adverse events are reported using Medical Dictionary for Regulatory Activities version 25.0. ICANS was evaluated according to the American Society for Transplantation and Cellular Therapy consensus grading system.
aTEAEs with at least 10% frequency was reported.
bThe reason for deaths (not due to disease progression) was reported as an adverse event if the adverse event was treatment emergent; it was reported as “other” if the adverse event was non–treatment emergent.
Sources: 2023 primary Clinical Study Report for CARTITUDE-4 trial;14 sponsor-provided additional data.15,16 Details included in the table are from the sponsor’s summary of clinical evidence.17
Critical Appraisal
Internal Validity
The CARTITUDE-4 trial is an ongoing phase III, open-label, active-control RCT. The methods of randomization involved stratification by physician’s choice of PVd or DPd, ISS disease stage at screening (I, II, or III), and number of prior lines of therapy (1 versus 2 to 3), which were considered appropriate by the review team. There was generally no notable imbalance in the baseline patient characteristics between treatment groups.
In the ITT analysis set, 32 of the 208 patients (15.4%) in the cilta-cel group did not receive cilta-cel infusion and 3 of the 211 patients (1.4%) in the SOC group did not receive PVd or DPd as their randomly assigned study treatments. Of the 32 patients in the cilta-cel group who did not receive cilta-cel infusion, 30 (14.4%) discontinued study treatment on or after bridging therapy and before the start of the conditioning regimen and 2 (1.0%) discontinued on or after the conditioning regimen and before cilta-cel infusion. The most common reason for discontinuing the study treatment was disease progression (30 patients [14.4%]). Bridging therapy included PVd or DPd, per physician’s choice. The differential imbalance in the baseline characteristics of the patients who discontinued treatment between the 2 groups could be a source of attrition bias against the cilta-cel group. This would complicate the interpretation of causal inference — which may require an appropriate and precise definition of the estimand (i.e., not considering patients who actually did not receive the cilta-cel treatment) — about the use of cilta-cel and improvement in efficacy outcomes. The clinical experts confirmed that the median duration of study treatment for the SOC group (PVd: 4.8 months; DPd: 11.8 months) was reflective of clinical practice but highlighted that for patients whose disease is refractory to lenalidomide, the experts would expect a slightly longer duration of treatment for PVd of approximately 8 months. The review team noted that the relatively short study treatment for patients with PVd (26 patients [12.3%]) may bias the study results in favour of cilta-cel. Consistently and notably, higher proportions of patients in the cilta-cel group than in SOC group received concomitant therapies for the control of various clinical symptoms or disorders associated with the increased incidence of adverse events. These therapies included antimicrobial and antiviral medications, normal human immunoglobulin, serotonin (5ht3) antagonists, paracetamol, enoxaparin, interleukin inhibitors, antiepileptics, and drugs for the treatment of psychological and sleeping disorders. In particular, the clinical experts indicated that the higher use of the above-mentioned concomitant medications was due to the increased incidence of TEAEs related to infections, CRS, and gastrointestinal disorders (e.g., nausea and/or vomiting). In particular, the frequency and/or severity of the adverse events — which might have significantly affected patients’ quality of life, including ability to perform daily functions — could have been reduced due to the use of those concomitant medications. Overall, the increased use of concomitant medications might have had an impact on the reported adverse events and HRQoL outcomes in the cilta-cel group. Fewer patients received subsequent treatment in the cilta-cel group than in the SOC group; this would bias the OS results against the cilta-cel group.
As the CARTITUDE-4 trial is ongoing, results were only available from the interim analysis for this review. At the time of the interim analysis, the median PFS and median OS had not been reached in the cilta-cel group, which casts uncertainty on the assessment of treatment effect in terms of both median survival time and HRs. Although results from the sponsor-conducted subsequent OS analysis (data cut-off: December 13, 2023) indicated a trend favouring OS benefit for the cilta-cel group compared to the SOC group, the median OS was still not yet reached at this time. Moreover, the statistical testing of the subsequent OS analysis was not controlled for the overall type I error; therefore, the results were descriptive and should be considered as supportive data.
A multiple testing procedure was employed to control the overall type I error for the primary end point of PFS and the major secondary end points of CR or better rate, ORR, overall MRD negativity rate, OS, and time to worsening of symptoms in the MySIm-Q total symptom score in the interim analysis. Many of the outcomes used in the CARTITUDE-4 trial (PFS, OS, CR or better rate, VGPR or better rate, ORR, and DOR) were identified as clinically important by patients and/or clinicians. However, VGPR or better rate and DOR were not part of the statistical testing strategy and thus were not adjusted for multiple testing; therefore, the ability to draw conclusions from these results may be limited. The clinical experts confirmed that a 35% reduction in the risk of progressive disease or death and a median PFS of 20 months for the cilta-cel group, used in the sample size calculation, was considered to be reasonable and clinically meaningful.
External Validity
According to the clinical experts consulted for this review, the demographic and disease characteristics of the CARTITUDE-4 trial population were generally reflective of the patient population with RRMM who would be candidates for treatment with cilta-cel. However, the trial excluded a small group of patients (less than 5%) with symptomatic MM who do not have measurable disease; their disease may have bone and/or bone marrow involvement, which would be detectable on imaging such as PET or CT scans or biopsies. Those patients who have confirmed relapsed disease, even if nonsecretory, may still benefit from cilta-cel as per the feedback from the clinical experts. The CARTITUDE-4 trial excluded patients with an ECOG PS of 2; the clinical experts would consider those patients to be eligible for cilta-cel as patients with an ECOG PS of 2 are similar to patients with an ECOG PS of 1 or less in terms of responding to the treatment. Additionally, the clinical experts mentioned that ECOG PS scores may change along a patient’s disease course; therefore, there is no reason to exclude patients with an ECOG PS of 2 from treatment with cilta-cel. Careful consideration of overall health and ability to withstand acute toxicities such as CRS would be important. The clinical experts commented that the proportion of patients with high-risk cytogenetic abnormality (61.2%) in the CARTITUDE-4 trial was higher than what they would expect in clinical practice (about 25% to 35% of patients), which may indicate that the study included a higher-risk patient population. The patient population (median age: 61.0 years) was generally younger than the general population with MM. The proportion of patients with a prior autologous stem cell transplant (82.2% versus 87.7% for cilta-cel versus SOC) was higher than what the clinical experts would expect in clinical practice (about 50% to 60% of patients), which may indicate that the study included a favourable patient population that may not be reflective of patients with RRMM in clinical practice.
In the SOC group, 26 patients (10.4%) used PVd and 182 patients (86.3%) used DPd. Although PVd has been recommended by the drug agency for RRMM in patients who have received at least 1 prior treatment regimen including lenalidomide, PVd is not commonly used or an SOC in Canada.33 The clinical experts estimated that about 10% to 25% of patients whose disease is refractory to lenalidomide might be on PVd in clinical practice in Canada. Moreover, DPd is not currently funded in Canada, but the clinical experts commented that the treatment effect of DPd is similar to IsaPd, which is used in clinical practice in Canada. Additionally, there was no study site in Canada in the CARTITUDE-4 trial. Overall, the review team noted all these factors may compromise the generalizability of the study results in Canada.
At the time this report was prepared, the duration of follow-up (median: 15.9 months) in the interim analysis (data cut-off: November 1, 2022) was adequate for the assessment of the primary efficacy end point of PFS but inadequate for the assessment of OS, as per feedback from the clinical experts. Patients and/or clinicians indicated that prolonging PFS and OS, delaying disease progression, maintaining HRQoL, and controlling the symptoms of the disease were critical considerations. Overall, it is uncertain the extent to which the observed OS, patient-reported HRQoL, and disease symptom results from the CARTITUDE-4 trial could be generalized to clinical practice in Canada considering the limited representativeness of the study population due to restrictive eligibility criteria and comparators that were not exactly reflective of current clinical practice in Canada.
GRADE Summary of Findings and Certainty of the Evidence
Methods for Assessing the Certainty of the Evidence
For the pivotal CARTITUDE-4 trial identified in the sponsor’s systematic review, GRADE was used to assess the certainty of the evidence for the outcomes considered most relevant to inform the expert committee deliberations, and a final certainty rating was determined as outlined by the GRADE Working Group:12,13
High certainty: We are very confident that the true effect lies close to that of the estimate of the effect.
Moderate certainty: We are moderately confident in the effect estimate — The true effect is likely to be close to the estimate of the effect, but there is a possibility that it is substantially different. We use the word “likely” for evidence of moderate certainty (e.g., “X intervention likely results in Y outcome”).
Low certainty: Our confidence in the effect estimate is limited — The true effect may be substantially different from the estimate of the effect. We use the word “may” for evidence of low certainty (e.g., “X intervention may result in Y outcome”).
Very low certainty: We have very little confidence in the effect estimate — The true effect is likely to be substantially different from the estimate of effect. We describe evidence of very low certainty as “very uncertain.”
Following the GRADE approach, evidence from RCTs started as high-certainty evidence and could be rated down for concerns related to study limitations (which refer to internal validity or risk of bias), inconsistency across studies, indirectness, imprecision of effects, and publication bias.
When possible, certainty was rated in the context of the presence of an important (nontrivial) treatment effect; if this was not possible, certainty was rated in the context of the presence of any treatment effect (i.e., the clinical importance is unclear). In all cases, the target of the certainty of evidence assessment was based on the point estimate and where it was located relative to the threshold for a clinically important effect (when a threshold was available) or to the null. The target of the certainty of evidence assessment was the presence or absence of a clinically important effect based on thresholds for PFS informed by the clinical experts consulted for this review; there is no established minimal important difference and the clinical experts could not provide a threshold of important difference, so the target of the certainty of evidence assessment was the presence or absence of any (non-null) effect for CR or better rate, VGPR or better rate, overall MRD negativity rate, OS, DOR, HRQoL, and SAEs.
Results of GRADE Assessments
Table 2 presents the GRADE summary of findings for cilta-cel versus SOC.
Long-Term Extension Studies
No long-term extension studies were submitted for this review.
Indirect Evidence
Contents within this section have been informed by materials submitted by the sponsor. The following has been summarized and validated by the CDA-AMC review team.
Objectives for the Summary of Indirect Evidence
The pivotal CARTITUDE-4 trial provided a head-to-head comparison between cilta-cel and physician’s choice of 2 SOC therapies (PVd or DPd) among patients with RRMM. However, no direct evidence was included in the submission to support comparisons of the efficacy or safety of cilta-cel with other available treatments for the patient population under review in Canada. Hence, an ITC was warranted to address this evidence gap.
Description of Indirect Comparisons
The sponsor submitted 2 ITC analyses to compare cilta-cel to relevant treatment comparators in Canada. One ITC report presented analyses of IPD from the pivotal and 3 additional comparator clinical trials — the CANDOR (Kd), CASTOR (Vd, DVd), and APOLLO (Pd) trials — using IPTW methods. The other report presented an unanchored MAIC, using IPD from the pivotal CARTITUDE-4 trial and summary-level data from 2 comparator trials: the ICARIA-MM (IsaPd) and BOSTON (SVd) trials.
Table 20: Study Selection Criteria and Methods for ITCs Submitted by the Sponsor
Characteristics | Indirect comparison |
|---|---|
Population |
|
Intervention | Cilta-cel |
Comparator | Comparators relevant to Canada:
|
Outcome | Efficacy:
Safety:
|
Study designs | Priority 1: Prospective RCTs (a minimum of 2-arm parallel, phase II or III, crossover trials) Priority 2 (to fill evidence gaps): single-arm trials, nonrandomized trials, observational studies |
Publication characteristics | Studies published up to May 2022, including conference abstracts |
Databases searched | Conducted in the following indexed databases via Ovid:
|
Selection process |
|
Data extraction process | In the first phase of the data extraction process, top-line study details (publication details, study details, patient characteristics, outcome availability, subgroup availability) were extracted for all studies included in the systematic literature review. Then, extracted top-line study details were compared with the cilta-cel study population (CARTITUDE-4 trial). Only studies that investigated relevant comparators and were broadly comparable to the cilta-cel study were progressed to the full data extraction and feasibility assessment. All data (top-line and detailed) were extracted by 1 investigator and validated by a second investigator. A third investigator was consulted to resolve any disagreements, where necessary. Where multiple (related) publications of a study were identified, these were grouped together, and detailed data were extracted as 1 study to avoid double-counting of patients. All secondary references and related material were reviewed to see if there were any unique additional data to extract. For added quality assurance, there was a final check once all information was extracted to ensure consistency in reporting of information across publications. |
Quality assessment | The quality of each RCT considered in the feasibility assessment was assessed using the Cochrane risk of bias.48 |
AE = adverse event; cilta-cel = ciltacabtagene autoleucel; CR = complete response; HRQoL = health-related quality of life; ITC = indirect treatment comparison; MM = multiple myeloma; MRD = minimal residual disease; ORR = overall response rate; OS = overall survival; PFS = progression-free survival; PICOS = population, interventions and comparisons, outcomes, and study design; RCT = randomized controlled trial; RRMM = relapsed or refractory multiple myeloma; VGPR = very good partial response.
aTrials that had at least 75% of patients with RRMM with exposure to prior lenalidomide or a subgroup reporting based on prior lenalidomide exposure or lenalidomide refractoriness were considered in the feasibility assessment.
Source: Details included in the table are from the sponsor’s summary of clinical evidence.17
ITC Design
Objectives
The objectives of the sponsor-conducted ITCs were to assess the efficacy and/or safety of cilta-cel compared to other relevant treatments available in Canada.
Study Selection Methods
The sponsor conducted a feasibility assessment to understand the appropriateness of conducting ITCs against all approved and commonly used regimens in the US, UK, Spain, France, Germany, Italy, the Netherlands, and Canada. For the purposes of this CDA-AMC review, only comparators relevant to and available in Canada were presented by the sponsor.
A broad systematic literature review was conducted to identify clinical trials assessing the efficacy, safety, and HRQoL associated with cilta-cel compared to other relevant treatments (Table 20) among adult patients with RRMM who had received prior lenalidomide. The inclusion criteria covered single-arm trials and RCTs, published up to May 2022. The following electronic databases were screened: MEDLINE, Embase, Cochrane Database of Systematic Reviews, Cochrane Central Register of Controlled Trials, and PsychInfo. Some details of the literature search, including search dates, search terms, and limitations to searches, were not reported.
Screening for potentially eligible articles was conducted by 2 reviewers. Data were extracted by 1 reviewer and validated by an additional reviewer; a third investigator was consulted if there were any disagreements. Quality assessment of the studies evaluated in the feasibility assessment was conducted using the Cochrane Collaboration’s Risk of Bias tool (version 1). Details regarding the systematic literature review protocol were not available in the sponsor’s submission.
The feasibility assessment included evaluation of the network connectivity as well as evaluation of the alignment between each comparator trial and the CARTITUDE-4 trial in terms of study design features, patients’ characteristics, previous treatments, and outcome definitions. A total of 142 trials were identified through the literature search, 11 of which were informing the potential network for the CARTITUDE-4 trial and were assessed in detail for feasibility of used in the ITC. Only 2 relevant comparators, Pd and IsaPd, were identified for potential inclusion in the network for the CARTITUDE-4 trial. Given that the network contained a limited number of comparators, the majority of which were not relevant to the Canadian clinical context, and that there was substantial heterogeneity across studies, the sponsor determined that a network meta-analysis approach would be inappropriate (Table 22).
IPTW and multivariable regression analyses were conducted for the studies with available IPD, specifically for DVd (CASTOR trial), Vd (CASTOR trial), Kd (CANDOR trial), and Pd (APOLLO trial). Unanchored MAICs were conducted for comparisons to IsaPd (ICARIA-MM trial) and SVd (BOSTON trial) using summary-level data for the comparator trials. A summary of the feasibility assessment and recommended analyses is reported in Table 22.
The feasibility assessment further identified limitations for the IKEMA trial (IsaKd), which precluded the conduct of an ITC of cilta-cel versus IsaKd. These limitations included the following:
Lack of direct and indirect connectivity between the IKEMA trial (IsaKd and Kd groups) and the CARTITUDE-4 trial (cilta-cel and SOC groups).
Substantial heterogeneity between the CARTITUDE-4 and IKEMA trials:
Lenalidomide refractoriness was an inclusion criterion for the CARTITUDE-4 trial; only 32% of patients in the IKEMA trial were had lenalidomide-refractory disease.
Patient descriptive and outcomes data specific to the lenalidomide-refractory disease subgroup were not available from the IKEMA trial.
The IKEMA trial excluded patients previously exposed to carfilzomib, those whose disease was refractory to carfilzomib, and those whose disease was refractory to anti-CD38 mAB, which corresponds to, respectively, 37.0%, 24.5%, and 24.0% of patients treated with cilta-cel in the CARTITUDE-4 trial.
The IKEMA trial did not report OS data.
Since it was not possible to generate comparative estimates for cilta-cel versus IsaKd, the sponsor submitted a deviation request to CDA-AMC to exclude IsaKd as a comparator in the reference case pharmacoeconomic analysis. This was approved by CDA-AMC on March 12, 2024.
ITC Analysis Methods — IPTW
The ITCs included cilta-cel, DVd, Kd, Pd, and Vd treatments from the CARTITUDE-4, CANDOR, CASTOR, and APOLLO trials. The IPTW methods are summarized in Table 22. Patients from the comparator trials were selected for the analyses if they met key inclusion criteria from the CARTITUDE-4 trial (i.e., have received 1 to 3 prior lines of therapy including a PI and an IMiD, had disease that was refractory to lenalidomide, and had an ECOG PS of 0 or 1). Additionally, patients with prior anti-CD38 mAB exposure in the cilta-cel cohort were excluded to align with the exclusion criteria in the daratumumab clinical trials. The sponsor reported that the relative treatment effect of cilta-cel did not differ in the CARTITUDE-4 trial between patients who had and had not previously had anti-CD38 mAB exposure, based on insignificant findings from the statistical analysis assessing the interaction between treatment outcome and anti-CD38 mAB exposure.
IPTW with average treatment effect on the treated (ATT) weighting was selected as the primary analysis for the PFS, ORR, CR or better, and VGPR or better end points. For the analyses of OS, a multivariable regression approach was deemed more appropriate due to the lower number of events and limited sample size of comparator trials. The outcomes of interest are defined in Table 23.
Prognostic baseline characteristics for adjustment in the analyses were identified and ranked in order of importance a priori, based on input from independent clinical experts.49,50 Refractory status, cytogenetic risk, ISS or revised ISS disease stage, presence of plasmacytomas or extramedullary disease, and time to disease progression on prior line were identified as the prognostic factors of most relevance. Cytogenetics was ultimately excluded from the analyses due to the high proportion of unreported data in the comparator clinical trials (range, 25% to 60%). Hence, the remaining 4 factors constitute the variables used for adjustment in the base-case analysis.
Two sensitivity analyses were conducted, both of which allowed additional adjustments for several covariates: multivariable regression models, and IPTW with average treatment effect on the control (ATC) weights (Table 23).
To ensure balance between the cilta-cel and comparator cohorts, selected baseline characteristics were adjusted for using either propensity score or regression methods.51 Logistic regression methods were adopted to estimate propensity scores, with treatment as the dependent variable and baseline covariates as explanatory variables. Weights were derived for each participant, based on the propensity scores and by using weighting formulas for the desired target population. In the case of ATT weights, a score of 1 was assigned to patients in the CARTITUDE-4 trial, while patients in the comparator trials were reweighted based on the probability of receiving treatment.52 In the case of ATC weighting, a score of 1 was assigned to patients in the comparator treatment cohorts, while patients in the CARTITUDE-4 trial were reweighted based on the probability of receiving treatment.
Relative efficacy was assessed for both the unadjusted (i.e., cilta-cel versus comparative treatment before IPTW) and the adjusted (i.e., with IPTW) comparisons for all outcomes. For binary outcomes (i.e., ORR, VGPR or better, and CR or better), logistic regression (with weights applied for the adjusted comparison) were adopted to estimate outcomes such as RRs, ORs and corresponding 95% CIs. Cox proportional hazards models were applied to estimate HRs and 95% CIs for PFS (with weights applied for the adjusted comparison) and OS (with factors included as model covariates for the adjusted comparison). The appropriateness of the proportional hazards assumption was assessed based on visual inspection of the log-cumulative hazard and Schoenfeld residuals plots and on the performance of the Grambsch-Therneau test. Variables with less than 25% missing values were imputed using the multiple imputation with chained equation. Specifically, missing variables in the CANDOR trial (i.e., time to disease progression on prior line [4.1% missing for DKd and 4.4% for Kd], years since MM diagnosis [5.1% missing for DKd and 2.2% for Kd], and hemoglobin [1% missing for DKd]) were imputed. Imputation was not required for the CARTITUDE-4, CASTOR, or APOLLO trials.
ITC Analysis Methods — Unanchored MAIC
The methodology of unanchored MAICs, conducted using IPD from the CARTITUDE-4 trial and summary-level data from the comparator trials (IsaPd [ICARIA-MM trial] and SVd [BOSTON trial]), is described in Table 23.53
The feasibility assessment covered comparison of the key aspects of each comparator trial — including inclusion and exclusion criteria, general study designs, outcome definitions, and baseline characteristics — to the CARTITUDE-4 trial. Patients in the cilta-cell group from the CARTITUDE-4 trial who satisfied the eligibility criteria from the comparator trials were included in the analyses (Table 21).
Table 21: Eligibility Criteria Matching
Method | Trial | Patients, n | Exclusion criteria applied to CARTITUDE-4 trial | Patients in cilta-cel group from CARTITUDE-4 trial remaining, n |
|---|---|---|---|---|
IsaPd | ICARIA-MM | ███ | Patients with fewer than 2 prior lines of therapy, whose disease was not refractory to last line of therapy, whose disease was refractory to anti-CD38 mAB, or who had prior exposure to pomalidomide were excluded | ██ |
SVd | BOSTONa | ██ | None | ███ |
Cilta-cel = ciltacabtagene autoleucel; IsaPd = isatuximab-pomalidomide-dexamethasone; SVd = selinexor-bortezomib-dexamethasone.
aSubgroup of patients whose disease was refractory to lenalidomide.
Source: Details included in the table are from the sponsor’s summary of clinical evidence.17
The prognostic factors to be used for adjustments in the analysis were identified and ranked by importance a priori, based on input from independent clinical experts consulted by the sponsor. The following prognostic factors were included in the base case: refractory status, cytogenetic risk, and ISS disease stage. Refractory status was not adjusted in the MAIC with SVd as the BOSTON trial did not report these data.
Sensitivity analyses were performed to include an expanded list of adjusting variables (Table 23).
IPD from the CARTITUDE-4 trial were weighted so that the baseline characteristics of the participants matched the summary-level baseline characteristics from the published comparator trials. Propensity score weighting was implemented to assign weights to patients from the CARTITUDE-4 trial by their inverse odds of being in that group versus the comparator cohort. Separate propensity score models were estimated for each of the comparator trials using the generalized method of moments, including baseline risk factors available in the CARTITUDE-4 trial and the comparator trials.54
ESS, corresponding to the size of the unweighted sample that would result in the same precision as the weighted cohort of the patients receiving cilta-cel, was reported (Table 22).
Reconstructed IPD were derived from the reported results for the comparators and by simulating data for PFS and OS from digitally scanned, published Kaplan-Meier curves using a previously published and validated algorithm method.55
To estimate the relative benefit for cilta-cel versus comparators on survival outcomes (OS and PFS), weighted IPD for cilta-cel from the CARTITUDE-4 trial and simulated IPD for the comparator trials were analyzed for each pairwise comparison separately using weighted logistic regression and weighted Cox proportional hazards regression.
Table 22: Summary of Feasibility Assessment and Analysis Recommendations
Treatment | ITC base-case analysis | Trial | N (trial) | Assigned to treatment arm, n | Included in the ITC analysis, n | Median follow-up (months) |
|---|---|---|---|---|---|---|
Ciltacabtagene autoleucel | Reference treatment | CARTITUDE-4 | 419 | 208 | For IPTW analyses: 155a ESS for MAIC: 26 (vs. IsaPd), 188 (vs. SVd) | 15.9 |
Kd | Multivariable regression (OS) IPTW-ATT (PFS and response rates) | CANDOR | 466 | 154 | 46b | 16.9 |
Pd | APOLLO | 304 | 153 | 92b | 39.9 | |
Vd | CASTOR | 498 | 247 | 46b | 74.3 | |
DVd | CASTOR | 498 | 251 | 44b | 74.3 | |
SVd | Unanchored MAIC | BOSTON | ███ | ██ | ██ | ████ |
IsaPd | ICARIA-MM | ███ | ███ | ███ | ████ | |
IsaKd | ITC not feasiblec | IKEMA | 302 | NA | NA | NA |
ATT = average treatment effect on the treated; DVd = daratumumab-bortezomib-dexamethasone; ESS = effective sample size; IPTW = inverse probability of treatment weighting; ITC = indirect treatment comparison; IsaKd = isatuximab-carfilzomib-dexamethasone; IsaPd = isatuximab-pomalidomide-dexamethasone; Kd = carfilzomib-dexamethasone; MAIC = matching-adjusted indirect comparison; NA = not available; OS = overall survival; Pd = pomalidomide-dexamethasone; PFS = progression-free survival; SVd = selinexor-bortezomib-dexamethasone; Vd = bortezomib-dexamethasone; vs. = versus.
aPatients with no prior exposure to anti-CD38 mAB.
bPatients who received 1 to 3 prior lines of therapy including a proteasome inhibitor and an immunomodulatory drug, whose disease was refractory to lenalidomide, and who had an Eastern Cooperative Oncology Group performance status of less than 2.
cNo common comparator. Imbalance on lenalidomide-refractoriness (32% with lenalidomide-refractory disease), and patient baseline characteristics and subgroup outcomes specific to the lenalidomide-refractory disease subgroup were not available from the IKEMA trial. The IKEMA trial excluded patients previously exposed to carfilzomib, those whose disease was refractory to carfilzomib, and those whose disease was refractory to anti-CD38 mAB. OS was not reported in the IKEMA trial.
Source: Details included in the table are from the sponsor’s summary of clinical evidence.17
Table 23: ITC Analysis Methods
Methods | IPTW description | Unanchored MAIC description |
|---|---|---|
Analysis methods | IPTW using ATT weights derived from propensity scores (except for OSa) | Unanchored MAICs of efficacy outcomes were conducted following NICE DSU guidelines for population-adjusted ITCs.53 MAICs use propensity score–based regression to correct for observed cross-trial imbalances in patient characteristics by adjusting available IPD from the index trial (CARTITUDE-4) to more closely match the aggregate data from each comparator trial (ICARIA-MM and BOSTON). |
Outcomes |
| |
Identification and validation of study population characteristics as well as prognostic baseline characteristics | Study population matching Patients from the comparator trials were included in the comparator cohorts if at baseline they met the following key inclusion criteria from the CARTITUDE-4 trial:
Additionally, as prior exposure to anti-CD38 mAB therapies was an exclusion factor in the daratumumab clinical trials, patients with prior exposure to anti-CD38 mAB therapies in the cilta-cel cohort were excluded. Baseline characteristics adjustment Prognostic baseline characteristics for adjustment were identified and ranked in order of importance before the analysis, based on input from independent clinical experts.49,50 The following 5 factors were identified as most prognostic:
Due to the high proportion (range, 25% to 60%) of patients with unknown cytogenetics in the comparator trials, cytogenetic risk could not be included. The remaining 4 factors constitute the base-case adjustment set. | Study population matching Patients who did not align with comparator trial line of therapy eligibility criteria were removed from the CARTITUDE-4 trial. Baseline characteristics adjustment Prognostic factors to be adjusted for in the analyses were identified a priori and ranked by importance, based on input from independent clinical experts. The following factors were included in the base case if available in both the CARTITUDE-4 trial and comparator trials:
|
Assessment of variable selection | Variables were selected and ranked as described previously.49,50 Input from independent clinical experts was used for validation. | After MAICs, the baseline characteristics for the reweighted CARTITUDE-4 trial population were balanced vs. each of the respective comparator studies through visual inspection. |
Weighting assessment | Visual inspections of variable balance before and after IPTW adjustments were conducted. Key baseline characteristics were well balanced across the cohorts. | Effective sample size was assessed for each base-case and sensitivity analysis. |
Missing data imputation | Variables for which proportion of missing values was less than 25%, the missing values were imputed using the multiple imputation with chained equation. Multiple imputation was required for the following missing base-case variables in the CANDOR trial (Kd): time to disease progression on prior line (4.4% missing for Kd) and years since MM diagnosis (2.2% missing for Kd). Imputation was not necessary for the CARTITUDE-4 trial (cilta-cel), the CASTOR trial (Vd and DVd), or the APOLLO trial (Pd), as there were no other missing values. | NA |
Sensitivity analyses |
| Inclusion of additional factors in the adjustment, if reported in both the CARTITUDE-4 trial and the comparator trials: number of prior lines, time since diagnosis, age, lactate dehydratase level, prior autologous hematopoietic cell transplant, ECOG PS, race, sex, MM type, creatinine clearance, and tumour burden. |
ATC = average treatment effect on the controls; ATT = average treatment effect on the treated; cilta-cel = ciltacabtagene autoleucel; CR = complete response; DSU = Decision Support Unit; DVd = daratumumab-bortezomib-dexamethasone; ECOG PS = Eastern Cooperative Oncology Group performance status; IMiD = immunomodulatory drug; IMWG = International Myeloma Working Group; IPD = individual patient data; IPTW = inverse probability of treatment weighting; ISS = International Staging System; ITC = indirect treatment comparison; Kd = carfilzomib-dexamethasone; MAIC = matching-adjusted indirect comparison; MM = multiple myeloma; NA = not applicable; NICE = National Institute for Health and Care Excellence; ORR = overall response rate; OS = overall survival; Pd = pomalidomide-dexamethasone; PFS = progression-free survival; PI = proteasome inhibitor; PR = partial response; sCR = stringent complete response; Vd = bortezomib-dexamethasone; VGPR = very good partial response.
aFor OS, a multivariable regression model was deemed most appropriate and presented as the base case. IPTW-ATT and IPTW-ATC approaches were provided as sensitivity analyses.
Source: Details included in the table are from the sponsor’s summary of clinical evidence.17
Results of ITC
Summary of Included Studies
The sponsor’s assessment of the heterogeneity of the 6 studies included in the ITC analyses (the CARTITUDE-4, CANDOR, APOLLO, CASTOR, BOSTON, and ICARIA-MM trials) is presented in Table 24. All studies were randomized, multicentre, open-label, phase III studies, with sample sizes ranging from 304 to 498 patients. Only the BOSTON study allowed treatment switching, where patients receiving Vd switched to SVd in cases of disease progression.
The feasibility assessment revealed differences in eligibility criteria and in baseline patient and treatment characteristics across the included trials. Even though all studies were conducted among patients who had experienced treatment failure or disease progression on at least 1 prior therapy for MM, only the CARTITUDE-4 trial required patients to have disease that was refractory to lenalidomide. To provide comparable analyses, the sponsor leveraged subgroup analyses on patients whose disease was refractory to lenalidomide from comparator studies (corresponding to approximately 32% to 36% of patients from the CANDOR trial, 80% of patients from the APPOLO trial, 28% of patients from the CASTOR trial, and 92% to 94% of patients from the ICARIA-MM trial; no data were available for the BOSTON trial). The CARTITUDE-4 trial enrolled patients who had had 1 to 3 prior lines of treatment, the ICARIA-MM trial enrolled 34% of patients who had had 4 or more prior lines of treatment, and the APOLLO trial enrolled 14% of patients who had had 4 or more prior lines of treatment. About a third of patients from the CARTITUDE-4 trial had had just 1 prior line of treatment (32.1%), while the APOLLO trial included a very limited proportion of patients who had had just 1 prior line of treatment (12%) and the ICARIA-MM trial did not include any such patients.
Assessment of the patients’ baseline characteristics showed that there were imbalances in patients’ performance status, disease stage, and cytogenetic risk. Further details on patient characteristics are provided in Table 24 and Table 25. The majority of the comparator trials had more patients with advanced stages of disease than the CARTITUDE-4 trial (the CANDOR, APOLLO, and CASTOR trials) as well as more patients with lower cytogenetic risk than the CARTITUDE-4 trial (the CANDOR, APOLLO, CASTOR, BOSTON, and ICARIA-MM trials). The CARTITUDE-4 trial did not include patients with an ECOG PS of 2, while the rest of the studies included varying proportions of individuals with ECOG PS of 2, except for the ICARIA-MM trial, for which such data were not available.
The baseline covariates for populations in the CARTITUDE-4 and daratumumab comparator trials, before and after IPTW adjustments are summarized in Table 26 and Table 27. The CARTITUDE-4 study consisted of 208 patients who were treated with cilta-cel. After the exclusion of 53 patients with prior exposure to an anti-CD38 mAB therapy, the cilta-cel cohort for the analysis included 155 patients. Patients from daratumumab trials were selected, based on the eligibility criteria for the CARTITUDE-4 trial (i.e., received 1 to 3 prior lines of therapy, including a PI and an IMiD; ECOG PS < 2; disease refractory to lenalidomide). The comparator treatment populations consisted of the following cohorts: 44 patients treated with DVd (CASTOR trial), 46 patients treated with Vd (CASTOR trial), 46 patients treated with Kd (CANDOR trial), and 92 patients treated with Pd (APOLLO trial).
Before adjustment, there were numerous pairwise imbalances (standardized mean difference > 0.2) in baseline characteristics between the CARTITUDE-4 and daratumumab trial cohorts.56 The daratumumab cohorts had more patients with advanced stages of disease than the cilta-cel cohort (5.2% of patients receiving cilta-cel were at ISS disease stage III versus 22.7% of patients receiving DVd, 17.4% of patients receiving Vd, 17.4% of patients receiving Kd, and 19.6% of patients receiving Pd). Moreover, the DVd, Vd, and Pd cohorts enrolled more patients whose disease was more than double refractory than were found in the CARTITUDE-4 trial population (47.1% in the cilta-cel cohort versus 59.1% in DVd cohort, 52.2% in the Vd cohort, and 51.1% in the Pd cohort). In contrast, the Kd cohort enrolled fewer patients whose disease was more than double refractory (43.5% for Kd) than were found in the cilta-cel cohort (47.1%). Regarding time to disease progression on prior lines of therapy, 85% of patients receiving cilta-cel had experienced disease progression after more than 6 months, compared to 84.1%, 76.1%, 69.6%, and 79.3% of patients receiving DVd, Vd, Kd, and Pd, respectively. The presence of plasmacytomas or extramedullary disease was reported among 18.7% of patients receiving cilta-cel, 22% of patients receiving DVd, 20.4% of patients receiving Vd, 6.5% of patients receiving Kd, and 27.2% of patients receiving Pd. Other differences between the cilta-cel and daratumumab cohorts were observed for number of prior lines of therapy, time since MM diagnosis, hemoglobin levels, prior stem cell transplant, age, prior stem cell transplant, ECOG PS, type of MM, creatinine clearance, sex, and ethnicity.
After adjustment, there were no imbalances, with a standardized mean difference greater than 0.2, in the variables included in the base-case analyses, except for ISS disease stage, for the comparison between the cilta-cel and DVd cohorts (66.5% versus 54.7%, respectively, had ISS stage I disease).
An overview of the baseline patient covariates from the CARTITUDE-4 and comparator trials as well as the CARTITUDE-4 values after adjustment to the comparator studies used in the MAIC analyses are presented in Table 28. The CARTITUDE-4 study initially consisted of 208 patients who were treated with cilta-cel. The numbers of patients in the IsaPd and SVd cohorts were 154 and 53, respectively. Following MAIC adjustment, the ESS of cilta-cel was 26 for the comparison to IsaPd (ICARIA-MM trial) and 188 for the comparison to SVd (BOSTON trial).
When assessing the patient characteristics adjusted in the base-case analysis, there were differences in refractory status of disease (50% of individuals had disease that was refractory to PI in the cilta-cel cohort versus 77% in the IsaPd cohort), cytogenetic risk (59% of the cilta-cel cohort were of high risk versus 19% of the IsaPd and 55% of the SVd cohorts), and ISS disease stage (6% of the cilta-cel cohort were of ISS disease stage III versus 23% of the IsaPd and 8% of the SVd cohorts). Following adjustment, the proportions of individuals across diverse categories of baseline characteristics were balanced across the studies of the MAIC.
Table 24: Assessment of Homogeneity for ITC
Characteristics | Description and handling of potential effect modifiers |
|---|---|
Study design |
|
Common comparators |
|
Trial eligibility criteria |
|
Treatment history |
|
Patient baseline characteristics | Characteristics were generally comparable across trials; however, differences were observed:
|
Definitions of end points |
|
DPd = daratumumab-pomalidomide-dexamethasone; ECOG PS = Eastern Cooperative Oncology Group performance status; IMWG = International Myeloma Working Group; IPD = individual patient data; IPTW = inverse probability of treatment weighting; IRC = Independent Review Committee; IsaPd = isatuximab-pomalidomide-dexamethasone; ISS = International Staging System; ITC = indirect treatment comparison; Kd = carfilzomib-dexamethasone; MAIC = matching-adjusted indirect comparison; MM = multiple myeloma; OS = overall survival; Pd = pomalidomide-dexamethasone; PFS = progression-free survival; RRMM = relapsed or refractory multiple myeloma; SOC = standard of care; SVd = selinexor-bortezomib-dexamethasone; Vd = bortezomib-dexamethasone.
Source: Details included in the table are from the sponsor’s summary of clinical evidence.17
Table 25: Description of Study Inclusion Criteria and Baseline Characteristics From Studies Included in the ITC
Trial, comparison | Prior LOT (%) | Prior therapy (%) | Refractory status | ECOG PS | ISS disease stage | Cytogenetic risk | Extramedullary disease |
|---|---|---|---|---|---|---|---|
CARTITUDE-4 Cilta-cel vs. SOC | 1L: 32.1% 2L to 3L: 67.9% | LEN: 100% PI: 100% BOR: 97.5% DARA: 24.6% K: 33.8% Ixa: 9.5% | LEN: 100% PI: 48.3% Anti-CD38 mAB: 22.4% | 0: 55.7% 1: 44.0% 2: 0.2% | I: 63% II: 30% III: 6% | High: 62% Standard: 32% Missing: 6% | Yes: 19.4% No: 80.6% |
CANDOR DKd vs. Kd | 1L: 45% to 46% ≥ 2L: 54% to 55% | LEN: 39% to 48% BOR: 87% to 92% PI: 90% to 93% | LEN: 32% to 36% BOR: 28% to 31% | 0 to 1: 95% 2: 5% Missing: < 1% | I: 47% to 51% II: 31% to 33% III: 18% to 20% | High: 15% to 17% Standard: 33% to 34% Unknown: 49% to 51% | NR |
APOLLO DPd vs. Pd | 1L: 12% 2L to 3L: 75% ≥ 4L: 14% | LEN: 100% PI: 100% BOR: 95% to 96% K: 24% to 31% Ixa: 11% to 12% | LEN: 80% PI: 48% PI and IMiD: 42% | 0: 50% to 60% 1: 36% to 37% 2: 4% to 12% | I: 45% II: 33% III: 22% | High: 23% to 26% Standard: 42% to 47% Missing: 29% to 32% | Yes: 5% to 10% No: 90% to 95% |
CASTOR DVd vs. Vd | 1L: 45.7% to 48.6% 2L: 27.9% to 30.0% 3L: 13.0% to 14.7% > 3L: 8.8% to 11.3% | LEN: 35.5% PI: 67.3% BOR: 64.5% K: 4.8% Ixa: 4.8% IMiD: 71.3% | LEN: 28.3% BOR: 0.6% | 0: 42% to 47% 1: 45% to 53% 2: 5% to 8% > 2: 0% | I: 39% II: 38% to 41% III: 21% to 24% | High: 21% to 23% | NR |
BOSTON SVd vs. Vd | ██████ | ██ ██ ████ ███ ██ ███ ███ ████ | ██ | ██ ██████ | ██████ ███ ████ | █████ ███ | ██ |
ICARIA-MM IsaPd vs. Pd | █████ ███ █████ ███ | ████ ███ ████ ████ | ██████ | ██ | ██████ | ███ ██████ | ████ ██████ |
1L = first line; 2L = second line; 3L = third line; BOR = bortezomib; cilta-cel = ciltacabtagene autoleucel; DARA = daratumumab; DKd = daratumumab-carfilzomib-dexamethasone; DPd = daratumumab-pomalidomide-dexamethasone; DVd = daratumumab-bortezomib-dexamethasone; ECOG PS = Eastern Cooperative Oncology Group performance status; IMiD = immunomodulatory drug; IsaPd = isatuximab-pomalidomide-dexamethasone; ISS = International Staging System; ITC = indirect treatment comparison; Ixa = ixazomib; K = carfilzomib; Kd = carfilzomib-dexamethasone; LEN = lenalidomide; LOT = line of treatment; NR = not reported; Pd = pomalidomide-dexamethasone; PI = proteasome inhibitor; SOC = standard of care; SVd = selinexor-bortezomib-dexamethasone; Vd = bortezomib and dexamethasone; vs. = versus.
Note: The contents of this table were extracted by the review team from the feasibility assessment documentation for further clarity as a summary of study characteristics was not included in the sponsor’s summary of clinical evidence.
Source: Details included in the table are from the sponsor’s inverse probability of treatment weighting technical report.57
Table 26: Overview of Patient Characteristics Before and After IPTW-ATT Weighting (DVd, Vd [CASTOR Trial])
Variable | CARTITUDE-4 N = 155, n (%) | DVd pre-IPTW-ATT N = 44, n (%) | SMD | DVd post-IPTW-ATT N = 44, n (%) | SMD | Vd pre-IPTW-ATT N = 46, n (%) | SMD | Vd post-IPTW-ATT N = 46, n (%) | SMD |
|---|---|---|---|---|---|---|---|---|---|
Refractory status | |||||||||
< Double | 82 (52.9) | 18 (40.9) | –0.2421 | 26 (59.3) | 0.1283 | 22 (47.8) | –0.1017 | 19 (40.9) | –0.2419 |
≥ Double | 73 (47.1) | 26 (59.1) | 18 (40.7) | 24 (52.2) | 27 (59.1) | ||||
ISS disease stage | |||||||||
I | 103 (66.5) | 19 (43.2) | 0.6002 | 24 (54.7) | 0.2800 | 19 (41.3) | 0.5673 | 31 (68.2) | 0.0583 |
II | 44 (28.4) | 15 (34.1) | 18 (41.5) | 19 (41.3) | 13 (27.8) | ||||
III | 8 (5.2) | 10 (22.7) | 2 (3.7) | 8 (17.4) | 2 (4) | ||||
Time to disease progression on prior line | |||||||||
< 6 months | 22 (14.2) | 7 (15.9) | 0.0480 | 4 (9.8) | –0.1339 | 11 (23.9) | 0.2494 | 10 (20.8) | 0.1743 |
≥ 6 months | 133 (85.8) | 37 (84.1) | 40 (90.2) | 35 (76.1) | 36 (79.2) | ||||
Presence of plasmacytomas or extramedullary disease | |||||||||
Yes | 29 (18.7) | 1 (2.3) | –0.5568 | 10 (22) | 0.0820 | 2 (4.3) | –0.4615 | 9 (20.4) | 0.0433 |
No | 126 (81.3) | 43 (97.7) | 34 (78) | 44 (95.7) | 37 (79.6) | ||||
Number of prior lines of treatment | |||||||||
1 to 2 | 120 (77.4) | 24 (54.5) | –0.4975 | 18 (40.6) | –0.8079 | 30 (65.2) | –0.2723 | 28 (60.6) | –0.3689 |
3 | 35 (22.6) | 20 (45.5) | 26 (59.4) | 16 (34.8) | 18 (39.4) | ||||
Years since MM diagnosis | |||||||||
< 4 | 101 (65.2) | 17 (38.6) | –0.5506 | 20 (44.4) | –0.4272 | 27 (58.7) | –0.1335 | 32 (68.9) | 0.0791 |
≥ 4 | 54 (34.8) | 27 (61.4) | 24 (55.6) | 19 (41.3) | 14 (31.1) | ||||
Hemoglobin (g/dL) | |||||||||
< 10 | 40 (25.8) | 18 (40.9) | 0.3372 | 9 (20.3) | 0.4286 | 11 (23.9) | 0.1681 | 14 (30.6) | 0.1652 |
10 to 12 | 55 (35.5) | 11(25) | 9 (20.7) | 20 (43.5) | 18 (38.4) | ||||
> 12 | 60 (38.7) | 15 (34.1) | 26 (59) | 15 (32.6) | 14 (31.1) | ||||
Age (years) | |||||||||
< 65 | 96 (61.9) | 22 (50) | –0.2422 | 27 (62.2) | 0.0046 | 25 (54.3) | –0.1543 | 27 (59.4) | –0.0519 |
≥ 65 | 59 (38.1) | 22 (50) | 17 (37.8) | 21 (45.7) | 19 (40.6) | ||||
Prior stem cell transplant | |||||||||
Yes | 129 (83.2) | 36 (81.8) | –0.0371 | 39 (89.6) | 0.1883 | 30 (65.2) | –0.4207 | 27 (59.5) | –0.5431 |
No | 26 (16.8) | 8 (18.2) | 5 (10.4) | 16 (34.8) | 19 (40.5) | ||||
ECOG PS | |||||||||
0 | 85 (54.8) | 21 (47.7) | –0.1426 | 16 (36.5) | −0.375 | 25 (54.3) | –0.0099 | 24 (51.8) | –0.0618 |
1 | 70 (45.2) | 23 (52.3) | 28 (63.5) | 21 (45.7) | 22 (48.2) | ||||
Type of MM | |||||||||
IgA | 26 (16.8) | 6 (13.6) | 0.0941 | 6 (12.7) | 0.1851 | 12 (26.1) | 0.2649 | 10 (22.1) | 0.1919 |
IgG | 86 (55.5) | 26 (59.1) | 28 (64.4) | 25 (54.3) | 26 (57.3) | ||||
Other | 43 (27.7) | 12 (27.3) | 10 (22.8) | 9 (19.6) | 9 (20.6) | ||||
Creatinine clearance (mL/min) | |||||||||
< 60 | 20 (12.9) | 13 (29.5) | 0.4157 | 7 (16) | 0.0892 | 16 (34.8) | 0.5313 | 11 (23.7) | 0.2823 |
≥ 60 | 135 (87.1) | 31 (70.5) | 37 (84) | 30 (65.2) | 35 (76.3) | ||||
Sex | |||||||||
Male | 86 (55.5) | 21 (47.7) | –0.1557 | 24 (54.5) | –0.0195 | 29 (63) | 0.1543 | 28 (60) | 0.092 |
Female | 69 (44.5) | 23 (52.3) | 20 (45.5) | 17 (37) | 18 (40) | ||||
Race | |||||||||
White | 115 (74.2) | 38 (86.4) | 0.3095 | 29 (66.9) | –0.1611 | 41 (89.1) | 0.3934 | 37 (81.5) | 0.1757 |
Not reported / othera | 40 (25.8) | 6 (13.6) | 15 (33.1) | 5 (10.9) | 9 (18.5) | ||||
ATT = average treatment effect on the treated; DVd = daratumumab-bortezomib-dexamethasone; ECOG PS = Eastern Cooperative Oncology Group performance status; Ig = immunoglobulin; IPTW = inverse probability of treatment weighting; ISS = International Staging System; MM = multiple myeloma; SMD = standardized mean difference; Vd = bortezomib-dexamethasone.
aData regarding ethnicity information, including categories reported, were presented as such in the original source (sponsor’s IPTW technical report).
Notes: Shaded cells indicate that these variables were not adjusted for in the given analysis. An SMD between 0 and 0.1 indicates a small difference, an SMD greater than 0.1 and less than or equal to 0.2 indicates a moderate difference, and an SMD of more than 0.2 indicates a substantial difference.56 The content of this table was extracted by the review team from the sponsor’s IPTW technical report for further clarity, as details of patient characteristics were not included in the sponsor’s summary of clinical evidence.
Source: Details included in the table are from the sponsor’s IPTW technical report.57
Table 27: Overview of Patient Characteristics Before and After IPTW-ATT Weighting (Pd [APPOLO Trial], Kd [CANDOR Trial])
Variable | CARTITUDE-4 N = 155, n (%) | Pd pre-IPTW-ATT N = 92, n (%) | SMD | Pd post-IPTW-ATT N = 92, n (%) | SMD | Kd pre-IPTW-ATT N = 46, n (%) | SMD | Kd post-IPTW-ATT N = 46, n (%) | SMD |
|---|---|---|---|---|---|---|---|---|---|
Refractory status | |||||||||
< Double | 82 (52.9) | 45 (48.9) | –0.0799 | 47 (51.1) | –0.0352 | 26 (56.5) | 0.0727 | 24 (52.4) | –0.0108 |
≥ Double | 73 (47.1) | 47 (51.1) | 45 (48.9) | 20 (43.5) | 22 (47.6) | ||||
ISS disease stage | |||||||||
I | 103 (66.5) | 41 (44.6) | 0.5397 | 67 (73.3) | 0.1532 | 23 (50) | 0.4404 | 28 (60) | 0.1557 |
II | 44 (28.4) | 33 (35.9) | 21 (23) | 15 (32.6) | 16 (35.6) | ||||
III | 8 (5.2) | 18 (19.6) | 3 (3.6) | 8 (17.4) | 2 (4.4) | ||||
Time to disease progression on prior line | |||||||||
< 6 months | 22 (14.2) | 19 (20.7) | 0.1709 | 12 (13) | –0.0342 | 14 (30.4) | 0.3977 | 5 (10.9) | –0.1005 |
≥ 6 months | 133 (85.8) | 73 (79.3) | 80 (87) | 32 (69.6) | 41 (89.1) | ||||
Presence of plasmacytomas or extramedullary disease | |||||||||
Yes | 29 (18.7) | 3 (3.3) | –0.5098 | 25 (27.2) | 0.203 | 3 (6.5) | –0.3734 | 8 (17.2) | –0.0396 |
No | 126 (81.3) | 89 (96.7) | 67 (72.8) | 43 (93.5) | 38 (82.8) | ||||
Number of prior lines of treatment | |||||||||
1 to 2 | 120 (77.4) | 65 (70.7) | –0.1548 | 74 (79.9) | 0.0608 | 26 (56.5) | –0.4557 | 29 (62.3) | –0.3339 |
3 | 35 (22.6) | 27 (29.3) | 18 (20.1) | 20 (43.5) | 17 (37.7) | ||||
Years since MM diagnosis | |||||||||
< 4 | 101 (65.2) | 49 (53.3) | –0.2439 | 58 (63.1) | –0.0434 | 28 (60.9) | –0.0890 | 25 (53.7) | –0.2350 |
≥ 4 | 54 (34.8) | 43 (46.7) | 34 (36.9) | 18 (39.1) | 21 (46.3) | ||||
Hemoglobin (g/dL) | |||||||||
< 10 | 40 (25.8) | 25 (27.2) | 0.1818 | 16 (17.2) | 0.225 | 9 (19.6) | 0.1856 | 5 (11.3) | 0.3809 |
10 to 12 | 55 (35.5) | 39 (42.4) | 40 (43.4) | 20 (43.5) | 20 (43) | ||||
> 12 | 60 (38.7) | 28 (30.4) | 36 (39.4) | 17 (37) | 21 (45.7) | ||||
Age (years) | |||||||||
< 65 | 96 (61.9) | 37 (40.2) | –0.4451 | 47 (51.2) | –0.2176 | 28 (60.9) | –0.0219 | 27 (58.7) | –0.0671 |
≥ 65 | 59 (38.1) | 55 (59.8) | 45 (48.8) | 18 (39.1) | 19 (41.3) | ||||
Prior stem cell transplant | |||||||||
Yes | 129 (83.2) | 42 (45.7) | –0.8534 | 42 (45.3) | –0.8607 | 21 (45.7) | –0.8534 | 21 (44.9) | –0.8709 |
No | 26 (16.8) | 50 (54.3) | 50 (54.7) | 25 (54.3) | 25 (55.1) | ||||
ECOG PS | |||||||||
0 | 85 (54.8) | 58 (63) | 0.1674 | 54 (59.2) | 0.0888 | 23 (50) | –0.0970 | 19 (41.5) | –0.2698 |
1 | 70 (45.2) | 34 (37) | 38 (40.8) | 23 (50) | 27 (58.5) | ||||
Type of MM | |||||||||
IgA | 26 (16.8) | 20 (21.7) | 0.1666 | 27 (29.1) | 0.3235 | 10 (21.7) | 0.2082 | 9 (18.6) | 0.1406 |
IgG | 86 (55.5) | 52 (56.5) | 39 (42.3) | 27 (58.7) | 22 (48.6) | ||||
Other | 43 (27.7) | 20 (21.7) | 26 (28.7) | 9 (19.6) | 15 (32.9) | ||||
Creatinine clearance (mL/min) | |||||||||
< 60 | 20 (12.9) | 31 (33.7) | 0.5074 | 29 (31.8) | 0.4659 | 12 (26.1) | 0.3375 | 12 (26.9) | 0.3551 |
≥ 60 | 135 (87.1) | 61 (66.3) | 63 (68.2) | 34 (73.9) | 34 (73.1) | ||||
Sex | |||||||||
Male | 86 (55.5) | 47 (51.1) | –0.0882 | 47 (50.9) | –0.0911 | 29 (63) | 0.1543 | 27 (58.7) | 0.0641 |
Female | 69 (44.5) | 45 (48.9) | 45 (49.1) | 17 (37) | 19 (41.3) | ||||
Race | |||||||||
White | 115 (74.2) | 83 (90.2) | 0.4285 | 84 (91) | 0.4532 | 38 (82.6) | 0.2056 | 38 (82.4) | 0.2011 |
Not reported / othera | 40 (25.8) | 9 (9.8) | 8 (9) | 8 (17.4) | 8 (17.6) | ||||
ATT = average treatment effect on the treated; ECOG PS = Eastern Cooperative Oncology Group performance status; Ig = immunoglobulin; IPTW = inverse probability of treatment weighting; ISS = International Staging System; Kd = carfilzomib-dexamethasone; MM = multiple myeloma; Pd = pomalidomide-dexamethasone; SMD = standardized mean difference.
aData regarding ethnicity information, including categories reported, were presented as such in the original source (sponsor’s IPTW technical report).
Note: Shaded cells indicate that these variables were not adjusted for in the given analysis. An SMD between 0 and 0.1 indicates a small difference, an SMD greater than 0.1 and less than or equal to 0.2 indicates a moderate difference, and an SMD of more than 0.2 indicates a substantial difference.56 The content of this table was extracted by the review team from the sponsor’s IPTW technical report for further clarity, as details of patient characteristics were not included in the sponsor’s summary of clinical evidence.
Source: Details included in the table are from the sponsor’s IPTW technical report.57
Table 28: Overview of Patient Baseline Characteristics, Observed by Study and CARTITUDE-4 Adjusted to Comparator Studies (IsaPd [ICARIA-MM Trial], SVd [BOSTON Trial]) — MAIC
Variable | Cilta-cel (CARTITUDE-4) | IsaPd (ICARIA-MM) | Cilta-cel adjusted | SVd (BOSTON) | Cilta-cel adjusted |
|---|---|---|---|---|---|
Patients, N | ███ | ███ | ██ ███ ██ | ██ | ██ ██ ██ |
Baseline characteristics matched in the base-case analyses | |||||
Refractory status (disease refractory to PI), % | ███ | ███ | ███ | ██ | ██ |
Cytogenetic risk (high), % | ███ | ███ | ███ | ███ | ███ |
ISS disease stage, % | |||||
I | ███ | ███ | ███ | ██ | ██ |
II | ███ | ███ | ███ | ██ | ██ |
III | ██ | ███ | ███ | ██ | ██ |
R-ISS disease stage, % | |||||
I | ███ | ██ | ██ | ███ | ███ |
II | ███ | ██ | ██ | ███ | ███ |
III | ██ | ██ | ██ | ██ | ██ |
Baseline characteristics additionally matched in sensitivity analyses | |||||
Number of prior lines of therapy, % | |||||
1 | ███ | ██ | ██ | ███ | ███ |
2 | ███ | ██ | ██ | ███ | ███ |
Time from MM diagnosis to randomization (years), median | || | ███ | ███ | ███ | ██ |
Age, % | |||||
< 65 years | ███ | ███ | ███ | ██ | ██ |
≤ 65 and < 75 years | ███ | ███ | ███ | ██ | ██ |
≥ 75 years | ██ | ███ | ██ | ██ | ██ |
Median age (years) | ██ | ██ | ██ | ██ | ██ |
LDH category, % | |||||
LDH < 300 U/litre | ███ | ██ | ██ | ██ | ██ |
LDH > ULN | ███ | ███ | ███ | ██ | ██ |
Prior autologous HCT, % | |||||
Prior autologous stem cell transplant | ███ | ███ | ███ | ███ | ███ |
ECOG PS, % | |||||
0 | ███ | ███ | ███ | ███ | ███ |
≥ 1 | ███ | ███ | ███ | ███ | ███ |
Ethnicity, % | |||||
Black | ██ | ██ | ██ | ██ | ██ |
White | ███ | ███ | ███ | ██ | ██ |
Other | ██ | ███ | ██ | ██ | ██ |
Sex (male), % | ███ | ███ | ███ | ███ | ███ |
Type of MM, % | |||||
IgA | ███ | ███ | ███ | ██ | ██ |
IgG | ███ | ███ | ███ | ██ | ██ |
Light chain | ███ | ███ | ███ | ██ | ██ |
Other | ██ | ██ | ███ | ██ | ██ |
Creatinine clearance, % | |||||
30 to 60 mL/min | ███ | ██ | ██ | ██ | ██ |
≥ 60 mL/min | ███ | ███ | ███ | ██ | ██ |
> 60 mL/min | ███ | ██ | ██ | ███ | ███ |
Cilta-cel = ciltacabtagene autoleucel; ECOG PS = Eastern Cooperative Oncology Group performance status; HCT = hematopoietic cell transplant; Ig = immunoglobulin; IsaPd = isatuximab-pomalidomide-dexamethasone; ISS = International Staging System; LDH = lactate dehydrogenase; MAIC = matching-adjusted indirect comparison; MM = multiple myeloma; PI = proteasome inhibitor; R-ISS = Revised International Staging System; SVd = selinexor-bortezomib-dexamethasone; ULN = upper limit of normal.
Notes: Shaded cells indicate variables available for matching but not included in the model selected for sensitivity analysis given the observed baseline characteristics and impact on effective sample size. The content of this table was extracted by the review team from the sponsor’s MAIC technical report for further clarity, as details of patient characteristics were not included in the sponsor’s summary of clinical evidence. The corresponding values for baseline characteristics are reported as proportions (percentages) in the table, as the numbers were not available (except for time from MM diagnosis to randomization [median, years] and age [median, years]).
Source: Details included in the table are from the sponsor’s MAIC technical report.58
Results
Progression-Free Survival
The results of the IPTW analyses comparing the PFS estimates for cilta-cel versus comparators are summarized in Table 29. The unadjusted and ATT weighted Kaplan-Meier plots for PFS are presented for cilta-cel versus comparators in Figure 6. The observed median PFS for cilta-cel was not reached. The observed median PFS for DVd, Vd, Kd, and Pd was 7.59 months (95% CI, 6.51 to 11.17 months), 4.93 months (95% CI, 3.98 to 6.57 months), 12.01 months (95% CI, 7.43 to 15.26 months), and 6.93 months (95% CI, 4.73 to 9.53 months), respectively. The median PFS using IPTW was 9.79 months (95% CI, 6.51 to 13.40 months) for DVd, 6.21 months (95% CI, 3.84 to 7.03 months) for Vd, 11.09 months (95% CI, 3.98 to 15.26 months) for Kd, and 8.34 months (95% CI, 2.14 to 9.26 months) for Pd.
Following adjustment, the conditional HR for PFS between cilta-cel and Kd was 0.27 (95% CI, 0.16 to 0.45), between cilta-cel and Pd was 0.19 (95% CI, 0.13 to 0.30), between cilta-cel and Vd was 0.11 (95% CI, 0.07 to 0.17), and between cilta-cel and DVd was 0.25 (95% CI, 0.15 to 0.41), all favouring cilta-cel.
The results for additional sensitivity analyses of PFS using the IPTW-ATC approach and regression modelling, which included additional adjustment variables, are summarized in Appendix 1. The results for these analyses were consistent with the primary analysis.
The proportional hazards assumption was assessed for the ATT-adjusted populations of cilta-cel versus comparator treatments (Appendix 1). The log-cumulative hazard plot and Schoenfeld residuals plots for each outcome were visually inspected, and there was evidence of violation of the proportional hazards assumption for DVd, Kd, and Pd. However, the Grambsch-Therneau tests were nonsignificant (P = 0.2907 for DVd, P = 0.1156 for Kd, P = 0.5374 for Pd), indicating the proportional hazards assumption to be appropriate. Conversely, the Grambsch-Therneau test for Vd indicated potential violation of the proportional hazards assumption (P = 0.0107).
The results of the MAIC analyses comparing the PFS estimates for cilta-cel versus comparators are summarized in Table 29. The observed Kaplan-Meier curves for all treatments and adjusted curves for cilta-cel are presented in Figure 8. The median-adjusted PFS for cilta-cel was not reached. The median PFS for IsaPd and SVd was 1 ████ ██████ ████ ███ ████ ██ ██████ and ████ ██████ ████ ███ ████ ██ ███████, respectively. The adjusted HR for PFS between treatment groups was ████ ████ ███ ████ ██ █████ in the cilta-cel versus IsaPd comparison and ████ ████ ███ ████ ██ █████ ██ the cilta-cel versus SVd comparison. Findings from the sensitivity analyses, matching on additional prognostic factors, were consistent with the base case (Appendix 1).
Overall Survival
The results comparing the OS estimates for cilta-cel versus comparators are summarized in Table 29. The observed Kaplan-Meier plots for OS are presented for the cilta-cel versus comparator cohorts in Figure 7. The observed median OS for cilta-cel and Kd was not reached. The observed median OS for DVd, Vd, and Pd was █████ ██████ ████ ███ █████ ██ ███████ █████ ██████ ████ ███ █████ ██ ██████, and █████ ██████ ████ ███ █████ ██ ███████, respectively.
Following adjustment, the conditional HR for OS between cilta-cel and Kd was ████ ████ ███ ████ ██ █████, between cilta-cel and Pd was ████ ████ ███ ████ ██ ██████, between cilta-cel and Vd was ████ ████ ███ ████ ██ ██████, and between cilta-cel and DVd was ████ ████ ███ ████ ██ ██████.
The results for additional sensitivity analysis of OS, using the IPTW-ATC approach, were consistent with the base case (Appendix 1).
The proportional hazards assumption was assessed for the unadjusted populations of cilta-cel versus comparator treatments. The log-cumulative hazard plot and Schoenfeld residual plots for each outcome were visually inspected, and there was no violation of the proportional hazards assumption before significant patient drop-off, except for Kd. For OS, the Grambsch-Therneau test was nonsignificant, indicating the proportional hazards assumption to be appropriate.
The results of the MAIC analyses comparing the OS estimates for cilta-cel versus comparators are summarized in Table 29. The observed Kaplan-Meier curves for all treatments and adjusted curves for cilta-cel are presented in Figure 9[REMOVED REF FIELD]. The median OS for cilta-cel was not reached. The median OS for IsaPd and SVd was ████ ██████ ████ ███ ████ ██ █████ and ████ ██████ ████ ███ ████ ██ ████, respectively. The adjusted HR for OS was ████ ████ ███ ████ ██ █████ in the cilta-cel versus IsaPd comparison and ████ ████ ███ ████ ██ █████ in the cilta-cel versus SVd comparison. The findings from the sensitivity analyses, matching on additional prognostic factors, were consistent with the base case (Appendix 1).
Clinical Response Outcomes
The results of the IPTW and MAIC analyses, comparing cilta-cel and comparator treatment for clinical response outcomes, including ORR, CR or better, and VGPR or better, are summarized in Table 30.
For ORR assessed through IPTW analyses, observed proportions in the treatment populations were 89.7% for cilta-cel, 76.1% for Kd, 42.4% for Pd, 54.4% for Vd, and 72.7% for DVd. The IPTW-estimated RR was 1.32 (95% CI, 0.99 to 1.74) for cilta-cel versus Kd, 2.00 (95% CI, 1.31 to 3.06) for cilta-cel versus Pd, 1.77 (95% CI, 1.19 to 2.65) for cilta-cel versus Vd, and 1.38 (95% CI, 0.86 to 2.20) for cilta-cel versus DVd. Findings from the base-case analyses were aligned with the sensitivity analyses (Appendix 1).
For ORR assessed through MAIC analyses, the observed proportions in the treatment populations were 84.6% for cilta-cel, 60.4% for IsaPd, and █████ for SVd. The MAIC-estimated RR was 1.39 (95% CI, 1.19 to 1.63) for cilta-cel versus IsaPd and ████ ████ ███ ████ ██ █████ for cilta-cel versus SVd.
For the CR or better outcome assessed through IPTW analyses, observed proportions in the treatment populations were 78.1% for cilta-cel, 10.9% for Kd, 2.2% for Pd, 4.4% for Vd, and 11.4% for DVd. The IPTW-estimated RR was 6.48 (95% CI, 2.72 to 15.43) for cilta-cel versus Kd, 38.76 (95% CI, 8.55 to 175.8) for cilta-cel versus Pd, 15.60 (95% CI, 3.88 to 62.73) for cilta-cel versus Vd, and 9.36 (95% CI, 3.35 to 26.14) for cilta-cel versus DVd. Results were consistent across all sensitivity analyses (Appendix 1).
For CR assessed through MAIC analyses, observed proportions in the treatment populations were 73.1% for cilta-cel, 4.5% for IsaPd, and ████ for SVd. The MAIC-estimated RR was 17.30 (95% CI, 8.29 to 36.11) for cilta-cel versus IsaPd and ████ ████ ███ ████ ██ ██████ for cilta-cel versus SVd.
For the VGPR or better outcome assessed through IPTW analyses, the observed proportions in the treatment populations were 85.2% for cilta-cel, 52.2% for Kd, 14.1% for Pd, 15.2% for Vd, and 40.9% for DVd. The IPTW-estimated RR was 1.81 (95% CI, 1.24 to 2.64) for cilta-cel versus Kd, 3.73 (95% CI, 1.52 to 9.15) for cilta-cel versus Pd, 5.13 (95% CI, 2.39 to 10.99) for cilta-cel versus Vd, and 2.51 (95% CI, 1.39 to 4.53) for cilta-cel versus DVd. Results were consistent across all sensitivity analyses (Appendix 1).
For VGPR assessed through MAIC analyses, the observed proportions in the treatment populations were 81.3% for cilta-cel, 31.8% for IsaPd, and █████ for SVd. The MAIC-estimated RR was 2.52 (95% CI, 1.95 to 3.25) for cilta-cel versus IsaPd and ████ ████ ███ ████ ██ █████ for cilta-cel versus SVd.
Table 29: Summary of ITC Results for PFS and OS
Comparison (cilta-cel vs. comparator) | Kd | Pd | IsaPd | Vd | DVd | SVd |
|---|---|---|---|---|---|---|
Comparator trial | CANDOR | APOLLO | ICARIA-MM | CASTOR | CASTOR | BOSTON |
PFS | ||||||
ITC analyses | IPTW | IPTW | Unanchored MAICb | IPTW | IPTW | Unanchored MAICb |
Cilta-cel PFS (months), median (95% CI)a | NE (NE to NE) | NE (NE to NE) | ███ ██ ███ ███ ███ ██ | NE (NE to NE) | NE (NE to NE) | ██ ██ ██ ██ █ ██ █ ██ |
Adjusted comparator PFS (months), median (95% CI) | 11.09 (3.98 to 15.26) | 8.34 (2.14 to 9.26) | ███ ██ █ █████ | 6.21 (3.84 to 7.03) | 9.79 (6.51 to 13.40) | ████ ████ ██ █████ |
After adjustment HRc (95% CI) | 0.27 (0.16 to 0.45) | 0.19 (0.13 to 0.30) | 0.32 (0.15 to 0.70) | 0.11 (0.07 to 0.17) | 0.25 (0.15 to 0.41) | ██ ██ ██ ███ |
OS | ||||||
ITC analyses | Multivariable regression | Multivariable regression | Unanchored MAIC | Multivariable regression | Multivariable regression | Unanchored MAIC |
Observed cilta-cel OS (months), median (95% CI)a | NE (NE to NE) | NE (NE to NE) | NE (NE to NE) | NE (NE to NE) | NE (NE to NE) | NE (NE, NE) |
Observed comparator OS (months), median (95% CI) | NE (18.62 to NE) | 23.46 (17.81 to 28.81) | ████ ██ ██ █████ | ███ ██ ██ ██████ | ███ ██ ██ ██████ | ██ ███ ██ ███ |
After adjustment HRd (95% CI) | 0.44 (0.16 to 1.2) | 0.26 (0.14 to 0.49) | ████ ███ ██ █████ | ███ ██ █ █████ | ██ ██ █ █████ | ████ ███ ██ █████ |
CI = confidence interval; cilta-cel = ciltacabtagene autoleucel; DVd = daratumumab-bortezomib-dexamethasone; ECOG PS = Eastern Cooperative Oncology Group performance status; HR = hazard ratio; IPTW = inverse probability of treatment weighting; IsaPd = isatuximab-pomalidomide-dexamethasone; ISS = International Staging System; ITC = indirect treatment comparison; Kd = carfilzomib-dexamethasone; MAIC = matching-adjusted indirect comparison; mAB = monoclonal antibody; MM = multiple myeloma; NE = not estimable; OS = overall survival; Pd = pomalidomide-dexamethasone; PFS = progression-free survival; SVd = selinexor-bortezomib-dexamethasone; Vd = bortezomib-dexamethasone; vs. = versus.
aFor IPTW-based analyses, N = 155 for the cilta-cel arm (after excluding patients with no prior exposure to anti-CD38 mAB). For MAICs, N = 208 for the cilta-cel arm as reported in the CARTITUDE-4 trial.
bObserved, unadjusted median PFS were reported for MAIC-based comparators (IsaPd and SVd).
cBase-case analyses were adjusted for refractory status, ISS disease stage, presence of plasmacytomas or extramedullary disease, and time to disease progression on prior lines of therapy.
dMultivariable regression analyses adjusted for all base-case covariates (refractory status, ISS disease stage, presence of plasmacytomas or extramedullary disease, time to disease progression on prior lines of therapy), plus number of prior lines, years since diagnosis, age, hemoglobin levels, prior transplants, ECOG PS, MM type, creatinine clearance, sex, and race, for a total of 14 variables.
Source: Details included in the table are from the sponsor’s summary of clinical evidence.17
Figure 6: Observed and ATT-Adjusted Kaplan-Meier Curves for PFS for Cilta-Cel Versus Comparator Treatments (IPTW)
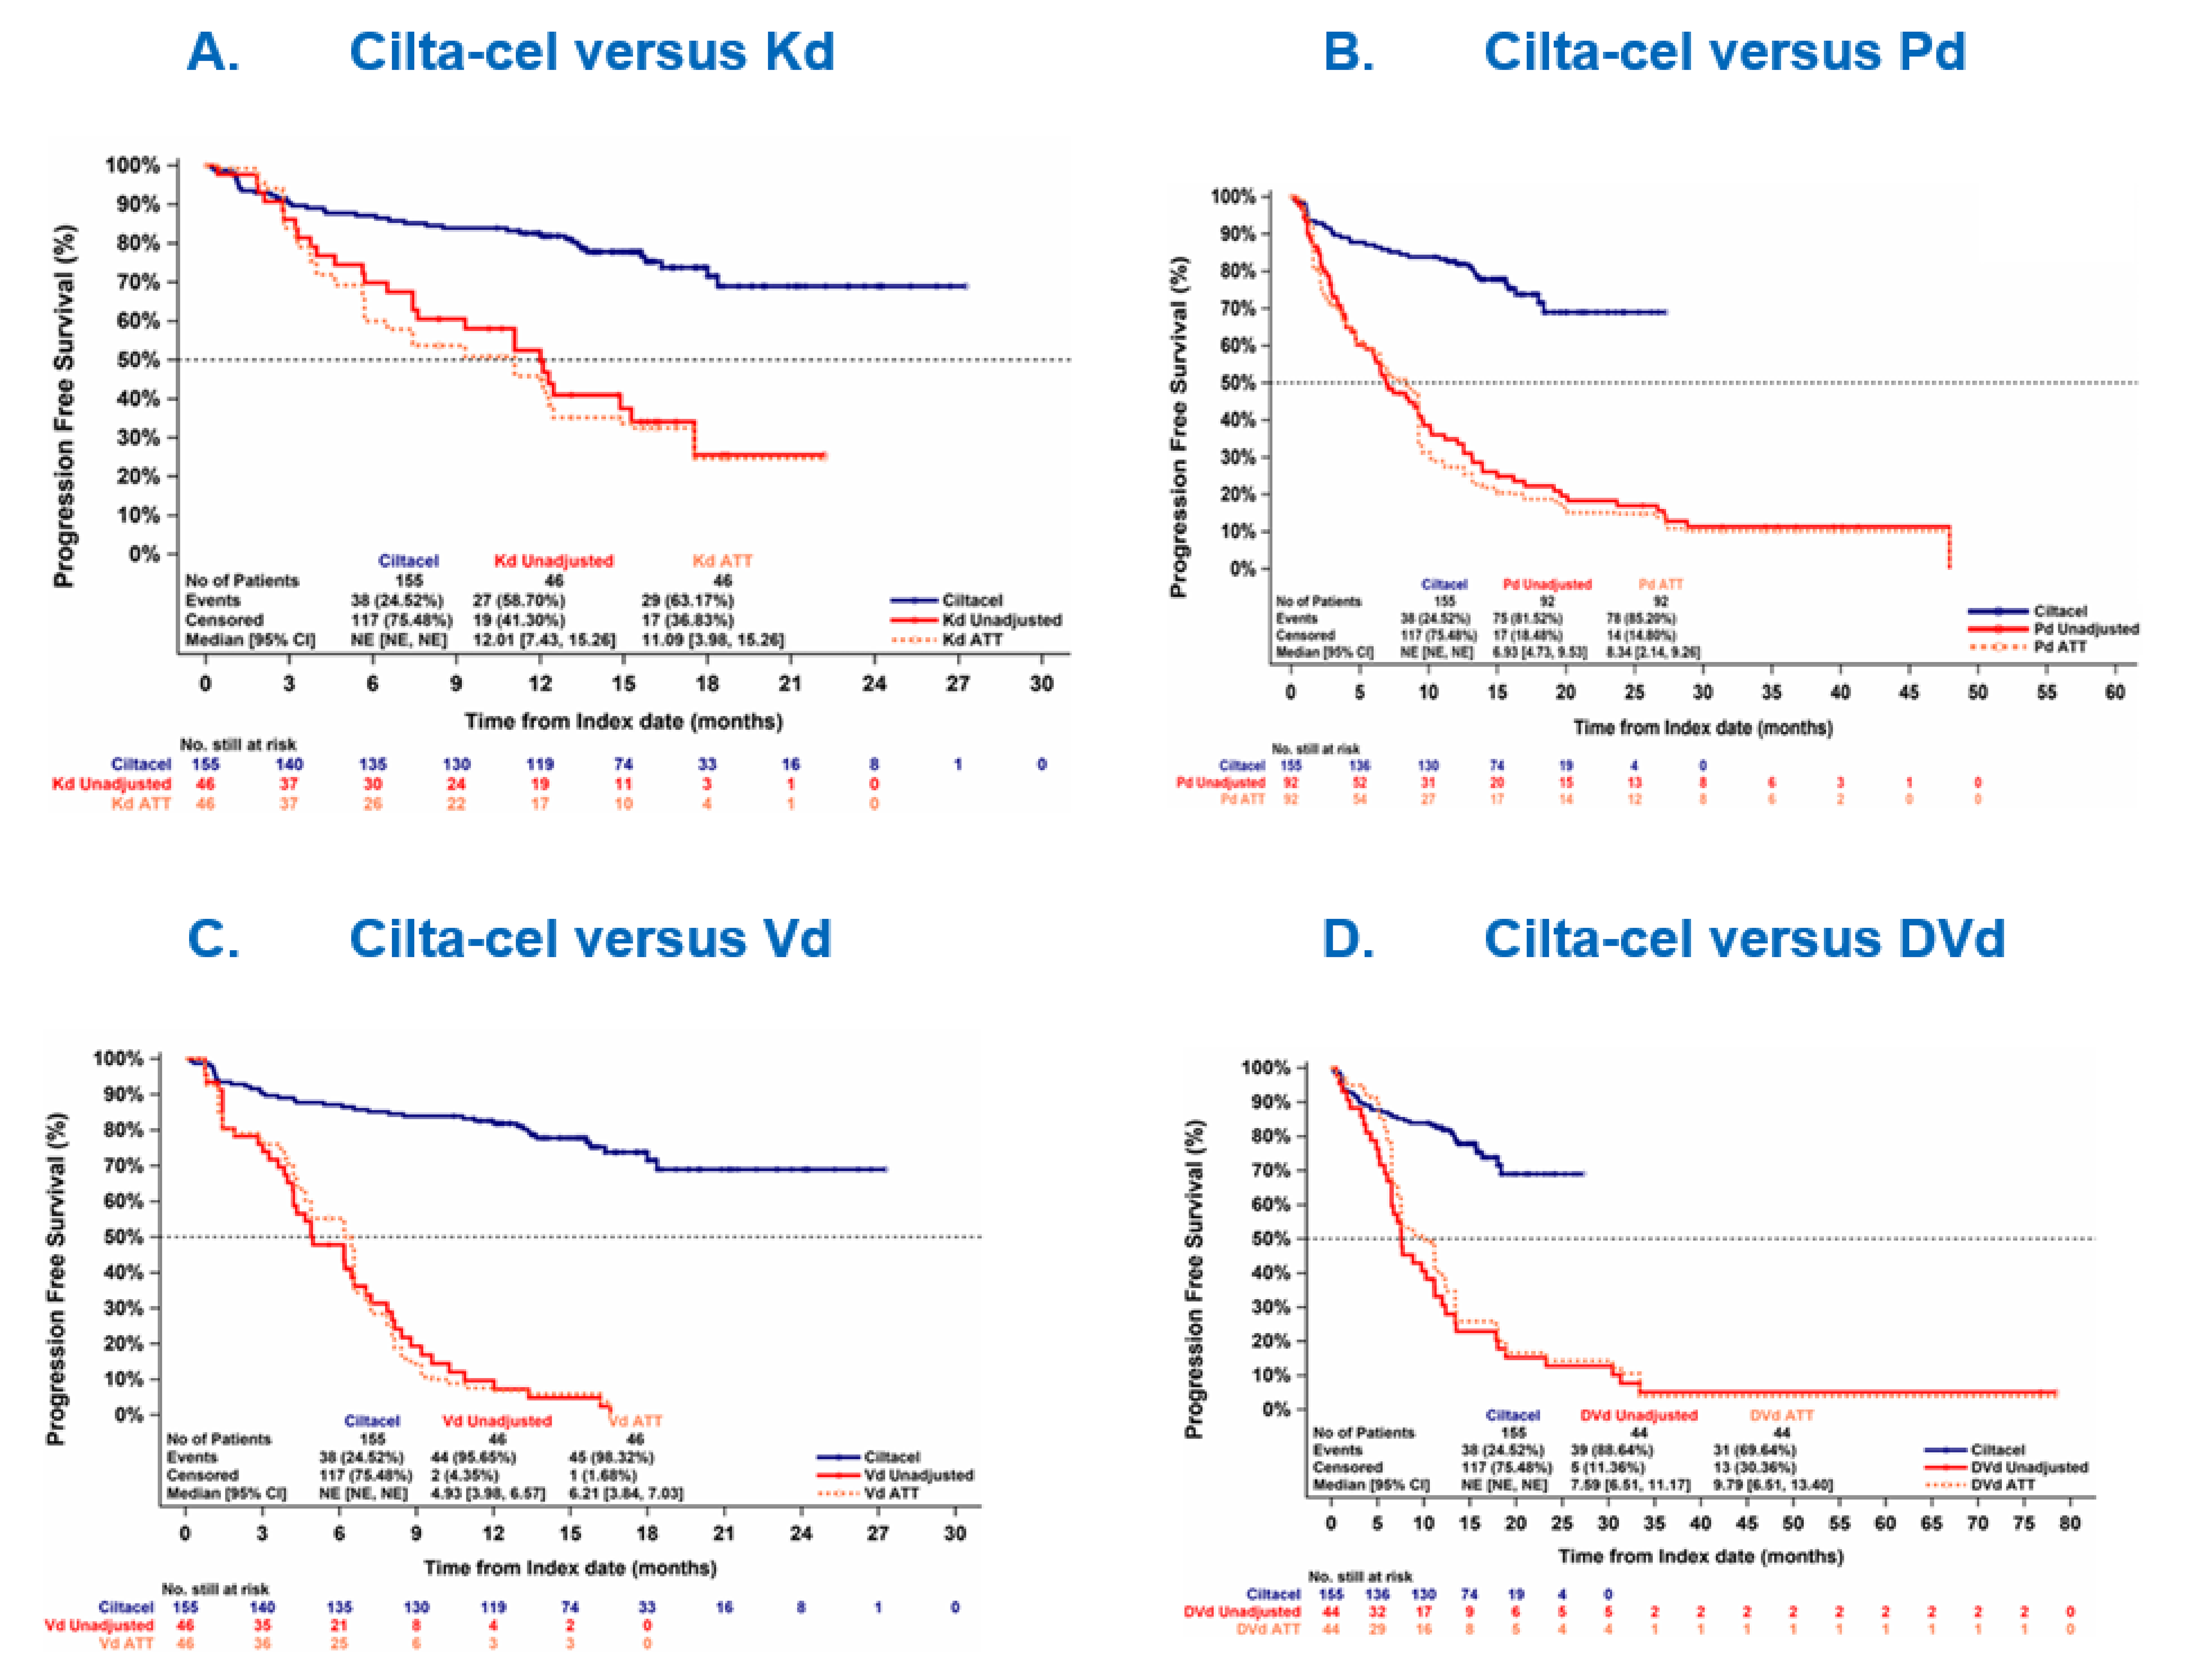
ATT = average treatment effect on the treated; CI = confidence interval; cilta-cel = ciltacabtagene autoleucel; DVd = daratumumab-bortezomib-dexamethasone; IPTW = inverse probability of treatment weighting; Kd = carfilzomib-dexamethasone; NE = not estimable; Pd = pomalidomide-dexamethasone; PFS = progression-free survival; Vd = bortezomib-dexamethasone.
Note: Adjusted for refractory status, International Staging System stage, presence of plasmacytomas or extramedullary disease, and time to disease progression on prior lines of therapy.
Source: Details included in the figure are from the sponsor’s IPTW technical report.57
Figure 7: Observed Kaplan-Meier Curves for OS for Cilta-Cel Versus Comparator Treatments (IPTW) [Redacted]

Source: Details included in the figure are from the sponsor’s IPTW technical report.57
Figure 8: Observed and Adjusted Kaplan-Meier Curves of PFS for Cilta-Cel Versus Comparator Treatments (MAIC) [Redacted]

Source: Details included in the figure are from the sponsor’s MAIC technical report.58
Figure 9: Observed and Adjusted Kaplan-Meier Curves of OS for Cilta-Cel Versus Comparator Treatments (MAIC) [Redacted]

Source: Details included in the figure are from the sponsor’s MAIC technical report.58
Table 30: Summary of ITC Results for ORR, CR or Better Rate, and VGPR or Better Rate
Comparison (cilta-cel vs. comparator) | Kd | Pd | IsaPd | Vd | DVd | SVd |
|---|---|---|---|---|---|---|
Comparator trial | CANDOR | APOLLO | ICARIA-MM | CASTOR | CASTOR | BOSTON |
ITC analyses | IPTW | IPTW | Unanchored MAIC | IPTW | IPTW | Unanchored MAIC |
ORR | ||||||
Observed cilta-cel (%)a | 89.7 | 89.7 | 84.6 | 89.7 | 89.7 | 84.6 |
Observed comparator (%) | 76.1 | 42.4 | 60.4 | 54.4 | 72.7 | █████ |
After adjustment RR (95% CI) | 1.32 (0.99 to 1.74) | 2.00 (1.31 to 3.06) | 1.39 (1.19 to 1.63) | 1.77 (1.19 to 2.65) | 1.38 (0.86 to 2.20) | ████ ██ ██ █████ |
CR or better | ||||||
Observed cilta-cel (%) | 78.1 | 78.1 | 73.1 | 78.1 | 78.1 | 73.1 |
Observed comparator (%) | 10.9 | 2.2 | 4.5 | 4.4 | 11.4 | ████ |
After adjustment RR (95% CI) | 6.48 (2.72 to 15.43) | 38.76 (8.55 to 175.8) | 17.30 (8.29 to 36.11) | 15.60 (3.88 to 62.73) | 9.36 (3.35 to 26.14) | ███ ██ ██ █████ |
VGPR or better | ||||||
Observed cilta-cel (%)a | 85.2 | 85.2 | 81.3 | 85.2 | 85.2 | 81.3 |
Observed comparator (%) | 52.2 | 14.1 | 31.8 | 15.2 | 40.9 | █████ |
After adjustment RR (95% CI) | 1.81 (1.24 to 2.64) | 3.73 (1.52 to 9.15) | 2.52 (1.95 to 3.25) | 5.13 (2.39 to 10.99) | 2.51 (1.39 to 4.53) | ███ ██ ██████ |
CI = confidence interval; cilta-cel = ciltacabtagene autoleucel; CR = complete response; DVd = daratumumab-bortezomib-dexamethasone; IPTW = inverse probability of treatment weighting; IsaPd = isatuximab-pomalidomide-dexamethasone; ITC = indirect treatment comparison; Kd = carfilzomib-dexamethasone; MAIC = matching-adjusted indirect comparison; ORR = overall response rate; Pd = pomalidomide-dexamethasone; RR = relative risk; SVd = selinexor-bortezomib-dexamethasone; Vd = bortezomib-dexamethasone; VGPR = very good partial response; vs. = versus.
aFor IPTW-based analyses, N = 155 for the cilta-cel arm (after excluding patients with no prior exposure to anti-CD38 mAB). For MAICs, N = 208 for the cilta-cel arm as reported in the CARTITUDE-4 trial.
Source: Details included in the table are from the sponsor’s summary of clinical evidence.17
Critical Appraisal of ITC
The sponsor-conducted ITC adopted a systematic review approach, with standard methods for conducting and reporting of reviews, including the following: defining the research question according to the population, interventions and comparisons, outcomes, and study design (PICOS) criteria; searching through multiple database sources; and involving multiple reviewers for study selection and data extraction. Details of the literature search and the literature review protocol were not available in the sponsor’s submission, which precluding CDA-AMC reviewers from properly assessing review performance. Moreover, a risk of bias assessment at the individual study level was conducted with the Cochrane risk of bias tool, but the results were not presented; hence, it was not possible for the CDA-AMC review team to comment on whether and how the assessment of bias was leveraged to inform the feasibility assessment or ITC analyses conducted by the sponsor.
A feasibility assessment was performed by the sponsor, assessing the variability in study designs, inclusion and exclusion criteria, outcome definitions, and baseline patient characteristics across the studies eligible for the ITC. Before the ITC adjustments, differences were observed in trial eligibility criteria as well as baseline patient characteristics, notably the number of prior lines of treatment, disease stage, refractory status, patients’ cytogenetic risk, performance status, and time to disease progression on prior lines of therapy. IPD from comparator studies on DVd, Kd, Pd, and Vd were leveraged in the IPTW analyses to obtain more balanced populations for comparison to cilta-cel, while the MAIC analyses leveraged IPD from the CARTITUDE-4 trial to match the eligibility criteria and summary-level data reported in the IsaPd and SVd trials. This process led to a reduced sample size of the individual treatment arms, introducing a potential for imprecision in the ITC outcome assessment as well as generalizability concerns. Fifty-three patients with prior anti-CD38 mAB exposure in the cilta-cel cohort were excluded from the IPTW analysis to align with the exclusion criteria in the daratumumab clinical trials. Moreover, there was about a 40% to 80% reduction in the sample sizes of the daratumumab trial arms (Kd, Pd, Vd, DVd) once the inclusion criteria for the CARTITUDE-4 trial were applied to the IPTW analyses. Matching to the comparator trials (IsaPd and SVd) for the MAIC analyses reduced the initial sample size of cilta-cel (N = 208) to an ESS of 28 (for IsaPd comparison) and 188 (for SVd comparison).
The prognostic variables to be used in the adjustments were identified a priori via literature review and consultation with independent clinical experts consulted by the sponsor. Based on this process, 15 variables were identified as important to take into consideration for the IPTW and MAIC analyses. Following the adjustment, the key baseline covariates were well balanced across the cilta-cel and comparator cohorts. However, due to limited data availability and restricted sample sizes available to inform the ITC analyses, only 4 variables were considered in the base-case analyses for IPTW (refractory status, ISS or revised ISS disease stage, presence of plasmacytomas or extramedullary disease, and time to disease progression on prior line). There was a high proportion of patients with unknown cytogenetics in the daratumumab clinical trials (range, 25% to 60%); thus, cytogenetic risk could not ultimately be included and accounted for in base-case analyses, despite being classified as “most prognostic” in the sponsor’s feasibility assessment. Cytogenetic risk was also considered a particularly important prognostic factor by the clinical experts consulted by the review team; thus, its omission from the analyses must be considered. The absence of cytogenetic risk in the IPTW analyses might have introduced bias against cilta-cel in the base-case effect estimates as there was a higher proportion of patients receiving cilta-cel in the CARTITUDE-4 cohort who had high cytogenetic risk than in the daratumumab cohorts. In the MAIC analyses, there was limited overlap between the cilta-cel and IsaPd and SVd populations. The base-case models included only 3 variables in the adjustment (refractory status, cytogenetic risk, ISS disease stage), leaving numerous prognostic factors unaccounted for. Presence of plasmacytomas or extramedullary disease was not included as a factor in the MAIC analysis. Moreover, refractory status was not adjusted in the MAIC with SVd as the BOSTON trial did not report these data. However, data for patients whose disease was refractory to lenalidomide were available from the BOSTON trial to support comparisons to SVd (subgroup data), but the lenalidomide-refractory status could not be adjusted for in the comparisons to IsaPd (i.e., only refractoriness to PI was used in the analyses). Even though sensitivity analyses adjusted for additional prognostic variables, some of these data were unavailable in the comparator trials, such as data on number of prior lines in the IsaPd trial and data on ethnicity, type of MM, and LDH category in the SVd trial. Considering all the above, there remains a high possibility that not all prognostic and effect-modifying factors were balanced between the cilta-cel and comparator groups in the MAIC analyses, leading to an unknown amount of bias in the unanchored estimates.
An additional source of heterogeneity between the CARTITUDE-4 and comparator trials, noted by the clinical experts consulted for this review, was the type of prior treatment regimens. Although the number of previous treatments was included in the sponsor’s sensitivity analyses for IPTW and MAIC, lack of subgroup data by type of prior regimen represents a limitation, according to the experts. Still, the experts reported that the previous treatment regimens used across the trials in the ITCs are aligned with the treatments used in Canadian clinical practice. Lastly, as with all observational analyses, there remains an additional possibility of an unmeasured amount of residual confounding for unknown or unobserved patient characteristics.
Outcomes included in the ITC analyses (i.e., PFS, OS, CR or better, VGPR or better, and ORR) were relevant to the treatment of patients with MM, as reported by the clinical experts consulted. There was minimal variability in the ways the outcomes were measured across the trials included in the ITC analyses. Tumour response variables were assessed in a consistent manner, using the IMWG criteria.42 The definitions of OS and PFS were comparable across trials, with time zero consistently defined as the date of randomization. Crossover and subsequent treatments used across individual trials included in the ITCs could impact the comparative survival estimates. Treatment switching was only allowed in the BOSTON trial, where patients receiving Vd switched to SVd in cases of disease progression, and subsequent therapy was reported among 56% of patients in the Pd arm of the APOLLO trial and 39% of patients in the IsaPd arm of the ICARIA-MM trial. From an analytical perspective, the proportional hazards assumption for PFS and OS was tested both visually and statistically through the Grambsch-Therneau test in the IPTW analyses. For PFS, visual evidence of violation of the proportional hazards assumption was seen for the DVd, Kd, and Pd comparisons, even though the Grambsch-Therneau test indicated potential violation only for the Vd comparison. Moreover, only visual violation of the proportional hazards assumption was observed for the OS outcome in the cilta-cel versus Kd comparison. Additionally, notable imbalances in the length of follow-up of the individual trials were noted, from around 11 months in the ICARIA-MM trial to more than 70 months in the CASTOR trial, impacting the comparability of the trials included in the ITC.
Considering all the aforementioned limitations, it is difficult to accurately determine the comparative benefits of cilta-cel versus other treatments in improving the survival of patients with MM, based on the current ITC evidence. Further uncertainty comes from the fact that the median PFS and OS were not reached for the cilta-cel population based on the interim analysis results available from the CARTITUDE-4 trial, suggesting that a longer follow-up is likely required to observe the effect of cilta-cel treatment on survival outcomes in patients with MM, which was further validated by the clinical experts consulted for this review.
No analyses were conducted for HRQoL and safety outcomes in the ITCs, which were considered important outcomes for patients with MM, according to the clinical experts. As such, no conclusions can be drawn about the impact of cilta-cel on HRQoL and the comparative safety of cilta-cel versus other treatment options for MM.
Multiple comparative analyses were prespecified and performed for cilta-cel versus Kd, Pd, Vd, and DVd (IPTW with ATT weights, IPTW with ATC weights, and multivariable regression). For the PFS and tumour response outcomes, the primary analysis method using IPTW with ATT weights was considered appropriate given the use of an external control group to estimate relative treatment effect in the population of interest (cilta-cel) and adjust for effect modifiers. For OS, multivariate regression was the primary analysis method due to the limited sample size in the comparator trials as well as the limited number of events. The regression models incorporated 14 variables, but the model fit statistics and diagnostic criteria were not reported in the sponsor’s submission, despite being prespecified in the analyses protocol. As such, it was not possible to assess the stability and performance of multivariate models, which represents a limitation, considering the substantial number of variables used for the adjustment.
Sensitivity analyses, balancing additional baseline covariates using the ATC or multivariable regression approach, were also conducted. The results of the adjusted treatment comparisons between the sensitivity and base-case analyses were consistent across survival and tumour response end points. For the comparison of cilta-cel to IsaPd and SVd, prespecified sensitivity analyses of the unadjusted MAIC accounted for an additional set of adjustment variables, beyond those already accounted for in the base case. Even though the addition of prognostic variables in the MAIC model led to further reductions in ESS for cilta-cel, the results for all outcomes of the sensitivity analyses were aligned with the base-case model. Regarding missing data, the sponsor prespecified and adopted multiple imputation procedures for variables with less than 25% of data missing, which was considered appropriate. Missing variables were imputed in the CANDOR trial for time to disease progression on prior line (about 4% of missingness), years since MM diagnosis (2% to 5% of missingness), and hemoglobin level (1% of missingness). No further imputations were required.
Considerations regarding the representation of included treatments as well as the generalizability constraints of the included therapies in the individual trials were discussed with the clinical experts consulted for this review. The treatment options presented in the ITC analyses were generally validated by the clinical experts; however, some of the key therapies were not included, such as IsaKd (an important treatment option for patients who are eligible for transplant who experienced disease progression after lenalidomide maintenance).
The daratumumab cohorts represented a broad population from Europe, North America, South America, Asia, and Australia, while the results from the CARTITUDE-4 trial are drawn from Europe, US, and a smaller proportion from other regions. An international setting was specified for the ICARIA-MM and BOSTON trials in the sponsor’s submission, with no details of specific regions or countries. It remains uncertain whether there are differences in clinical practice or availability of treatments across the regions of the trials included in the ITCs, and the direction and magnitude of potential biases remains unclear. Additionally, no Canadian investigative sites were included in the CARTITUDE-4 study, which may impact the generalizability of the results to patients living in Canada.
Regarding the generalizability of the ITC results, IPTW analyses applied CARTITUDE-4 inclusion and exclusion criteria to identify a population from the daratumumab trials for indirect comparisons. The population of interest included patients who received 1 to 3 prior lines of treatment, including an IMiD and a PI, and whose disease was refractory to lenalidomide, which is aligned with the Health Canada–approved indication. However, the additional exclusion of patients with prior anti-CD38 mAB exposure from the CARTITUDE-4 trial, which was adopted to match the exclusion criteria of the daratumumab trials, might limit the generalizability of the studied population. Beyond generalizability constraints, the experts noted that the exclusion of patients with prior anti-CD38 mAB exposure might have introduced bias against cilta-cel as the daratumumab cohorts would be more likely to respond to anti-CD38 mAB–containing regimens. According to the sponsor’s additional analyses, the relative treatments effects did not differ between the anti-CD38 mAB exposed and unexposed population of the CARTITUDE-4 trial. The generalizability of the MAIC results needs consideration, given the limited comparability between the cilta-cel and IsaPd and SVd populations described above (i.e., lack of refractory status data for comparison to SVd and lack of lenalidomide-refractory status data for comparison to IsaPd). Further generalizability constraints are associated with the eligibility criteria of the BOSTON SVd population (which included patients with an ECOG PS of 0, 1, or 2) and the eligibility criteria of the ICARIA-MM IsaPd population (which required patients to have received ≥ 2 previous lines of treatment), which are not aligned with the CARTITUDE-4 trial cilta-cel population and the Health Canada indication.
Studies Addressing Gaps in the Systematic Review Evidence
No studies addressing gaps in the systematic review evidence were submitted for this review.
Discussion
Summary of Available Evidence
One pivotal trial (the CARTITUDE-4 trial) was included in the sponsor-submitted systematic review. The CARTITUDE-4 trial is an ongoing phase III, open-label, randomized, multicentre study to evaluate the efficacy and safety of cilta-cel compared to physician’s choice of SOC therapies of either PVd or DPd in patients with RRMM who have received 1 to 3 prior lines of therapy. The CARTITUDE-4 trial enrolled adults who had documented diagnosis of MM according to IMWG diagnostic criteria, had received 1 to 3 prior lines of therapy, including a PI and an IMiD, and whose disease was refractory to lenalidomide per IMWG consensus guidelines. A total of 419 eligible patients were randomized at a 1:1 ratio to receive either cilta-cel (n = 208) or standard therapy with PVd or DPd (n = 211). Randomization was stratified by physician’s choice of PVd or DPd, ISS disease stage at screening (I, II, or III), and number of prior lines of therapy (1 versus 2 to 3). The median age of all study participants was 61.0 years, with a range of 27 to 80 years. The demographic and disease characteristics were well balanced between the treatment groups. At baseline, most of the participants were at ISS disease stage I (64.0%), had received 2 lines of therapy (40.9%), had at least 1 high-risk cytogenetic abnormality (61.2%), with gain/amp(1q) being the most reported abnormality (47.0%) of all patients. The primary objective of the study was to compare the efficacy of cilta-cel against SOC of either PVd or DPd in terms of PFS in patients with relapsed and lenalidomide-refractory MM. The primary end point was PFS, following a computerized algorithm per IMWG criteria, and secondary and other outcomes included CR or better rate, VGPR or better rate, ORR, MRD negativity rate, OS, DOR, and HRQoL. The study was funded by Janssen and Legend Biotech.
The sponsor submitted 2 ITC analyses to compare cilta-cel to relevant treatment comparators in Canada. One ITC report presented the analyses of IPD from the pivotal and 3 additional comparator clinical trials — the CANDOR (Kd), CASTOR (Vd and DVd), and APOLLO (Pd) trials — using IPTW methods. The other report presented an unanchored MAIC, using IPD from the pivotal CARTITUDE-4 trial and summary-level data from 2 comparator trials: the ICARIA-MM (IsaPd) and BOSTON (SVd) trials.
Interpretation of Results
Efficacy
Based on the results in the interim analysis (data cut-off: November 1, 2022), cilta-cel demonstrated a statistically significant and clinically meaningful improvement in the primary end point of PFS compared with SOC for patients with RRMM whose disease is lenalidomide refractory (HR = 0.26; 95% CI, 0.18 to 0.38; P < 0.0001). The cilta-cel and SOC groups’ Kaplan-Meier curves of PFS probability crossed at around 3 months after randomization, by which time 27 and 31 PFS events had occurred in the SOC group and the cilta-cel group, respectively. The sponsor stated that, given that the time from first apheresis to cilta-cel infusion was a median of 79 days, the impact of cilta-cel on PFS becomes apparent after the first 3 months. The clinical experts considered the sponsor’s statement reasonable. Overall, there is moderate certainty that cilta-cel likely results in a clinically important benefit in PFS when compared with SOC based on a 20% threshold suggested by the clinical experts at 12 months (between-group difference = 27.3%; 95% CI, 18.2% to 36.4%) and a threshold of any (non-null) effect at 24 months.
Generally, the improvements observed in PFS, CR or better rate, VGPR or better rate, ORR, DOR, overall MRD negativity rate, and time to worsening in MySIm-Q total symptom score are clinical meaningful per the feedback from the clinical experts. The median PFS and OS were not reached in the cilta-cel group and not interpretable at the time of the interim analysis (data cut-off: November 1, 2022). The clinical experts stated that the duration of follow-up (median = 15.9 months) in the interim analysis was adequate for the assessment of PFS; however, longer-term disease progression and survival data are required to assess the overall (i.e., both median survival and relative risk reduction) and absolute OS and PFS benefit at 24 months and beyond.
Moreover, there were imbalances in treatment exposure, concomitant medications, and subsequent treatments, with the following implications: more patients in the cilta-cel group discontinued study treatment and did not receive cilta-cel as the study treatment; the duration of PVd treatment was relatively short in the SOC group; notably higher proportions of patients used antibacterials (e.g., fluoroquinolones and piperacillin-tazobactam), serotonin(5ht3) antagonists, interleukin inhibitors (tocilizumab), or medications treating gastrointestinal disorders (e.g., nausea, constipation, and vomiting), anxiety, insomnia, or epileptic symptoms; and more patients (53.1%) in the SOC group received subsequent treatments than in the cilta-cel group (20.7%). These imbalances may introduce bias and make the study results difficult to interpret.
In the CARTITUDE-4 trial, the type I error rate was adequately accounted for during the primary analyses using a multiple testing procedure. Sensitivity analyses, including investigator assessment and Independent Review Committee assessment, were conducted for PFS to assess the robustness of the data; overall, the results were consistent with the primary analysis.
The review team noted that the comparators used (i.e., PVd and DPd) may not be reflective of the current clinical practice in Canada and that there were no study sites in Canada in the CARTITUDE-4 trial, which may have an impact on the generalizability of the study results to clinical practice in Canada.
Compared to SOC, cilta-cel has demonstrated clinically significant benefits in relation to sCR and CR but no benefit in relation to VGPR or PR. Overall, the CR or better (primarily sCR) rate was about 50% higher in the cilta-cel group than in the SOC group (73.1% versus 21.8%). However, the proportions of patients who reported a PR (3.4% versus 21.8% for cilta-cel versus SOC) or a VGPR (8.2% versus 23.7%) were lower in the cilta-cel group than in the SOC group, indicating no benefit in relation to PR in both the VGPR or better rate and ORR outcomes. It appears the observed improvement in the overall response was driven by the increase in the number of patients experiencing a CR or sCR. Therefore, a combined outcome measure of ORR and VGPR or better rate, which included the individual component of VGPR and PR, and related conclusions about benefit based on such combined outcomes, could be misleading as the observed improvements in these outcomes were primarily driven by sCR and CR but not VGPR and PR. According to the clinical experts, VGPR or better rate is a useful outcome in clinical practice that they would use to inform patients about the likelihood of having benefit from a treatment, whereas the CR or better rate is not commonly used in clinical practice as its measurement requires bone marrow testing, which is not conducted repeatedly in clinical practice.
The median DOR (measured as PR or better) was not reached in the cilta-cel group and not interpretable at the time of the interim analysis, despite there being high event-free probabilities at 12 months and 24 months. Therefore, it remains uncertain how long the treatment response could be sustained. Despite the improvement in CR and sCR, cilta-cel also significantly improved MRD-negative status (at 10-5) by bone marrow aspirate compared with SOC. On the prespecified statistical testing hierarchy, all these outcomes (CR, ORR, and MRD-negative status) were listed ahead of OS. Given the importance of OS, theoretically, it should be at the top of the hierarchical testing order.
Despite the reported improvements in the surrogate outcomes (i.e., CR or better rate and MRD negativity rate), the degree to which the observed benefits could be translated to an improvement in OS remains uncertain. The median OS was not reached in the cilta-cel group and not interpretable at the time of the interim analysis. Although the sponsor conducted a subsequent OS analysis at a later data cut-off of December 13, 2023, with results on the improvement of OS in favour of cilta-cel, the statistical testing of the subsequent OS analysis was not controlled for the overall type I error and the results were descriptive and should be considered as supportive evidence. As fewer patients received subsequent anticancer treatment in the cilta-cel group than in the SOC group, the OS results could potentially be biased by the subsequent antimyeloma treatments against the cilta-cel group, and thus the OS results were not necessarily a reflection of the cilta-cel treatment that was being administered in the trial (i.e., involved in certain number of intercurrent events), as per feedback from the clinical experts.
Thirty-two patients (15.4%) randomized to the cilta-cel group did not receive cilta-cel as the study treatment because they experienced progressive disease (n = 30; 14.4%) or death (n = 2; 1.0%) at the bridging therapy or conditioning treatment phases. Of those 32 patients, 20 (9.6%) received cilta-cel as a subsequent therapy rather than as the study treatment. The review team note that receiving cilta-cel as subsequent treatment may have had an impact on the reported OS. These factors would introduce uncertainty and make the OS results difficult to interpret. Overall, there is moderate certainty that cilta-cel likely results in little to no difference in OS when compared with SOC based on a threshold of any (non-null) effect.
As there is no direct evidence of cilta-cel versus relevant comparators for the treatment of MM in the clinical setting in Canada, 2 reports of ITC analyses were submitted by the sponsor. One ITC report presented IPTW-based analyses, in which IPD were used from 3 daratumumab trials — the CANDOR (Kd), CASTOR (Vd and DVd), and APOLLO (Pd) trials — which were leveraged for comparison to cilta-cel (CARTITUDE-4 trial). Another ITC report presented unanchored MAIC analyses, using IPD from the CARTITUDE-4 trial for comparisons of cilta-cel to IsaPd (ICARIA-MM trial) and SVd (BOSTON trial). Comparative treatment effect on outcomes of interest were reported, including tumour response outcomes (ORR, VGPR or better, CR or better) and survival outcomes (PFS and OS). The base-case scenario for tumour response and PFS outcomes incorporated 4 variables in the IPTW analyses (refractory status, ISS disease stage, presence of plasmacytomas or extramedullary disease, time to disease progression on prior line) and 3 variables (refractory status, cytogenetic risk, ISS disease stage) in the MAIC analyses. Assessment of OS was conducted via multivariable regression, with 14 prognostic variables used for adjustment.
While the comparative effect estimates are suggestive of a possible favourable treatment effect with cilta-cel versus Kd, Pd, Vd, and DVd, there is some uncertainty in the evidence due to limitations in the analyses. There was significant heterogeneity between the CARTITUDE-4 trial and the comparator data sources used to generate external control arms in study eligibility criteria and baseline population characteristics. Limited sample sizes were available to inform the analyses, which were further reduced by matching and adjustment methods. Cytogenetic risk and type of previous treatment regimen were considered important prognostic factors by the clinical experts consulted but were not available for the adjustment, in both the base-case and the sensitivity analysis. Further uncertainty stems from the fact that propensity scoring methods cannot account for unknown, unmeasured, or unmeasurable confounders. Regarding the assessment of survival outcomes, median PFS and OS were not reached for cilta-cel, and there was possible visual violation of proportional hazards assumptions for certain comparisons. However, statistical violation of the proportional hazards assumption, assessed with the Grambsch-Therneau test, was observed only for Vd for the PFS end point. Generalizability issues were raised by the clinical experts consulted for the review, including lack of important comparators for Canadian clinical practice (i.e., IsaKd) as well as lack of assessment of important outcomes for patients with MM (i.e., HRQoL and safety). In consideration of these notable limitations, the exact magnitude of effect when comparing cilta-cel versus Kd, Pd, Vd, and DVd remains uncertain.
The MAIC results showed a favourable treatment effect of cilta-cel versus IsaPd and SVd, based on tumour response and survival outcomes. Notable limitations of the unanchored MAIC analyses included a considerable reduction in the ESS for cilta-cel and heterogeneity between the cilta-cel and IsaPd and SVd populations. The base-case models included only a small number of variables for the adjustment and did not take into account plasmacytomas and/or extramedullary disease status, type of prior treatment, refractory status (in the comparison to SVd), and lenalidomide-refractory status (in the comparisons to IsaPd). Thus, limited comparability between the cilta-cel and IsaPd and SVd groups raises concerns that not all prognostic and effect-modifying factors were accounted for in the analysis, potentially leading to biased estimates of comparative treatment effect. The generalizability of the MAIC findings is complicated by notable differences in the eligibility criteria between the studies included in the analyses, mainly the inclusion of patients with an ECOG PS of 0,1, and 2 in the BOSTON trial and the inclusion of patients who had received 2 or more previous lines of treatment in the ICARIA-MM trial.
HRQoL was measured using disease-specific time to worsening in the MySIm-Q total symptom score. The clinical experts indicated that both the 12-month and 18-month results are relevant and provide different information from each other. The results at 12 months might reflect what the disease is doing in terms of relapsing or progressing, and the results at 18 months might reflect what the treatments are doing to the patient. Although the use of concomitant medication seemed to be consistent with the product monograph, overall, there is moderate certainty that cilta-cel likely results in a benefit in HRQoL, when compared with SOC, when the potential biased estimates due to the significantly increased use of concomitant treatments for the control of adverse events in cilta-cel group are taken into account.
Harms
Generally, increased incidences of TEAEs related to infections, CRS, and gastrointestinal disorders (e.g., nausea and/or vomiting) were observed in the cilta-cel group, as shown in the following examples: blood and lymphatic system disorders, including neutropenia (89.9% versus 85.1% for cilta-cel versus SOC), anemia (54.3% versus 26.0%), thrombocytopenia (54.3% versus 31.3%), gastrointestinal disorders (74.0% versus 55.8%), and immune system disorders (77.5% versus 8.2%). This may have led to the notably increased use of concomitant treatments in the cilta-cel group. Slightly more patients in the cilta-cel group experienced at least 1 SAE than in the SOC group (44.2% versus 38.9% for cilta-cel versus SOC). Overall, the clinical experts commented that this result is aligned with the known toxicity profile of cilta-cel in clinical practice and that they would expect to see a high frequency of toxicities (e.g., grade 1 to 2 CRS and ICANS) happening early in the cilta-cel group due to the intense initial immune response of the infused CAR T cells. The clinical experts commented on infections (61.1% versus 71.2% for cilta-cel versus SOC) and that they would closely watch the incidence of infections with CAR T-cell therapy, being vigilant to identify, treat, and if possible prevent them with prophylactic therapy such as immunoglobulins or antibiotics. The sponsor and clinical experts identified CRS and neurotoxicity (including ICANS) as notable harms. According to the clinical experts, sites administering cilta-cel typically have procedures in place for the early identification and management of CRS and neurotoxicity given they are known to arise with CAR T-cell therapy. The rates of grade 3 CRS or ICANS were less than 1.1%. The clinical experts also identified B-cell aplasia (not reported), hypogammaglobulinemia (42.2% versus 6.3% for cilta-cel versus SOC), and immune suppression (89.4% versus 87.5%) as unique notable harms for treatment with cilta-cel compared to other treatment options and indicated that they would monitor such adverse events to inform the decision to administer cilta-cel in an outpatient or inpatient setting. The sponsor-submitted ITPWs and MAICs did not include harms data, and therefore no conclusions could be drawn on the relative safety of cilta-cel versus relevant comparators.
Conclusion
Evidence derived from an ongoing trial demonstrated that the infusion of cilta-cel compared to SOC (i.e., PVd or DPd) has shown a clinically significant benefit in terms of PFS in patients with RRMM who have received 1 to 3 prior lines of therapy and whose disease is refractory to lenalidomide. The treatment benefit with cilta-cel was also consistently presented in relation to CR and sCR and to MRD-negative status. The OS benefit was uncertain, based on the submitted evidence, due to the immaturity of the data, as were the reported treatment effects on PFS and DOR. Patients’ HRQoL as measured by a disease-specific quality-of-life instrument, the MySIm-Q total symptom score. The score was prone to bias due to increased use of concomitant therapies in the cilta-cel group to control side effects, which would have positively impacted the quality of life of those patients.
There is low-certainty evidence that, compared with SOC, cilta-cel may result in little to no difference in the percentage of patients who experience SAEs. Overall, no new safety signals were identified in the CARTITUDE-4 trial; the observed safety profile of cilta-cel is aligned with clinical practice as per feedback from the clinical experts.
In the ITCs comparing cilta-cel to various currently available therapies (i.e., Kd, Pd, Vd, DVd, IsaPd, and SVd), cilta-cel demonstrated statistically significant improvements in terms of PFS (for all comparisons) and OS (for the comparisons versus Pd, Vd, DVd, and SVd). No statistically significant differences were shown in terms of OS outcome in the comparisons of cilta-cel versus Kd and IsaPd. However, the comparative evidence derived from the ITC was associated with notable limitations, including incomplete adjustment of important effect modifiers and concerns of restricted generalizability to the clinical setting in Canada.
References
1.Kyle RA, Rajkumar SV. Criteria for diagnosis, staging, risk stratification and response assessment of multiple myeloma. Leukemia. 2009;23(1):3-9. PubMed
2.Canadian Cancer Statistics Advisory Committee, Canadian Cancer Society, Statistics Canada, Public Health Agency of Canada. Canadian Cancer Statistics 2021. Toronto (ON): Canadian Cancer Society; 2021: https://cdn.cancer.ca/-/media/files/research/cancer-statistics/2021-statistics/2021-pdf-en-final.pdf. Accessed 2024 Mar 7.
3.Canadian Cancer Society. Multiple myeloma statistics. 2023; https://cancer.ca/en/cancer-information/cancer-types/multiple-myeloma/statistics. Accessed 2023 Dec 1.
4.Canadian Cancer Statistics Advisory, Canadian Cancer Society, Statistics Canada, Public Health Agency of Canada. Canadian Cancer Statistics: a 2022 special report on cancer prevalence. Toronto (ON): Canadian Cancer Society; 2022: https://cdn.cancer.ca/-/media/files/research/cancer-statistics/2022-statistics/2022-special-report/2022_prevalence_report_final_en.pdf. Accessed 2024 Mar 7.
5.Gandhi UH, Cornell RF, Lakshman A, et al. Outcomes of patients with multiple myeloma refractory to CD38-targeted monoclonal antibody therapy. Leukemia. 2019;33(9):2266-2275. PubMed
6.Kurtin SE. Relapsed or Relapsed/Refractory Multiple Myeloma. J Adv Pract Oncol. 2013;4(Suppl 1):5-14.
7.Dhakal B, Einsele H, Potluri R, et al. Real-world Treatments and Outcomes in Patients with Lenalidomide-refractory Relapsed Multiple Myeloma Treated With 1–3 Prior Lines of Therapy, Including a PI and IMiD, From the SEER-Medicare Database. Los Angeles (CA): 19th International Myeloma Society Annual Meeting; 2022 Aug 25-27. Accessed Aug 25-27, 2022.
8.Yong K, Delforge M, Driessen C, et al. Multiple myeloma: patient outcomes in real-world practice. Br J Haematol. 2016;175(2):252-264. PubMed
9.Heimberg L, Knop S. Updated Perspectives on the Management of Relapsed and Refractory Multiple Myeloma. Oncol Res Treat. 2021;44(12):682-689. PubMed
10.van de Donk NWCJ. Sequencing multiple myeloma therapies with and after antibody therapies. Hematology Am Soc Hematol Educ Program. 2020;2020(1):248-258. PubMed
11.Drug Reimbursement Expert Review Committee final recommendation: ciltacabtagene autoleucel (Carvykti -Janssen Inc.). Can J Health Technol. 2023;3(5). https://canjhealthtechnol.ca/index.php/cjht/article/view/PG0302/PG0302. Accessed 2024 Jun 1.
12.Balshem H, Helfand M, Schünemann HJ, et al. GRADE guidelines: 3. Rating the quality of evidence. J Clin Epidemiol. 2011;64(4):401-406. PubMed
13.Santesso N, Glenton C, Dahm P, et al. GRADE guidelines 26: informative statements to communicate the findings of systematic reviews of interventions. J Clin Epidemiol. 2020;119:126-135. PubMed
14.Clinical Study Report: CARTITUDE-4, 68284528MMY3002. A phase 3 randomized study comparing JNJ-68284528, a chimeric antigen receptor T cell (CAR-T) therapy directed against BCMA, versus pomalidomide, bortezomib and dexamethasone (PVd) or daratumumab, pomalidomide and dexamethasone (DPd) in subjects with relapsed and lenalidomide-refractory multiple myeloma [internal sponsor's report]. Raritan (NJ): Janssen Research & Development, LLC; 2023 May 2.
15.Janssen Inc. response to May 27, 2024 CADTH request for additional information regarding Carvykti (ciltacabtagene autoleucel) CADTH review: attachments to the CARTITUDE-4 CSR dated May 2, 2023 (data cut-off date: November 1, 2022) [internal additional sponsor's information]. Toronto (ON): Janssen Inc.; 2024 Jun 3.
16.Janssen Inc. response to June 6, 2024 CADTH request for additional information regarding Carvykti (ciltacabtagene autoleucel) CADTH review: absolute differences re: duration response and very good partial response or better rate [internal additional sponsor's information]. Toronto (ON): Janssen Inc.; 2024 Jun 11.
17.Sponsor summary of clinical evidence: ciltacabtagene autoleucel for the treatment of relapsed/refractory multiple myeloma [internal sponsor's report]. In: Drug Reimbursement Review sponsor submission: Carvykti (ciltacabtagene autoleucel), cell suspension in infusion bag for intravenous infusion. Toronto (ON): Janssen Inc.; 2023 Jun.
18.Rajkumar SV. Multiple myeloma: 2022 update on diagnosis, risk stratification, and management. Am J Hematol. 2022;97(8):1086-1107. PubMed
19.Acaster S, Gaugris S, Velikova G, Yong K, Lloyd AJ. Impact of the treatment-free interval on health-related quality of life in patients with multiple myeloma: a UK cross-sectional survey. Support Care Cancer. 2013;21(2):599-607. PubMed
20.Despiegel N, Touboul C, Flinois A, et al. Health-Related Quality of Life of Patients With Multiple Myeloma Treated in Routine Clinical Practice in France. Clin Lymphoma Myeloma Leuk. 2019;19(1):e13-e28. PubMed
21.Kamal M, Wang XS, Shi Q, et al. Symptom burden and its functional impact in patients with “symptomatic” relapsed or refractory multiple myeloma. Support Care Cancer. 2020;29(1):467-475. PubMed
22.Quinn C, Hirji I, Shingler SL, Davis C. Mapping Health State Utility Values From Eortc Data Collected From A Clinical Trial Population With Relapsed/Refractory Multiple Myeloma. Value Health. 2015;18(7):A468.
23.Ramsenthaler C, Osborne TR, Gao W, et al. The impact of disease-related symptoms and palliative care concerns on health-related quality of life in multiple myeloma: a multi-centre study. BMC Cancer. 2016;16:427. PubMed
24.Rizzo M, Xu Y, Panjabi S, Iheanacho I. PSY90 - A Systematic Literature Review of the Humanistic Burden of Multiple Myeloma. Value Health. 2014;17(7):A537. PubMed
25.Kyle RA, Gertz MA, Witzig TE, et al. Review of 1027 patients with newly diagnosed multiple myeloma. Mayo Clin Proc. 2003;78(1):21-33. PubMed
26.Lokhorst HM, van der Holt B, Zweegman S, et al. A randomized phase 3 study on the effect of thalidomide combined with adriamycin, dexamethasone, and high-dose melphalan, followed by thalidomide maintenance in patients with multiple myeloma. Blood. 2010;115(6):1113-1120. PubMed
27.Moreau P, Attal M, Facon T. Frontline therapy of multiple myeloma. Blood. 2015;125(20):3076-3084. PubMed
28.SEER Cancer Statistics Factsheets: Common Cancer Sites. Bethesda (MD): National Cancer Institute: https://seer.cancer.gov/statfacts/html/common.html. Accessed 2021 May 13.
29.Canadian Cancer Society. Diangosis of multiple myeloma. 2023; https://cancer.ca/en/cancer-information/cancer-types/multiple-myeloma/diagnosis. Accessed 2023 Dec 3.
30.Mayo Clinic. Multiple myeloma - Diagnosis. 2023; https://www.mayoclinic.org/diseases-conditions/multiple-myeloma/diagnosis-treatment/drc-20353383. Accessed 2023 Dec 3.
31.Rajkumar SV. Updated Diagnostic Criteria and Staging System for Multiple Myeloma. Am Soc Clin Oncol Educ Book. 2016;35:e418-423. PubMed
32.Mikhael J, Ismaila N, Cheung MC, et al. Treatment of Multiple Myeloma: ASCO and CCO Joint Clinical Practice Guideline. J Clin Oncol. 2019;37(14):1228-1263. PubMed
33.Reimbursement Review: Provisional Funding Algorithm for multiple myeloma. Ottawa (ON): CADTH; 2023: https://www.cadth.ca/sites/default/files/DRR/2023/PH0031%20Multiple%20Myeloma_Algorithm-Secured.pdf. Accessed 2023 Aug.
34.Carvykti (ciltacabtagene autoleucel): cell suspension in infusion bag, 0.5-1.0x10⁶ CAR-positive viable T-cells per kg body weight with a maximum of 1x10⁸ CAR-positive viable T-cells, for intravenous infusion [product monograph]. Toronto (ON): Janssen Inc.; 2023 Feb 9.
35.Darzalex (daratumumab): 20 mg/mL concentrate for solution for infusion [product monograph]. Toronto (ON): Janssen Inc.; 2024 Apr 30.
36.Xpovio (selinexor): 20 mg oral tablets [product monograph]. Oakville (ON): FORUS Therapeutics Inc; 2024 Mar 22.
37.Pomalyst (pomalidomide): 1 mg, 2 mg, 3 mg and 4 mg, oral capsules [product monograph]. Saint-Laurent (QC): Bristol-Myers Squibb Canada; 2024 Jan 25.
38.Sarclisa (isatuximab for injection): 100 mg/5 mL or 500 mg/25 mL, concentrate for solution for infusion, in single use vial [product monograph]. Toronto (ON): Sanofi-aventis Canada Inc.; 2024 Jan 12: https://pdf.hres.ca/dpd_pm/00074207.PDF. Accessed 2024 Aug 08.
39.Kyprolis (carfilzomib): 10, 30, 60 mg per vial, powder for injection [product monograph]. Mississauga (ON): Amgen Canada Inc.; 2018 Oct 19.
40.San-Miguel J, Dhakal B, Yong K, et al. Cilta-cel or Standard Care in Lenalidomide-Refractory Multiple Myeloma. N Engl J Med. 2023;389(4):335-347. PubMed
41.Statistical Analysis Plan: CARTITUDE-4 Addendum, protocol 68284528MMY3002. A phase 3 randomized study comparing JNJ-68284528, a chimeric antigen receptor T cell (CAR-T) therapy directed against BCMA, versus pomalidomide, bortezomib and dexamethasone (PVd) or daratumumab, pomalidomide and dexamethasone (DPd) in subjects with relapsed and lenalidomide-refractory multiple myeloma [internal sponsor's report]. Raritan (NJ): Janssen Research & Development, LLC; 2022 Aug 22.
42.Kumar S, Paiva B, Anderson KC, et al. International Myeloma Working Group consensus criteria for response and minimal residual disease assessment in multiple myeloma. Lancet Oncol. 2016;17(8):e328-e346. PubMed
43.Drug Topic: Use of Minimal Residual Disease (MRD) as an Endpoint in Multiple Myeloma Clinical Trials. Oncologic Drugs Advisory Committee (ODAC) Meeting on April 12, 2024. Silver Spring (MD): U.S. Food and Drug Administration (FDA); 2024: https://www.fda.gov/media/177652/download. Accessed 2024 Aug 7.
44.Gries KS, Fastenau J, Seo C, Potrata B, Iaconangelo C, Serrano D. Development of the Multiple Myeloma Symptom and Impact Questionnaire: A New Patient-Reported Outcome Instrument to Assess Symptom and Impacts in Patients With Multiple Myeloma. Value Health. 2021;24(12):1807-1819. PubMed
45.Uno H, Claggett B, Tian L, et al. Moving beyond the hazard ratio in quantifying the between-group difference in survival analysis. J Clin Oncol. 2014;32(22):2380-2385. PubMed
46.Clinical Study Report: CARTITUDE-4 Addendum, 68284528MMY3002. A phase 3 randomized study comparing JNJ-68284528, a chimeric antigen receptor T cell (CAR-T) therapy directed against BCMA, versus pomalidomide, bortezomib and dexamethasone (PVd) or daratumumab, pomalidomide and dexamethasone (DPd) in subjects with relapsed and lenalidomide-refractory multiple myeloma [internal sponsor's report]. Raritan (NJ): Janssen Research & Development, LLC; 2023 May 24.
47.Sponsor briefing document for oncologic drugs advisory committee (ODAC): Ciltacabtagene autoleucel for the treatment of adult patients with relapsed or refractory multiple myeloma who have received at least 1 prior line of therapy, including a proteasome inhibitor and an immunomodulatory agent, and are refractory to lenalidomide [internal sponsor's report]. Toronto (ON): Janssen, Inc.; 2024 Mar 15.
48.Cochrane Methods Bias. RoB 2: A revised Cochrane risk-of-bias tool for randomized trials. https://methods.cochrane.org/bias/resources/rob-2-revised-cochrane-risk-bias-tool-randomized-trials. Accessed 2024 Jun 20.
49.Martin T, Krishnan A, Yong K, et al. Comparative effectiveness of ciltacabtagene autoleucel in CARTITUDE-1 versus physician's choice of therapy in the Flatiron Health multiple myeloma cohort registry for the treatment of patients with relapsed or refractory multiple myeloma. EJHaem. 2022;3(1):97-108. PubMed
50.Weisel K, Martin T, Krishnan A, et al. Comparative Efficacy of Ciltacabtagene Autoleucel in CARTITUDE-1 vs Physician's Choice of Therapy in the Long-Term Follow-Up of POLLUX, CASTOR, and EQUULEUS Clinical Trials for the Treatment of Patients with Relapsed or Refractory Multiple Myeloma. Clin Drug Investig. 2022;42(1):29-41. PubMed
51.Faria R, Hernandez Alava M, Manca A, Wailoo AJ. NICE DSU Technical Support Document 17: The use of observational data to inform estimates of treatment effectiveness for Technology Appraisal: Methods for comparative individual patient data. Sheffield (UK): Decision Support Unit, ScHARR, University of Sheffield; 2015: https://www.sheffield.ac.uk/media/34204/download?attachment. Accessed 2024 Jun 20.
52.Li F, Morgan KL, Zaslavsky AM. Balancing Covariates via Propensity Score Weighting. J Am Stat Assoc. 2017;113(521):390-400. PubMed
53.Phillippo DM, Ades AE, Dias S, Palmer S, Abrams KR, Welton NJ. NICE DSU Technical Support Document 18: Methods for population-adjusted indirect comparisons in submissions to NICE. Sheffield (UK): Decision Support Unit, ScHARR, University of Sheffield; 2016: https://www.sheffield.ac.uk/media/34216/download?attachment. Accessed 2024 Jun 20.
54.Signorovitch JE, Sikirica V, Erder MH, et al. Matching-adjusted indirect comparisons: a new tool for timely comparative effectiveness research. Value Health. 2012;15(6):940-947. PubMed
55.Guyot P, Ades AE, Ouwens MJ, Welton NJ. Enhanced secondary analysis of survival data: reconstructing the data from published Kaplan-Meier survival curves. BMC Med Res Methodol. 2012;12:9. PubMed
56.Austin PC. Balance diagnostics for comparing the distribution of baseline covariates between treatment groups in propensity-score matched samples. Stat Med. 2009;28(25):3083-3107. PubMed
57.Efficacy of CARVYKTI in CARTITUDE-4 versus other conventional treatment regimens for lenalidomide-refractory multiple myeloma using inverse probability of treatment weighting. Draft [internal sponsor's report]. In: Drug Reimbursement Review sponsor submission: Carvykti (ciltacabtagene autoleucel), cell suspension in infusion bag for intravenous infusion. Toronto (ON): Janssen Inc.; 2024 Apr 5.
58.Comparative efficacy of ciltacabtagene autoleucel (CARTITUDE-4) versus approved comparator treatments for patients with relapsed or refractory multiple myeloma with 1–3 prior lines of therapy: MAIC Technical Report – EloPd, IsaPd, SVd [internal sponsor's report]. In: Drug Reimbursement Review sponsor submission: Carvykti (ciltacabtagene autoleucel), cell suspension in infusion bag for intravenous infusion. Toronto (ON): Janssen Inc.; 2024 Mar 7.
Appendix 1: Detailed Outcome Data
Please note that this appendix has not been copy-edited.
Figure 10: Forest Plot of PFS by Subgroups (ITT Analysis Set; Data Cut-Off: November 1, 2022) — Part 1
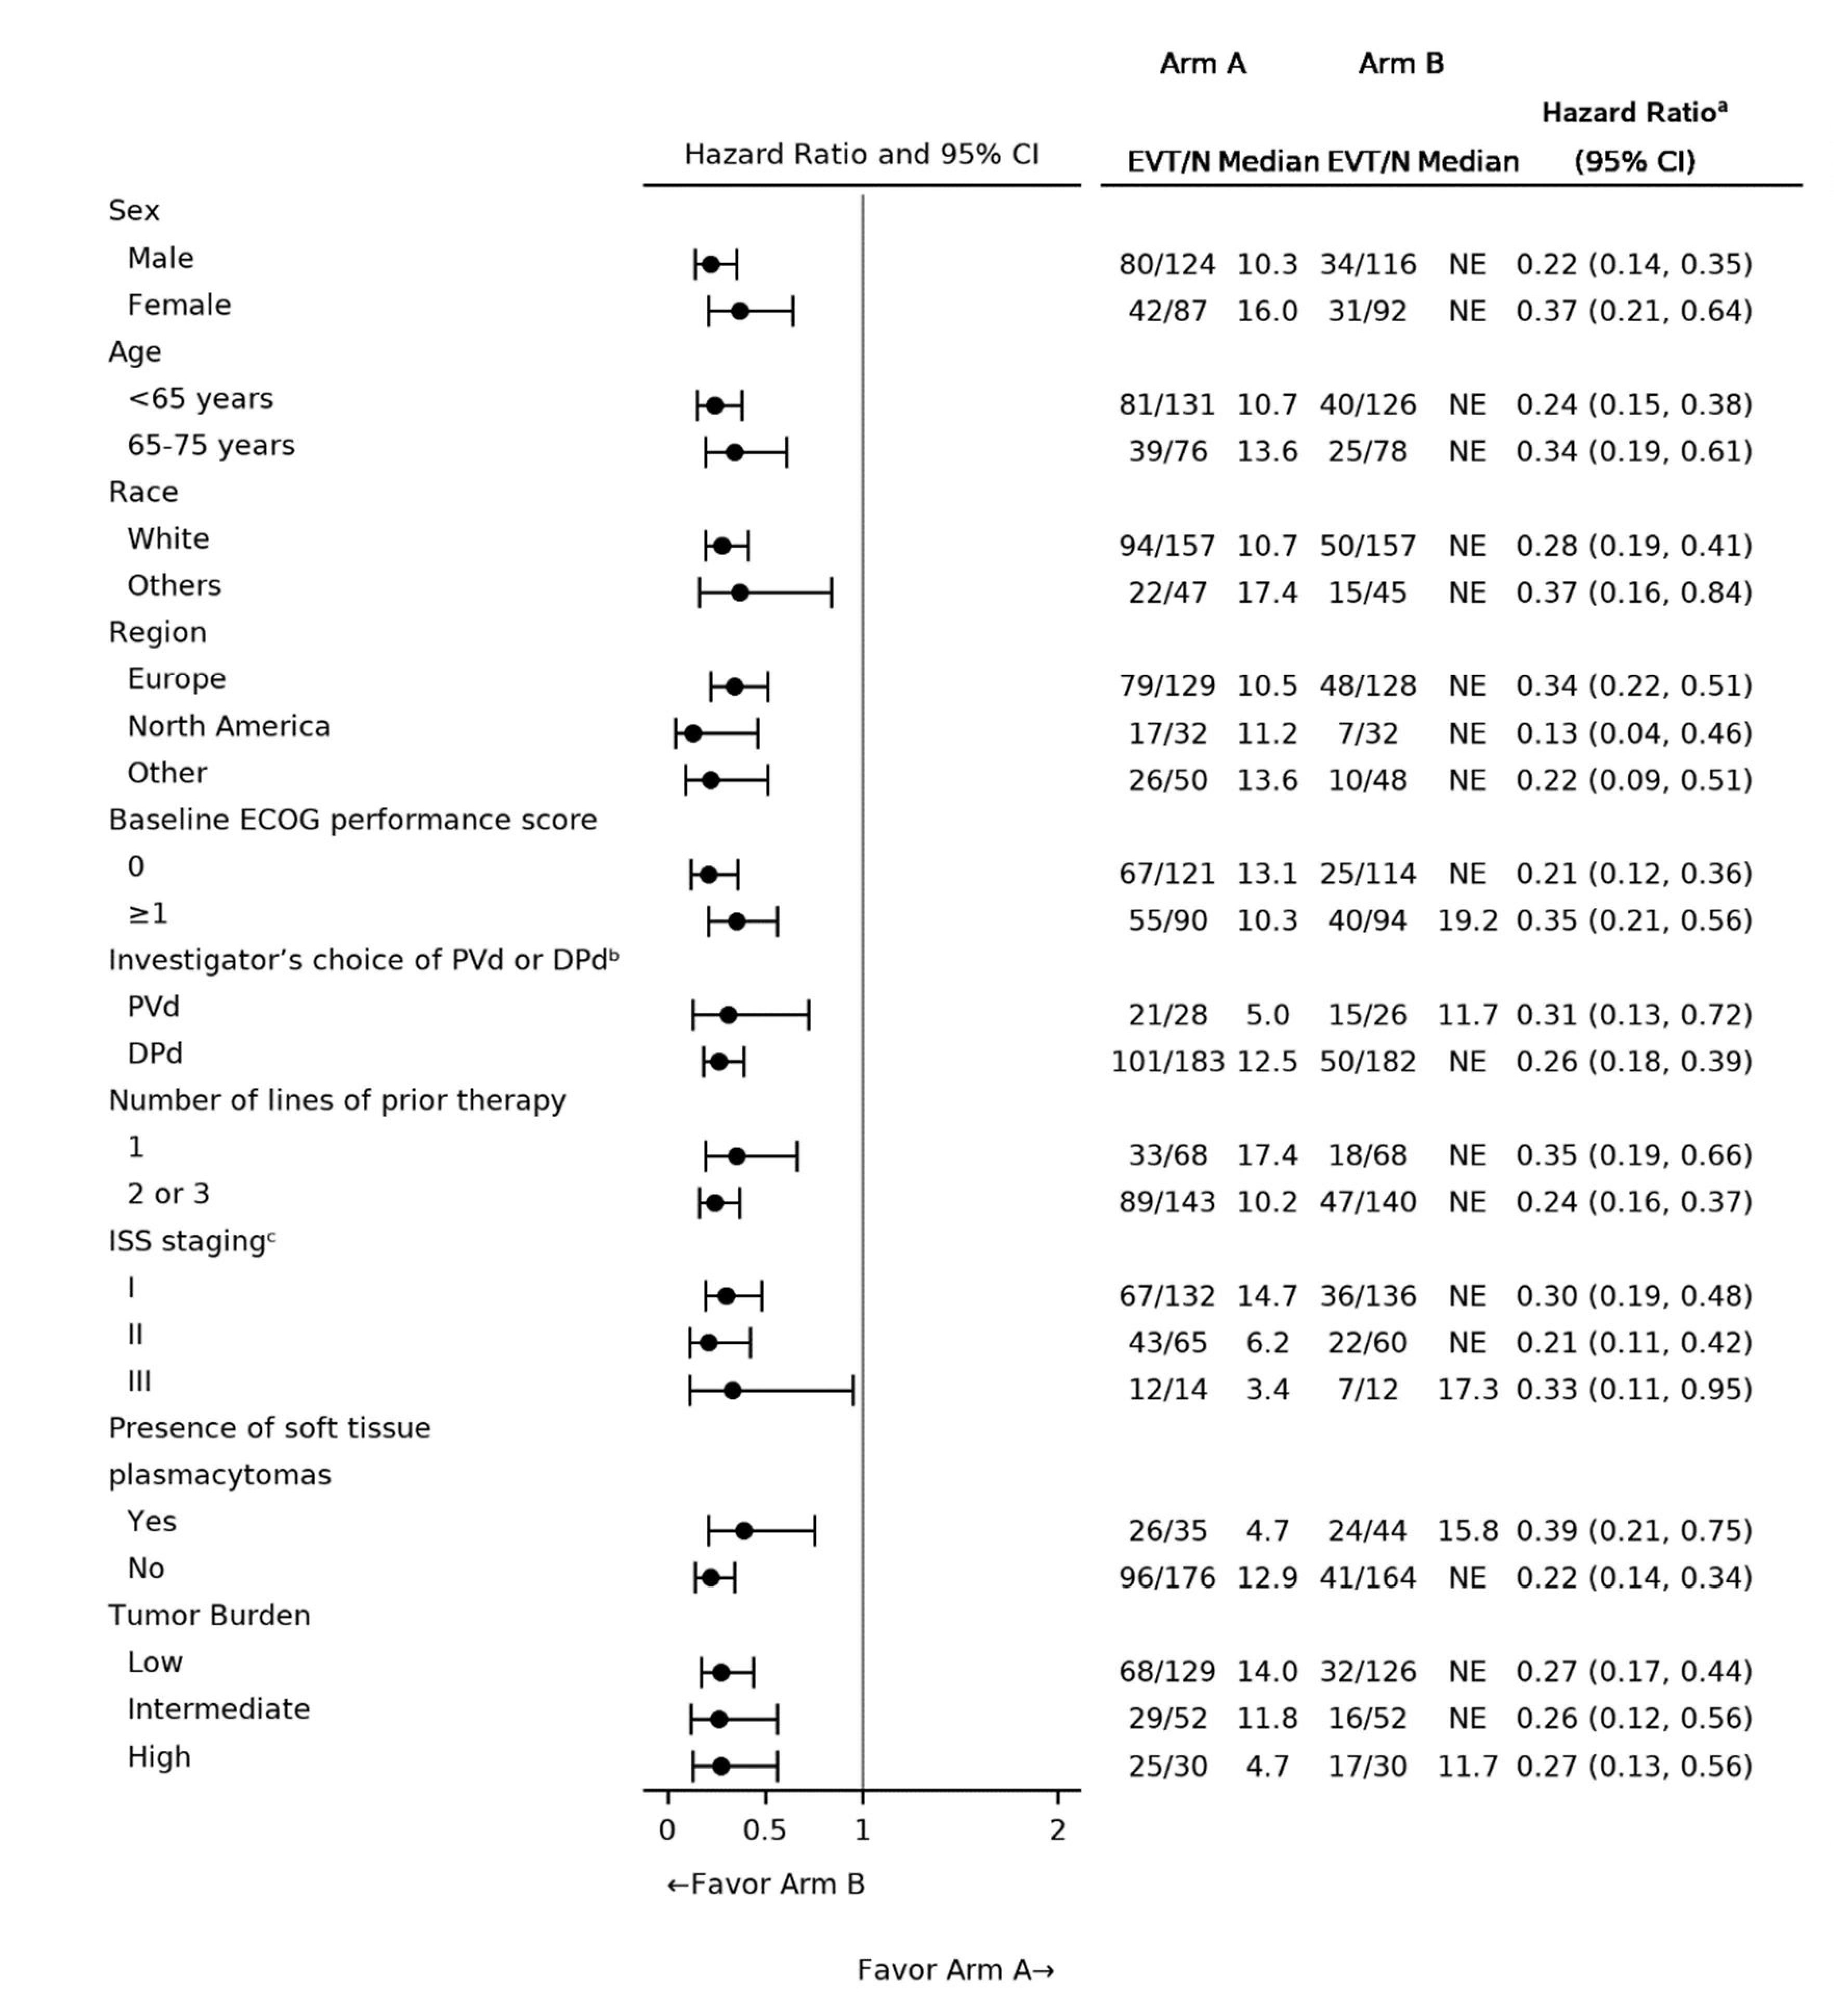
Source: 2023 primary Clinical Study Report for CARTITUDE-4 trial.14
Figure 11: Forest Plot of PFS by Subgroups (ITT Analysis Set; Data Cut-Off: November 1, 2022) — Part 2
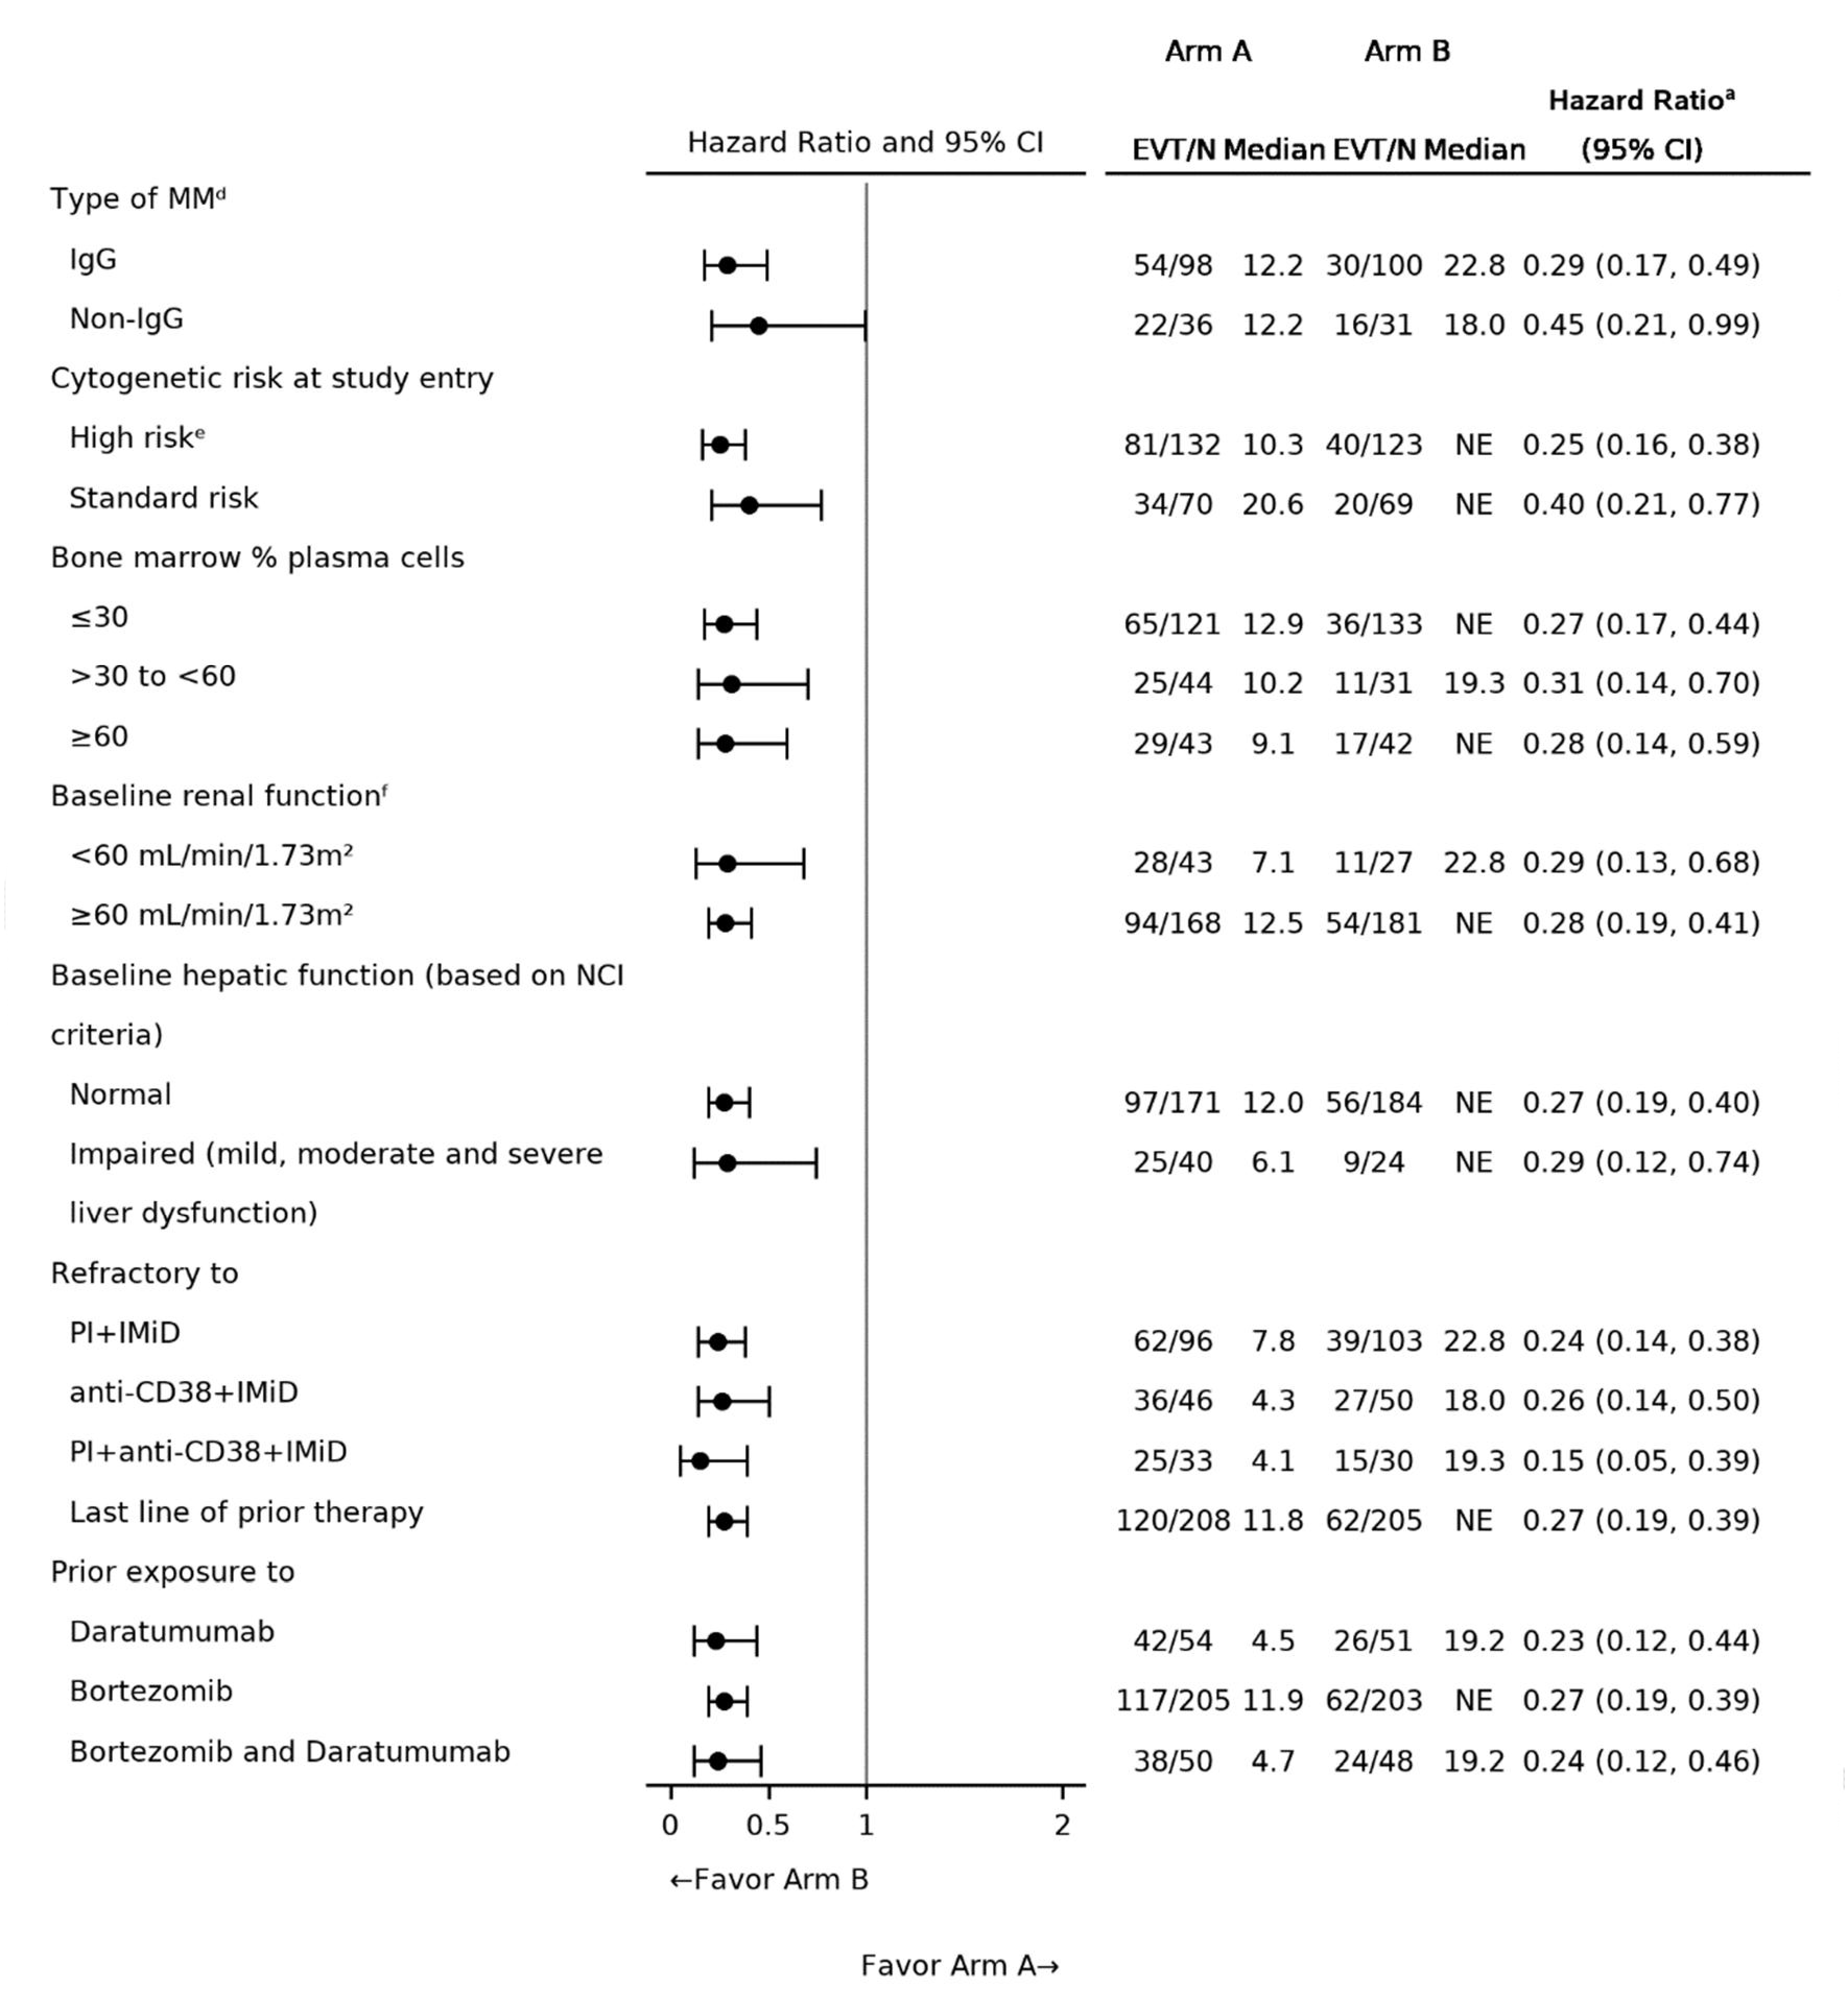
Source: 2023 primary Clinical Study Report for CARTITUDE-4 trial.14
Figure 12: Kaplan-Meier Plot for Overall Survival (ITT Analysis Set; Data Cut-Off: December 13, 2023)
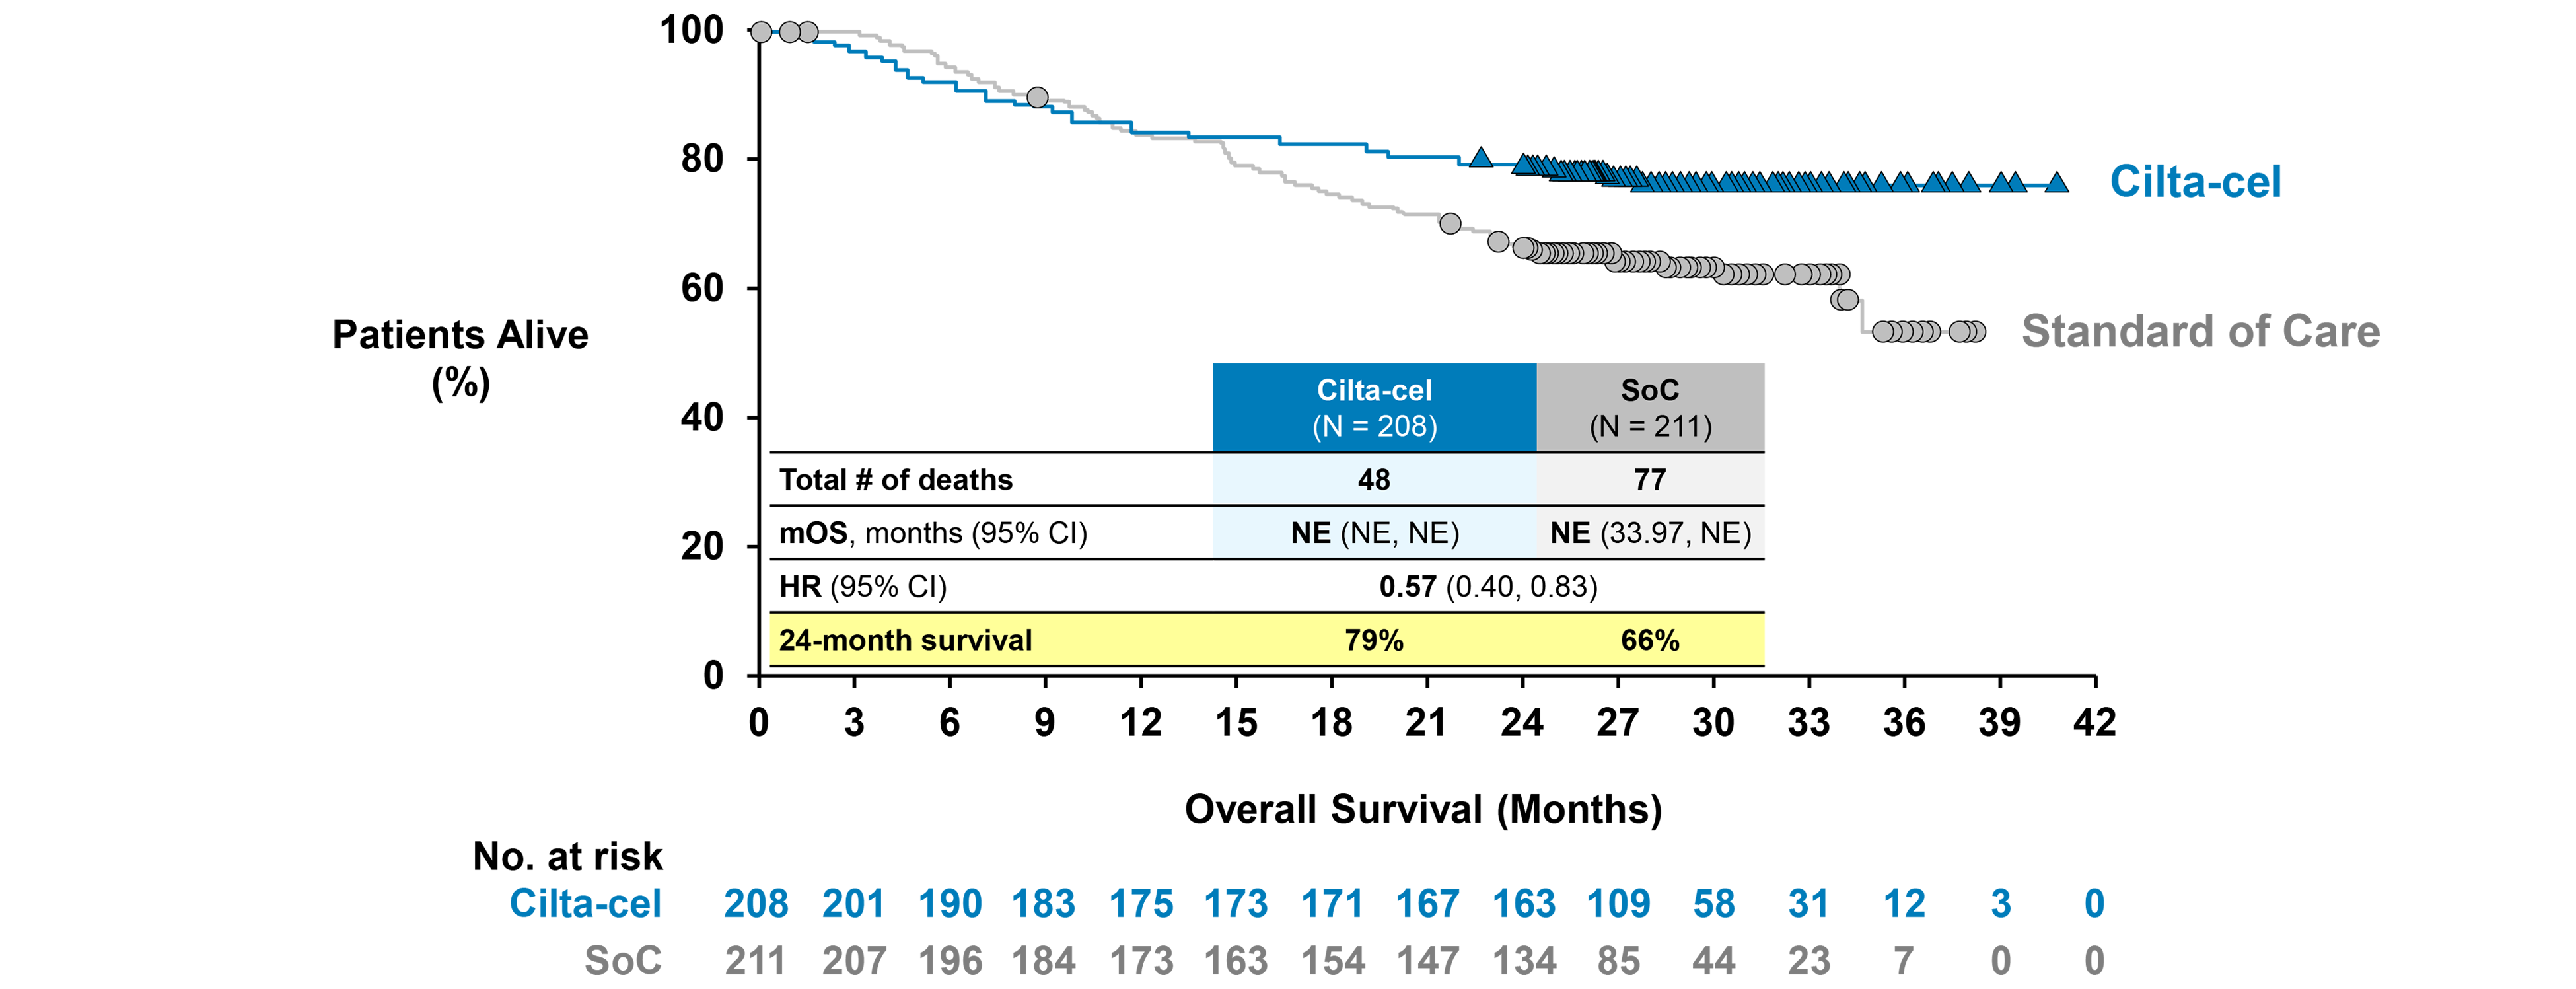
Source: Sponsor briefing document for oncologic drugs advisory committee.47
Figure 13: Comparative Efficacy of Cilta-Cel Versus Comparators for PFS (IPTW Results Including Sensitivity Analyses)
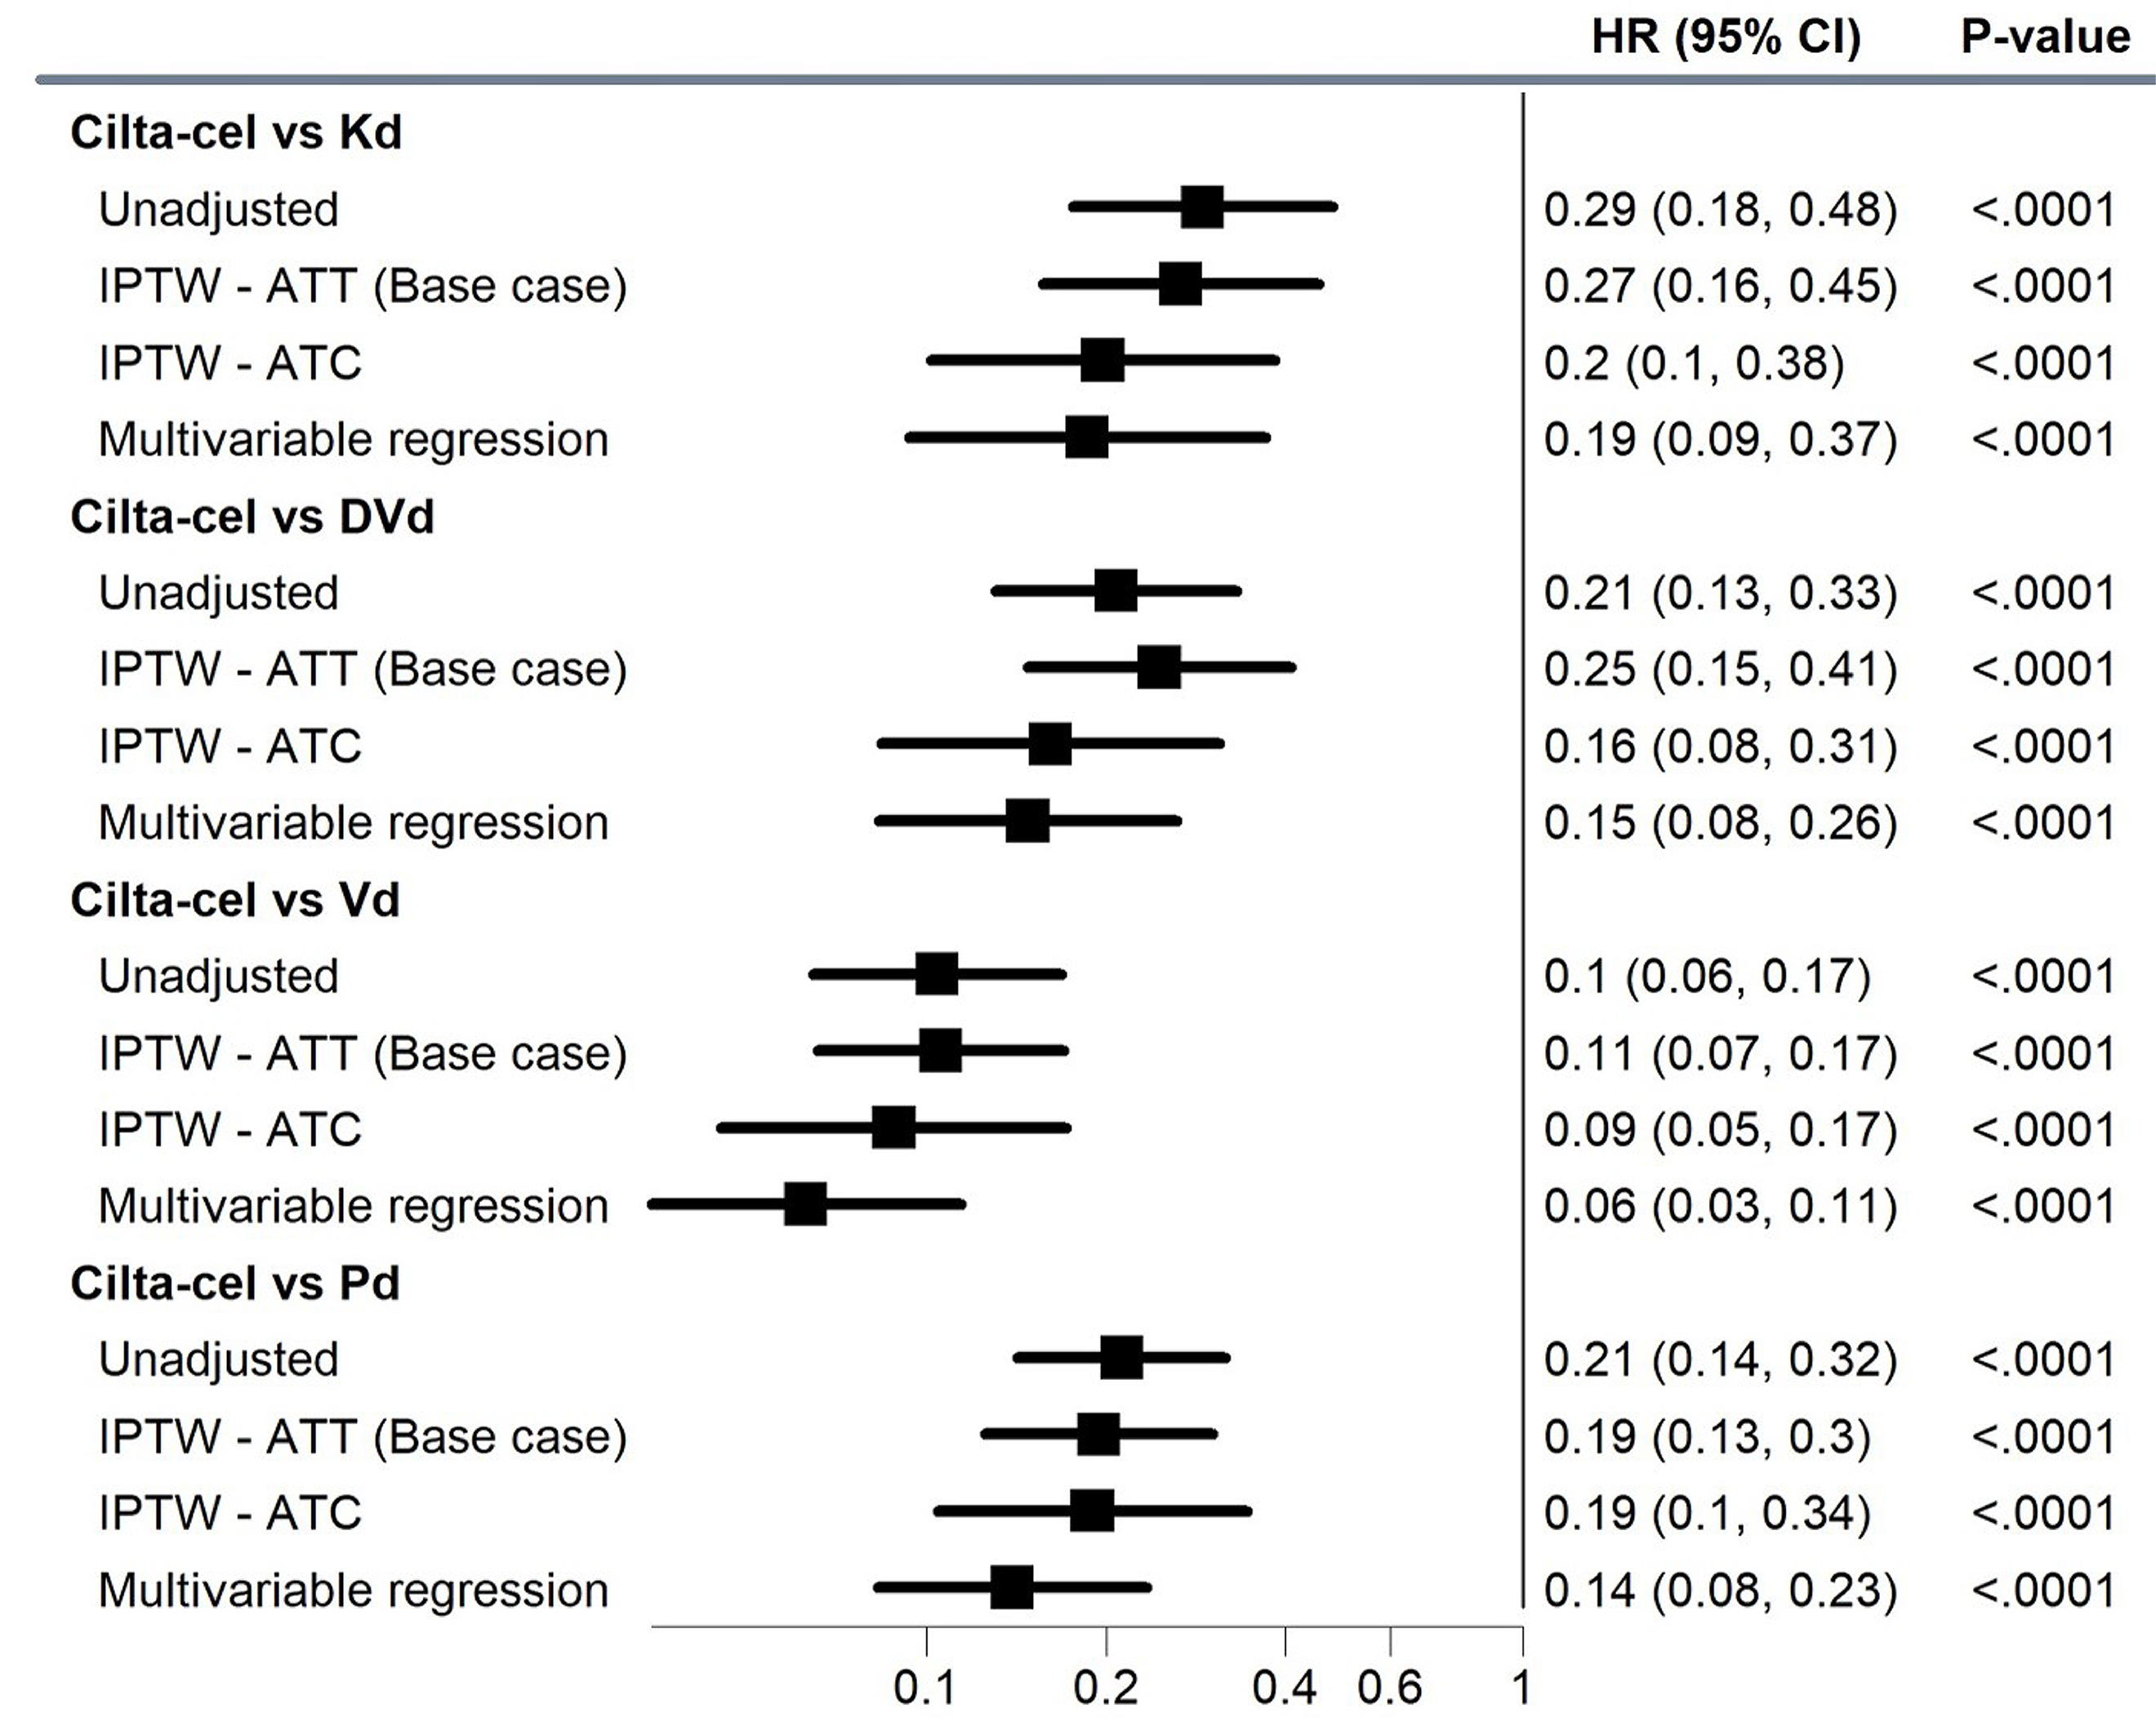
ATC = average treatment effect in the control; ATT = average treatment effect in the treated; CI = confidence interval; cilta-cel = ciltacabtagene autoleucel; DVd = daratumumab-bortezomib-dexamethasone; HR = hazard ratio; IPTW = inverse probability of treatment weighting; Kd = carfilzomib-dexamethasone; Pd = pomalidomide-dexamethasone; PFS = progression-free survival; Vd = bortezomib-dexamethasone.
Note: Base-case analyses were adjusted for refractory status, ISS disease stage, presence of plasmacytomas/extramedullary disease, time to disease progression on prior lines of therapy. IPTW-ATC analyses adjusted for all base-case covariates plus number of prior lines, years since diagnosis, age, and hemoglobin levels, for a total of 8 variables. Multivariable regression analyses adjusted for all base-case covariates plus number of prior lines, years since diagnosis, age, hemoglobin levels, prior transplants, ECOG PS, MM type, creatinine clearance, sex, and race, for a total of 14 variables.
Source: Details included in the figure are from the sponsor’s summary of clinical evidence.17
Figure 14: Assessment for the Proportional Hazard Assumption for PFS (IPTW Analysis, ATT-Adjusted, Cilta-Cel [CARTITUDE-4 Trial] Versus DVd [CASTOR Trial]) [Redacted]

Source: Details included in the figure are from the sponsor’s IPTW technical report.57
Figure 15: Assessment for the Proportional Hazard Assumption for PFS (IPTW Analysis, ATT-Adjusted, Cilta-Cel [CARTITUDE-4 Trial] Versus Vd [CASTOR Trial]) [Redacted]

Source: Details included in the figure are from the sponsor’s IPTW technical report.57
Figure 16: Assessment for the Proportional Hazard Assumption for PFS (IPTW Analysis, ATT-Adjusted, Cilta-Cel [CARTITUDE-4 Trial] Versus Kd [CANDOR Trial]) [Redacted]

Source: Details included in the figure are from the sponsor’s IPTW technical report.57
Figure 17: Assessment for the Proportional Hazard Assumption for PFS (IPTW Analysis, ATT-Adjusted, Cilta-Cel [CARTITUDE-4 Trial] Versus Pd [Apollo Trial]) [Redacted]

Source: Details included in the figure are from the sponsor’s IPTW technical report.57
Figure 18: Comparative Efficacy of Cilta-Cel Versus Comparators for OS (IPTW Results Including Sensitivity Analyses) [Redacted]

Source: Details included in the figure are from the sponsor’s summary of clinical evidence.17
Figure 19: Assessment for the Proportional Hazard Assumption for OS (IPTW Analysis, Unadjusted, Cilta-Cel [CARTITUDE-4 Trial] Versus DVd [CASTOR Trial]) [Redacted]

Source: Details included in the figure are from the sponsor’s IPTW technical report.57
Figure 20: Assessment for the Proportional Hazard Assumption for OS (IPTW Analysis, Unadjusted, Cilta-Cel [CARTITUDE-4 Trial] Versus Vd [CASTOR Trial]) [Redacted]

Source: Details included in the figure are from the sponsor’s IPTW technical report.57
Figure 21: Assessment for the Proportional Hazard Assumption for OS (IPTW Analysis, Unadjusted, Cilta-Cel [CARTITUDE-4 Trial] Versus Kd [CANDOR Trial]) [Redacted]

Source: Details included in the figure are from the sponsor’s IPTW technical report.57
Figure 22: Assessment for the Proportional Hazard Assumption for OS (IPTW Analysis, Unadjusted, Cilta-Cel [CARTITUDE-4 Trial] Versus Pd [APOLLO Trial]) [Redacted]

Source: Details included in the figure are from the sponsor’s IPTW technical report.57
Table 31: MAIC Sensitivity Analysis Results for Cilta-Cel Versus Comparator Treatments
Outcomes | IsaPd base case | IsaPd SAa | SVd base case | SVd SAb |
|---|---|---|---|---|
Cilta-cel ESS | 26 | 25 | 188 | 139 |
PFS (HR, 95% CI) | 0.32 (0.15 to 0.70) | 0.27 (0.12 to 0.60) | ██ ███ ████ | 0.39 (0.22 to 0.69) |
OS (HR, 95% CI) | ████ █████ ██ █████ | ████ █████ ██ █████ | ████ █████ ██ █████ | ████ █████ ██ █████ |
ORR (OR, 95% CI) | 3.44 (1.39 to 8.54) | 4.79 (1.92 to 11.94) | ██ ███ █████ | 2.42 (1.05 to 5.59) |
VGPR + (OR, 95% CI) | 8.63 (3.65 to 20.40) | 9.84 (4.05 to 23.90) | █████ █████ | 7.19 (3.21 to 16.09) |
CR + (OR, 95% CI) | 77.24 (26.26 to 227.19) | 85.12 (28.50 to 254.19) | ███ ███ ████ | 22.07 (7.57 to 64.35) |
CI = confidence interval; cilta-cel = ciltacabtagene autoleucel; CR = complete response; ESS = effective sample size; HR = hazard ratio; IsaPd = isatuximab, pomalidomide, dexamethasone; OR = odds ratio; ORR = objective response rate; OS = overall survival; PFS = progression-free survival; SA = sensitivity analysis; SVd = selinexor, bortezomib, dexamethasone; VGPR = very good partial response.
aCharacteristics matched: disease refractory to PI, cytogenetic risk, ISS disease stage, time from diagnosis, age, LDH, prior autologous HCT, ECOG PS.
bCharacteristics matched: cytogenetic risk, ISS disease stage, prior lines of treatment, age, prior autologous HCT, race, sex.
Source: Details included in the table are from the sponsor’s MAIC report.58
Figure 23: Sensitivity Analysis of Comparative Efficacy of Cilta-Cel Versus Comparators for ORR (IPTW Approach)
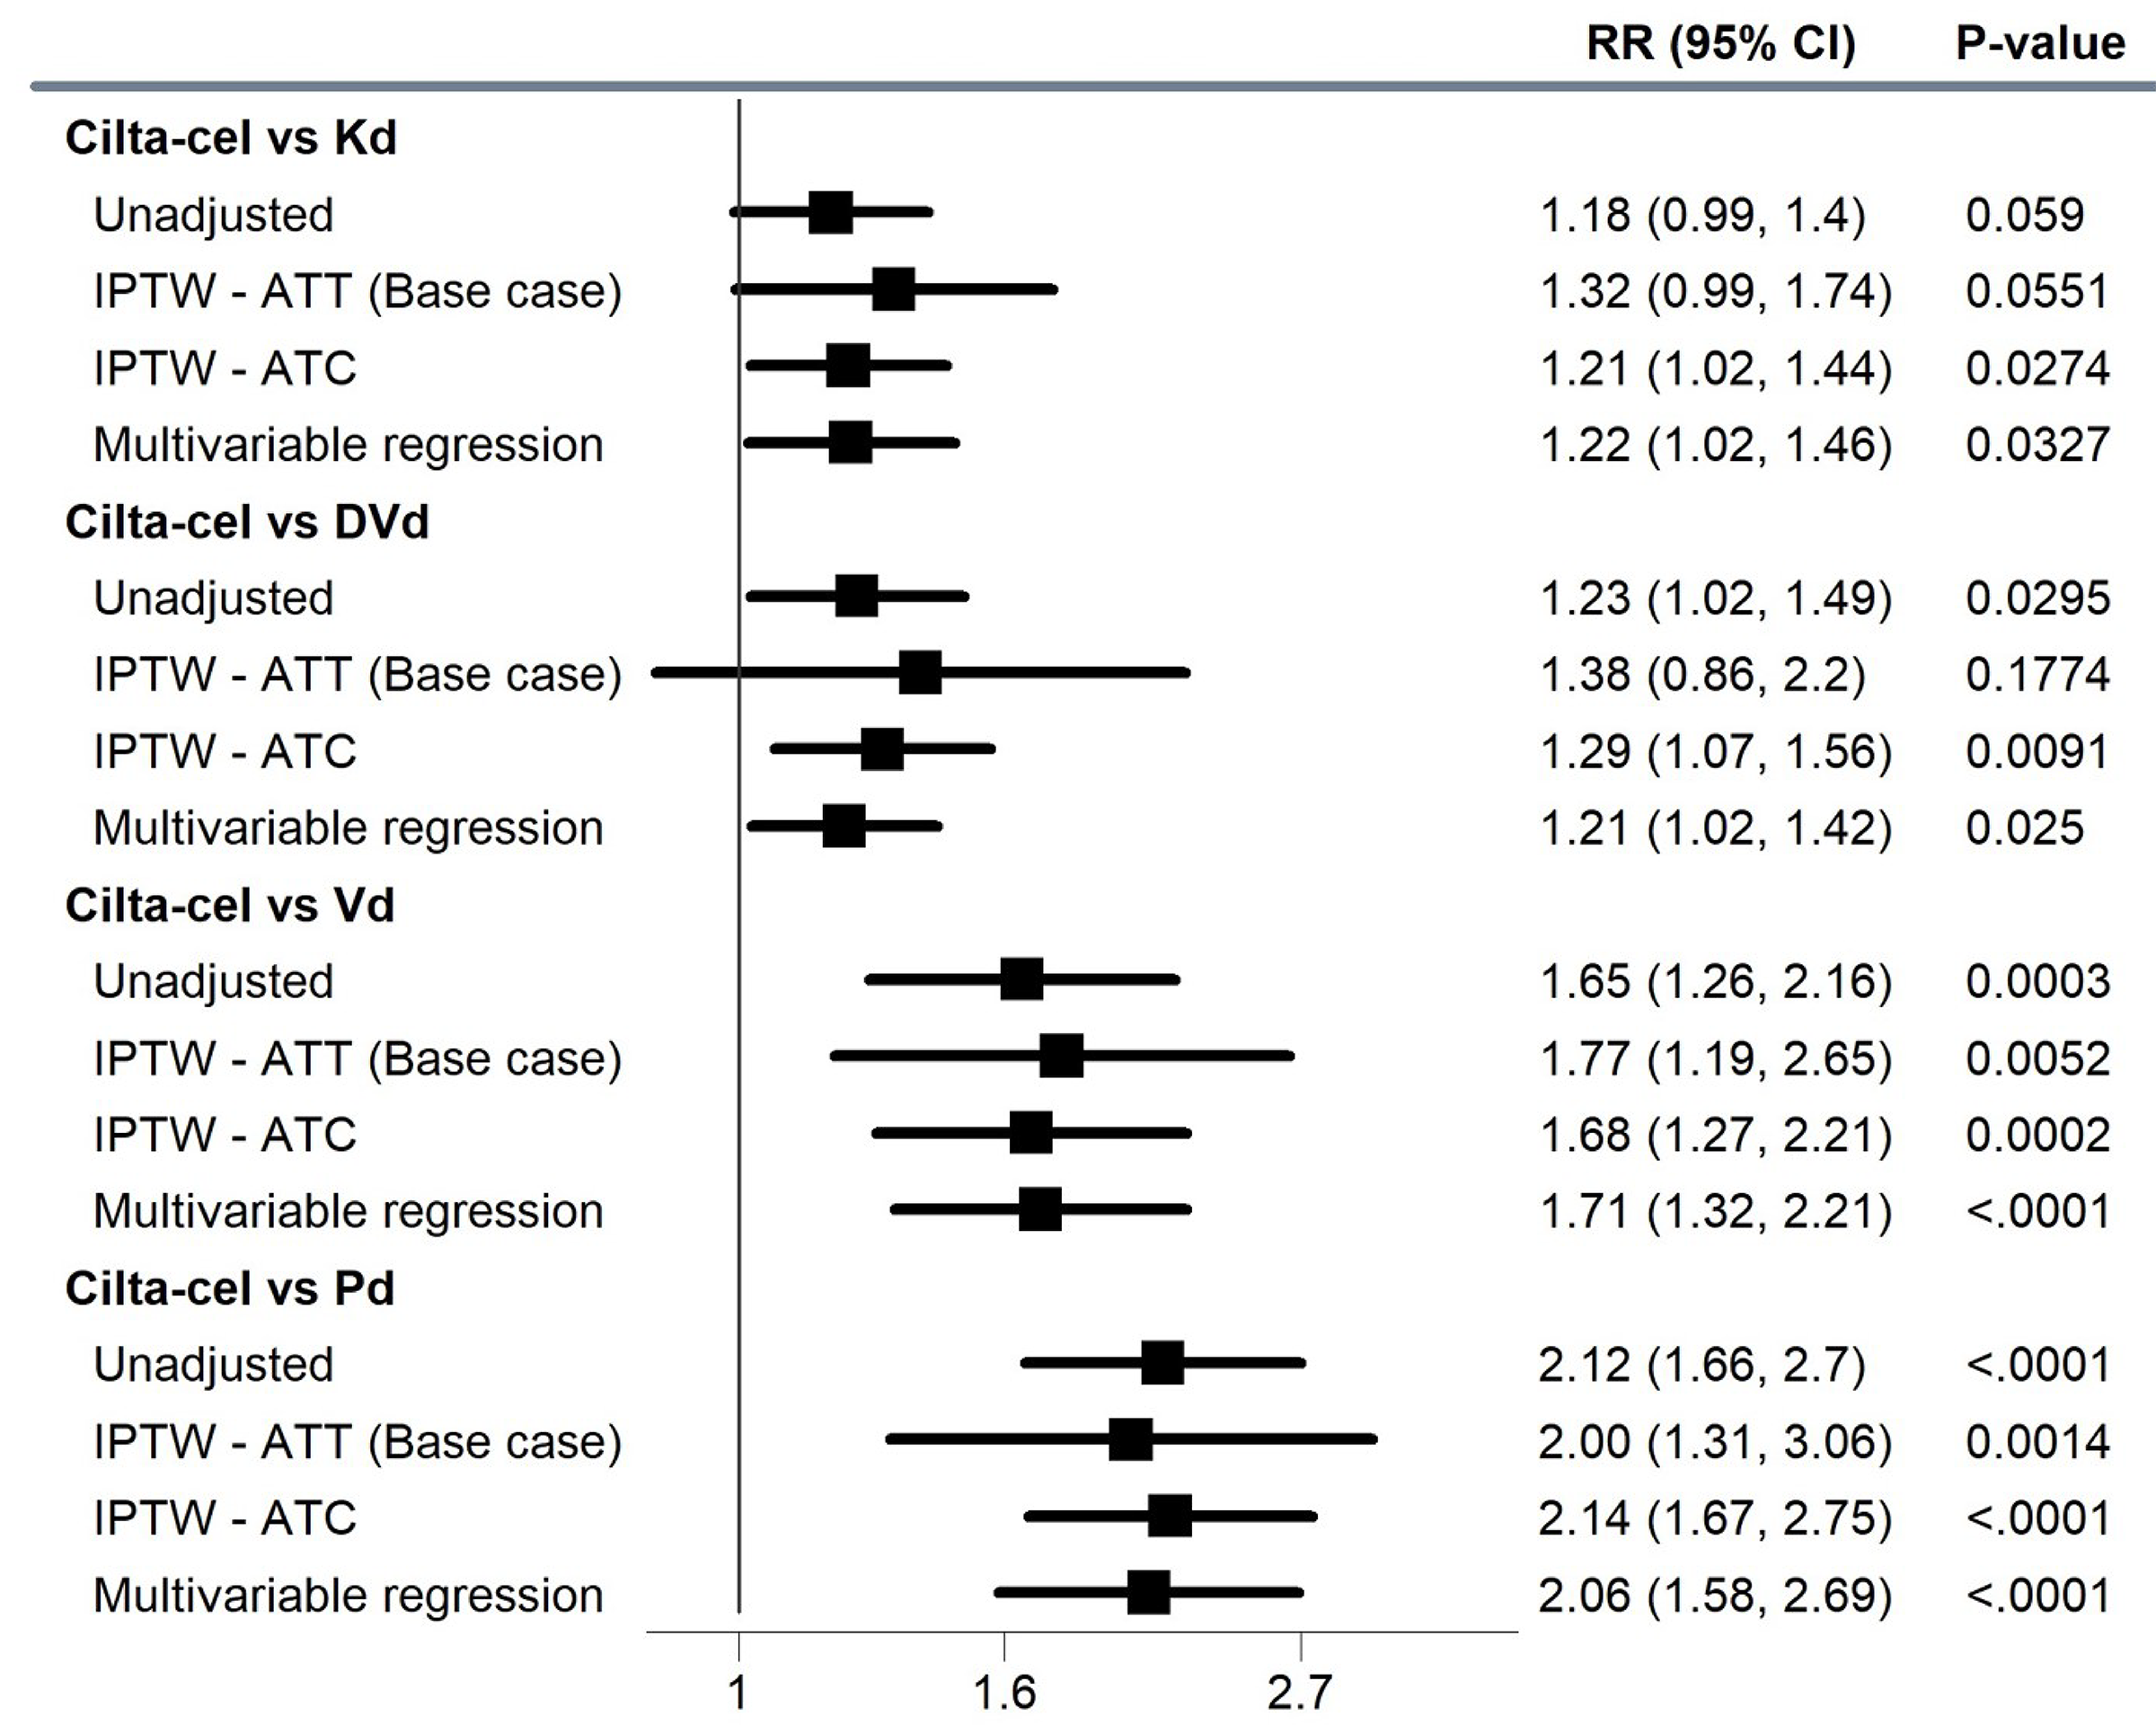
ATC = average treatment effect on the control; ATT = average treatment effect on the treated; CI = confidence interval; cilta-cel = ciltacabtagene autoleucel; DVd = daratumumab-bortezomib- dexamethasone; IPTW = inverse probability of treatment weighting; Kd = carfilzomib-dexamethasone; MM = multiple myeloma; ORR = overall response rate; Pd = pomalidomide-dexamethasone; RR = relative risk; Vd = bortezomib-dexamethasone.
Notes: Base-case analyses were adjusted for refractory status, ISS disease stage, presence of plasmacytomas/extramedullary disease, time to disease progression on prior lines of therapy. IPTW-ATC analyses adjusted for all base-case covariates plus number of prior lines, years since diagnosis, age, and hemoglobin levels, for a total of 8 variables. Multivariable regression analyses adjusted for all base-case covariates plus number of prior lines, years since diagnosis, age, hemoglobin levels, prior transplants, ECOG PS, MM type, creatinine clearance, sex, and race, for a total of 14 variables.
Source: Details included in the figure are from the sponsor’s summary of clinical evidence.17
Figure 24: Sensitivity Analysis of Comparative Efficacy of Cilta-Cel Versus Comparators for CR or Better (IPTW Approach)
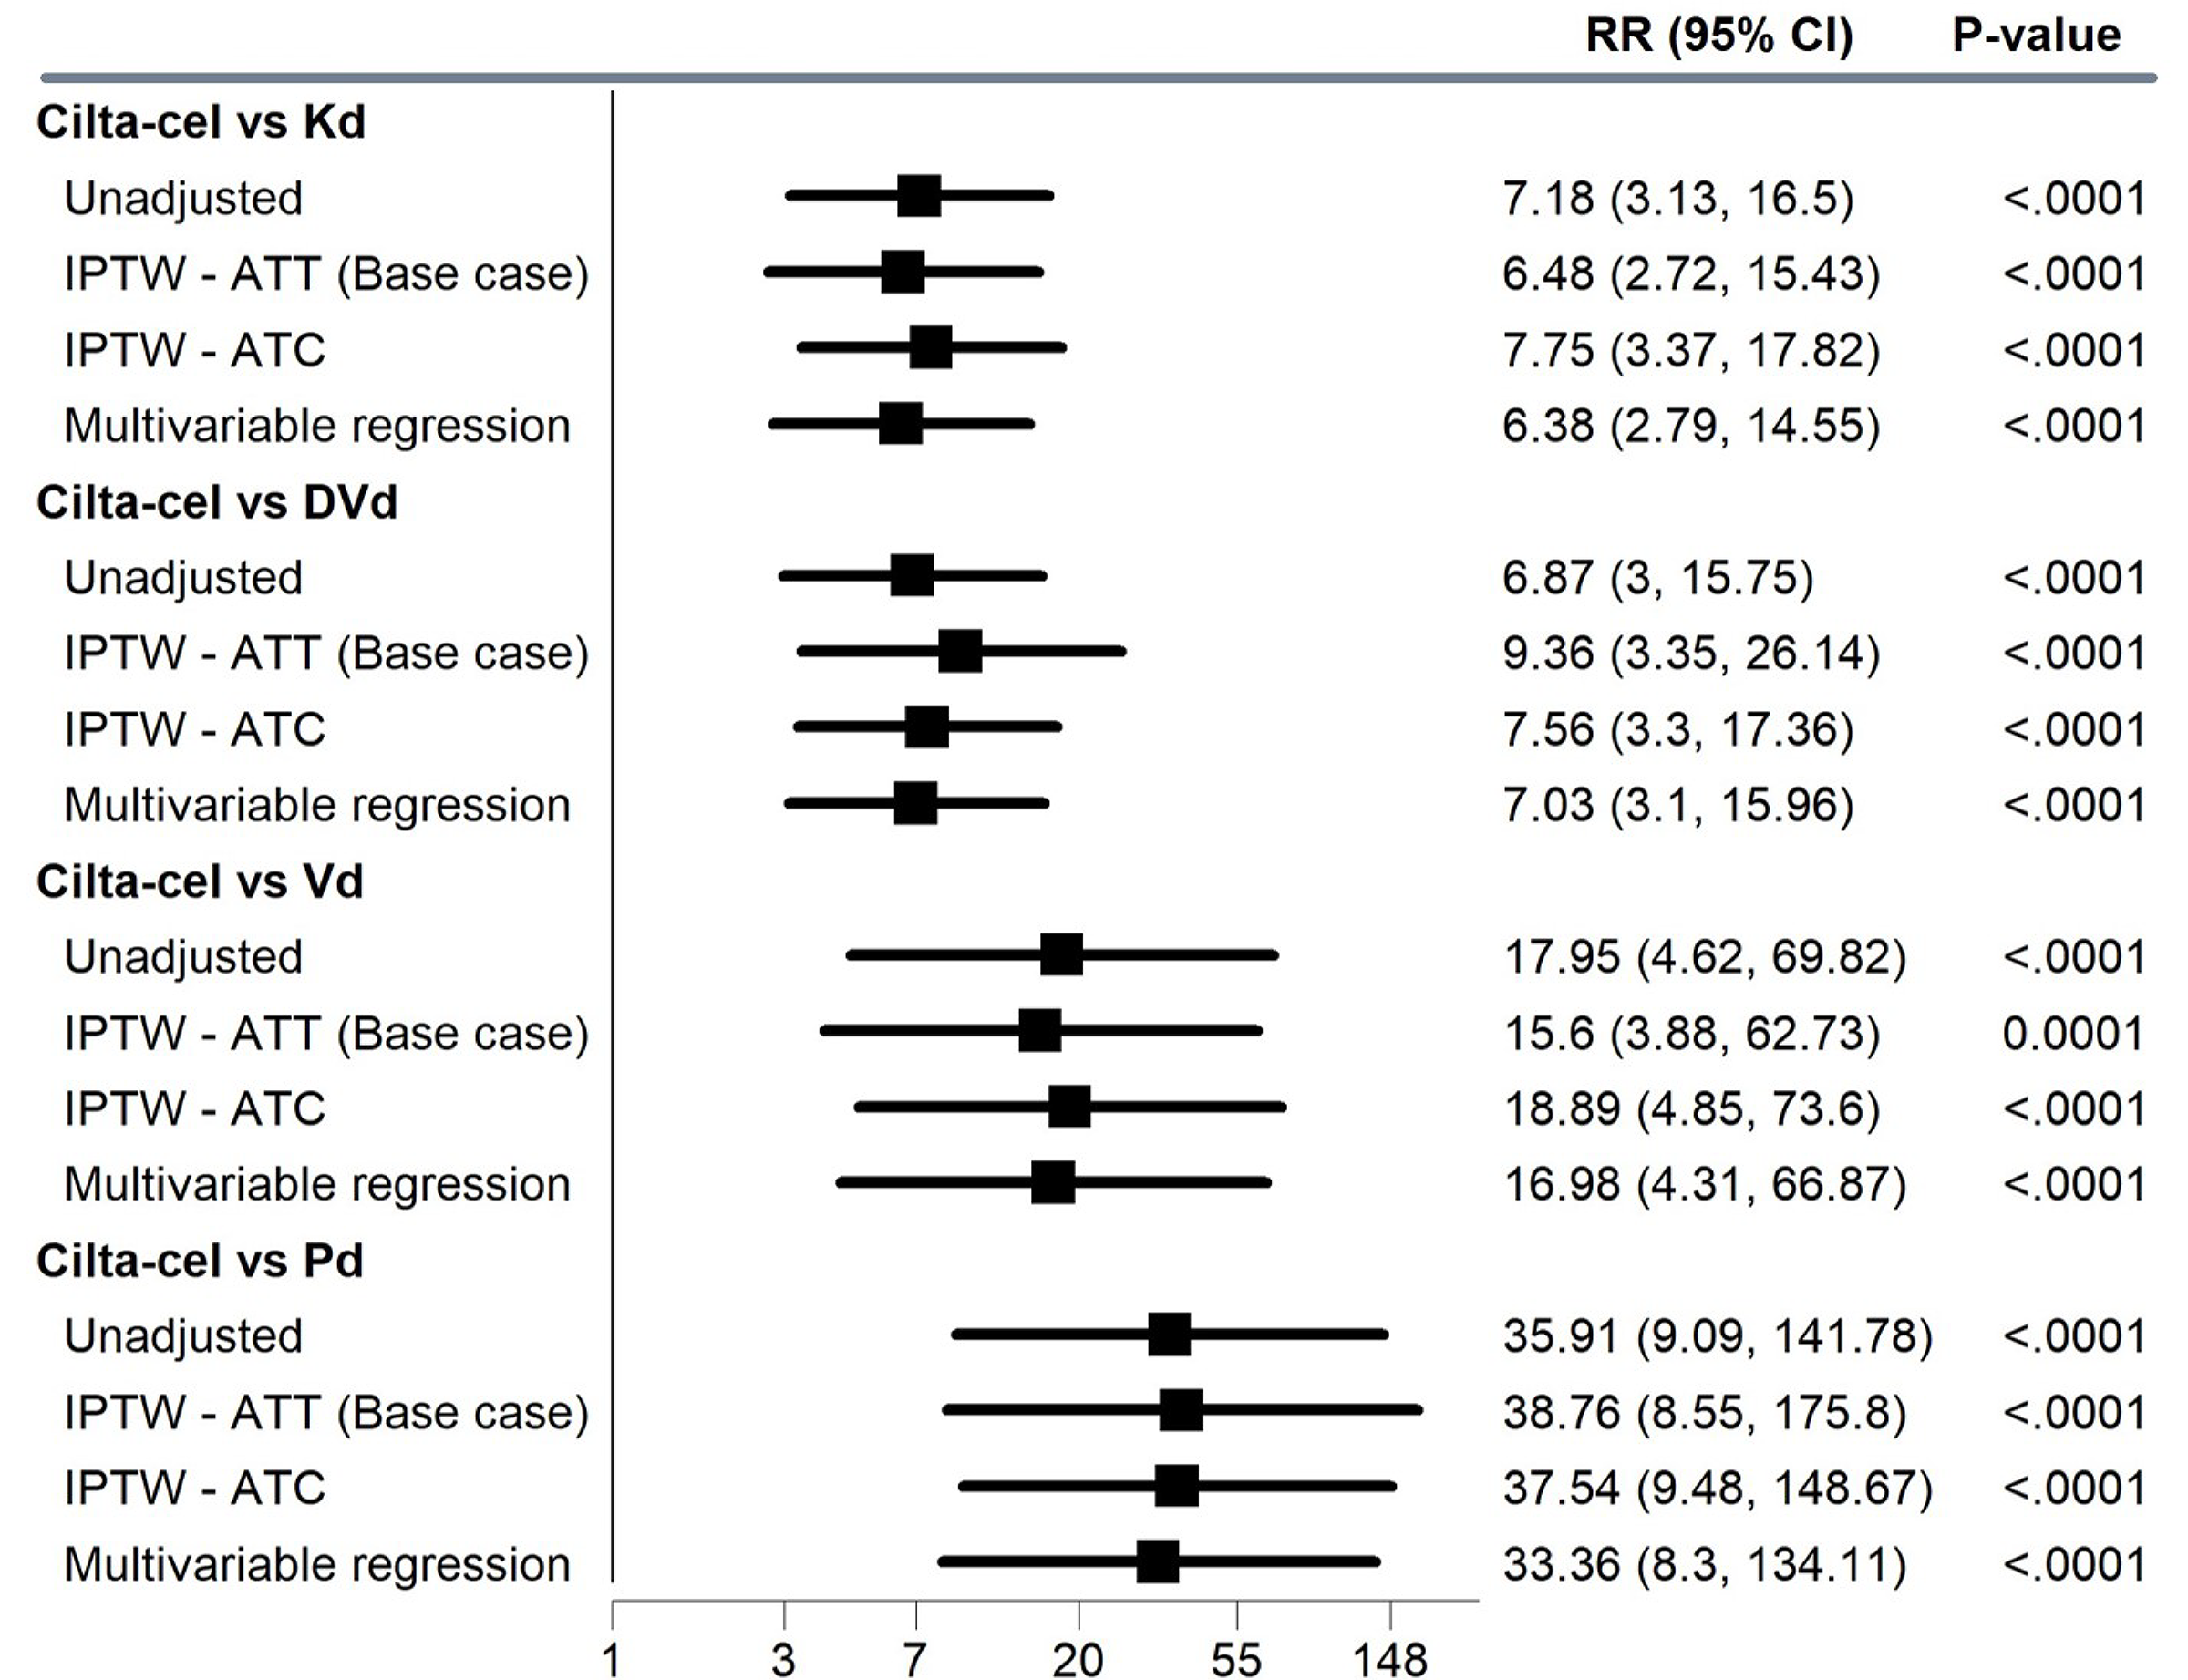
ATC = average treatment effect on the controls; ATT = average treatment effect on the treated; CI = confidence interval; cilta-cel = ciltacabtagene autoleucel; CR = complete response; DVd = daratumumab-bortezomib-dexamethasone; IPTW = inverse probability of treatment weighting; Kd = carfilzomib-dexamethasone; Pd = pomalidomide-dexamethasone; RR = relative risk; Vd = bortezomib-dexamethasone.
Notes: Base-case analyses were adjusted for refractory status, ISS disease stage, presence of plasmacytomas/extramedullary disease, time to disease progression on prior lines of therapy. IPTW-ATC analyses adjusted for all base-case covariates plus number of prior lines, years since diagnosis, age, and hemoglobin levels, for a total of 8 variables. Multivariable regression analyses adjusted for all base-case covariates plus number of prior lines, years since diagnosis, age, hemoglobin levels, prior transplants, ECOG PS, MM type, creatinine clearance, sex, and race, for a total of 14 variables.
Source: Details included in the figure are from the sponsor’s summary of clinical evidence.17
Figure 25: Sensitivity Analysis of Comparative Efficacy of Cilta-Cel Versus Comparators for VGPR or Better (IPTW Approach)
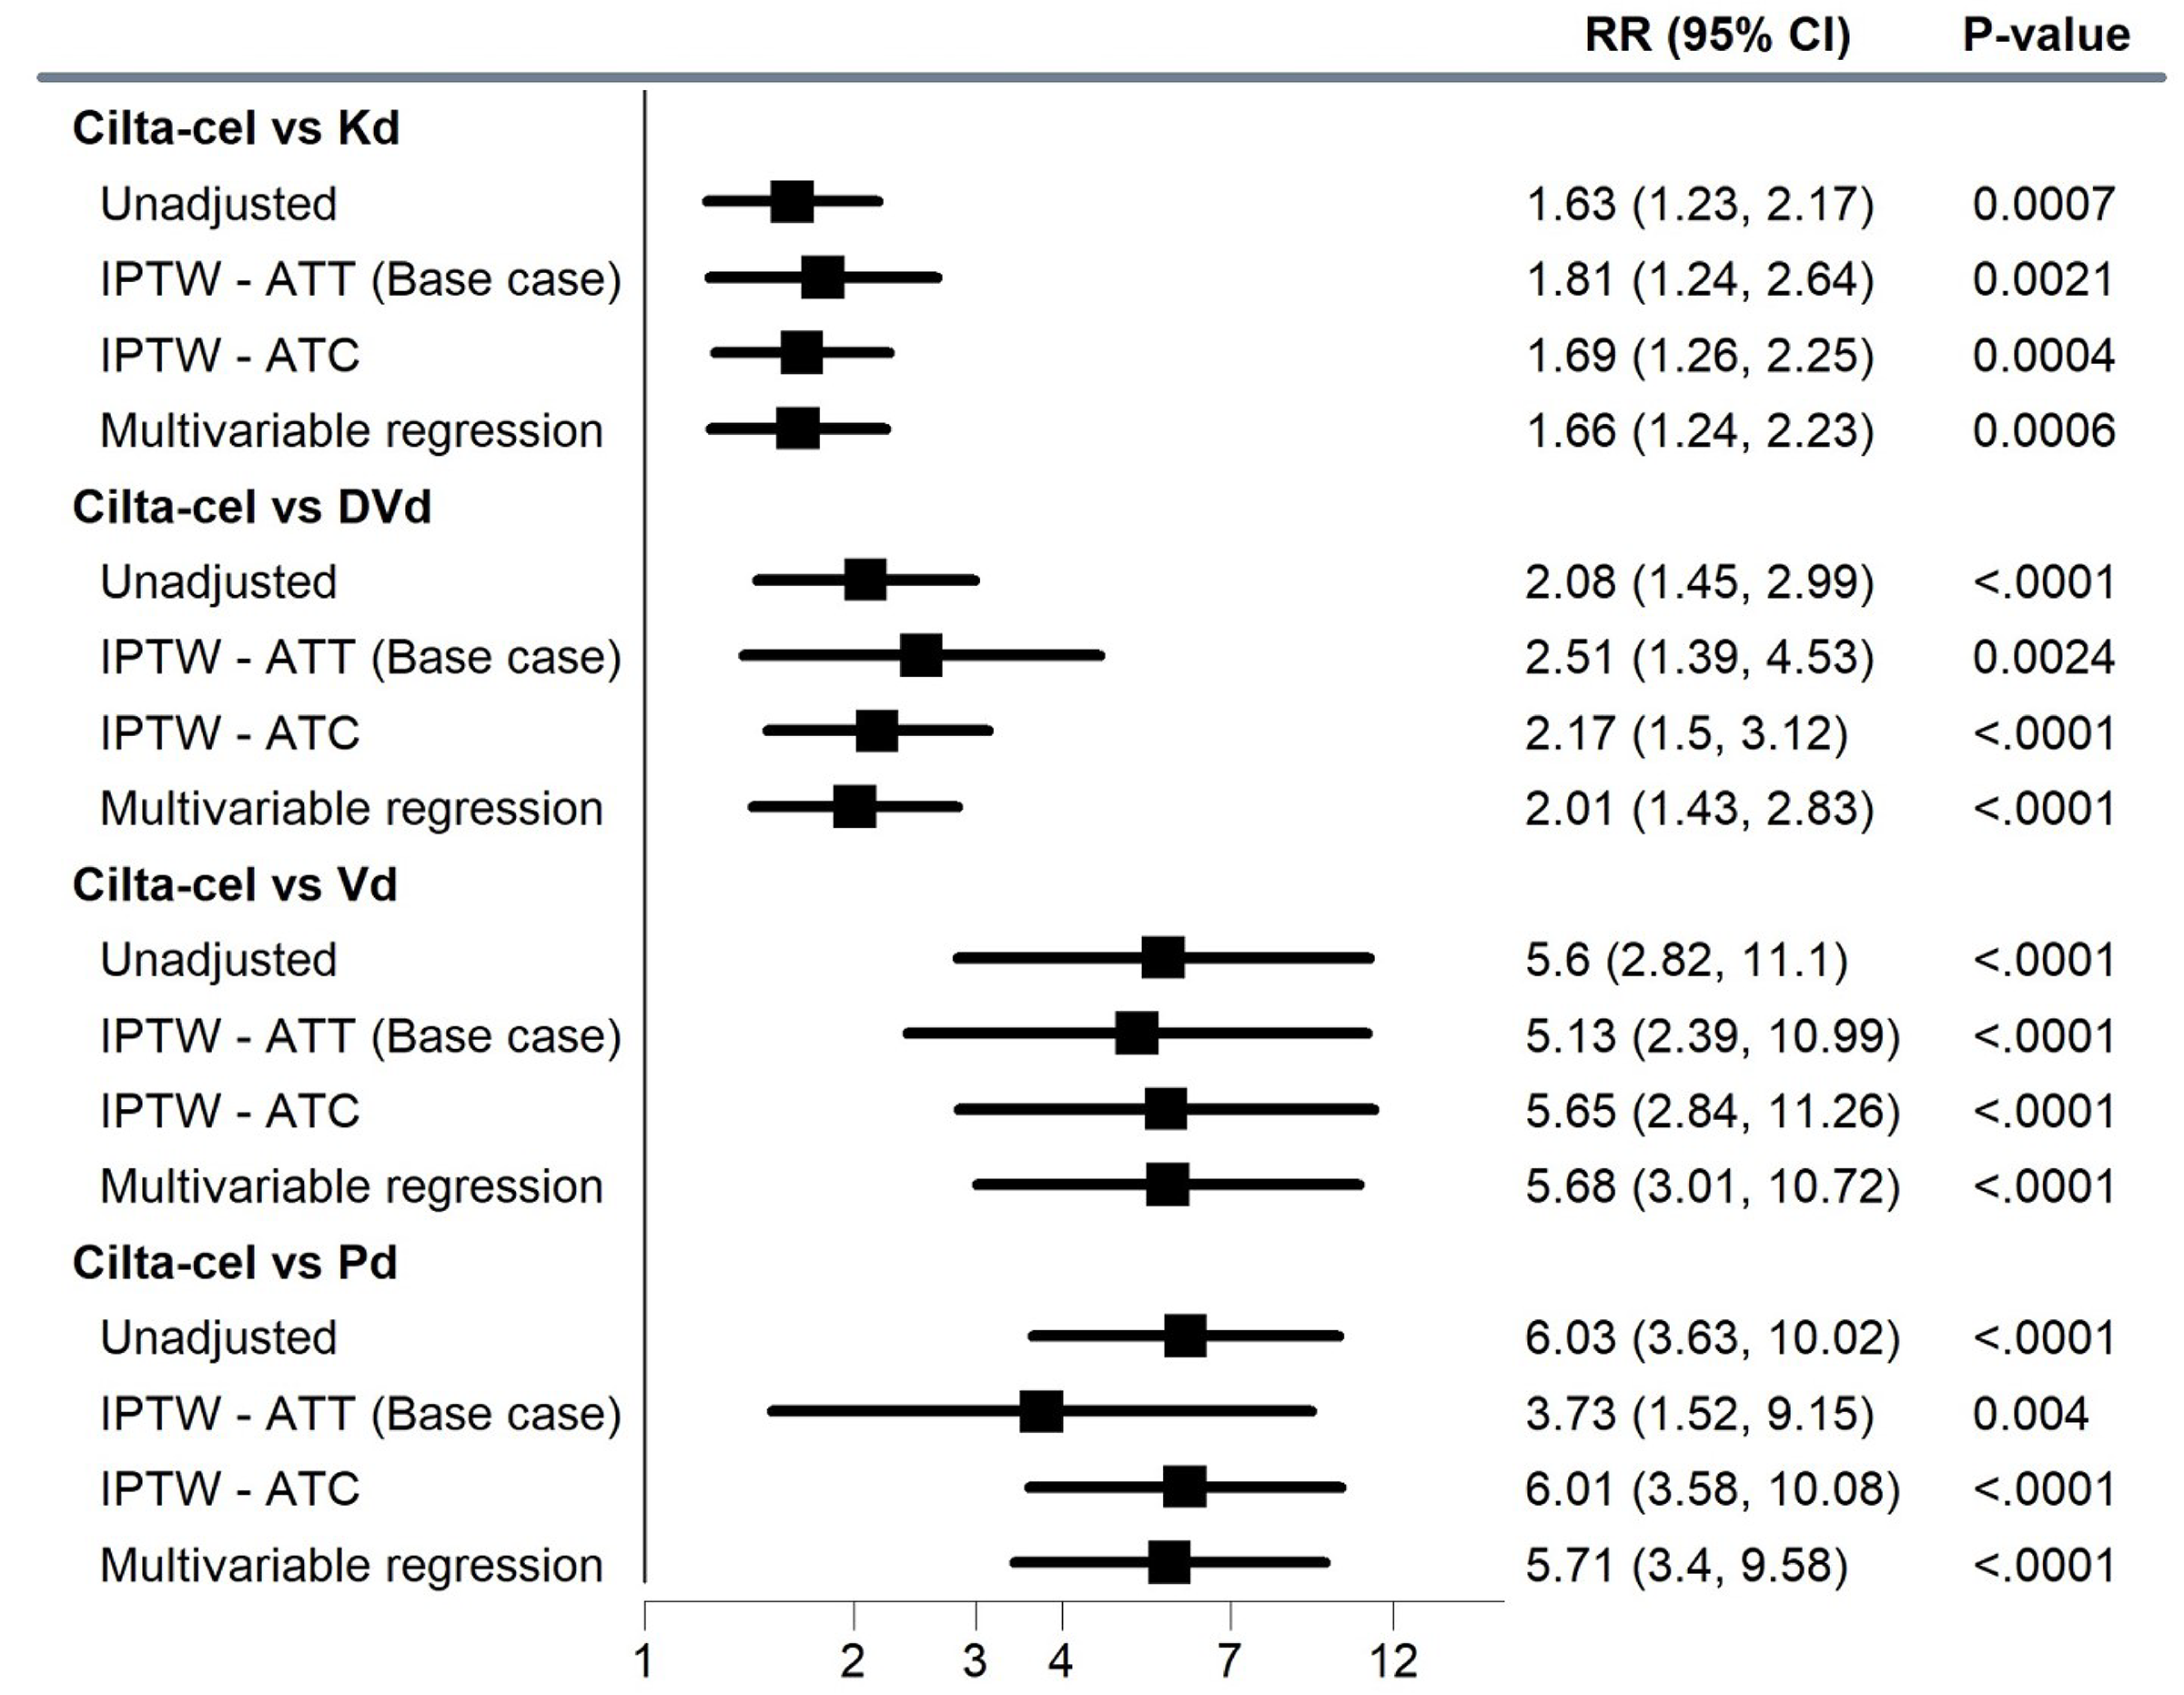
ATC = average treatment effect in the controls; ATT = average treatment effect in the treated; CI = confidence interval; cilta-cel = ciltacabtagene autoleucel; DVd = daratumumab-bortezomib-dexamethasone; IPTW = inverse probability of treatment weighting; Kd = carfilzomib-dexamethasone; Pd = pomalidomide-dexamethasone; RR = relative risk; Vd = bortezomib-dexamethasone; VGPR = very good partial response.
Notes: Base-case analyses were adjusted for refractory status, ISS disease stage, presence of plasmacytomas/extramedullary disease, time to disease progression on prior lines of therapy. IPTW-ATC analyses adjusted for all base-case covariates plus number of prior lines, years since diagnosis, age, and hemoglobin levels, for a total of 8 variables. Multivariable regression analyses adjusted for all base-case covariates plus number of prior lines, years since diagnosis, age, hemoglobin levels, prior transplants, ECOG PS, MM type, creatinine clearance, sex, and race, for a total of 14 variables.
Source: Details included in the figure are from the sponsor’s summary of clinical evidence.17
Pharmacoeconomic Review
Abbreviations
AE
adverse event
BIA
budget impact analysis
CAR
chimeric antigen receptor
CDA-AMC
Canada’s Drug Agency
cilta-cel
ciltacabtagene autoleucel
DPd
daratumumab-pomalidomide-dexamethasone
DVd
daratumumab-bortezomib-dexamethasone
ICER
incremental cost-effectiveness ratio
IsaKd
isatuximab-carfilzomib-dexamethasone
IsaPd
isatuximab-pomalidomide-dexamethasone
ITC
indirect treatment comparison
Kd
carfilzomib-dexamethasone
MM
multiple myeloma
OS
overall survival
Pd
pomalidomide-dexamethasone
PFS
progression-free survival
PSM
partitioned survival model
PVd
pomalidomide-bortezomib-dexamethasone
QALY
quality-adjusted life-year
SVd
selinexor-bortezomib-dexamethasone
Vd
bortezomib-dexamethasone
Executive Summary
The executive summary comprises 2 tables (Table 1 and Table 2) and a conclusion.
Item | Description |
|---|---|
Drug product | Ciltacabtagene autoleucel (Carvykti), suspension of CAR-positive viable T-cells, for IV infusion |
Indication | For the treatment of adult patients with multiple myeloma, who have received 1 to 3 prior lines of therapy, including a proteasome inhibitor and an immunomodulatory agent, and who are refractory to lenalidomide. |
Health Canada approval status | NOC |
Health Canada review pathway | Standard |
NOC date | July 19, 2024 |
Reimbursement request | As per indication |
Sponsor | Janssen Inc. |
Submission history | Yes Indication: The treatment of adult patients with multiple myeloma, who have received at least 3 prior lines of therapy, including a proteasome inhibitor, an immunomodulatory agent, and an anti-CD38 antibody, and who are refractory to their last treatment. Recommendation date: May 1, 2023 Recommendation: Reimburse with clinical criteria and/or conditions. |
CAR = chimeric antigen receptor; NOC = Notice of Compliance.
Table 2: Summary of Economic Evaluation
Component | Description |
|---|---|
Type of economic evaluation | Cost-utility analysis, partitioned survival model |
Target population | Adult patients with multiple myeloma who have received 1 to 3 prior lines of therapy, including a proteasome inhibitor and an immunomodulatory agent, and who are refractory to lenalidomide. |
Treatment | Ciltacabtagene autoleucel (cilta-cel) |
Dose regimen | 0.5 × 10⁶ to 1.0 × 10⁶ CAR-positive viable T-cells per kilogram of body weight, with a maximum dose of 1 × 10⁸ CAR-positive viable T-cells per single infusion |
Submitted price | Cilta-cel: $632,455.00 per administration |
Submitted treatment cost | $632,455 per patient as a 1-time infusion |
Comparators |
|
Perspective | Canadian publicly funded health care payer |
Outcomes | QALYs, life-years |
Time horizon | Lifetime (40 years) |
Key data source | Efficacy for cilta-cel was informed by the CARTITUDE-4 trial; efficacy for comparators was informed by sponsor-submitted indirect treatment comparisons |
Submitted results | Compared to Vd, cilta-cel was associated with an ICER of $69,861 per QALY gained. Based on the sequential analysis, 3 treatments (Pd, Vd, and cilta-cel) were on the cost-effectiveness frontier. |
Key limitations |
|
CDA-AMC reanalysis results |
|
CAR = chimeric antigen receptor; CDA-AMC = Canada’s Drug Agency; cilta-cel = ciltacabtagene autoleucel; DVd = daratumumab-bortezomib-dexamethasone; ICER = incremental cost-effectiveness ratio; IsaKd = isatuximab-carfilzomib-dexamethasone; IsaPd = isatuximab-pomalidomide-dexamethasone; Kd = carfilzomib-dexamethasone; OS = overall survival; Pd = pomalidomide-dexamethasone; PFS = progression-free survival; SVd = selinexor-bortezomib-dexamethasone; Vd = bortezomib-dexamethasone.
Conclusions
Evidence from the CARTITUDE-4 trial demonstrated that infusion of ciltacabtagene autoleucel (cilta-cel) compared to treatment of physician’s choice (i.e., pomalidomide-bortezomib-dexamethasone [PVd] or daratumumab-pomalidomide-dexamethasone [DPd]) shows a clinically significant benefit in terms of progression-free survival (PFS) in patients with relapsed or refractory multiple myeloma (MM) who have received 1 to 3 prior lines of therapy, including a proteasome inhibitor and an immunomodulatory agent, and whose disease is refractory to lenalidomide. The overall survival (OS) benefit was uncertain due to immaturity of data. When compared to other currently available therapies (i.e., carfilzomib-dexamethasone [Kd], pomalidomide-dexamethasone [Pd], bortezomib-dexamethasone [Vd], daratumumab-bortezomib-dexamethasone [DVd], isatuximab-pomalidomide-dexamethasone [IsaPd], and selinexor-bortezomib-dexamethasone [SVd]), cilta-cel demonstrated improvements in terms of OS and PFS; however, the comparative evidence was derived from indirect treatment comparisons (ITCs), which were limited by small sample sizes, generalizability concerns, and risk of bias. Given these limitations, the exact magnitude of effect when comparing cilta-cel to comparators not used in the CARTITUDE-4 trial remains uncertain.
Canada’s Drug Agency (CDA-AMC) addressed key limitations with respect to model structure, extrapolation of OS, subsequent therapy costs, cost of pomalidomide and bortezomib, carfilzomib treatment schedule, and out-of-specification product costs. In the CDA-AMC reanalysis, the incremental cost-effectiveness ratio (ICER) for cilta-cel was $280,871 per quality-adjusted life-year (QALY) gained compared with Vd (incremental costs = $639,096; incremental QALYs = 2.28; incremental life-years = 3.03) based on a sequential analysis. In this reanalysis, additional costs associated with cilta-cel were driven mainly by drug acquisition costs (approximately $607,000, including cilta-cel, bridging therapy, and conditioning therapy acquisition costs), administration of cilta-cel (approximately $27,000, including determination of eligibility, infusion, and apheresis) and management of adverse events (approximately $30,000). All these costs were incurred in the first year of the analysis. Incremental benefits were driven by extensions in life, with cilta-cel estimated to extend life by an average of approximately 3 years versus Vd (ranging from 2.6 years versus Kd to 4.3 years versus Pd). The degree of life extension associated with cilta-cel is uncertain given the immaturity of events and the length of data available (2 years). At 2 years, cilta-cel has similar OS expectations relative to Kd, for example. Therefore, the majority of benefit in OS is derived from the extrapolated period where there are no data. The short-term PFS benefit is therefore assumed to lead to large, long-term OS gain. An alternate extrapolation of PFS and OS for cilta-cel was conducted assuming that rates of progression increased over time (indicative of a treatment waning effect). In this scenario, the ICER (based on a sequential analysis) increased to $506,778 per QALY gained (versus Kd).
Based on the primary sequential analysis conducted by CDA-AMC, the treatment acquisition cost of cilta-cel would need to be approximately $76,000 (88% reduction in price) to be considered cost-effective at a $50,000 per QALY threshold versus all relevant comparators, including Vd. Including costs associated with administration (determination of eligibility, infusion, apheresis, bridging and conditioning therapies), this would bring the total health care cost of infusing cilta-cel to $115,000 per patient. Given the changing landscape of MM, the use of certain comparators, such as Vd, may become very small over time. If Vd is removed from the sequential analysis, the treatment acquisition cost of cilta-cel would need to decrease to approximately $120,000 (81% reduction in price) to be considered the optimal treatment option at a $50,000 per QALY threshold.
In the absence of long-term data, the uncertainties in the comparative evidence versus relevant comparators, the immaturity of the OS data, and the limitations in how the submitted analysis models subsequent therapies mean that the cost-effectiveness of cilta-cel is uncertain. Due to an absence of evidence, direct or indirect, the cost-effectiveness of cilta-cel versus some regimens, such as isatuximab-carfilzomib-dexamethasone (IsaKd), is unknown.
Patient, Clinician, and Drug Plan Input Relevant to the Economic Review
This section is a summary of the feedback received from the patient groups, clinician groups, and drug plans that participated in the CDA-AMC review process.
Patient input was received from Myeloma Canada, which collected data from caregivers and patients with relapsed or refractory myeloma who had received 1 to 3 prior lines of therapy and whose disease was refractory to lenalidomide or who had experience with a chimeric antigen receptor (CAR) T-cell therapy. There were 53 eligible, with the majority (n = 51) being from Canada. Of the cohort, 16 respondents had experience with CAR T-cell therapy, with 8 having direct experience with cilta-cel. The respondents noted that myeloma had a significant impact on their quality of life. Patients and caregivers emphasized the importance of effective treatments with manageable side effects. Of the 8 respondents with cilta-cel experience, 5 of them rated the treatment as extremely effective with extremely tolerable side effects. It was notable that cytokine release syndrome remains a significant concern.
Clinical input was received from the Ontario Health–Cancer Care Ontario Hematology Cancer Drug Advisory Committee and the Canadian Myeloma Research Group. Both clinician groups noted that there are many treatment options available for patients with MM and that the choice of treatment depends on a patient’s transplant eligibility and exposure to previous lines of therapy. Overall, the treatment goals are to improve response, quality of life, disease-related symptoms, PFS, and OS. The clinicians noted that myeloma remains incurable and that there remains an unmet need for adequate treatments for patients who have experienced progression despite exposure to effective agents, particularly those who have been exposed to anti-CD38 agent. The clinicians suspected that CAR T-cell therapies could be a second-line option for patients who have received a transplant or a third-line option for patients who have not received a transplant and who received daratumumab in the first line. Lastly, the clinicians commented on issues of administration and safety resource use and possible collection or supply issues that may limited the availability of CAR T-cell therapy.
Participating drug plans noted concerns with the comparator used in the CARTITUDE-4 trial because 1 of the regimens used for physician’s choice (i.e., DPd) is not funded in Canada. Further concerns about the implementation of treatment with cilta-cel were raised, including CAR T-cell therapy capacity restrictions and the intensive health care resource use associated with the administration, monitoring, and adverse event (AE) management of CAR T-cell therapies. The drug plans commented on the possible impact cilta-cel may have on the current funding algorithm. Lastly, the drug plans noted that CADTH had previously recommended cilta-cel for the treatment of patients with MM after 3 prior lines of therapy and that active pricing negotiations with pan-Canadian Pharmaceutical Alliance were under way.
Several of these concerns were addressed in the sponsor’s model:
Health-related quality of life was incorporated in the sponsor’s model by use of the EQ-5D-5L data captured in the CARTITUDE-4 trial.
AEs, including cytokine release syndrome, were captured in the sponsor’s model.
CDA-AMC was unable to address the following concerns raised from the patient, clinician, and drug plan input:
The impact on changing lines of therapy could not be assessed as the model assessed the impact of cilta-cel across multiple lines rather than on each individual line separately.
Economic Review
Economic Evaluation
Summary of Sponsor’s Economic Evaluation
Overview
The sponsor submitted a cost-utility analysis to assess the cost-effectiveness of cilta-cel against comparators for the treatment of adult patients with MM who have received 1 to 3 prior lines of therapy, including a proteasome inhibitor and an immunomodulatory agent, and whose disease is refractory to lenalidomide. The model population aligns with the Health Canada indication and represents the sponsor’s reimbursement request.
Cilta-cel is available as a cell suspension of 0.5 × 10⁶ to 1.0 × 10⁶ of CAR-positive viable T-cells in a patient-specific infusion bag for infusion.1 The recommended dose is 0.5 × 10⁶ to 1.0 × 10⁶ CAR-positive viable T-cells per kilogram of body weight, with a maximum dose of 1 × 10⁸ CAR-positive viable T-cells per single infusion.1 The submitted price for cilta-cel is $632,455.00 per administration.2 Lymphodepleting regimens (e.g., cyclophosphamide and fludarabine) and premedication (e.g., acetaminophen and diphenhydramine) should be administered before administration of cilta-cel. Patients should be monitored daily for 14 days after cilta-cel for signs of cytokine release syndrome, neurologic events, and other toxicities.1 The comparators for this analysis were Kd, Pd, IsaPd, Vd, DVd, SVd, and IsaKd (the latter included in a scenario analysis only).1
The outcomes of the model included QALYs and life-years over a lifetime horizon of 40 years. Discounting (1.5% per annum) was applied for both costs and outcomes, and a cycle length of 1 week was used with a half-cycle correction applied.2
Model Structure
For the base-case analysis, the sponsor submitted a partitioned survival model (PSM) composed of 3 health states: progression-free, postprogression, and death. The proportions of patients who are progression-free, who experience progressed disease, or who are dead at any time over the model horizon were derived from non–mutually exclusive survival curves. Patients entered the model in the progression-free health state and could either have stable disease, experience progression, or die. The proportion of patients with progressed disease or death was derived based on the area under the survival curves. Specifically, OS was partitioned to estimate the proportion of patients in the death state, while the PFS curve was used to estimate the proportion of patients in the progression-free health state. The difference between the OS curve and the PFS curve was partitioned at each time point to estimate the proportion of patients in the progressive disease health state.
An alternative model structure was presented as a scenario analysis in which a short-term decision tree was followed by the PSM.2 The decision tree only applied to patients in the cilta-cel treatment arm, and patients are stratified into patients who received cilta-cel infusion following the trial protocol; patients who received cilta-cel after early disease progression; or patients who did not receive cilta-cel due to death, AEs, manufacturing failure, or other reasons. Within the PSM component, the survival of each cohort was modelled separately and then combined to represent the entire CARTITUDE-4 population. As such, the proportion of patients who received cilta-cel per protocol were modelled using the CARTITUDE-4 modified intention-to-treat efficacy dataset, and patients who received cilta-cel after progression or did not receive cilta-cel at all were modelled using a subset of the intention-to-treat data.2
Model Inputs
The baseline characteristics used to inform the model were based on the CARTITUDE-4 trial.3 Patients were mostly male (57.3%), with a mean age of 60.10 years, a mean body weight of 77.54 kg, and a mean body surface area of 1.90 m2.3 The proportions of patients who had received 1, 2, or 3 prior lines of therapy were 32.2%, 40.6%, and 27.0%, respectively.3
Key efficacy inputs for patients receiving cilta-cel were based on the intention-to-treat cohort of the CARTITUDE-4 trial. Parametric extrapolations for OS and PFS were fit to Kaplan-Meier data for these patients (median follow-up = 15.8 months). In the base-case analysis, a lognormal distribution was selected for both OS and PFS based on statistical fit, visual assessment, and input received by Canadian clinical experts consulted by the sponsor.2 Efficacy data for comparators were derived from ITC analysis conducted by the sponsor. In the absence of a valid network connection with the CARTITUDE-4 trial due to the lack of a common anchor, the sponsor conducted a matching-adjusted indirect comparison (for IsaPd and SVd) and an inverse probability of treatment weighting analysis (for Kd, Pd, Vd, and DVd). A summary of the curve selections used in the base-case analysis can be found in Appendix 3.
The health state utility value for PFS (0.752) was derived from mean EQ-5D-5L data collected in the CARTITUDE-4 trial. Specifically, the model’s PFS health state utility value was a pooled average of the preprogression utility values of cilta-cel and physician’s choice collected in the CARTITUDE-4 clinical trial.2 A postprogression utility value of 0.665 was obtained from the National Institute for Health and Care Excellence DVd single technology appraisal submission.4
AEs were modelled as a 1-off cost in the first cycle of the model. Grade 3 or 4 AEs occurring in 5% or more of patients in at least 1 of the relevant trials were considered; in addition, for the AEs of cytokine release syndrome and neurotoxicity, all grades were considered.2 AE-related utility decrements were calculated for a specified duration and applied in the first cycle of the model. Duration in days and disutility values were informed by either the CARTITUDE-4 or CARTITUDE-1 trials, or published literature.2,5-11
The analysis includes the following costs: drug acquisition, drug administration, co-medication acquisition and administration, subsequent treatment acquisition and administration, routine follow-up care, AE management, and terminal care. Costs were obtained from the Ontario Drug Formulary, previous CADTH Reimbursement Reviews, the Ontario Case Costing Initiative, or published literature when appropriate.2 Patients receiving cilta-cel incurred pretreatment costs including CAR T-cell therapy eligibility assessment, apheresis, bridging therapy, and conditioning regimen. Cilta-cel was calculated to be a 1-time cost of $595,067.21 (unit cost of $632,455, assuming only 97.64% of patients would be infused).2 For non–CAR T-cell treatments, dosing regimens were informed by Cancer Care Ontario and treatment duration was based on PFS (i.e., treat to progression). Concomitant medications associated with CAR T-cell and non–CAR T-cell treatments were also considered and were largely informed by the CARTITUDE-4 trial and Cancer Care Ontario, respectively. The sponsor included subsequent treatment costs as a 1-off cost at the time of disease progression, where duration of subsequent treatment and breakdown of type was informed by published literature and clinical expert feedback obtained by the sponsor.2 The type of subsequent therapy received and the length of time the patient would remain on subsequent therapy were assumed to be the same regardless of initial treatment. Unit costs informing routine monitoring were informed by published literature, and the frequency was based on prior CDA-AMC reports on MM and clinical expert feedback. Patients receiving CAR T-cell therapy were assumed to also incur a postinfusion monitoring cost. It was assumed that all AEs were associated with inpatient costs, obtained from Ontario Case Costing Initiative. Terminal care costs included in the model were informed by published literature.12 All costs were reported in 2024 Canadian dollars.
Summary of Sponsor’s Economic Evaluation Results
All analyses were run probabilistically (1,000 iterations). The deterministic and probabilistic results were similar. The probabilistic findings are presented below. The submitted analysis was based on the submitted price for cilta-cel and public list prices for comparators. Additional results from the sponsor’s submitted economic evaluation base case are presented in Appendix 3.
Base-Case Results
In the sponsor’s probabilistic base-case analysis, cilta-cel was associated with an estimated cost of $814,889 and 7.95 QALYs over a lifetime horizon (Table 3). In the sequential analysis, cilta-cel was associated with ICER of $69,861 versus Vd (incremental cost = $389,316; incremental QALYs = 5.57). At a willingness-to-pay threshold of $50,000 per QALY gained, cilta-cel had a 0.2% probability of being considered the optimal treatment.
Table 3: Summary of the Sponsor’s Economic Evaluation Results
Drug | Total costs ($) | Total QALYs | Sequential ICER ($/QALY) |
|---|---|---|---|
Pd | 397,911 | 1.587 | Reference |
Vd | 425,573 | 2.375 | 35,101 |
Cilta-cel | 814,889 | 7.947 | 69,861 |
Dominated treatments | |||
DVd | 507,983 | 2.300 | Dominated by Vd |
Kd | 585,732 | 2.702 | Extendedly dominated by cilta-cel |
Cilta-cel = ciltacabtagene autoleucel; DVd = daratumumab-bortezomib-dexamethasone; ICER = incremental cost-effectiveness ratio; Kd = carfilzomib-dexamethasone; Pd = pomalidomide-dexamethasone; QALY = quality-adjusted life-year; Vd = bortezomib-dexamethasone.
Source: Sponsor’s pharmacoeconomic submission.2
Sensitivity and Scenario Analysis Results
The sponsor conducted several pairwise deterministic scenario analyses including using alternative discount rates and time horizons, excluding drug wastage, using alternative survival extrapolations for cilta-cel, using a decision tree plus PSM structure, using alternative out-of-specification rates, using hazard ratio–based extrapolations for comparators, and including or excluding certain comparators for analyses. Compared to the lowest cost comparator, the ICERs for cilta-cel ranged from $53,024 to $174,117 per QALY gained.
In the scenario analysis where the decision tree plus PSM structure was used, the ICERs were all higher than the base-case analysis, ranging from $67,350 versus IsaPd to $137,940 versus Vd.
No scenario analysis was conducted using a perspective other than the health care payer.
CDA-AMC Appraisal of the Sponsor’s Economic Evaluation
CDA-AMC identified several key limitations to the sponsor’s analysis that have notable implications for the economic analysis:
Model structure was inappropriate. The sponsor notes that a simple PSM was used in the base-case analysis as it preserves sample size in the cilta-cel arm. However, use of survival analysis assumes that the cilta-cel population is homogenous (i.e., all individuals in a cohort assumed to be at risk at a specific point in time have the same probability of progression), which is not reflective of the trial cohort. Some patients within the intention-to-treat population were either infused with cilta-cel after progression (n = 20) or did not receive cilta-cel at all (n = 12). Survival in these patients was far worse than in those who were infused. Not accounting for this heterogeneity leads to inappropriate and inaccurate long-term survival estimates as it gives the impression OS is decreasing for the entire cohort when this is not true. Given this heterogeneity in the cohort, it would be more appropriate to conduct survival analysis on the different subgroups separately.
There are also additional uncertainties associated with the CARTITUDE-4 trial intention-to-treat population as it is a single cohort composed of patients with different transplant eligibility and who have received 1 to 3 prior lines of therapy. Data from a Canadian paper examining survival and outcomes of patients with MM suggest that a patient’s survival outcome differs depending on their line of treatment.13 Specifically, median OS decreases for each subsequent line of treatment, suggesting that a patient who has had 1 prior line of therapy experiences different survival outcomes than a patient who has had 3 or more lines of therapy.13 This finding is aligned with the clinical expert feedback received by CDA-AMC. As such, a single survival analysis conducted on such a heterogeneous cohort is associated with further uncertainty.
The limitations of conducting survival analysis in a heterogenous population have been discussed in the literature.14,15 To account for heterogeneity, the survival analysis should be conducted on subgroups of the population that represent more homogenous populations.
In the CDA-AMC reanalysis, the decision tree plus PSM structure was selected, as per the sponsor’s submitted functionality. This structure accounts for heterogeneity across infusion status. Heterogeneity across treatment lines and transplant status could not be explored.
The OS benefit of cilta-cel is uncertain. The sponsor submitted a PSM based on the intention-to-treat population enrolled in the cilta-cel arm of the CARTITUDE-4 trial. Treatment effect (i.e., PFS and OS) was informed by parametric survival modelling. Specifically, PFS and OS for cilta-cel were informed by extrapolating Kaplan-Meier curves observed from the CARTITUDE-4 trial (median follow-up = 15.9 months) over the model’s time horizon where the lognormal curve was used for both in the sponsor’s base-case analysis. The sponsor estimates that cilta-cel will extend life by approximately 7 years (versus Kd) and up to 8.61 years versus Pd. The mean starting age of the cohort is approximately 60 years old. At 2 years (the period for which there are data), the sponsor estimates that 76% of patients who received cilta-cel will be alive. At 10 and 20 years, the sponsor predicts that, respectively, 45% and 32% of the cohort who received cilta-cel will be alive. At 30 years, when the average age of the cohort is older than 90 years, more than 10% of patients are predicted to still be alive. This indicates a substantial reduction in the risk of death over time. The only plausible rationale for such a reduction in the risk of death would be if cilta-cel was curative for most patients who received it. This would mean the risk of death associated with MM was no longer present despite these patients having experienced relapse and disease that is refractory to potentially multiple lines of therapy. There is no evidence in the trial that cilta-cel is curative. Across all hematologic malignancies where CAR T-cell therapy is used, the long-term efficacy of CAR T-cell therapies remains uncertain.16 The model does not use any real-world evidence in MM but relies on short-term, immature data from the CARTITUDE-4 trial to fully predict the potential long-term survival associated with cilta-cel. The reduction in mortality is therefore not attributed to evidence but to assumption.
As noted in the CDA-AMC Clinical Review Report, while the interim analysis (data cut-off: November 1, 2022) suggests an improvement in PFS and OS for patients receiving cilta-cel compared to treatment of physician’s choice (PVd or DPd), median PFS and OS were not reached. As such, in the absence of robust long-term data, PFS and OS beyond the trial data for cilta-cel are uncertain. This uncertainty was echoed in the clinical expert feedback received by CDA-AMC. If the treatment impact of cilta-cel on PFS is permanent and enduring, then the rate of progression as seen at the end of the trial may remain the same or decrease over time. Conversely, if the treatment effect wanes over time, then rates of progression may begin to increase. In the absence of long-term data, alongside trial data being immature, the long-term impact of cilta-cel on PFS remains unknown.
When extrapolating long-term OS, there are a few considerations. In the interim analysis, OS data are very immature, with only 17% of the cohort who were infused with cilta-cel per protocol having died at the latest data cut-off. At this data cut-off, only 33% of the cohort had experienced a progression or preprogression death event. Therefore, when conducting survival analysis on the OS data, the impact that progression has on OS is likely not fully captured. Whereas for all other treatments in the analysis, mature PFS and OS data are used to extrapolate beyond the trial outcomes. Evidence shows that mortality rates in relapsed or refractory MM tend to increase as a patient moves through lines of therapy upon progression.13,17 As progression events are low in the interim analysis, OS mostly represents a progression-free cohort, and therefore any survival analysis will likely overestimate long-term OS. Second, clinical expert feedback received by CDA-AMC noted that there is no evidence of a clear mechanism by which cilta-cel would provide clinical benefit to patients post–disease progression. Postprogression survival will, however, likely be impacted by what type of therapy is received next and what therapies the patient has already received. The submitted analysis does not allow for the impact of subsequent therapies on health outcomes to be captured. In the submitted analysis, postprogression survival for treatments based on inverse probability of treatment weighting ranges from 1.29 years (Pd) to 2.96 years (Vd). It is not anticipated that postprogression survival for patients who receive cilta-cel will deviate substantially from this range. If cilta-cel delays time to progression, then this increases the likelihood a patient will die before progression. Therefore, if fewer patients who receive cilta-cel experience progression, the average postprogression survival over a cohort may be lower for those who receive cilta-cel. These considerations were used to inform the CDA-AMC reanalysis.
In the CDA-AMC reanalysis, the log-logistic and Weibull curves were selected to inform, respectively, PFS and OS for patients treated with cilta-cel. This assumes the treatment effect is enduring, as the rate of progression slightly declines over time. This analysis is limited as it is only informed by short-term immature survival data and assumes no relationship between OS and PFS. The exponential function used to extrapolate OS was not considered suitable for several reasons. First, as demonstrated by Figure 3 in Appendix 4, the proportion of the cohort that have experienced progression increases over time. As evidence and clinical expectation indicate that mortality rates are anticipated to be higher in individuals who have experienced progression, the hazard rate for mortality will likely increase over time. This is especially true if the next therapy in the treatment pathway is less effective than what preceded it. Second, when the exponential function was selected, it was still assumed that approximately 10% of the cohort are cured and have a probability of death matching that of the general population. Therefore, the Weibull and Gompertz functions were the only parametric curves that met clinical expectations (increasing mortality rate over time, no patients returning to general population mortality, postprogression survival not too dissimilar to other comparators).
The Gompertz function for OS for patients treated with cilta-cel was used in a scenario analysis as this extrapolation predicts higher postprogression survival for cilta-cel versus all other comparators. If this extrapolation was accurate, then the results from this analysis may be biased in favour of cilta-cel as postprogression costs would be anticipated to be higher for cilta-cel than for all other comparators. However, due to the model structure, subsequent therapy costs could not be accurately measured in the analysis.
As an additional scenario analysis, CDA-AMC selected the Weibull curve to inform PFS. This assumes the treatment effect slightly wanes over time as progression rates increase. When extrapolating OS, the curves based on parametric survival analysis all lead to substantial postprogression survival estimates. As no long-term external evidence was used, the survival analysis has no information to predict the impact that increasing progression rates may have on OS. It was not considered clinically plausible for PFS to decrease and have no impact on OS. Therefore, to generate the OS curve, a piecewise model was used. For the first 2 years, the Weibull curve was used to interpolate the OS trial data. After 2 years, an OS curve was derived such that postprogression survival (approximately 2.7 years) did not differ substantially from the base-case analysis using the Weibull function. This was achieved by assuming that the hazard rate for OS is 0.3 that of PFS. This links PFS and OS, meaning that the rate of mortality is linked to the rate of progression. 0.3 was selected to achieve comparable life-years gained in postprogression as in the base-case analysis (approximately 2.7 years). A more robust and accurate method to model the impact of cilta-cel on long-term OS would be to use a more granular model structure, such as a Markov model or discrete event simulation, as per other analyses in this area.18-20
OS curves based on different extrapolation assumptions are presented in Figure 2.
Relevant comparators were not included in the base-case analysis. The sponsor submitted a deviation request to exclude IsaKd in the base case due to lack of head-to-head comparison and differences in patient characteristics in the trials, which did not allow for ITCs. The sponsor further noted that a naive comparison could not be conducted due to the lack of OS data from the IKEMA trial and instead conducted a scenario analysis using hypothetical hazard ratios applied to the OS and PFS curves of cilta-cel. While CDA-AMC acknowledges the limitations associated with assessing the cost-effectiveness of cilta-cel versus IsaKd, the exclusion of it from the base-case analysis remains a limitation, and the cost-effectiveness of cilta-cel versus IsaKd is unknown.21
CDA-AMC was unable to address this limitation due to a lack of comparative effectiveness data.
Comparative clinical evidence of cilta-cel versus relevant comparators is uncertain. In the absence of direct head-to-head evidence comparing cilta-cel to relevant treatments used in clinical practice in Canada, relative effectiveness in the model (i.e., OS and PFS) was informed by sponsor-conducted ITCs. Specifically, in the absence of forming a valid network with the CARTITUDE-4 trial due to lack of a common anchor, unanchored inverse probability of treatment weighting or matching-adjusted indirect comparison were used, depending on the availability of individual patient-level data (refer to Appendix 3 for an overview of which ITC method was used for which comparators). As noted in the CDA-AMC Clinical Review Report, while the sponsor’s submitted indirect evidence suggests that cilta-cel may provide better outcomes for OS and PFS than existing comparators for the treatment of relapsed or refractory MM, there remain significant limitations in this analysis, including the use of immature interim data, incomplete adjustment of important effect modifiers, and restricted generalizability to the clinical setting in Canada, which renders the conclusion of cilta-cel’s relative efficacy versus relevant comparators uncertain.
There are also concerns of face validity when analyzing the results from the economic analysis, which uses indirect evidence. In the submitted economic evaluation, patients who receive Vd have a median OS of 3.12 years. Patients who receive DVd have a median OS of 2.38 years. This indicates that patients who receive Vd live approximately 9 months longer than those who receive DVd. However, direct evidence from the CASTOR trial conducted in patients with relapsed or refractory MM shows that DVd extends life relative to Vd.22 The sponsor’s ITC results therefore indicate that in the population being analyzed (who have received 1 to 3 lines of therapy, including a proteasome inhibitor, and whose disease is refractory to lenalidomide), patients do worse on DVd than Vd, a reverse of the findings from the CASTOR trial. If this conclusion is true, then it highlights how influential patient characteristics are on treatment efficacy and the importance of direct randomized evidence, which is the only mechanism to control for all confounding.
Given the lack of direct evidence for cilta-cel versus relevant comparators and limitations within the sponsor’s ITC, it remains uncertain to what extent cilta-cel provides a net benefit above any funded regimen other than those used in the trial (i.e., physician choice between PVd and DPd).
SVd and IsaPd were not included in the base-case analysis as they were based on matching-adjusted indirect comparisons and therefore these estimates were based on a different population than those analyzed by cilta-cel and all other treatments. Sequential analyses can only be conducted on homogenous populations. Likewise, the only option to include these comparators was to assume that the proportional hazards assumption would hold. However, this is unlikely to be the case as it does not hold for any other comparator and would assume that the impact on OS would be seen immediately.
Subsequent therapy costs are associated with significant uncertainty. In the sponsor’s base-case analysis, subsequent therapy costs were applied as a 1-off cost when a patient entered the postprogression health state (i.e., the time of disease progression). The cost of subsequent treatment was assumed to be the same regardless of prior treatment and was calculated as a weighted distribution of treatment regimens (i.e., IsaKd, IsaPd, Pd, Kd, and SVd), with proportions of each informed by clinical expert input obtained by the sponsor. The sponsor assumed that the median duration of subsequent treatment was 14.9 months, obtained from Yong et al. (2024).23 This was deemed inappropriate for several reasons.
First, the 1-time implementation based on a median duration of 14.9 months likely underestimates total subsequent therapy costs as it assumes only 1 additional line of therapy is trialled. Of the patients for whom the next line of therapy fails, many will go on to receive another. This is not accounted for.
Second, clinical expert feedback received by CDA-AMC noted that assuming the type of subsequent therapy received was the same regardless of a patient’s treatment history is inappropriate. This is because a patient’s prior therapy exposure impacts the selection of the subsequent therapy. For example, a patient who receives an anti-CD38 regimen (daratumumab or isatuximab) will likely not be re-treated with another anti-CD38 regimen.
Third, time to progression may influence the likelihood of receiving additional treatment. A study by McCurdy et al., conducted in Canada, looked at reasons for attrition (not going on to receive the next line of therapy) in a cohort with MM.24 Using multivariate regression analysis, the study found that a shorter time to progression was associated with a higher risk of attrition. Therefore, if a patient experiences progression on their current line of therapy sooner, then they are less likely to receive another line.
Fourth, when estimating subsequent therapy costs, the sponsor assumes the probability of death is the same for those with progressed disease versus those who are progression-free. This assumption means that for patients on cilta-cel the majority of PFS events that occur are deaths rather than progression and therefore few patients go on to receive subsequent therapy. This goes against clinical expectation as well as evidence from the trial, which shows that progression events make up most of the PFS events.
Overall, while subsequent treatment efficacy and cost may differ among cilta-cel and comparators, in the absence of a more robust and granular model (i.e., by lines of therapy), substantial uncertainty remains with the inclusion of subsequent therapy costs in the economic analysis as is. Subsequent therapy costs may be higher for those who received cilta-cel, as cilta-cel presents a new treatment class and the number of treatment options postprogression is expanded. Likewise, if cilta-cel delays progression, then more patients who progress may go on to receive a subsequent therapy, as evidence from McCurdy et al. suggests. Conversely, by delaying time to progression, more patients may die in the preprogression phase, which would reduce the number of patients who require subsequent therapy and therefore decrease subsequent therapy costs. Lastly,
Due to the heterogenous population (i.e., a mix of patients on second line, third line, and so forth) and the limitations of a PSM structure, CDA-AMC excluded subsequent therapy costs in the base-case analysis. The impact of subsequent therapy costs on the cost-effectiveness of cilta-cel remains unknown. Any estimate derived from the current model structure would be misleading as it fails to account for many of the complexities that apply to MM.
Uncertainty regarding the reimbursement of out-of-specification products. In its pharmacoeconomic report, the sponsor noted that 3.41% of cilta-cel products in the CARTITUDE-4 trial were deemed out of specification but were still administered to patients.2 As a result, the sponsor excluded drug acquisition costs for 3.41% of patients, under the assumption that out-of-specification products would not be reimbursed. This assumption is uncertain and subject to jurisdiction-specific practices and policies. The exclusion of drug acquisition costs for these products may underestimate costs for patients receiving cilta-cel, biasing results in favour of this product.
In the CDA-AMC reanalysis, CDA-AMC assumed that out-of-specification products would be reimbursed (i.e., drug acquisition costs would be incurred by the health care system) via the sponsor-provided drop-down selection. The exclusion of these costs was tested in a scenario analysis.
The cost of pomalidomide and bortezomib is overestimated. In the sponsor’s economic analysis, the cost of pomalidomide was informed by the Ontario Drug Benefit Formulary and estimated to be $425 per 4 mg capsule. However, based on the pan-Canadian tiered pricing framework outlined by the pan-Canadian Pharmaceutical Alliance, generic pomalidomide should have a lower cost, at $125 per 4 mg tablet.25 Additionally, the sponsor used a unit cost of $1,402.42 per 3.5 mg for bortezomib informed by the CADTH reimbursement review of selinexor. CDA-AMC notes that generic bortezomib should have a lower cost, at $654.31 per 3.5 mg, which was a change that was implemented in the reimbursement review of selinexor.
In the CDA-AMC analysis, the cost of pomalidomide was updated to $125 per capsule and the cost of bortezomib was updated to $654.31 per 3.5 mg tablet.
The treatment schedule for Kd is not reflective of Canadian practice. The sponsor assumes patients receiving Kd will receive the treatment on a twice-weekly schedule in the economic model. Most centres in Canada use the once-weekly schedule in practice. Based on the phase III A.R.R.O.W. study, treatment with the once-weekly schedule was found to have a potentially improved efficacy profile compared to the twice-weekly schedule, in addition to having a more convenient dosing schedule for patients since it requires less frequent administration.26 Therefore, CDA-AMC notes that the cost of Kd in the sponsor’s model is not reflective of Canadian practice and is overestimated. CDA-AMC further notes that since the efficacy for Kd in the economic model was informed by the randomized phase III CANDOR study, where patients were treated with the twice-weekly regimen of Kd, the efficacy estimates of Kd in the sponsor’s submitted model may be underestimated.
CDA-AMC updated the dosing schedule for Kd to align with the following once-weekly dosing, 28-day cycle: cycle 1, 20mg/m2 on day 1, then 70 mg/m2 on days 8 and 15; cycle 2, 70 mg/m2 on days 1, 8, and 15.
CDA-AMC was unable to address the efficacy limitations regarding Kd. As such, the cost-effectiveness of cilta-cel versus Kd may be biased in favour of cilta-cel as Kd efficacy in the model may be lower than expected due to the modelling being based on data from the CANDOR study (i.e., twice-weekly carfilzomib and dexamethasone).
The model lacked transparency due to poor modelling practices. The sponsor’s submitted model included numerous IFERROR and ISERROR statements, which lead to situations in which the parameter value is overwritten with an alternative value without alerting the user to the automatized overwriting. The systematic use of IFERROR statements makes thorough auditing of the sponsor’s model impractical, and it remains unclear whether the model is running inappropriately by overriding errors.
CDA-AMC was unable to address this limitation and notes that a thorough validation of the sponsor’s model was not possible.
Additionally, the following key assumptions were made by the sponsor and have been appraised by CDA-AMC (refer to Table 4).
Table 4: Key Assumptions of the Submitted Economic Evaluation (Not Noted as Limitations to the Submission)
Sponsor’s key assumption | CDA-AMC comment |
|---|---|
100% of patients were assumed to receive cilta-cel in an inpatient setting. | Reasonable. Cilta-cel is expected to only be infused in specialized CAR T-cell therapy centres across Canada. |
CAR = chimeric antigen receptor; CDA-AMC = Canada’s Drug Agency; cilta-cel = ciltacabtagene autoleucel.
CDA-AMC Reanalyses of the Economic Evaluation
Base-Case Results
Several limitations with the sponsor’s submission could not be adequately addressed (i.e., exclusion of relevant comparators, uncertainty regarding comparative clinical evidence, subsequent therapy costs). CDA-AMC conducted stepped analysis that used the decision tree plus PSM structure, used different assumptions for extrapolating cilta-cel OS and PFS, excluded subsequent therapy costs, included out-of-specification product reimbursement, updated the cost of pomalidomide, and assumed carfilzomib was administered weekly rather than twice weekly.
Details for each stepwise change to derive the CDA-AMC analysis are presented in Table 4, with stepped analysis results in Appendix 4. The summary results of the CDA-AMC reanalysis are presented in Table 6 (disaggregated results are presented in Appendix 4).
Table 5: CDA-AMC Revisions to the Submitted Economic Evaluation
Stepped analysis | Sponsor’s value or assumption | CDA-AMC value or assumption |
|---|---|---|
Changes to derive the CDA-AMC base case | ||
1. Model structure | PSM | Decision tree plus PSM |
2. Subsequent therapy cost | One-off cost at the time of progression | Exclude |
3. Reimbursement of out-of-specification products | Excluded | Included |
4. Price of pomalidomide and bortezomib | Pomalidomide: $425 per tablet Bortezomib: $1,402.42 per 3.5 mg | Pomalidomide: $125 per tablet Bortezomib: $654.31 per 3.5 mg |
5. Dosing schedule of Kd | 28-day cycles: Cycle 1: 20 mg/m2 on days 1, 2; 56 mg/m2 on days 8, 9, 15, 16 Cycles 2+: 56 mg/m2 on days 1, 2, 8, 9, 15, 16 | 28-day cycles: Cycle 1: 20 mg/m2 on day 1 then 70 mg/m2 on days 8 and 15 Cycle 2+: 70 mg/m2 on days 1, 8, 15 |
6. Cilta-cel OS and PFS | (When the decision tree plus PSM structure is selected) PFS = log-logistic OS = exponential | (When the decision tree plus PSM structure is selected) PFS = log-logistic OS = Weibull |
CDA-AMC reanalysis | ― | Reanalysis 1 + 2 + 3 + 4 + 5 + 6 |
CDA-AMC = Canada’s Drug Agency; cilta-cel = ciltacabtagene autoleucel; Kd = carfilzomib-dexamethasone; OS = overall survival; PFS = progression-free survival; PSM = partitioned survival model.
In the CDA-AMC reanalysis, cilta-cel was associated with an ICER of $280,871 per QALY gained compared to Vd (incremental cost: $639,096; incremental QALYs: 2.28) based on a sequential analysis. Incremental costs were primarily due to cilta-cel treatment and administration costs, and incremental QALYs were primarily due to improved OS. Nearly all incremental costs were incurred in the first year, and nearly all the incremental QALYs were incurred after 2 years. Refer to Appendix 4 for full results.
Table 6: Summary of the CDA-AMC Reanalysis Results
Drug | Total costs ($) | Total QALYs | Sequential ICER ($/QALY) |
|---|---|---|---|
Vd | 107,774 | 2.375 | Reference |
Cilta-cel | 746,870 | 4.650 | 280,871 |
Dominated treatments | |||
Pd | 113,284 | 1.587 | Dominated by Vd |
Kd | 211,930 | 2.702 | Extendedly dominated by cilta-cel |
DVd | 292,871 | 2.300 | Dominated by Vd, Kd |
CDA-AMC = Canada’s Drug Agency; cilta-cel = ciltacabtagene autoleucel; DVd = daratumumab-bortezomib-dexamethasone; ICER = incremental cost-effectiveness ratio; Kd = carfilzomib-dexamethasone; Pd = pomalidomide-dexamethasone; QALY = quality-adjusted life-year; Vd = bortezomib-dexamethasone.
Scenario Analysis Results
CDA-AMC undertook price reduction analyses based on the sponsor’s results and the CDA-AMC reanalysis. Results from the CDA-AMC reanalysis suggest a price reduction of approximately 88% would be required for cilta-cel to achieve cost-effectiveness versus all relevant comparators at a $50,000 per QALY threshold. Price reductions to achieve cost-effectiveness at alternate thresholds are displayed in Table 7. Given the changing landscape of MM, the use of certain comparators, such as Vd, may become very small over time. If Vd is removed from the sequential analysis, the treatment acquisition cost of cilta-cel would need to decrease to approximately $120,000 (81% reduction in price) to be considered the optimal treatment option at a $50,000 per QALY threshold.
Table 7: CDA-AMC Price Reduction Analyses
Price reduction | Unit drug cost ($) | Sequential ICERs for cilta-cel vs. comparator (as indicated) ($/QALY) | |
|---|---|---|---|
Sponsor base case | CDA-AMC reanalysis | ||
No price reduction | 632,455 | 74,922 (vs. Vd) | 280,871 (vs. Vd) |
10% | 569,210 | 64,592 (vs. Vd) | 254,679 (vs. Vd) |
20% | 505,964 | 54,262 (vs. Vd) | 228,487 (vs. Vd) |
30% | 442,719 | 43,932 (vs. Vd) | 202,296 (vs. Vd) |
40% | 379,473 | 33,602 (vs. Vd) | 176,104 (vs. Vd) |
50% | 316,228 | 23,273 (vs. Vd) | 149,912 (vs. Vd) |
60% | 252,982 | 12,943 (vs. Vd) | 123,721 (vs. Vd) |
70% | 189,736 | 2,613 (vs. Vd) | 97,529 (vs. Vd) |
80% | 126,491 | Dominant | 71,337 (vs. Vd) |
90% | 63,246 | Dominant | 45,146 (vs. Vd) |
CDA-AMC = Canada’s Drug Agency; cilta-cel = ciltacabtagene autoleucel; ICER = incremental cost-effectiveness ratio; QALY = quality-adjusted life-year; Vd = bortezomib-dexamethasone; vs. = versus.
Issues for Consideration
Specialized centres, which require training and accreditation by the sponsor, are required to treat patients with cilta-cel. Obtaining and maintaining this accreditation can result in a high resource burden, which may be compounded with an increase in overall administrative burden as there are likely multiple CAR T-cell therapies being administered by these specialized centres.
There may be issues with access and prolonged stays required near specialized centres, especially for patients from remote areas, and financial support for travel and accommodation would be needed.
The sponsor has indicated that institution and manufacturing constraints associated with cilta-cel should be considered; the sponsor estimates that 432 and 480 patients will be able to receive cilta-cel across Canada in the first and subsequent years, respectively. Based on feedback from clinical experts, there will be a larger demand for treatment with cilta-cel than current resource capacity allows for.
CADTH previously reviewed cilta-cel for the treatment of adult patients with MM who have received at least 3 prior lines of therapy, including a proteasome inhibitor, an immunomodulatory agent, and an anti-CD38 antibody, and whose disease is refractory to their last treatment.18 The submitted price in that review was the same. The committee recommended reimbursement of cilta-cel with conditions, including a price reduction of 72% to 80% if a $50,000 per QALY gained threshold was used. The indicated population is under review at the pan-Canadian Pharmaceutical Alliance at the time of writing.
Overall Conclusions
Evidence from the CARTITUDE-4 trial demonstrated that infusion of cilta-cel, when compared to treatment of physician’s choice (i.e., PVd or DPd), shows a clinically significant benefit in terms of PFS in patients with relapsed or refractory MM who have received 1 to 3 prior lines of therapy, including a proteasome inhibitor and an immunomodulatory agent, and whose disease is refractory to lenalidomide. OS benefit was uncertain due to immaturity of data. When compared to other currently available therapies (i.e., Kd, Pd, Vd, DVd, IsaPd, and SVd), cilta-cel demonstrated improvements in terms of OS and PFS; however, the comparative evidence was derived from ITCs, which were limited by small sample sizes, generalizability concerns, and risk of bias. In consideration of these limitations, the exact magnitude of effect of cilta-cel versus comparators not used in the CARTITUDE-4 trial remains uncertain.
CDA-AMC addressed key limitations with respect to model structure, extrapolation of OS, subsequent therapy costs, cost of pomalidomide and bortezomib, carfilzomib treatment schedule, and out-of-specification product costs. In the CDA-AMC reanalysis, the ICER for cilta-cel was $280,871 per QALY gained compared with Vd (incremental costs = $639,096; incremental QALYs = 2.28; incremental LYs = 3.03) based on a sequential analysis. In this reanalysis, additional costs associated with cilta-cel were driven mainly by drug acquisition costs (approximately $607,000, including cilta-cel, bridging therapy, and conditioning therapy acquisition costs), administration of cilta-cel (approximately $27,000, including determination of eligibility, infusion, and apheresis), and management of adverse events (approximately $30,000). All these costs were incurred in the first year of the analysis. Incremental benefits were driven by extensions in life, with cilta-cel estimated to extend life by an average of approximately 3 years versus Vd (ranging from 2.6 years versus Kd to 4.3 years versus Pd). The degree of life extension associated with cilta-cel is uncertain given the immaturity of events and the length of data available (2 years). At 2 years, cilta-cel has similar OS expectations relative to Kd and Vd. Therefore, all the assumed benefit in OS is derived from the extrapolated period, for which there are no data. It is assumed that the magnitude of benefit with regard to PFS, which is substantially different at 2 years, is anticipated to translate into future OS benefit. An alternate extrapolation of OS for cilta-cel was conducted, assuming that rates of progression increased over time (indicative of a treatment-waning effect). In this scenario the ICER, based on a sequential analysis, increased to $506,778 per QALY gained (versus Kd).
Based on the primary sequential analysis conducted by CDA-AMC, the treatment acquisition cost of cilta-cel would need to be approximately $76,000 (88% reduction in price) to be considered cost-effective at a $50,000 per QALY threshold versus all relevant comparators, including Vd. Including costs associated with administration (determination of eligibility, infusion, apheresis, bridging and conditioning therapies) would bring the total health care cost of infusing cilta-cel to $115,000 per patient. Given the changing landscape of MM, the use of certain comparators, such as Vd, may become very small over time. If Vd is removed from the sequential analysis, the treatment acquisition cost of cilta-cel would need to decrease to approximately $120,000 (81% reduction in price) to be considered the optimal treatment option at a $50,000 per QALY threshold.
In the absence of long-term data, the uncertainties in the comparative evidence versus relevant comparators, the immaturity of the OS data, and the limitations in how the submitted analysis models subsequent therapies mean the cost-effectiveness of cilta-cel is uncertain. Due to an absence of evidence, either direct or indirect, the cost-effectiveness of cilta-cel versus some regimens, such as IsaKd, is unknown.
References
1.Carvykti (ciltacabtagene autoleucel): cell suspension in infusion bag, 0.5-1.0x10⁶ CAR-positive viable T-cells per kg body weight with a maximum of 1x10⁸ CAR-positive viable T-cells, for intravenous infusion [product monograph]. Toronto (ON): Janssen Inc.; 2024 Jul 19.
2.Pharmacoeconomic evaluation [internal sponsor's report]. In: Drug Reimbursement Review sponsor submission: Carvykti (ciltacabtagene autoleucel), cell suspension in infusion bag for intravenous infusion. Toronto (ON): Janssen Inc.; 2024 Apr 18.
3.San-Miguel J, Dhakal B, Yong K, et al. Cilta-cel or standard care in lenalidomide-refractory multiple myeloma. N Engl J Med. 2023;389(4):335-347. PubMed
4.National Institute for Health Care Excellence. Daratumumab with bortezomib and dexamethasone for previously treated multiple myeloma. (Technology appraisal guidance TA897) 2023; https://www.nice.org.uk/guidance/TA897. Accessed by sponsor, no date provided.
5.Beusterien KM, Davies J, Leach M, et al. Population preference values for treatment outcomes in chronic lymphocytic leukaemia: a cross-sectional utility study. Health Qual Life Outcomes. 2010;8:50. PubMed
6.Jakubowiak AJ, Campioni M, Benedict A, et al. Cost-effectiveness of adding carfilzomib to lenalidomide and dexamethasone in relapsed multiple myeloma from a US perspective. J Med Econ. 2016;19(11):1061-1074. PubMed
7.Nafees B, Lloyd AJ, Dewilde S, Rajan N, Lorenzo M. Health state utilities in non-small cell lung cancer: an international study. Asia Pac J Clin Oncol. 2017;13(5):e195-e203. PubMed
8.Nafees B, Stafford M, Gavriel S, Bhalla S, Watkins J. Health state utilities for non small cell lung cancer. Health Qual Life Outcomes. 2008;6:84. PubMed
9.Slot M, Niemann CU, Ehlers LH, Rotbain EC. Cost-effectiveness of targeted treatment vs chemoimmunotherapy in treatment-naive unfit CLL without TP53 aberrations. Blood Adv. 2023;7(15):4186-4196. PubMed
10.Smith-Palmer J, Bae JP, Boye KS, Norrbacka K, Hunt B, Valentine WJ. Evaluating health-related quality of life in type 1 diabetes: a systematic literature review of utilities for adults with type 1 diabetes. Clinicoecon Outcomes Res. 2016;8:559-571. PubMed
11.Sullivan PW, Slejko JF, Sculpher MJ, Ghushchyan V. Catalogue of EQ-5D scores for the United Kingdom. Med Decis Making. 2011;31(6):800-804. PubMed
12.de Oliveira C, Pataky R, Bremner KE, et al. Phase-specific and lifetime costs of cancer care in Ontario, Canada. BMC Cancer. 2016;16(1):809. PubMed
13.Mian H, Reece D, Masih-Khan E, et al. Survival and outcomes of newly diagnosed multiple myeloma patients stratified by transplant status 2007-2018: retrospective analysis from the Canadian Myeloma Research Group Database. Clin Lymphoma Myeloma Leuk. 2022;22(8):608-617. PubMed
14.Zaric GS. The impact of ignoring population heterogeneity when Markov models are used in cost-effectiveness analysis. Med Decis Making. 2003;23(5):379-396. PubMed
15.Tarride JE, Cheung M, Hanna TP, et al. Platform, basket, and umbrella trial designs: issues around health technology assessment of novel therapeutics. Can J Health Technol. 2022;2(7). https://canjhealthtechnol.ca/index.php/cjht/article/view/nm0002/nm0002. Accessed 2024 Jun 26. PubMed
16.Zinzi A, Gaio M, Liguori V, et al. Late relapse after CAR-T cell therapy for adult patients with hematologic malignancies: a definite evidence from systematic review and meta-analysis on individual data. Pharmacol Res. 2023;190:106742. PubMed
17.Reimbursement Review clinical and pharmacoeconomic report: optimal pharmacotherapy for transplant-ineligible multiple myeloma. Can J Health Technol. 2024;4(4). https://www.cadth.ca/sites/default/files/DRR/2024/TR0014-MM-ESHPM-Combined-Report.pdf. Accessed 2024 Jul 15.
18.Drug Reimbursement Expert Review Committee draft recommendation: ciltacabtagene autoleucel (Carvykti - Janssen Inc.). Ottawa (ON): CADTH; 2023: https://www.cadth.ca/sites/default/files/DRR/2023/PG0302%20Carvykti%20-%20Draft%20CADTH%20Recommendation%20March%2028%2C%202023_For%20Posting.pdf. Accessed 2024 Feb.
19.Blommestein HM, Franken MG, van Beurden-Tan CHY, et al. Cost-effectiveness of novel treatment sequences for transplant-ineligible patients with multiple myeloma. JAMA Netw Open. 2021;4(3):e213497. PubMed
20.Freitag A, Sarri G, Ta A, Gurskyte L, Cherepanov D, Hernandez LG. A systematic review of modeling approaches to evaluate treatments for relapsed refractory multiple myeloma: critical review and considerations for future health economic models. Pharmacoeconomics. 2024;42(9):955-1002. PubMed
21.Procedures for Reimbursement Reviews. Ottawa (ON): CADTH; 2024: https://www.cadth.ca/sites/default/files/Drug_Review_Process/CADTH%20Drug%20Reimbursement%20Review%20Procedures.pdf. Accessed 2024 Jun 24.
22.Sonneveld P, Chanan-Khan A, Weisel K, et al. Overall Survival With Daratumumab, Bortezomib, and Dexamethasone in Previously Treated Multiple Myeloma (CASTOR): A Randomized, Open-Label, Phase III Trial. J Clin Oncol. 2023;41(8):1600-1609. PubMed
23.Yong K, Einsele H, Schecter JM, et al. Characteristics and outcomes in patients with lenalidomide-refractory multiple myeloma treated with 1-3 prior lines of therapy: analysis of individual patient-level data from daratumumab clinical trials [internal sponsor's report]. In: Drug Reimbursement Review sponsor submission: Carvykti (ciltacabtagene autoleucel), cell suspension in infusion bag for intravenous infusion. Toronto (ON): Janssen Inc.; 2024 Apr 18. 2024.
24.McCurdy A, Mian H, LeBlanc R, et al. Redefining attrition in multiple myeloma (MM): a Canadian Myeloma Research Group (CMRG) analysis. Blood Cancer J. 2023;13(1):111. PubMed
25.pan-Canadian Pharmaceutical Alliance (pCPA). Generic Categories Report February 2024 [spreadsheet]. 2024; https://www.pcpacanada.ca/sites/default/files/eng/pCPA_Generic_Category_Report_202402.xlsx. Accessed 2024 Jun 06.
26.Moreau P, Mateos MV, Berenson JR, et al. Once weekly versus twice weekly carfilzomib dosing in patients with relapsed and refractory multiple myeloma (A.R.R.O.W.): interim analysis results of a randomised, phase 3 study. Lancet Oncol. 2018;19(7):953-964. PubMed
27.Cancer Care Ontario (CCO). CARFDEXA: carfilzomib-dexamethasone [regimen monograph]. 2024; https://www.cancercareontario.ca/en/drugformulary/regimens/monograph/47761. Accessed 2024 Jun 06.
28.Cancer Care Ontario (CCO). DEXAPOMA: dexamethasone-pomalidomide [regimen monograph]. 2023; https://www.cancercareontario.ca/en/drugformulary/regimens/monograph/46761. Accessed 2024 Jun 06.
29.Cancer Care Ontario (CCO). DEXAPOMA-ISAT: dexamethasone-pomalidomide-isatuximab [regimen monograph]. 2024; https://www.cancercareontario.ca/en/drugformulary/regimens/monograph/66886. Accessed 2024 Jun 06.
30.Cancer Care Ontario (CCO). CARFDEXA+ISAT: carfilzomib-dexamethasone-isatuximab [regimen monograph]. 2024; https://www.cancercareontario.ca/en/drugformulary/regimens/monograph/71326. Accessed 2024 Jun 06.
31.Cancer Care Ontario (CCO). BORT: bortezomib [regimen monograph]. 2019; https://www.cancercareontario.ca/en/drugformulary/regimens/monograph/44991. Accessed 2024 Jun 06.
32.Cancer Care Ontario (CCO). DARA(MNT-SC): daratumumab (subcut) maintenance [regimen monograph]. 2022; https://www.cancercareontario.ca/en/drugformulary/regimens/monograph/72301. Accessed 2024 Jun 06.
33.Cancer Care Ontario (CCO). BORTDEXADARA(SC): bortezomib-dexamethasone-daratumumab (subcut) [regimen monograph]. 2023; https://www.cancercareontario.ca/en/drugformulary/regimens/monograph/72851. Accessed 2024 Jun 06.
34.Cancer Care Ontario (CCO). BORTDEXASELI: bortezomib-dexamethasone-selinexor [regimen monograph]. 2024; https://www.cancercareontario.ca/en/drugformulary/regimens/monograph/59751. Accessed 2024 Jun 06.
35.DeltaPA. Ottawa (ON): IQVIA; 2023: https://www.iqvia.com/. Accessed 2024 Jun 06.
36.Exceptional Access Program (EAP). Toronto (ON): Ontario Ministry of Health; Ontario Ministry of Long-Term Care; 2024: http://www.health.gov.on.ca/en/pro/programs/drugs/odbf/odbf_except_access.aspx. Accessed 2024 Jun 06.
37.Canadian Cancer Statistics Advisory CCS, Statistics Canada, Public Health Agency of Canada. Canadian Cancer Statistics: a 2022 special report on cancer prevalence. Toronto (ON): Canadian Cancer Society; 2022: https://cdn.cancer.ca/-/media/files/research/cancer-statistics/2022-statistics/2022-special-report/2022_prevalence_report_final_en.pdf. Accessed 2024 Jun 23.
38.ONCO-CAPPS Patient Treatment Dynamics Multiple Myeloma (MM) [internal sponsor's data]. In: Drug Reimbursement Review sponsor submission: Carvykti (ciltacabtagene autoleucel), cell suspension in infusion bag for intravenous infusion. Toronto (ON): Janssen Inc.; 2024 Jan.
39.Despiegel N, Touboul C, Flinois A, et al. Health-related quality of life of patients with multiple myeloma treated in routine clinical practice in France. Clin Lymphoma Myeloma Leuk. 2019;19(1):e13-e28. PubMed
40.Table: 17-10-0005-01. Population estimates on July 1, by age and gender Ottawa (ON): Statistics Canada; 2024: https://www150.statcan.gc.ca/t1/tbl1/en/cv.action?pid=1710000501. Accessed 2024 Jul 16.
Appendix 1: Cost Comparison Table
Please note that this appendix has not been copy-edited.
The comparators presented in the following table have been deemed to be appropriate based on feedback from clinical expert(s). Comparators may be recommended (appropriate) practice or actual practice. Existing Product Listing Agreements are not reflected in the table and as such, the table may not represent the actual costs to public drug plans.
Table 8: CDA-AMC Cost Comparison Table for Patients With Relapsed or Refractory Multiple Myeloma Who Have Received 1 to 3 Prior Therapies Including a Proteasome Inhibitor and an Immunomodulatory Agent, and Who Are Refractory to Lenalidomide
Treatment | Strength / concentration | Form | Price | Recommended dosage | Daily cost ($) | 28-day cycle cost ($) |
|---|---|---|---|---|---|---|
Ciltacabtagene autoleucel (Carvykti) | 0.5 to 1.0 × 10⁶ CAR-positive viable T-cells per kg, with a maximum of 1 × 10⁸ T-cells | Cell suspension in patient-specific single infusion bag | 632,455.0000a | One-time doseb | NA | NA |
Carfilzomib-dexamethasone (Kd)27 | ||||||
Carfilzomib | 10 mg 30 mg 60 mg | Powder in vial | 255.5500c 766.6590c 1,533.3300c | Cycle 1 20 mg/m2 on days 1 70 mg/m2 on days 8, 15 Cycle 2+ 70 mg/m2 on days 1, 8, 15 | Cycle 1: 292 Cycle 2+: 329 | Cycle 1: 8,178 Cycle 2+: 9,200 |
Dexamethasone | 0.5 mg 4 mg | Tablet | 0.1564 0.6112 | 20 mg on Days 1, 2, 8, 9, 15, 16, 22, 23 | 0.87 | 24 |
Carfilzomib + dexamethasone regimen | Cycle 1: 293 Cycle 2+: 329 | Cycle 1: 8,202 Cycle 2+: 9,224 | ||||
Pomalidomide-dexamethasone (Pd)28 | ||||||
Dexamethasone | 0.5 mg 4 mg | Tablet | 0.1564 0.6112 | 20 to 40 mg on Days 1, 8, 15, 22 | 0.44 to 0.87 | 12 to 24 |
Pomalidomide | 1 mg 2 mg 3 mg 4 mg | Capsule | 125.0000c | 4 mg on Days 1 to 21 | 93.75 | 2,625 |
Dexamethasone + pomalidomide regimen | 94.19 to 94.62 | 2,637 to 2,649 | ||||
Isatuximab-pomalidomide-dexamethasone (IsaPd)29 | ||||||
Dexamethasone | 0.5 mg 4 mg | Tablet | 0.1564 0.6112 | 20 to 40 mg on Days 1, 8, 15, 22 | 0.44 to 0.87 | 12 to 24 |
Isatuximab | 100 mg/ 5 mL 500 mg / 25 mL | Solution for Injection | 757.9000d 3,789.4900d | Cycle 1: 10 mg/ kg on Days 1, 8, 15, 22 Cycle 2+: 10 mg/ kg days 1, 15 | Cycle 1: 757.90 Cycle 2+: 378.95 | Cycle 1: 21,221 Cycle 2+: 10,611 |
Pomalidomide | 1 mg 2 mg 3 mg 4 mg | Capsule | 125.0000c | 4 mg on Days 1 to 21 | 93.75 | 2,625 |
Isatuximab-pomalidomide-dexamethasone regimen | Cycle 1:852.52 Cycle 2+: 473.57 | Cycle 1: 23,871 Cycle 2+: 13,260 | ||||
Isatuximab-carfilzomib-dexamethasone (IsaKd)30 | ||||||
Dexamethasone | 0.5 mg 4 mg | Tablet | 0.1564 0.6112 | 40 mg on Days 1, 8, 15, 22 | 0.87 | 24 |
Isatuximab | 100 mg/ 5 mL 500 mg / 25 mL | Solution for Injection | 757.9000d 3,789.4900d | Cycle 1: 10 mg/ kg on Days 1, 8, 15, 22 Cycle 2+: 10 mg/ kg days 1, 15 | Cycle 1: 757.90 Cycle 2+: 378.95 | Cycle 1: 21,221 Cycle 2+: 10,611 |
Carfilzomib | 10 mg 30 mg 60 mg | Powder in vial | 255.5500c 766.6590c 1,533.3300c | Cycle 1: 20 mg/ m2 on Day 1; 70 mg/ m2 on Days 8, 15 Cycle 2+: 70 mg/ m2 on Days 1, 8, 15 | Cycle 1: 255.55 Cycle 2+: 328.57 | Cycle 1: 7,156 Cycle 2+: 9,200 |
Isatuximab-carfilzomib-dexamethasone regimen | Cycle 1: 1,014 Cycle 2+: 708 | Cycle 1: 28,401 Cycle 2+: 19,835 | ||||
Bortezomib-dexamethasone (Vd)31 | ||||||
Bortezomib | 3.5 mg | Powder in vial (for infusion) | 654.3100c | 1.3 mg/ m2 on Days 1, 8, 15, 22 every 35 days | 75.78 | 2,094 |
Dexamethasone | 0.5 mg 4 mg | Tablet | 0.1564 0.6112 | 40 mg once weekly | 0.87 | 24 |
Bortezomib-dexamethasone regimen | 76 | 2,118 | ||||
Daratumumab | 1,800 mg | Solution for SC Injection | 7,712.0505c | Cycle 1 to 3: 1,800 mg SC on Days 1, 8, 15 Cycle 4+: 1,800 mg SC on Day 1 | Cycle 1 to 3: 826.29 Cycle 4+: 275.43 | Cycle 1 to 3: 23,136 Cycle 4+: 7,712 |
Bortezomib | 3.5 mg | Powder in vial (for infusion) | 654.3100c | Cycle 1 to 8: 1.3 mg/m2 SC days 1, 4, 8, 11 | Cycle 1 to 8: 93.47 | Cycle 1 to 8: 2,617 |
Dexamethasone | 0.5 mg 4 mg | Tablet | 0.1564 0.6112 | Cycle 1 to 8: 20 mg on Days, 1, 2, 4, 5, 8, 9, 11, 13 | Cycle 1 to 8: 0.87 | Cycle 1 to 8: 24 |
Daratumumab-bortezomib-dexamethasone regimen | Cycle 1 to 3:921 Cycle 4 to 8: 370 Cycle 9+: 275 | Cycle 1 to 3: 25,778 Cycle 4 to 8: 10,354 Cycle 9+: 7,712 | ||||
Selinexor-bortezomib-dexamethasone (SVd)34 | ||||||
Bortezomib | 3.5 mg | Powder in vial (for infusion) | 654.3100c | 1.3 mg/m2 Days 1, 8, 15, 22 every 25 days | 74.78 | 2,094 |
Selinexor | 20 mg | Tab | 550.0000 | 100 mg on Days 1, 8, 15, 22, 29 every 35 days | 392.86 | 11,000 |
Dexamethasone | 0.5 mg 4 mg | Tablet | 0.1564 0.6112 | 40 mg on Days 1, 8, 15, 22, 29 ever 35 days | 0.87 | 24 |
Selinexor-bortezomib-dexamethasone | 468.51 | 13,118 | ||||
CDA-AMC = Canada’s Drug Agency.
Note: All prices are from the Ontario Drug Benefit Formulary (accessed June 2024), unless otherwise indicated, and do not include dispensing fees. Daily and 28-day
costs are calculated based on a mean body surface area of 1.91 m2.
aSponsor-submitted price.2
bCilta-cel is delivered as a 1-time dose. Daily and annual costs were not calculated.
cIQVIA DeltaPA Database. Accessed June 2024.35
dOntario exceptional access program. Accessed June 2024.36
Appendix 2: Submission Quality
Please note that this appendix has not been copy-edited.
Description | Yes or no | Comments |
|---|---|---|
Population is relevant, with no critical intervention missing, and no relevant outcome missing | No | Refer to CDA-AMC critical appraisal on relevant comparators. Due to an absence of evidence comparative efficacy vs. some comparators could not be determined. |
Model has been adequately programmed and has sufficient face validity | No | Refer to CDA-AMC critical appraisal. The model relied extensively on IFERROR functions. |
Model structure is adequate for decision problem | No | Refer to CDA-AMC critical appraisal on model structure. Relative to other models in this space the approach to estimating long-term OS is limited and the impact of subsequent therapy costs could not be adequately measured. |
Data incorporation into the model has been done adequately (e.g., parameters for probabilistic analysis) | Yes | No comment. |
Parameter and structural uncertainty were adequately assessed; analyses were adequate to inform the decision problem | No | Refer to CDA-AMC critical appraisal on model structure. Uncertainty regarding long-term extrapolation of OS relied exclusively on data from the CARTITUDE-4 trial and did not account for the impact of subsequent therapies. |
The submission was well organized and complete; the information was easy to locate (clear and transparent reporting; technical documentation available in enough details) | Yes | No comment. |
CDA-AMC = Canada’s Drug Agency.
Appendix 3: Additional Information on the Submitted Economic Evaluation
Please note that this appendix has not been copy-edited.
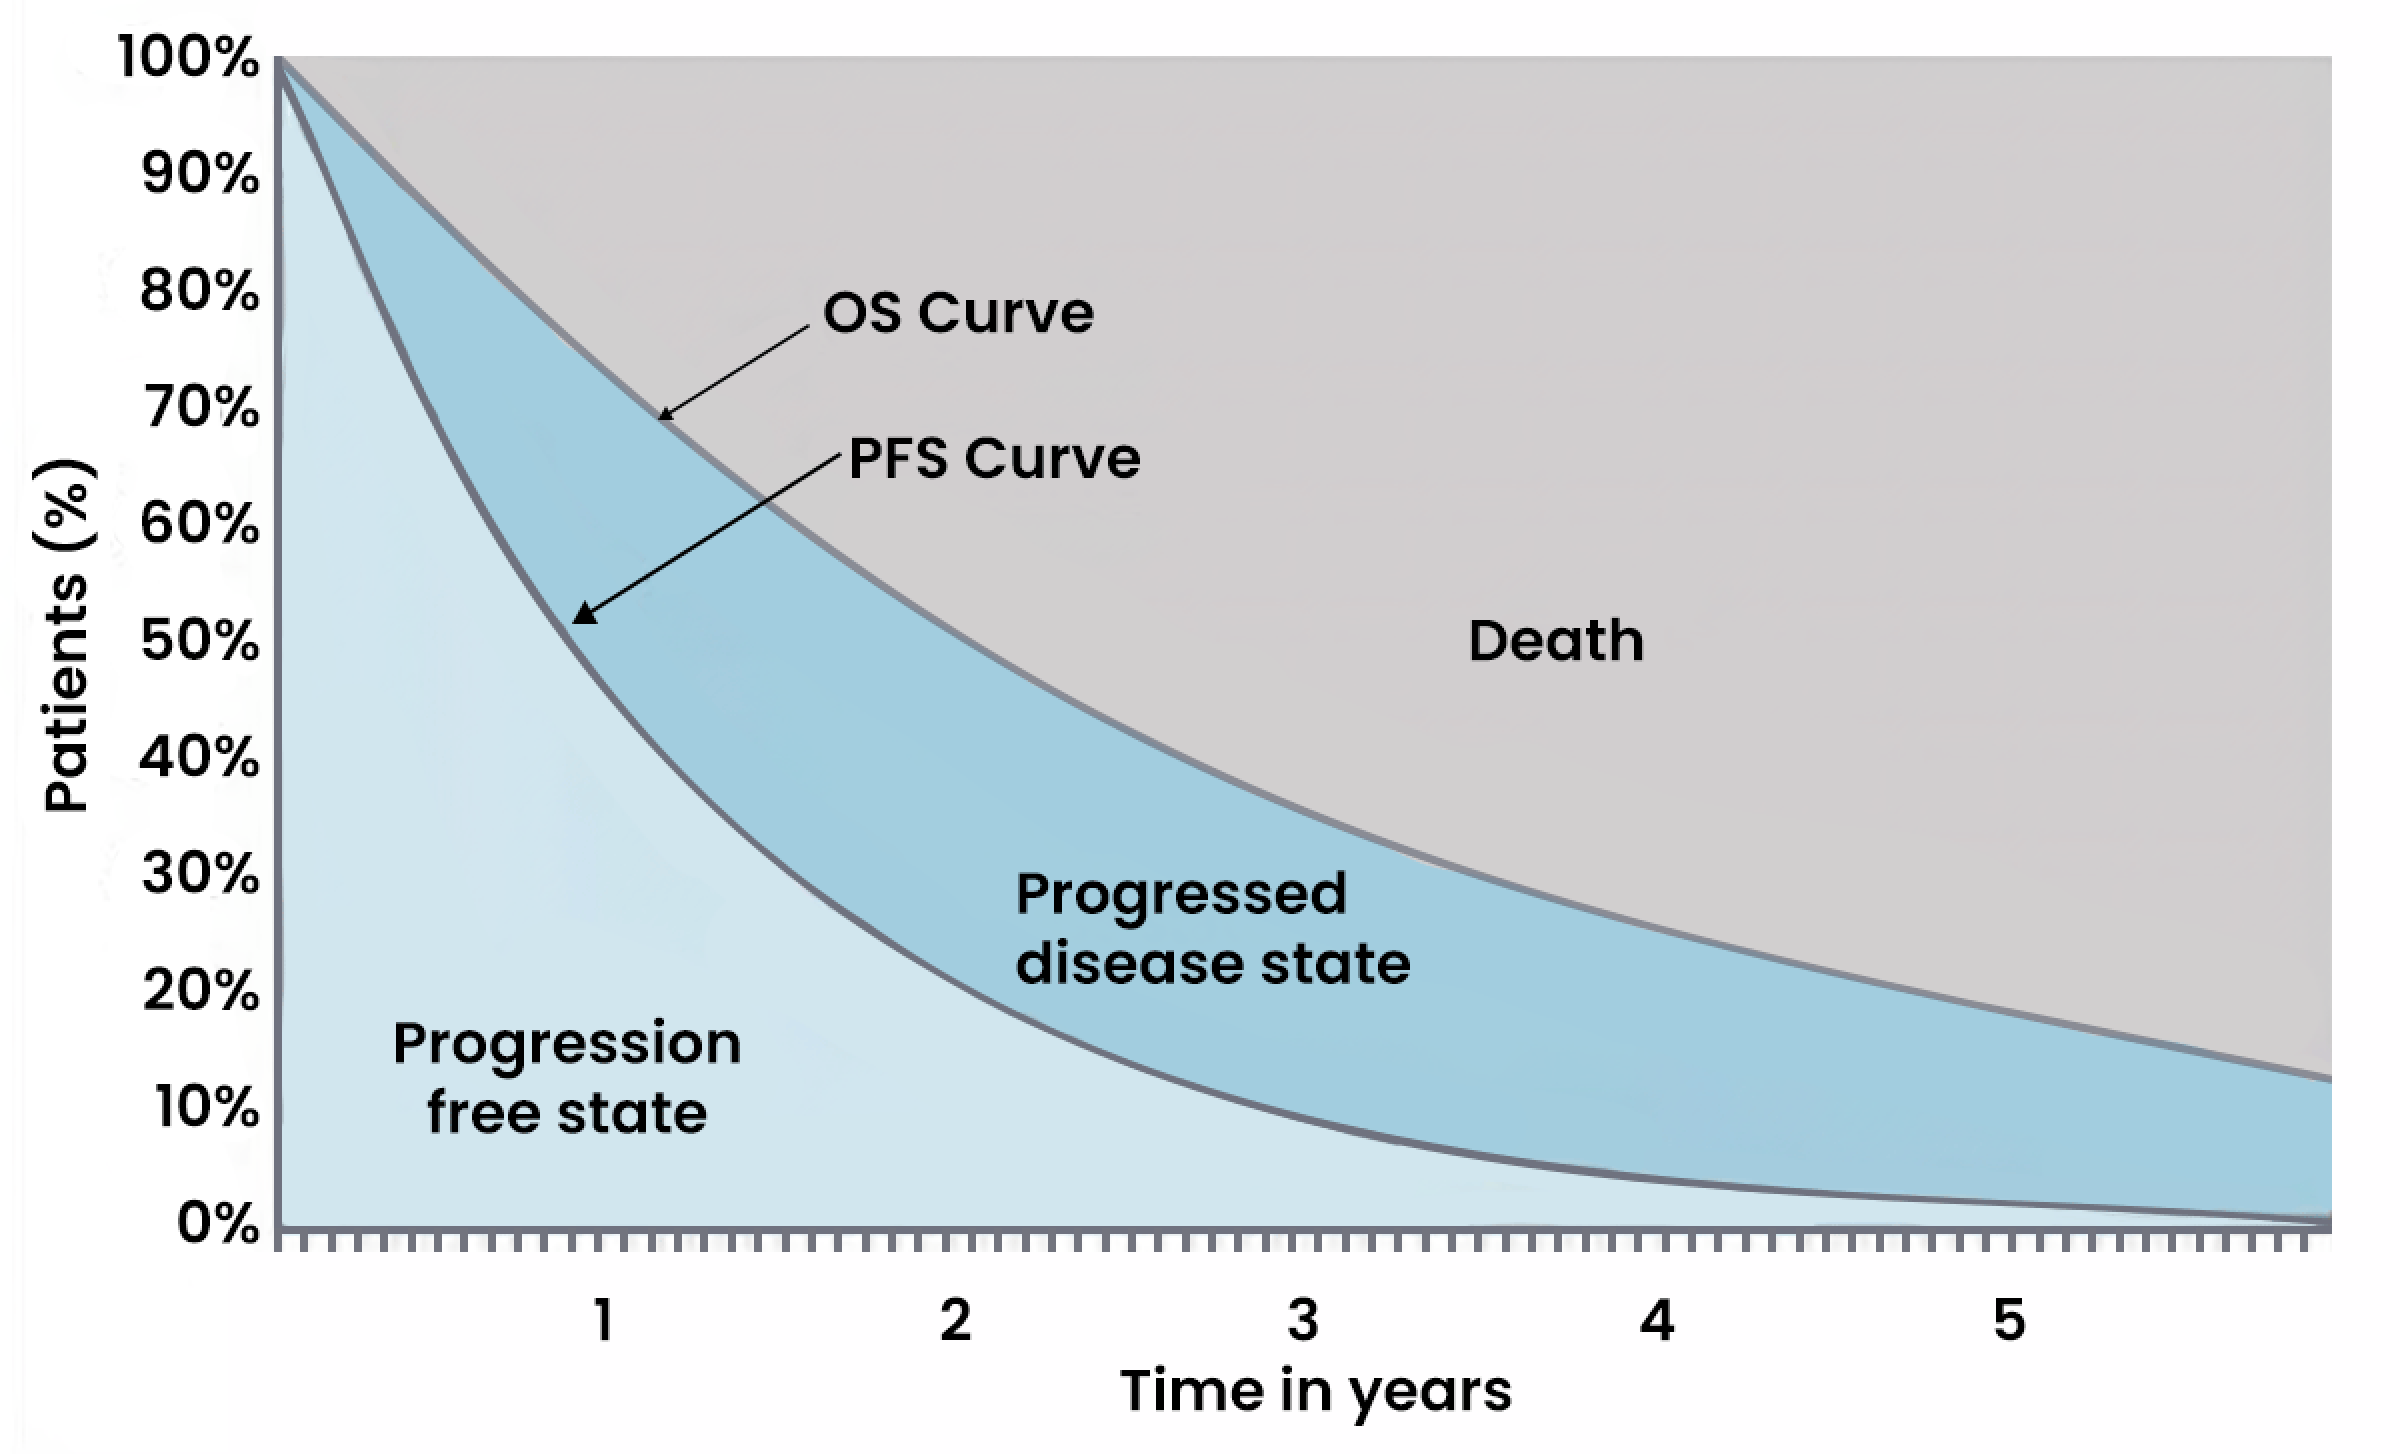
OS = overall survival; PFS = progression-free survival.
Source: Sponsor’s pharmacoeconomic submission.2
Figure 2: Sponsor’s Extrapolation of PFS and OS
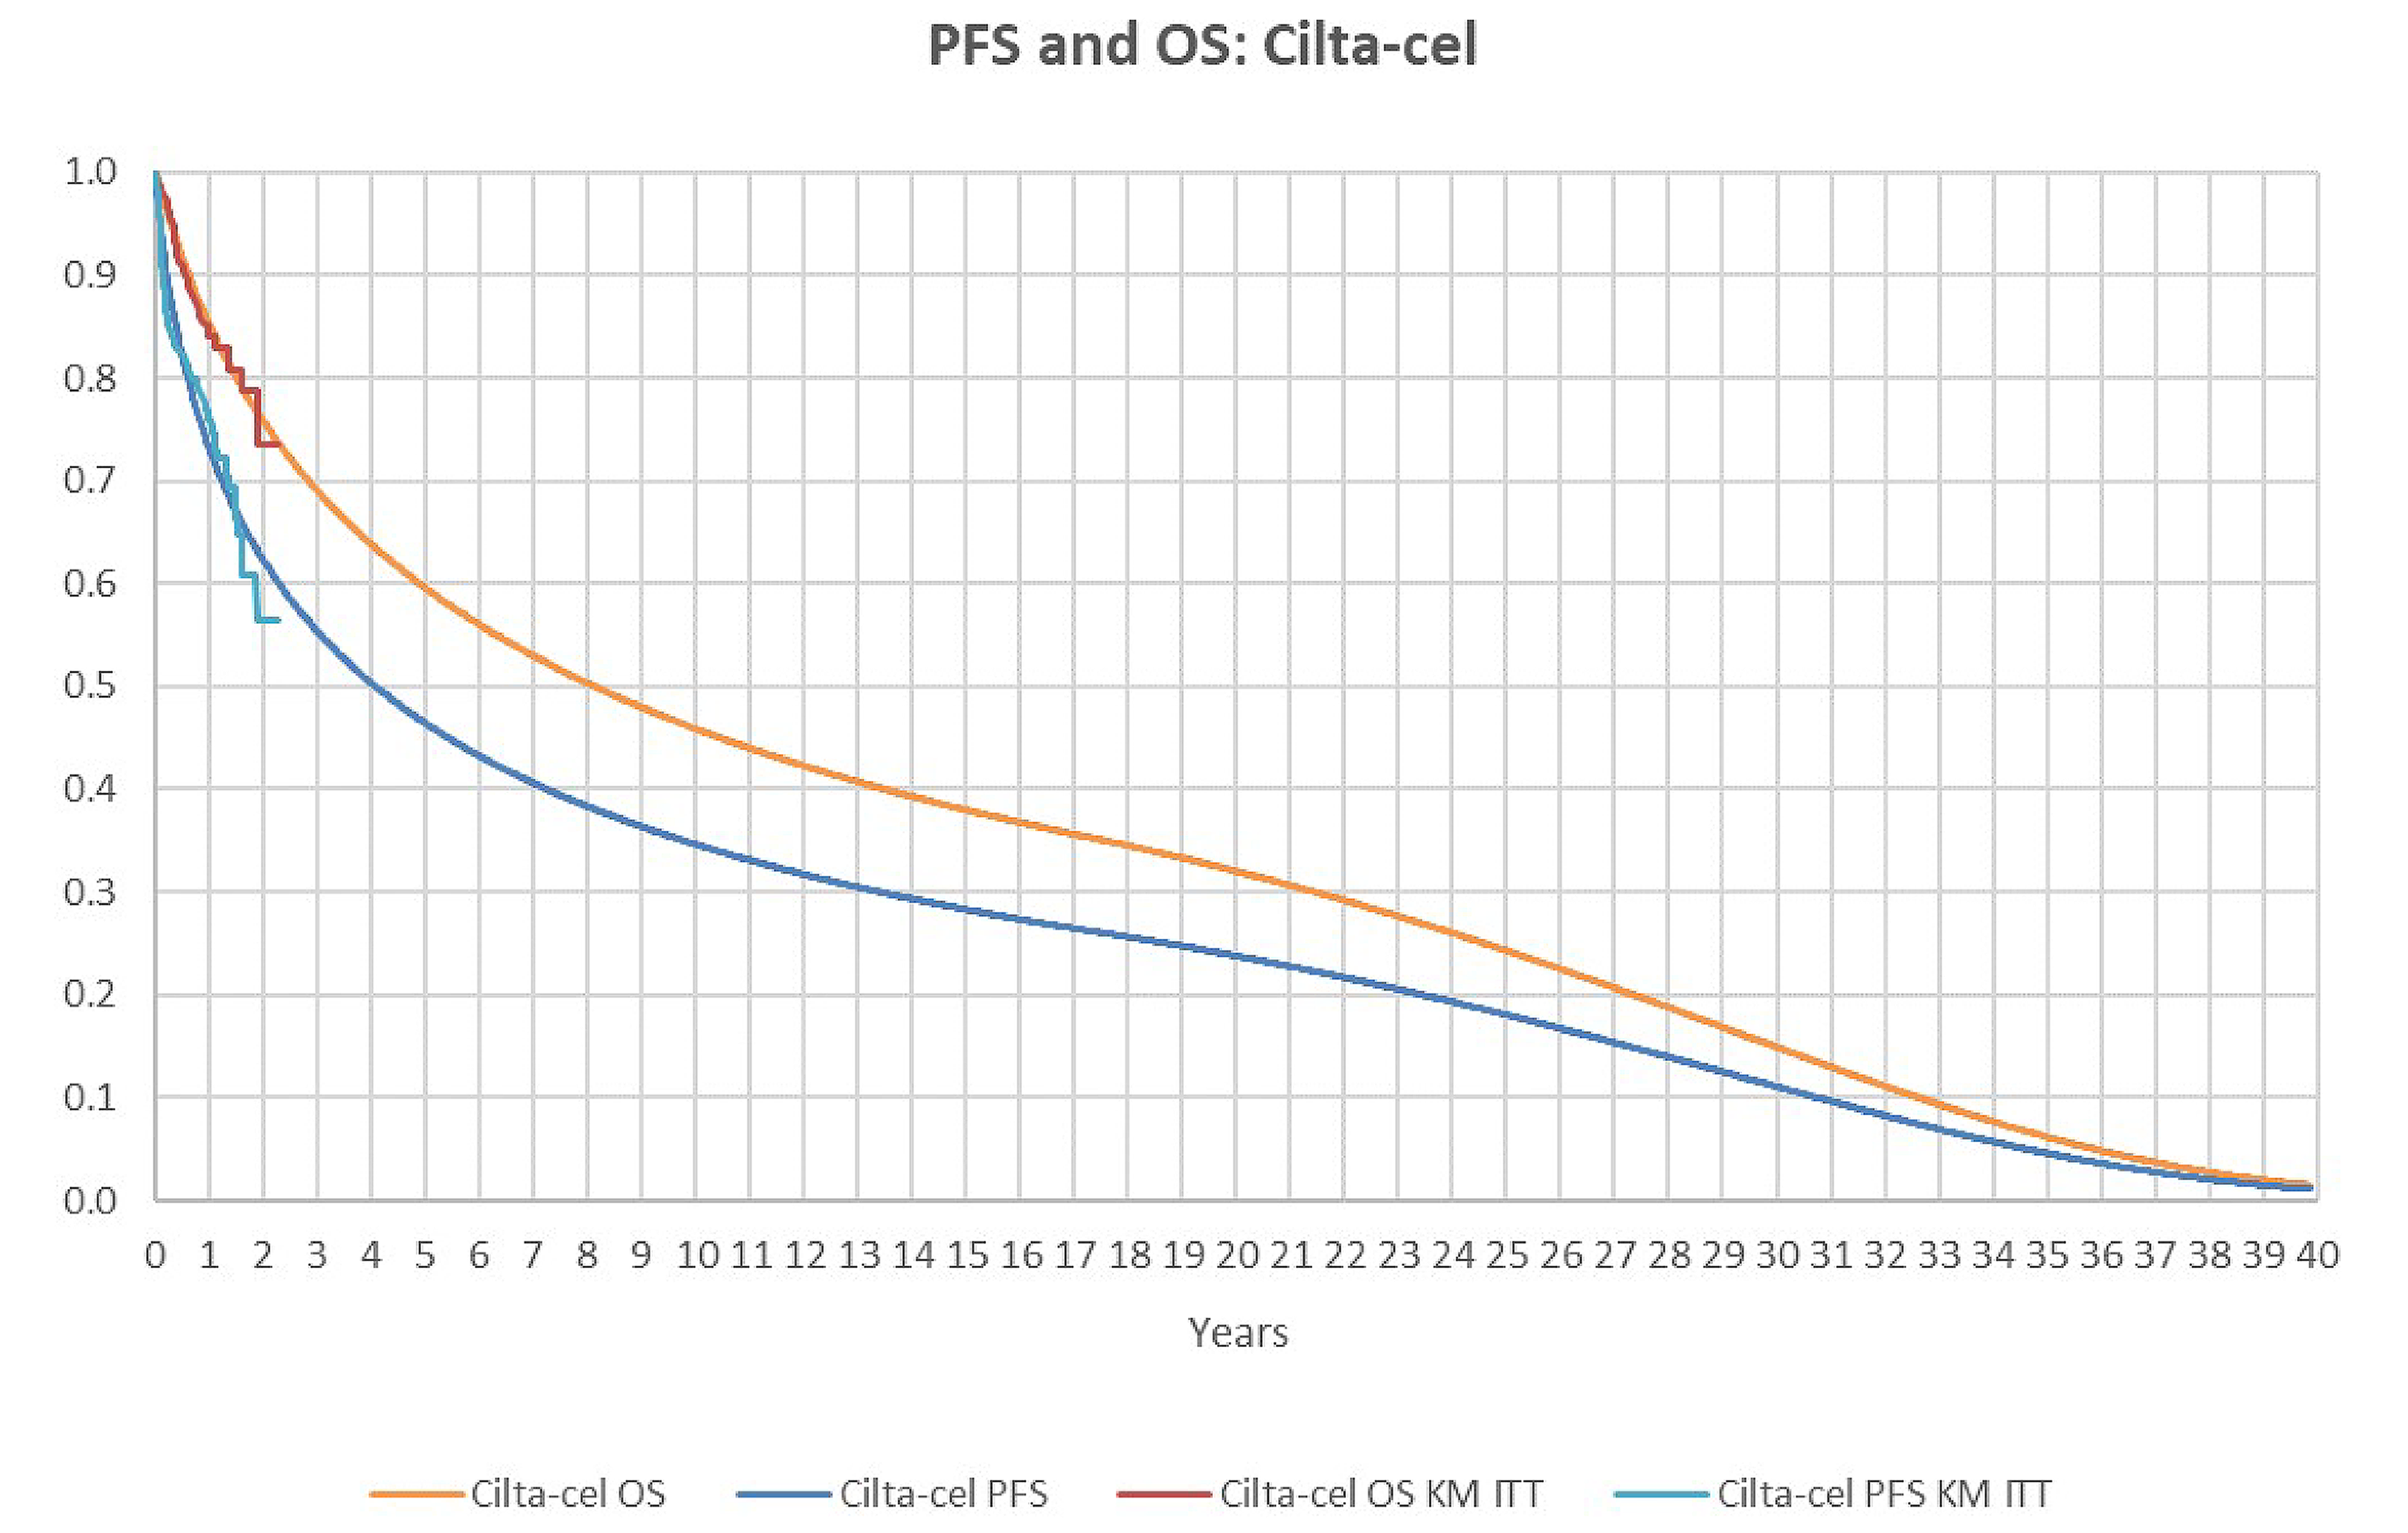
Cilta-cel = ciltacabtagene autoleucel; ITT = intention to treat; KM = Kaplan-Meier; OS = overall survival; PFS = progression free survival.
Source: Sponsor’s pharmacoeconomic submission.2
Detailed Results of the Sponsor’s Base Case
Table 10: Summary of the Sponsor’s Base-Case Analysis Curve Selections for Comparators
Intervention | ITC analysis | Curve selection | |
|---|---|---|---|
OS | PFS | ||
Kd | IPTW | Weibull | Weibull |
Pd | IPTW | Gamma | Log normal |
IsaPd | MAIC | HR-based approach | HR-based approach |
Vd | PTW | Weibull | Weibull |
DVd | IPTW | Exponential | Log logistic |
SVd | MAIC | HR-based approach | HR-based approach |
DVd = daratumumab plus bortezomib and dexamethasone; HR = hazard ratio; IPTW = inverse probability of treatment weighting; IsaPd = isatuximab plus pomalidomide plus dexamethasone; Kd = carfilzomib and dexamethasone; MAIC = matched adjusted indirect comparison; Pd = pomalidomide and dexamethasone; Vd = bortezomib and dexamethasone.
Source: Sponsor’s pharmacoeconomic submission.2
Table 11: Disaggregated Summary of the Sponsor’s Economic Evaluation Results
Parameter | Cilta-cel | Kd | DVd | IsaPd | Pd | SVd | Vd |
|---|---|---|---|---|---|---|---|
Discounted LYs | |||||||
Total | 10.88 | 3.92 | 3.31 | 6.46 | 2.27 | 6.59 | 3.51 |
PFS | 8.30 | 1.10 | 1.22 | 1.81 | 0.96 | 2.84 | 0.52 |
PPS | 2.58 | 2.83 | 2.08 | 4.65 | 1.30 | 3.75 | 2.99 |
Discounted QALYs | |||||||
Total | 7.95 | 2.70 | 2.30 | 4.45 | 1.59 | 4.62 | 2.37 |
PFS | 6.24 | 0.82 | 0.92 | 1.36 | 0.72 | 2.14 | 0.39 |
PPS | 1.71 | 1.88 | 1.39 | 3.09 | 0.87 | 2.49 | 1.99 |
Disutility | –0.010 | –0.003 | –0.004 | –0.005 | –0.004 | –0.005 | –0.003 |
Discounted costs ($) | |||||||
Total | 814,889 | 585,732 | 507,983 | 818,971 | 397,911 | 839,898 | 425,573 |
Preprogression | |||||||
CAR T-cell therapy cost | 625,730 | — | — | — | — | — | — |
Non–CAR T-cell therapy drug | — | 243,067 | 225,347 | 520,816 | 113,575 | 581,831 | 51,600 |
Non–CAR T-cell therapy admin | — | 6,484 | 5,757 | 3,699 | — | 8,926 | 2,743 |
Follow-up | 31,519 | 6,390 | 7,121 | 10,550 | 5,605 | 16,569 | 3,008 |
AE | 30,188 | 11,480 | 11,054 | 13,028 | 12,196 | 11,275 | 7,384 |
Postprogression | |||||||
Follow-up | 15,235 | 16,481 | 12,143 | 27,120 | 7,601 | 21,831 | 17,432 |
Subsequent treatment | 65,788 | 249,202 | 193,409 | 193,410 | 204,916 | 149,227 | 290,419 |
End of life | 46,430 | 52,628 | 53,152 | 50,349 | 54,018 | 50,238 | 52,986 |
AE = adverse event; CAR = chimeric antigen receptor; cilta-cel = ciltacabtagene autoleucel; DVd = daratumumab-bortezomib-dexamethasone; Kd = carfilzomib-dexamethasone; IsaPd = isatuximab-pomalidomide-dexamethasone; LY = life-year; Pd = pomalidomide-dexamethasone; PFS = progression-free survival; PPS = postprogression survival; QALY = quality-adjusted life-year; SVd = selinexor-bortezomib-dexamethasone; Vd = bortezomib-dexamethasone.
Source: Sponsor’s pharmacoeconomic submission.2
Appendix 4: Additional Details on the CDA-AMC Reanalyses and Sensitivity Analyses of the Economic Evaluation
Please note that this appendix has not been copy-edited.
Detailed Results of CDA-AMC Base Case
Figure 3: Extrapolation of OS and PFS in CDA-AMC Reanalyses
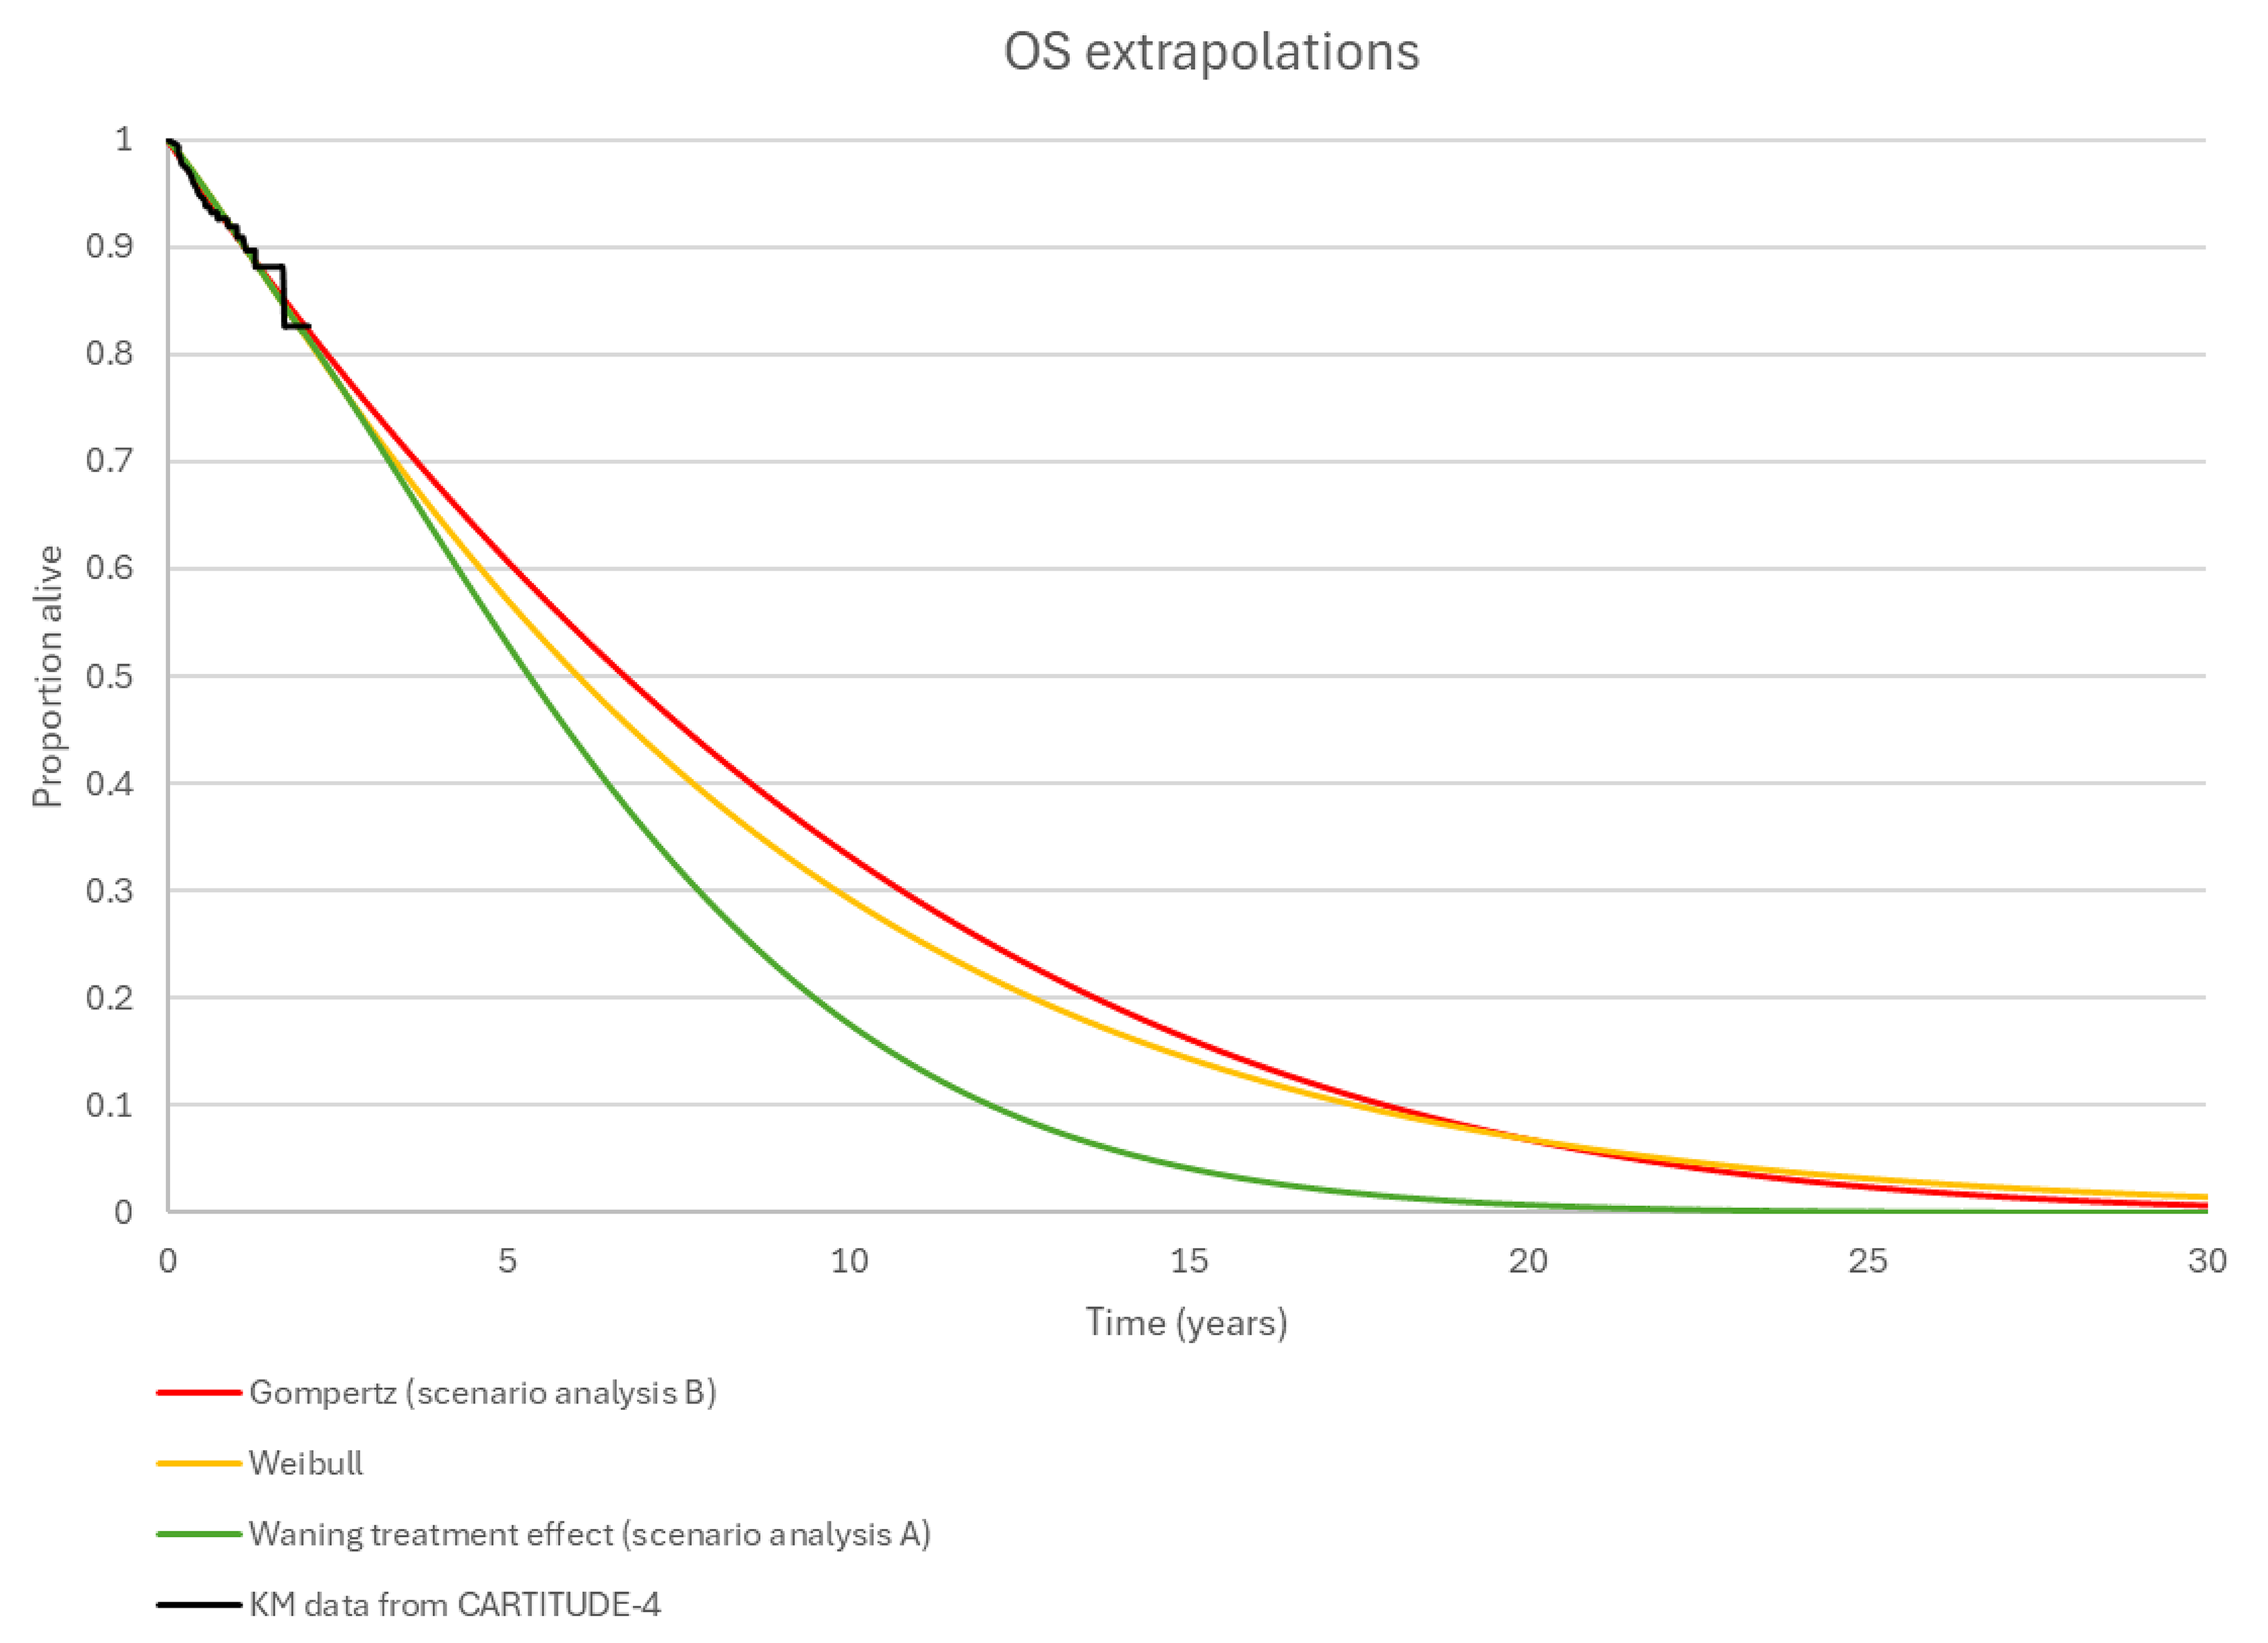
CDA-AMC = Canada’s Drug Agency; KM = Kaplan-Meier; OS = overall survival.
Source: Sponsor’s pharmacoeconomic submission.2
Figure 4: Percentage of the Cohort That Are Progression-Free Over time (Years)
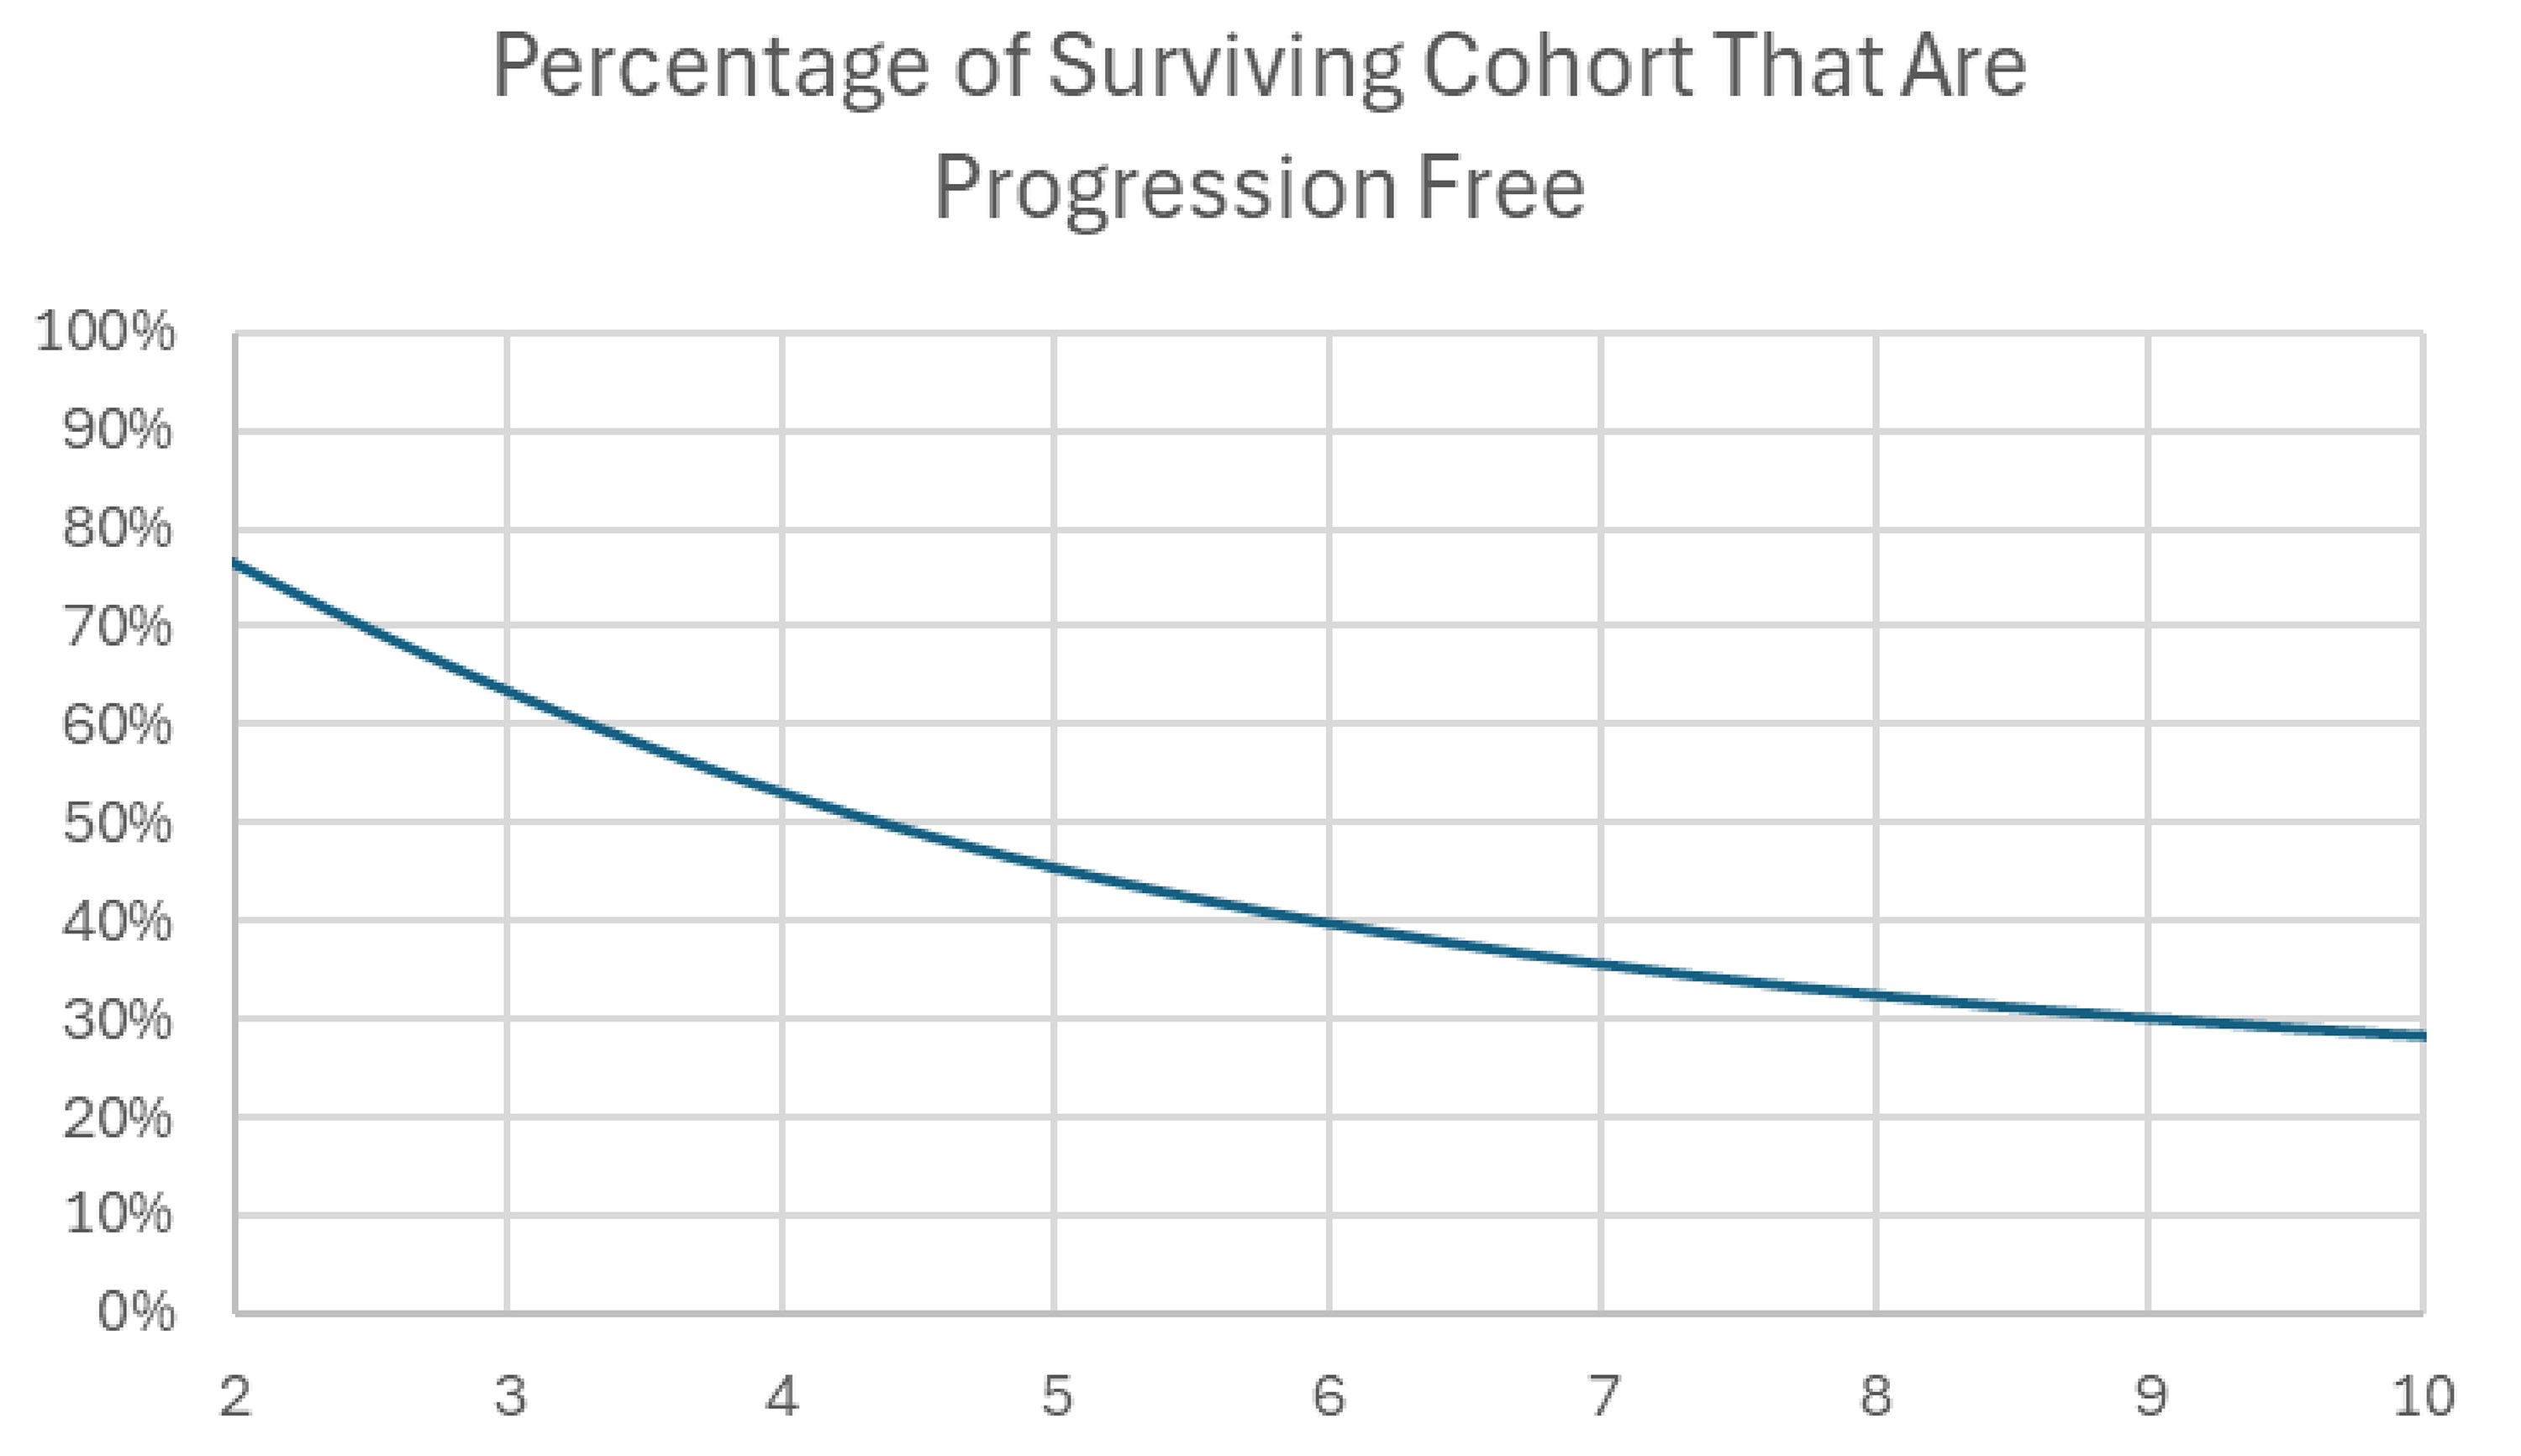
Source: Sponsor’s pharmacoeconomic submission.2
Table 12: Summary of the Stepped Analysis of the CDA-AMC Base-Case Results
Stepped analysis | Drug | Total costs ($) | Total QALYs | Sequential ICER ($/QALY) |
|---|---|---|---|---|
Sponsor base case (probabilistic) | Pd | 397,911 | 1.587 | Reference |
Vd | 425,573 | 2.375 | 35,101 | |
Cilta-cel | 814,889 | 7.947 | 69,861 | |
Dominated treatments | ||||
DVd | 507,983 | 2.300 | Dominated by Vd | |
Kd | 585,732 | 2.702 | Extendedly dominated by cilta-cel | |
CDA-AMC reanalysis 1 (model structure) | Pd | 397,295 | 1.581 | Reference |
Vd | 423,406 | 2.350 | 33,956 | |
Cilta-cel | 883,663 | 5.687 | 137,940 | |
Dominated treatments | ||||
DVd | 507,807 | 2.277 | Dominated by Vd | |
Kd | 584,030 | 2.604 | Extendedly dominated by cilta-cel | |
CDA-AMC reanalysis 2 (subsequent therapy cost) | Vd | 134,345 | 2.350 | Reference |
Cilta-cel | 749,474 | 8.139 | 106,265 | |
Dominated treatments | ||||
Pd | 193,332 | 1.581 | Dominated by Vd | |
DVd | 314,284 | 2.277 | Dominated by Vd | |
Kd | 332,215 | 2.604 | Extendedly dominated by cilta-cel | |
CDA-AMC reanalysis 3 (reimbursement of OOS products) | Pd | 397,295 | 1.581 | Reference |
Vd | 423,406 | 2.350 | 33,956 | |
Cilta-cel | 832,911 | 8.139 | 70,743 | |
Dominated treatments | ||||
DVd | 507,807 | 2.277 | Dominated by Vd | |
Kd | 584,030 | 2.604 | Extendedly dominated by cilta-cel | |
CDA-AMC reanalysis 4 (price of pomalidomide and bortezomib) | Pd | 293,016 | 1.581 | Reference |
Cilta-cel | 795,718 | 8.139 | 76,660 | |
Dominated treatments | ||||
Vd | 361,898 | 2.350 | Extendedly Dominated by cilta-cel | |
DVd | 462,889 | 2.277 | Dominated by Vd | |
Kd | 554,028 | 2.604 | Extendedly Dominated by cilta-cel | |
CDA-AMC reanalysis 5 (dosing schedule of Kd) | Pd | 397,295 | 1.581 | Reference |
Vd | 423,406 | 2.350 | 33,956 | |
Cilta-cel | 811,015 | 8.139 | 66,961 | |
Dominated treatments | ||||
Kd | 461,219 | 2.604 | Extendedly dominated by cilta-cel | |
DVd | 507,807 | 2.277 | Dominated by Vd, Kd | |
CDA-AMC reanalysis 6 (cilta-cel OS [Weibull] and PFS [loglogistic]) | Pd | 397,295 | 1.581 | Reference |
Vd | 423,406 | 2.350 | 33,956 | |
Cilta-cel | 784,095 | 4.941 | 139,195 | |
Dominated treatments | ||||
DVd | 507,807 | 2.277 | Dominated by Vd | |
Kd | 584,030 | 2.604 | Extendedly dominated by cilta-cel | |
CDA-AMC reanalysis (deterministic) (reanalyses 1 + 2 + 3 + 4 + 5 + 6) | Vd | 107,276 | 2.350 | Reference |
Cilta-cel | 746,418 | 4.624 | 281,032 | |
Dominated treatments | ||||
Pd | 113,353 | 1.581 | Dominated by Vd | |
Kd | 209,404 | 2.604 | Extendedly dominated by Cilta-cel | |
DVd | 292,422 | 2.277 | Dominated by Vd, Kd | |
CDA-AMC reanalysis (probabilistic) (reanalyses 1 + 2 + 3 + 4 + 5 + 6) | Vd | 107,774 | 2.375 | Reference |
Cilta-cel | 746,870 | 4.650 | 280,871 | |
Dominated treatments | ||||
Pd | 113,284 | 1.587 | Dominated by Vd | |
Kd | 211,930 | 2.702 | Extendedly dominated by Cilta-cel | |
DVd | 292,871 | 2.300 | Dominated by Vd, Kd | |
CDA-AMC = Canada’s Drug Agency; cilta-cel = ciltacabtagene autoleucel; DVd = daratumumab-bortezomib-dexamethasone; ICER = incremental cost-effectiveness ratio; Kd = carfilzomib-dexamethasone; OOS = out of specification; OS = overall survival; Pd = pomalidomide-dexamethasone; PFS = progression-free survival; QALY = quality-adjusted life-year; Vd = bortezomib-dexamethasone.
Note: The CDA-AMC reanalysis is based on publicly available prices of the comparator treatments. The results of all steps are presented deterministically unless otherwise indicated, while the cumulative CDA-AMC base case is always presented both deterministically and probabilistically.
Table 13: Disaggregated Summary of CDA-AMC Economic Evaluation Results
Parameter | Cilta-cel | Kd | DVd | Pd | Vd |
|---|---|---|---|---|---|
Discounted LYs | |||||
Total | 6.54 | 3.92 | 3.31 | 2.27 | 3.51 |
PFS | 3.71 | 1.10 | 1.22 | 0.96 | 0.52 |
PPS | 2.82 | 2.83 | 2.08 | 1.30 | 2.99 |
Discounted QALYs | |||||
Total | 4.65 | 2.70 | 2.30 | 1.59 | 2.37 |
PFS | 2.78 | 0.82 | 0.92 | 0.72 | 0.39 |
PPS | 1.88 | 1.88 | 1.39 | 0.87 | 1.99 |
Disutility | –0.010 | –0.003 | –0.004 | –0.004 | –0.003 |
Discounted costs ($) | |||||
Total | 746,870 | 211,930 | 292,871 | 113,284 | 107,774 |
Preprogression | |||||
CAR T-cell therapy cost | 635,148 | — | — | — | — |
Non–CAR T-cell therapy drug | — | 121,708 | 203,644 | 33,864 | 24,221 |
Non–CAR T-cell therapy admin | — | 3,242 | 5,757 | — | 2,743 |
Follow-up | 15,427 | 6,390 | 7,121 | 5,605 | 3,008 |
AE | 30,188 | 11,480 | 11,054 | 12,196 | 7,384 |
Postprogression | |||||
Follow-up | 15,722 | 16,481 | 12,143 | 7,601 | 17,432 |
Subsequent treatment | — | — | — | — | — |
End of life | 50,385 | 52,628 | 53,152 | 54,018 | 52,986 |
Pairwise ICER vs. cilta-cel | |||||
ICER ($ per QALY gained) | Reference | 274,578 | 193,189 | 206,820 | 280,871 |
AE = adverse event; CAR = chimeric antigen receptor; CDA-AMC = Canada’s Drug Agency; cilta-cel = ciltacabtagene autoleucel; DVd = daratumumab-bortezomib-dexamethasone; Kd = carfilzomib-dexamethasone; LY = life-year; Pd = pomalidomide-dexamethasone; PFS = progression-free survival; PPS = postprogression survival; QALY = quality-adjusted life-year; Vd = bortezomib-dexamethasone.
Scenario Analyses
Table 14: Summary of the CDA-AMC Scenario Analyses
Scenario analysis | Drug | Total costs ($) | Total QALYs | Sequential ICER ($/QALY) |
|---|---|---|---|---|
CDA-AMC Scenario: Reanalysis A – PFS = Weibull OS = Weibull for the first 2 years; a function of PFS (HR = 0.3) after 2 years | Vd | 107,774 | 2.375 | Reference |
Kd | 211,930 | 2.702 | 318,341 | |
Cilta-cel | 743,439 | 3.751 | 506,778 | |
Dominated treatments | ||||
Pd | 113,284 | 1.587 | Dominated by Vd | |
DVd | 292,871 | 2.300 | Dominated by Vd, Kd | |
CDA-AMC Scenario Reanalysis B: PFS = loglogistic Gompertz for cilta-cel OS | Vd | 107,774 | 2.375 | Reference |
Cilta-cel | 757,350 | 5.944 | 182,011 | |
Dominated treatments | ||||
Pd | 113,284 | 1.587 | Dominated by Vd | |
Kd | 211,930 | 2.702 | Extendedly dominated by cilta-cel | |
DVd | 292,871 | 2.300 | Dominated by Vd, Kd | |
CDA-AMC Scenario: Reanalysis – cilta-cel vs. SVda | SVd | 416,052 | 3.19 | Reference |
Cilta-cel | 746,870 | 4.65 | 280,871 | |
CDA-AMC Scenario: Reanalysis – cilta-cel vs. IsaPda | IsaPd | 401,989 | 3.11 | Reference |
Cilta-cel | 746,870 | 4.65 | 224,019 | |
CDA-AMC = Canada’s Drug Agency; cilta-cel = ciltacabtagene autoleucel; DVd = daratumumab-bortezomib-dexamethasone; IsaPd = isatuximab-pomalidomide-dexamethasone; Kd = carfilzomib-dexamethasone; OS = overall survival; Pd = pomalidomide-dexamethasone; QALY = quality-adjusted life-year; SVd = selinexor-bortezomib-dexamethasone; Vd = bortezomib-dexamethasone; vs. = versus.
aResults reported as a pairwise analysis as sequential analysis were not feasible for these comparators as they were based on the MAIC results. Hazard ratios used in these analyses were based on the full intention-to-treat population; however, the hazard ratios were only applied to those who received cilta-cel. This therefore underestimates the benefit of cilta-cel vs. these treatments.
Appendix 5: Submitted Budget Impact Analysis and CDA-AMC Appraisal
Please note that this appendix has not been copy-edited.
Table 15: Summary of Key Take-Aways
Key take-aways of the budget impact analysis |
|---|
|
Summary of Sponsor’s Budget Impact Analysis
The sponsor submitted a budget impact analysis (BIA) to estimate the 3-year budget impact of reimbursing cilta-cel for the treatment of adult patients with MM, who have received 1 to 3 prior lines of therapy, including a proteasome inhibitor and an immunomodulatory agent, and who are refractory to lenalidomide. The analysis was taken from the perspective of the Canadian public drug plan. A 3-year time horizon was used from 2025 to 2027, with 2024 as the base year. The target population size was derived with an epidemiological approach, considering prevalent cases of MM in Canada. Key inputs to the BIA are documented in Table 17.
The BIA compared 2 scenarios to determine the incremental budget impact of reimbursing cilta-cel. The reference case scenario assumed that patients could receive DVd, SVd, IsaKd, IsaPd, Kd, Pd, or Vd. The new drug scenario included cilta-cel. In the sponsor’s base case, costs related to drug acquisition were considered. Vial wastage was included.
State the key assumptions:
Annual transition rates across each line of therapy from McCurdy et al., 2023 were incorporated to account for patient attrition.24
CAR T-cell therapy eligibility was defined as patients having ECOG criteria of 0 to 1.
Median treatment duration as informed by respective clinical studies, was used to estimate the annual cost of non–CAR T-cell therapies.
Table 16: Summary of Key Model Parameters
Parameter | Sponsor’s estimate (reported as year 1 / year 2 / year 3 if appropriate) |
|---|---|
Target population | |
MM prevalence Baseline distribution into 1L % Remaining in 1L % transition from 1L to 2L % of attrition (from 1L) Baseline distribution into 2L % Remaining in 1L % transition from 1L to 2L % of attrition (from 1L) Baseline distribution into 3L % Remaining in 1L % transition from 1L to 2L % of attrition (from 1L) Baseline distribution into 4L % Remaining in 1L % transition from 1L to 2L % of attrition (from 1L) Lenalidomide refractory CAR T-cell therapy eligible | 0.04%37 42%24 72%24 21%24 7%24 24%24 42%24 32%24 26%24 15%24 23%24 48%24 29%24 9%24 70%38 64%39 |
Number of patients eligible for drug under review | 2,893 / 2,551 / 2,518 |
Market uptake (3 years) | |
Uptake (reference scenario) Cilta-cel DVd SVd IsaKd IsaPd Kd Pd Vd | 0% / 0% / 0% 7% / 6% / 5% 12% / 14% / 15% 21% / 23% / 25% 13% / 15% / 18% 21% / 20% / 16% 19% / 18% / 18% 7% / 4% / 3% |
Uptake (new drug scenario) Cilta-cel DVd SVd IsaKd IsaPd Kd Pd Vd | ██ █ ██ █ ██ ██ █ ██ █ ██ ██ █ ██ █ ██ ██ █ ██ █ ██ ██ █ ██ █ ██ ██ █ ██ █ ██ ██ █ ██ █ ██ ██ █ ██ |
Cost of treatment (per patient, per median duration as informed by respective clinical trials) | |
Cilta-cel DVd SVd IsaKd IsaPd Kd Pd Vd | $632,455 $214,903 $155,145 $402,979 $236,356 $159,000 $53,696 $35,231 |
1L = first line; 2L = second line; 3L = third line; 4L = fourth line; CAR = chimeric antigen receptor; cilta-cel = ciltacabtagene autoleucel; DVd = daratumumab-bortezomib-dexamethasone; Kd = carfilzomib-dexamethasone; IsaKd = isatuximab-carfilzomib-dexamethasone; IsaPd = isatuximab-pomalidomide-dexamethasone; MM = multiple myeloma; Pd = pomalidomide-dexamethasone; SVd = selinexor-bortezomib-dexamethasone; Vd = bortezomib = dexamethasone.
Summary of the Sponsor’s BIA Results
In the sponsor’s base-case analysis, the estimated incremental budget impact of funding cilta-cel for the treatment of adult patients with MM, who have received 1 to 3 prior lines of therapy, including a proteasome inhibitor and an immunomodulatory agent, and who are refractory to lenalidomide was $144,597,951 in year 1, $71,071,114 in year 2, and –$9,412,855 in year 3. Therefore, the 3-year incremental budget impact was $206,256,210.
CDA-AMC Appraisal of the Sponsor’s BIA
CDA-AMC identified several key limitations to the sponsor’s analysis that have notable implications on the results of the BIA:
Uncertainty in the sponsor’s approach to calculating the BIA. The sponsor’s BIA was calculated using a prevalence-based approach. There are notable cost implications associated with a prevalence-based versus an incidence-based approach. Using a prevalence-based approach, it is conventional to assign an annual cost of therapy to the size of the cohort every year. This is under the assumption of a static population, i.e., if a patient comes off therapy (for example due to death) they are replaced with a new patient (new diagnosis). When using an incidence-based approach, the full costs of therapy incurred over the time horizon of the BIA is applied to each incident case.
A prevalence-based approach is conventional where there is an expectation that the entry of a new drug will lead to patients switching to new treatments from existing therapies. This means prevalent cases are relevant to the decision problem, not just new incident cases. Clinical expert feedback noted that there is no expectation that patients with RRMM would switch from current to new therapies unless they experienced unacceptable toxicity or progression at which point (i.e., become an incident patient). Hence, only patients who fail first-line therapy or beyond (i.e., incident cases) are relevant to the decision problem. Additionally, when assigning market shares in a prevalence-based model this details what percentage of patients will be on a given therapy at any point during the year. Whereas in an incidence-based model, market shares outline what percentage of patients start on each therapy each year. For example, if 50% of patients started on drug A and 50% started on drug B but A had a very high discontinuation rate then the market shares in a prevalence-based model would need to reflect this. In an incidence-based model discontinuation rates are captured in treatment costs. The sponsor notes that market shares are based on what treatment incident patients start on and therefore would not be accurate to use in a prevalence-based model. This would only be appropriate if time on treatment was equal among all therapies which the submitted economic analysis refutes.
Overall, a prevalence-based model imposes many strict assumptions that are problematic. Given all patients relevant to the decision problem are incident (individuals would be considered for cilta-cel at the point of progression on their prior therapy), there is no treatment switching, market shares are based on incident patients, an incident-based model is more appropriate.
Given the above reasons, CDA-AMC re-estimated the eligible patient population using an incidence-based approach. The calculations used to derive this are in Table 20. CDA-AMC extracted costs from the economic model (where the economic model was run with a 1-year, 2-year, and 3-year time horizon at a 0% discount rate) to estimate drug costs incurred for each incident case in the BIA. These costs are in Table 21.
Costs for selinexor and isatuximab based regimens are highly uncertain in the indicated patient population. Indirect evidence was either highly limited (based on matched adjusted indirect comparisons) or based on a naive comparison in the economic analysis. In a scenario analysis drug costs for selinexor and isatuximab based regimens was reduced by 25% to explore the impact. As the indicated population requires more lines of therapy and for the patient to be refractory to lenalidomide it was felt costs for these treatments may be overestimated.
The number of patients eligible for cilta-cel is uncertain. As noted, the sponsor derived the eligible patient population based on the 2018 prevalence rate estimates of MM combined with survival data and a linear projection of incidence cases from the Canadian Cancer Society. Attrition rates from McCurdy et al., 2023 were used to generate the total expected number of MM patients in 2L, 3L, and 4L.24 Based on submitted ONCO-CAPS data38 the sponsor estimated that approximately 70% of patients in the 2L to 4L setting would be refractory to lenalidomide, of which 64% of those patients would meet the ECOG criteria of 0 to1 that would allow for cilta-cel eligibility. As a result, the sponsor estimated that 2,893, 2,551, and 2,518 patients would be eligible for cilta-cel treatment in years 1, 2, and 3, respectively.
Due to the incidence-based approach adopted, CDA-AMC re-estimated the eligible patient incidence population using a different approach. CDA-AMC examined data from the Canadian Cancer Society showing that the 25-year prevalence of MM in Canada is 1 in 2,505 (or 0.04%).37 However, data from the Canadian Cancer Society shows that since 2018 incidence rates for MM have exceeded that of general population. Likewise, approval of new therapies in this space, such as daratumumab have extended survival. Both of these factors will increase the prevalence rate in 2024 relative to 2018.
To estimate how many patients would be eligible for cilta-cel each year, the number of patients who fail treatment and require a new line of therapy needed to be estimated. A Canadian-based study by McCurdy et al. (2023) analyzed retrospective cohort data from patients with newly diagnosed MM who received at least 1 line of therapy from January 1, 2010, to December 31, 2020.24 McCurdy et al. categorized patients by transplant eligibility status and line of therapy. They further categorized patients receiving each therapy line based on whether they (1) were actively receiving treatment or were on remission off-treatment; (2) relapsed and went on to receive subsequent therapy; (3) progressed and opted to forego subsequent therapy; (4) died; or (5) were lost to follow-up.24 Using the reported values from McCurdy et al. (2023), annual probabilities of receiving subsequent treatment were calculated. These were estimated by taking the percentage of patients who discontinued therapy over the median follow-up. This was then turned into an annual probability using the following formula:
Annual probability = 1 – EXP(LN(1 – (% who discontinued over median follow-up)) / (median follow-up))
The annual probability of discontinuation could then be estimated for each line of therapy for both transplant eligible and ineligible patients. The final calculation was to estimate what percentage of patients who discontinued went on to receive a subsequent therapy. In McCurdy et al., 4 events are given for discontinuing treatment: (1) death; (2) unknown; (3) progressed but did not receive subsequent therapy; (4) progressed and received subsequent therapy. Therefore, to estimate what percentage of patients who discontinue went on to receive subsequent therapy the following calculation was made:
(% discontinued and went on to receive subsequent treatment) / (% who discontinued for all reasons)
For illustrative purposes this is how the calculations were derived for first-line transplant eligible patients. Data from McCurdy shows that in a median follow-up time of 3.69 years, 63% have discontinued first-line therapy. The annual probability of discontinuation can therefore be calculated:
1 – EXP(LN(1 – 63%)) / 3.69 = 23.6%
This means we expect 23.6% of transplant eligible patients to discontinue therapy each year assuming this probability is constant over time. Of those that discontinue, the data shows that (47% / 63% = 75%) go on to receive a subsequent therapy. This means that each year (23.6% * 75% = 18%) of transplant eligible patients fail first-line therapy and go on to receive a subsequent therapy. This calculation was also made for 2L and 3L for both transplant eligible and ineligible patients. The McCurdy et al. (2023) study does not offer data regarding the distribution of patients beyond the third setting that are actively receiving therapy or have died. Therefore, it was assumed that the annual transition rate of patients progressing from 4L to later lines of therapy was the same as the probability seen from 3L to 4L.
To calculate what percentage of new patients are currently receiving each line of therapy, CDA-AMC used data on the distributions by line of therapy from Mian et al. (2022).13 This data shows that of the prevalent cohort diagnosed from 2007 to 2018: 42% were on their first line of treatment; 24% were on their second-line treatment; 13% were on their third line; and 18% were on forth line or later.13 This distribution was used to determine what proportion of patients would currently be receiving each line of therapy in Canada.
To determine the proportion of patients who are lenalidomide refractory, CDA-AMC used inputs informed by the sponsor’s submitted ONCO-CAPPs data which indicated that ██% and ██% of 2L and 3L+ new starts, respectively, are lenalidomide refractory.38 Finally, CDA-AMC assumed that 64% of patients would be fit enough for CAR T-cell treatment (i.e., ECOG 0 to 1), aligned with the sponsor submitted value.39
Table 19 outlines the data and sources used to derive the number of patients eligible for cilta-cel in years 1, 2, and 3.
There is uncertainty with this approach given that it may not account for recent changes to practice, such as the anticipated increase in daratumumab use in the first-line setting. Likewise, assumptions had to be made such as constant rates over time. Given this a scenario analysis was conducted that reduced the size of the eligible population by 25%.
Market share estimates for comparators are uncertain. In the sponsor’s base-case analysis, the estimated market share of comparators in the world without cilta-cel reimbursement was informed by prior Canadian HTA submission and Janssen market research. CDA-AMC noted a few limitations with the sponsor’s approach. First, market shares would vary considerably by transplant eligibility status, making the estimates difficult to validate when only presented as a weighted average. Second, clinical expert feedback received by CDA-AMC noted that the market share estimates for isatuximab based regimens appears to be high, especially when considering that IsaPd is not anticipated to experience significant use in later lines of therapy given most patients are not retreated with an anti-CD38 therapy. Most patients who are transplant ineligible will receive daratumumab in the first of second line and therefore not receive isatuximab in a later line.
Given the above limitation values, CDA-AMC re-estimated market shares based on clinical expert feedback by first estimating separate market shares for the transplant eligible and transplant ineligible population before deriving a weighted average to inform the model. The proportion of patients who are transplant eligible was based on data from Mian (2022).
For transplant eligible patients, IsaKd use is predominantly expected to primarily occur in 2L (with limited use in later lines) with some growth (< 10%) over the next few years at the expensive of other available therapies. It was therefore estimated that IsaKd use would be 20% in transplant eligible patients. Clinical expert feedback noted that IsaPd use would be limited (approximately 5%).
For the transplant ineligible population, due to high likelihood of patient exposure to anti-CD38 treatment (isatuximab or daratumumab) by 3L treatment, IsaKd and IsaPd use is expected to be substantially limited (5% and 1% respectively). The reduction is IsaKd and IsaPd market share was redistributed to all remaining regimens.
Lastly clinical expert feedback noted that SVd use may increase marginally in both groups over time.
Subsequent therapy costs could not be accurately estimated: To estimate subsequent therapy costs for each comparator multiple factors need to be addressed. First, transplant status and prior lines of therapies are needed to understand what therapies come next. Second, time spent on subsequent therapies is needed. Finally, patients would need to be tracked across the entire MM treatment pathway. Estimation of these costs requires a more sophisticated analysis as they will be influenced by cilta-cel’s place in therapy. In the short term, fewer patients who receive cilta-cel will likely require subsequent therapy as it delays progression. This will reduce the budget impact. However, patients who fail cilta-cel may go on to receive higher cost therapies, such as isatuximab based regimens, whereas individuals who fail isatuximab regimens will likely not be retreated with an anti-CD38. This would increase the budget impact.
The impact that subsequent therapies have on the budget impact is uncertain. In the short run the reduction in subsequent therapy use may decrease the budget impact, however this will depend on how cilta-cel changes the treatment pathway. Overall, the introduction of cilta-cel may increase the costs associated with the full treatment pathway if it does not displace therapies but rather shifts them to later in the treatment algorithm. The submitted analysis is not sophisticated enough to explore the impact this may have.
CAR T-cell therapy capacity and cilta-cel market uptake is associated with uncertainty. In the sponsor’s base-case analysis, the estimated market share of cilta-cel was ██%, ██%, and ██% of patients in year 1, year 2, and year 3, respectively. The sponsor noted that these market share values incorporated anticipated institutional and manufacturing constraints associated with CAR T-cell therapy administration therefore implying a larger proportion of patient would be expected to receive cilta-cel should capacity constraints not be an issue. Clinical expert feedback received by CDA-AMC noted that in a world without capacity constraint considerations, they would expect a much larger market uptake of cilta-cel, perhaps upwards of 80%. In the long-term, capacity constraints in Canada are uncertain as the use of CAR T-cell therapy continues to grow.
In the absence of more robust estimate, CDA-AMC was unable to address this limitation. However, should capacity for CAR T-cell therapies increase this would increase the budget impact of reimbursing cilta-cel. A more sophisticated BIA would be required to explore the impact of uptake reaching these levels as it would have a substantial impact on the proportion of patients seeking new therapies each year.
CDA-AMC Reanalyses of the BIA
Table 17: CDA-AMC Revisions to the Submitted Budget Impact Analysis
Changes | Sponsor’s value or assumption | CDA-AMC value or assumption |
|---|---|---|
Changes to derive the CDA-AMC base case | ||
Calculation of the budget impact | Prevalence-based approach | Incidence-based approach derived using prevalence |
Eligible population | Year 1: 2,893 Year 2: 2,551 Year 3: 2,518 | Year 1: 2,080 Year 2: 2,116 Year 3: 2,152 |
Drug costs | Annual costs informed from dosing schedules informed by product monographs | Costs extracted from the CUA model based on a 1-year, 2-year, or 3-year time horizon at a 0% discount rate (refer to Table 20) |
Comparator market share | DVd = 7% / 6% / 5% SVd = 12% / 14% / 15% IsaKd = 21% / 23% / 25% IsaPd = 13% / 15% / 18% Kd = 21% / 20% / 16% Pd = 19% / 18% / 18% Vd = 7% / 4% / 3% | DVd = 6% / 5% / 4% SVd = 14% / 15% / 16% IsaKd = 14% / 15% / 16% IsaPd = 3% / 4% / 5% Kd = 28% / 28% / 28% Pd = 25% / 24% / 24% Vd = 9% / 8% / 8% |
CDA-AMC base case | All above changes | |
CDA-AMC = Canada’s Drug Agency; CUA = cost-utility analysis; DVd = daratumumab-bortezomib-dexamethasone; IsaKd = isatuximab-carfilzomib-dexamethasone; IsaPd = isatuximab-pomalidomide-dexamethasone; Kd = carfilzomib-dexamethasone; Pd = pomalidomide-dexamethasone; SVd = selinexor-bortezomib-dexamethasone Vd = bortezomib-dexamethasone.
The results of the CDA-AMC reanalysis are presented in summary format in Table 18 and a more detailed breakdown is presented in Table 21. Results of the CDA-AMC reanalysis suggests that the estimated incremental budget impact of funding cilta-cel for the treatment of adult patients with MM, who have received 1 to 3 prior lines of therapy, including a proteasome inhibitor and an immunomodulatory agent, and who are refractory to lenalidomide was $129,790,049 in year 1, $166,040,215 in year 2, and $180,984,153 in year 3. Therefore, the 3-year incremental budget impact was $476,814,416.
Table 18: Summary of the CDA-AMC Reanalyses of the Budget Impact Analysis
Stepped analysis | Three-year total ($) |
|---|---|
Submitted base case | 206,256,210 |
CDA-AMC base case | 476,814,416 |
CDA-AMC = Canada’s Drug Agency.
Table 19: Derivation of Patient Population in the CDA-AMC BIA Reanalysis
Parameter | Value | Source |
|---|---|---|
Population of Canada (excluding Quebec) in 2024 | 31,757,312 | Statistics Canada, 202440 |
Population of Canada (excluding Quebec) in 2025 | 32,300,687 | Assumption; based on a population growth rate of 1.71% |
Population of Canada (excluding Quebec) in 2026 | 32,853,358 | |
Population of Canada (excluding Quebec) in 2027 | 33,415,487 | |
Prevalence of MM | 0.040% | Canadian Cancer Society, 202237 |
Adjustment to prevalence of MM for increased incidence and longer life expectancy | 0.042% | Assumption; increased 2018 prevalence by 5%. |
Percentage of patients who are ASCT eligible | 59% | Mian et al., 202213 |
Percentage of patients currently on 1L treatment for MM | ASCT eligible: 44% ASCT ineligible: N/Aa | Mian et al., 202213 |
Percentage of patients currently on 2L treatment for MM | ASCT eligible: 22% ASCT ineligible: 28% | |
Percentage of patients currently on 3L treatment for MM | ASCT eligible: 13% ASCT ineligible: 18% | |
Percentage of patients currently on 4L treatment or beyond for MM | ASCT eligible: 21% ASCT ineligible: 15% | |
Percentage of patients on 1L treatment who require subsequent treatment annually | ASCT eligible: 18% ASCT ineligible: N/Aa | McCurdy et al., 202324 |
Percentage of patients on 2L treatment who require subsequent treatment annually | ASCT eligible: 34% ASCT ineligible: 36% | |
Percentage of patients on 3L treatment who require subsequent treatment annually | ASCT eligible: 54% ASCT ineligible: 42% | |
Percentage of patients on 4L treatment or beyond who require subsequent treatment annually | ASCT eligible: 54% ASCT ineligible: 42% | Assumption (same probabilities used in 3L) |
Percentage of patients that are lenalidomide refractory | 2L = ██% 3L+ = ██% | ONCO-CAPPS38 |
Percentage of patients with an ECOG score 0 to 1 | 64% | Despiegel et al., 201939 |
Number of patients who become eligible for cilta-cel year 1 (2025) | 2,080 | Calculation: Prevalence x (% ASCT eligible) x (% ASCT eligible on 1L) x (% ASCT eligible who fail 1L each year) = number of patients who require 2L treatment each year. Prevalence x (% ASCT eligible) x (% ASCT eligible on 2L) x (% ASCT eligible who fail 2L each year) + Prevalence x (% ASCT ineligible) x (% ASCT ineligible on 2L) x (% ASCT ineligible who fail 2L each year) = number of patients who require 3L treatment each year. Prevalence x (% ASCT eligible) x (% ASCT eligible on 3L) x (% ASCT eligible who fail 3L each year) + Prevalence x (% ASCT ineligible) x (% ASCT ineligible on 3L) x (% ASCT ineligible who fail 3L each year) = number of patients who require 4L treatment each year. Prevalence x (% ASCT eligible) x (% ASCT eligible on 4L) x (% ASCT eligible who fail 4L each year) + Prevalence x (% ASCT ineligible) x (% ASCT ineligible on 4L) x (% ASCT ineligible who fail 4L each year) = number of patients who require 5L+ treatment each year. Finally, to determine cilta-cel eligibility multiply the above numbers by % who are refractory to lenalidomide and have an ECOG score (0 to 1) |
Number of patients who become eligible for cilta-cel year 2 (2026) | 2,116 | |
Number of patients who become eligible for cilta-cel year 3 (2027) | 2,152 |
1L = first line; 2L = second line; 3L = third line; 4L = fourth line; ASCT = autologous stem cell transplant; BIA = budget impact analysis; CDA-AMC = Canada’s Drug Agency; cilta-cel = ciltacabtagene autoleucel; MM = multiple myeloma; TE = transfusion eligible; TI = transfusion ineligible.
aAssumed that no transplant ineligible patients on first-line treatment would be eligible for cilta-cel after the treatment has failed as they are unlikely to be lenalidomide refractory and have received prior protostome inhibitor based on the current treatment algorithm for MM in Canada.
Table 20: Cost of Treatment in the CDA-AMC BIA Reanalysis
Treatment | Year 1 | Year 2 | Year 3 |
|---|---|---|---|
Cilta-cel | $635,083 | $0 | $0 |
DVd | $156,751 | $22,755 | $9,988 |
SVd | $152,167 | $84,844 | $42,369 |
IsaKd | $380,222 | $277,226 | $206,420 |
IsaPd | $181,499 | $76,980 | $31,402 |
Kd | $79,976 | $29,308 | $9,020 |
Pd | $21,065 | $6,825 | $3,292 |
Vd | $23,260 | $804 | $5 |
CDA-AMC = Canada’s Drug Agency; cilta-cel = ciltacabtagene autoleucel; CUA = cost-utility analysis; DVd = daratumumab-bortezomib-dexamethasone; IsaKd = isatuximab-carfilzomib-dexamethasone; IsaPd = isatuximab-pomalidomide-dexamethasone; Kd = carfilzomib-dexamethasone; Pd = pomalidomide-dexamethasone; SVd = selinexor-bortezomib-dexamethasone; Vd = bortezomib-dexamethasone.
Note: Derived from the CDA-AMC reanalysis where the economic model was run with a 1-year, 2-year, and 3-year time horizon at a 0% discount rate) to estimate drug costs incurred for each incident case in the BIA. Note cost of IsaKd was based on the sponsor’s functionally where PFS is a function of cilta-cel PFS and is associated with significant uncertainty.
CDA-AMC conducted the following scenario analyses to address remaining uncertainty, using the CDA-AMC base case (results are provided in Table 21):
Assuming a 25% reduction in the eligible patient population to account for a potential decreased rate of progression for those receiving more efficacious treatments than those received in the McCurdy study. This decreases the rate at which patients become eligible for treatment with cilta-cel.
Assuming 100% lenalidomide refractory.
Assuming a 25% reduction in the cost of IsaKd, IsaPd, and SVd.
Table 21: Detailed Breakdown of the CDA-AMC Reanalyses of the BIA
Stepped analysis | Scenario | Year 0 (current situation) ($) | Year 1 ($) | Year 2 ($) | Year 3 ($) | Three-year total ($) |
|---|---|---|---|---|---|---|
Submitted base case | Reference | 701,479,513 | 564,286,673 | 524,635,781 | 537,493,314 | 1,626,415,769 |
New drug | 701,479,513 | 708,884,624 | 595,706,895 | 528,080,459 | 1,832,671,979 | |
Budget impact | 0 | 144,597,951 | 71,071,114 | −9,412,855 | 206,256,210 | |
CDA-AMC base case | Reference | 245,850,186 | 250,057,891 | 398,885,000 | 507,112,197 | 1,156,055,088 |
New drug | 245,850,186 | 379,847,940 | 564,925,215 | 688,096,349 | 1,632,869,504 | |
Budget impact | 0 | 129,790,049 | 166,040,215 | 180,984,153 | 476,814,416 | |
CDA-AMC scenario analysis 1: Smaller eligible patient population | Reference | 184,387,640 | 187,543,418 | 299,163,750 | 380,334,147 | 867,041,316 |
New drug | 184,387,640 | 284,885,955 | 423,693,911 | 516,072,262 | 1,224,652,128 | |
Budget impact | 0 | 97,342,536 | 124,530,161 | 135,738,114 | 357,610,812 | |
CDA-AMC scenario analysis 2: 100% lenalidomide refractory | Reference | 301,031,231 | 306,200,697 | 488,306,898 | 620,872,725 | 1,415,380,320 |
New drug | 301,031,231 | 465,131,107 | 691,534,402 | 842,488,905 | 1,999,154,414 | |
Budget impact | 0 | 158,930,410 | 203,227,503 | 221,616,180 | 583,774,094 | |
CDA-AMC scenario analysis 3: Lower cost for IsaKd, IsaPd, and SVd cost | Reference | 204,830,240 | 208,335,892 | 325,009,087 | 407,156,743 | 940,501,721 |
New drug | 204,830,240 | 342,421,897 | 503,226,281 | 610,648,921 | 1,456,297,099 | |
Budget impact | 0 | 134,086,005 | 178,217,194 | 203,492,178 | 515,795,378 |
BIA = budget impact analysis; CDA-AMC = Canada’s Drug Agency; IsaKd = isatuximab-carfilzomib-dexamethasone; IsaPd = isatuximab-pomalidomide-dexamethasone; SVd = selinexor-bortezomib-dexamethasone.
Ethics Review
Abbreviations
CAR
chimeric antigen receptor
CDA-AMC
Canada’s Drug Agency
cilta-cel
ciltacabtagene autoleucel
MM
multiple myeloma
SCT
stem cell transplant
Supplementary Ethical Considerations: Ciltacabtagene Autoleucel for Multiple Myeloma
Ethical considerations relevant to all chimeric antigen receptor (CAR) T-cell therapies in the treatment of hematological cancers are described in the Summary Report: Ethical Considerations in the Use of CAR T-Cell Therapies for Hematological Cancers. Ciltacabtagene autoleucel (cilta-cel) was previously reviewed for the treatment of adult patients with relapsed or refractory multiple myeloma (MM) who have received at least 3 prior lines of therapy, including a proteasome inhibitor, an immunomodulatory agent, and an anti-CD38 antibody, and whose disease is refractory to their last treatment. This supplement outlines ethical considerations specific to the use of cilta-cel for the treatment of adult patients with MM who have received 1 to 3 prior lines of therapy, including a proteasome inhibitor and an immunomodulatory agent, and whose disease is refractory to lenalidomide. This supplement draws on patient and clinician group and drug program input, as well as consultation with clinical experts and clinical and economic reviewers.
Patient experiences and treatment options for MM: As described in detail in the Clinical Review Report, MM is a hematological malignancy for which there are currently no available curative treatments. Patients with MM undergo successive lines of therapy, with progressively worsening outcomes, and eventually develop refractory disease. Treatment for MM is considered continuous, requiring frequent (even weekly) treatment and monitoring, and offers no “treatment-free” windows. MM and its treatment are physically, psychosocially, and financially burdensome for patients and caregivers. The clinical experts noted that the treatment and monitoring requirements for MM are additionally burdensome for patients living in rural or remote communities (including First Nations, Métis, and Inuit communities) who must travel to access treatment.
Evidentiary uncertainties related to cilta-cel for MM: The safety and efficacy of cilta-cel compared to physician’s choice of standard-of-care therapies (either pomalidomide-bortezomib-dexamethasone or daratumumab-pomalidomide-dexamethasone) in the treatment of adult patients with relapsed or refractory MM who have received 1 to 3 prior lines of therapy was evaluated in the pivotal, ongoing, phase III, open-label, randomized CARTITUDE-4 trial. As noted in the Clinical Review Report, treatment with cilta-cel demonstrated a clinically significant benefit in terms of the primary end point of progression-free survival compared to standard of care of PVd or DPd. However, the overall survival benefit was uncertain due to the immaturity of the data. Additionally, as noted by the clinical experts, the standard-of-care comparators used in the trial may not reflect current clinical practice in Canada, which may impact the generalizability of the results. Comparative evidence for other relevant comparators (carfilzomib-dexamethasone, pomalidomide-dexamethasone, bortezomib-dexamethasone, daratumumab-bortezomib-dexamethasone, isatuximab-pomalidomide-dexamethasone, and selinexor-bortezomib-dexamethasone) was submitted through 2 indirect treatment comparison reports. The Clinical Review Report concluded that cilta-cel demonstrated statistically significant improvement in overall survival and progression-free survival relative to currently available therapies (with the exception of no statistically significant differences in terms of overall survival when compared with carfilzomib-dexamethasone and isatuximab-pomalidomide-dexamethasone). However, the Clinical Review Report noted that the indirect treatment comparisons had methodological limitations, which added uncertainty to the overall survival and progression-free survival benefits estimated in those comparisons. The clinical experts noted that more comparative evidence was required to determine whether the risk-benefit favoured CAR T-cell therapy for patients who were transplant eligible and had yet to undergo transplant or treatment with an anti-CD38 agent. The CARTITUDE-4 trial did not yield long-term safety and efficacy data. The clinical experts noted the need for long-term data on safety, efficacy, and comparative effectiveness (including with emerging therapeutic options such as other B-cell maturation antigen–targeting agents, such as bispecific antibodies), especially for the use of cilta-cel in earlier lines of treatment with existing therapeutic options. Together, the uncertainties in comparative effectiveness and long-term effectiveness and safety have ethical implications for informed consent. As detailed in the following Summary Report, uncertainty about long-term safety, efficacy, and comparative effectiveness also presents challenges for pharmacoeconomic assessments and has prompted consideration of alternative pricing and reimbursement models. Although value-based reimbursement has not been used in Canada to date, the sponsor has indicated that they are preparing the groundwork to enable this for cilta-cel. How risk-sharing arrangements like value-based reimbursement are designed (e.g., what parameters are chosen) has ethical implications for the distribution of their potential benefits and burdens between patients, the public, payers, and manufacturers.
Risk of secondary T-cell lymphomas: As detailed in the Summary Report, CAR T-cell therapies (including cilta-cel) may pose a rare, class-level risk of secondary malignancy and developing CAR-positive T-cell lymphoma. Although the development of CAR-positive T-cell lymphoma was not observed in the CARTITUDE-4 trial, clinical experts acknowledged the possibility of this risk with cilta-cel. However, they suggested that, based on currently available evidence, this risk would not alter their decision-making regarding cilta-cel, as both MM and existing therapies for MM also pose the risk of secondary malignancies. The clinical experts noted the importance of informing patients of this risk — which requires lifelong monitoring as described in the product monograph — during consent conversations.
Clinical decision-making for relapsed or refractory MM: Patient and clinician group input highlighted that patients’ goals include the desire for a 1-time, life-extending therapy that does not require active management, given the unmet need for curative treatment and the burdensome nature of existing therapies. The clinical experts noted that patients residing in rural or remote communities might especially benefit from a 1-time therapy such as cilta-cel, including in earlier lines, given the expected reduction in need for frequent travel compared with accessing alternate treatments for MM. The clinical experts also noted that introducing cilta-cel in earlier lines of therapy for MM increased the complexity of prioritizing patients in the context of capacity constraints. They observed that prescribing decisions would require consideration of the following: the availability and comparative evidence for other therapeutic options in second-line and third-line settings (including opportunities to access other B-cell maturation antigen–targeting agents in the future); whether CAR T-cell therapy would be more effective in earlier lines of therapy while patients have less pretreated disease; and a patient’s individual presentation of the disease and circumstances.
Implications of capacity constraints for the use of cilta-cel in earlier lines of therapy for MM: The clinical experts emphasized that offering cilta-cel for MM, especially in earlier lines of therapy, would require significantly increasing delivery capacity in Canada. They reiterated that Canada still lacks sufficient health system capacity to deliver CAR T-cell therapy to all eligible patients, given the resource-intensive, personnel-intensive, and infrastructure-intensive nature of CAR T-cell therapy. As described in the Summary Report, they noted that insufficient human resources, including hematological specialists skilled in monitoring and responding to acute toxicities, could limit the safe and effective delivery of CAR T-cell therapy. The ethical, equity, and access challenges arising from existing limitations in manufacturing and delivery capacity for CAR T-cell therapy are also detailed further in the Summary Report. The clinical experts cautioned that in the absence of sufficient capacity to deliver CAR T-cell therapy to all eligible patients and in the absence of transparent, fair guidance on how to prioritize patients for access to limited therapy, reimbursement of cilta-cel may contribute to inequitable access to treatment (e.g., favouring patients residing near treatment centres or those who are more vocal). The Summary Report outlines further details on transparent, fair prioritization criteria, including the importance of recognizing and mitigating structural and systemic factors that may impact a patient’s perceived priority or eligibility and thus contribute to inequities. The clinical experts also reiterated the importance of offering support for patients and caregivers who reside in rural or remote communities to reduce geographic and financial barriers to equitable access. The sponsor has indicated that they are currently developing and discussing a patient support program with payers and the pan-Canadian Pharmaceutical Alliance for cilta-cel in the fourth line. The program is proposed to address gaps in jurisdictional or centre-based support for education and for travel and accommodation–associated costs for patients and caregivers for apheresis and infusion, but the sponsor acknowledged that regional inequalities may remain.
Summary Report: Ethical Considerations in the Use of CAR T-Cell Therapies for Hematological Cancers
Summary
Normative and empirical literature on CAR T-cell therapies, as well as past ethics reports from Canada’s Drug Agency (CDA-AMC) on CAR T-cell therapies for hematological cancers, were reviewed to summarize the ethical considerations associated with the use of CAR T-cell therapies for the treatment of hematological cancers.
Ethical considerations arising in the context of hematological cancers include the unmet need for durable, life-prolonging treatment for patients with relapsed or refractory disease, as well as disparities in the incidence, diagnosis, treatment, and outcomes in hematological cancers, especially the way these affect patients from racialized, marginalized, or lower socioeconomic status groups, and those residing in rural areas.
Ethical considerations arising in the evidence used to evaluate CAR T-cell therapies indicate limitations in the representativeness of the clinical trial populations, the absence of long-term safety and efficacy data, and the absence of comparative effectiveness data. Uncertainty about the magnitude of clinical benefit presents challenges for the pharmacoeconomic assessment of CAR T-cell therapies and the assessment of opportunity costs and may expose payers to greater financial risks. Budget forecasting may underestimate the overall budget impact of reimbursing CAR T-cell therapies if they are implemented fairly and as needed.
Ethical considerations arise with respect to the potential benefits and harms related to the use and delivery of CAR T-cell therapies. Several access considerations arise in the context of CAR T-cell therapies in Canada, including those related to geographical access, especially as these considerations may disproportionately impact racialized, marginalized, and lower socioeconomic status groups and patients lacking caregiver support; other important considerations are inequities that may arise during referral or treatment. Considerations related to privacy and culturally sensitive practices also arise in the context of cell and tissue ownership, as do considerations related to informed consent, shared decision-making, and balanced communication related to CAR T-cell therapies.
Ethical considerations for health systems include challenges associated with the capacity to manufacture and deliver CAR T-cell therapy and to scale the number of CAR T-cell centres across Canada due to the complex infrastructure and personnel requirements. Fair priority-setting criteria are required if demand for therapy exceeds manufacturing or delivery capacity. The reimbursement of high-cost, resource-intensive therapies such as CAR T-cell therapies presents opportunity costs for health systems within and beyond the hematological-oncological cancer space. Resources for health information infrastructure may be required to support postmarket surveillance, the collection of real-world evidence, and the implementation of alternative pricing or financing models.
Objectives
This report summarizes the ethical considerations common to the use of CAR T-cell therapies for the treatment of children and adults with hematological cancers in Canada, as identified in the normative and empirical literature on CAR T-cell therapies and informed by previous CDA-AMC ethics reports of CAR T-cell therapies for hematological cancers. These reports addressed ethical considerations related to CAR T-cell therapies in the context of acute lymphoblastic leukemia, diffuse large B-cell lymphoma, follicular lymphoma, mantle cell lymphoma, and MM.1-8 Past reports drew on published literature; consultation with clinical experts; consideration of input from patient groups, clinician groups, and drug programs; and collaboration with clinical and pharmacoeconomic review teams at CDA-AMC. Domains of interest in this Summary Report include ethical considerations related to the therapeutic context of hematological cancers, the evidentiary basis and use of CAR T-cell therapies, and health systems. In the context of this report, any reference to “CAR T-cell therapy” refers to CAR T-cell therapies used to treat hematological cancers.
Key Ethical Considerations
Therapeutic Context: Hematological Cancers
Patient and caregiver experiences, as well as diagnostic and treatment pathways, vary across the different hematological cancers for which CAR T-cell therapies are available or are under development (e.g., acute lymphoblastic leukemia, diffuse large B-cell lymphoma, follicular lymphoma, mantle cell lymphoma, and MM). Nonetheless, common ethical considerations are reported across indications, including those related to the high unmet needs of the patient population and equity issues related to disparities in the diagnosis, treatment, and outcomes of these cancers. Presently, CAR T-cell therapies are reimbursed, or are under consideration for reimbursement, as second-line, third-line, and fourth-line therapies for patients with relapsed or refractory disease, for whom there are few or no available alternative treatments or for whom alternative treatments have failed. As a result, patients eligible for CAR T-cell therapy are usually characterized as having a high unmet need for durable, life-prolonging therapy.
Published literature, which is largely reported from the US, indicates that there are disparities in diagnosis, treatment, and outcomes across hematological cancers, especially for racialized, marginalized, and lower socioeconomic status groups and patients residing in rural areas or far from tertiary care centres, and sometimes across age groups.1,2,5-8 Published literature concerning the distribution, incidence, treatment, and outcomes of hematological cancers in Canada is more limited, in part due to gaps in the collection of demographic data related to age, sex, and race in Canadian health information databases.9,10 This may limit a contextualized understanding of cancer-related disparities observed in Canada and its subnational jurisdictions.1
The clinical experts consulted during previous Reimbursement Reviews indicated that geography (residence in rural areas and/or far from tertiary centres) and socioeconomic status could impact the diagnosis, treatment, and outcomes of hematological cancers in Canada.1,2 They noted that disparities are more likely to be observed in access to primary care before diagnosis than once a patient is actively followed in the cancer care system. However, even in cancer care, requirements to travel and leave one’s support system and the costs associated with travel, time off work, or childcare, as well as inconsistent funding and support across Canadian jurisdictions, can differentially impact patients’ and caregivers’ decision-making about treatment and care, including for CAR T-cell therapies, as will be discussed later. Disparities in outcomes between age groups have also been reported in Canada, as adults older than 70 years may have fewer therapeutic options if they are considered ineligible for common second-line or third-line treatments for hematological cancers, including allogenic stem cell transplant (SCT) and autologous SCT.2
Evidence and Evaluation of CAR T-Cell Therapies
Ethical Considerations in Clinical Trial Data
During Reimbursement Reviews, CAR T-cell therapies have usually been evaluated with phase I/II or II, single-arm, open-label trials that offer only limited certainty about short-term therapeutic safety and efficacy and lack head-to-head comparative effectiveness and long-term safety, efficacy, and survival data.1-8 Uncertainty about the magnitude and duration of clinical benefit presents challenges for the assessment of clinical benefits and harms.11 Clinical experts consulted during previous reimbursement reviews of CAR T-cell therapies noted that the risks associated with evidentiary uncertainty for particular therapies are partially mitigated by the growing body of evidence on CAR T-cell therapies as a therapeutic class, which facilitates earlier identification and response to adverse events.1,2 Evidence-generating measures, such as active postmarket surveillance, are required to better understand the risk-benefit profile and cost-effectiveness of CAR T-cell therapies in practice12 and to inform the clinical and policy decision-making that serves the interests of patients and the public.11,13,14
The extent to which participants in CAR T-cell therapy trials are representative of patients in clinical practice in Canada varies. CAR T-cell therapy trials have generally tended to exclude patients with an Eastern Cooperative Oncology Group (ECOG) performance status greater than 1, which may not be reflective of clinical practice.1,2,6 ECOG performance status is a measure of a patient’s level of functioning in terms of their ability to care for themselves, their daily activity, and their physical ability, with a lower score (0 or 1) denoting the highest levels of functioning and a score of 5 denoting death. Further, trials tend to exclude patients with HIV or hepatitis B and include patients with a median age lower than that observed in practice, which may present challenges for the applicability of results to patients who are living with these conditions or are older.1,6 CAR T-cell therapy trials also tend to include disproportionately higher rates of patients who are white than patients from other racial or ethnic groups, irrespective of disease incidence within the patient population.1,2,6 Indeed, racial and socioeconomic disparities in access to, and inclusion in, clinical trials have been reported in clinical trials for CAR T-cell therapies in the US (where most CAR T-cell trials are conducted).15,16 For example, participants who are African American or Black were underrepresented in the clinical trials of 5 CAR T-cell products across 7 indications for hematological cancers, and are often underrepresented in clinical trials for cancer therapies across hematological indications more generally.1,6-8,15 This may potentially exacerbate existing health disparities observed in these populations15 and lead to a limited understanding of, and hinder efforts to eliminate, the racial and ethnic disparities observed in disease outcomes for these populations.17
The underrepresentation of racial, ethnic, and other marginalized groups, as well as women, has been identified as a common issue in clinical trials more generally. Underrepresentation in trial participation is ethically concerning, as diverse clinical trial participation contributes to building trust in medical research and institutions (which can impact a patient’s willingness to pursue treatment), promotes fairness for potential participants and their communities, and produces higher-quality biomedical knowledge.18 The clinical experts consulted in a previous Reimbursement Review were uncertain about the clinical implications of the underrepresentation of racial or ethnic groups in CAR T-cell therapy trials.1 However, demographically representative clinical trial data for CAR T-cell therapies may help determine whether therapeutic efficacy varies between subgroups and whether nontherapeutic factors (such as caregiver support or socioeconomic status) have an impact on effectiveness and clinical outcomes in the real world.1,19 Greater support is required to facilitate equitable access to clinical trial participation and to CAR T-cell treatment centres,15,18 and it is important to consider how trial participant selection may privilege certain groups and disadvantage others where demand for CAR T-cell therapy and trial participation exceed supply.11,20
Ethical Considerations in Economic Models
The lack of long-term safety, efficacy, and survival data, as well as head-to-head comparative effectiveness data, at the time of a Reimbursement Review has implications for the pharmacoeconomic assessment of CAR T-cell therapies, as it limits the ability to accurately model and assess cost-effectiveness.1,21,22 Uncertainty about pharmacoeconomic assessments, which are used to support the ethical principles of stewardship and public accountability in resource allocation,3 has implications for resource allocation at a health system level, because it hinders assessments of the opportunity costs (or forgone benefits) associated with the reimbursement and resourcing of CAR T-cell therapies over other resources.1,6,23 Data collection for long-term safety, efficacy, and comparative effectiveness may better support the robust pharmacoeconomic assessments used to inform reimbursement recommendations and decisions.23
Concerns about evidentiary limitations in pharmacoeconomic assessments and health system sustainability have prompted consideration of alternative pricing and reimbursement models (e.g., value-based agreements, outcome-based pricing) as potential risk-sharing mechanisms that could help mitigate the risks that payers face when reimbursing high-cost therapies, including CAR T-cell therapies, based on uncertain clinical and pharmacoeconomic evidence.6,23-28 Although not currently used in Canada for the reimbursement of CAR T-cell therapies, risk-sharing payment models have been used in other jurisdictions (especially in Europe).24 However, the way such financial arrangements are designed has ethical implications for the distribution of their potential benefits and burdens (e.g., for patients, the public, payers, and manufacturers).28 For example, the way the value of a drug is defined, such as which surrogate outcomes are selected to evaluate efficacy, impacts how financial risks are distributed between manufacturers and payers.
The budget impact of implementing a CAR T-cell therapy may be underestimated if the estimated uptake does not reflect expected demand by patients and clinicians. CAR T-cell therapies that are reimbursed are expected to be widely adopted by clinicians and patients, resulting in related expectations that they will have a high budget impact.1 Higher budget impacts may present challenges for health systems with respect to the consideration of opportunity costs and fair resource allocation within and beyond the reimbursement of hematological-oncological therapies.6
Use of CAR T-Cell Therapies
Potential Benefits and Harms in the Use and Delivery of CAR T-Cell Therapies
CAR T-cell therapies have the potential to expand access to therapeutic options for patients without alternatives, including those who are ineligible for SCT (e.g., patients who are sufficiently healthy to receive CAR T-cell therapy but not to undergo SCT, patients who could not find a suitable match for allogeneic SCT, and patients who exceed the age cut-offs for SCT). As a result, CAR T-cell therapies may offer equity-related advantages by expanding therapeutic options for older patients and for patients who are Black, Indigenous, and racialized, who may be underrepresented in SCT registries and thus unable to find adequate matches for allogeneic SCT in a timely manner.2,29 CAR T-cell therapies may offer additional practical advantages over existing therapies, especially for patients residing in rural or remote regions or with mobility issues, as they require a single infusion and treatment period and, as a durable therapy, may offer the first treatment-free window for patients with some cancers (e.g., MM).1,30,31
Nonetheless, most CAR T-cell therapies lack long-term safety and efficacy data at the time of a Reimbursement Review, which limits the assessment of clinical benefits and harms. In practice, the balance of potential risks and benefits associated with CAR T-cell therapy is assessed relative to available alternative therapeutic options and to a patient’s condition (which, in the case of relapsed or refractory cancer, may have a poor prognosis).1,11,32,33 CAR T-cell therapies bear the risk of severe toxicities, including cytokine release syndrome and other adverse events. Moreover, shortages or inconsistent availability of treatments (e.g., tocilizumab) used to treat patients who develop adverse events (e.g., cytokine release syndrome) after CAR T-cell therapy could impact the safe administration of these therapies.4
The evidence base for CAR T-cell therapies continues to evolve, especially as more therapies are introduced and used in real-world settings. For example, the FDA announced a safety signal in November 2023 and subsequently issued a boxed warning regarding a class-level risk of secondary malignancy based on postmarket adverse event and clinical trial reports.53,54 CAR T-cell therapies using an integrating (retroviral or lentiviral) vector are considered to pose a risk of developing T-cell lymphoma, which may develop as soon as weeks after infusion.54 While incidence of such T-cell lymphoma is currently expected to be low, it may be underestimated as sequencing may not have been conducted when a subsequent T-cell lymphoma was observed.53 The clinical experts noted that this risk will need to be considered in the context of disease severity and the availability, or lack thereof, of other therapeutic options, which may also carry risks of secondary malignancy. Patients should be informed of the risk of secondary malignancy in consent conversations for CAR T-cell therapy and provide acknowledgement.53 The risk of secondary malignancy also highlights the importance of randomized clinical trial data to inform comparative clinical risk-benefit assessments, especially as CAR T-cell therapies are offered earlier in the disease course, when other therapeutic options may be available.53
Although the long-term safety of CAR T-cell therapies remains uncertain, clinical experts consulted in previous Reimbursement Reviews noted that the safety of CAR T-cell therapies has improved as clinicians have become more experienced at administering treatment and identifying and responding to adverse events.1,2 This suggests that the safety of CAR T-cell therapies is context dependent, where safety and efficacy may be impacted by the level of experience of the treating team and centre and the availability of supportive resources.12 The collection of postmarket data and real-world evidence related to the use of novel CAR T-cell therapies could contribute to a more robust understanding of the real-world safety and efficacy of CAR T-cell therapies, and the balance of risks and benefits, in diverse clinical practice settings and communities.
Equitable Access to CAR T-Cell Therapies
The safe and effective administration of CAR T-cell therapies presently requires administration in a limited number of accredited treatment centres equipped with specialized infrastructure and highly trained providers, which are currently localized in large urban centres in Canada. As a result, access to CAR T-cell therapies may be moderated by geographic and financial barriers. Patients residing far from treatment centres (including in other provinces or territories) must travel to access treatment and spend more than a month near the treatment centre for preinfusion and postinfusion treatment and care.1-3 The financial and psychosocial burdens resulting from geographic distance may impact patients’ therapeutic decision-making (e.g., patients opting for noncurative or inferior treatments to avoid leaving their communities or spending an extended time in hospital).1
Disparities in access to CAR T-cell therapies have been widely reported in the US context, including across race, geography (residence), and socioeconomic status.34,35 Geographic disparities in access to CAR T-cell therapies are especially salient in Canada, especially for populations residing in rural and northern communities or in provinces and territories without CAR T-cell centres, given Canada’s vast geography and the limited number of established and proposed CAR T-cell centres.1,2 In the Canadian context, race-based disparities in access should be considered, as they impact Indigenous people — especially in light of their disproportionately increased representation in rural and northern communities — as well as other marginalized people or groups.1,2 At the same time, CAR T-cell therapies may offer access-related advantages over, and be less burdensome than, existing treatments, as they only require a single treatment period.1,31 Ensuring equitable access to high-quality care across Canada may also require considering what, if anything, might be owed to patients who are eligible for, but opt not to pursue, effective therapeutic options such as CAR T-cell therapy due to geographic or other barriers.1
Presently in Canada, most jurisdictions provide some support for accommodation and/or food-related expenses for people who reside a certain distance from an infusion centre, but fewer provide support for travel costs.1 CAR T-cell manufacturers may offer programs for financial and/or accommodation support for required travel, but they often include distance-related eligibility cut-offs, which could leave gaps in coverage for some patients or provide insufficient support to cover all the costs borne by patients and caregivers.1,2,6,36 Adequate financial support for patients and caregivers may be important for facilitating equitable access to CAR T-cell therapies by mitigating cost-related barriers that are exacerbated by geography (e.g., costs associated with travel, accommodations, and lost income for patients and caregivers who reside outside of cities with CAR T-cell treatment facilities).1,6
Referral practices can also impact access to CAR T-cell therapies in Canada.6,12,37,38 Not only do patients require access to primary care to be referred for CAR T-cell therapy, physicians must be aware of available therapies and eligibility criteria, as well as the processes involved in making a referral to a treatment centre (which could be located in a different jurisdiction).1,2 Providers less confident in their knowledge about CAR T-cell therapies may be less likely to refer,37 and racial and ethnic disparities observed in the distribution of patients receiving CAR T-cell therapy may be, in part, explained by disparities in referral patterns in primary care rather than in treatment practices in cancer care.38 Accordingly, it is important to have clear and equitable referral practices, educate clinicians about CAR T-cell therapies and referral processes, facilitate communication between clinicians and treatment centres, and provide system-level supports for clinicians practising outside the large metropolitan centres where CAR T-cell centres are located.1,2 Eligibility for CAR T-cell therapy presently requires patients to have already undergone several lines of therapy and for those therapies to have failed. However, not all patients may have had access to, or been eligible for, earlier lines of therapy for reasons outside their or their providers’ control; this may present a barrier to access to CAR T-cell therapy for a subset of patients.1,31
Cell Ownership
The collection and storage of patients’ cells during CAR T-cell manufacturing may raise questions related to patient privacy and cell ownership, particularly when manufacturers are outside of Canadian jurisdictions.1,6,39 It is important to recognize that tissue and genetic materials are valued differently by different cultural groups (e.g., Indigenous groups internationally) and that informed consent processes need to clearly detail cell processing and ownership, as well as how remaining cells that are not infused will be handled or disposed of.40 Consultation with diverse groups has been identified as essential to CAR T-cell research and implementation to ensure that cell handling and disposal practices, as well as educational and consent materials, are sensitive to the needs and values of diverse patients and communities.6,39,40 In the Canadian context, attention should be paid to understanding Indigenous communities’ values and practices with respect to cell and tissue ownership and governance (e.g., with reference to guidance, such as the First Nations principles of OCAP [ownership, control, access, possession]).41
Considerations for Informed Consent
Processes should be in place to ensure that patients (and caregivers) are apprised of the unique risks of, and evidentiary uncertainties related to, CAR T-cell therapies to support robust, ongoing, iterative informed consent, including as patients transition between care settings.6,42-45,53 Robust consent processes should recognize both the unique vulnerabilities of patients with cancer who have limited or no alternative therapeutic options and who may be exposed to hype surrounding or the underreporting of treatment-related harms or uncertainties related to CAR T-cell therapies; consent processes should also take into account the degree of the patient’s autonomous decision-making capacity.4,6,8 The term “cure” should be avoided in discussions to avoid misleading patients or promoting false hope for therapies for which long-term clinical effectiveness remains unknown.46 The balance of potential risks and benefits associated with CAR T-cell therapy should be assessed in a process of shared decision-making by patients, providers, and caregivers. For CAR T-cell therapies approved for use in pediatric populations, it is important to recognize the unique vulnerability of children, who are reliant on parents or caregivers for decision-making as well as broader support. Depending on age or determined level of competency, minors may have a more active role in consent or assent to treatment, supported by age-appropriate educational materials about the potential benefits and harms of CAR T-cell therapy to facilitate family-based discussions.43,45 Discussions related to the preservation of fertility may also be important for adolescents and young adults considering CAR T-cell therapy.2 Studying and considering patient-reported outcomes and patient experiences may better facilitate shared decision-making about the use of CAR T-cell therapies.12 Additional resources, including the use of translators and the provision of age-appropriate and language-appropriate educational materials for patients and caregivers, may be required to support patient decision-making.45
Health Systems
Manufacturing and Health Systems Capacity
There are at least 2 challenges related to CAR T-cell therapy delivery in Canada: manufacturing and health system capacity.12 The first concerns the capacity to manufacture and supply CAR T-cell therapies and the need for timely coordination between manufacturers and CAR T-cell centres for limited manufacturing slots during a multiweek preparatory and manufacturing period (e.g., stabilizing of patients’ conditions before apheresis, manufacturing and treatment, coordination of bridging therapy, apheresis, and the transport of cells). As each step in the complex sequence of manufacturing and delivery requirements for CAR T-cell therapy represents an opportunity for disruption or delay, it may be important to consider the development of contingency plans to ensure a stable supply.1,47 Patients may be harmed by delays in access to therapy, because they have to be in sufficiently stable condition and in good health to remain eligible for, and be able to withstand, treatment.1,31 The proliferation of CAR T-cell therapies also presents a growing administrative burden for centres, which must maintain resource-intensive accreditations and manage multiple protocols for the preparation and delivery of a growing number of therapies.1 The possibility of a domestic, local CAR T-cell manufacturer in hospital and research settings is currently under investigation in the CLIC-01 clinical trial in British Columbia.48 Although still nascent, the potential use of a local CAR T-cell manufacturer in the future may expedite access to CAR T-cell therapies for patients (including eliminating the time required to transport cells to and from international manufacturing facilities) and is expected to be less costly and more cost-effective than CAR T-cell therapies produced by pharmaceutical manufacturers.48
The second challenge concerns the health system’s capacity to meet the therapeutic demand for CAR T-cell therapies in Canada due to the complex infrastructure and personnel requirements.6,39 For example, implementation requires tertiary medical centres with specialized expertise; specialized training for staff; infrastructure modifications; close interactions among experienced inpatient, intensive care unit, outpatient, and emergency personnel and facilities; and the identification of and planning for patients before and after treatment. The implementation of an increasing number of CAR T-cell therapies for a growing number of indications may exacerbate existing health system capacity challenges. Presently, there are a limited number of pediatric and adult CAR T-cell centres in Canada, which are localized in large urban centres in only some provinces. Although access in provinces and territories lacking CAR T-cell centres is managed through interjurisdictional agreements, the distribution of CAR T-cell centres in Canada could present a barrier for access to treatment for patients residing far from, or in jurisdictions without, CAR T-cell facilities. As a result, it is important to consider the allocation of CAR T-cell centres in a way that reflects regional, rural-urban, and sociodemographic equity.6,49
Although not currently used, outpatient delivery of CAR T-cell therapies has been suggested as a potential mechanism to address capacity limitations and expand access to a greater number of patients by circumventing limitations in inpatient capacity (e.g., human resources, hospital beds, intensive care unit capacity, apheresis facilities) and to reduce health system costs.1,49 However, outpatient delivery would increase the need for patients to have access to social supports and a reliable caregiver, because the responsibility for care would be shifted largely onto patients and caregivers and away from trained health care personnel and health systems.1 Thus, a shift to outpatient delivery could potentially exacerbate burdens and the resulting inequities associated with accessing CAR T-cell therapies for patients and caregivers in lower socioeconomic strata and residing far from CAR T-cell centres, as is already observed in the context of SCTs.1 Outpatient delivery would still require significant health system resources to provide safe follow-up care for patients presenting with severe side effects or requiring ongoing care, emphasizing the need to invest in the infrastructure required to implement CAR T-cell therapies.6,39
Resource Allocation in the Context of Capacity Limitations
Insufficient supply or capacity to deliver CAR T-cell therapies raises ethical questions related to distributive justice (e.g., Who should be prioritized for access to a particular CAR T-cell therapy, and why?), as well as procedural justice (e.g., Who should decide how to allocate limited resources and capacity? What constitutes a fair allocation process?).1,3,20,47,50 Fair decision-making processes and priority-setting criteria are required to inform the prioritization of patients for access to CAR T-cell therapies within and across indications to facilitate the equitable allocation of limited resources in Canada.1-8 Indeed, as multiple CAR T-cell therapies become available for single indications, criteria may also be required to determine whether to use 1 therapy over another31 or whether patients would be eligible (and if so, under what conditions) for re-treatment with CAR T-cell therapy. The development of pan-Canadian priority-setting criteria for prioritizing access to CAR T-cell therapies and/or pan-Canadian coordination could facilitate fair resource allocation processes, accountability in decision-making, equitable pan-Canadian access to CAR T-cell therapies; reduce decision-making burden for clinicians; and reduce inefficiencies as a result of duplicated efforts.1,3,50,55 Consideration of manufacturing and health system capacity implications may be required if CAR T-cell therapies demonstrate long-term curative potential, which could prompt the use of CAR T-cell therapy in earlier lines of treatment and, thus, for a greater number of patients.11
The introduction of multiple CAR T-cell therapies in Canada and abroad has heightened attention on the importance of fair allocation of scarce CAR T-cell therapies.55-58 In Canada, allocation occurs largely on an ad hoc basis at jurisdictional or institutional levels, which may result in inequitable and inefficient allocation of limited CAR T-cell therapy.55 One of Ontario’s CAR T-cell centres has published a framework to facilitate the systematized, fair allocation of CAR T-cell therapy.55 The framework describes the need for prioritization both at the disease site level (including prioritization within each disease site) and at the Cell Therapy Review Committee level (requiring prioritization across disease sites).55 Prioritization occurs in a 3-step process: assessment of patients for medical benefit; an evaluation of functional and psychosocial challenges that may limit optimal CAR T-cell tolerance and caregiver availability; and consensus review and prioritization by a multidisciplinary team requiring clear, transparent documentation of rationales on the basis of 9 prioritization criteria (medical need or acuity, likelihood of benefit from and tolerance of therapy, safety and risk of complications, adherence to treatment regimen and compliance, social and caregiver support, impact on other resources, length of wait, first come first served, exhaustion of all other treatment options). Given the context-dependent nature of the prioritization criteria, the authors of the framework note the importance of understanding and providing support to address underlying factors that might disadvantage a patient and deprioritize them for access (e.g., availability of caregiver support or potential challenges in adhering to treatment).55 Additionally, they emphasize the importance of pan-Canadian coordination to ensure equitable access within and across jurisdictions.55 Experience from the US also indicates the importance of explicitly attending to the fair allocation of CAR T-cell therapy to mitigate inequities arising from structural and systemic factors such as socioeconomic status, geography, and race.56-58 For example, the importance of addressing inequities faced by populations who are marginalized, including patients who are Black and those with lower socioeconomic status, may require reconsidering existing allocation practices such as “first come, first served,” which inadvertently prioritize those who are wealthier and have better and earlier access to health care.56
Funding, Opportunity Costs, and Data Infrastructure
The reimbursement and implementation of CAR T-cell therapies, which are highly expensive and resource intensive, raises concerns about the sustainability of the Canadian health care system1,6,12 and stewardship and about the responsible use of health resources based on available evidence.3 Reimbursing and implementing CAR T-cell therapies presents opportunity costs (or forgone benefits for other treatments or health care services) for fixed health care budgets in which not all services or therapies can be reimbursed, within both hematological and oncological therapies and in other therapeutic classes.12,14,23,42,51,52 Additionally, it presents opportunity costs for health system resources (e.g., hospital beds, intensive care unit capacity, access to clinical specialists) due to the resource-intensive nature of CAR T-cell therapies.1,3 As discussed previously, uncertainty in the clinical evidence and pharmacoeconomic models used to evaluate CAR T-cell therapies limits the ability to accurately assess the magnitude of benefit of CAR T-cell therapies relative to other treatments or services and thus to inform an understanding of whether the benefits and burdens associated with funding some therapies or services but not others are distributed fairly.23 Clear and transparent decisions about the expansion of access to CAR T-cell therapies in the context of existing system constraints, competing health care priorities, and long-term health system sustainability are required to support fair decision-making and sustain patient and public trust.1,11,26,42 Although, as discussed previously, alternative pricing and reimbursement models may potentially help attenuate the risks faced by payers reimbursing therapies based on uncertain clinical and pharmacoeconomic evidence, it is still important to recognize that CAR T-cell therapies would remain very expensive and resource intensive from a health system perspective.1
From a health system perspective, it is also important to consider the clinical and health informatics infrastructure and resources required to collect the data needed to implement novel funding models and postmarket surveillance.14,39
Conclusion
CAR T-cell therapies are being introduced as second-line, third-line, and fourth-line therapies for the treatment of various hematological cancers (e.g., acute lymphoblastic leukemia, diffuse large B-cell lymphoma, follicular lymphoma, mantle cell lymphoma, and MM). Published empirical and normative literature, as well as past ethics reviews of CAR T-cell therapies, were reviewed to identify the ethical considerations relevant to the use of CAR T-cell therapies for the treatment of hematological cancers. Ethical considerations in the context of hematological cancers include the need for an effective, durable treatment that prolongs life, as well as existing disparities in incidence, diagnosis, treatment, and outcomes for racialized, marginalized, and lower- socioeconomic status groups, although more data are required to inform a greater understanding of disparities in the Canadian context. Clinical trials assessing CAR T-cell therapies may not be fully representative of the patient population in Canada (e.g., across race, age, and functional status) and lack long-term safety and efficacy data and comparative effectiveness data. The lack of long-term and comparative clinical data limits the certainty of pharmacoeconomic assessments, which poses challenges for the assessment of opportunity costs and may expose payers to greater financial risks. The way alternate pricing or funding arrangements are designed has implications for the distribution of the potential benefits and risks associated with the reimbursement of high-cost therapies based on uncertain clinical and pharmacoeconomic evidence. Underestimates in the demand for CAR T-cell therapy can lead to underestimates in the total budget impact of reimbursing and implementing CAR T-cell therapies.
The implementation of CAR T-cell therapies in clinical practice raises several access-related considerations, given a limited delivery capacity and resulting geographic barriers to access; notably, barriers to access may disproportionately impact racialized, marginalized, and low socioeconomic groups, as well as those lacking caregiver support. The reimbursement and implementation of an increasing number of CAR T-cell therapies raises several ethical considerations for health systems, including challenges associated with scaling CAR T-cell delivery across Canada due to the complex and resource-intensive infrastructure and personnel requirements. A possible shift to outpatient delivery in the future may expand access to CAR T-cell therapies but may also shift responsibility for care onto patients and caregivers and may disproportionately burden patients without robust caregiver support. The development of fair, consistent criteria to prioritize access to CAR T-cell therapy would facilitate equitable access across Canada, especially if demand exceeds manufacturing or delivery capacity (e.g., the growing number of CAR T-cell therapies and use in earlier lines of therapy, if CAR T-cell therapies demonstrate curative potential, may exacerbate demand). Additionally, the high cost of implementing CAR T-cell therapies presents a challenge for health care budgets and raises questions about the system-level opportunity costs (both within and beyond the oncological space) of reimbursing CAR T-cell therapies.
The absence of long-term and comparative evidence for the safety and efficacy of CAR T-cell therapies necessitates robust postmarket surveillance to better understand the risk-benefit profile, as well as cost-effectiveness, of CAR T-cell therapies in practice. Moreover, where possible, postmarket surveillance and the use of real-world evidence may contribute to a better understanding of how the safety and efficacy of CAR T-cell therapies in clinical practice may be impacted by nonclinical factors and of whether this has an impact on how the benefits and burdens associated with the use of this therapy are distributed fairly across diverse demographic subgroups of patients with hematological cancers in Canada.
References
1.Drug Reimbursement Review clinical, pharmacoeconomic, and ethics reports: ciltacabtagene autoleucel (Carvykti) for the treatment of adult patients with multiple myeloma, who have received at least three prior lines of therapy, including aproteasome inhibitor, an immunomodulatory agent and ananti-CD38 antibody, and who are refractory to their last treatment. Can J Health Technol. 2023;3(8). 10.51731/cjht.2023.706. Accessed 2023 Aug 24.
2.Drug Reimbursement Review clinical, pharmacoeconomic, and ethics reports: brexucabtagene autoleucel (Tecartus) for the treatment of adult patients with relapsed or refractory B-cell precursor acute lymphoblastic leukemia (ALL). Can J Health Technol. 2023;3(6). 10.51731/cjht.2023.668. Accessed 2023 Aug 24.
3.Tisagenlecleucel for acute lymphoblastic leukemia and diffuse large b-cell lymphoma: ethics and implementation report. (CADTH optimal use report; vol.8, no.3d). Ottawa (ON): CADTH; 2019: https://www.cadth.ca/sites/default/files/pdf/car-t/op0538-tisagenlecleucel-ethics-and-implementation-jan2019.pdf. Accessed 2023 Aug 24.
4.Axicabtagene ciloleucel for large B-cell lymphoma: ethics and implementation report. (CADTH optimal use report; vol. 9, no. 1e). Ottawa (ON): CADTH; 2019: https://www.cadth.ca/sites/default/files/pdf/car-t/ct0002-ipe-report.pdf. Accessed 2023 Aug 24.
5.Drug Reimbursement Review clinical, pharmacoeconomic, and ethics reports: brexucabtagene autoleucel (Tecartus) for mantle cell lymphoma. Can J Health Technol. 2021;1(11). 10.51731/cjht.2021.187. Accessed 2023 Aug 24.
6.Drug Reimbursement Review clinical, pharmacoeconomic, and ethics reports: axicabtagene ciloleucel (Yescarta) for treatment of adult patients with relapsed or refractory large B-cell lymphoma (LBCL), who are candidates for autologous stem cell transplant (ASCT). Can J Health Technol. 2023;3(6). 10.51731/cjht.2023.667. Accessed 2023 Aug 24.
7.Drug Reimbursement Review clinical, pharmacoeconomic, ethics, and stakeholder input reports: lisocabtagene maraleucel (Breyanzi) for relapsed or refractory large B-cell lymphoma. Can J Health Technol. 2022;2(10). 10.51731/cjht.2022.461. Accessed 2023 Aug 24.
8.Drug Reimbursement Review clinical, pharmacoeconomic, and ethics reports: idecabtagene vicleucel (Abecma) for multiple myeloma. Can J Health Technol. 2022;2(2). 10.51731/cjht.2022.250. Accessed 2023 Aug 24.
9.Tsang M, Le M, Ghazawi FM, et al. Multiple myeloma epidemiology and patient geographic distribution in Canada: a population study. Cancer. 2019;125(14):2435-2444. PubMed
10.Mohyuddin GR, Sinnarajah A, Gayowsky A, Chan KKW, Seow H, Mian H. Quality of end-of-life care in multiple myeloma: a 13-year analysis of a population-based cohort in Ontario, Canada. Br J Haematol. 2022;199(5):688-695. PubMed
11.Imbach KJ, Patel A, Levine AD. Ethical considerations in the translation of CAR-T cell therapies. Cell Gene Ther Insights. 2018;4(4):295-307.
12.Gagelmann N, Sureda A, Montoto S, et al. Access to and affordability of CAR T-cell therapy in multiple myeloma: an EBMT position paper. Lancet Haematol. 2022;9(10):e786-e795. PubMed
13.Buitrago J, Adkins S, Hawkins M, Iyamu K, Oort T. Adult survivorship: considerations following CAR T-Cell therapy. Clin J Oncol Nurs. 2019;23(2):42-48. PubMed
14.Atilla E, Kilic P, Gurman G. Cellular therapies: day by day, all the way. Transfus Apher Sci. 2018;57(2):187-196. PubMed
15.Al Hadidi S, Schinke C, Thanendrarajan S, Zangari M, van Rhee F. Enrollment of Black participants in pivotal clinical trials supporting US Food and Drug Administration approval of chimeric antigen receptor-T cell therapy for hematological malignant neoplasms. JAMA Netw Open. 2022;5(4):e228161. PubMed
16.Alqazaqi R, Schinke C, Thanendrarajan S, et al. Geographic and racial disparities in access to chimeric antigen receptor-T cells and bispecific antibodies trials for multiple myeloma. JAMA Netw Open. 2022;5(8):e2228877. PubMed
17.Marinac CR, Ghobrial IM, Birmann BM, Soiffer J, Rebbeck TR. Dissecting racial disparities in multiple myeloma. Blood Cancer J.2020;10(2):19. PubMed
18.Schwartz AL, Alsan M, Morris AA, Halpern SD. Why diverse clinical trial participation matters. N Engl J Med. 2023;388(14):1252-1254. PubMed
19.Knight JM, Hackett E, Szabo A, et al. Associations between socioeconomic status and bispecific LV20.19 CAR T-cell therapy outcomes. Haematologica. 2023;108(2):588-593. PubMed
20.Jecker NS, Wightman AG, Rosenberg AR, Diekema DS. From protection to entitlement: selecting research subjects for early phase clinical trials involving breakthrough therapies. J Med Ethics. 2017;43(6):391-400. PubMed
21.CAR T-cell therapy: perceived need versus actual evidence. Lancet Oncol. 2018;19(10):1259. PubMed
22.Jonsson B, Hampson G, Michaels J, Towse A, von der Schulenburg JG, Wong O. Advanced therapy medicinal products and health technology assessment principles and practices for value-based and sustainable healthcare. Eur J Health Econ. 2019;20(3):427-438. PubMed
23.Choi G, Shin G, Bae S. Price and prejudice? The value of chimeric antigen receptor (CAR) T-cell therapy. Int J Environ Res Public Health. 2022;19(19):12366. PubMed
24.Goncalves E. Value-based pricing for advanced therapy medicinal products: emerging affordability solutions. Eur J Health Econ.2022;23(2):155-163. PubMed
25.Holmes H. Barriers to patient access to CAR-T therapy in the community setting. Journal of Clinical Pathways. 2018; https://www.texasoncology.com/who-we-are/media-center/in-the-news/news-articles/2018/june/barriers-to-patient-access-to-car-t-therapy-in-the. Accessed 2023 Aug 24.
26.de Lima Lopes G, Nahas GR. Chimeric antigen receptor T cells, a savior with a high price. Chin Clin Oncol. 2018;7(2):21. PubMed
27.Brigand T, Prokupkova A, Muller G, ECL Access to Medicines Task Force. CAR-T cell therapies: how much for survival? Brussels (BE): Association of European Cancer Leagues; 2018: https://www.cancer.eu/wp-content/uploads/2018/06/CAR-T-ECL-Article_Final_20062018.pdf. Accessed 2023 Aug 24.
28.Kannarkat JT, Good CB, Parekh N. Value-based pharmaceutical contracts: value for whom? Value Health. 2020;23(2):154-156. PubMed
29.Apostolidou E, Lachowiez C, Juneja HS, et al. Clinical outcomes of patients with newly diagnosed acute lymphoblastic leukemia in a county hospital system. Clin Lymphoma Myeloma Leuk. 2021;21(11):e895-e902. PubMed
30.Cohen AD, Hari P, Htut M, et al. Patient perceptions regarding ciltacabtagene autoleucel treatment: qualitative evidence from interviews with patients with relapsed/refractory multiple myeloma in the CARTITUDE-1 study. Clin Lymphoma Myeloma Leuk.2023;23(1):68-77. PubMed
31.Goldfinger M, Shah N, Cooper DL. Chimeric antigen receptor T-cell therapy for patients with multiple myeloma-a call for equal opportunity. JAMA Oncol. 2023;9(3):297-298. PubMed
32.Kuehn BM. The promise and challenges of CAR-T gene therapy. JAMA. 2017;318(22):2167-2169. PubMed
33.Chimeric antigen receptor T-cell therapy for B-cell cancers: effectiveness and value - final evidence report. Boston (MA): Institute for Clinical and Economic Review (ICER); 2018: https://icer.org/wp-content/uploads/2020/10/ICER_CAR_T_Final_Evidence_Report_032318.pdf. Accessed 2023 Aug 24.
34.Ahmed N, Shahzad M, Shippey E, et al. Socioeconomic and racial disparity in chimeric antigen receptor T cell therapy access. Transplant Cell Ther. 2022;28(7):358-364. PubMed
35.Emole J, Lawal O, Lupak O, Dias A, Shune L, Yusuf K. Demographic differences among patients treated with chimeric antigen receptor T-cell therapy in the United States. Cancer Med. 2022;08:08.
36.Snyder S, Albertson T, Garcia J, Gitlin M, Jun MP. Travel-related economic burden of chimeric antigen receptor T cell therapy administration by site of care. Adv Ther. 2021;38(8):4541-4555. PubMed
37.Blue B. Socioeconomic and racial disparity in chimeric antigen receptor T cell (CART) therapy access. Transplant Cell Ther. 2022;28(7):345-346. PubMed
38.Molina A, Muffly L. CT-095 disparities and incomplete capture of race/ethnicity data in adults with hematologic malignancies referred for cellular therapies. Clin Lymphoma Myeloma Leuk. 2022;22(Suppl 2):S433-S434.
39.Lamprecht M, Dansereau C. CAR T-cell therapy: update on the state of the science. 2019;23(2):6-12.
40.Weinkove R, George P, Ruka M, Haira TH, Giunti G. Chimeric antigen receptor T-cells in New Zealand: challenges and opportunities. N Z Med J. 2021;134(1542):96-108. PubMed
41.First Nations Information Governance Centre (FNIGC). The First Nations Principles of OCAP®. https://fnigc.ca/ocap-training/. Accessed 2023 Aug 24.
42.Cossu G, Birchall M, Brown T, et al. Lancet Commission: stem cells and regenerative medicine. Lancet. 2018;391(10123):883-910. PubMed
43.Mahadeo KM, Khazal SJ, Abdel-Azim H, et al. Management guidelines for paediatric patients receiving chimeric antigen receptor T cell therapy. Nat Rev Clin Oncol. 2019;16(1):45-63. PubMed
44.Darrow JJ, Sarpatwari A, Avorn J, Kesselheim AS. Practical, legal, and ethical issues in expanded access to investigational drugs. N Engl J Med. 2015;372(3):279-286. PubMed
45.McConville H, Harvey M, Callahan C, Motley L, Difilippo H, White C. CAR T-cell therapy effects: review of procedures and patient education. Clin J Oncol Nurs. 2017;21(3):E79-E86.
46.Bach PB, Giralt SA, Saltz LB. FDA approval of tisagenlecleucel: promise and complexities of a $475 000 cancer drug. JAMA. 2017;318(19):1861-1862. PubMed
47.Couzin-Frankel J. For experimental cancer therapy, a struggle to ensure supply keeps up with demand. Science 2017; https://www.sciencemag.org/news/2017/06/experimental-cancer-therapy-struggle-ensure-supply-keeps-demand. Accessed 2023 Aug 24.
48.Kekre N, Hay KA, Webb JR, et al. CLIC-01: Manufacture and distribution of non-cryopreserved CAR-T cells for patients with CD19 positive hematologic malignancies. Front Immunol. 2022;13:1074740. PubMed
49.Snyder S, Chung KC, Jun MP, Gitlin M. Access to chimeric antigen receptor T cell therapy for diffuse large B cell lymphoma. Adv Ther. 2021;38(9):4659-4674. PubMed
50.Unguru Y, Fernandez CV, Bernhardt B, et al. An ethical framework for allocating scarce life-saving chemotherapy and supportive care drugs for childhood cancer. J Natl Cancer Inst. 2016;108(6):djv392. PubMed
51.Gumer JM. A new frontier in the fight against cancer (that is, for those who can afford it): the approval and cost of CAR T-cell therapies. Voices Bioeth. 2018;4. https://journals.library.columbia.edu/index.php/bioethics/article/view/6024/2987. Accessed 2023 Aug 24.
52.Gonzalez-Vicent M, Sanz J, Fuster JL, et al. Autoimmune hemolytic anemia (AIHA) following allogeneic hematopoietic stem cell transplantation (HSCT): a retrospective analysis and a proposal of treatment on behalf of the Grupo Espanol De Trasplante de Medula Osea en Ninos (GETMON) and the Grupo Espanol de Trasplante Hematopoyetico (GETH). Transfus Med Rev.2018;32(3):179-185. PubMed
53.Prasad V. T-Cell lymphoma from CAR T-cell therapy—a new safety notice. JAMA. 2024;331(5):389-390. PubMed
54.U.S. Food and Drug Administration (FDA). FDA requires boxed warning for T cell malignancies following treatment with BCMA-directed or CD19-directed autologous chimeric antigen receptor (CAR) T cell immunotherapies. 2024; https://www.fda.gov/vaccines-blood-biologics/safety-availability-biologics/fda-requires-boxed-warning-t-cell-malignancies-following-treatment-bcma-directed-or-cd19-directed. Accessed 2024 Jul 08.
55.Bell J, Jeffries G, Chen C. Mitigating inequity: ethically prioritizing patients to CAR T-cell therapy. Blood. 2023;142(15):1263-1270. PubMed
56.Derman BA, Parker WF. Fair allocation of scarce CAR T-cell therapies for relapsed/refractory multiple myeloma. JAMA. 2023;330(8):687-688. PubMed
57.Goldfinger M, Shah N, Cooper DL. Chimeric antigen receptor T-cell therapy for patients with multiple myeloma—a call for equal opportunity. JAMA Oncology. 2023;9(3):297-298. PubMed
58.Kuipers MT, Kersten MJ. CAR Traffic jam: who can use the fast lane? Blood. 2023;142(15):1257-1258. PubMed
ISSN: 2563-6596
Canada’s Drug Agency (CDA-AMC) is a pan-Canadian health organization. Created and funded by Canada’s federal, provincial, and territorial governments, we’re responsible for driving better coordination, alignment, and public value within Canada’s drug and health technology landscape. We provide Canada’s health system leaders with independent evidence and advice so they can make informed drug, health technology, and health system decisions, and we collaborate with national and international partners to enhance our collective impact.
Disclaimer: CDA-AMC has taken care to ensure that the information in this document was accurate, complete, and up to date when it was published, but does not make any guarantee to that effect. Your use of this information is subject to this disclaimer and the Terms of Use at cda-amc.ca.
The information in this document is made available for informational and educational purposes only and should not be used as a substitute for professional medical advice, the application of clinical judgment in respect of the care of a particular patient, or other professional judgments in any decision-making process. You assume full responsibility for the use of the information and rely on it at your own risk.
CDA-AMC does not endorse any information, drugs, therapies, treatments, products, processes, or services. The views and opinions of third parties published in this document do not necessarily reflect those of CDA-AMC. The copyright and other intellectual property rights in this document are owned by the Canadian Agency for Drugs and Technologies in Health (operating as CDA-AMC) and its licensors.
Questions or requests for information about this report can be directed to Requests@CDA-AMC.ca.