CADTH Health Technology Review
Intermittently Scanned and Real-Time Continuous Glucose Monitoring for People With Diabetes
Rapid Review
Authors: Keeley Farrell, Hannah Loshak
Abbreviations
A1C
hemoglobin A1C
CGM
continuous glucose monitoring
isCGM
intermittently scanned continuous glucose monitoring
RCT
randomized controlled trial
rtCGM
real-time continuous glucose monitoring
Key Messages
Continuous glucose monitoring is a method of glucose testing in which a sensor is inserted into the skin and continuously monitors interstitial glucose concentrations. Real-time continuous glucose monitoring (rtCGM) systems automatically measure glucose and display a recent glucose value. Intermittently scanned continuous glucose monitoring (isCGM) systems require the person using the system to scan the sensor to display glucose information.
The evidence of the comparative effectiveness of isCGM versus rtCGM for improving time in range, time above range, A1C, and quality of life in people with type 1 diabetes is uncertain. Evidence from some studies suggested there was a significant benefit favouring rtCGM versus isCGM for these outcomes, whereas other studies found no significant differences between treatment groups.
Evidence suggested that people with type 1 diabetes using rtCGM spent significantly less time below range/time in hypoglycemia than those using isCGM.
The evidence of the comparative safety of isCGM versus rtCGM in people with type 1 diabetes is limited and uncertain. Evidence from 1 study suggested that severe hypoglycemic events were more frequent in those using isCGM. In other studies, there were no severe hypoglycemic events in either treatment group.
No studies were identified that evaluated the comparative effectiveness of isCGM versus rtCGM in people living with type 2 diabetes or gestational diabetes.
Context and Policy Issues
Diabetes is a chronic condition in which the body is not able to produce enough insulin and/or properly use insulin.1 The body needs insulin to use sugar as an energy source.1 There are 3 main types of diabetes including type 1 diabetes, type 2 diabetes, and gestational diabetes. Type 1 diabetes is an autoimmune condition in which the insulin-producing beta cells of the pancreas are destroyed by the immune system.2 Type 1 diabetes is often diagnosed in childhood and common presenting symptoms include frequent urination, excessive thirst, weight loss, and diabetic ketoacidosis (a potentially life-threatening complication of diabetes in which acids called ketones build up to dangerous levels in the body).3,4 Type 2 diabetes is a condition that occurs when the body does not make enough insulin and/or does not respond to the insulin it makes.1 In the early stages of type 2 diabetes there may be no symptoms or only mild symptoms that can go unnoticed.5 When symptoms are present, they can include frequent urination, excessive thirst and hunger, fatigue, blurry vision, slow-healing wounds and tingling, pain, or numbness in the hands and/or feet.5 Gestational diabetes is a form of diabetes that develops during pregnancy and resolves after delivery.1 Gestational diabetes affects approximately 4% of people who are pregnant.1 There are approximately 3 million people in Canada living with diagnosed diabetes.6 This corresponds to 1 in 300 children and youth and 1 in 10 adults.6 In Canada, it is estimated that approximately 90% of adults living with diabetes have type 2 diabetes.6
All people living with type 1 diabetes and some people with type 2 diabetes or gestational diabetes need to take insulin to keep blood glucose levels within the target range.1,7 There are many ways insulin therapy can be delivered including multiple daily injections (MDI) and insulin pumps.7 Blood glucose monitoring is used in combination with insulin therapy to adjust insulin doses and maintain glucose control.8 The traditional method for blood glucose monitoring is self-monitoring of blood glucose using a glucometer.9 Self-monitoring of blood glucose requires a fingerstick to take a blood sample which can be painful and time-consuming.10 Some people living with diabetes find it difficult to practice self-monitoring of blood glucose at the recommended rates.8 Additionally, nocturnal or asymptomatic hypoglycemia (low blood glucose) may not be recognized through self-monitoring of blood glucose.10 Severe hypoglycemia can lead to coma or death.10 Continuous glucose monitoring (CGM) systems continuously measure the glucose concentration in the interstitial fluid and transfer the data to a receiver that displays the results.10 These devices represent another blood glucose monitoring option for people living with diabetes.
CGM systems typically consist of a sensor inserted into the deepest layer of the skin, a transmitter that is attached to the sensor, and a receiver or smartphone that displays the results.10 There are several types of CGM systems, including isCGM (also known as flash glucose monitoring) and rtCGM. rtCGM systems (e.g., Dexcom G6, Guardian Connect) measure the glucose values and automatically display a recent value.10 isCGM systems (e.g., FreeStyle Libre) measure glucose levels every minute and store 1 value every 15 minutes.10 isCGM systems need to be actively scanned to display glucose information.10 Only the most recent 8 hours of data are retained in isCGM systems and therefore the person using the system must scan the sensor at least every 8 hours to avoid data gaps.11 rtCGM systems have the capability for alerts and alarms for current and/or impending glycemic events such as hyperglycemia (high blood glucose) or hypoglycemia.11 Some of the older rtCGM systems (e.g., Dexcom G5) require daily calibration with self-monitoring of blood glucose whereas the newer devices (e.g., Dexcom G6) do not.11 isCGM systems do not require calibration with self-monitoring of blood glucose.11 Typical sensor application sites are the abdomen for rtCGM and the upper arm for isCGM.10 Due to the differences between the rtCGM and isCGM systems, evidence of the comparative effectiveness of isCGM versus rtCGM in people living with diabetes could help aid decision-making around the use of these systems.
The aim of this report is to summarize the evidence regarding the comparative clinical effectiveness of monitoring glycemia with isCGM versus rtCGM in people living with diabetes.
Research Question
What is the comparative clinical effectiveness of monitoring glycemia with intermittently scanned continuous glucose monitoring versus real-time continuous glucose monitoring in people with diabetes?
Methods
Literature Search Methods
A limited literature search was conducted by an information specialist on key resources including MEDLINE and Embase via OVID, the Cochrane Database of Systematic Reviews, the International HTA Database, the websites of Canadian and major international health technology agencies, as well as a focused internet search. The search strategy comprised both controlled vocabulary, such as the National Library of Medicine’s MeSH (Medical Subject Headings), and keywords. The main search concepts were intermittently scanned continuous glucose monitoring and real-time continuous glucose monitoring. No filters were applied to limit the retrieval by study type. Comments, newspaper articles, editorials, and letters were excluded. Where possible, retrieval was limited to the human population. The search was completed on May 13, 2022 and limited to English-language documents published since January 1, 2017.
Selection Criteria and Methods
One reviewer screened citations and selected studies. In the first level of screening, titles and abstracts were reviewed and potentially relevant articles were retrieved and assessed for inclusion. The final selection of full-text articles was based on the inclusion criteria presented in Table 1.
Criteria | Description |
|---|---|
Population | People with diabetes (e.g., type 1, type 2) |
Intervention | Intermittently scanned continuous glucose monitoring |
Comparator | Real-time continuous glucose monitoring |
Outcomes | Clinical effectiveness (e.g., A1C, glucose management indicator [e.g., proportion of participants with a value ≤ 7.0%], quality of life, time spent in target glucose ranges [e.g., between 3.9 mmol/L and 10.0 mmol/L], time spent below target glucose ranges [e.g., < 3.9 mmol/L], time spent above target glucose ranges [e.g., > 10.0 mmol/L], glycemic variability [e.g., proportion of participants with a value ≤ 36%], safety [e.g., hypoglycemia events, device-related adverse events]) |
Study designs | Health technology assessments, systematic reviews, randomized controlled trials, non-randomized studies |
Exclusion Criteria
Articles were excluded if they did not meet the selection criteria outlined in Table 1, they were duplicate publications, or were published before 2017. Systematic reviews in which all relevant studies were captured in other more recent or more comprehensive systematic reviews were excluded. Primary studies retrieved by the search were excluded if they were captured in 1 or more included systematic reviews. Single-arm before-after studies were excluded.
Critical Appraisal of Individual Studies
The included publications were critically appraised by 1 reviewer using the following tools as a guide: A MeaSurement Tool to Assess systematic Reviews 2 (AMSTAR 2)12 for systematic reviews, and the Downs and Black checklist13 for randomized and non-randomized studies. Summary scores were not calculated for the included studies; rather, the strengths and limitations of each included publication were described narratively.
Summary of Evidence
Quantity of Research Available
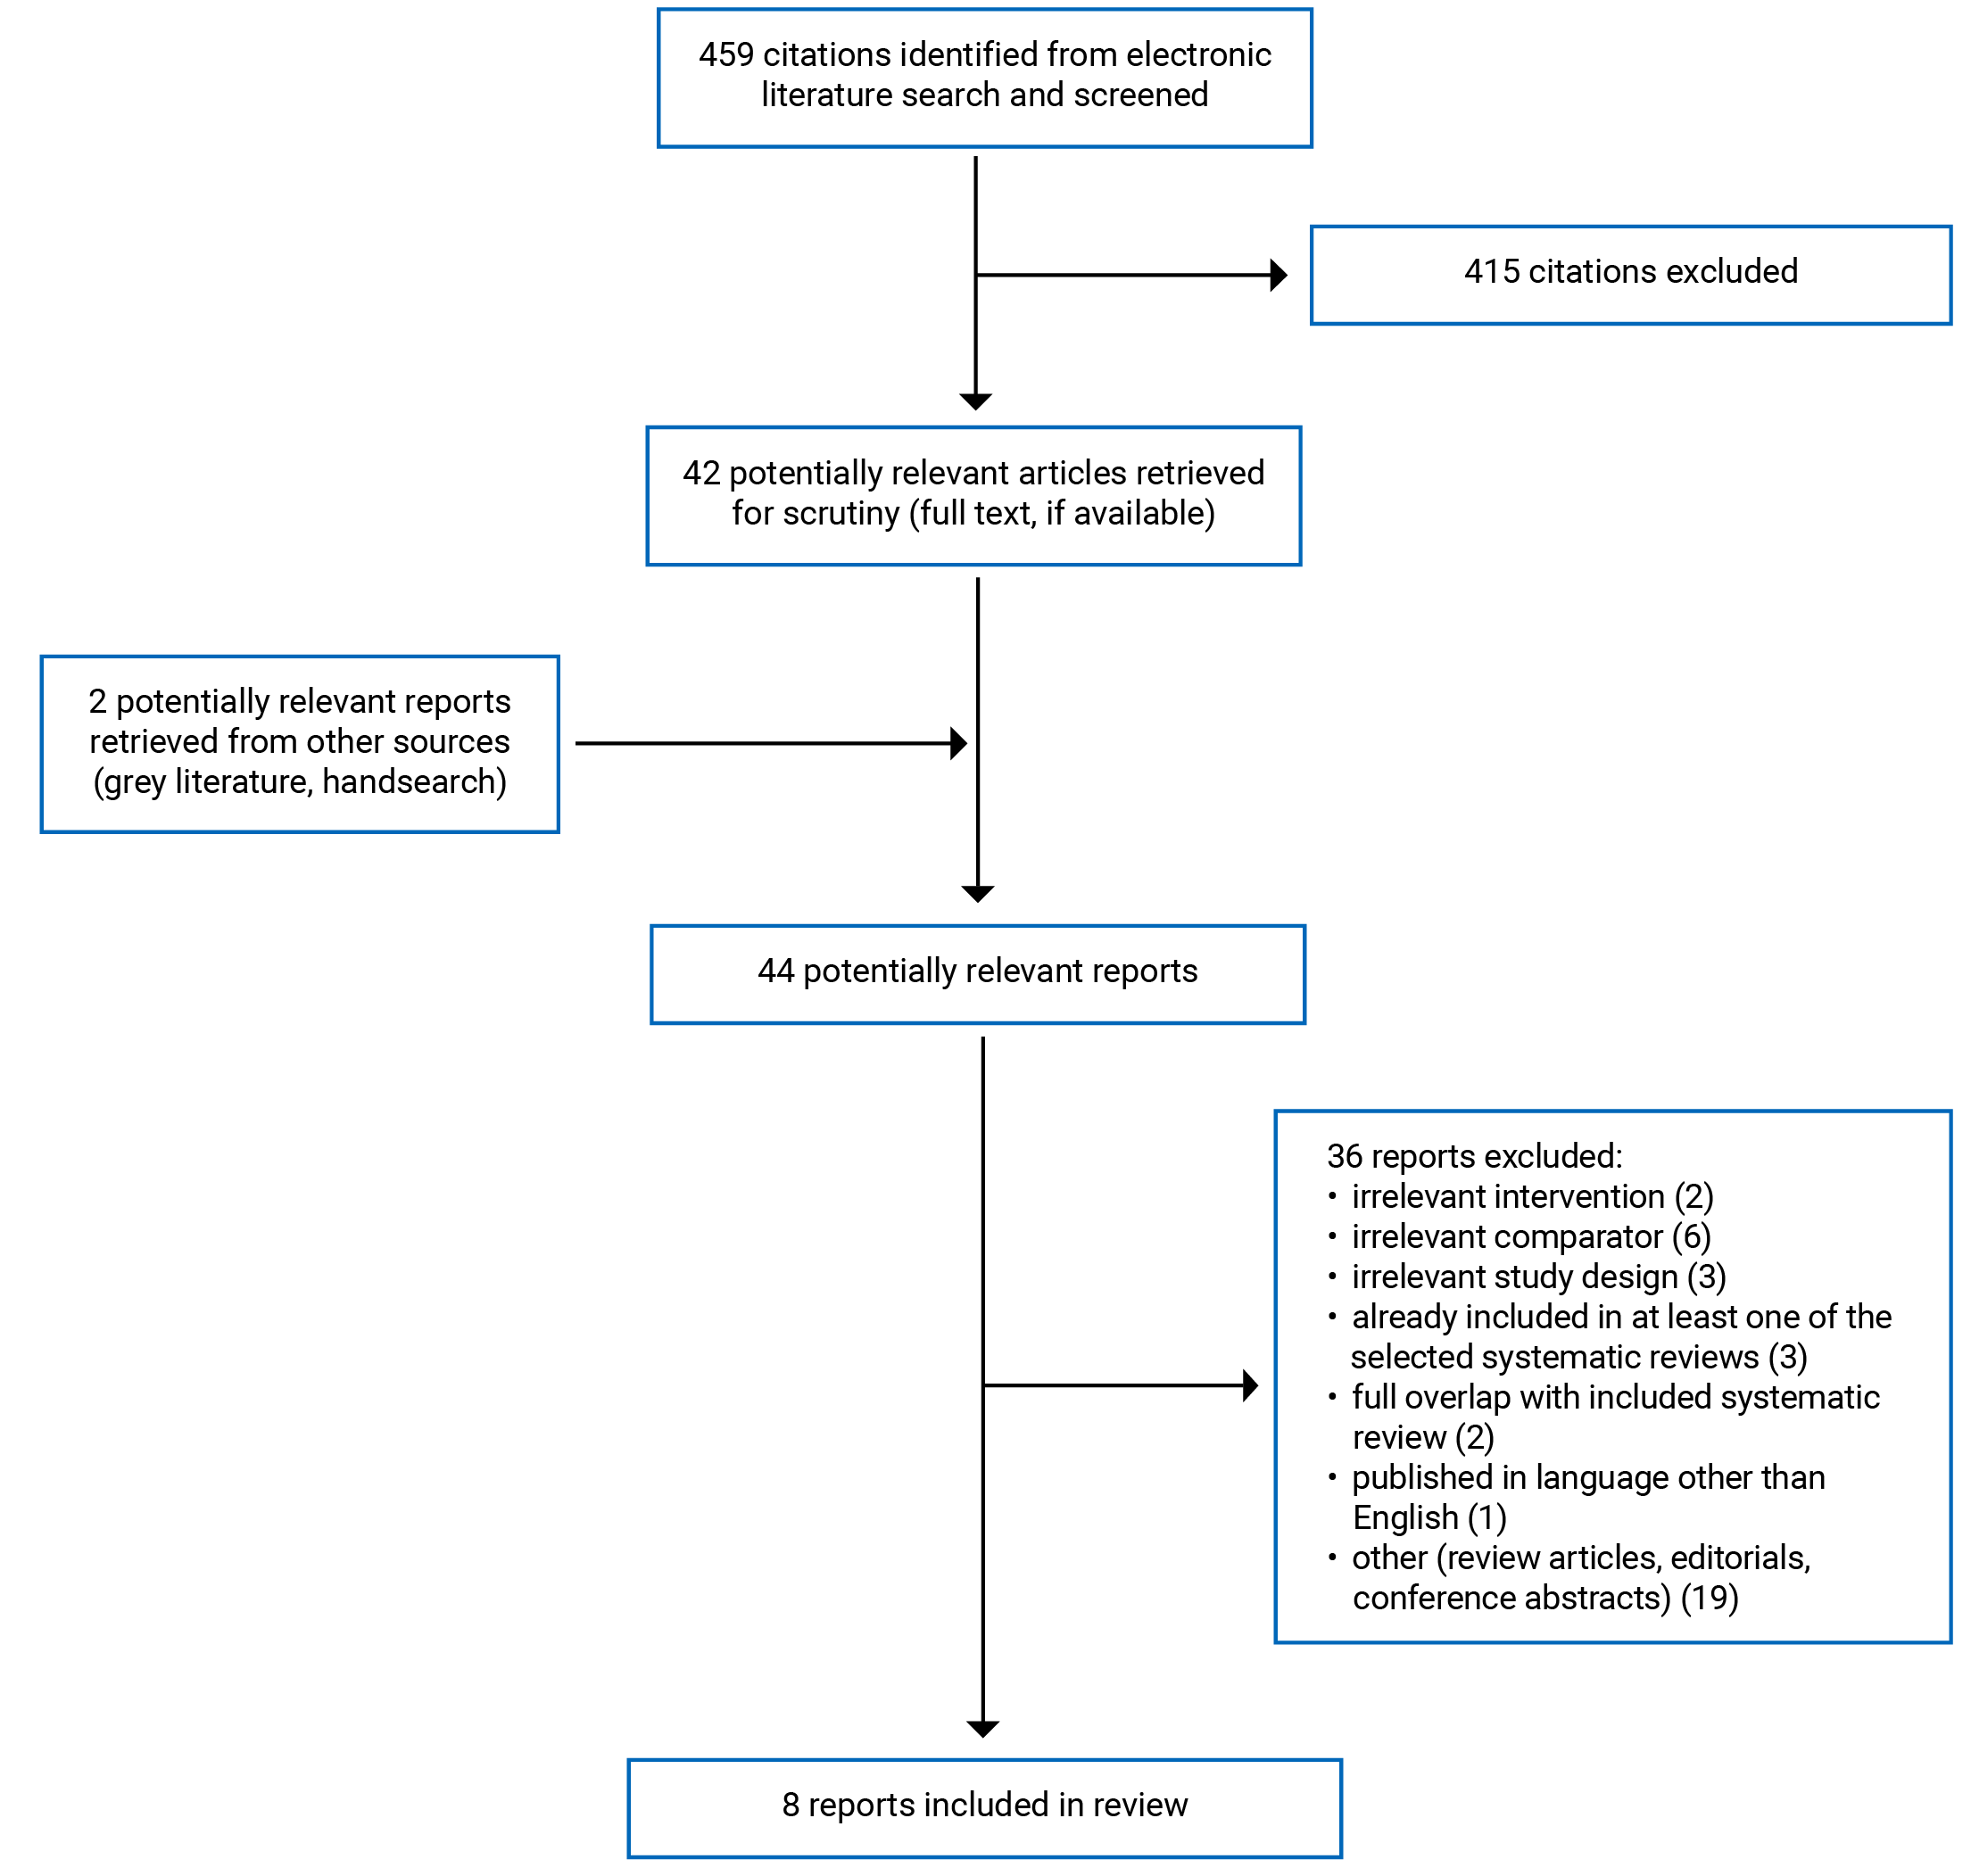
A total of 459 citations were identified in the literature search. Following screening of titles and abstracts, 415 citations were excluded and 42 potentially relevant reports from the electronic search were retrieved for full-text review. Two potentially relevant publications were retrieved from the grey literature search for full-text review. Of these potentially relevant articles, 36 publications were excluded for various reasons, and 8 publications met the inclusion criteria and were included in this report. These comprised 1 systematic review, 2 randomized controlled trials (RCTs), and 5 non-randomized studies. Appendix 1 presents the PRISMA14 flow chart of the study selection.
Additional references of potential interest are provided in Appendix 5.
Summary of Study Characteristics
In total, 1 systematic review,15 2 RCTs16,17 and 5 non-randomized studies18-22 were included in this report.
The systematic review15 had broader inclusion criteria than the present report. Specifically, it included studies that evaluated isCGM versus a range of comparators. The systematic review included 1 RCT and its extension study that evaluated a comparison of interest (i.e., isCGM versus rtCGM). Only the characteristics and results of the relevant study will be described in this report.
Additional details regarding the characteristics of included publications are provided in Appendix 2.
Study Design
The systematic review by Cowart et al. (2020)15 included 1 RCT and its extension study that are relevant to the present report. The search time frame was RCTs published up to and including November 8, 2019.
Both of the included RCTs were open-label. The Visser et al. (2021)16 RCT was a multi-centre study and the Haskova et al. (2020)17 RCT was a single-centre study.
Three of the included non-randomized studies were retrospective cohort studies.18,19,22 The other 2 non-randomized studies were cross-sectional studies.20,21
Country of Origin
The systematic review by Cowart et al. (2020)15 was authored by researchers in the US.
One of the RCTs was conducted in Belgium16 and the other RCT was conducted in the Czech Republic.17 The retrospective cohort studies were conducted in Japan,18 the UK,19 and Sweden.22 One of the cross-sectional studies was conducted in Italy20 and the other cross-sectional study was conducted in Germany and Austria.21
Patient Population
Participants in the relevant RCT and extension study included in the systematic review were adults with type 1 diabetes with impaired awareness of hypoglycemia or severe hypoglycemia.15 There were 20 participants in the isCGM group and 20 participants in the rtCGM group.15
The RCT by Visser et al. (2021)16 included 254 people (127 in the rtCGM group, 127 participants in the isCGM group) with type 1 diabetes. The mean age of participants was 42.8 years in the rtCGM group and 43 years in the isCGM group.16 The mean baseline A1C was 7.4% in both groups.16 The RCT by Haskova et al. (2020)17 included 60 people (30 in the rtCGM group, 30 in the isCGM group) with type 1 diabetes. The mean age of participants was 39.6 years in the rtCGM group and 37.8 years in the isCGM group.17 The mean baseline A1C was 7.7% in the rtCGM group and 8.0% in the isCGM group.17
The retrospective cohort study by Urakami et al. (2022)18 included 112 children and adolescents (36 in the rtCGM group, 76 in the isCGM group) with type 1 diabetes. The mean age of participants was 10.8 years in the rtCGM group and 11.7 years in the isCGM group.18 The retrospective cohort study by Prabhu Navis et al. (2021)19 included 269 adults (190 in the isCGM group and 79 in the rtCGM group) with type 1 diabetes. The mean age of participants was 41.4 years and the mean baseline A1C was 7.3%.19 The cross-sectional study by Cherubini et al. (2020)20 included 665 children and adolescents (325 who used isCGM and 340 who used rtCGM) with type 1 diabetes and a median age of 12 years. The cross-sectional study by Sandig et al. (2020)21 included 233 adults (185 who used isCGM, 48 who used rtCGM) with type 1 diabetes. The median age of participants was 19 years and the median baseline A1C was 7.3%.21 The retrospective cohort study by Kristensen et al. (2019)22 included 186 pregnant women (92 in the rtCGM group, 94 in the isCGM group) with type 1 diabetes. The median age of participants was 31 years in both groups.22
Interventions and Comparators
The devices used for rtCGM and isCGM were not specified in the cross-sectional study by Sandig et al. (2020).21 In all the other included studies FreeStyle Libre was the device used for isCGM.15-20,22 The device used for rtCGM was the Dexcom G6 in the RCT by Visser et al. (2021)16 and the retrospective cohort study by Prabhu Navis et al. (2021).19 The device used for rtCGM was the Dexcom G5 in the relevant RCT included in the systematic review by Cowart et al. (2020).15 The Dexcom G4 was the device used for rtCGM in the retrospective cohort studies by Urakami et al. (2022)18 and Kristensen et al. (2019).22 The Guardian Connect was the device used for rtCGM in the RCT by Haskova et al. (2020).17 In the cross-sectional study by Cherubini et al. (2020)20 multiple devices were used for rtCGM including the Dexcom G4, Dexcom G5, Dexcom G6, and Guardian Connect.
Participants in the Sandig et al. (2020)21 and Cherubini et al. (2020)20 studies were separated into 4 treatment groups based on the type of CGM used (rtCGM or isCGM) and type of insulin therapy. In the Sandig et al. (2020)21 study the insulin therapies were multiple daily injections or continuous subcutaneous insulin infusion. Results for the group of participants (n = 10) who used multiple daily injections and rtCGM were not presented because the authors stated that the sample size was too small to draw valid inferences.21 In the Cherubini et al. (2020)20 study the insulin therapies were multiple daily injections or insulin pump.
Outcomes
The systematic review and all the included primary studies assessed CGM metrics such as time in range, time below range, time above range.15-22 In the relevant RCT included in the systematic review15 and 6 of the included primary studies16-21 time in range was defined as a sensor glucose of 3.9 mmol/L to 10.0 mmol/L (70 to 80 mg/dL). In the Kristensen et al. (2019)22 study time in range was defined as sensor glucose of 3.5 mmol/L to 7.8 mmol/L. Time below range/time in hypoglycemia and time above range and time in hyperglycemia were defined using a range of glucose sensor values in the included studies. Additional CGM metrics including glycemic variability (expressed as the coefficient of variation), mean sensor glucose, and low and high blood glucose index were assessed in the studies by Haskova et al. (2020),17 Sandig et al. (2020),21 and Kristensen et al. (2019).22 High blood glucose index and low blood glucose index convert glucose values to risk scores that predict the risk of high and low blood glucose values, respectively.22 Mean amplitude of glycemic or glucose excursion was assessed in the studies by Haskova et al. (2020)17 and Kristensen et al. (2019).22 Mean amplitude of glycemic/glucose excursion summarizes glycemic variability by identifying and summarizing significant glucose highs and lows.22 The A1C was assessed in the Urakami et al. (2022)18 and Visser et al. (2021)16 studies. Estimated A1C was also assessed in the Urakami et al. (2022)18 study and was calculated using the mean glucose level on CGM.
The Kristensen et al. (2019)22 study assessed maternal and neonatal outcomes including pre-eclampsia/ pregnancy-induced hypertension, Caesarean section, preterm birth, mean birth weight, large for gestational age infant, macrosomia, 5-minute Apgar score lower than 7, shoulder dystocia, neonatal hypoglycemia, neonatal intensive care unit admission longer than 24 hours, and neonatal composite outcome.
Quality of life was assessed in both the included RCTs.16,17 In the Visser et al. (2021)16 study quality of life was evaluated using the Diabetes Treatment Satisfaction Questionnaire. The study also assessed hypoglycemia fear using the Hypoglycemia Fear Survey version II worry subscale.16 In the Haskova et al. (2020)17 study quality of life was evaluated using the WHO Quality of Life-BREF assessment.
Adverse events were assessed in the Urakami et al. (2022),18 Visser et al. (2021),16 and Haskova et al. (2020)17 studies.
Summary of Critical Appraisal
Additional details regarding the strengths and limitations of included publications are provided in Appendix 3.
Systematic Review
The systematic review by Cowart et al. (2020)15 had a clear research objective. The inclusion criteria included the elements of population, intervention, and outcomes; however, eligible comparators were not specified. The review authors did not state whether the review methods were established before conducting the review. This has the potential to introduce bias if the methods were adjusted after the review had begun. The literature search was conducted in multiple databases and a trial registry, and the full search strategy was provided. Providing details on the search strategy increases its reproducibility. The authors did not provide a list of the excluded studies however, they did provide the reasons for exclusion. Study selection was performed independently by 2 authors, reducing the risk of bias in this domain. The authors do not state whether data extraction was performed in duplicate. Performing data extraction in duplicate reduces the likelihood of inconsistencies. The populations, interventions, and comparators of the included primary studies were described in adequate detail; however, the countries the included studies were conducted in were not specified. The risk of bias of the included primary studies was assessed using appropriate methods. The sources of funding for the individual studies included in the review were not specified. The authors did not receive funding for the review and stated that they had no potential conflicts of interest.15
Primary Clinical Studies
The study objective, patient characteristics, interventions, and main findings were clearly described in both RCTs16,17 and 4 of the non-randomized studies.18-20,22 In the Sandig et al. (2020)21 study the objective was clearly described; however, other details of the study were lacking. The inclusion and exclusion criteria for participants were not specified and the specific devices used for rtCGM and isCGM were not reported.21 Additionally, the adjusted comparisons between treatment groups were only reported graphically and therefore, exact values could not be ascertained.21 The main outcome measures used were valid and reliable for all the studies.16-22 Commonly known adverse events were reported in both RCTs16,17 and 1 of the non-randomized studies.18 The other 4 non-randomized studies19-22 did not report commonly known adverse events (e.g., severe hypoglycemia, diabetic ketoacidosis, skin reactions). In all the studies participants in different intervention groups were recruited from the same population.16-22 Both the RCTs16,17 were open-label, and patients and investigators were not blind to group allocation. Participants were not randomized to intervention groups and participants and investigators were not blind to group allocation in all the non-randomized studies.18-22 Objective outcomes such as CGM metrics are unlikely to be influenced by blinding; however, subjective outcomes such as quality of life could be at risk of performance bias or measurement bias. Randomization aims to balance the distribution of known and unknown confounders between treatment groups. In both the Cherubini et al. (2020)20 and Sandig et al. (2020)21 studies the main outcomes were adjusted for specific baseline characteristics. In the 5 other studies potential confounders were not discussed or adjusted for.16-19 In the Visser et al. (2021)16 RCT the key secondary outcomes were adjusted for multiplicity; however, no adjustment was made for the other outcomes. No adjustments were made for multiplicity in the other 6 studies.17-22 Adjusting for multiplicity is important for studies that assess multiple outcomes due to the potential inflation of the type I error rate. The authors of the Urakami et al. (2022)18 study reported their potential conflicts of interest however, they did not report whether they received any funding for the study. The other 6 studies reported their funding sources and potential conflicts of interest.16,17,19-22
Summary of Findings
Appendix 4 presents the main study findings.
Clinical Effectiveness of rtCGM Versus isCGM
Evidence regarding the clinical effectiveness of rtCGM versus isCGM for people with type 1 diabetes was available from 1 systematic review,15 2 RCTs16,17 and 5 non-randomized studies.18-22
Time in Range
In both RCTs16,17 and 1 cross-sectional study21 there was a statistically significant difference in time in range (3.9 mmol/L to 10.0 mmol/L) in favour of rtCGM versus isCGM in adults with type 1 diabetes. In the retrospective cohort study by Urakami et al. (2022) there was a statistically significant difference in time in range (3.9 mmol/L to 10.0 mmol/L) in favour of rtCGM versus isCGM in children and adolescents with type 1 diabetes. In the cross-sectional study by Cherubini et al. (2020)20 children and adolescents receiving treatment with an insulin pump and rtCGM had a statistically significantly higher median time in range (3.9 mmol/L to 10.0 mmol/L) than those receiving treatment with multiple daily injections and rtCGM or either insulin therapy and isCGM. There were no significant differences for time in range (3.9 mmol/L to 10.0 mmol/L) between treatment groups in the systematic review15 (1 RCT) or the retrospective cohort study by Prabhu Navis et al. (2021).19 There was no significant difference in time in range (3.5 mmol/L to 7.8 mmol/L) between treatment groups in the retrospective cohort study by Kristensen et al. (2019).22
Time Below Range or Time in Hypoglycemia
In both RCTs16,17 there was a statistically significant difference in time below range (< 3.0 mmol/L) in favour of rtCGM versus isCGM in adults with type 1 diabetes. In 1 RCT17 and 1 retrospective cohort study19 there was a statistically significant difference in time below range (< 3.9 mmol/L) in favour of rtCGM versus isCGM in adults with type 1 diabetes. In the systematic review15 (1 RCT) there was a statistically significant difference in time in hypoglycemia (< 3.3 mmol/L) in favour of the rtCGM group versus isCGM group in adults with type 1 diabetes. Results from the retrospective cohort study by Kristensen et al. (2019)22 suggested there was a statistically significant difference in time in hypoglycemia (< 3.5 mmol/L) in favour of rtCGM versus isCGM in pregnant women with type 1 diabetes. Results from 2 non-randomized studies18,20 suggested there was a statistically significant difference in time below range (< 3.9 mmol/L) in favour of children and adolescents with type 1 diabetes using rtCGM versus isCGM. Results from the cross-sectional study by Sandig et al. (2020)21 suggested there was no significant difference in time below range (< 3.9 mmol/L) between groups.
Time Above Range or Time in Hyperglycemia
In the cross-sectional study by Sandig et al. (2020)21 there was a statistically significant difference in time above 13.9 mmol/L in favour of the rtCGM versus isCGM in adults with type 1 diabetes. Results from the RCT by Haskova et al. (2020)17 suggested that there were statistically significant differences in time above 10.0 mmol/L and 13.9 mmol/L in favour of rtCGM versus isCGM in adults with type 1 diabetes. Results from the cross-sectional study by Cherubini et al. (2020)20 suggested that there was a statistically significant difference in time above range (> 10.0 mmol/L) in favour of insulin pump and rtCGM versus multiple daily injections and isCGM in children and adolescents treated with type 1 diabetes. There were no significant differences in time above range between treatment groups in the systematic review15 (1 RCT), and 3 non-randomized studies.18,19,22
Additional Continuous Glucose Monitoring Metrics
In the RCT by Haskova et al. (2020)17 there were no significant differences between groups for mean glycemic variability, mean amplitude of glycemic excursion, or mean sensor glucose. In the retrospective cohort study by Kristensen et al. (2019)22 low blood glucose index was significantly lower in all trimesters in pregnant women with type 1 diabetes using rtCGM versus isCGM. There were no significant differences between groups for mean glucose levels, glycemic variability, mean amplitude of glucose excursions, or high blood glucose index.22
Quality of Life
Results from the RCT by Visser et al. (2021)16 suggested that there were statistically significant differences in the Diabetes Treatment Satisfaction Questionnaire score and satisfaction subscale in favour of rtCGM versus isCGM in adults with type 1 diabetes. There was also a statistically significant difference in the Hypoglycaemia Fear Survey version II worry subscale in favour of the rtCGM group versus isCGM group.16 In the RCT by Haskova et al. (2020)17 there were no significant within-group or between-group differences in patient-reported quality of life.
Hemoglobin A1C
Results from the RCT by Visser et al. (2021)16 suggested that mean A1C was statistically significantly lower in the rtCGM group versus the isCGM group. There were no significant differences between groups in laboratory measured A1C or estimated A1C in the retrospective cohort study by Urakami et al. (2022).18
Maternal and Neonatal Outcomes
There were no significant differences between treatment groups in any of the maternal and neonatal outcomes assessed in the retrospective cohort study by Kristensen et al. (2019).22
Safety
In the Urakami et al. (2022)18 study 5 people in the isCGM group and 1 person in the rtCGM group experienced skin reactions, redness and/or irritation at the sensor attachment site. No participants in either group experienced severe hypoglycemia.18 In the RCT by Visser et al. (2021)16 38 serious adverse events were reported including 30 severe hypoglycemic events in the isCGM group and 3 severe hypoglycemic events and 1 acute hyperglycemia leading to hospitalization in the rtCGM group. None of the serious adverse events were caused by device malfunction.16 Bleeding after sensor insertion was reported by 12 people in the rtCGM group and skin reactions were more frequent in the isCGM group.16 In the RCT by Haskova et al. (2020)17 no clinically relevant skin reactions or episodes of severe hypoglycemia or diabetic ketoacidosis were reported.
Limitations
None of the included primary studies were conducted in Canada.16-22 The systematic review did not specify where the relevant RCT was conducted.15 Therefore, it is unclear whether the results summarized in the report are generalizable Canada. Additionally, all the included studies evaluated rtCGM versus isCGM in people with type 1 diabetes. The comparative effectiveness of rtCGM versus isCGM in people with type 2 diabetes or gestational diabetes is unknown. Limited evidence was identified that evaluated rtCGM versus isCGM in children and adolescents. Two non-randomized studies were identified that included children and adolescents with type 1 diabetes.18,20
The findings summarized in this review are based on the way the outcomes were reported in the included publications. All the included studies evaluated time in range metrics; however, the clinical significance of this outcome is uncertain. There is some evidence suggesting that time in range has a strong relationship with A1C.23 However, a 2019 review concluded that time in range should not be considered a validated surrogate marker of diabetes-related complications due to lack of evidence.24
No studies were identified in which participants and investigators were blind to group allocation. Unblinded studies are at an increased risk for multiple forms of bias. Due to the nature of rtCGM and isCGM a blinded trial comparing the devices is likely not possible (i.e., participants can see and interact with the device).
Conclusions and Implications for Decision- or Policy-Making
This report comprised 1 systematic review,15 2 RCTs,16,17 and 5 non-randomized studies18-22 that evaluated rtCGM versus isCGM in people with type 1 diabetes. No relevant evidence for people with type 2 diabetes or gestational diabetes was identified.
Overall, the evidence regarding the clinical effectiveness of rtCGM versus isCGM for people with type 1 diabetes was mixed. Evidence from 2 RCTs16,17 and 3 non-randomized studies18,20,21 suggested there was a significant difference in time in range in favour of rtCGM in people with type 1 diabetes. Evidence from 1 systematic review15 (1 RCT) and 2 non-randomized studies19,22 suggested there was no significant difference in time in range between people with type 1 diabetes using rtCGM versus isCGM. Evidence from 1 systematic review15 (1 RCT), 2 RCTs,16,17 and 4 non-randomized studies18-20,22 suggested that people with type 1 diabetes using rtCGM spent significantly less time below range or time in hypoglycemia than those using isCGM. Results from 1 RCT17 and 2 non-randomized studies20,21 suggested that people with type 1 diabetes using rtCGM spent significantly less time above range than those using isCGM. Results from 1 systematic review15 (1 RCT) and 3 non-randomized studies18,19,22 suggested there were no significant differences between groups for time above range. The uncertainty around the clinical significance of glucose time in range metrics should be considered when interpreting these results.
Results from 1 RCT suggested that mean A1C was significantly lower in adults with type 1 diabetes using rtCGM versus isCGM.16 Results from 1 non-randomized study suggested there were no significant differences in A1C in children and adolescents with type 1 diabetes using rtCGM versus isCGM.18 Results from 1 RCT suggested there were significant differences in quality of life in favour of rtCGM.16 Results from a different RCT suggested there were no significant differences between treatment groups in quality of life.17 In 1 RCT severe hypoglycemic events and skin reactions were more frequent in the isCGM group; however, bleeding after sensor insertion only occurred in the rtCGM group.16 In a different RCT no clinically relevant skin reactions or episodes of severe hypoglycemia or diabetic ketoacidosis were reported in either group.17 In a non-randomized study of children and adolescents 5 people in the isCGM group and 1 person in the rtCGM group experienced skin reactions, redness and/or irritation at the sensor attachment site and 0 participants in either group experienced severe hypoglycemia.18
The limitations of the included literature (e.g., uncertain clinical significance of time in range metrics, lack of blinding, non-randomized studies) should be considered when interpreting the findings of this report. The evidence around time in range, time above range, and quality of life was mixed. Evidence from 1 systematic review15 (1 RCT), 2 RCTs,16,17 and 4 non-randomized studies18-20,22 suggested that people with type 1 diabetes using rtCGM spent significantly less time below range or time in hypoglycemia than those using isCGM. Additional high-quality studies that evaluate safety as well as outcomes such as diabetes-related complications and quality of life in people with diabetes using rtCGM versus isCGM would help stakeholders in decision-making around the use of these devices.
References
1.Public Health Agency of Canada. Diabetes facts. 2012; https://www.canada.ca/en/public-health/services/chronic-diseases/diabetes/diabetes-facts.html Accessed 2022 Jun 9.
2.Simmons KM, Michels AW. Type 1 diabetes: A predictable disease. World J Diabetes. 2015;6(3):380-390. PubMed
3.DiMeglio LA, Evans-Molina C, Oram RA. Type 1 diabetes. Lancet. 2018;391(10138):2449-2462. PubMed
4.Centers for Disease Control and Prevention. Diabetic ketoacidosis. 2021; https://www.cdc.gov/diabetes/basics/diabetic-ketoacidosis.html#:~:text=Diabetic%20ketoacidosis%20(DKA)%20is%20a,cells%20for%20use%20as%20energy. Accessed 2022 Jun 9.
5.Artasensi A, Pedretti A, Vistoli G, Fumagalli L. Type 2 Diabetes Mellitus: A Review of Multi-Target Drugs. Molecules. 2020;25(8). PubMed
6.Diabetes in Canada. Ottawa (ON): Public Health Agency of Canada; 2017: https://www.canada.ca/en/public-health/services/publications/diseases-conditions/diabetes-canada-highlights-chronic-disease-surveillance-system.html. Accessed 2022 Jun 9.
7.Shah RB, Patel M, Maahs DM, Shah VN. Insulin delivery methods: Past, present and future. Int J Pharm Investig. 2016;6(1):1-9. PubMed
8.McGill JB, Ahmann A. Continuous glucose monitoring with multiple daily insulin treatment: Outcome studies. Diabetes Technol Ther. 2017;19(Supplement 3):S3-S12. PubMed
9.Mancini G, Berioli MG, Santi E, et al. Flash glucose monitoring: A review of the literature with a special focus on type 1 diabetes. Nutrients. 2018;10(8) (no pagination).
10.Freckmann G. Basics and use of continuous glucose monitoring (CGM) in diabetes therapy. J Lab Med. 2020;44(2):71-79.
11.Edelman SV, Argento NB, Pettus J, Hirsch IB. Clinical Implications of Real-time and Intermittently Scanned Continuous Glucose Monitoring. Diabetes Care. 2018;41(11):2265-2274. PubMed
12.Shea BJ, Reeves BC, Wells G, et al. AMSTAR 2: a critical appraisal tool for systematic reviews that include randomised or non-randomised studies of healthcare interventions, or both. BMJ. 2017;358:j4008. PubMed
13.Downs SH, Black N. The feasibility of creating a checklist for the assessment of the methodological quality both of randomised and non-randomised studies of health care interventions. J Epidemiol Community Health. 1998;52(6):377-384. PubMed
14.Liberati A, Altman DG, Tetzlaff J, et al. The PRISMA statement for reporting systematic reviews and meta-analyses of studies that evaluate health care interventions: explanation and elaboration. J Clin Epidemiol. 2009;62(10):e1-e34. PubMed
15.Cowart K, Updike W, Bullers K. Systematic Review of Randomized Controlled Trials Evaluating Glycemic Efficacy and Patient Satisfaction of Intermittent-Scanned Continuous Glucose Monitoring in Patients with Diabetes. Diabetes Technol Ther. 2020;22(5):337-345. PubMed
16.Visser MM, Charleer S, Fieuws S, et al. Comparing real-time and intermittently scanned continuous glucose monitoring in adults with type 1 diabetes (ALERTT1): a 6-month, prospective, multicentre, randomised controlled trial. Lancet. 2021;397(10291):2275-2283. PubMed
17.Haskova A, Radovnicka L, Petruzelkova L, et al. Real-time CGM Is Superior to Flash Glucose Monitoring for Glucose Control in Type 1 Diabetes: The CORRIDA Randomized Controlled Trial. Diabetes Care. 2020;43(11):2744-2750. PubMed
18.Urakami T, Terada H, Yoshida K, et al. Comparison of the clinical effects of intermittently scanned and real-time continuous glucose monitoring in children and adolescents with type 1 diabetes: A retrospective cohort study. J Diabetes Investig. 2022;09:09.
19.Prabhu Navis J, Leelarathna L, Mubita W, et al. Impact of COVID-19 lockdown on flash and real-time glucose sensor users with type 1 diabetes in England. Acta Diabetol. 2021;58(2):231-237. PubMed
20.Cherubini V, Bonfanti R, Casertano A, et al. Time In Range in Children with Type 1 Diabetes Using Treatment Strategies Based on Nonautomated Insulin Delivery Systems in the Real World. Diabetes Technol Ther. 2020;22(7):509-515. PubMed
21.Sandig D, Grimsmann J, Reinauer C, et al. Continuous Glucose Monitoring in Adults with Type 1 Diabetes: Real-World Data from the German/Austrian Prospective Diabetes Follow-Up Registry. Diabetes Technol Ther. 2020;22(8):602-612. PubMed
22.Kristensen K, Ogge LE, Sengpiel V, et al. Continuous glucose monitoring in pregnant women with type 1 diabetes: an observational cohort study of 186 pregnancies. Diabetologia. 2019;62(7):1143-1153. PubMed
23.Hybrid closed-loop insulin delivery systems for people with type 1 diabetes. (CADTH Health technology assessment). Ottawa (ON): CADTH; 2021: https://www.cadth.ca/hybrid-closed-loop-insulin-delivery-systems-people-type-1-diabetes. Accessed 2022 Jun 9.
24.Glucose monitoring technologies for the management of insulin-dependent diabetes. Calgary (AB): Health Technology Assessment Unit, University of Calgary; 2019: https://www2.gov.bc.ca/assets/gov/health/about-bc-s-health-care-system/heath-care-partners/health-authorities/bc-health-technology-assessments/glucose-monitoring-hta.pdf. Accessed 2022 Jun 9.
Appendix 1: Selection of Included Studies
Appendix 2: Characteristics of Included Publications
Note that this appendix has not been copy-edited.
Table 2: Characteristics of Included Systematic Review
Study citation, country, funding source | Study designs and numbers of primary studies included | Population characteristics | Intervention and comparator(s) | Clinical outcomes, length of follow-up |
|---|---|---|---|---|
Cowart et al. (2020)15 US No funding received | Included studies: 9 RCTs including 1 RCT and its extension study that are relevant to the present report | Inclusion criteria: studies of children, adolescents, or adults with type 1 diabetes or type 2 diabetes. Pregnant women or those with gestational diabetes were also included. Characteristics of relevant population: 40 adults with type 1 diabetes with impaired awareness of hypoglycemia or severe hypoglycemia | Eligible interventions: isCGM Eligible comparators: not specified Relevant intervention: isCGM (FreeStyle Libre) Relevant comparator: rtCGM (Dexcom G5) | Outcomes: change in A1C, time in glycemic range, hypoglycemia, patient satisfaction Follow-up: 8 weeks |
A1C = hemoglobin A1C; isCGM = intermittently scanned continuous glucose monitoring; RCT = randomized controlled trial; rtCGM = real-time continuous glucose monitoring.
Table 3: Characteristics of Included Primary Clinical Studies
Study citation, country, funding source | Study design | Population characteristics | Intervention and comparator(s) | Clinical outcomes, length of follow-up |
|---|---|---|---|---|
Randomized controlled trials | ||||
Visser et al. (2021)16 Belgium Dexcom | Open-label multicentre RCT | Inclusion criteria: people aged 18 years or older with a diagnosis of type 1 diabetes for at least 6 months receiving treatment with multiple daily injections or insulin pump who have exclusively used isCGM for 6 months. Baseline characteristics: rtCGM: 127 participants with a mean age of 42.8 years, mean A1C of 7.4%, median duration of diabetes 18 years, 81% were using MDI, 19% were using insulin pump, 19% with hypoglycemia unawareness isCGM: 127 participants with a mean age of 43 years, mean A1C of 7.4%, median duration of diabetes 17 years, 80% were using MDI, 20% were using insulin pump, 16% with hypoglycemia unawareness | Intervention: rtCGM (Dexcom G6) Comparator: isCGM (FreeStyle Libre) | Outcomes: time in range, A1C, time in clinically significant hypoglycemia, hypoglycemia fear, time in hypoglycemia, time in target, time in hyperglycemia, time in clinically significant hyperglycemia, mean glucose concentration, glycemic variability, number of low glucose events, adverse events Follow-up: 6 months |
Haskova et al. (2020)17 Czech Republic Agency for Healthcare Research of the Czech Republic; the Research Project of Charles University | Open-label single-centre RCT | Inclusion criteria: people aged 18 years or older with diabetes for more than 2 years, with no history of severe hypoglycemia in the last 6 months, no previous experience with rtCGM or isCGM, and normal hypoglycemia awareness. Baseline characteristics: 60 people with type 1 diabetes. rtCGM: 30 participants, 52% male, mean age of 39.6 years, mean A1C of 7.7%, mean duration of diabetes of 15.9 years, 69% were using MDI isCGM: 30 participants, 29% male, mean age of 37.8 years, mean A1C of 8.0%, mean duration of diabetes of 14.4 years, 55% were using MDI | Intervention: rtCGM (Guardian Connect Mobile system) Comparator: isCGM (FreeStyle Libre Flash system) | Outcomes: percentage of time spent in hypoglycemia, changes in time in range, mean sensor glucose, glycemic variability, quality of life, incidence of severe hypoglycemia and ketoacidosis Follow-up: 4-day exercise phase + 4-week home phase |
Non-randomized studies | ||||
Urakami et al. (2022)18 Japan NR | Retrospective cohort | Inclusion criteria: children or adolescents with type 1 diabetes using either rtCGM or isCGM Baseline characteristics: rtCGM: 36 participants (16 male, 20 female) with a mean age of 10.8 years, ratio of MDI/CSII for insulin treatment was 32/4 isCGM: 76 participants (36 male, 40 female) with a mean age of 11.7 years, ratio of MDI/CSII for insulin treatment was 42/6 | Intervention: rtCGM (Dexcom G4 Platinum) Comparator: isCGM (FreeStyle Libre) | Outcomes: time in range, time above range, time below range, eA1C, frequencies of CGM metrics, adverse events Follow-up: 5 months |
Prabhu Navis et al. (2021)19 UK No funding received | Retrospective cohort | Inclusion criteria: people with a history of diabetes using MDI or insulin pump therapy and isCGM or rtCGM on their smartphone device. Baseline characteristics: 269 people with type 1 diabetes, 54% male, mean age of 41.4 years, mean A1C of 7.3%, 30% using MDI, 70% using insulin pump therapy, 190 (71%) participants using isCGM, 79 (29%) participants using rtCGM | Intervention: rtCGM (Dexcom G6) Comparator: isCGM (FreeStyle Libre) | Outcomes: time in range, time above range, time below range Follow-up: three 2-week periods over 4 months |
Cherubini et al. (2020)20 Italy No funding received | Cross-sectional | Inclusion criteria: people with type 1 diabetes aged less than 18 years who have used continuous glucose monitoring for more than 1 year Baseline characteristics: 665 children and adolescents with a median age of 12 years, 51% male, 46% were using insulin pump, median duration of diabetes 5 years, 325 (49%) participants were using isCGM, 340 (51%) participants were using rtCGM | Intervention: isCGM (FreeStyle Libre 1) Comparator: rtCGM (Dexcom G4, Dexcom G5, Dexcom G6, or Guardian Connect) | Outcomes: time in range, time above range, time below range, glucose variability Follow-up: 2 weeks |
Sandig et al. (2020)21 Germany, Austria the German Center for Diabetes Research; the German Diabetes Association; the Robert Koch Institute; Sanofi Germany; Abbott Germany | Cross-sectional | Inclusion criteria: NR Baseline characteristics: 233 adults with type 1 diabetes, median age of 19 years, median A1C of 7.3%, 47% male, 55% were using CSII, 45% were using MDI, 185 (79%) participants were using isCGM, 48 (21%) participants were using rtCGM | Intervention: rtCGM Comparator: isCGM | Outcomes: time in range, time in hyperglycemic range, time in hypoglycemic range, glucose variability, high blood glucose index, low blood glucose index, average daily risk range Follow-up: at least 14 and up to 30 days |
Kristensen et al. (2019)22 Sweden Region Skåne, Sweden; the Oak Foundation | Retrospective cohort | Inclusion criteria: pregnant women aged 18 years or older with type 1 diabetes using a CGM device Baseline characteristics: rtCGM: 92 women with a median age of 31 years, 42% were using insulin pump, median diabetes duration 17 years, mean A1C of 7.0% in trimester 1 and 6.3% in trimesters 2 and 3 isCGM: 94 women with a median age of 31 years, 16% were using insulin pump, median diabetes duration 14 years, mean A1C of 6.9% in trimester 1 and 6.3% in trimesters 2 and 3 | Intervention: rtCGM (Dexcom G4) Comparator: isCGM (FreeStyle Libre) | Outcomes: maternal and neonatal outcomes, time in euglycemia, time in hyperglycemia, time in hypoglycemia, low blood glucose index, high blood glucose index, glucose variability, mean glucose levels, mean amplitude of glucose excursions Follow-up: duration of pregnancy (up to 40 weeks) |
A1C = hemoglobin A1C; CGM = continuous glucose monitoring; CSII = continuous subcutaneous insulin infusion; eA1C = estimated A1C; isCGM = intermittently scanned continuous glucose monitoring; MDI = multiple daily injections; NR = not reported; RCT = randomized controlled trial; rtCGM = real-time continuous glucose monitoring.
Appendix 3: Critical Appraisal of Included Publications
Note that this appendix has not been copy-edited.
Table 4: Strengths and Limitations of Systematic Review Using AMSTAR 212
Strengths | Limitations |
|---|---|
Cowart et al. (2020)15 | |
|
|
AMSTAR 2 = A MeaSurement Tool to Assess systematic Reviews 2; RCT = randomized controlled trial.
Table 5: Strengths and Limitations of Clinical Studies Using the Downs and Black checklist13
Strengths | Limitations |
|---|---|
Randomized controlled trials | |
Visser et al. (2021)16 | |
|
|
Haskova et al. (2020)17 | |
|
|
Non-randomized studies | |
Urakami et al. (2022)18 | |
|
|
Prabhu Navis et al. (2021)19 | |
|
|
Cherubini et al. (2020)20 | |
|
|
Sandig et al. (2020)21 | |
|
|
Kristensen et al. (2019)22 | |
|
|
isCGM = intermittently scanned continuous glucose monitoring; rtCGM = real-time continuous glucose monitoring.
Appendix 4: Main Study Findings
Note that this appendix has not been copy-edited.
Table 6: Summary of Findings by Outcome — Glucose Time in Range Metrics
Study citation and study design | Outcome | Time point | Treatment group | Difference (95% CI) | P value | |
|---|---|---|---|---|---|---|
rtCGM | isCGM | |||||
Time in range | ||||||
Urakami et al. (2022)18 Retrospective cohort | Mean time in range (3.9 to 10.0 mmol/L), % | 5 months | 57.7 (SD=12.3) | 52.3 (SD=12.3) | NR | 0.0368 |
Proportion of participants with time in range >70% | 5 months | 13.9 | 3.9 | NR | 0.108 | |
Visser et al. (2021)16 RCT | Mean time in range (3.9 to 10.0 mmol/L), % | Baseline | 52.5 (95% CI, 49.8 to 55.1) | 51.3 (95% CI, 48.7 to 54.0) | NR | NR |
6 months | 59.6 (95% CI, 56.8 to 62.4) | 51.9 (95% CI, 49.1 to 54.7) | 6.85 (4.36 to 9.34) | <0·0001 | ||
Haskova et al. (2020)17 RCT | Mean time in range (3.9 to 10.0 mmol/L), % | Baseline | 65.4 (SD=14.8) | 61.4 (SD=20.6) | 3.94 (-5.4 to 13.3) | 0.2765 |
Exercise phase | 78.5 (SD=10.2) | 69.7 (SD=16.0) | 8.81 (1.8 to 15.8) | 0.0149 | ||
Home phase | 75.6 (SD=9.7) | 67.4 (SD=17.8) | 8.14 (0.7 to 15.6) | 0.0339 | ||
Post-randomization phase (exercise + home) | 76.4 (SD=8.7) | 67.9 (SD=15.4) | 8.52 (2.0 to 15.1) | 0.0117 | ||
Prabhu Navis et al. (2021)19 Retrospective cohort | Mean time in range (3.9 to 10.0 mmol/L), % | Pre-lockdown | 56.6 (SD=19.9) | 55.8 (SD=17.2) | NR | 0.74 |
Period 1 | 56 (SD=20) | 61 (SD=16) | NR | 0.06 | ||
Period 2 | 57 (SD=21) | 60 (SD=17) | NR | 0.14 | ||
Time below range | ||||||
Urakami et al. (2022)18 Retrospective cohort | Mean time below range (<3.9 mmol/L), % | 5 months | 4.3 (SD=2.7) | 10.2 (SD=5.4) | NR | <0.0001 |
Proportion of participants with time below range <5% | 5 months | 72.2 | 18.4 | NR | <0.001 | |
Visser et al. (2021)16 RCT | Mean time in hypoglycemia (<3.0 mmol/L), % | Baseline | 0·91 (95% CI, 0.60 to 1.22) | 1.05 (95% CI, 0.74 to 1.36) | NR | NR |
6 months | 0·47 (95% CI, 0.28 to 0.66) | 0·84 (95% CI, 0.65 to 1.03) | -0.35 (-0·61 to -0·10) | 0·0070 | ||
Haskova et al. (2020)17 RCT | Mean time below range (<3.9 mmol/L), % | Baseline | 6.4 (SD=5.8) | 4.1 (SD=4.1) | 2.31 (-0.3 to 4.9) | 0.0844 |
Exercise phase | 6.8 (SD=5.5) | 11.4 (SD=8.6) | -4.64 (-8.4 to -0.9) | 0.0180 | ||
Home phase | 5.3 (SD=2.5) | 7.3 (SD=4.4) | -2.03 (-3.9 to -0.2) | 0.0353 | ||
Post-randomization phase (exercise + home) | 5.4 (SD=2.5) | 8.3 (SD=4.8) | -2.85 (-4.9 to -0.8) | 0.0062 | ||
Mean time below range (<3.0 mmol/L), % | Baseline | 1.8 (SD=2.4) | 1.0 (SD=1.8) | 0.76 (-0.3 to 1.9) | 0.1531 | |
Exercise phase | 1.5 (SD=1.7) | 3.5 (SD=3.9) | -2.02 (-3.6 to -0.4) | 0.0131 | ||
Home phase | 1.3 (SD=1.1) | 2.1 (SD=2.0) | -0.82 (-1.7 to 0.0) | 0.0557 | ||
Post-randomization phase (exercise + home) | 1.3 (SD=1.0) | 2.5 (SD=2.2) | -1.18 (-2.1 to -0.3) | 0.0107 | ||
Prabhu Navis et al. (2021)19 Retrospective cohort | Median time below range (<3.9 mmol/L), % | Pre-lockdown | 1.6 (IQR=0.5 to 3.6) | 4.0 (IQR=2 to 7) | NR | <0.005 |
Period 1 | 1.8 (IQR=0.4 to 4.8) | 4 (IQR=2 to 9) | NR | <0.005 | ||
Period 2 | 1.4 (IQR=0.3 to 4.4) | 4 (IQR=2 to 8) | NR | <0.005 | ||
Time above range | ||||||
Urakami et al. (2022)18 Retrospective cohort | Mean time above range (>10.0 mmol/L), % | 5 months | 37.4 (SD=12.9) | 38.0 (SD=12.5) | NR | 0.881 |
Haskova et al. (2020)17 RCT | Mean time above range (>10.0 mmol/L), % | Baseline | 27.4 (SD=15.5) | 34.1 (SD=21.3) | -6.64 (-16.3 to 3.0) | 0.1523 |
Exercise phase | 14.7 (SD=9.1) | 18.9 (SD=17.7) | -4.12 (-11.5 to 3.2) | 0.2073 | ||
Home phase | 18.3 (SD=8.6) | 25.3 (SD=17.6) | -6.96 (-14.2 to 0.3) | 0.0581 | ||
Post-randomization phase (exercise + home) | 18.0 (SD=8.1) | 25.2 (SD=16.7) | -7.23 (-14.1 to -0.4) | 0.0391 | ||
Mean time above range (>13.9 mmol/L), % | Baseline | 9.9 (SD=9.9) | 12.0 (SD=13.6) | -2.12 (-8.3 to 4.1) | 0.3134 | |
Exercise phase | 3.4 (SD=5.2) | 3.8 (SD=6.4) | -0.46 (-3.5 to 2.6) | 0.3804 | ||
Home phase | 3.5 (SD=3.8) | 8.3 (SD=7.7) | -4.19 (-8.0 to -0.4) | 0.0296 | ||
Post-randomization phase (exercise + home) | 3.4 (SD=3.6) | 6.6 (SD=7.7) | -3.19 (-6.3 to 0.0) | 0.0465 | ||
Prabhu Navis et al. (2021)19 Retrospective cohort | Mean time above range (>10.0 mmol/L), % | Pre-lockdown | 40.4 (SD=21.6) | 38.6 (SD=19.2) | NR | 0.49 |
CI = confidence interval; IQR = interquartile range; isCGM = intermittently scanned continuous glucose monitoring; NR = not reported; RCT = randomized controlled trial; rtCGM = real-time continuous glucose monitoring; SD = standard deviation.
Table 7: Summary of Findings by Outcome — Additional CGM Metrics
Study citation and study design | Outcome | Time point | Treatment group | Difference (95% CI) | P value | |
|---|---|---|---|---|---|---|
rtCGM | isCGM | |||||
Glycemic variability | ||||||
Haskova et al. (2020)17 RCT | Mean glycemic variability (coefficient of variation, %) | Baseline | 39.2 (SD = 7.7) | 34.8 (SD = 8.9) | 0.04 (0.0 to 0.1) | 0.0473 |
Exercise phase | 35.1 (SD = 8.0) | 36.0 (SD = 7.7) | -0.01 (-0.1 to 0.0) | 0.3564 | ||
Home phase | 36.2 (SD = 5.7) | 37.2 (SD = 7.8) | -0.01 (-0.1 to 0.0) | 0.3365 | ||
Post-randomization phase (exercise + home) | 36.1 (SD = 5.1) | 38.4 (SD = 8.3) | -0.02 (-0.1 to 0.0) | 0.1764 | ||
Mean amplitude of glycemic excursion | ||||||
Haskova et al. (2020)17 RCT | Mean amplitude of glycemic excursion | Baseline | 6.7 (SD = 2.0) | 6.0 (SD = 2.3) | 0.77 (-0.4 to 1.9) | 0.1577 |
Exercise phase | 5.2 (SD = 1.5) | 4.8 (SD = 1.6) | 0.36 (-0.4 to 1.2) | 0.2656 | ||
Home phase | 5.1 (SD = 1.3) | 5.7 (SD = 1.9) | -0.61 (-1.5 to 0.2) | 0.1374 | ||
Post-randomization phase (exercise + home) | 5.1 (SD = 1.2) | 5.8 (SD = 1.8) | -0.67 (-1.5 to 0.1) | 0.0973 | ||
Mean sensor glucose | ||||||
Haskova et al. (2020)17 RCT | Mean sensor glucose, mmol/L | Baseline | 8.5 (SD = 1.6) | 9.0 (SD = 2.0) | -0.51 (-1.4 to 0.4) | 0.2116 |
Exercise phase | 7.3 (SD = 0.8) | 7.3 (SD = 1.6) | -0.04 (-0.7 to 0.6) | 0.3962 | ||
Home phase | 7.7 (SD = 0.7) | 8.2 (SD = 1.6) | -0.52 (-1.2 to 0.1) | 0.1080 | ||
Post-randomization phase (exercise + home) | 7.6 (SD = 0.7) | 8.0 (SD = 1.4) | -0.34 (-0.9 to 0.2) | 0.1926 | ||
CGM = continuous glucose monitoring; CI = confidence interval; isCGM = intermittently scanned continuous glucose monitoring; RCT = randomized controlled trial; rtCGM = real-time continuous glucose monitoring; SD = standard deviation.
Table 8: Summary of Findings by Outcome — Glucose Time in Range Metrics and Additional CGM Metrics
Study citation | Detailed findings |
|---|---|
Cowart et al. (2020)15 SR (1 RCT and its extension) | Reddy et al. 2018 (I HART CGM)
|
Reddy et al. 2018 (I HART CGM Extension)
| |
Kristensen et al. (2019)22 Retrospective cohort |
|
CGM = continuous glucose monitoring; isCGM = intermittently scanned continuous glucose monitoring; RCT = randomized controlled trial; rtCGM = real-time continuous glucose monitoring.
Table 9: Summary of Findings by Outcome — Quality of Life and Adverse Events
Study citation | Detailed findings |
|---|---|
Quality of life | |
Visser et al. (2021)16 RCT |
|
Haskova et al. (2020)17 RCT | There were no significant within-group changes or between-group differences in patient-reported quality of life |
Adverse events | |
Urakami et al. (2022)18 Retrospective cohort |
|
Visser et al. (2021)16 RCT |
|
Haskova et al. (2020)17 RCT |
|
CGM = continuous glucose monitoring; isCGM = intermittently scanned continuous glucose monitoring; RCT = randomized controlled trial; rtCGM = real-time continuous glucose monitoring.
Table 10: Summary of Findings by Outcome — Additional Outcomes
Study citation and study design | Outcome | Time point | Treatment group | Difference (95% CI) | P value | |
|---|---|---|---|---|---|---|
rtCGM | isCGM | |||||
A1C | ||||||
Urakami et al. (2022)18 Retrospective cohort | Mean eA1C, % | 5 months | 7.4 (SD=0.9) | 7.5 (SD=0.8) | NR | 0.734 |
Proportion of participants with eA1C <7.0% | 5 months | 38.9 | 31.6 | NR | 0.523 | |
Mean laboratory measured A1C, % | 5 months | 7.6 (SD=0.7) | 7.7 (SD=0.7) | NR | 0.758 | |
Visser et al. (2021)16 RCT | Mean A1C, % | Baseline | 7.4 (95% CI, 7.3 to 7.6) | 7.4 (95% CI, 7.3 to 7.6) | NR | NR |
6 months | 7.1 (95% CI, 6.9 to 7.2) | 7.4 (95% CI, 7.3 to 7.6) | -0.36 (-0.48 to -0.24) | <0.0001 | ||
HFS-worry | ||||||
Visser et al. (2021)16 RCT | HFS-worry, points | Baseline | 18.8 (95% CI, 16.7 to 21.0) | 18.7 (95% CI, 16.5 to 20.8) | NR | NR |
6 months | 15.4 (95% CI, 13.3 to 17.5) | 18.0 (95% CI, 15.8 to 20.1) | -2.62 (-4.52 to --0.71) | 0.0071 | ||
Maternal and neonatal outcomes | ||||||
Kristensen et al. (2019)22 Retrospective cohort | Pre-eclampsia/ pregnancy-induced hypertension, n (%) | During pregnancy | 15 (16) | 19 (20) | NR | 0.47 |
Caesarean section, n (%) | Birth | 46 (50) | 41 (44) | NR | 0.38 | |
Preterm birth (<37 weeks), n (%) | Birth | 24 (26) | 28 (30) | NR | 0.57 | |
Mean birthweight, g | Birth | 3812 (SD = 678) | 3834 (SD = 747) | NR | 0.84 | |
Large for gestational age infant, n (%) | Birth | 48 (52) | 50 (53) | NR | 0.89 | |
Macrosomia (>4500 g), n (%) | Birth | 14 (15) | 16 (17) | NR | 0.74 | |
5 min Apgar score <7, n (%) | Birth | 1 (1) | 5 (5) | NR | NR | |
Shoulder dystocia, n (%) | Birth | 3 (3) | 2 (2) | NR | NR | |
Neonatal hypoglycemia (plasma glucose < 2.6 mmol/L), n (%) | >3 hours after birth | 19 (21) | 26 (28) | NR | 0.27 | |
NICU admission > 24 hours, n (%) | Birth | 27 (29) | 33 (35) | NR | 0.40 | |
Neonatal composite outcome, n (%) Note: Neonatal composite outcome includes ≥ 1 of the following: macrosomia, shoulder dystocia, neonatal hypoglycemia or NICU admission > 24 hours | Birth | 37 (40) | 46 (49) | NR | 0.23 | |
A1C = hemoglobin A1C; CGM = continuous glucose monitoring; CI = confidence interval; eA1C = estimated A1C; HFS-worry = Hypoglycaemia Fear Survey version II worry subscale; isCGM = intermittently scanned continuous glucose monitoring; RCT = randomized controlled trial; NICU = neonatal intensive care unit; NR = not reported; rtCGM = real-time continuous glucose monitoring; SD = standard deviation.
Table 11: Summary of Findings From Sandig et al. (2020)21
Outcome | Treatment group | P value (CSII + rtCGM vs CSII + isCGM) | ||
|---|---|---|---|---|
CSII + rtCGM (n=38) | CSII + isCGM (n=90) | MDI + isCGM (n=95) | ||
Mean sensor glucose | ||||
Mean sensor glucose, median (IQR) | 166 (147 to 194) | 182 (153 to 214) | 173 (149 to 207) | NR |
Adjusted mean sensor glucosea | — | — | — | NS |
Glucose time in range metrics | ||||
Time in range (3.9 to 10.0 mmol/L) (%), median (IQR) | 54 (47 to 66) | 46 (34 to 58) | 51 (37 to 63) | NR |
Adjusted mean time in rangea | — | — | — | 0.027 (favours rtCGM group) |
Time <3.0 mmol/L (%), median (IQR) | 1 (<1 to 3) | 2 (1 to 4) | 2 (1 to 4) | NR |
Time <3.9 mmol/L (%), median (IQR) | 4 (1 to 9) | 6 (3 to 10) | 5 (3 to 9) | NR |
Adjusted mean time <3.9 mmol/La | — | — | — | NS |
Time >10.0 mmol/L (%), median (IQR) | 39 (26 to 50) | 47 (34 to 60) | 43 (28 to 57) | NR |
Adjusted mean time >10.0 mmol/La | — | — | — | NS |
Time >13.9 mmol/L (%), median (IQR) | 13 (6 to 22) | 19 (11 to 31) | 15 (7 to 28) | NR |
Adjusted mean time >13.9 mmol/L a | — | — | — | 0.026 (favours rtCGM group) |
Glucose variability | ||||
Glucose variability (coefficient of variation, %), median (IQR) | 33 (31 to 39) | 39 (35 to 43) | 36 (31 to 40) | NR |
Adjusted mean glucose variability (coefficient of variation)a | — | — | — | 0.002 (favours rtCGM group) |
Blood glucose index | ||||
Low blood glucose index, median (IQR) | 1.0 (0.4 to 2.0) | 1.5 (0.7 to 2.4) | 1.3 (0.7 to 2.2) | NR |
High blood glucose index, median (IQR) | 8.7 (5.7 to 12.8) | 11.3 (7.4 to 17.2) | 10.0 (6.3 to 15.8) | NR |
Average daily risk range | ||||
Average daily risk range, median (IQR) | 47 (40 to 54) | 56 (46 to 69) | 51 (40 to 61) | NR |
aResults for this outcome were presented in a figure and exact values could not ascertained.
CSII = continuous subcutaneous insulin infusion; IQR = interquartile range; isCGM = intermittently scanned continuous glucose monitoring; MDI = multiple daily injections; NR = not reported; rtCGM = real-time continuous glucose monitoring.
Table 12: Summary of Findings from Cherubini et al. (2020)20
Outcome | Treatment group | Significance | |||
|---|---|---|---|---|---|
MDI + rtCGM (n=120) | IP + rtCGM (n=221) | MDI + isCGM (n=240) | IP + isCGM (n=85) | ||
Time in range (3.9 to 10.0 mmol/L) | |||||
Time in range (%), median (IQR) | 56 (39 to 66) | 61 (50 to 71) | 49 (40 to 60) | 56 (42 to 65) | IP + rtCGM group had significantly higher median time in range than the other groups (all P<0.01) |
Proportion of participants with time in range >60%, n (%) | 51 (42.5) | 116 (52.5) | 58 (24.2) | 29 (34.1) | P<0.001 |
Proportion of participants with time in range >70%, n (%) | 17 (14.2) | 62 (28.1) | 20 (8.3) | 11 (12.9) | P<0.001 |
Time below range (<3.9 mmol/L) | |||||
Time below range (%), median (IQR) | 2 (1 to 4) | 3 (1 to 6) | 5 (2 to 8) | 5 (3 to 7) |
All comparisons favour rtCGM |
Proportion of participants with time below range <4%, n (%) | 87 (72.5) | 136 (61.5) | 102 (42.5) | 24 (28.2) | P<0.001 |
Time above range (>10.0 mmol/L) | |||||
|---|---|---|---|---|---|
Time above range (%), median (IQR) | 42 (30 to 61) | 35 (24 to 46) | 44 (33 to 56) | 38 (30 to 54) | IP +rtCGM group had significantly lower time above range than the MDI + isCGM group (P<0.001) |
Proportion of participants with time above range <25%, n (%) | 20 (16.7) | 58 (26.2) | 25 (10.4) | 17 (20) | P<0.001 |
IP = insulin pump; IQR = interquartile range; isCGM = intermittently scanned continuous glucose monitoring; MDI = multiple daily injections; NR = not reported; rtCGM = real-time continuous glucose monitoring.
Appendix 5: References of Potential Interest
Note that this appendix has not been copy-edited.
Previous CADTH Reports
Flash glucose monitoring and continuous glucose monitoring for people with diabetes in acute care settings (CADTH Rapid response report: summary of abstracts). Ottawa (ON): CADTH; 2021: https://www.cadth.ca/flash-glucose-monitoring-and-continuous-glucose-monitoring-people-diabetes-acute-care-settings. Accessed 2022 Jun 9.
Flash glucose monitoring systems in pediatric populations with diabetes (CADTH Rapid response report: summary with critical appraisal). Ottawa (ON): CADTH; 2021: https://www.cadth.ca/flash-glucose-monitoring-systems-pediatric-populations-diabetes. Accessed 2022 Jun 9.
Continuous glucose monitoring for patients with all diabetes types: clinical effectiveness and guidelines (CADTH Rapid response report: summary of abstracts). Ottawa (ON): CADTH; 2018: https://www.cadth.ca/continuous-glucose-monitoring-patients-all-diabetes-types-clinical-effectiveness-and-guidelines. Accessed 2022 Jun 9.
Review Articles
Lucidi P, Porcellati F, Bolli GB, Fanelli CG. Prevention and management of severe hypoglycemia and hypoglycemia unawareness: incorporating sensor technology. Curr Diab Rep. 2018;18(10):83. PubMed
Klonoff DC, Ahn D, Drincic A. Continuous glucose monitoring: A review of the technology and clinical use. Diabetes Res Clin Pract. 2017;133:178-192. PubMed
Rodbard D. Continuous glucose monitoring: a review of recent studies demonstrating improved glycemic outcomes. Diabetes Technol Ther. 2017;19(Supplement 3):S25-S37. PubMed
Single-arm Before-after Studies
Preau Y, Galie S, Schaepelynck P, Armand M, Raccah D. Benefits of a Switch from Intermittently Scanned Continuous Glucose Monitoring (isCGM) to Real-Time (rt) CGM in Diabetes Type 1 Suboptimal Controlled Patients in Real-Life: A One-Year Prospective Study. Sensors (Basel). 2021;21(18):13. PubMed
Preau Y, Armand M, Galie S, Schaepelynck P, Raccah D. Impact of Switching from Intermittently Scanned to Real-Time Continuous Glucose Monitoring Systems in a Type 1 Diabetes Patient French Cohort: An Observational Study of Clinical Practices. Diabetes Technol Ther. 2021;23(4):259-267. PubMed
Massa GG, Gys I, Bevilacqua E, Wijnands A, Zeevaert R. Comparison of flash glucose monitoring with real time continuous glucose monitoring in children and adolescents with type 1 diabetes treated with continuous subcutaneous insulin infusion. Diabetes Res Clin Pract. 2019;152:111-118. PubMed
ISSN: 2563-6596
Disclaimer: The information in this document is intended to help Canadian health care decision-makers, health care professionals, health systems leaders, and policy-makers make well-informed decisions and thereby improve the quality of health care services. While patients and others may access this document, the document is made available for informational purposes only and no representations or warranties are made with respect to its fitness for any particular purpose. The information in this document should not be used as a substitute for professional medical advice or as a substitute for the application of clinical judgment in respect of the care of a particular patient or other professional judgment in any decision-making process. The Canadian Agency for Drugs and Technologies in Health (CADTH) does not endorse any information, drugs, therapies, treatments, products, processes, or services.
While care has been taken to ensure that the information prepared by CADTH in this document is accurate, complete, and up to date as at the applicable date the material was first published by CADTH, CADTH does not make any guarantees to that effect. CADTH does not guarantee and is not responsible for the quality, currency, propriety, accuracy, or reasonableness of any statements, information, or conclusions contained in any third-party materials used in preparing this document. The views and opinions of third parties published in this document do not necessarily state or reflect those of CADTH.
CADTH is not responsible for any errors, omissions, injury, loss, or damage arising from or relating to the use (or misuse) of any information, statements, or conclusions contained in or implied by the contents of this document or any of the source materials.
This document may contain links to third-party websites. CADTH does not have control over the content of such sites. Use of third-party sites is governed by the third-party website owners’ own terms and conditions set out for such sites. CADTH does not make any guarantee with respect to any information contained on such third-party sites and CADTH is not responsible for any injury, loss, or damage suffered as a result of using such third-party sites. CADTH has no responsibility for the collection, use, and disclosure of personal information by third-party sites.
Subject to the aforementioned limitations, the views expressed herein are those of CADTH and do not necessarily represent the views of Canada’s federal, provincial, or territorial governments or any third-party supplier of information.
This document is prepared and intended for use in the context of the Canadian health care system. The use of this document outside of Canada is done so at the user’s own risk.
This disclaimer and any questions or matters of any nature arising from or relating to the content or use (or misuse) of this document will be governed by and interpreted in accordance with the laws of the Province of Ontario and the laws of Canada applicable therein, and all proceedings shall be subject to the exclusive jurisdiction of the courts of the Province of Ontario, Canada.
The copyright and other intellectual property rights in this document are owned by CADTH and its licensors. These rights are protected by the Canadian Copyright Act and other national and international laws and agreements. Users are permitted to make copies of this document for non-commercial purposes only, provided it is not modified when reproduced and appropriate credit is given to CADTH and its licensors.
About CADTH: CADTH is an independent, not-for-profit organization responsible for providing Canada’s health care decision-makers with objective evidence to help make informed decisions about the optimal use of drugs, medical devices, diagnostics, and procedures in our health care system.
Funding: CADTH receives funding from Canada’s federal, provincial, and territorial governments, with the exception of Quebec.
Questions or requests for information about this report can be directed to Requests@CADTH.ca