CADTH Health Technology Review
Portable Bone Imaging Devices for Screening and Diagnosing Osteoporosis
Rapid Review
Authors: Sara D. Khangura, Quenby Mahood
Abbreviations
AACE
American Association of Clinical Endocrinologists
ACR
American College of Radiology
AUC
area under the curve
BMD
bone mineral density
BUA
broadband ultrasound attenuation
CI
confidence interval
COM
current osteoporosis management pathway
DTA
diagnostic test accuracy
DXA
dual-energy x-ray absorptiometry
FRAX
fracture risk assessment
ICER
incremental cost-effectiveness ratio
NRS
non-randomized study
OR
odds ratio
PEUS
pulse-echo ultrasonometry
POM
proposed osteoporosis management pathway
QALY
quality-adjusted life-year
QUS
quantitative ultrasound
REMS
radiofrequency echographic multi spectrometry
ROC
receiver operating characteristic
SIGN
Scottish Intercollegiate Guidelines Network
T1DM
type 1 diabetes mellitus
T2DM
type 2 diabetes mellitus
WTP
willingness to pay
Key Messages
Limited evidence describing the clinical utility of 2 types of portable bone imaging devices suggest that they may be comparable to DXA for predicting the incidence of fracture, but the findings are uncertain.
Incorporating 1 type of portable bone imaging device into a screening and diagnosis management pathway for osteoporosis was more cost-effective in a Finnish context, compared to an osteoporosis management approach that did not include the portable bone imaging device.
Two guidelines were found that have recommendations about portable bone imaging devices for screening and diagnosing osteoporosis. Both guidelines reported limited evidence on the use of portable bone imaging devices.
Context and Policy Issues
Osteoporosis is a disease that causes compromised bone strength and an increased risk of bone fracture — particularly in older adults.1 Osteoporosis is a significant public health problem affecting a large proportion of the global population — particularly post-menopausal females, but other groups, as well.2,3 Estimates indicate that as many as half of all women and 20% of men will experience a fragility fracture in their lifetimes.2-4 Fragility fractures can be devastating, with downstream outcomes including significant morbidity and even mortality.5,6 Hip fracture, for instance, carries a high risk of mortality, with estimates comparing the risk of death to that of breast cancer.5 Other estimates indicate that as many as 40% of people who suffer a hip fracture die within 1 year.2,7 These deleterious effects of osteoporosis have a significant impact on older populations, communities and the health systems that serve them, with major costs presenting a significant burden to health systems.3
Osteoporosis is defined as a bone mineral density (BMD) T-score of equal-to or less-than 2.5 standard deviations below that of a healthy, young reference population.5,8 Dual-energy X-ray absorptiometry (DXA) is the most commonly used measure of BMD and is considered to be the gold standard diagnostic approach.1 Nonetheless, DXA is often neither available nor accessible in many resource-constrained areas throughout the world, making access to screening and diagnostic services for osteoporosis a challenge for the aging population across the globe.5,7 Consequently, osteoporosis often goes undiagnosed in a considerable proportion of the population, with estimates from the WHO suggesting that as many as 70% of those at risk are neither screened nor diagnosed, with resource-constrained areas being most adversely affected.1
This widespread phenomenon of under-diagnosis is known to be the primary contributor to preventable fragility fractures, emphasizing the importance early diagnosis and preventive therapy for those affected.8,9 And while BMD screening with DXA in the entire population is not necessary, it is currently indicated in populations with a higher risk of fracture; that is, post-menopausal females and others with a history of low-impact fracture or other risk factors.1 Nonetheless, DXA is expensive, exposes the patient to radiation and is generally less accessible in non-urban areas.4,7,10 In addition, some have suggested that BMD alone may be insufficient for predicting the risk of fragility fracture and that consideration of other properties of the bone is important as well.11,12
Alternatives to DXA have been proposed, including more accessible, less resource-intensive interventions for identifying clinical risk and/or screening for osteoporosis. Portable bone imaging devices have emerged as interventions to improve accessibility and affordability — particularly in resource-constrained contexts.1 For instance, quantitative ultrasound (QUS) has been studied for 30 years as a screening and/or diagnostic tool for osteoporosis, with the advantages of both portability and lower-cost, QUS is also radiation free, which limits the risk of exposure to radiation.5,12,13 While there is a considerable body of work comparing the diagnostic test accuracy (DTA) of ultrasound and other portable devices with DXA9 the evidence describing clinical utility and other patient-oriented outcomes is less well known.12
Given the potential benefits that portable bone imaging devices could proffer to patients and populations at risk of osteoporosis (particularly those in resource-constrained and/or rural/remote areas), this review sought to identify, summarize, and critically appraise the available evidence and information describing the clinical utility, cost-effectiveness and evidence-based guidelines describing these interventions.
Research Questions
What is the clinical utility of portable bone imaging devices versus standard bone density scanners for screening and diagnosing osteoporosis?
What is the cost-effectiveness of portable bone imaging devices versus standard bone density scanners for screening and diagnosing osteoporosis?
What are the evidence-based guidelines regarding the use of portable bone imaging devices for screening and diagnosing osteoporosis?
Methods
Literature Search Methods
A limited literature search was conducted by an information specialist on key resources including MEDLINE, the Cochrane Database of Systematic Reviews, the International HTA Database, the websites of Canadian and major international health technology agencies, as well as a focused internet search. The search strategy comprised both controlled vocabulary, such as the National Library of Medicine’s MeSH (Medical Subject Headings), and keywords. The main search concepts were osteoporosis, portable, and bone scanners. A CADTH-developed search filter was applied to limit retrieval to guidelines for a secondary search for the concepts of osteoporosis and bone scanners. The search was completed on July 7, 2022 and limited to English-language documents published since January 1, 2017.
Selection Criteria and Methods
One reviewer screened citations and selected studies. In the first level of screening, titles and abstracts were reviewed and potentially relevant articles were retrieved and assessed for inclusion. The final selection of full-text articles was based on the inclusion criteria presented in Table 1.
Criteria | Description |
|---|---|
Population | People with suspected osteoporosis |
Intervention | Portable bone imaging devices |
Comparator | Q1 to Q2: Standard bone density scanners (e.g., non-portable dual-energy X-ray scanners) Q3: Not applicable |
Outcomes | Q1: Clinical utility (e.g., time to treatment, incidence of fractures, mortality, quality of life) Q2: Cost-effectiveness (e.g., cost per quality-adjusted life-year gained) Q3: Recommendations regarding best practices (e.g., appropriate patient populations or clinical settings, testing protocols) |
Study designs | Health technology assessments, systematic reviews, randomized controlled trials, non-randomized studies, economic evaluations, and evidence-based guidelines |
Exclusion Criteria
Articles were excluded if they did not meet the selection criteria outlined in Table 1, they were duplicate publications, or were published before 2017. Guidelines with unclear methodology were excluded.
Critical Appraisal of Individual Studies
The included publications were critically appraised by 1 reviewer using the following tools as a guide: the Downs and Black checklist14 for non-randomized studies, the Drummond checklist15 for economic evaluations, and the Appraisal of Guidelines for Research and Evaluation (AGREE) II instrument16 for evidence-based guidelines. Summary scores were not calculated for the included studies; rather, the strengths and limitations of each included publication were described narratively.
Summary of Evidence
Quantity of Research Available
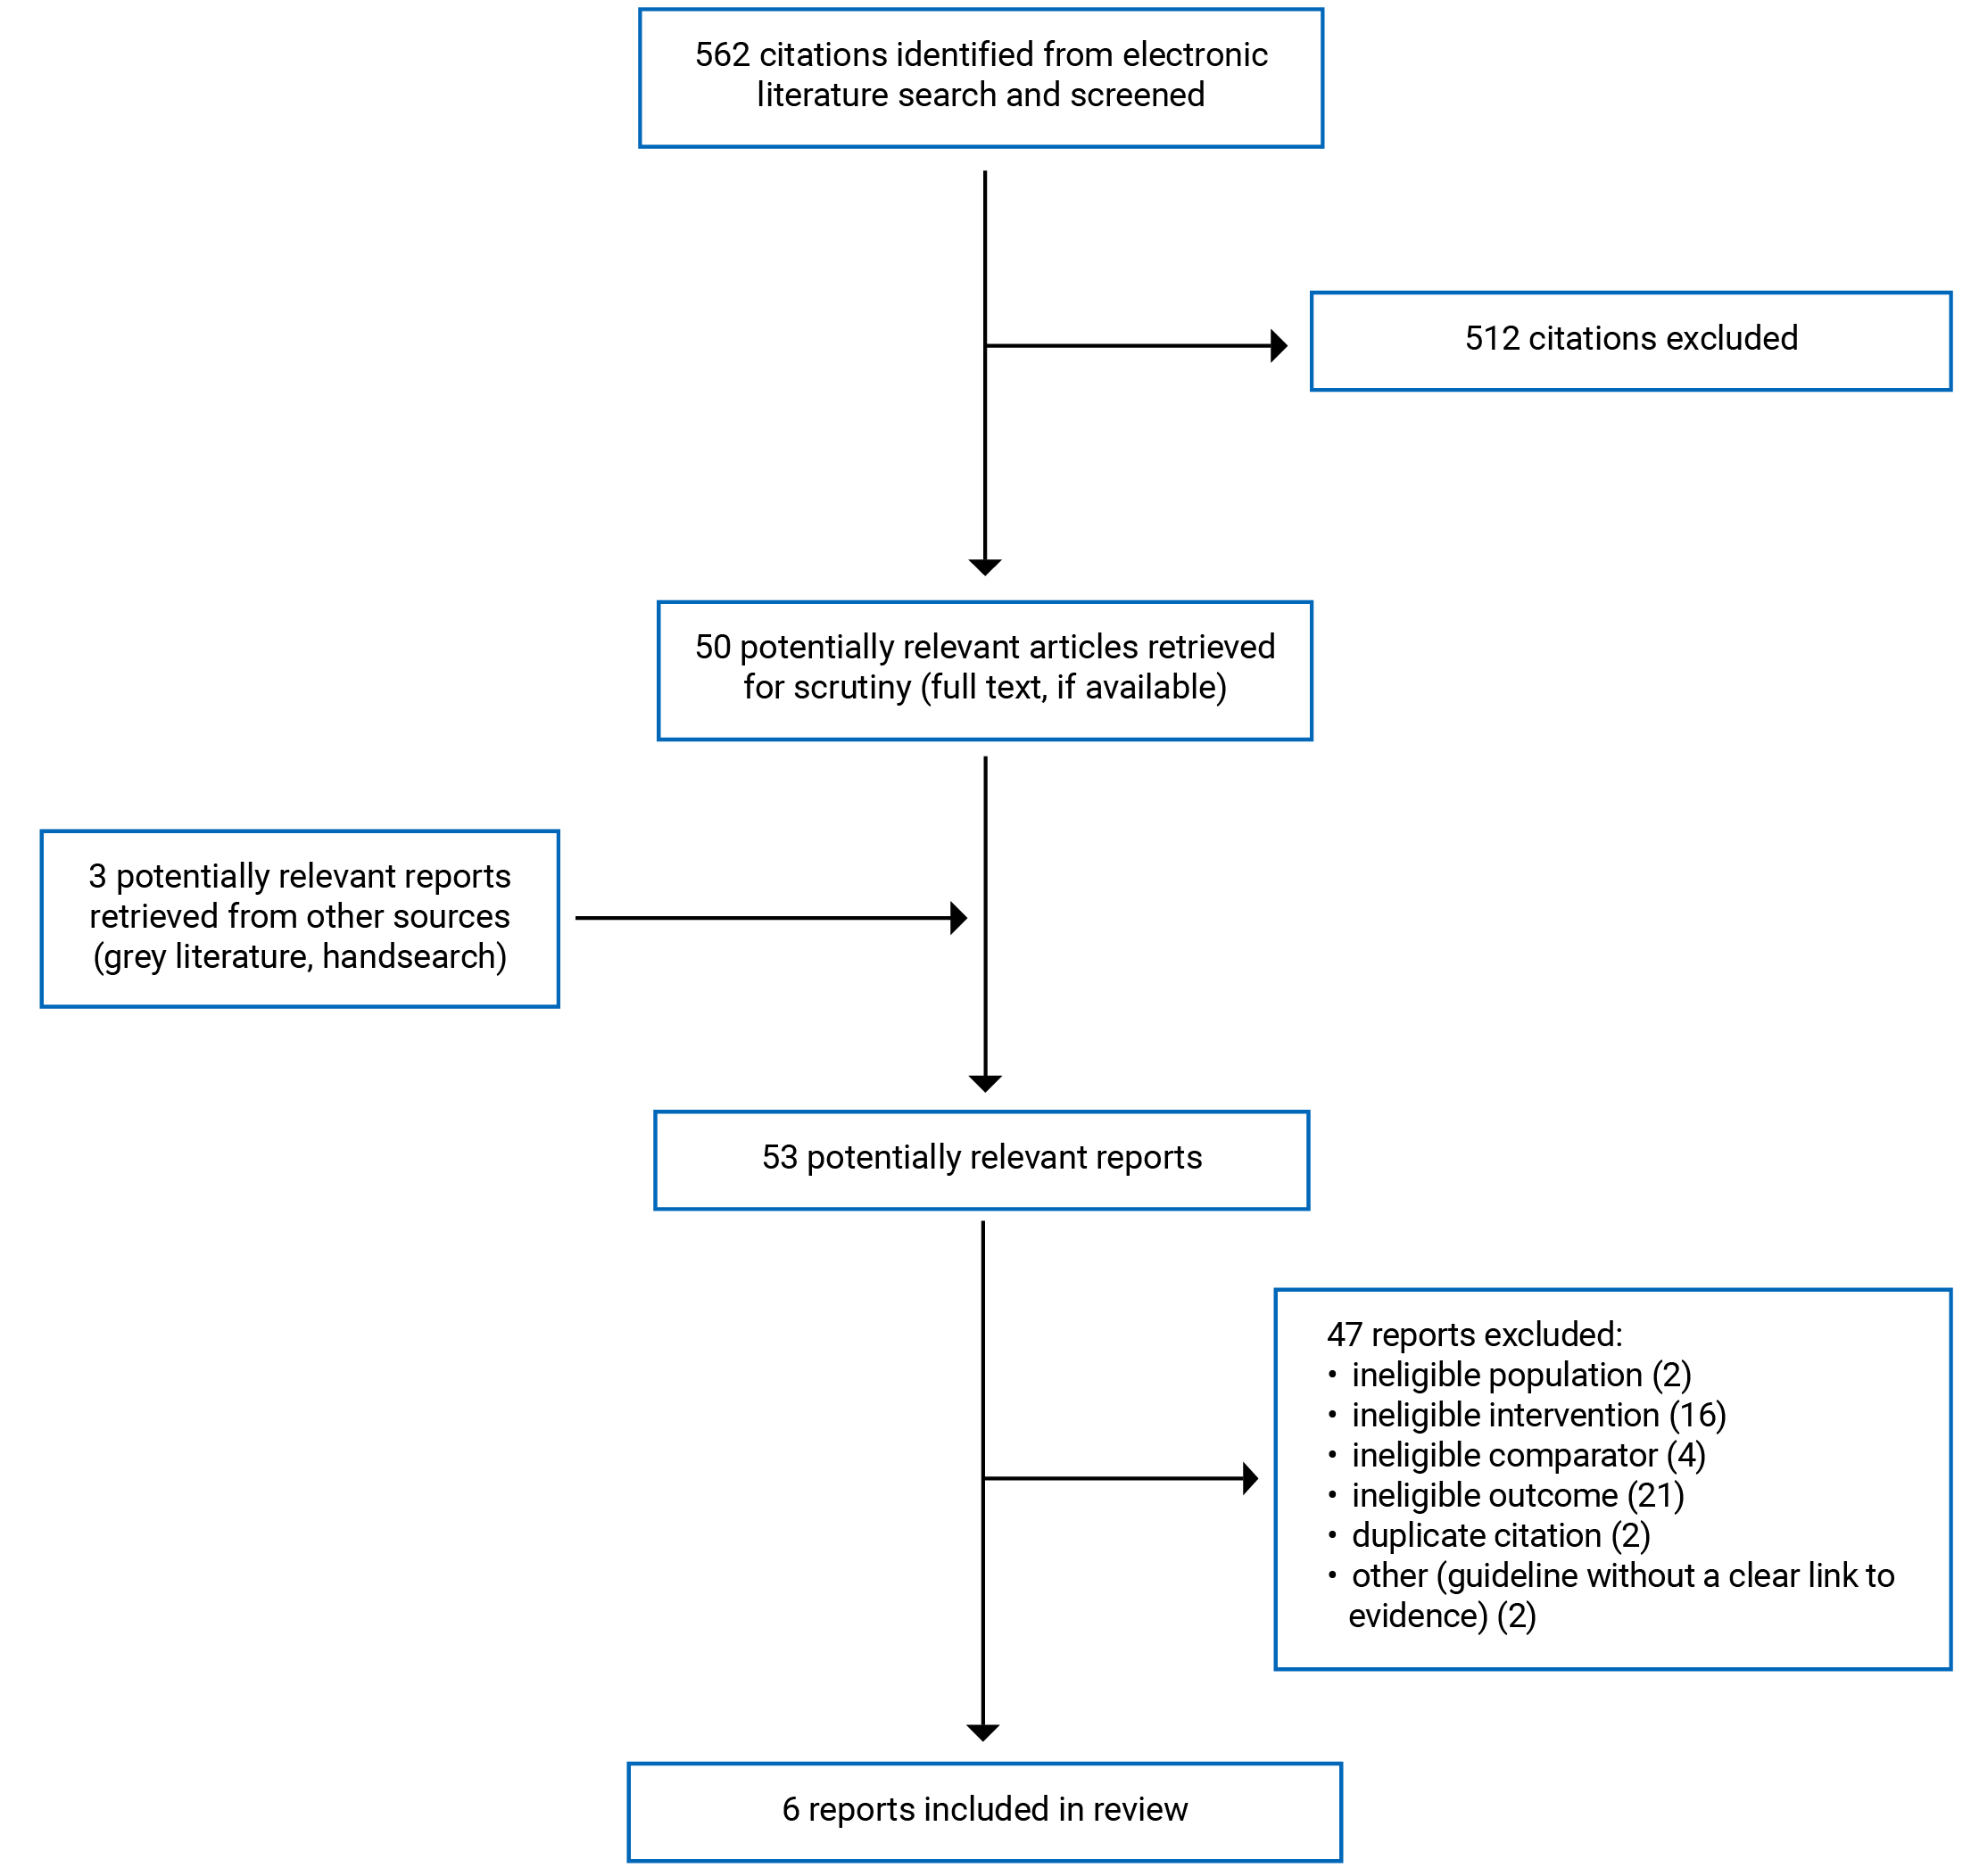
A total of 562 citations were identified in the literature search. Following screening of titles and abstracts, 512 citations were excluded and 50 potentially relevant reports from the electronic search were retrieved for full-text review. Three potentially relevant publications were retrieved from the grey literature search for full-text review. Of these potentially relevant articles, 47 publications were excluded for various reasons, and 6 publications met the inclusion criteria and were included in this report. These comprised 3 non-randomized studies (NRS),1 economic evaluation, and 2 evidence-based guidelines. Appendix 1 presents the PRISMA17 flow chart of the study selection.
Summary of Study Characteristics
Study Design
The 3 NRS used prospective cohort designs over a long-term duration of follow-up; that is, 20 years18 5 years,19 and over 20 years,20 respectively. All 3 studies used both a portable bone imaging device and DXA to measure bone properties in each study participant and compare clinical utility across follow-up.18-20
The economic evaluation used a cost-effectiveness analysis across a 10-year time horizon using a third-party payer perspective.21 A Markov model was used for the data of relevance to this report, with clinical and cost data drawn from published and cited sources.21 Key assumptions incorporated into the model included: that the gold standard imaging device was 100% accurate, affordable and accessible; that the experimental imaging device was more costly than is expected; that all diagnosed osteoporosis was treated with a particular medication, and; that there was a willingness-to-pay (WTP) threshold of £20 to £30 thousand per quality-adjusted life-year (QALY).21
Two evidence-based guidelines were identified by this review, including relevant recommendations and statements developed by the American College of Radiology (ACR)22 and the Latin American Federation of Endocrinology (FELAEN).23 One of the guidelines specified that a systematic review was used to identify, collect and synthesize evidence, though the methods were not reported in detail.22 The other guideline reported the use of evidence; however, the methods used to identify, collect, and synthesize evidence were not described.23 Similarly, there was some indication that the quality of the evidence used in the development of the guidelines was assessed by both author groups22,23; however, neither was explicit about the methods used to perform the assessments, with only a cursory mention and/or a published source cited in reference to evidence quality assessment.22,23 Likewise, 1 of the guidelines mentioned the incorporation of evidence into the development of recommendations, though no detailed information was provided);22 whereas the other guideline made no such mention.23 Both guidelines described the use of a consensus process to help inform the development of recommendations, though no detail was provided about the process used.22,23 Neither of the eligible guidelines assigned levels, or other indications of strength, to the recommendations that they made.22,23
Country of Origin
The 3 NRS were conducted in Sweden,18 Italy19 and Australia,20 respectively. The economic evaluation was conducted in a Finnish context.21 The 2 guidelines were developed in and for the US,22 and a Latin American context, with the development group representing 9 countries (i.e., Colombia, Argentina, Brazil, Chile, Costa Rica, Mexico, Dominican Republic, Uruguay, Venezuela).23
Patient Population
The Swedish NRS studied consecutive, eligible patients attending a foot clinic with either type 1 or type 2 diabetes mellitus (T1DM, T2DM).18 The Italian NRS included women between the ages of 30 and 90 who had been given a prescription for a bone density scan using DXA.19 The Australian NRS examined a subset of patients aged 60 years and older from a larger prospective cohort study on osteoporosis (details not reported).20 The economic evaluation used data describing post-menopausal women between the ages of 65 and 85, with or without a previous bone fracture.21 The models were developed in consideration of 5 cohorts of women: those 65 years of age with no history of fracture; those 75 years of age with or without a history of fracture, and; those 85 years of age with or without a history of fracture.21 The guidelines were developed to inform clinical practice for populations with or at risk of developing osteoporosis.22,23 While 1 of the guidelines was limited to target populations including women only,23 the other included recommendations applicable to men and women.22 Of note, none of the included publications distinguished sex from gender in their descriptions of the populations of interest (e.g., postmenopausal women). While have retained the original language used when reporting on these publications, it is acknowledged that such language is not inclusive of trans and non-binary persons.
Interventions and Comparators
Both the Swedish and Australian NRS compared bone imaging with QUS of the calcaneus versus dual-energy X-ray absorptiometry (DXA) as predictors of incident fractures across at least 20 years of follow-up.18,20 Calcaneal QUS is described as using sound waves18 to measure bone quality and quantity at the calcaneus (i.e., heel of the foot), with the advantages of portability and it does not use ionizing radiation.20 The Italian NRS compared bone imaging with radiofrequency echographic multi spectrometry (REMS) versus DXA for the prediction of incident fragility fractures across 5 years of follow-up.19 REMS is described as using “... raw unfiltered ultrasound signals acquired during an echographic scan of lumbar spine and/or femoral neck and provides a DXA-equivalent BMD value.(p. 2)”19
The economic evaluation compared 2 proposed osteoporosis management pathways (POM) including pulse-echo ultrasonometry or ultrasonography (PEUS) for bone imaging versus 1 pathway including only DXA for bone density scanning (i.e., described as the current osteoporosis management approach, or COM).21 All pathways began with a standard clinical fracture risk assessment (FRAX), which resulted in no further intervention if the risk was determined to be sufficiently low so as to not require any further intervention.21 If the FRAX assessment indicated a sufficiently high level of risk, the COM pathway advanced to a DXA scan to diagnose osteoporosis, which then resulted in fracture preventive therapy with alendronate. The POMs inserted a step following a high-risk FRAX assessment wherein PEUS was also used to screen for and/or diagnose osteoporotic risk/osteoporosis.21 The first POM (i.e., POMa) was intended for testing and diagnosis i.e., following a high-risk FRAX, the pathway advanced to a diagnostic DXA scan only if the PEUS scan resulted in an ambiguous finding, while osteoporotic findings advanced directly to fracture prevention therapy with alendronate and a healthy finding resulted in no further intervention. The second POM (i.e., POMb) was intended for screening only; that is., following a high-risk FRAX, the pathway advanced to a DXA scan if the PEUS scan indicated either an osteoporotic or ambiguous finding (with a DXA diagnosis of osteoporosis resulting in fracture prevention therapy with alendronate and a non-osteoporotic DXA diagnosis resulting in no further therapy), while non-osteoporotic findings following PEUS resulted in no further intervention.21
The guidelines provided recommendations and supporting evidence concerning QUS22 and REMS.23
Outcomes
The 3 NRS measured bone properties and their association with incident fractures across a long-term follow-up using medical records and/or patient interviews.18-20 The Swedish and Australian studies measured bone at the calcaneus in each patient using QUS, and at the spine and femoral neck using DXA.18,20 The Italian study measured bone properties at the lumbar vertebrae and femoral neck using REMS and at the spine and femur using DXA.19 The conversion of bone imaging parameters to score values was not described in either the Swedish or Italian studies; however, the Australian study described the conversion of broadband ultrasound attenuation (BUA) and velocity of sound (VOS) parameters for QUS, and BMD parameters for DXA, to standardized Z-scores.20 Both the Swedish and Italian NRS reported bone properties with T-scores (i.e., the standard deviation from the mean of younger, healthy, sex-matched controls),18,19 while the Swedish and Australian studies reported bone properties with Z-scores (i.e., the standard deviation from the mean of age- and sex-matched controls).18,20
Data on incident fractures were distinguished as fragility or low-trauma fractures in the Italian and Australian studies (i.e., likely to result from osteoporotic status);19,20 whereas no such clear distinction was made in the Swedish study.18 Incident fractures were subset by site of the fracture in 2 of the NRS studies, with the Swedish study reporting on incident fractures of the hip, radius, vertebrae, foot, lower limb, and ribs,18 and the Italian study reporting on incident fragility fractures of the wrist, vertebra, humerus, hip, ribs, forearm, ankle, pelvis as well as other sites (indicated only as other).19 The Australian NRS did not distinguish the sites of the low-trauma fractures observed.20
The economic evaluation reported on comparative cost-effectiveness, including estimated costs of the intervention and comparator (in Euros [€]), QALYs gained, and incremental cost-effectiveness ratios (ICERs).21
Relevant recommendations presented by the guidelines included the appropriateness and accuracy of portable bone imaging devices for the initial imaging, screening and/or diagnosis of osteoporosis.22,23
Additional details regarding the characteristics of included publications are provided in Appendix 2.
Summary of Critical Appraisal
Non-Randomized Studies
The 3 reports of non-randomized research were generally well-reported, exhibiting both strengths and limitations identified by the critical appraisal exercise. Strengths included clear reporting of study objectives, patient characteristics, interventions, potential confounders, estimates of random variability and/or actual P values.18-20 The main outcomes were adequately described in 2 of the studies.19,20 The settings selected for the Swedish and Italian studies appeared to be sufficiently representative, with both study populations being drawn from non-specialist health care facilities18,19; this contributes to the confidence that can be placed in the external validity of the findings generated by the studies. While patients were not randomized to the study interventions, this was a necessary feature of the studies, given that all study participants received imaging from both devices18-20; the lack of randomization is thus not a threat to the internal validity of these studies.
The outcome measures and statistical tests described in both study reports appeared to be appropriate, and there was no evidence of post-hoc analyses,18-20 which can otherwise introduce bias and potentially compromise the internal validity of the study findings. In addition, the participants in the Swedish and Italian studies were recruited from the same population across the same time period,18,19 which contributes to confidence in the internal validity of the study by limiting the potential for confounding. The Italian and Australian studies were careful to clearly indicate that incident fractures included in their data collection and analyses were caused by fragility or low trauma, and not occurring for other reasons (e.g., traumatic injury)19,20; this is an important detail that adds to the confidence in the internal validity of the study findings, as the reader is assured that the fractures reported were likely to be associated with osteoporotic status. Further, the 3 study reports described analyses designed to adjust for the impacts of potentially confounding factors,18-20 which also contributes to confidence in the internal validity of both studies.
Limitations were also observed in the 3 reports of NRS, including unclear descriptions and/or analytical accounting for losses to follow-up,18-20 which can compromise the internal validity of the studies by potentially introducing a source of confounding. One of the studies reported that QUS was used to measure bone density18; however other sources in the literature indicate that QUS does not measure bone density.5,9,24,25 This lack of clarity introduces a potential threat to the internal validity of the study.18 The representativeness of the patient populations was similarly unclear, due to the fact that explicit comparisons with the broader population of potentially eligible participants were not included,18-20 introducing a potential threat to external validity. In particular, the Swedish study was interested in patients with T1DM or T2DM only; however, a conclusion was made with regard to the potential applicability of the study findings to a broader population in primary care settings.18 This discordance between the study population and conclusions represents a limitation of the study and its generalizability. Due to the nature of the interventions (i.e., bone imaging devices)18-20 blinding of study participants, clinicians and researchers was not possible; while these shortcomings can introduce a risk of bias, they are common in non-randomized research study designs, which is why measures to account for possible confounding are essential (and were present, as above). Further, the lack of blinding among patients is unlikely to introduce an important source of bias, as the exposure (bone imaging device) and outcome (incident fracture) are unlikely to be affected by the patient’s knowledge of being exposed to both devices. While it may be possible that a lack of blinding among clinicians and/or researchers could introduce a potential risk of bias, this possible study limitation is necessarily common among all studies researching bone imaging devices, as it is not possible to blind the clinician operator or researchers to the interventions being used. Further, it is not clear whether or how this lack of blinding could compromise the data and/or study findings, rendering the lack of blinding a minor consideration in the assessment of these studies.
A notable limitation observed in the Swedish study was the lack of a clear delineation regarding whether the incident fractures were due to fragility or low trauma as opposed to any reason.18 While it is unclear whether this was an oversight in reporting (e.g., that the reported fractures were, in fact, due to fragility but were not indicated as such in the report) or whether all fractures, regardless of cause, were included in the analyses, this represents a potential limitation of the study. Specifically, if the reporting was unclear, this is an important limitation of the study report, which prevents the reader from being able to clearly interpret the findings; if the reported fractures occurred from any cause, this contributes to a potential source of bias, as the fractures could have occurred from traumatic injury or other causes not associated with osteoporotic status.18 Another limitation in the study reports was unclear or compromised compliance with the study interventions i.e., authors of the Swedish study explained that not all patients underwent DXA scans due to access barriers18 whereas the Italian and Australian studies did not address patient compliance with the interventions at all.19,20 The shortfall in patients receiving DXA scans in the Swedish study limits the number of patients that can be adequately assessed with regard to a comparison between the bone imaging devices of interest, and the lack of clarity concerning patient compliance in the other study introduces uncertainty concerning this feature of internal validity. Two of the studies drew conclusions that did not align clearly with the data reported;18,20 that is, the Swedish study concluded that QUS may be appropriate in primary care settings, but its findings were specific to patients with diabetes mellitus.18 The Australian study stated as its aim a comparison between QUS and DXA, but most of its findings compared patients by T2DM status, with no clear or quantitative comparisons drawn between the bone imaging devices; nonetheless, the conclusions state that parameters from both devices are comparable.20 Further, the main study conclusions are drawn with regard to T2DM patients, without acknowledging the data from the much larger group of patients in the study without T2DM.20 Finally, study power calculations were either not conducted18 or not reported by any of the studies,19,20 which may contribute to a lack of certainty regarding the findings, limiting an understanding of their generalizability.
Economic Evaluation
The cost-effectiveness study demonstrated both strengths and limitations during critical appraisal.21 In particular, the study design was well-reported, with a clear rationale, justification, research objective and viewpoint.21 In addition, several features of the data collection methods were clear, including the source of clinical data, methods for the estimation of costs, currency and price data, as well as the models chosen and a justification of the choices made.21 Likewise, several components of the analyses and interpretation were clearly reported and demonstrated strengths that increase confidence in the findings of the study i.e., a clearly reported time horizon and discount rate were included. Further, the statistical methods (including sensitivity analyses) were clearly reported, and the data and conclusions were concordant, with the former supporting the latter.21 These details are important for the reader of the study to determine the confidence they can place in the findings of an economic evaluation.
Several limitations of the study were also observed; in particular, productivity changes were not included in the report,21 limiting the extent to which the reader can consider the potential impact of indirect costs on the study findings. Other limitations included a lack of justification for the selection of discount rate and variables included in the sensitivity analyses21; these omissions limit the extent to which the reader can weigh the potential impact of these methodological choices on the study findings and conclusions.
Evidence-Based Guidelines
As with the studies included in this review, the evidence-based guidelines demonstrated strengths and limitations worth considering when interpreting the recommendations they developed.22,23 For instance, the scope and purpose of the evidence-based guidelines were generally well-reported, with all documents clearly describing their objectives and the target population to whom the guideline applies.22,23 Similarly, the health questions and/or problems covered by the guidelines were clearly reported by 1 of the guidelines,22 but were not clearly reported in the other guideline.23
As it concerned stakeholder involvement, both of the guidelines demonstrated that their development groups included multidisciplinary representation, and clearly indicated the target users for whom the guidelines were developed.22,23 On the other hand, the guidelines did not explicate whether or not a public consultation was carried out as part of the guideline development process.22,23
Rigour of development was variable, with some elements of rigour apparent, and a lack of clarity concerning other elements.22,23 In particular, the use of a systematic method for identifying and assessing evidence to inform the recommendations was not clear for 1 of the guidelines,23 whereas the other reported the use of a systematic review but failed to explicate the criteria used in the selection of evidence.22 Neither of the included guidelines clearly reported the methods used in formulating their recommendations.22,23 Notably, both guidelines provided an explicit link between the evidence used and the recommendations that were formulated22,23 — which is a critical feature in describing the methods used to develop evidence-based recommendations.
Clarity of presentation was a strength common to the guidelines, with both presenting information relevant to different bone imaging modalities, as well as clear and specific recommendations.22,23 Similarly, both guidelines presented key recommendations in an easily identifiable manner,22,23 Clarity of presentation is an important feature of evidence-based guidelines that ensures readers can easily identify, interpret, and apply key recommendations.
Applicability is an important domain when critically appraising evidence-based guidelines, as it ensures that readers can understand how the recommendations can best be implemented in a real-world context. Both of the guidelines demonstrated limitations in applicability, with 1 demonstrating some (but not other) criteria,23 and the other providing no explicit information demonstrating applicability.22
Finally, 1 of the evidence-based guidelines demonstrated both criteria necessary to demonstrate editorial independence,23 while the other did not describe any elements necessary to demonstrate editorial independence.22 Editorial independence is a key strength of evidence-based guidelines that can assure the reader that the recommendations have been formulated with limited influence or interference from external interests that could compromise the impartiality of the guideline and introduce a risk of bias.
Additional details regarding the strengths and limitations of included publications are provided in Appendix 3.
Summary of Findings
Clinical Utility of Portable Bone Imaging Devices
The 3 NRS reported on the associations between parameters and scores produced by bone imaging devices and the incidence of fractures across a long-term follow-up18-20; no data were identified describing other measures of clinical utility.
QUS Versus DXA as Predictors of Incident Fracture
Authors of the Swedish NRS reported their findings narratively, indicating that no association was found between either the T-scores or Z-scores of QUS or DXA with incident fractures of any type across 20 years of follow-up; however, a statistically significant association was reported between the Z-scores of QUS and incident fractures of the hip, lower leg and foot (i.e., authors reported P < 0.021 but did not report the details of the association).18 No other findings were reported.
The Australian study reported that BUA as measured by QUS and femoral BMD as measured by DXA were the most accurate predictors of any incident low-trauma fracture per 1 standard deviation (SD) decrease in bone parameter i.e., HR 1.47 (95% CI, 1.26 to 1.71) for BUA and 1.39 (95% CI, 1.17 to 1.64) for femoral neck BMD using adjusted Cox proportional hazards modelling for study patients without T2DM.20 No statistical comparisons were made between QUS and DXA; however, a narrative description by the authors suggests indicates that BUA and femoral BMD parameters from both devices performed similarly.20 Results of receiver operating characteristic (ROC) analyses comparing areas under the curve (AUC) for the predication of any low-trauma fracture in patients without type 2 diabetes produced identical values for BUA and femoral neck BMD; that is, 0.64 (95% CI, 0.60 to 0.68).20 A narrative description by the authors indicated that the AUC values were similar for both devices in the T2DM and non-T2DM groups, however, not statistical comparisons were reported between interventions.20
REMS Versus DXA as Predictors of Incident Fracture
The Italian NRS observed similar findings between REMS and DXA in the number of patients indicated as healthy at baseline (i.e., not osteoporotic or osteopenic) and the proportion of patients who experienced an incident fragility fracture across follow-up i.e., 74.5% and 75.6%, respectively (i.e., the difference between interventions was compared narratively only and described as being similar).19 Authors reported that the proportions of patients indicated as being osteoporotic at baseline and who experienced an incident fragility fracture as 43.7% with REMS and 39.5% with DXA (i.e., the difference between the interventions was not described).19 The proportions of patients who experienced an incident fragility fracture across follow-up who were identified as being osteopenic at baseline was 21.9% for REMS and 29.1% for DXA (i.e., again, the difference between the interventions was not characterized).19
The accuracy of vertebral T-scores indicating osteoporotic status as predictors of incident fragility fractures was also measured, producing statistically significant odds ratios (OR) of 2.6 (95% CI, 1.77 to 3.76, P < 0.001) for REMS and 1.70 (95% CI, 1.20 to 2.51, P = 0.0032) for DXA (though, the difference between the accuracies of REMS versus DXA was not reported).19 Similar data were generated describing the accuracy of femoral T-scores as predictors of incident fragility fractures, resulting in statistically significant ORs from both devices of 2.81 (95% CI, 1.80 to 4.39, P < 0.001) for REMS and 2.68 (95% CI, 1.71 to 4.21, P < 0.001) for DXA (though, again, the difference between the accuracies of REMS versus DXA was not reported).19
Results of ROC analyses comparing AUC values for femoral T-scores of REMS versus DXA found no significant differences in their predictive accuracy for a variety of incident fragility fractures.19 However, a statistically significant benefit of REMS as compared to DXA was reported in the predictive accuracy of vertebral T-scores for incident fragility fractures at all sites in a series of analyses matched and/or adjusted for age and/or BMI (i.e., P ≤ 0.001).19 Nonetheless, this clinical benefit of REMS was not apparent in sub-analyses by certain sites of fracture (i.e., hip and vertebra).19
Cost-Effectiveness of Portable Bone Imaging Devices
Cost-effectiveness
The base case analysis indicated that differences in QALYs gained between both POMs (which include the PEUS for bone imaging) and COM were small, with findings similar across the age and fracture history cohorts.21 While COM produced an estimated average gain of 0.001 QALY as compared to POMa, the additional cost of COM resulted in incremental cost-effectiveness ratios for COM ranging from €60,478 to €307,527 per QALY gained (dependent on age and fracture history cohort). With a willingness-to-pay threshold of €24,406 per QALY gained, POMa was more cost-effective than COM in all scenarios.21 POMb was clearly cost-effective as compared to COM, producing similar estimates of QALYs gained and a lower cost of POMb; that is, ICERs for all age and fracture history cohorts for COM were reported as being dominated. Relevant sensitivity analyses determined that the findings were most sensitive to the cost of DXA (including the costs of the test as well as travel) and the severity of osteoporosis at baseline as measured by T-scores (i.e., indicating that early detection is critical and supporting the assertion that the more easily accessible PEUS may have important value in the early identification and treatment of osteoporotic disease).21 Authors concluded that COM was not cost-effective as compared to either POMa or POMb.21
Guidelines
Recommendations Regarding QUS
The ACR made 2 recommendations specific to QUS for different indications; that is, 1 recommendation is intended to inform the screening or initial imaging of clinically suspected low BMD, and the other recommendation was developed to inform initial imaging for pre-menopausal women, men younger than 50 years of age and others with risk factors for low BMD.22 Both recommendations state that QUS is usually inappropriate for these indications.22 The evidence referenced in support of these recommendations and their associated statements is characterized as limited; that is, of poor quality, and there is no strength or level associated with either of the recommendations.22
Recommendation Regarding REMS
FELAN has published 1 recommendation specific to imaging devices, which states that imaging modalities other than DXA, such as REMS, should be implemented in Latin American contexts.23 This recommendation is made against the backdrop of a description of resource-constrained jurisdictions where barriers to access of DXA can interfere the identification of risk for fragility fractures.23 The quality of the evidence informing the recommendation is characterized as high,23 and is based on 1 study (that is also featured in this report as 1 of the NRS describing clinical utility19). There is no strength or level associated with the recommendation.23
Appendix 4 presents the main study findings and authors’ conclusions.
Limitations
The 6 eligible sources identified by this review expose limitations of the current body of evidence describing portable bone imaging devices for osteoporosis; that is, no systematic reviews or other high-quality evidence describing clinical utility were identified; 1 study describing cost-effectiveness in a non-Canadian context was identified, and the evidence-based guidelines either explicitly or implicitly highlighted important gaps in the evidence describing this topic.
In particular, of the 3 NRS describing clinical utility,18-20 1 reported findings from a total of 62 patients with diabetes mellitus,18 limiting the generalizability of the study findings to that sub-population. In addition, data describing the clinical utility of 2 types of portable bone imaging devices (i.e., QUS and REMS)18-20 and cost-effectiveness for 1 type of portable bone imaging device (i.e., PEUS)21 were identified, with no evidence found describing other types of portable bone imaging devices. Evidence describing clinical utility across a variety of portable bone imaging devices for the screening and diagnosis of osteoporosis in a variety of settings, including rural/remote and/or resource-constrained settings, is currently scarce.
Evidence describing the outcome of clinical utility for portable bone imaging devices was also found to be limited; that is, only data describing incident fractures was identified, with no data found describing impact on time to treatment for those diagnosed with osteoporosis, quality of life, and other measures of morbidity or mortality. Of note, evidence was found describing the DTA of portable bone imaging devices as compared to DXA (see [REMOVED REF FIELD]); however, studies describing outcomes of explicit clinical relevance were few.
One study describing cost-effectiveness was identified and it was conducted in a Finnish health care setting, which may not be comparable or applicable to the Canadian context. In addition, the economic evaluation conceded to the uncertainty in its estimates of cost, indicating that those for PEUS may have been inflated and those for DXA may have been underestimated.21 While this may minimize the cost-effectiveness benefits estimated of PEUS, the lack of certainty extends to the findings and conclusions of the study, representing another limitation of the data in answer to the question of cost-effectiveness.
Finally, the guideline recommendations were limited in their focus on portable bone imaging devices, with much of the emphasis put on DXA as the current gold standard. This often seemed to be a function of the scarcity of evidence on the topic, with 1 of the guidelines explicitly highlighting the lack of available and/or high-quality studies22 and the other basing its relevant recommendation on findings from 1 study.23 This dearth of evidence is corroborated by the findings of this review, which identified a limited number of studies describing either clinical utility and/or cost-effectiveness data.
In general, the literature describing bone imaging devices often lacked clarity as to the portability of the devices; that is, it was not always clear whether a device was or was not portable, as this feature of the devices did not appear to routinely be made explicit in the literature on this topic. Likewise, the bone properties measured by the respective imaging devices were often not made clear; that is, while all of the literature describing DXA clearly indicates its measurement of BMD, the properties measured by other bone imaging devices was often unclear. For instance, while many sources explicitly stated that QUS does not measure bone density,5,9,24,25 1 of the studies included in this review stated that QUS does measure bone density.18 This inconsistency and lack of clarity in the literature on the topic makes the information and evidence challenging to interpret and indicates the need for clarity and consensus in terminology and definitions among experts in this field.
Conclusions and Implications for Decision- or Policy-Making
This review identified 3 NRS describing clinical utility18-20; 1 economic evaluation describing cost-effectiveness,21 and 2 evidence-based guidelines describing recommendations to inform the use of portable bone imaging devices.22,23
Findings from 2 NRSs18,20 suggest that some measures by QUS were comparable to DXA for predicting fractures in patients with diabetes. However, 1 study only reported the results narratively (i.e., no numerical results)18 while the other study20 reported the numerical results, but no formal comparisons between the interventions, thus limiting the certainty in the findings from either study. The limitations of the evidence in support of QUS for screening for osteoporosis were also highlighted in 1 of the evidence-based guidelines, which recommended that using QUS for osteoporosis screening is usually inappropriate, based on insufficient evidence in support of QUS.22 Findings from 1 NRS19 comparing REMS and DXA, found REMS T-scores to be an effective predictor of incident fragility fractures in women, with findings reported as either comparable to DXA or favouring REMS. Notably, the 1 evidence-based guideline in this review that favoured the use of a portable bone imaging device (i.e., REMS) in its recommendation of relevance to this report, did so in the context of a resource-constrained setting,23 highlighting the importance of access and availability to those who are unable to access diagnostic services with the gold standard DXA.23,21,26 These limited findings about the clinical utility for portable bone imaging devices for screening and diagnosing osteoporosis suggest that additional evidence from larger studies with more heterogenous populations, and additional clinical utility outcomes (e.g., time to treatment, quality of life) are needed to better understand the clinical utility of these portable bone imaging devices.
The review includes findings from 1 economic evaluation,21 that examined the cost-effectiveness of 2 different POM pathways, that included the PEUS portable bone imaging device compared to the current osteoporosis management approach (without a portable bone imaging device) in a Finnish setting. Both proposed pathways with the PEUS device were cost-effective relative to the current pathway at a willingness-to-pay threshold of €24,406 per QALY across all scenarios. The findings from this study suggest a potential for PEUS portable bone imaging devices to proffer cost savings to health systems,21 which could also contribute to improved availability of bone imaging services in resource-constrained jurisdictions.
Questions concerning the value and utility of portable bone imaging devices are pressing and important — particularly in resource-constrained and/or rural or remote settings, where availability and access to DXA devices are often limited.10,13 Early diagnosis and treatment of osteoporosis is critical, making availability and access to those who may be at risk essential.8,9 These concerns around availability and access have important implications for Canada as well,26 given the large number of rural and remote communities across our large geographic land mass, as well as other jurisdictions and contexts where availability and/or access may be limited.
While a considerable body of evidence exists describing the DTA of portable bone imaging devices as compared to DXA,3,5,27,28 the clinical utility of these devices remains uncertain, and the body of research needs to be expanded to describe additional clinical outcomes that demonstrate the utility and safety of these devices on such real-world outcomes as morbidity (incident fractures, quality of life) and mortality. Importantly, research must also account for variability and differences across portable bone imaging devices, to ensure valid and reliable results.13 Further higher-quality research is needed to inform health care decision-makers as to the clinical utility and cost-effectiveness of various portable bone imaging devices for those at risk of osteoporosis.
References
1.Hans D, Baim S. Quantitative ultrasound (QUS) in the management of osteoporosis and assessment of fracture risk. J Clin Densitom. 2017;20(3):322-333. PubMed
2.Adams JW, Zhang Z, Noetscher GM, Nazarian A, Makarov SN. Application of a neural network classifier to radiofrequency-based osteopenia/osteoporosis screening. IEEE J Transl Eng Health Med. 2021;9:4900907. PubMed
3.Nowakowska-Plaza A, Wronski J, Plaza M, Sudol-Szopinska I, Gluszko P. Diagnostic agreement between radiofrequency echographic multispectrometry and dual-energy x-ray absorptiometry in the assessment of osteoporosis in a Polish group of patients. Pol Arch Intern Med. 2021;131(9):840-847. PubMed
4.Komar C, Ahmed M, Chen A, et al. Advancing methods of assessing bone quality to expand screening for osteoporosis. J Am Osteopath Assoc. 2019;119(3):147-154. PubMed
5.Nguyen HG, Lieu KB, Ho-Le TP, Ho-Pham LT, Nguyen TV. Discordance between quantitative ultrasound and dual-energy x-ray absorptiometry in bone mineral density: the Vietnam Osteoporosis Study. Osteoporos Sarcopenia. 2021;7(1):6-10. PubMed
6.Oral A, Esmaeilzadeh S, Yaliman A, Sindel D, Kursuz Koseoglu P, Aydin T. The ability of calcaneal and multisite quantitative ultrasound variables in the identification of osteoporosis in women and men. Turk J Phys Med Rehabil. 2019;65(3):203-215. PubMed
7.Subramaniam S, Chan CY, Soelaiman IN, et al. The performance of a calcaneal quantitative ultrasound device, CM-200, in stratifying osteoporosis risk among Malaysian population aged 40 years and above. Diagnostics (Basel). 2020;10(4):25. PubMed
8.Amiri L, Kheiltash A, Movassaghi S, Moghaddassi M, Seddigh L. Comparison of bone density of distal radius with hip and spine using DXA. Acta Med Iran. 2017;55(2):92-96. PubMed
9.Tabor E, Pluskiewicz W, Tabor K. Clinical conformity between heel ultrasound and densitometry in postmenopausal women: a systematic review. J Ultrasound Med. 2018;37(2):363-369. PubMed
10.Hollick RJ, McKee L, Shim J, et al. Introducing mobile fracture prevention services with DXA in Northern Scotland: a comparative study of three rural communities. Osteoporosis Int. 2020;31(7):1305-1314. PubMed
11.Sergio RO, Nayelli RGE. Evaluation of the bone mineral density in the Mexican female population using the Radiofrequency Echographic Multi Spectrometry (REMS) technology. Arch Osteoporos. 2022;17(1):43. PubMed
12.Raum K, Laugier P. Clinical devices for bone assessment. Adv Exp Med Biol. 2022;1364:35-53. PubMed
13.Hans D, Metrailler A, Gonzalez Rodriguez E, Lamy O, Shevroja E. Quantitative ultrasound (QUS) in the management of osteoporosis and assessment of fracture risk: an update. Adv Exp Med Biol. 2022;1364:7-34. PubMed
14.Downs SH, Black N. The feasibility of creating a checklist for the assessment of the methodological quality both of randomised and non-randomised studies of health care interventions. J Epidemiol and Community Health. 1998;52(6):377-384. PubMed
15.Higgins JPT, Green S, editors. Figure 15.5.a: Drummond checklist (Drummond 1996). Cochrane handbook for systematic reviews of interventions. London (GB): The Cochrane Collaboration; 2011: http://handbook-5-1.cochrane.org/chapter_15/figure_15_5_a_drummond_checklist_drummond_1996.htm. Accessed 2022 Jul 14.
16.Agree Next Steps Consortium. The AGREE II Instrument. [Hamilton, ON]: AGREE Enterprise; 2017: https://www.agreetrust.org/wp-content/uploads/2017/12/AGREE-II-Users-Manual-and-23-item-Instrument-2009-Update-2017.pdf. Accessed 2022 Jul 14.
17.Liberati A, Altman DG, Tetzlaff J, et al. The PRISMA statement for reporting systematic reviews and meta-analyses of studies that evaluate health care interventions: explanation and elaboration. J Clin Epidemiol. 2009;62(10):e1-e34. PubMed
18.Anna UM, Maria S, Kerstin B. Comparison of quantitative ultrasound of calcaneus and dual energy X-ray absorptiometry in measuring bone density and predicting fractures in patients with diabetic polyneuropathy: A prospective cohort study. Diabetes Res Clin Pract. 2021;180:109064. PubMed
19.Adami G, Arioli G, Bianchi G, et al. Radiofrequency echographic multi spectrometry for the prediction of incident fragility fractures: a 5-year follow-up study. Bone. 2020;134:115297. PubMed
20.Lasschuit JWJ, Center JR, Greenfield JR, Tonks KTT. Comparison of calcaneal quantitative ultrasound and bone densitometry parameters as fracture risk predictors in type 2 diabetes mellitus. Diabet Med. 2020;37(11):1902-1909. PubMed
21.Soini E, Riekkinen O, Kroger H, Mankinen P, Hallinen T, Karjalainen JP. Cost-effectiveness of pulse-echo ultrasonometry in osteoporosis management. ClinicoEcon. 2018;10:279-292. PubMed
22.American College of Radiology. ACR Appropriateness Criteria®: osteoporosis and bone mineral density. Reston (VA): American College of Radiology; 2022: https://acsearch.acr.org/docs/69358/Narrative/?_ga=2.64315695.1208439396.1649760002-2082026322.1646820991&_gl=1*1ecgsi0*_ga*MjA4MjAyNjMyMi4xNjQ2ODIwOTkx*_ga_K9XZBF7MXP*MTY0OTc2MDAwMS4xLjAuMTY0OTc2MDAwMS4w. Accessed 2022 Jun 29.
23.Gomez O, Talero AP, Zanchetta MB, et al. Diagnostic, treatment, and follow-up of osteoporosis-position statement of the Latin American Federation of Endocrinology. Arch Osteoporos. 2021;16(1):114. PubMed
24.U. S. Preventive Services Task Force, Curry SJ, Krist AH, et al. Screening for osteoporosis to prevent fractures: US Preventive Services Task Force recommendation statement. JAMA. 2018;319(24):2521-2531. PubMed
25.Chin KY, Ima-Nirwana S. Calcaneal quantitative ultrasound as a determinant of bone health status: what properties of bone does it reflect? Int J Med Sci. 2013;10(12):1778-1783. PubMed
26.Kendler DL, Adachi JD, Brown JP, et al. A scorecard for osteoporosis in Canada and seven Canadian provinces. Osteoporos Int. 2021;32(1):123-132. PubMed
27.Lewiecki EM. Pulse-echo ultrasound identifies Caucasian and Hispanic women at risk for osteoporosis. J Clin Densitom. 2021;24(2):175-182. PubMed
28.Vogl F, Friesenbichler B, Husken L, Kramers-de Quervain IA, Taylor WR. Can low-frequency guided waves at the tibia paired with machine learning differentiate between healthy and osteopenic/osteoporotic subjects? A pilot study. Ultrasonics. 2019;94:109-116. PubMed
29.American College of Radiology. ACR Appropriateness Criteria®: evidence document. Reston (VA): American College of Radiology; 2019: https://www.acr.org/-/media/ACR/Files/Appropriateness-Criteria/EvidenceTableDevelopment.pdf. Accessed 2022 July 14.
Appendix 1: Selection of Included Studies
Appendix 2: Characteristics of Included Publications
Note that this appendix has not been copy-edited.
Table 2: Characteristics of Included Primary Clinical Studies
Study citation, country, funding source | Study design | Population characteristics | Intervention and comparator(s) | Clinical outcomes, length of follow-up |
|---|---|---|---|---|
Anna, 202118 Country: Sweden Funding: Erling-Persson Family Foundation | Prospective cohort comparing the use of bone imaging devices in each study participant | Patients with T1DM (n=27) or T2DM (n=35) and polyneuropathy, attending a foot clinic Mean age, yrs (SD) T1DM: 50 (13.6) T2DM: 65 (10.0) Male sex, n (%) T1DM: 13 (48) T2DM: 21 (60) Mean BMI, (SD) T1DM: 24 (3.3) T2DM: 27 (5.5) | QUS DXA | Outcomes:
Follow-up:
|
Adami, 202019 Country: Italy Funding: NR | Prospective cohort comparing the use of bone imaging devices in each study participant | Women between the ages of 30 and 90 years with a prescription for a bone density scan with DXA (N =1,516 recruited; N=1370 analyzed) Median age, yrs (IQR) Fractured group: 71 (62.8 to 74.3) Non-fractured group: 59.7 (54.1 to 64.8) Median BMI, (IQR) Fractured group: 25.0 (22.9 to 27.1) Non-fractured group: 24.2 (22.2 to 26.6) | REMS DXA | Outcomes:
Follow-up:
|
Lasschuit, 202020 Country: Australia Funding: Australian Government research scholarship | Prospective cohort comparing the use of bone imaging devices in each study participant | People aged 60 years and older with T2DM (n=96) or without T2DM (n=809) Median age, yrs (IQR) T2DM, fractured: 70 (67 to 77) T2DM, not fractured: 70 (68 to 75) No T2DM, fractured: 71 (68 to 76) No T2DM, not fractured: 71 (68 to 76) Male sex, n (%) T2DM, fractured: 8 (33) T2DM, not fractured: 45 (63) No T2DM, fractured: 107 (37) No T2DM, not fractured: 297 (57) Median BMI, (IQR) T2DM, fractured: 27.9 (25.3 to 29.6) T2DM, not fractured: 28.6 (25.7 to 30.3) No T2DM, fractured: 25.1 (23.0 to 28.1) No T2DM, not fractured: 25.8 (23.4 to 28.6) | QUS DXA | Outcomes:
Follow-up:
|
DXA = dual-energy x-ray absorptiometry; IQR = inter-quartile range; QUS = quantitative ultrasound; NR = not reported; REMS = radiofrequency echographic multi spectrometry; SD = standard deviation; T1DM = type 1 diabetes mellitus; T2DM = type 2 diabetes mellitus; yr = year(s).
Table 3: Characteristics of Included Economic Evaluation
Study citation country, funding source | Type of analysis, time horizon, perspective | Population characteristics | Intervention and comparator(s) | Approach | Source of clinical, cost, and utility data used in analysis | Main assumptions |
|---|---|---|---|---|---|---|
Soini, 201821 Country: Finland Funding: Bone Index Finland Ltd. | Cost-effectiveness analysis, 10yr time horizon (max.), third-party payer perspective | 5 cohorts of females ranging in age from 65-85, with or without previous fracture | 2 osteoporosis management pathways: FRAX/PEUS/DXA FRAX/DXA | Markov model | Published population health and clinical data sources (various, cited); published sources for cost data (cited); source for utilities data NR | DXA was assumed to be 100% accurate, generally affordable, and accessible PEUS was assumed to have a relatively higher cost than is likely to be actual Severity of fractures was assumed to be hierarchical by type (i.e., hip more serious than vertebral, vertebral more serious than wrist and others) All diagnosed osteoporosis was assumed to initiate treatment Alendronate was assumed to be the prescribed medication All state costs were assumed to vary within 10% The willingness-to-pay threshold was assumed to be £20-30K/QALY (which converted to €24,406) |
DXA = dual-energy x-ray absorptiometry; FRAX = fracture risk assessment; NR = not reported; PEUS = pulse-echo ultrasonometry; QALY = quality-adjusted life-year; yr = year(s).
Table 4: Characteristics of Included Guidelines
Intended users, target population | Intervention and practice considered | Major outcomes considered | Evidence collection, selection, and synthesis | Evidence quality assessment | Recommendations development and evaluation | Guideline validation |
|---|---|---|---|---|---|---|
American College of Radiology (ACR), 202222 | ||||||
Intended users: Physicians and other health care providers Target population: Populations with: (i) clinically suspected low bone mineral density (ii) pre-menopausal females or males <50 yr of age and/or individuals with risk factors that could alter bone mineral density | Interventions/ interventions for bone imaging Intervention relevant to this report: QUS of the calcaneus | Appropriate- | Systematic literature search (full search strategy provided), evidence selection and synthesis methods NR | “Study Quality” scale — the origin of which is neither cited nor described (other than a tabulated presentation of the criteria that are applied) | Development of recommendations includes incorporation of the best available evidence, expert consensus, and consultation with health care providers; evaluation is NR | Review of the guidance was undertaken by an expert panel (not specified whether internal or external to the development group) |
Latin American Federation of Endocrinology (FELAEN), 202123 | ||||||
Intended Users: Any clinicians providing health care to patients with OP Target Population: Women with or at risk for developing OP | Interventions/ interventions for the diagnosis and treatment of OP Interventions relevant to this report: diagnostic technologies for OP, other than DXA i.e., REMS | Accurate diagnosis of OP | Search of guidelines and evidence, selection of high-quality sources of evidence only, synthesis methods NR | Information was appraised by the development group (no other information/detail reported) | Delphi consensus method (anonymous responses, three rounds) | NR |
ACR = American College of Radiology; DXA = dual-energy x-ray absorptiometry; FELAEN = Latin American Federation of Endocrinology; NR = not reported; OP = osteoporosis; QUS = quantitative ultrasound; REMS = radiofrequency echographic multi spectrometry.
Appendix 3: Critical Appraisal of Included Publications
Note that this appendix has not been copy-edited.
Table 5: Strengths and Limitations of Clinical Study Using the Downs and Black Checklist14
Strengths | Limitations |
|---|---|
Anna 202118 | |
Reporting
External validity
Internal validity (bias)
Internal validity (confounding)
Power
| Reporting
External validity
Internal validity (bias)
Internal validity (confounding)
|
Adami 202019 | |
Reporting
External validity
Internal validity (bias)
Internal validity (confounding)
| Reporting
External validity
Internal validity (bias)
Internal validity (confounding)
Power
|
Lasschuit, 202020 | |
Reporting
External validity
Internal validity (bias)
Internal validity (confounding)
| Reporting
External validity
Internal validity (bias)
Internal validity (confounding)
Power
|
DXA = dual-energy X-ray absorptiometry.
Table 6: Strengths and Limitations of Economic Evaluation Using the Drummond Checklist15
Strengths | Limitations |
|---|---|
Soini 201821 | |
Study design
Data collection
Analysis and interpretation
| Data collection
Analysis and interpretation
|
Table 7: Strengths and Limitations of Guidelines Using AGREE II16
Item | ACR, 202222 | FELAEN, 202123 |
|---|---|---|
Domain 1: Scope and Purpose | ||
1. The overall objective(s) of the guideline is (are) specifically described. | Yes | Yes |
2. The health question(s) covered by the guideline is (are) specifically described. | No | Partially |
3. The population (patients, public, etc.) to whom the guideline is meant to apply is specifically described. | Yes | Yes |
Domain 2: Stakeholder Involvement | ||
4. The guideline development group includes individuals from all relevant professional groups. | Yes | Yes |
5. The views and preferences of the target population (patients, public, etc.) have been sought. | NR | NR |
6. The target users of the guideline are clearly defined. | Yes | Yes |
Domain 3: Rigour of Development | ||
7. Systematic methods were used to search for evidence. | Yes | Unclear |
8. The criteria for selecting the evidence are clearly described. | No | Partially |
9. The strengths and limitations of the body of evidence are clearly described. | Yes | No |
10. The methods for formulating the recommendations are clearly described. | Partially | Partially |
11. The health benefits, side effects, and risks have been considered in formulating the recommendations. | NR | Unclear |
12. There is an explicit link between the recommendations and the supporting evidence. | Yes | Yes |
13. The guideline has been externally reviewed by experts prior to its publication. | Unclear | NR |
14. A procedure for updating the guideline is provided. | Yes | No |
Domain 4: Clarity of Presentation | ||
15. The recommendations are specific and unambiguous. | Yes | Yes |
16. The different options for management of the condition or health issue are clearly presented. | Yes | Yes |
17. Key recommendations are easily identifiable. | Yes | Yes |
Domain 5: Applicability | ||
18. The guideline describes facilitators and barriers to its application. | No | Partially |
19. The guideline provides advice and/or tools on how the recommendations can be put into practice. | No | Yes |
20. The potential resource implications of applying the recommendations have been considered. | Unclear | Yes |
21. The guideline presents monitoring and/or auditing criteria. | No | No |
Domain 6: Editorial Independence | ||
22. The views of the funding body have not influenced the content of the guideline. | Unclear | Yes |
23. Competing interests of guideline development group members have been recorded and addressed. | No | Yes |
ACR = American College of Radiology; AGREE II = Appraisal of Guidelines for Research and Evaluation II; FELAEN = Latin American Federation of Endocrinology; NR = not reported.
Appendix 4: Main Study Findings and Authors’ Conclusions
Table 8: Summary of Findings by Outcome — DXA Versus QUS as Predictors of Incident Fracture
Study citation and study design | Measure | DXA | QUS | Difference between interventions |
|---|---|---|---|---|
Anna, 202118 NRS | Association between T- or Z-scores and incident fracture | NR | NR | No association between incident fractures (all types) and QUS or DXA T- or Z-scores (results reported narratively only) Statistically significant association was observed between incident fractures of the hip, lower leg and foot and Z-scores of QUS (results reported narratively only) P < 0.021 |
Lasschuit, 202020 NRS | Risk of fracture (in study patients without T2DM) predicted by 1 SD decrease in bone measurement parameter, adjusted Cox proportional hazard model, HR (95% CI) | Lumbar spine BMD 1.43 (1.21 to 1.68) Femoral neck BMD 1.39 (1.17 to 1.64) | VOS 1.19 (1.06 to 1.34) BUA 1.47 (1.26 to 1.71) | Authors conclude, generally, that BUA and femoral neck BMD are comparable predictors of incident low-trauma fractures in patients with T2DM. No other comparisons between interventions are reported. |
Risk of fracture (in study patients with T2DM) predicted by 1 SD decrease in bone measurement parameter, adjusted Cox proportional hazard model, HR (95% CI) | Lumbar spine BMD 1.86 (1.08 to 3.19) Femoral neck BMD 2.55 (1.28 to 5.08) | VOS 1.59 (0.89 to 2.84) BUA 1.81 (1.03 to 3.19) | ||
Bone measurement parameters and incidence of any low-trauma fracture (in study patients without T2DM), AUC values (95% CI) | Lumbar spine BMD 0.65 (0.61 to 0.69) Femoral neck BMD 0.64 (0.60 to 0.68) | VOS 0.57 (0.53 to 0.61) BUA 0.64 (0.60 to 0.68) | ||
Bone measurement parameters and incidence of any low-trauma fracture (in study patients with T2DM), AUC values (95% CI) | Lumbar spine BMD 0.72 (0.60 to 0.85) Femoral neck BMD 0.73 (0.60 to 0.85) | VOS 0.63 (0.50 to 0.76) BUA 0.69 (0.56 to 0.81) |
AUC = area under the curve; BMD = bone mineral density; BUA = broadband ultrasound attenuation; CI = confidence interval; DXA = dual-energy x-ray absorptiometry; HR = hazard ratio; QUS = quantitative ultrasound; NR = not reported; p. = page; SD = standard deviation; T2DM = type 2 diabetes mellitus; VOS = velocity of sound.
Table 9: Summary of Findings by Outcome — DXA Versus REMS as Predictors of Incident Fracture
Measure | DXA | REMS | Difference between interventions |
|---|---|---|---|
Adami, 2020,19 NRS | |||
Proportion of patients indicated as healthy at baseline who did not experience a vertebral fragility fracture, % | 75.6 | 74.5 | Described as “similar” (p. 4) |
Proportion of patients indicated as osteoporotic at baseline and who experienced a vertebral fragility fracture, % | 39.5 | 43.7 | NR |
Proportion of patients indicated as osteopenic at baseline and who experienced a vertebral fragility fracture, % | 29.1 | 21.9 | NR |
Agreement between osteoporotic T-score (i.e., ≤-2.5) and incident fragility fracture across follow-up, % | Vertebral DXA Sensitivity: 57.1 Specificity: 56.3 | Vertebral REMS Sensitivity: 65.1 Specificity: 57.7 | NR |
Femoral DXA Sensitivity: 42.3 Specificity: 79.3 | Femoral REMS Sensitivity: 40.2 Specificity: 79.9 | NR | |
Odds of fracture by osteoporotic status as characterized by T-score (i.e., ≤-2.5 vs. > -2.5), OR (95% CI) | Vertebral DXA 2.6 (1.77 to 3.76) P < 0.001 | Vertebral REMS 1.7 (1.20 to 2.51) P = 0.0032 | NR |
Femoral DXA 2.68 (1.71 to 4.21) P < 0.001 | Femoral REMS 2.81 (1.80 to 4.39) P < 0.001 | NR | |
Lumbar T-scores and incidence of fragility fractures, AUC values for age-matched dataset, fractures at all sites | 0.614 | 0.657 | P = 0.0002 (favours REMS) |
Lumbar T-scores and incidence of fragility fractures, AUC values for age-adjusted overall dataset, fractures at all sites | 0.597 | 0.631 | P = 0.001 (favours REMS) |
Lumbar T-scores and incidence of fragility fractures, AUC values for BMI-adjusted overall dataset, fractures at all sites | 0.692 | 0.723 | P = 0.001 (favours REMS) |
Lumbar T-scores and incidence of fragility fractures, AUC values for age- and BMI-adjusted overall dataset, vertebral fractures | 0.613 | 0.649 | P = 0.001 (favours REMS) |
Lumbar T-scores and incidence of fragility fractures, AUC values for age- and BMI-adjusted overall dataset, vertebral fractures | 0.78 | 0.781 | P = 0.99 (NS) |
Lumbar T-scores and incidence of fragility fractures, AUC values for age- and BMI-adjusted overall dataset, hip fractures | 0.674 | 0.664 | P = 0.67 (NS) |
Lumbar T-scores and incidence of fragility fractures, AUC values for age- and BMI-adjusted overall dataset, fractures at other sites | 0.545 | 0.594 | P = 0.001 (favours REMS) |
Femoral neck T-scores and incidence of fragility fractures, AUC values for age-adjusted overall dataset, fractures at all sites | 0.583 | 0.627 | P = 0.06 (NS) |
Femoral neck T-scores and incidence of fragility fractures, AUC values for BMI-adjusted overall dataset, fractures at all sites | 0.674 | 0.695 | P = 0.24 (NS) |
Femoral neck T-scores and incidence of fragility fractures, AUC values for age- and BMI-adjusted overall dataset, fractures at all sites | 0.596 | 0.632 | P = 0.08 (NS) |
Femoral neck T-scores and incidence of fragility fractures, AUC values for age- and BMI-adjusted overall dataset, vertebral fractures | 0.590 | 0.622 | P = 0.60 (NS) |
Femoral neck T-scores and incidence of fragility fractures, AUC values for age- and BMI-adjusted overall dataset, hip fractures | 0.616 | 0.602 | P = 0.78 (NS) |
Femoral neck T-scores and incidence of fragility fractures, AUC values for age- and BMI-adjusted overall dataset, fractures at other sites | 0.567 | 0.611 | P = 0.07 (NS) |
AUC = area under the curve; BMD = bone mineral density; BMI = body mass index; CI = confidence interval; DXA = dual-energy x-ray absorptiometry; HR = hazard ratio; NR = not reported; NS = not significant; OR = odds ratio; p. = page; REMS = radiofrequency echographic multi spectrometry; T2DM = type 2 diabetes mellitus.
Table 10: Summary of Findings of the Included Economic Evaluation
Main study findings | Authors’ conclusion |
|---|---|
Soini (2018)21 | |
Costs/pt in €
Projected annual cost savings (assuming 40K women tested), millions of € (range)
| |
QALYs gained
| |
Base case, ICERs i.e., €/QALY gained or cost-effectiveness verdict
| “The inclusion of PEUS to osteoporosis management pathway was cost-effective.” (p. 279) |
Sensitivity analyses, severe osteoporosis (i.e., mean T-score of -3.5)
| |
Sensitivity analyses, most affordable estimated cost of DXA (i.e., €124.00)
| |
Sensitivity analyses, expected cost of DXA (i.e., €381.26)
| |
Sensitivity analyses, assumed cost of PEUS at €20.00
| |
Sensitivity analyses, assumed cost of PEUS at €35.00
| |
Probability of cost-effectiveness, POMa vs. COM, %
Probability of cost-effectiveness, POMB vs. COM, %
| |
CEA = cost-effectiveness ratio; COM = current osteoporosis management pathway; ICER = incremental cost-effectiveness ratio; K = thousand(s); pt = patient(s); POM = proposed osteoporosis management pathway; POMa = proposed osteoporosis management pathway A; POMb = proposed osteoporosis management pathway B; QALY = quality-adjusted life-year; WTP = willingness to pay; yr = year(s).
Table 11: Summary of Recommendations in Included Guidelines
Recommendations and supporting evidence | Quality of evidence and strength of recommendations |
|---|---|
American College of Radiology (ACR), 202222 | |
Evidence-based recommendations and supporting evidence: Variant 1 — QUS for osteoporosis screening, or initial imaging of clinically suspected low bone mineral density, is usually inappropriate: "There is insufficient evidence to support the current use of quantitative ultrasound (QUS) as a screening tool in patients suspected of having osteoporosis or low BMD" (pp. 6-7) Variant 4 — QUS as initial imaging for pre-menopausal females or males <50yrs, or individuals with risk factors that could alter BMD, is usually inappropriate: “There is insufficient evidence to support the use of QUS as a screening study in this group of patients. The correlation between QUS parameters and DXA has been reported to be lower in premenopausal women than in postmenopausal women and not predictive of osteoporosis [109].” (p. 11) | Quality of evidence: Characterized as ‘Limited’ for both recommendations applicable to Variants 1 and 4 (i.e., recommendations relevant to this review by virtue of their basis upon evidence), which is defined as: “Poor quality studies (i.e., reviews) are used to support the recommendation. The studies may or may not demonstrate similar estimates of the effect and relate to the same or very similar clinical conditions”29 (p. 6) Strength of recommendations: NR |
Latin American Federation of Endocrinology (FELAEN), 202123 | |
Relevant recommendation: “There are additional diagnostic tools to DXA such as… REMS… that should be implemented in Latin American countries to improve the initial approach to osteoporosis.” (p. 114) Supporting evidence for the relevant recommendation: Results from one cohort study are described, indicating that REMS T-scores were significantly associated with the incidence of fragility fractures | Quality of evidence: Characterized as ‘High’ for the study supporting the relevant recommendation (though, the methods used to arrive at this assessment are NR) Strength of recommendation: NR |
AACE = American Association of Clinical Endocrinologists; ACE = American College of Endocrinology; BMD = bone mineral density; DXA = dual-energy x-ray absorptiometry; FELAEN = Latin American Federation of Endocrinology; NR = not reported; QUS = quantitative ultrasound; REMS = radiofrequency echographic multi spectrometry; yr = year(s).
Appendix 5: References of Potential Interest
Note that this appendix has not been copy-edited.
Previous CADTH Reports
Portable bone mineral density scanners for screening and diagnosis of osteoporosis: uses, limitations, and guidelines. Ottawa (ON): CADTH; 2013: https://www.cadth.ca/sites/default/files/pdf/htis/jun-2013/RB0590%20Portable%20BMD%20testing%20Final.pdf. Accessed 2022 Jul 14.
Smartphone-, tablet-, or app-based portable ultrasound: a review of clinical effectiveness. (CADTH rapid response report: summary with critical appraisal). Ottawa (ON): CADTH; 2019: https://www.cadth.ca/sites/default/files/pdf/htis/2019/RC1173%20App-Based%20Ultrasound%20Final.pdf. Accessed 2022 Jul 14.
Point of care ultrasound for assessment of patients in emergency departments: guidelines. (CADTH rapid response report: summary of abstracts). Ottawa (ON): CADTH; 2019: https://www.cadth.ca/sites/default/files/pdf/htis/2019/RB1370%20POCUS%20Guidelines%20Final.pdf. Accessed 2022 Jul 14.
Point of care ultrasound for assessment of patients with physical trauma in emergency departments: clinical utility and cost-effectiveness. (CADTH rapid response report: summary of abstracts). Ottawa (ON): CADTH; 2019: https://www.cadth.ca/sites/default/files/pdf/htis/2019/RB1383%20POCUS%20for%20Physical%20Trauma%20Final.pdf. Accessed 2022 Jul 14.
Point of care ultrasound for assessment of patients with suspected or known chronic heart failure in emergency departments: clinical utility and cost-effectiveness. (CADTH rapid response report: summary of abstracts). Ottawa (ON): CADTH; 2019: https://www.cadth.ca/sites/default/files/pdf/htis/2019/RB1380%20POCUS%20for%20CHF%20Final.pdf. Accessed 2022 Jul 14.
Point-of-care testing: summary of evidence. Ottawa (ON): CADTH: 2017: https://www.cadth.ca/sites/default/files/pdf/point_of_care_testing_summary_of_evidence_e.pdf. Accessed 2022 Jul 14.
Review Articles
Bindex for investigating suspected osteoporosis. Medtech innovation briefing. London (UK): NICE: 2017: https://www.nice.org.uk/advice/mib106/resources/bindex-for-investigating-suspected-osteoporosis-pdf-2285963217659077. Accessed 2022 Jun 29.
Diez-Perez A, Brandi ML, Al-Daghri N, et al. Radiofrequency echographic multi-spectrometry for the in-vivo assessment of bone strength: state of the art-outcomes of an expert consensus meeting organized by the European Society for Clinical and Economic Aspects of Osteoporosis, Osteoarthritis and Musculoskeletal Diseases (ESCEO). Aging Clin Exp Res. 2019;31(10):1375-1389. PubMed
Additional References
Alternative Comparator: Not Standard Bone Density Scanner
Gao C, Song H, Chen B, Zhang Z, Yue H. The assessment of the osteoporosis self-assessment tool for Asians and calcaneal quantitative ultrasound in identifying osteoporotic fractures and falls among Chinese people. Front Endocrinol (Lausanne). 2021;12:684334. PubMed
Alternative Comparator i.e., no comparison between interventions
Rinaldi C, Bortoluzzi S, Airoldi C, et al. The early detection of osteoporosis in a cohort of healthcare workers: is there room for a screening program? Int J Environ Res Public Health. 2021;18(3):1368. PubMed
Hollick RJ, McKee L, Shim J, et al. Introducing mobile fracture prevention services with DXA in Northern Scotland: a comparative study of three rural communities. Osteoporosis Int. 2020;31(7):1305-1314. PubMed
Alternative Outcomes i.e., not clinical utility (no measure of incident fractures and/or diagnostic test accuracy measures only)
Li C, Sun J, Yu L. Diagnostic value of calcaneal quantitative ultrasound in the evaluation of osteoporosis in middle-aged and elderly patients. Medicine. 2022;101(2):e28325. PubMed
Bi D, Dai Z, Liu D, et al. Ultrasonic backscatter measurements of human cortical and trabecular bone densities in a head-down bed-rest study. Ultrasound Med Biol. 2021;47(8):2404-2415. PubMed
Di Paola M, Gatti D, Viapiana O, et al. Radiofrequency echographic multispectrometry compared with dual x-ray absorptiometry for osteoporosis diagnosis on lumbar spine and femoral neck. Osteoporos Int. 2019;30(2):391-402. PubMed
Lewiecki EM. Pulse-echo ultrasound identifies Caucasian and Hispanic women at risk for osteoporosis. Clin Densitom. 2021;24(2):175-182. PubMed
Nguyen HG, Lieu KB, Ho-Le TP, Ho-Pham LT, Nguyen TV. Discordance between quantitative ultrasound and dual-energy x-ray absorptiometry in bone mineral density: the Vietnam Osteoporosis Study. Osteoporos Sarcopenia. 2021;7(1):6-10. PubMed
Nowakowska-Plaza A, Wronski J, Plaza M, Sudol-Szopinska I, Gluszko P. (2021) Diagnostic agreement between radiofrequency echographic multispectrometry and dual-energy X-ray absorptiometry in the assessment of osteoporosis in a Polish group of patients. Pol Arch Intern Med. 2021;131(9):840-847. PubMed
Yen CC, Lin WC, Wang TH, et al. (2021) Pre-screening for osteoporosis with calcaneus quantitative ultrasound and dual-energy X-ray absorptiometry bone density. Sci Rep. 2021;11(1):15709. PubMed
Shalof H, Dimitri P, Shuweihdi F, Offiah AC. Which skeletal imaging modality is best for assessing bone health in children and young adults compared to DXA? A systematic review and meta-analysis. Bone. 2021;150:116013. PubMed
Caffarelli C, Tomai Pitinca MD, Al Refaie A, Ceccarelli E, Gonnelli S. Ability of radiofrequency echographic multispectrometry to identify osteoporosis status in elderly women with type 2 diabetes. Aging Clin Exp Res. 2022;34(1):121-127. PubMed
Cortet B, Dennison E, Diez-Perez A, et al. Radiofrequency Echographic Multi Spectrometry (REMS) for the diagnosis of osteoporosis in a European multicenter clinical context. Bone. 2021;143:115786. PubMed
Costa C, Scabini S, Kaimal A, et al. Calcaneal quantitative ultrasonography and urinary retinol-binding protein in antiretroviral-treated patients with human immunodeficiency virus in Uganda: a pilot study. J Infect Dis. 2020;222(2):263-272. PubMed
Fitzgerald GE, Anachebe T, McCarroll KG, O'Shea F. Calcaneal quantitative ultrasound has a role in out ruling low bone mineral density in axial spondyloarthropathy. Clin Rheumatol. 2020;39(6):1971-1979. PubMed
Lasschuit JWJ, Center JR, Greenfield JR, Tonks KTT. Comparison of calcaneal quantitative ultrasound and bone densitometry parameters as fracture risk predictors in type 2 diabetes mellitus. Diabet Med. 2020;37(11):1902-1909. PubMed
Subramaniam S, Chan CY, Soelaiman IN, et al. The performance of a calcaneal quantitative ultrasound device, CM-200, in stratifying osteoporosis risk among Malaysian population aged 40 years and above. Diagnostics (Basel). 2020;10(4):25. PubMed
Oral A, Esmaeilzadeh S, Yaliman A, Sindel D, Kursuz Koseoglu P, Aydin T. The ability of calcaneal and multisite quantitative ultrasound variables in the identification of osteoporosis in women and men. Turk J Phys Med Rehabil. 2019;65(3):203-215. PubMed
Steiner B, Dimai HP, Steiner H, Cirar S, Fahrleitner-Pammer A. Prescreening for osteoporosis with quantitative ultrasound in postmenopausal white women. J Ultrasound Med. 2019;38(6):1553-1559. PubMed
Vogl F, Friesenbichler B, Husken L, Kramers-de Quervain IA, Taylor WR. Can low-frequency guided waves at the tibia paired with machine learning differentiate between healthy and osteopenic/osteoporotic subjects? A pilot study. Ultrasonics. 2019;94:109-116. PubMed
Sung, K.H., Choi, Y., Cho, G.H. et al. Peripheral DXA measurement around ankle joint to diagnose osteoporosis as assessed by central DXA measurement. Skeletal Radiol 2018;47:1111–1117. . [Identified through ref list searches]PubMed
Tabor E, Pluskiewicz W, Tabor K. Clinical conformity between heel ultrasound and densitometry in postmenopausal women: a systematic review. J Ultrasound Med. 2018;37(2):363-369. PubMed
Alternative Outcome i.e., No Recommendation(s) Specific to Portable Bone Density Scanners
Sanchez-Rodriguez D, Bergmann P, Body JJ, et al. The Belgian Bone Club 2020 guidelines for the management of osteoporosis in postmenopausal women. Maturitas. 2020;139:69-89. PubMed
Alternative Study Design i.e., guideline with an unclear methodology/use of evidence
Galindo-Zavala R, Bou-Torrent R, Magallares-Lopez B, et al. Expert panel consensus recommendations for diagnosis and treatment of secondary osteoporosis in children. Pediatr Rheumatol Online J. 2020;18(1):20. PubMed
Conference Abstract
Ciardo D, Conversano F, Pisani P, Casciaro S. SUN-LB74 Radiofrequency Echographic Multi-Spectrometry (REMS) for the assessment of bone strength and fracture risk prediction. J Endoc Soc. 2020;4(Suppl 1):SUN–LB74. 10.1210/jendso/bvaa046.2277. Accessed 2022 Jul 14.
Evidence-Based Guidelines With No Recommendations Specific to Portable Bone Imaging Devices
Scottish Intercollegiate Guidelines Network (SIGN). Management of osteoporosis and the prevention of fragility fractures. 2021; https://www.sign.ac.uk/media/1812/sign-142-osteoporosis-v3.pdf. Accessed 2022 Jun 29.
Camacho PM, Petak SM, Binkley N, et al. American Association of Clinical Endocrinologists/American College of Endocrinology clinical practice guidelines for the diagnosis and treatment of postmenopausal osteoporosis: 2020 update. Endocr Pract. 2020;26(Suppl 1):1-46. PubMed
U. S. Preventive Services Task Force, Curry SJ, Krist AH, et al. Screening for osteoporosis to prevent fractures: US Preventive Services Task Force recommendation statement. JAMA. 2018;319(24):2521-2531. PubMed
ISSN: 2563-6596
Disclaimer: The information in this document is intended to help Canadian health care decision-makers, health care professionals, health systems leaders, and policy-makers make well-informed decisions and thereby improve the quality of health care services. While patients and others may access this document, the document is made available for informational purposes only and no representations or warranties are made with respect to its fitness for any particular purpose. The information in this document should not be used as a substitute for professional medical advice or as a substitute for the application of clinical judgment in respect of the care of a particular patient or other professional judgment in any decision-making process. The Canadian Agency for Drugs and Technologies in Health (CADTH) does not endorse any information, drugs, therapies, treatments, products, processes, or services.
While care has been taken to ensure that the information prepared by CADTH in this document is accurate, complete, and up to date as at the applicable date the material was first published by CADTH, CADTH does not make any guarantees to that effect. CADTH does not guarantee and is not responsible for the quality, currency, propriety, accuracy, or reasonableness of any statements, information, or conclusions contained in any third-party materials used in preparing this document. The views and opinions of third parties published in this document do not necessarily state or reflect those of CADTH.
CADTH is not responsible for any errors, omissions, injury, loss, or damage arising from or relating to the use (or misuse) of any information, statements, or conclusions contained in or implied by the contents of this document or any of the source materials.
This document may contain links to third-party websites. CADTH does not have control over the content of such sites. Use of third-party sites is governed by the third-party website owners’ own terms and conditions set out for such sites. CADTH does not make any guarantee with respect to any information contained on such third-party sites and CADTH is not responsible for any injury, loss, or damage suffered as a result of using such third-party sites. CADTH has no responsibility for the collection, use, and disclosure of personal information by third-party sites.
Subject to the aforementioned limitations, the views expressed herein are those of CADTH and do not necessarily represent the views of Canada’s federal, provincial, or territorial governments or any third-party supplier of information.
This document is prepared and intended for use in the context of the Canadian health care system. The use of this document outside of Canada is done so at the user’s own risk.
This disclaimer and any questions or matters of any nature arising from or relating to the content or use (or misuse) of this document will be governed by and interpreted in accordance with the laws of the Province of Ontario and the laws of Canada applicable therein, and all proceedings shall be subject to the exclusive jurisdiction of the courts of the Province of Ontario, Canada.
The copyright and other intellectual property rights in this document are owned by CADTH and its licensors. These rights are protected by the Canadian Copyright Act and other national and international laws and agreements. Users are permitted to make copies of this document for non-commercial purposes only, provided it is not modified when reproduced and appropriate credit is given to CADTH and its licensors.
About CADTH: CADTH is an independent, not-for-profit organization responsible for providing Canada’s health care decision-makers with objective evidence to help make informed decisions about the optimal use of drugs, medical devices, diagnostics, and procedures in our health care system.
Funding: CADTH receives funding from Canada’s federal, provincial, and territorial governments, with the exception of Quebec.
Questions or requests for information about this report can be directed to Requests@CADTH.ca