Drugs, Health Technologies, Health Systems
Health Technology Review
Dextrose Prolotherapy for Musculoskeletal Conditions
Key Messages
What Is the Issue?
Musculoskeletal conditions are a leading cause of chronic pain and disability among adults, affecting function, quality of life, and participation in daily activities. These conditions contribute to health care use and societal costs in Canada.
Dextrose prolotherapy is an injection-based treatment used for certain types of acute and chronic musculoskeletal pain. The procedure involves injecting an irritant solution — most commonly hypertonic dextrose — into ligaments, tendons, or joint spaces to stimulate a localized inflammatory response. This response is intended to promote tissue repair, collagen deposition, and strengthening of connective tissue, which may improve joint stability and reduce pain over time.
What Did We Do?
We conducted a rapid review to summarize evidence that compared the clinical effectiveness and safety of dextrose prolotherapy to any comparators not involving prolotherapy for adults with an acute or chronic musculoskeletal condition.
We searched key resources, including journal citation databases, and conducted a focused internet search for relevant evidence published between January 1, 2024, and March 23, 2026.
What Did We Find?
We identified 5 systematic reviews (SRs) addressing the clinical effectiveness and safety of dextrose prolotherapy in adults with an acute or chronic musculoskeletal condition.
For knee osteoarthritis, 1 SR found that evidence for the effectiveness of dextrose prolotherapy versus placebo or other comparators was uncertain or inconclusive, with studies reporting mixed findings and no consistent pattern of benefit.
For plantar fasciitis and other foot pain, 2 SRs found that dextrose prolotherapy may improve pain outcomes compared to placebo (normal saline injections) and physical therapy (PT). The evidence on the effectiveness of dextrose prolotherapy versus extracorporeal shockwave therapy, phonophoresis, or platelet-rich plasma showed no statistically significant differences between groups in assessed outcomes. Corticosteroid injections may provide better short-term and similar medium-term results in pain and function outcomes compared to dextrose prolotherapy.
For shoulder pain, 2 SRs indicated that the evidence for the effectiveness of dextrose prolotherapy versus placebo (normal saline injections), PT, or corticosteroid injections was uncertain or inconclusive, with studies reporting mixed findings and no consistent pattern of benefit.
For lateral elbow tendinopathy, 1 SR found that evidence on the effectiveness of dextrose prolotherapy compared to corticosteroid injections and extracorporeal shockwave therapy was uncertain or inconclusive, with studies reporting mixed findings and no consistent pattern of benefit. A comparison of dextrose prolotherapy versus hyaluronic acid injection or PT showed no statistically significant differences between groups in assessed outcomes, but dextrose prolotherapy may improve pain-related functioning compared with placebo (normal saline injections). Receiving dextrose prolotherapy compared to being on a wait-list was associated with greater improvement in pain-related functioning and physical performance over 4 months.
For low back pain, 1 SR showed that the effectiveness of dextrose prolotherapy versus placebo (normal saline injections) or corticosteroid injections was uncertain or inconclusive, with studies reporting mixed findings and no consistent pattern of benefit.
For temporomandibular joint dysfunction and pain, 3 SRs found that dextrose prolotherapy may improve pain-related functioning, physical performance, and pain intensity compared to placebo (normal saline injections). Dextrose prolotherapy may improve pain intensity compared to autologous blood injection but showed no between-group differences or inconclusive results for physical performance. Dextrose prolotherapy resulted in greater improvements across many included outcomes versus comparators (e.g., low-level laser therapy, occlusal splints).
Two SRs reported that adverse events associated with dextrose prolotherapy were generally infrequent and described as mild and transient.
What Does This Mean?
The certainty of the evidence was generally low and unclear, and findings were inconsistent across populations, comparators, and outcomes.
Although some studies reported benefits associated with dextrose prolotherapy for certain musculoskeletal conditions, particularly for some temporomandibular joint disorders and possibly for plantar fasciitis, these findings were often limited to specific outcomes or time points. The broader evidence for many common musculoskeletal conditions remains uncertain and should be interpreted in the context of the methodological and evidence limitations.
Widespread implementation should be balanced against current evidence limitations, resource implications, equity considerations, and clinical practice in the context of Canada.
Abbreviations
ABI
autologous blood injection
AE
adverse event
ESWT
extracorporeal shockwave therapy
HA
hyaluronic acid
HTA
health technology assessment
MMO
maximal mouth opening
PRP
platelet-rich plasma
PT
physical therapy
RCT
randomized controlled trial
ROM
range of motion
SR
systematic review
TMJ
temporomandibular joint
VAS
visual analogue scale
Research Question
What are the clinical effectiveness and safety of dextrose prolotherapy compared to any treatment not involving prolotherapy for adults with an acute or chronic musculoskeletal condition?
Context and Policy Issues
What Are Musculoskeletal Conditions?
Musculoskeletal conditions are a leading cause of chronic pain and disability among adults globally and in Canada.1 Musculoskeletal pain from these conditions can reduce quality of life and represents a substantial public health burden.1,2 Osteoarthritis, a progressive degenerative joint disease, is 1 of the most common forms of musculoskeletal conditions, affecting approximately 3.9 million people living in Canada (about 13.6% of adults aged 20 years or older).1 The prevalence of osteoarthritis increases with age.1 The knee is 1 of the most frequently affected joints, contributing substantially to functional limitations and health care utilization among individuals with osteoarthritis.3,4 In addition to osteoarthritis, other joint and periarticular conditions are common sources of musculoskeletal pain and related health care use. For example, pain related to the temporomandibular joint (TMJ) and the shoulder, such as rotator cuff tendinopathy, represents a frequent reason for primary care consultations.5,6 Plantar fasciitis, a common cause of heel pain and functional impairment, is another musculoskeletal condition often reported among adults seeking health care.7
Musculoskeletal conditions include both acute and chronic disorders that vary in duration, underlying mechanisms, and clinical management.1,2,8 Acute and chronic pain may co-occur in an individual. Acute musculoskeletal conditions — such as sprains, strains, and inflammatory injuries — typically arise from trauma or overuse and often subside with the appropriate treatment and healing of tissue.8 In contrast, chronic conditions, such as osteoarthritis, involve progressive structural joint changes and persistent pain that may last months or years and require long-term management strategies.1,2 Chronic musculoskeletal pain can substantially affect physical functioning and performance, quality of life, and participation in daily activities, contributing to substantial health care utilization and societal costs.1,2 Addressing pain in these populations remains a critical challenge and often needs a combination of pharmacologic and nonpharmacologic strategies.9,10
Pain Management for Adults With Musculoskeletal Conditions
Pain associated with musculoskeletal conditions is commonly managed using a multimodal integrated approach that combines pharmacologic and nonpharmacologic strategies.3,11 Clinical guidelines generally recommend nonpharmacologic interventions as first-line treatments, including patient education, physical therapy (PT) and exercise programs, weight management, and structured self-management programs.10 Pharmacologic treatments may include acetaminophen, nonsteroidal anti-inflammatory drugs, and topical analgesics.10 Some patients may benefit from intra-articular corticosteroid injections or other interventional procedures when conservative approaches are insufficient.10 Opioids are typically reserved for selected cases of severe pain that does not respond to other therapies due to the potential risks of opioid use and limited evidence of long-term benefit for patients with chronic noncancer pain.12
What Is Prolotherapy?
Prolotherapy is an injection-based therapy used for certain types of acute and chronic musculoskeletal pain, particularly in conditions involving ligament, tendon, or joint instability.13 The procedure involves injecting an irritant solution — most commonly hypertonic dextrose — into ligaments, tendons, or joint spaces to stimulate a localized inflammatory response.13 Although the exact physiological mechanisms are not fully understood, this response is intended to promote tissue repair, collagen deposition, and strengthening of connective tissue, which may improve joint stability and reduce pain over time.14
Prolotherapy protocols vary considerably across studies and clinical practice, including differences in the dextrose concentration used, additional solution components, injection sites, treatment frequency, and the use of imaging guidance, even when used for the same musculoskeletal conditions.13,14 For example, intra-articular dextrose prolotherapy involves injecting the dextrose solution directly into the joint space to target joint structures, such as the synovium and cartilage. In contrast, extra-articular prolotherapy involves injections into tissues surrounding the joint, such as ligaments, tendons, or entheses, to promote connective tissue repair and improve joint stability.13,14
The placebo effect can complicate the interpretation of prolotherapy studies. The act of receiving an injection — regardless of the solution — may influence an individual’s perception, expectations, and reported outcomes. In pain research, sham or saline injections have been shown to produce significant improvements in pain and function, highlighting the contribution of nonspecific effects to observed treatment responses.15 As a result, it is unclear whether reported benefits are truly due to the dextrose solution or to nonspecific effects of the injection. These factors underscore the importance of including active control or placebo arms in clinical trials to more accurately assess the true efficacy of dextrose prolotherapy.
Dextrose Prolotherapy in Canada
In Canada, dextrose prolotherapy is considered an emerging or complementary treatment for musculoskeletal conditions rather than a standard, widely recommended therapy. We found 5 rapid reviews conducted in Canada.16 One rapid review was conducted in 2014 by Canada’s Drug Agency (CADTH at the time) on the efficacy of prolotherapy for the management of musculoskeletal pain.17 Four other rapid reviews were published in 2024: 1 by the Institut national d’excellence en santé et en services sociaux (INESSS) in French18 and 3 by WorkSafeBC.19-21 These rapid reviews addressed the use of prolotherapy for a range of musculoskeletal conditions, including chronic musculoskeletal pain;18 wrist sprain or strain and repetitive strain injury;19 shoulder labral tears;20 and rotator cuff tendinopathy.21 Overall, these reports consistently concluded that evidence on the effectiveness of prolotherapy is limited, methodologically weak, and insufficient to support definitive conclusions regarding its clinical effectiveness or safety.
Why Is It Important to Do This Review?
Decision-makers remain uncertain about the clinical effectiveness and safety of dextrose prolotherapy. However, its uptake has expanded rapidly as part of efforts to improve pain and function in people with musculoskeletal conditions. There is a need to synthesize evidence from studies evaluating the clinical effectiveness and safety of prolotherapy, compared with alternative treatment approaches that do not involve prolotherapy, for people with musculoskeletal conditions.
Objectives
In response to an external request to support decision-making about dextrose prolotherapy, we prepared this Rapid Review to summarize and critically appraise available evidence regarding the clinical effectiveness and safety of dextrose prolotherapy compared to other treatment strategies for adults with acute or chronic musculoskeletal conditions.
Methods
Our initial scoping of the topic identified a comprehensive systematic review (SR) published by the US Department of Veterans Affairs in 2024 that aligned with our research question.22 This SR22 included literature from inception through February 2024. In consultation with the external requester, we set our search time frame from January 1, 2024, onward to capture any SRs published after the review produced by the US Department of Veterans Affairs. This SR22 was included and appraised in our rapid review.
An information specialist conducted a customized literature search, balancing comprehensiveness with relevance, of multiple sources and grey literature on March 23, 2026.
One reviewer screened citations and selected studies based on the inclusion criteria presented in Table 1 and critically appraised the included publications using 1 critical appraisal tool.23
Appendix 1 presents a detailed description of the methods and criteria used to select included studies.
Criteria | Description |
|---|---|
Population | Adults with an acute or chronic musculoskeletal condition |
Intervention | Dextrose prolotherapy |
Comparator | Alternative pain management interventions not involving prolotherapy (e.g., active control, placebo [e.g., saline, water, or injection without solution], other injection-based therapies [e.g., HA, PRP, ozone], PT, and exercise programs) |
Outcomes | Clinical benefits and harms (e.g., pain intensity, pain-related functioning, physical performance, health-related quality of life, adverse events) |
Study designs | SRs |
Publication date | January 1, 2024, to March 23, 2026 |
HA = hyaluronic acid; PRP = platelet-rich plasma; PT = physical therapy; SR = systematic review.
Summary of Evidence
Quantity of Research Available
This report includes 5 SRs22,24-27 that met our inclusion criteria and addressed our research question. We reported on the characteristics and results of the subset of relevant studies.
Appendix 2 presents the Preferred Reporting Items for Systematic reviews and Meta-Analyses (PRISMA)28 flow chart of the study selection.
Summary of Study Characteristics
Appendix 3 provides details about the characteristics of included publications.
Included Studies for Question 1: Clinical Effectiveness and Safety of Dextrose Prolotherapy for People With Musculoskeletal Conditions
We identified 5 SRs with meta-analysis;22,24-27 4 of them22,24,25,27 included meta-analyses that addressed this question. These 5 SRs22,24-27 included data from 119 unique primary randomized controlled trials (RCTs) and observational cohort studies relevant to this report. Considerable overlap exists among the included primary studies across SRs. As a result, the pooled effect estimates from separate reviews are based on some of the same data, although not all reviews reported the same outcomes. Appendix 6 presents a citation matrix illustrating the degree of primary study overlap.
Two SRs25,27 had searches limited to RCTs; 2 SRs22,24 included RCTs and comparative observational studies; and 1 SR26 included comparative studies. The 5 SRs22,24-27 searched for studies published from inception, with the last search date being reported as October 2025.24 The included SRs were conducted by researchers in the US,22 Palestine and the US,24 China,27 Thailand,26 and Greece.25
All SRs22,24-27 included studies with adult participants aged older than 18 years with the following conditions:
various acute or chronic musculoskeletal pain (1 SR)22
plantar fasciitis (1 SR)24
rotator cuff tendinopathy (1 SR).26
The SRs varied in the level of detail reported for their study population characteristics. All included SRs22,24-27 provided information on the age of participants from their included primary studies. Three SRs22,25,27 provided information on the sex of participants from their included primary studies; the authors did not report how sex was defined or measured. Authors of the SRs included numbers or percentages of female and/or male participants; other sexes or genders were not reported. None of the included SRs22,24-27 provided participant information for other PROGRESS-Plus criteria,29 such as place of residence, race, ethnicity, culture, language, occupation, religion, education, socioeconomic status, or social capital. Two SRs22,24 reported on the body mass index of participants from their included studies.
The study setting was described as outpatient in 1 SR.22 The setting was not reported in the other 4 SRs.24-27
The SRs also varied in the level of detail reported about the intervention. Three22,25,27 of the 5 SRs reported on the location of dextrose injections (intra-articular injections and/or periarticular or masseter injections). All SRs22,24-27 reported on the number of dextrose injection sessions, which ranged from single session to 8 sessions. All SRs22,24-27 reported on dextrose injection doses, which ranged from 5% to 50% in their included studies. Three22,24,26 out of the 5 SRs reported on the use of imaging guidance (ultrasound guided, palpation guided, landmark based, and fluoroscopy) for dextrose injection.
Interventions and comparators included:
dextrose prolotherapy versus any comparators not involving prolotherapy (3 SRs)22,25,27
dextrose prolotherapy versus corticosteroid injections (1 SR)24
dextrose prolotherapy versus placebo (normal saline with or without lidocaine) or active control (PT) (1 SR).26
All 5 SRs reported more than 1 outcome on the clinical effectiveness or safety of dextrose prolotherapy, including:
All SRs22,24-27 reported on outcomes at follow-up, which ranged from 1 month to 36 months.
Summary of Critical Appraisal
Appendix 4 provides additional details about the strengths and limitations of the included publications.
Included SRs
Of the included reviews, 2 SRs22,24 adequately reported relevant details across the critical appraisal domains, whereas 3 SRs25‑27 did not meet, or partially met, most of these domains. All 5 SRs22,24-27 included literature searches across multiple databases and reported search terms and time frames, but there were some concerns about risk of selection and/or reporting bias for some reviews. Methods were established before the reviews were conducted in 4 of the 5 SRs through protocol registration, reducing the risk of reporting bias.22,24,26,27 Three SRs24,26,27 lacked a grey literature search, which increased the risk of missing relevant studies not published in or inaccessible through typical bibliographic databases (i.e., nonindexed studies). Four SRs22,25-27 applied language restrictions, which may have introduced selection bias and omitted relevant data from non-English studies. All SRs22,24-27 assessed the quality and risk of bias of included primary studies using structured approaches, although the tools used varied. Four SRs22,24,25,27 used appropriate risk of bias tools, while 1 SR26 relied on methodological quality scales rather than a standard risk of bias tool. Three SRs25-27 did not adequately account for risk of bias in individual studies and its impact on pooled findings when interpreting and discussing the results of the SR. The 4 SRs22,24,25,27 that conducted meta-analyses relevant to the present review used appropriate statistical methods (e.g., I2 statistic). Assessment and discussion of publication bias were limited in several SRs; 1 SR24 consistently assessed publication bias with formal methods and discussed its likely impact, whereas 2 SRs22,25 partially assessed publication bias or discussed its impact on results. Two SRs26,27 did not provide any information on or discussion of publication bias. Finally, 3 SRs25-27 did not provide a list of excluded studies or justify the exclusions, while the other 2 SRs did.22,24
Two of the included SRs22,24 adequately reported relevant details across the noncritical appraisal domains, whereas 3 SRs25-27 did not meet, or only partially met, many of these domains. The authors of all 5 SRs22,24-27 defined their objectives and eligibility criteria. They also included flow charts illustrating study selection, along with reasons for excluding studies at abstract and full-text levels.22,24-27 Information about the population, intervention, comparator, and outcomes was reported in sufficient detail in 4 SRs.22,24,25,27 Although study designs were specified in all 5 SRs,22,24-27 2 SRs26,27 did not clearly justify their inclusion criteria. Most SRs used a satisfactory technique for data extraction. In all 5 SRs,22,24-27 at least 2 independent reviewers conducted the study selection and data extraction (in 4 SRs).22,24,25,27In 1 SR,26 data extraction procedures were not clearly described as duplicate, raising potential concerns about accuracy. The authors of 4 SRs22,24-26 explored heterogeneity and provided satisfactory explanation for any heterogeneity observed in the results of the review. All SRs22,24-27 reported conflicts of interest and funding sources for the review. Finally, 3 SRs25-27 did not report funding sources for the included primary studies, while the other 2 SRs did.22,24
Summary of Findings
Appendix 5 presents additional details regarding the main study findings.
Clinical Effectiveness and Safety of Dextrose Prolotherapy for Adults With Musculoskeletal Conditions
Evidence regarding the clinical effectiveness and safety of dextrose prolotherapy for adults with musculoskeletal conditions was available from 5 SRs,22,24-27 and 4 of them22,24,25,27 had meta-analyses relevant to the present review. There was considerable overlap in the primary studies included in these SRs; the pooled estimates from separate reviews thus contain much of the same data (refer to Appendix 6 for details regarding overlap). These SRs and their included primary studies reported results on various types of acute or chronic musculoskeletal pain, including knee osteoarthritis and other knee pain, shoulder and elbow pain, plantar fasciitis and other foot pain, chronic low back pain, TMJ dysfunction and pain, and other pain conditions. In general, dextrose prolotherapy appeared to be more effective in improving certain conditions, such as TMJ pain and disorders, while evidence for other pain conditions and indications remains mixed or uncertain. AEs associated with dextrose prolotherapy were generally infrequent and described as mild and transient.
Knee Osteoarthritis and Other Knee Pain
One SR22 evaluated the effectiveness and safety of dextrose prolotherapy versus comparators on knee osteoarthritis and other knee pain. Evidence for the effectiveness of dextrose prolotherapy versus placebo or other comparators was uncertain or inconclusive, with studies reporting mixed findings and no consistent pattern of benefit.
Knee Osteoarthritis: Dextrose Prolotherapy Versus Placebo
One SR22 that included 5 relevant RCTs compared dextrose prolotherapy with normal saline or water injection (Table 8).
Four relevant RCTs from the 1 SR22 showed mixed results for pain-related functioning measures, with each group of participants showing statistically significant between-group differences for certain measures at some time points and no differences for other measures at other time points.
Three relevant RCTs from the 1 SR22 showed mixed results for physical performance; however, certain between-group differences became statistically significant at some time points.
Among 5 relevant RCTs from the 1 SR,22 3 RCTs showed no statistically significant differences between groups for pain intensity; however, 2 RCTs showed statistically significant reductions in pain intensity at 18-week and 52-week follow-up in the groups of participants who received prolotherapy.
Two relevant RCTs from the 1 SR22 showed no statistically significant differences between groups in health-related quality of life over time.
Knee Osteoarthritis: Dextrose Prolotherapy Versus Other Comparators
One SR22 that included 5 meta-analyses and 8 RCTs compared dextrose prolotherapy with other comparators (Table 9).
One meta-analysis from the 1 SR22 compared dextrose prolotherapy to platelet-rich plasma (PRP) injections, and the authors reported that the evidence for pain-related functioning at medium-term follow-up (6 months) was uncertain and inconclusive.
Two meta-analyses from the 1 SR22 indicated that participants who received dextrose prolotherapy showed statistically significant improvement in pain-related functioning at short-term follow-up (1 month to 1.5 months) and medium-term follow-up (3 months to 4 months) compared to those participating in PT and/or home exercise programs. However, there was substantial inconsistency in 95% confidence intervals and prediction intervals.
Two meta-analyses from the 1 SR22 indicated that participants who received dextrose prolotherapy showed statistically significant improvement in pain intensity or severity at short-term follow-up (1 month to 1.5 months) and medium-term follow-up (3 months to 4 months) compared to those participating in PT and/or home exercise programs. However, there was substantial inconsistency in 95% confidence intervals and prediction intervals.
Two relevant RCTs from the 1 SR22 compared dextrose prolotherapy to PT and/or home exercise programs. They found that the dextrose prolotherapy group had statistically significantly greater improvements in pain-related functioning at 16 weeks, but the between-group differences were not statistically significant for physical performance at 16 weeks or for pain-related functioning at 2 weeks or 6 weeks.
Two relevant RCTs from the 1 SR22 indicated that those receiving dextrose prolotherapy and those receiving ozone injection showed no statistically significant between-group differences in pain-related functioning or pain intensity at short-, medium-, or long-term follow-up.
Two relevant RCTs from the 1 SR22 indicated that those receiving hyaluronic acid (HA) injection had statistically significantly better scores for pain-related functioning (1 RCT) and pain intensity (1 RCT) at 3 months compared to those receiving dextrose prolotherapy.
One relevant RCT from the 1 SR22 compared dextrose prolotherapy with hypertonic saline and found no statistically significant differences between groups for pain-related functioning or pain intensity at follow-up.
One relevant RCT from the 1 SR22 compared dextrose prolotherapy with corticosteroid injections and found no between-group differences at short-term follow-up (1 month), but dextrose prolotherapy was statistically significantly better at improving pain-related functioning at 3 months.
One relevant RCT from the 1 SR22 compared dextrose prolotherapy with 2 comparators: erythropoietin and pulsed radiofrequency waves. Results indicated there was greater improvement in range of motion (ROM) and pain intensity in the group of participants who received erythropoietin compared to those treated with either dextrose prolotherapy or pulsed radiofrequency waves. However, this study did not report pairwise testing statistics.
One relevant RCT from the 1 SR22 compared dextrose prolotherapy with 3 comparators: PT, botulinum toxin injection, or HA injection. All 4 groups improved in pain-related functioning and pain intensity over 3 months. Participants in the HA arm showed statistically significantly less improvement compared with those receiving each of the other treatments, including dextrose prolotherapy.
Two relevant RCTs from the 1 SR22 evaluated quality of life (physical and mental components) in groups receiving dextrose prolotherapy versus those participating in home exercise programs. One RCT showed statistically significantly higher scores in the physical component of quality of life in the dextrose prolotherapy group at 18 weeks. Other between-group differences were not statistically significant at follow-up time points.
Plantar Fasciitis and Other Foot Pain
Two SRs22,24 evaluated the effectiveness and safety of dextrose prolotherapy versus comparators for plantar fasciitis and other foot pain. Dextrose prolotherapy may improve pain-related functioning (foot function) and pain intensity compared with normal saline injections and PT. The evidence on the effectiveness of dextrose prolotherapy versus extracorporeal shockwave therapy (ESWT), phonophoresis, or PRP showed no statistically significant differences between groups in assessed outcomes. Patients who received corticosteroid injections had better outcomes compared to those who received dextrose prolotherapy in terms of pain intensity or severity, pain-related function, and physical performance at short-term follow-up. The efficacy of these interventions became similar in the medium-term follow-up, and dextrose prolotherapy outperformed corticosteroid injections in terms of physical performance (i.e., pain while walking).
Plantar Fasciitis: Dextrose Prolotherapy Versus Placebo
Two relevant RCTs from 1 SR22 compared dextrose prolotherapy with normal saline (Table 10).
Both RCTs reported that receiving dextrose prolotherapy was associated with statistically significantly greater improvements in pain-related functioning and greater reductions in pain intensity or severity at short-term and medium-term follow-up compared with normal saline injection.
Plantar Fasciitis: Dextrose Prolotherapy Versus Other Comparators
One SR24 that included 10 meta-analyses and 1 SR22 that included 5 relevant RCTs compared dextrose prolotherapy with other comparators (Table 11).
Five meta-analyses from 1 SR24 that compared dextrose prolotherapy with corticosteroid injections at short-term follow-up (1 month) reported statistically significantly greater reductions in pain intensity at the first step in the morning (using a visual analogue scale [VAS]), in VAS scores for pain while walking, and in general VAS scores, as well as greater improvements in physical performance, were observed in those receiving corticosteroid injections.
Five meta-analyses from 1 SR24 that compared dextrose prolotherapy with corticosteroid injections at medium-term follow-up (3 months) revealed a statistically significant decrease in physical performance (pain while walking) in those receiving corticosteroid injections, whereas no statistically significant difference was observed in VAS scores (morning walk and general VAS scores) between groups.
Two relevant RCTs from 1 SR22 that compared dextrose prolotherapy with ESWT showed no statistically significant differences between groups in pain-related functioning or pain severity.
One relevant RCT from 1 SR22 that compared dextrose prolotherapy with PT reported statistically significantly greater improvement in pain-related function (foot function) at 42 days and 90 days and in pain intensity at 42 days, 90 days, and 360 days in those who received dextrose prolotherapy.
Two relevant RCTs from 1 SR22 that compared dextrose prolotherapy with phonophoresis and PRP reported no statistically significant differences for pain-related functioning between groups.
One relevant RCT from 1 SR22 compared the effects of dextrose prolotherapy versus phonophoresis on health-related quality of life at short-term and medium-term follow-up. Both groups improved in all domain scores over time; however, there were no statistically significant differences between groups for any domain.
Shoulder Pain
Two SRs22,26 evaluated the effectiveness and safety of dextrose prolotherapy versus comparators on shoulder pain, including varied rotator cuff pathology and subacromial bursitis. Evidence for the effectiveness of dextrose prolotherapy versus placebo (normal saline injections), PT, or corticosteroid injections was uncertain or inconclusive, with studies reporting mixed findings and no consistent pattern of benefit.
Shoulder Pain (Rotator Cuff Pathology and Subacromial Bursitis): Dextrose Prolotherapy Versus Placebo
One SR22 that included 4 meta-analyses and 1 relevant RCT compared dextrose prolotherapy with normal saline (Table 12).
Two meta-analyses from the 1 SR22 reported that the evidence for pain-related functioning at short-term and medium-term follow-up was uncertain and inconclusive.
Two meta-analyses from the 1 SR22 indicated that the evidence for pain severity or intensity at short-term and medium-term follow-up was uncertain and inconclusive.
Two relevant RCTs from the 1 SR22 indicated there were no statistically significant differences between groups in physical performance at short-term and medium-term follow-up.
One relevant RCT from the 1 SR22 compared participants who received dextrose prolotherapy with 2 groups of people who received normal saline, with 1 group using the same injection procedure as dextrose and 1 group using superficial injections only. The authors found no statistically significant differences between groups for pain intensity at short-term and medium-term follow-up.
Shoulder Pain (Rotator Cuff Pathology and Subacromial Bursitis): Dextrose Prolotherapy Versus Other Comparators
One SR22 that included 4 meta-analyses and 3 relevant RCTs and 1 SR26 that included 1 relevant RCT compared dextrose prolotherapy with other comparators (Table 13).
Four meta-analyses from 1 SR22 that compared people who received dextrose prolotherapy with those who received corticosteroid injections reported that the evidence for pain-related functioning and pain intensity or severity at short-term and medium-term follow-up was uncertain and inconclusive.
One relevant retrospective case-control study from 1 SR26 comparing dextrose prolotherapy (plus PT) with active control (plus PT) showed improvements in pain intensity, pain-related functioning, and shoulder ROM in the group that received dextrose prolotherapy; however, the P values were not reported in the SR.
Two relevant RCTs from 1 SR22 that compared dextrose prolotherapy with PT (with or without a home exercise program) found mixed results for pain-related functioning (2 RCTs) and physical performance (1 RCT), with statistically significant between-group differences for certain measures at some time points and no differences for other measures at other time points.
One relevant RCT from 1 SR22 indicated that the group that received corticosteroid injections showed statistically greater improvements in physical performance (ROM criteria) over 3 months of follow-up compared to the group that received dextrose prolotherapy.
One SR22 that included 1 relevant RCT reported statistically significantly greater improvement in health-related quality of life with dextrose prolotherapy compared to PT at time points beyond 6 weeks.
Shoulder Pain (Supraspinatus Tendinopathy Only): Dextrose Prolotherapy Versus Placebo or Other Comparators
One SR22 that included 4 relevant RCTs evaluated dextrose prolotherapy versus placebo or other comparators for shoulder pain due to supraspinatus tendinopathy (Table 14).
One relevant RCT from the 1 SR22 compared dextrose prolotherapy with normal saline injection. Pain-related functioning showed statistically significantly higher improvement in the group that received dextrose prolotherapy at 2 weeks, but the results trended back toward baseline scores by 6 and 12 weeks. Pain intensity was statistically significantly lower at 2 and 12 weeks in people who received dextrose prolotherapy, but the between-group differences were not significant at 6 weeks. There were no statistically significant differences between groups assessed at 12 weeks for physical performance.
One relevant RCT from the 1 SR22 that compared dextrose prolotherapy with PRP showed no statistically significant differences between groups in pain-related functioning, physical performance, or pain intensity at any time point.
One relevant RCT from the 1 SR22 that compared dextrose prolotherapy with PT reported no statistically significant differences between groups in pain-related functioning or pain intensity at 12 weeks.
One relevant RCT from the 1 SR22 that compared dextrose prolotherapy with corticosteroid injection showed no statistically significant differences between groups in physical performance (ROM) or pain severity at follow-up at 6 weeks, 3 months, or 6 months.
Elbow Pain
One SR22 that included 11 RCTs evaluated the effectiveness and safety of dextrose prolotherapy versus comparators for lateral elbow tendinopathy. Dextrose prolotherapy compared with normal saline injection may improve pain-related functioning but had little to no benefit for physical performance and pain intensity. Dextrose prolotherapy compared to corticosteroid injections and ESWT provided mixed and inconclusive findings. Dextrose prolotherapy compared to HA injection or PT showed no statistically significant differences between groups in assessed outcomes. Receiving dextrose prolotherapy compared to being on a wait-list was associated with greater improvement in pain-related functioning and physical performance over 4 months.
Elbow Pain: Dextrose Prolotherapy Versus Placebo
One SR22 that included 3 relevant RCTs compared dextrose prolotherapy with normal saline (Table 15).
Two relevant RCTs from the 1 SR22 reported statistically significant improvement in pain-related functioning at short-term and medium-term follow-up in the group that received dextrose prolotherapy compared to those who received normal saline.
Two relevant RCTs from the 1 SR22 reported no statistically significant between-group differences for physical performance (grip strength) at any time point, while 1 RCT reported a statistically significant difference favouring prolotherapy at 1 follow-up point (3 months).
Three relevant RCTs from the 1 SR22 had mixed results for pain severity or intensity, with each group showing statistically significant between-group differences at some points and no differences at other time points.
Elbow Pain: Dextrose Prolotherapy Versus Other Comparators
One SR22 that included 8 relevant RCTs compared dextrose prolotherapy with other comparators (Table 16).
Three relevant RCTs from the 1 SR22 that compared dextrose prolotherapy with corticosteroid injection showed mixed results for pain-related functioning and/or pain intensity or severity over follow-up periods, while 1 RCT reported no statistically significant between-group differences in physical performance at short-term or medium-term follow-up.
Two relevant RCTs from the 1 SR22 compared dextrose prolotherapy with ESWT. Results for physical performance and pain intensity were mixed. While 1 RCT reported statistically significantly better physical performance (grip strength) at 1, 3, and 6 months in the group that received dextrose prolotherapy, the other RCT found no significant between-group differences at either 1 or 2 months. For pain intensity, 1 RCT found statistically significantly lower pain intensity at 1, 3, and 6 months for the group that received dextrose prolotherapy, while the other RCT reported statistically significantly lower pain intensity at 1 and 2 months for the group that received ESWT. One RCT indicated there were statistically significantly greater improvements in pain-related functioning at 4 weeks and 8 weeks in the group that received ESWT.
One relevant RCT from the 1 SR22 that compared receiving dextrose prolotherapy or HA injection found no statistically significant between-group differences in pain-related functioning, physical performance, or pain severity at 6 weeks or 12 weeks.
One relevant RCT from the 1 SR22 that compared receiving dextrose prolotherapy with being on a wait-list showed statistically significantly greater improvement in pain-related functioning and physical performance over 4 months in the prolotherapy group.
One relevant RCT from the 1 SR22 that compared dextrose prolotherapy with PT and home exercise found no statistically significant between-group differences in pain-related functioning, quality of life, or pain severity over 1 year.
Chronic Low Back Pain
One SR22 that included 6 relevant RCTs and 2 relevant observational cohort studies evaluated the effectiveness and safety of dextrose prolotherapy versus comparators on low back pain. The evidence for the effectiveness of dextrose prolotherapy versus normal saline or corticosteroid injections was uncertain or inconclusive, with studies reporting mixed findings and no consistent pattern of benefit.
Low Back Pain: Dextrose Prolotherapy Versus Placebo
One SR22 that included 4 relevant RCTs compared dextrose prolotherapy with normal saline (Table 17).
Three relevant RCTs from the 1 SR22 showed no statistically significant between-group differences for pain-related functioning, while 1 RCT reported statistically significantly better physical performance at 1, 3, and 6 months in those who received dextrose prolotherapy.
Two relevant RCTs from the 1 SR22 found no statistically significant between-group differences for long-term physical performance.
Four relevant RCTs from the 1 SR22 showed mixed results for pain severity across short-term to long-term follow-up, with all groups generally improving over time.
Low Back Pain: Dextrose Prolotherapy Versus Other Comparators
One SR22 that included 2 relevant RCTs and 2 relevant observational cohort studies compared dextrose prolotherapy with other comparators (Table 18).
One relevant observational study in 1 SR22 that compared dextrose prolotherapy with corticosteroid injections found statistically significantly better physical performance at 3 months in those receiving corticosteroid injections, whereas those who received dextrose prolotherapy showed statistically significantly lower pain severity at 1 day and 3 months. Other between-group differences were not statistically significant.
Two relevant RCTs in the 1 SR22 that compared dextrose prolotherapy with corticosteroid injections showed no statistically significant between-group differences for pain-related functioning or pain intensity or severity over time.
TMJ Dysfunction and Pain
Three SRs22,25,27 that included 8 meta-analyses and 1 SR22 that included 4 relevant RCTs and 1 relevant observational cohort study evaluated the effectiveness and safety of dextrose prolotherapy versus comparators on TMJ dysfunction and pain. Dextrose prolotherapy may improve pain-related functioning, physical performance, and pain intensity compared to normal saline injections. Dextrose prolotherapy may improve pain intensity compared to autologous blood injection (ABI) but comparisons related to physical performance showed no between-group differences or inconclusive results. Dextrose prolotherapy showed better performance across many included outcomes compared to other comparators (e.g., low-level laser therapy, occlusal splints).
TMJ: Dextrose Prolotherapy Versus Placebo
Three SRs22,25,27 that included 5 meta-analyses and 1 SR22 that included 2 relevant RCTs compared dextrose prolotherapy with placebo (Table 19).
Three meta-analyses from 1 SR25 indicated there was a statistically significantly greater reduction in pain intensity or severity and greater improvement in pain-related functioning (perceived subluxation or jaw mobility) in the group that received dextrose prolotherapy. Between-group differences were not statistically significant for physical performance (maximal incisor opening).
Two meta-analyses from 1 SR27 indicated there was a statistically significantly greater reduction in pain intensity or severity and greater improvement in physical performance (maximal mouth opening [MMO]) among those who received dextrose prolotherapy.
Two relevant RCTs from 1 SR22 reported statistically significantly better physical performance (MMO) and lower pain intensity at 1 to 6 months among those who received dextrose prolotherapy.
TMJ: Dextrose Prolotherapy Versus Other Comparators
Three SRs22,25,27 that included 3 meta-analyses and 1 SR22 that included 3 relevant RCTs and 1 relevant observational cohort study compared dextrose prolotherapy with other comparators (Table 20).
One meta-analysis from 1 SR25 that compared dextrose prolotherapy with ABI reported a statistically significant greater reduction in pain intensity among those who received dextrose prolotherapy.
One meta-analysis from 1 SR27 that compared dextrose prolotherapy with ABI showed no statistically significant between-group differences in physical performance (MMO).
One meta-analysis from 1 SR22 that compared dextrose prolotherapy with ABI showed unclear direction of effect for the pooled estimate for physical performance (MMO) at 6 months.
One relevant observational study from 1 SR22 that compared dextrose prolotherapy with arthrocentesis/lavage reported statistically significantly better physical performance (mouth opening) at 3 to 6 weeks among those who received dextrose prolotherapy and no statistically significant between-group differences in pain intensity.
One relevant RCT from 1 SR22 that compared dextrose prolotherapy with low-level laser therapy found statistically significantly better physical performance (mouth opening) at 2 weeks and 4 weeks among those who received dextrose prolotherapy and no statistically significant between-group differences in pain intensity.
One relevant RCT from 1 SR22 compared dextrose prolotherapy with 2 comparators: arthrocentesis with intra-articular HA injection and PRP injections. This RCT found no statistically significant between-group differences at 1 month; however, over 1 year, dextrose prolotherapy and HA injection showed statistically significantly greater improvements in mouth opening compared to PRP, while PRP showed statistically significantly lower pain severity at 6 and 12 months compared to other 2 groups.
One relevant RCT from 1 SR22 that compared dextrose prolotherapy with occlusal splints found that those who received dextrose prolotherapy had statistically significantly better physical performance (mouth opening) and lower pain intensity at all follow-up time points from 1 month to 1 year.
Other Pain Conditions
One SR22 that included 8 relevant RCTs and 4 relevant observational cohorts evaluated the effectiveness and safety of dextrose prolotherapy versus comparators for a range of other pain conditions (Table 21).
Non-Arthritis Knee Pain
One SR22 that included 2 relevant RCTs and 1 relevant observational cohort study compared dextrose prolotherapy with comparators for non-arthritis knee pain.
One relevant RCT from 1 SR22 compared dextrose prolotherapy with corticosteroid and ozone-oxygen injections for pes anserine bursitis. Authors found statistically significantly greater improvements in pain-related functioning and pain intensity at 1 week in groups that received corticosteroid and ozone-oxygen injections compared to prolotherapy. By 8 weeks, the between-group differences were no longer statistically significant.
One relevant RCT from 1 SR22 that compared dextrose prolotherapy with normal saline for Osgood-Schlatter disease reported statistically significantly greater improvements in pain-related functioning at all time points in the group that received dextrose prolotherapy.
One relevant observational study from 1 SR22 compared dextrose prolotherapy with an exercise program for chronic patellar tendinopathy. The authors found statistically significantly greater improvements in pain-related functioning, pain intensity, and some measures of physical performance over time in the group that received the exercise program.
Other Types of Foot Pain (Not Plantar Fasciitis)
One SR22 that included 2 relevant RCTs and 1 relevant observational cohort study compared dextrose prolotherapy with comparators for other types of foot pain.
One relevant observational study from the 1 SR22 that compared dextrose prolotherapy with PRP for osteochondral lesions of the talus found no statistically significant between-group differences in pain-related functioning or pain intensity over 12 months of follow-up.
One relevant RCT from the 1 SR22 that compared dextrose prolotherapy with corticosteroid injections for hallux rigidus found no statistically significant between-group differences in pain-related functioning or pain intensity over 8 weeks of follow-up.
One relevant RCT from the 1 SR22 that compared dextrose prolotherapy with eccentric loading exercises found improvements in pain-related functioning in both groups over 12 months, but pairwise comparisons between groups were not reported.
Hand Pain Conditions
One SR22 that included 3 relevant RCTs compared dextrose prolotherapy with comparators for hand pain conditions.
One relevant RCT from the 1 SR22 that compared dextrose prolotherapy with lidocaine for dorsal wrist pain due to ligament laxity found statistically significantly greater improvements in pain-related functioning at 12-month follow-up in the group that received dextrose prolotherapy. No statistically significant between-group differences were found for physical performance or pain-related functioning at other time points.
One relevant RCT from the 1 SR22 compared dextrose prolotherapy with corticosteroid injections for thumb pain due to osteoarthritis. The authors found statistically significantly greater improvements in pain-related functioning and pain intensity at 2 months and 6 months in those who received dextrose prolotherapy. Participants who received corticosteroid injections showed statistically significantly greater physical performance (pinch strength) at 1 month. Between-group differences at other time points were not statistically significant.
One relevant RCT from the 1 SR22 that compared dextrose prolotherapy with paraffin wax for bilateral hand osteoarthritis found statistically significantly better outcomes in pain-related functioning at 2 weeks for those who received dextrose prolotherapy, but between-group differences became statistically nonsignificant at 1 month and 3 months. The authors did not find any statistically significant between-group differences in pain intensity at any time point.
Other Conditions
One SR22 that included 1 relevant RCT and 2 relevant observational cohort studies compared dextrose prolotherapy with comparators for other conditions.
One relevant observational study from the 1 SR22 compared dextrose prolotherapy with repetitive transcranial magnetic stimulation for fibromyalgia. The authors found statistically significantly better outcomes in pain-related functioning and pain intensity at 2 months in the group that received dextrose prolotherapy. No statistically significant between-group differences were found at 1-month follow-up.
One relevant RCT from 1 SR22 compared dextrose prolotherapy with PT or home exercise for hip osteoarthritis due to developmental dysplasia. The authors found statistically significantly lower pain intensity at all time points in the group that received dextrose prolotherapy.
One relevant observational study from 1 SR22 compared dextrose prolotherapy with naproxen for Tietze syndrome. The authors found statistically significantly lower pain intensity at 4 weeks in the group that received dextrose prolotherapy. No statistically significant between-group differences were found at 1-day or 1-week follow-up.
Adverse Events
Two SRs22,24 reported on AEs associated with dextrose prolotherapy. Across the 2 SRs,22,24 reported AEs associated with dextrose prolotherapy were generally infrequent and described as mild and transient (e.g., postinjection pain, swelling, bruising, or temporary discomfort).
In 1 SR22 (54 primary studies) on several musculoskeletal pain conditions, many studies reported no AEs; however, methods for the collection of AEs were often unclear or not reported. Isolated events leading to treatment discontinuation or localized complications were reported in a small number of participants.
In 1 SR24 (4 primary studies) on plantar fasciitis, both dextrose prolotherapy and corticosteroid injections were described as having low AE rates.
Both SRs22,24 noted that AE reporting was inconsistent, many included studies had small sample sizes, and follow-up periods were often short, limiting the ability to detect uncommon, delayed, or longer-term harms.
Limitations
Evidence Gaps
Despite the findings from the included SRs,22,24-27 important evidence gaps remain. Additional studies with larger sample sizes are needed, as the current evidence is based on small sample sizes and limited numbers of studies per condition,22 with some SRs24,27 relying on fewer than 10 RCTs. There is also a need for greater standardization in intervention protocols (e.g., dextrose concentration, injection technique, number of sessions, and cointerventions) and outcome measurement (e.g., pain scores, functional indices), as well as more consistent reporting of follow-up time points to improve comparability across studies.
High-quality evidence beyond pain outcomes is needed, particularly for quality of life and AEs.22 In addition, studies assessing long-term outcomes are lacking.24 There is also a need for clearer and more consistent reporting of AEs. Overall, more high-quality research is needed to strengthen the evidence base and improve confidence in conclusions about effectiveness and safety across conditions.
Generalizability
The generalizability of findings is limited by variability in study populations, settings, and intervention characteristics. The potential generalizability of these findings to clinical practice in Canada should be interpreted with these limitations considered.
With respect to study populations, most primary studies included in SRs were conducted outside Canada and North America. Participant characteristics were often limited to narrowly defined clinical groups with insufficient reporting on comorbidities, disease severity, or prior treatment history.22 This may limit applicability to people living in Canada, particularly older adults, individuals with multiple chronic conditions, rural populations, and those from diverse cultural or socioeconomic backgrounds.
Prolotherapy protocols varied substantially across studies in terms of dextrose concentration, injection location, number of treatment sessions, treatment duration, and use of imaging guidance.22,24-27 Such variability makes it difficult to determine which protocols are most effective and relevant to practice settings in Canada, where provider expertise, scope of practice, and access to ultrasound-guided procedures may differ across provinces and territories.
Four22,25-27 out of the 5 SRs22,24-27 included primary studies that used a wide range of treatment comparators, including placebo or saline injections, corticosteroid injections, PT, exercise programs, PRP, and other modalities. These comparators may not consistently reflect current standards of care in Canada, referral pathways, or publicly funded treatment options, which could affect the relevance of comparative findings across patient groups and care settings. Clinical heterogeneity across conditions, including knee osteoarthritis, TMJ, plantar fasciitis, and rotator cuff tendinopathy, further limits generalizability.
Many studies focused on pain scores or functional measures (e.g., ROM), while other outcomes (e.g., time to return to work, long-term quality of life, reduction in analgesic or opioid use, avoidance of surgery, and health service utilization) were infrequently reported.22 Most studies used only short-term to medium-term follow-up periods,22,24 limiting any understanding of sustained effectiveness for chronic musculoskeletal conditions.
The quality and quantity of the evidence further influence generalizability. Several reviews noted small sample sizes, few studies per condition, and frequent methodological limitations, including risk of bias and heterogeneity in interventions and outcome measurement.22 Given the large number of outcomes and time points assessed, there is an increased likelihood of observing statistically significant findings by chance, particularly for subjective measures (e.g., pain intensity). These limitations reduce confidence in the validity, consistency, and generalizability of the observed effects.
Placebo and Nonspecific Injection Effects
The placebo effect could obscure any true impact of prolotherapy on patient outcomes. Injection therapies for musculoskeletal pain conditions are known to have a large placebo effect that complicates rigorous evaluation. One SR22 noted that injection-based interventions may be susceptible to substantial placebo and contextual effects, making it difficult to determine whether observed benefits are attributable specifically to dextrose prolotherapy, needle-related tissue stimulation, natural symptom fluctuation, or other nonspecific treatment effects. Three SRs25-27 focused more on comparative results and meta-analysis outcomes without adequately considering the impact of possible placebo effects. However, they compared prolotherapy with placebo or saline injections, which implicitly acknowledges the need to control for injection-related placebo effects.
Patients’ conditions may also improve because of factors beyond the injected therapy itself. Other factors include natural healing processes in many musculoskeletal conditions, lifestyle changes, or other cointerventions.22 It also noteworthy that maintaining blinding can be challenging in injection studies, especially when multiple injections are given around an anatomic structure.22 In addition, the true physiologic effects of prolotherapy are not well understood, and the proposed mechanisms involve a low-grade inflammatory response stimulating healing and potentially altering pain perception pathways.22
Applicability to Clinical Practice in Health Care Contexts in Canada
The applicability of the findings to clinical practice in Canada is uncertain because of the lack of studies conducted in Canada and differences in the structures of health systems, resource availability, and clinical practice patterns. Evidence on resource use, implementation requirements, and system-level effects was limited.22
There is also limited information regarding the training and expertise required to deliver prolotherapy, particularly when image-guided injections are used. In addition, substantial variation in dosing, treatment frequency, and administration protocols across studies may not align with standardized care delivery across jurisdictions in Canada.12,30 Because prolotherapy is not consistently funded or standardized across health systems, uncertainty remains regarding its feasibility, scalability, and value within publicly funded care contexts.
Equity Considerations
Equity-related data were largely absent across the included reviews. None of the SRs explicitly examined differences in access, outcomes, or acceptability across population subgroups, such as sex, socioeconomic status, geographic location, or race or ethnicity.
Limited reporting on participant demographic characteristics beyond age and sex restricts the ability to determine whether findings are applicable to populations experiencing health inequities. In addition, potential barriers to access, including provider availability, out-of-pocket costs where services are not publicly funded, and geographic disparities in service delivery, were not evaluated. The absence of evidence focused on equity limits the ability to determine whether prolotherapy may reduce or worsen disparities in access to musculoskeletal pain treatments.
Conclusions and Implications for Decision- or Policy-Making
This rapid review evaluated the literature regarding the clinical effectiveness and safety of dextrose prolotherapy compared to other alternative treatments not involving prolotherapy for adults with an acute or chronic musculoskeletal conditions. We identified 5 SRs22,24-27 that addressed the clinical effectiveness and safety of dextrose prolotherapy. The evidence summarized in this report is drawn from SRs with substantial overlap in primary studies, meaning that data from the same participants were included in more than 1 SR (refer to Appendix 6 for a citation matrix illustrating the degree of primary study overlap). As a result, some evidence may be disproportionally represented in the overall conclusions.
Summary of Evidence
Results from the 5 included SRs22,24-27 suggest that dextrose prolotherapy may provide clinical benefit for patients with some musculoskeletal conditions; however, the certainty of the evidence is generally low and findings were mixed or inconclusive across populations, comparators, and outcomes. Collectively, the reviews indicated that prolotherapy may improve pain and selected functional outcomes in patients with some conditions, but it was not consistently superior to placebo, corticosteroid injections, or other active comparators not involving prolotherapy. In several cases, any observed benefits were modest, short term, or limited to specific outcomes rather than demonstrating broad clinical superiority.
The rapid review found that evidence varied substantially by conditions and comparators. For knee osteoarthritis, evidence on the effectiveness of dextrose prolotherapy was uncertain or inconclusive, with studies reporting mixed findings and no consistent pattern of benefit.22 For plantar fasciitis, prolotherapy may improve pain-related outcomes compared with saline and PT, but corticosteroid injections appeared to provide greater short-term benefit, with differences narrowing over time.22,24 For shoulder pain and rotator cuff tendinopathy, evidence suggested that prolotherapy was not superior to normal saline injections, PT, or corticosteroid injections for most patient-reported outcomes.26 For lateral elbow tendinopathy and low back pain, the evidence was mixed, nonsignificant, or inconclusive for most assessed outcomes.22 Evidence for the effectiveness of dextrose prolotherapy on TMJ pain and disorders was somewhat more favourable, with SRs reporting reductions in pain and/or improvements in jaw mobility compared to placebo (normal saline injections) or ABI. However, these findings were based on a small number of RCTs and low-quality evidence, and comparative advantages versus botulinum toxin or other interventions were less clear.25,27 These findings suggest prolotherapy may have limited benefits for selected conditions rather than for a broader range of musculoskeletal pain conditions, although confidence remains limited.
Overall, the 5 SRs22,24-27 were generally methodologically sound, with clear objectives, multidatabase searches, study selection flow diagrams, and appropriate quality appraisal methods. Most had preregistered protocols and used duplicate review processes. Common limitations included language restrictions, limited assessment of publication bias, and insufficient consideration of how primary study bias may have influenced pooled findings.
Interpretation of the evidence is limited by important methodological concerns. Across the included SRs,22,24‑27 many of the included primary studies had small sample sizes, short follow-up durations, heterogeneous prolotherapy protocols, inconsistent outcome measures, and risk of bias concerns. These factors reduce confidence in pooled estimates and make it difficult to determine optimal dosing, treatment frequency, injection technique, or patient selection criteria.22 In several SRs, conclusions were explicitly based on low or very low certainty evidence. Therefore, even when positive findings were reported, the true effect may differ substantially from published estimates.
Two SRs22,24 reported AEs associated with dextrose prolotherapy. Although AEs were generally infrequent and mostly mild or transient, AE reporting was inconsistent, sample sizes were often small, and certainty of evidence was low to very low, limiting confidence in the overall safety profile.22,24
The findings of the current rapid review were broadly consistent with an earlier report17 by Canada’s Drug Agency (CADTH at the time) in 2014 and other rapid reviews conducted in 2024 in Canada.18-21 Similar to the previous CADTH report,17 the current rapid review found possible benefits versus some placebo (saline injections) or conservative comparators (exercise), but no consistent superiority over other treatments such as corticosteroid injections. Conclusions of the earlier CADTH report17 appeared somewhat more favourable for the use of dextrose prolotherapy in patients with low back pain or osteoarthritis, whereas the current rapid review provided a more cautious and condition-specific interpretation, likely reflecting the inclusion of newer studies, more rigorous appraisal methods, and greater attention to certainty of evidence, heterogeneity, and risk of bias. Nevertheless, both reports concluded that the evidence base remains limited, heterogeneous, and inconsistent.
Overall, the current evidence suggests that the effectiveness of dextrose prolotherapy may offer benefit for patients with selected conditions, particularly some TMJ disorders and possibly plantar fasciitis, but evidence for many common musculoskeletal conditions remains uncertain or does not demonstrate clear superiority over other treatment alternatives not involving prolotherapy. The findings are consistent with a broader understanding that musculoskeletal pain conditions are heterogeneous and that response to injectable therapies likely depends on pathology, comparator treatment, cointerventions, and patient selection. The current evidence suggests dextrose prolotherapy may represent 1 option among several nonsurgical treatments, rather than a uniformly effective intervention, with potential benefits varying by indication. Additional high-quality comparative research is needed to clarify where it may provide meaningful clinical value.
Considerations for Future Research
Future research is needed to clarify the clinical role of dextrose prolotherapy across musculoskeletal conditions, as the current evidence base is limited by small studies, heterogeneous treatment protocols, short follow-up periods, and methodological concerns.22 Well-designed RCTs with adequate statistical power and larger sample sizes are needed, particularly for conditions for which current findings are mixed or uncertain, such as knee osteoarthritis and chronic low back pain. Future studies would benefit from greater standardization and reporting of intervention characteristics, including dextrose concentration, injection technique, use of imaging guidance, number of sessions, cointerventions, and provider expertise. Consistent use of clinically relevant comparators, such as physiotherapy, corticosteroid injections, exercise therapy, and other injectable treatments, would also improve understanding of the relative value of prolotherapy in practice.
Longer-term studies are needed to determine duration of benefit, recurrence of symptoms, repeat treatment requirements, and delayed harms, as many existing studies reported only short-term or medium-term outcomes.24 Future research should also assess broader outcomes relevant to patients and health systems, including quality of life, time to return to work, analgesic or opioid use, patient satisfaction, health service utilization, and systematic reporting of AEs. Additional evidence is needed to identify patient subgroups most likely to benefit from this treatment and to evaluate cost-effectiveness, implementation requirements, and feasibility within publicly funded systems such as health systems in Canada. However, some of these outcomes may have been evaluated in studies beyond the scope of this review, as they were not the primary focus of our literature search. Studies including diverse and underserved populations would further strengthen the relevance and equity of future evidence.
Considerations for Clinical Practice or Considerations for Decision- or Policy-Making
This Rapid Review summarizes the current evidence on dextrose prolotherapy and is intended to inform, rather than provide, clinical or policy recommendations. Current evidence suggests prolotherapy may offer limited benefits for patients with selected musculoskeletal conditions, while evidence for most indications remains mixed or uncertain. These findings may support consideration of prolotherapy as a potential adjunct or alternative nonsurgical option within selected musculoskeletal or temporomandibular care pathways when clinically appropriate.
Certain considerations of the evidence base may help contextualize the findings for decision-makers, including that the available evidence was drawn largely from studies conducted outside Canada, often in specialized outpatient or research settings, and with variable patient populations, treatment protocols, and comparators.22 As a result, the extent to which reported findings apply to care settings in Canada, provincial and territorial funding models, and populations with multimorbidity, older adults, or complex chronic pain may be uncertain. The evidence also suggests that outcomes may differ by specific musculoskeletal conditions. Therefore, it may be considered whether any implementation would be condition-specific rather than assuming applicability across all pain indications.
In addition to clinical findings, accessibility of prolotherapy services — including geographic availability of trained providers, referral pathways, wait times, and whether access differs between urban, rural, and remote communities — should be considered to support equitable access. Consideration may also be given to the health care resources required to deliver prolotherapy, such as clinic capacity, procedural space, consumables, imaging equipment where ultrasound guidance is used, and the need for repeat treatment sessions. Potential effects on health care staff may include training requirements, scope of practice considerations, appointment time, and administrative support for scheduling and follow-up. Budgetary considerations may include direct treatment costs to patients where services are privately funded, opportunity costs for clinicians and facilities, and broader implications for publicly funded systems if demand increases. It is also important to consider whether access or affordability could differ for equity-deserving groups, including people living in rural or remote areas, individuals with lower incomes, and patients with mobility or transportation barriers. In the context of limited and heterogeneous evidence, these operational, financial, and equity considerations may be relevant alongside the current clinical findings when evaluating the role of dextrose prolotherapy in care pathways.
References
1.Government of Canada. Osteoarthritis in Canada: surveillance report. 2020. Accessed March 16, 2026. https://www.canada.ca/en/public-health/services/publications/diseases-conditions/osteoarthritis.html
2.Woolf AD, Pfleger B. Burden of major musculoskeletal conditions. Bull World Health Organ. 2003;81(9):646-56. PubMed
3.Gibbs AJ, Gray B, Wallis JA, et al. Recommendations for the management of hip and knee osteoarthritis: A systematic review of clinical practice guidelines. Osteoarthritis Cartilage. Oct 2023;31(10):1280-1292. doi:10.1016/j.joca.2023.05.015 PubMed
4.Zhu S, Qu W, He C. Evaluation and management of knee osteoarthritis. J Evid Based Med. Sep 2024;17(3):675-687. doi:10.1111/jebm.12627 PubMed
5.Valesan LF, Da-Cas CD, Réus JC, et al. Prevalence of temporomandibular joint disorders: a systematic review and meta-analysis. Clin Oral Investig. Feb 2021;25(2):441-453. doi:10.1007/s00784-020-03710-w PubMed
6.Leong HT, Fu SC, He X, Oh JH, Yamamoto N, Hang S. Risk factors for rotator cuff tendinopathy: A systematic review and meta-analysis. J Rehabil Med. Oct 4 2019;51(9):627-637. doi:10.2340/16501977-2598 PubMed
7.Rhim HC, Kwon J, Park J, Borg-Stein J, Tenforde AS. A Systematic Review of Systematic Reviews on the Epidemiology, Evaluation, and Treatment of Plantar Fasciitis. Life (Basel). Nov 24 2021;11(12)doi:10.3390/life11121287 PubMed
8.Orejel Bustos A, Belluscio V, Camomilla V, et al. Overuse-Related Injuries of the Musculoskeletal System: Systematic Review and Quantitative Synthesis of Injuries, Locations, Risk Factors and Assessment Techniques. Sensors (Basel). Apr 1 2021;21(7)doi:10.3390/s21072438 PubMed
9.El-Tallawy SN, Nalamasu R, Salem GI, LeQuang JAK, Pergolizzi JV, Christo PJ. Management of Musculoskeletal Pain: An Update with Emphasis on Chronic Musculoskeletal Pain. Pain Ther. Jun 2021;10(1):181-209. doi:10.1007/s40122-021-00235-2 PubMed
10.Babatunde OO, Jordan JL, Van der Windt DA, Hill JC, Foster NE, Protheroe J. Effective treatment options for musculoskeletal pain in primary care: A systematic overview of current evidence. PLoS One. 2017;12(6):e0178621. doi:10.1371/journal.pone.0178621 PubMed
11.Santini A, Petruzzo A, Giannetta N, Ruggiero A, Di Muzio M, Latina R. Management of chronic musculoskeletal pain in veterans: a systematic review. Acta Biomed. Mar 31 2021;92(S2):e2021011. doi:10.23750/abm.v92iS2.11352 PubMed
12.Busse JW, Craigie S, Juurlink DN, et al. Guideline for opioid therapy and chronic noncancer pain. CMAJ. May 8 2017;189(18):E659-E666. doi:10.1503/cmaj.170363 PubMed
13.Hsu C, Vu K, Borg-Stein J. Prolotherapy: A Narrative Review of Mechanisms, Techniques, and Protocols, and Evidence for Common Musculoskeletal Conditions. Phys Med Rehabil Clin N Am. Feb 2023;34(1):165-180. doi:10.1016/j.pmr.2022.08.011 PubMed
14.Huang K, Cai H. Hypertonic dextrose prolotherapy in osteoarthritis: mechanisms, efficacy, and future research directions. Review. Front Endocrinol (Lausanne). 2025;16:1602727. doi:10.3389/fendo.2025.1602727 PubMed
15.Previtali D, Merli G, Di Laura Frattura G, Candrian C, Zaffagnini S, Filardo G. The Long-Lasting Effects of “Placebo Injections” in Knee Osteoarthritis: A Meta-Analysis. Cartilage. Dec 2021;13(1_suppl):185S-196S. doi:10.1177/1947603520906597 PubMed
16.Bélanger M, Allard J, de Arcos C, et al. Effect of Regenerative Injection Therapy on Function and Pain in Patients with Knee Osteoarthritis: A Randomized Crossover Study. Pain Med. 2012/08/01 2012;13(8):990-999. doi:10.1111/j.1526-4637.2012.01422.x
17.CADTH. Prolotherapy for Chronic Musculoskeletal Pain: A Review of Clinical Effectiveness and Guidelines. 2014. CADTH Rapid Response Report. Accessed March 16, 2026.
18.Institut national d’excellence en santé et en services sociaux (INESSS). Efficacité et innocuité de la prolothérapie dans le traitement de la douleur musculosquelettique chronique. 2024. Accessed April 28, 2026. https://www.inesss.qc.ca/en/publications/publications/publication/efficacite-et-innocuite-de-la-prolotherapie-dans-le-traitement-de-la-douleur-musculosquelettique-chronique.html
19.Martin C. Efficacy/Effectiveness of Prolotherapy in Treating Wrist Sprain/Strain or Repetitive Strain Injury (RSI): A Rapid Systematic Review. 2024. Accessed April 28, 2026. https://www.worksafebc.com/en/resources/health-care-providers/guides/efficacy-effectiveness-prolotherapy-treating-wrist-sprain-rsi
20.Martin C. Effectiveness of Prolotherapy in Shoulder Labral Tears: A Rapid Systematic Review. 2024. Accessed April 28, 2026. https://www.worksafebc.com/en/resources/health-care-providers/guides/effectiveness-prolotherapy-shoulder-labral-tears
21.Martin C. Effectiveness of Prolotherapy in Rotator Cuff Tendinopathy: A Rapid Systematic Review. 2024. Accessed April 28, 2026. https://www.worksafebc.com/en/resources/health-care-providers/guides/effectiveness-prolotherapy-rotator-cuff-tendinopathy
22.Ewart D, Sowerby C, Yang S, et al. Dextrose Prolotherapy for Musculoskeletal Pain: A Systematic Review. Department of Veterans Affairs (US). 2024.
23.Shea BJ, Reeves BC, Wells G, et al. AMSTAR 2: a critical appraisal tool for systematic reviews that include randomised or non-randomised studies of healthcare interventions, or both. BMJ. 2017;358:j4008. doi:10.1136/bmj.j4008 PubMed
24.Qafesha RM, Ishreiteh HA, Nassourah AL, Tawil OI, Mashaly D. Efficacy and Safety of Dextrose Prolotherapy Versus Corticosteroid Injections in Plantar Fasciitis: A Systematic Review and Meta-Analysis. J Foot Ankle Res. Mar 2026;19(1):e70135. doi:10.1002/jfa2.70135 PubMed
25.Saramantos A, Kyrgidis A, Venetis G, et al. Clinical Efficacy of Prolotherapy for Temporomandibular Joint Disorders: A Systematic Review and Meta-Analysis. Review. Clin Pract. Feb 27 2025;15(3):51. doi:10.3390/clinpract15030051 PubMed
26.Thamrongskulsiri N, Vitoonpong T, Itthipanichpong T, Limskul D, Tanpowpong T, Kuptniratsaikul S. Prolotherapy is not superior to control or placebo-based conservative treatments for rotator cuff tendinopathy: a systematic review and meta-analysis. Clin Shoulder Elb. Dec 2025;28(4):446-456. doi:10.5397/cise.2025.00570 PubMed
27.Zhou G, Hu Y, Wang S. Efficacy of dextrose prolotherapy for temporomandibular joint hypermobility: A systematic review and meta-analysis. Cranio. Nov 2025;43(6):1022-1031. doi:10.1080/08869634.2024.2419845 PubMed
28.Page MJ, Moher D, Bossuyt PM, et al. PRISMA 2020 explanation and elaboration: updated guidance and exemplars for reporting systematic reviews. BMJ. 2021;372:n160. doi:10.1136/bmj.n160 PubMed
29.O'Neill J, Tabish H, Welch V, et al. Applying an equity lens to interventions: using PROGRESS ensures consideration of socially stratifying factors to illuminate inequities in health. J Clin Epidemiol. 2014;67(1):56-64. doi:10.1016/j.jclinepi.2013.08.005 PubMed
30.Korownyk CS, Montgomery L, Young J, et al. PEER simplified chronic pain guideline: Management of chronic low back, osteoarthritic, and neuropathic pain in primary care. Can Fam Physician. Mar 2022;68(3):179-190. doi:10.46747/cfp.6803179 PubMed
31.Canada’s Drug Agency. Canada's Drug Agency Style: A Guide for Authors and Editors. 2025. Accessed January 1, 2026. https://www.cda-amc.ca/sites/default/files/pdf/style_guide_2025_digital.pdf
Appendix 1: Detailed Methods and Selection of Included Studies
Please note that this appendix has not been copy-edited.
What Is a Rapid Review?
Rapid reviews are based on accelerated and abbreviated SR methods, balancing timeliness with rigour, to allow for timely decision-making. Due to these abbreviated methods, rapid reviews have some limitations. For example, in our initial scoping of the topic, we identified an SR published by the US Veterans Affairs in 2024,22 which included literature from inception through February 2024. This SR22 was highly relevant, comprehensive, and methodologically robust, making it a well-aligned and appropriate baseline for the present rapid review. In consultation with the external requester, we set our search time frame from March 2024 onward and included and appraised this SR22 in the current rapid review. The included SRs published in this time frame also include older studies. Another example is that unlike in SRs, for which at least 2 independent reviewers are needed to screen studies to reduce selection bias, a single reviewer was required to include, extract the data, and appraise a study. Our rapid review intends to summarize the available evidence, rather than provide recommendations. These findings should not be interpreted as prescriptive guidance.
Literature Search Methods
An information specialist conducted a literature search on key resources including MEDLINE, Embase, the Cochrane Database of Systematic Reviews, the International HTA Database, the websites of health technology assessment (HTA) agencies in Canada and major international HTA agencies, as well as a focused internet search. The search approach was customized to retrieve a limited set of results, balancing comprehensiveness with relevance. The search strategy comprised both controlled vocabulary, such as the US National Library of Medicine’s MeSH (Medical Subject Headings), and keywords. Search concepts were developed based on the elements of the research questions and selection criteria. The main search concept was prolotherapy. Conference abstracts and clinical trial registry records were excluded. Retrieval was limited to the human population. The search was completed on March 23, 2026, and was limited to English-language documents published since January 1, 2024. The search strategy is available on request.
Selection Criteria and Methods
One reviewer screened citations and selected studies. In the first level of screening, titles and abstracts were reviewed and potentially relevant articles were retrieved and assessed for inclusion. The final selection of full-text articles was based on the inclusion criteria presented in Table 1.
Exclusion Criteria
Articles were excluded if they:
did not meet the selection criteria outlined in Table 1
were duplicate publications or were published before January 2024
were any study design other than SR
were SRs in which all relevant studies were captured in other more recent or more comprehensive SRs
were published in languages other than English (for feasibility reasons).
Critical Appraisal of Individual Studies
The included publications were critically appraised by 1 reviewer using the following tool as a guide: A MeaSurement Tool to Assess systematic Reviews 2 (AMSTAR 2)23 for SRs. Summary scores were not calculated for the included studies; rather, the strengths and limitations of each included publication were described narratively.
Data Extraction
One reviewer extracted data directly into standardized tables created in Microsoft Word, which were modified as necessary. The extracted information included study characteristics, methodology (e.g., study design), population, intervention, comparator, and results regarding the outcomes of interest.
One reviewer extracted information from the included studies using the PROGRESS-Plus29 tool to describe different population groups. Each included study was checked to determine if PROGRESS-Plus29 tool criteria were reported by study authors to describe the participants; detailed characteristics, if available, were then extracted and reported in Table 2 in Appendix 3. The main PROGRESS-Plus29 criteria include place of residence; race, ethnicity, culture, and/or language; occupation; gender and/or sex; religion; education; socioeconomic status; and social capital. As part of report writing, we discuss these characteristics across the evidence, where available, when presenting results within the text.
When reporting on sex, gender, race, or ethnicity in this Rapid Review, we planned to retain the language used by the original study authors, and, whenever possible, we referred to these groups based on guidance from Canada’s Drug Agency Style: A Guide for Authors and Editors31 at the time this rapid review was conducted, with an understanding that language is constantly evolving.
Appendix 2: Selection of Included Studies
Please note that this appendix has not been copy-edited.
Figure 1: Selection of Included Studies — PRISMA28 Flow Chart of Selected Reports
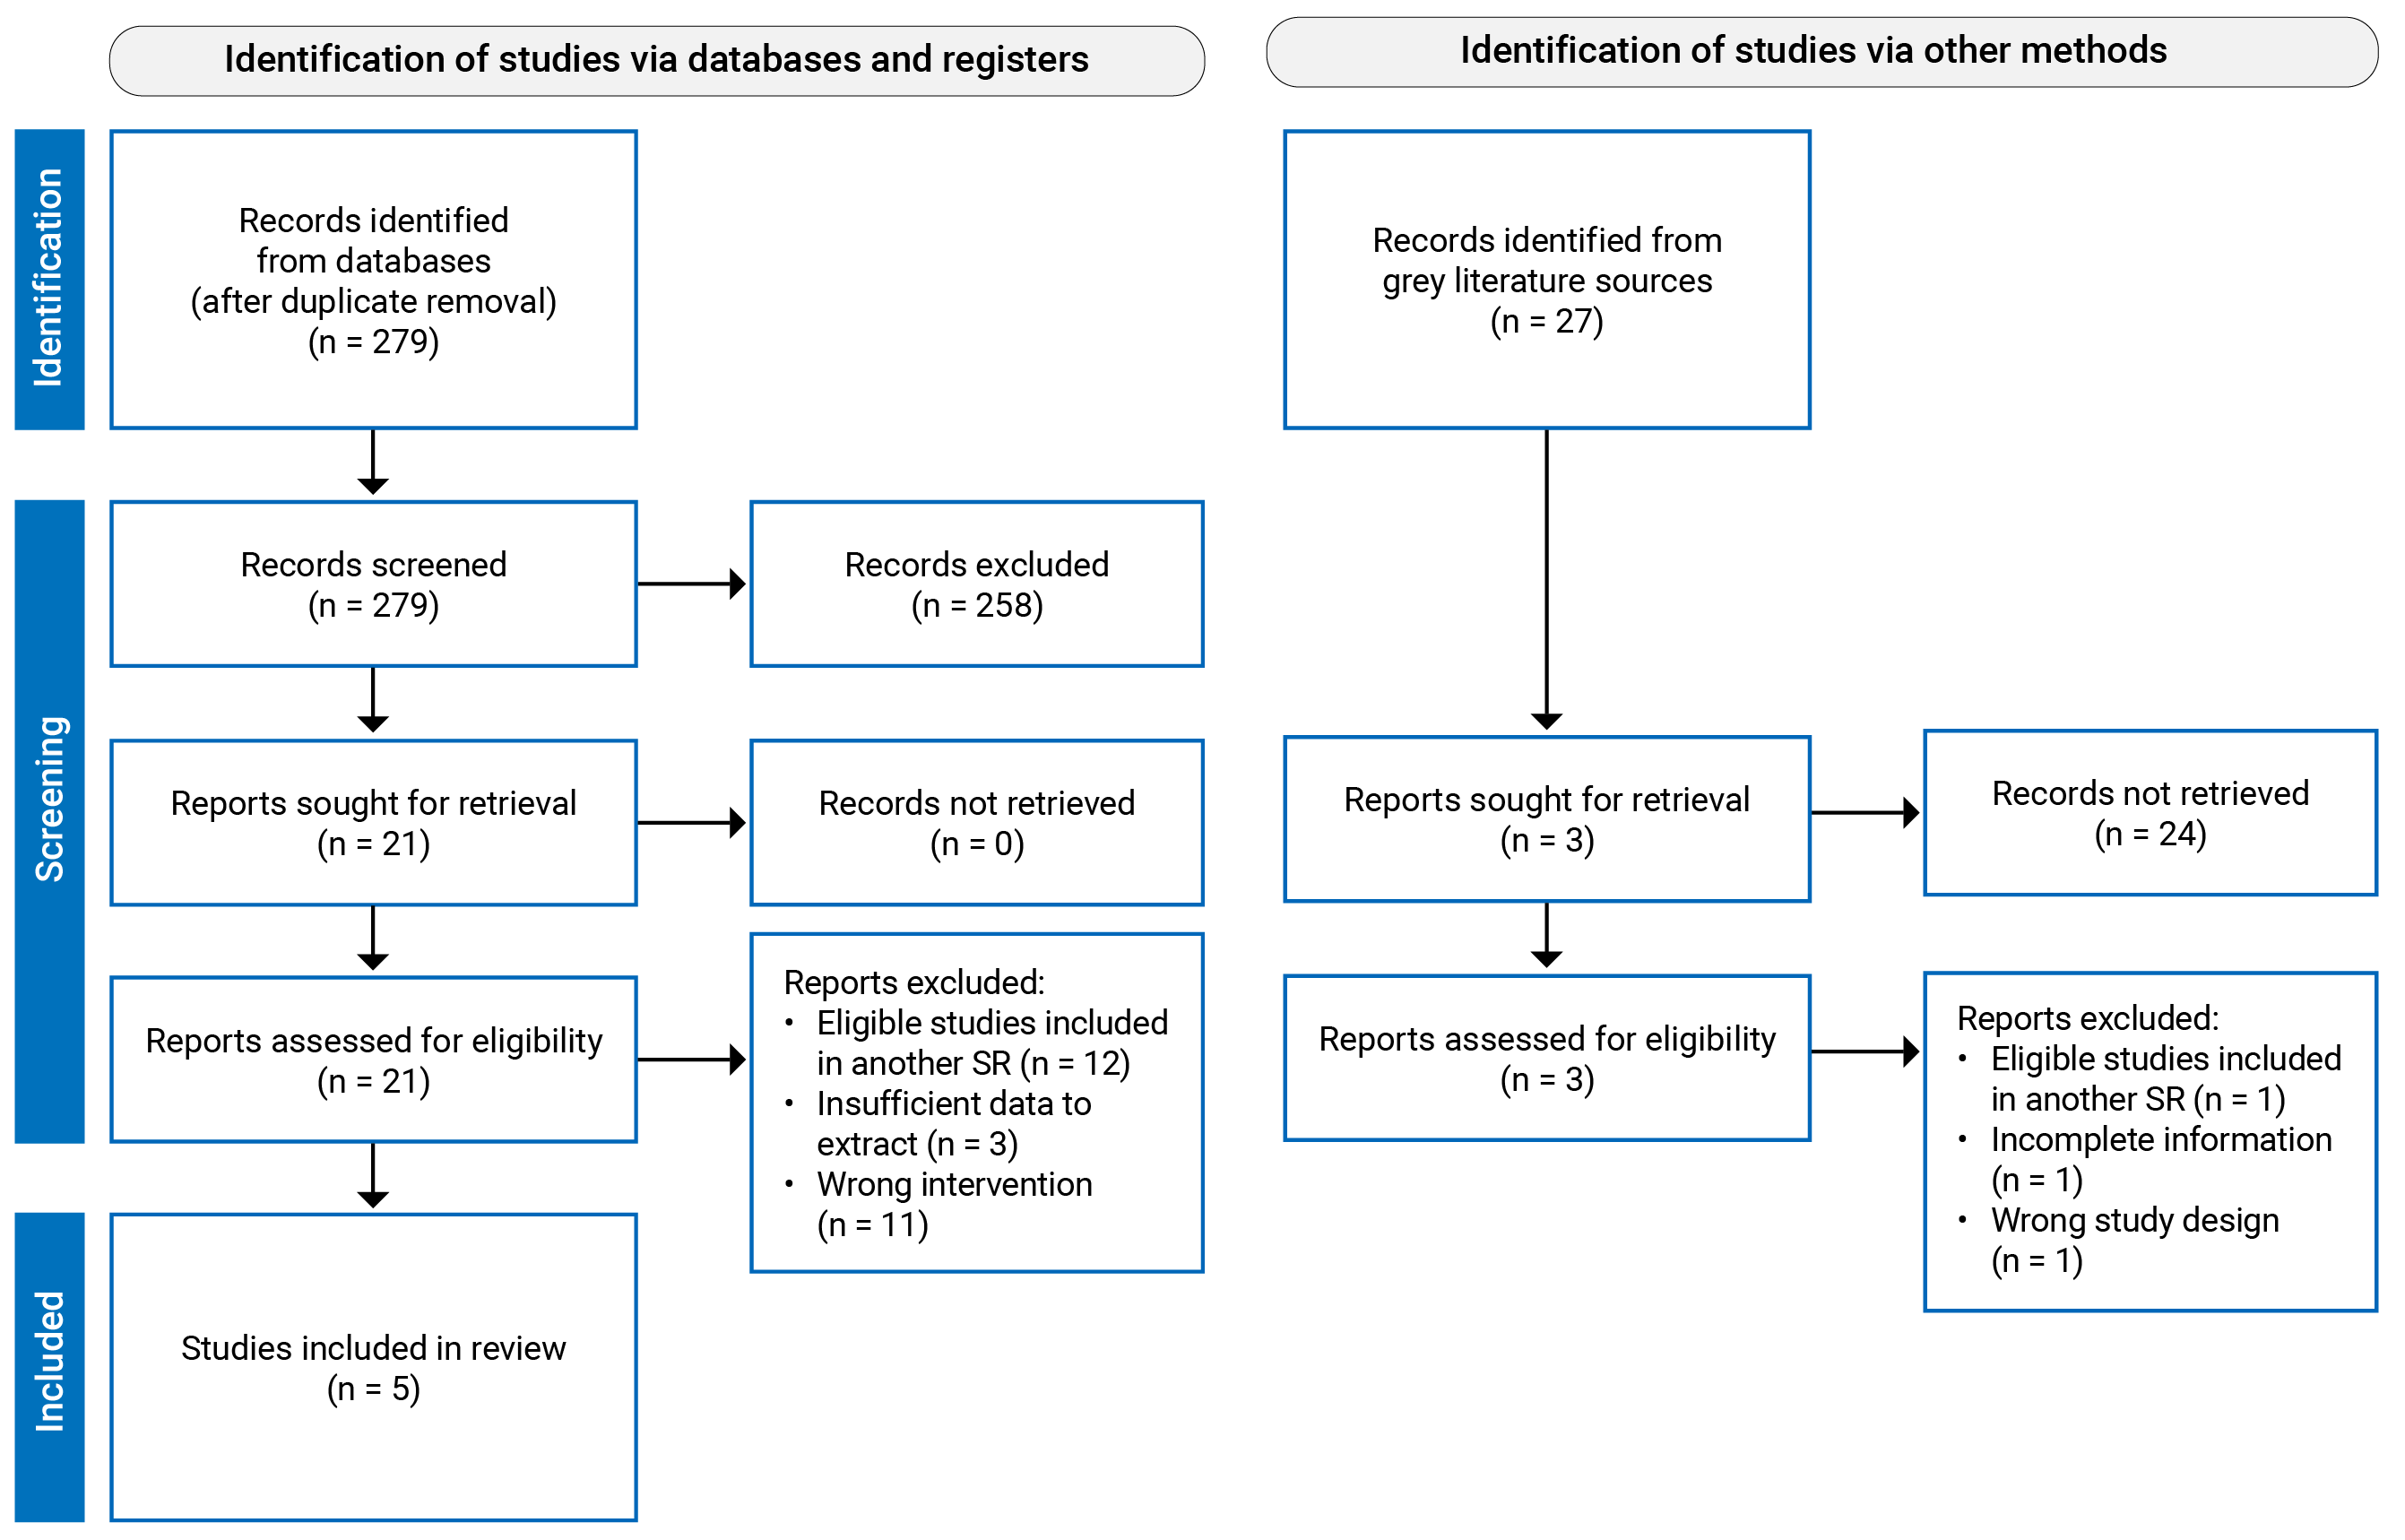
SR = systematic review.
Appendix 3: Characteristics of Included Publications
Please note that this appendix has not been copy-edited.
Table 2: Characteristics of Included Systematic Reviews
Study citation, countries of eligible studies, funding source | Study designs and number of primary studies included | Population characteristics | Intervention and comparator(s) | Intervention characteristics | Clinical outcomes, length of follow-up |
|---|---|---|---|---|---|
Qafesha et al. (2026)24 Countries of included studies eligible for the current review:
Funding source: None | Study design: SR and MA of RCTs and cohort studies Articles with no language restriction published from inception to Octobera 2025 Number of included studies: 7 (5 RCTs, 2 comparative cohort studies); all relevant to the present review. | Adults (≥ 18 years) with plantar fasciitis Number of participants: 567 Age (year), mean: mean ages ranging from approximately 42 to 54 years Sex or gender: predominance of female participants (up to 88% in 1 study); other sexes or genders were NR. BMI: mean ranging from 27.7 kg/m2 to 32.5 kg/m2 Other PROGRESS-Plus criteria:b NR Setting: NR | Intervention: Dextrose prolotherapy Comparator:
| Location of injections: NR Number of injection sessions:
Injection doses: Dextrose concentrations ranged from 5% to 50% in their included studies and were diluted with local anesthetics Use of imaging guidance:
| Outcomes:
Follow-up duration:
|
Saramantos et al. (2025)25 Countries of included studies eligible for the current review: NR Funding source: None | Study design: SR and MA of RCTs Language restriction on articles: NR Articles published from 1990 to September 2024 Number of included studies: 12 RCTs; 10 RCTs relevant to the present review. | Patients with TMD Number of participants: 345 Age (year), mean: mean ages ranging from approximately 23 to 50 years Sex or gender: The percentage of female participants from included primary studies ranged from 40% to 100%; other sexes or genders were NR. Other PROGRESS-Plus criteria:b NR Setting: NR | Intervention: Dextrose prolotherapy Comparator:
| Location of injections: Intra-articular injections ± periarticular/masseter injections Number of injection sessions:
Injection doses: Dextrose solutions ranged from 10% to 50% in their included studies Use of imaging guidance: NR for relevant RCTs | Outcomes:
Follow-up duration: 1 month to 12 months (varied) |
Thamrongskulsiri et al. (2025)26 Countries of included studies eligible for the current review: NR Funding source: None | Study design: SR and MA of comparative studies English-language articles published from inception to April 2025. Number of included studies: 8 (all comparative observational studies); all relevant to the present review. | Adults with rotator cuff tendinopathy Number of participants: 431 Age (year), mean: mean ages ranging from approximately 46 to 57 years Other PROGRESS-Plus criteria:b NR Setting: NR | Intervention: Dextrose prolotherapy + PT Comparator:
| Location of injections: NR Number of injection sessions:
Injection doses: Dextrose solutions ranged from 12.5% to 25% in their included studies Use of imaging guidance:
| Outcomes:
Follow-up duration: 3 months to 12 months (varied) |
Zhou et al. (2025)27 Countries of included studies eligible for the current review:
Funding source: None | Study design: SR and MA of RCTs English-language articles published from inception to August 2024. Number of included studies: 8 (all RCTs); 7 relevant to the present review. | Adult patients with TMJ hypermobility Number of participants: 236 Age (year), mean: mean ages ranging from approximately 23 to 32 years Sex or gender: The number of male participants from included primary studies ranged from 0 to 18; other sexes or genders were NR. Other PROGRESS-Plus criteria:a,b NR Setting: NR | Intervention: Dextrose prolotherapy Comparator:
| Location of injections: Intra-articular TMJ injections ± periarticular structures Number of injection sessions:
Injection doses: Dextrose solutions ranged from 10% to 50% in their included studies Use of imaging guidance: NR | Outcomes:
Follow-up duration: 1 month to 12 months (varied) |
Ewart et al. (2024)22 Countries/regions of included studies eligible for the current review:
Funding source: Department of Veterans Affairs, Veterans Health Administration, Health Systems Research | Study design: SR and MA (for certain pain conditions) of RCTs and observational studies English-language articles published from inception to February 2024. Number of included studies: 91 articles, reporting 90 unique studies (80 RCTs, 10 observational studies); 86 relevant to the present review. | Adults (≥ 18 years) with acute or chronic musculoskeletal pain:
Number of participants:
Age (year), mean/median:
Sex or gender: The percentage of women reported from included primary studies:
Other sexes or genders were NR. BMI: reported separately for each study Other PROGRESS-Plus criteria:b NR Setting: Outpatient | Intervention: Dextrose prolotherapy (hypertonic, > 5%) Comparator: Any Identified comparators related to the present review:
| Location of injections: Intra-articular and/or periarticular, depending on condition Number of injection sessions:
Injection doses: Dextrose solutions ranged from 5% to 50% in their included studies Use of imaging guidance:
| Outcomes:
Follow-up duration:
|
ABI = autologous blood injection; HA = hyaluronic acid; MA = meta-analysis; MIO = maximal incisor opening; MMO = maximal mouth opening; NR = not reported; NRS = numerical rating scale; PT = physical therapy; RCT = randomized controlled trial; ROM = range of motion; SPADI = shoulder pain and disability index; SR = systematic review; TMD = temporomandibular disorders; TMJ = Temporomandibular joint; VAS = visual analogue scale.
In this table, n refers to number of studies reported on a certain characteristic item in each SR.
aThe abstract of the article stated the date as August 2025, but the methods in the main text stated the date as October 2025.
bThe main PROGRESS-Plus criteria include place of residence, race, ethnicity, culture, language, occupation, gender, sex, religion, education, socioeconomic status, and social capital, personal characteristics associated with discrimination (e.g., age, disability), features of relationships, and time-dependent relationships.29
cIncludes platelet-rich plasma, autologous blood, and autologous conditioned serum.
dIncludes botulinum toxin, erythropoietin, and ozone.
eIncludes radiofrequency pulses, extracorporeal shock wave therapy, laser, occlusal splint, arthrocentesis, paraffin wax, and NSAIDs.
Appendix 4: Critical Appraisal of Included Publications
Please note that this appendix has not been copy-edited.
Table 3: Strengths and Limitations of the Qafesha et al. (2026) Study24 Using AMSTAR 223
AMSTAR 2 item | Domain type | Judgment | Support for judgment |
|---|---|---|---|
1. Did the research questions and inclusion criteria for the review include the components of PICO? | Noncritical | Yes | The review clearly defines population (adults with plantar fasciitis), interventions (dextrose prolotherapy), comparator (corticosteroid injections), and outcomes (VAS, FFI, adverse events). |
2. Did the report of the review contain an explicit statement that the review methods were established prior to the conduct of the review and did the report justify any significant deviations from the protocol? | Critical | Yes | The review reports PROSPERO registration (CRD420251126876), indicating predefined methods. No deviations were discussed. |
3. Did the review authors explain their selection of the study designs for inclusion in the review? | Noncritical | Yes | Authors explicitly justify inclusion of both RCTs and cohort studies due to limited RCT evidence for some outcomes. |
4. Did the review authors use a comprehensive literature search strategy? | Critical | Yes | Multiple databases (PubMed, Cochrane, Web of Science, Scopus, Google Scholar) searched from inception with no language restrictions; search strategy based on PICOS. However, they did not conduct a grey literature search. |
5. Did the review authors perform study selection in duplicate? | Noncritical | Yes | Two reviewers independently screened titles/abstracts and full texts, with a third reviewer resolving disagreements. |
6. Did the review authors perform data extraction in duplicate? | Noncritical | Yes | Data extraction was conducted independently by 2 reviewers using a predefined form. |
7. Did the review authors provide a list of excluded studies and justify the exclusions? | Critical | Yes | The list of excluded studies with reasons are provided in supplementary material. |
8. Did the review authors describe the included studies in adequate detail? | Noncritical | Yes | Detailed tables describe study design, population, interventions, dosing, follow-up, and outcomes. |
9. Did the review authors use a satisfactory technique for assessing the RoB in individual studies that were included in the review? | Critical | Yes | Two independent reviewers evaluated the risk of bias via the Cochrane RoB 2 tool for RCTs, and Newcastle–Ottawa Scale for cohort studies, with domain-level reporting. |
10. Did the review authors report on the sources of funding for the studies included in the review? | Noncritical | Yes | Funding status is reported in study characteristics table. |
11. If meta-analysis was performed did the review authors use appropriate methods for statistical combination of results? | Critical | Yes | Use of mean differences, heterogeneity assessment (χ2, I2), fixed- or random-effects models, subgroup and sensitivity analyses. |
12. If meta-analysis was performed, did the review authors assess the potential impact of RoB in individual studies on the results of the meta-analysis or other evidence synthesis? | Noncritical | Yes | Sensitivity analyses (via leave-1-out [jackknife] method) and RoB assessments were presented. The influence of individual studies on pooled results were estimated and discussed. |
13. Did the review authors account for RoB in individual studies when interpreting/discussing the results of the review? | Critical | Yes | Authors explicitly discussed bias (e.g., lack of blinding, missing data) and its implications for confidence in findings. |
14. Did the review authors provide a satisfactory explanation for, and discussion of, any heterogeneity observed in the results of the review? | Noncritical | Yes | Heterogeneity was explored via subgroup analysis (e.g., ultrasound vs. palpation guidance), and sensitivity analyses were conducted. |
15. If they performed quantitative synthesis did the review authors carry out an adequate investigation of publication bias (small study bias) and discuss its likely impact on the results of the review? | Critical | Yes | Egger’s test was used; authors acknowledged limitations due to small number of studies and interpreted them cautiously. |
16. Did the review authors report any potential sources of conflict of interest, including any funding they received for conducting the review? | Noncritical | Yes | Explicit statements of conflicts of interest and funding are clearly provided. |
AMSTAR 2 = A MeaSurement Tool to Assess systematic Reviews 2; FFI = foot function index; PICOS = population, intervention, comparison, outcomes, study design; RCT = randomized controlled trial; RoB = risk of bias; VAS = visual analogue scale; vs. = versus.
Table 4: Strengths and Limitations of the Saramantos et al. (2025) Study25 Using AMSTAR 223
AMSTAR 2 item | Domain type | Judgment | Support for judgment |
|---|---|---|---|
1. Did the research questions and inclusion criteria for the review include the components of PICO? | Noncritical | Yes | Population, intervention, comparator, and outcomes are clearly described, according to the PICO framework, presented in Supplementary Table S2. |
2. Did the report of the review contain an explicit statement that the review methods were established prior to the conduct of the review and did the report justify any significant deviations from the protocol? | Critical | No | The paper explicitly states that review protocol preregistration was not performed. |
3. Did the review authors explain their selection of the study designs for inclusion in the review? | Noncritical | Yes | The review explicitly focused on RCTs and explains that RCTs are the superior form of evidence for clinical conclusions. |
4. Did the review authors use a comprehensive literature search strategy? | Critical | Partial Yes | They searched MEDLINE, Scopus, and CENTRAL, screened conferences, and grey literature, checked references, and provided a search example and supplementary strategies. However, no clear justification for any publication restrictions was given. |
5. Did the review authors perform study selection in duplicate? | Noncritical | Yes | Two independent investigators conducted the search and resolved disagreements through a third investigator. |
6. Did the review authors perform data extraction in duplicate? | Noncritical | Yes | Two authors independently extracted data using a standardized form. |
7. Did the review authors provide a list of excluded studies and justify the exclusions? | Critical | No | The review provides counts and categories of excluded studies but not a citation-level list of excluded full-text studies with reasons. |
8. Did the review authors describe the included studies in adequate detail? | Noncritical | Yes | Included studies were described in descriptive tables and text, covering interventions, comparators, follow-up, and outcomes. |
9. Did the review authors use a satisfactory technique for assessing the RoB in individual studies that were included in the review? | Critical | Yes | The review used the RevMan risk of bias tool and presented risk of bias figures. |
10. Did the review authors report on the sources of funding for the studies included in the review? | Noncritical | No | Funding sources for the included primary studies were not reported. |
11. If meta-analysis was performed did the review authors use appropriate methods for statistical combination of results? | Critical | Yes | They pooled weighted mean differences, assessed heterogeneity with I2, used random-effects models for higher heterogeneity, and conducted subgroup and sensitivity analyses. |
12. If meta-analysis was performed, did the review authors assess the potential impact of RoB in individual studies on the results of the meta-analysis or other evidence synthesis? | Noncritical | No | RoB was presented, but no clear analysis linked study bias to the pooled results. |
13. Did the review authors account for RoB in individual studies when interpreting/discussing the results of the review? | Critical | Partial Yes | The authors acknowledge limited and imperfect evidence, but the interpretation does not clearly integrate specific RoB findings into each conclusion. |
14. Did the review authors provide a satisfactory explanation for, and discussion of, any heterogeneity observed in the results of the review? | Noncritical | Yes | They conducted subgroup and sensitivity analyses to investigate heterogeneity and used random-effects models when needed. |
15. If they performed quantitative synthesis did the review authors carry out an adequate investigation of publication bias (small study bias) and discuss its likely impact on the results of the review? | Critical | Partial Yes | Funnel plots were examined and reported in the supplementary file, but the discussion of their likely impact appears limited. |
16. Did the review authors report any potential sources of conflict of interest, including any funding they received for conducting the review? | Noncritical | Yes | The review reports no external funding and no conflicts of interest. |
AMSTAR 2 = A MeaSurement Tool to Assess systematic Reviews 2; PICOS = population, intervention, comparison, outcomes, study design; RCT = randomized controlled trial; RoB = risk of bias.
Table 5: Strengths and Limitations of the Thamrongskulsiri et al. (2025) Study26 Using AMSTAR 223
AMSTAR 2 item | Domain type | Judgment | Support for judgment |
|---|---|---|---|
1. Did the research questions and inclusion criteria for the review include the components of PICO? | Noncritical | Partial Yes | The information about the population, intervention, comparator, and outcomes can be found in the review, but they are not clearly defined in the methods. |
2. Did the report of the review contain an explicit statement that the review methods were established prior to the conduct of the review and did the report justify any significant deviations from the protocol? | Critical | Yes | The review was registered in PROSPERO (CRD42024615400). No deviations were reported. |
3. Did the review authors explain their selection of the study designs for inclusion in the review? | Noncritical | Partial Yes | Authors limited inclusion to comparative clinical studies with evidence levels 1 to 3, but the rationale for this design restriction was not fully explained. |
4. Did the review authors use a comprehensive literature search strategy? | Critical | Partial Yes | The review searched PubMed, Ovid, and Scopus from inception and used duplicate independent searching. However, they did not conduct a grey literature search. |
5. Did the review authors perform study selection in duplicate? | Noncritical | Yes | Two researchers independently reviewed titles, abstracts, and full texts, with third-author resolution of discrepancies. |
6. Did the review authors perform data extraction in duplicate? | Noncritical | Partial Yes | The paper clearly states duplicate eligibility review, but it does not explicitly state that full data extraction itself was independently duplicated in the same way. |
7. Did the review authors provide a list of excluded studies and justify the exclusions? | Critical | No | Authors reported the number of excluded abstracts and full texts, but not a study-level excluded list with justifications. |
8. Did the review authors describe the included studies in adequate detail? | Noncritical | Yes | Tables reported age, follow-up, sample size, outcomes, and study/intervention details. |
9. Did the review authors use a satisfactory technique for assessing the RoB in individual studies that were included in the review? | Critical | No | The quality of the included studies was assessed using 2 tools: MINORS and MCMS, but these are not dedicated domain-based tools for assessing RoB in studies. |
10. Did the review authors report on the sources of funding for the studies included in the review? | Noncritical | No | Funding sources for the included primary studies are not reported. |
11. If meta-analysis was performed did the review authors use appropriate methods for statistical combination of results? | Critical | Yes | Authors used RevMan, pooled MDs and ORs with 95% CIs, assessed heterogeneity with chi-square and I2, and selected fixed- or random-effects models based on heterogeneity. |
12. If meta-analysis was performed, did the review authors assess the potential impact of RoB in individual studies on the results of the meta-analysis or other evidence synthesis? | Noncritical | No | Study quality was scored, but there was no clear analysis of how bias or methodological limitations affected pooled estimates. |
13. Did the review authors account for RoB in individual studies when interpreting/discussing the results of the review? | Critical | Partial Yes | The discussion acknowledges methodological limitations, language bias, and heterogeneity, but it does not clearly integrate study-level bias assessments into interpretation. |
14. Did the review authors provide a satisfactory explanation for, and discussion of, any heterogeneity observed in the results of the review? | Noncritical | Yes | The authors discuss substantial heterogeneity in injection protocols, follow-up duration, and outcome measures, and explain that subgroup meta-analysis was limited by this heterogeneity. |
15. If they performed quantitative synthesis did the review authors carry out an adequate investigation of publication bias (small study bias) and discuss its likely impact on the results of the review? | Critical | No | They acknowledge possible publication bias and language bias, but no formal investigation of publication bias was reported. |
16. Did the review authors report any potential sources of conflict of interest, including any funding they received for conducting the review? | Noncritical | Yes | The review reports no conflict of interest and no funding. |
AMSTAR 2 = A MeaSurement Tool to Assess systematic Reviews 2; CI = confidence interval; MDs = mean differences; OR = odds ratio; MCMS = Modified Coleman Methodology Score; MINORS = Methodological Index for Non-Randomized Studies; RCT = randomized controlled trial; RoB = risk of bias.
Table 6: Strengths and Limitations of the Zhou et al. (2025) Study27 Using AMSTAR 223
AMSTAR 2 item | Domain type | Judgment | Support for judgment |
|---|---|---|---|
1. Did the research questions and inclusion criteria for the review include the components of PICO? | Noncritical | Yes | The review explicitly states population, intervention, comparator, outcomes, and study type using a PICOS-based framework. |
2. Did the report of the review contain an explicit statement that the review methods were established prior to the conduct of the review and did the report justify any significant deviations from the protocol? | Critical | Yes | The protocol was registered in PROSPERO before the study began (CRD42024574666). No deviations were reported. |
3. Did the review authors explain their selection of the study designs for inclusion in the review? | Noncritical | Partial Yes | The review restricted inclusion to RCTs but provided little explicit methodological justification for selecting only that design. |
4. Did the review authors use a comprehensive literature search strategy? | Critical | Partial Yes | They searched PubMed, CENTRAL, Embase, Scopus, and Web of Science, also searched Google Scholar grey literature, checked reference lists, used MeSH/free-text terms, and involved an experienced medical librarian. However, they did not conduct a grey literature search. |
5. Did the review authors perform study selection in duplicate? | Noncritical | Yes | Two independent reviewers screened studies, with disagreements resolved by a third reviewer. |
6. Did the review authors perform data extraction in duplicate? | Noncritical | Yes | Two reviewers independently extracted and re-reviewed the data, with third reviewer cross-checking. |
7. Did the review authors provide a list of excluded studies and justify the exclusions? | Critical | No | The paper reports numbers and broad reasons for exclusion, but not a study-level list of excluded full texts with individual justifications. |
8. Did the review authors describe the included studies in adequate detail? | Noncritical | Yes | The review summarizes country, year, sample size, intervention protocols, follow-up, and outcomes, and provides detailed study characteristics. |
9. Did the review authors use a satisfactory technique for assessing the RoB in individual studies that were included in the review? | Critical | Yes | The Cochrane Collaboration RoB 2 tool was used for the included RCTs, which is an appropriate tool. |
10. Did the review authors report on the sources of funding for the studies included in the review? | Noncritical | No | No reporting of funding sources for the included primary studies was provided. |
11. If meta-analysis was performed did the review authors use appropriate methods for statistical combination of results? | Critical | Yes | They used RevMan, pooled mean differences with 95% CIs, assessed heterogeneity with Q and I2, and used descriptive synthesis when pooling was not feasible. |
12. If meta-analysis was performed, did the review authors assess the potential impact of RoB in individual studies on the results of the meta-analysis or other evidence synthesis? | Noncritical | No | RoB was assessed, but no clear analysis of how study RoB affected pooled estimates was reported. |
13. Did the review authors account for RoB in individual studies when interpreting/discussing the results of the review? | Critical | Yes | The discussion and conclusions repeatedly describe the evidence as low quality and urge caution in interpretation. |
14. Did the review authors provide a satisfactory explanation for, and discussion of, any heterogeneity observed in the results of the review? | Noncritical | Partial Yes | Heterogeneity was quantified and acknowledged, but the exploration of its sources was limited. |
15. If they performed quantitative synthesis did the review authors carry out an adequate investigation of publication bias (small study bias) and discuss its likely impact on the results of the review? | Critical | No | They explicitly state that funnel plots were not drawn because of the small number of studies, and no alternative assessment or impact discussion was provided. |
16. Did the review authors report any potential sources of conflict of interest, including any funding they received for conducting the review? | Noncritical | Yes | The review reports no conflict of interest and no funding. |
AMSTAR 2 = A MeaSurement Tool to Assess systematic Reviews 2; PICOS = population, intervention, comparison, outcomes, and study design; RCT = randomized controlled trial; RoB = risk of bias; VAS = visual analogue scale.
Table 7: Strengths and Limitations of the Ewart et al. (2024) Study22 Using AMSTAR 223
AMSTAR 2 item | Domain type | Judgment | Support for judgment |
|---|---|---|---|
1. Did the research questions and inclusion criteria for the review include the components of PICO? | Noncritical | Yes | The review clearly defines population, intervention, comparators, outcomes, and study designs under eligibility criteria and key questions. |
2. Did the report of the review contain an explicit statement that the review methods were established prior to the conduct of the review and did the report justify any significant deviations from the protocol? | Critical | Yes | The authors report that the review protocol was registered in PROSPERO (CRD42024531179) before conducting the review. |
3. Did the review authors explain their selection of the study designs for inclusion in the review? | Noncritical | Yes | Inclusion of RCTs and observational studies (with justification tied to outcomes like adverse events) is explicitly described in eligibility criteria. |
4. Did the review authors use a comprehensive literature search strategy? | Critical | Yes | Multiple databases were searched and detailed search strategies are provided in the appendix. |
5. Did the review authors perform study selection in duplicate? | Noncritical | Yes | Study screening and selection were conducted by 2 reviewers. |
6. Did the review authors perform data extraction in duplicate? | Noncritical | Yes | Data extraction procedures indicate verification or independent extraction by 2 reviewers. |
7. Did the review authors provide a list of excluded studies and justify the exclusions? | Critical | Yes | The appendix includes a list of excluded studies along with reasons for exclusion. |
8. Did the review authors describe the included studies in adequate detail? | Noncritical | Yes | Characteristics of included studies are reported in detailed tables describing populations, interventions, comparators, and outcomes. |
9. Did the review authors use a satisfactory technique for assessing the RoB in individual studies that were included in the review? | Critical | Yes | RoB assessments are reported for included studies using established appraisal methods: Cochrane RoB-2 for RCTs, ROBINS-I for comparative cohort studies, and Joanna Briggs Institute Critical Appraisal Tool for Cohort Studies for 1 pre–post observational study. |
10. Did the review authors report on the sources of funding for the studies included in the review? | Noncritical | Yes | Funding information for included studies is reported, if available in the primary studies. |
11. If meta-analysis was performed did the review authors use appropriate methods for statistical combination of results? | Critical | Yes | Meta-analysis conducted when appropriate (≥ 3 studies), with structured grouping, and narrative synthesis otherwise. |
12. If meta-analysis was performed, did the review authors assess the potential impact of RoB in individual studies on the results of the meta-analysis or other evidence synthesis? | Noncritical | Yes | RoB findings were considered when interpreting results and evidence certainty. |
13. Did the review authors account for RoB in individual studies when interpreting/discussing the results of the review? | Critical | Yes | The authors note that many included studies had high RoB and incorporate this into the interpretation of findings. |
14. Did the review authors provide a satisfactory explanation for, and discussion of, any heterogeneity observed in the results of the review? | Noncritical | Yes | Variability in intervention protocols, patient populations, and outcomes is discussed as a source of heterogeneity. |
15. If they performed quantitative synthesis did the review authors carry out an adequate investigation of publication bias (small study bias) and discuss its likely impact on the results of the review? | Critical | Partial Yes | Publication bias considered within GRADE domain (“other considerations”), but no clear formal methods (e.g., funnel plots) consistently reported. |
16. Did the review authors report any potential sources of conflict of interest, including any funding they received for conducting the review? | Noncritical | Yes | Funding sources and institutional affiliations of the review authors are reported. |
AMSTAR 2 = A MeaSurement Tool to Assess systematic Reviews 2; GRADE = Grading of Recommendations Assessment, Development and Evaluation; RCT = randomized controlled trial; RoB = risk of bias; ROBINS-I = Risk of Bias In Non-Randomized Studies of Interventions.
Appendix 5: Main Study Findings
Please note that this appendix has not been copy-edited.
Table 8: Summary of Findings by Outcome and Comparator — Knee Osteoarthritis; Dextrose Prolotherapy vs. Placebo
Citation | Evidence source, number of participants (intervention vs. comparator) | Comparator, outcome measure | Baseline, mean (SD) | Follow-up, mean (SD) | Relative effect, mean difference (95% CI) | P value (between groups) | ||
|---|---|---|---|---|---|---|---|---|
Intervention | Comparator | Intervention | Comparator | |||||
Pain-related functioning | ||||||||
Ewart et al. (2024)22 | 1 RCT; Hsieh et al. (2022) 52 vs. 52 participants | Normal saline WOMAC physical function (1 week, 1, 3, 6 months)a | 523.5 (318.1) | 513.5 (326.8) | 1 week: 512.8 (303.9) 1 month: 491.9 (287.2) 3 months: 415.6 (299.6) 6 months: 529.8 (292.7) | 1 week: 500.8 (330.0) 1 month: 495.8 (295.5) 3 months: 434.3 (301.2) 6 months: 540.9 (298.2) | 1 week: 12.0 (NR) 1 month: −3.9 (NR) 3 months: −18.7 (NR) 6 months: −11.1 (NR) | NR |
Ewart et al. (2024)22 | 1 RCT; Sert et al. (2020) 22 vs. 22 participants | Normal saline WOMAC Total (6, 18 weeks)a | 68.7 (11.4) | 69.2 (17.6) | 6 weeks: 44.4 (11.5) 18 weeks: 32.7 (11.6) | 6 weeks: 50.5 (16.7) 18 weeks: 46.7 (13.5) | 6 weeks: −6.1 (NR) 18 weeks: −14.0 (NR) | 6 weeks: 0.118 18 weeks: 0.002 |
Ewart et al. (2024)22 | 1 RCT; Sit et al. (2020) 38 vs. 38 participants | Normal saline WOMAC Total (16, 26, 52 weeks)a | 49.1 (21.8) | 45.6 (21.2) | 16 weeks: 30.4 (NR) 26 weeks: 28.8 (NR) 52 weeks: 28.3 (NR) | 16 weeks: 32.4 (NR) 26 weeks: 33.3 (NR) 52 weeks: 36.0 (NR) | 16 weeks: −4.33 (−12.27 to 3.62) 26 weeks: −7.34 (−15.28 to 0.61) 52 weeks: −9.65 (−17.77 to −1.53) | 16 weeks: 0.285 26 weeks: 0.285 52 weeks: 0.020 |
Ewart et al. (2024)22 | 1 RCT; Rabago et al. (2013a) 33 vs. 31 participants | Normal saline Modified WOMAC Total (5, 9, 12, 24, 52 weeks) | 63.1 (15.0) | 62.7 (14.3) | 5 weeks: 71.2 (NR) 9 weeks: 77.1 (NR) 12 weeks: 76.5 (NR) 24 weeks: 79.1 (NR) 52 weeks: 78.6 (NR) | 5 weeks: 68.2 (NR) 9 weeks: 70.0 (NR) 12 weeks: 70.9 (NR) 24 weeks: 71.0 (NR) 52 weeks: 70.5 (NR) | 5 weeks: 3.0 (NR) 9 weeks: 7.1 (NR) 12 weeks: 5.6 (NR) 24 weeks: 8.1 (NR) 52 weeks: 8.0 (NR) | NR |
Physical performance | ||||||||
Ewart et al. (2024)22 | 1 RCT; Hsieh et al. (2022) 52 vs. 52 participants | Normal saline Regular Walking Speed, m/s, Chair Stand Test (1 week, 1, 3, 6 months) | Regular Walking Speed: 0.89 (0.32) | 0.92 (0.37) | 1 week: 0.94 (0.27) 1 month: 0.98 (0.37) 3 months: 0.99 (0.46) 6 months: 0.95 (0.42) | 1 week: 0.95 (0.38) 1 month: 1.0 (0.40) 3 months: 0.98 (0.39) 6 months: 0.94 (0.38) | 1 week: 0.0 (NR) 1 month: 0.0 (NR) 3 months: 0.0 (NR) 6 months: 0.0 (NR) | 1 week: 0.005 1 month: 0.340 3 months: 0.001 6 months: < 0.001 |
Ewart et al. (2024)22 | 1 RCT; Hsieh et al. (2022) 52 vs. 52 participants | Normal saline Regular Walking Speed, m/s, Chair Stand Test (1 week, 1, 3, 6 months) | Chair Stand Test: 20.5 (12.6) | 21.4 (12.4) | 1 week: 19.0 (10.5) 1 month: 18.0 (11.1) 3 months: 18.1 (10.6) 6 months: 19.2 (12.5) | 1 week: 21.0 (11.5) 1 month: 19.4 (10.3) 3 months: 18.7 (11.3) 6 months: 19.5 (11.0) | 1 week: −2.0 (NR) 1 month: −1.4 (NR) 3 months: −0.6 (NR) 6 months: −0.3 (NR) | 1 week: < 0.001 1 month: NR 3 months: NR 6 months: NR |
Ewart et al. (2024)22 | 1 RCT; Reeves et al. (2000) Total participants randomized: 77 (68 analyzed) but n per arm NR | Saline (with 0.075% lidocaine 9 mL) Flexion range (6 months) | 112.4 (19.5) | 117.8 (11.3) | 125.6 (8.6) | 125.4 (7.5) | 0.2 (NR) | NR |
Ewart et al. (2024)22 | 1 RCT; Sit et al. (2020) 38 vs. 38 participants | Normal saline TUG (16, 26, 52 weeks)a | 12.6 (7.1) | 12.5 (4.3) | 16 weeks: 10.9 (NR) 26 weeks: 10.1 (NR) 52 weeks: 9.9 (NR) | 16 weeks: 11.9 (NR) 26 weeks: 11.7 (NR) 52 weeks: 10.2 (NR) | 16 weeks: −1.13 (−2.74 to 0.49) 26 weeks: −1.73, (−3.34 to −0.12) 52 weeks: −0.3 (−2.38 to 0.92) | 16 weeks: 0.170 26 weeks: < 0.05 52 weeks: 0.385 |
Pain intensity or severity | ||||||||
Ewart et al. (2024)22 | 1 RCT; Hsieh et al. (2022) 52 vs. 52 participants | Normal saline WOMAC Pain (1 week, 1, 3, 6 months) | 230.8 (97.9) | 216.9 (89.4) | 1 week: 214.7 (85.1) 1 month: 194.7 (94.4) 3 months: 186.6 (92.1) 6 months: 180.3 (77.9) | 1 week: 205.8 (95.9) 1 month: 192.4 (76.9) 3 months: 200.6 (93.4) 6 months: 199.6 (91.9) | 1 week: 8.9 (NR) 1 month: 2.3 (NR) 3 months: −14.0 (NR) 6 months: −19.3 (NR) | NR |
Ewart et al. (2024)22 | 1 RCT; Sit et al. (2020) 38 vs. 38 participants | Normal saline VAS (16, 26, 52 weeks) | 63.1 (21.2) | 60.1 (19.2) | 16 weeks: 41.63 (NR) 26 weeks: 33.65 (NR) 52 weeks: 35.78 (NR) | 16 weeks: 44.48 (NR) 26 weeks: 38.92 (NR) 52 weeks: 46.05 (NR) | 16 weeks: −3.70 (−13.83 to 6.43) 26 weeks: −6.73 (−16.86 to 3.40) 52 weeks: −10.98 (−21.36 to 0.61) | 16 weeks: 0.473 26 weeks: 0.192 52 weeks: 0.038 |
Ewart et al. (2024)22 | 1 RCT; Sert et al. (2020) 22 vs. 22 participants | Normal saline VAS pain activity (6, 18 weeks) | 7.2 (1.0) | 7.4 (2.0) | 6 weeks: 4.1 (1.8) 18 weeks: 1.1 (1.9) | 6 weeks: 4.9 (2.2) 18 weeks: 4.6 (1.8) | 6 weeks: −0.8 (NR) 18 weeks: −3.5 (NR) | 6 weeks: NR 18 weeks: < 0.001 |
Ewart et al. (2024)22 | 1 RCT; Rabago et al. (2013a) 33 vs. 31 participants | Waitlist PRTEE pain domain (4, 8, 16, 32 weeks) | 24.2 (2.7) | 24.8 (2.6) | 4 weeks: 16.2 (2.6) 8 weeks: 15.5 (3.0) 16 weeks: 13.6 (3.6) 32 weeks: 11.1 (3.3) | 4 weeks: 22.4 (2.5) 8 weeks: 23.2 (2.9) 16 weeks: 20.9 (3.5) 32 weeks: NR (3.3) | 4 weeks: −6.2 (NR) 8 weeks: −7.7 (NR) 16 weeks: −7.3 (NR) 32 weeks: NR | 4 weeks: ≥ 0.05 8 weeks: ≥ 0.05 16 weeks: ≥ 0.05 32 weeks: NR |
Ewart et al. (2024)22 | 1 RCT; Reeves et al. (2000) Total participants randomized: 77 (68 analyzed) but n per arm NR | Saline (with 0.075% lidocaine 9 mL) VAS pain with walking (6 months)a | 3.9 (2.8) | 3.8 (2.2) | 2.6 (2.0) | 2.9 (2.2) | −0.3 (NR) | NR |
Health-related quality of life | ||||||||
Ewart et al. (2024)22 | 1 RCT; Sit et al. (2020) 38 vs. 38 participants | Normal saline EuroQol-5D Index (26, 52 weeks) | 0.569 (0.295) | 0.558 (0.318) | 26 weeks: 0.73 (NR) 52 weeks: 0.72 (NR) | 26 weeks: 0.62 (NR) 52 weeks: 0.63 (NR) | 26 weeks: 0.10 (−0.004 to 0.21) 52 weeks: 0.08 (−0.02 to 0.19) | 26 weeks: 0.058 52 weeks: 0.126 |
Ewart et al. (2024)22 | 1 RCT; Sert et al. (2020) 22 vs. 22 participants | Normal saline SF-36 Physical score, SF-36 Mental score (6, 18 weeks) | Physical score: 34.1 (8.9) | 30.0 (7.4) | 6 weeks: 41.2 (8.9) 18 weeks: 48.5 (7.5) | 6 weeks: 37.0 (10.1) 18 weeks: 39.6 (8.5) | 6 weeks: 4.2 (NR) 18 weeks: 8.9 (NR) | 6 weeks: NR 18 weeks: 0.124 |
Ewart et al. (2024)22 | 1 RCT; Sert et al. (2020) 22 vs. 22 participants | Normal saline SF-36 Physical score, SF-36 Mental score (6, 18 weeks) | Mental score: 45.4 (10.9) | 46.6 (13.0) | 6 weeks: 52.7 (9.1) 18 weeks: 53.5 (6.8) | 6 weeks: 48.7 (11.9) 18 weeks: 52.0 (7.7) | 6 weeks: 4.0 (NR) 18 weeks: 1.5 (NR) | 6 weeks: NR 18 weeks: NR |
CI = confidence interval; EuroQoL-5D = European Quality of Life-5 dimensions; NR = not reported; PRTEE = Patient-rated Tennis Elbow Evaluation; RCT = randomized controlled trial; SD = standard deviation; SF-36 = Short Form (36) Health Survey; SMD = standardized mean difference; SR = systematic review; TUG = timed up and go; VAS = visual analogue scale; vs. = versus; WOMAC = Western Ontario and McMaster Universities Osteoarthritis Index.
aAdditional results related to this outcome measure are available in the original SR.22
Table 9: Summary of Findings by Outcome and Comparator — Knee Osteoarthritis; Dextrose Prolotherapy vs. Other Comparators
Citation | Evidence source, number of participants (intervention vs. comparator) | Comparator, outcome measure | Baseline, mean (SD) | Follow-up, mean (SD) | Relative effect, mean difference (95% CI) | P value (between groups) | ||
|---|---|---|---|---|---|---|---|---|
Intervention | Comparator | Intervention | Comparator | |||||
Pain-related functioning | ||||||||
Ewart et al. (2024)22 | SR with MA (3 RCTs) 91 vs. 91 participants | PRP WOMAC score (6 months) | NR | NR | NR | NR | SMD = 2.24 (−3.85 to 8.33) | NR |
Ewart et al. (2024)22 | SR with MA (3 RCTs) 81 vs. 79 participants | PT or home exercise program WOMAC score at short-term follow‑up (1 to 1.5 month) | NR | NR | NR | NR | SMD = −0.81 (−8.93 to 7.30) | NR |
Ewart et al. (2024)22 | SR with MA (3 RCTs) 81 vs. 79 participants | PT or home exercise program WOMAC score at medium-term follow-up (3 to 4 months) | NR | NR | NR | NR | SMD = −1.13 (−15.68 to 13.41) | NR |
Ewart et al. (2024)22 | 1 RCT; Dumais et al. (2012) 21 vs. 24 participants | Home exercise program WOMAC Total (16 weeks)a | 44.4 (13.7) | 36.2 (16.8) | NR | NR | NR | 0.002 |
Ewart et al. (2024)22 | 1 RCT; Baygutalp et al. (2021) 25 vs. 25 participants | 2 comparators:
WOMAC Total (6, 12 weeks)a | 55.9 (17.0) | Ozone with home exercise: 58.0 (9.5) | NR | Ozone with home exercise: NR | Ozone with home exercise: NR | Ozone with home exercise:
|
Ewart et al. (2024)22 | 1 RCT; Baygutalp et al. (2021) 25 vs. 25 participants | 2 comparators:
WOMAC Total (6, 12 weeks)a | 55.9 (17.0) | Home exercise only: 57.6 (21.5) | NR | Home exercise only: NR | Home exercise only: NR | Home exercise only:
|
Ewart et al. (2024)22 | 1 RCT; Hashemi et al. (2015) 40 vs. 40 participants | Ozone 5 to 7 mL WOMAC Total (3 months) | 58.5 (13.3) | 56.3 (11.5) | 83.7 (15.3) | 81.6 (13.7) | 2.1 (NR) | 0.173 |
Ewart et al. (2024)22 | 1 RCT; Waluyo et al. (2021) 44 vs. 32 participants | Intra-articular HA, 10 mg WOMAC Total (12 weeks)a | 36.08 (10.06) | 24.81 (17.25) | 19.15 (12.04) | 15.86 (14.78) | 3.3 (NR) | 0.801 |
Ewart et al. (2024)22 | 1 RCT; Hosseini et al. (2019) 52 vs. 52 participants | Intra-articular HA 2.5 mL Modified WOMAC Total (3 months) | 52.7 (9.8) | 55.9 (10.4) | 83.7 (12.7) | 88.5 (15.6) | −4.8 (NR) | 0.001 |
Ewart et al. (2024)22 | 1 RCT; Babaeian et al. (2022) 28 vs. 26 participants | Hypertonic 2.5% saline 6 mL
| WOMAC Total: 0.52 (0.1) | 0.6 (0.14) | 2 weeks: 0.5 (0.11) 4 weeks: 0.5 (0.12) | 2 weeks: 0.47 (0.14) 4 weeks: 0.47 (0.16) | 2 weeks: 0.0 (NR) 4 weeks: 0.0 (NR) | NR |
Ewart et al. (2024)22 | 1 RCT; Babaeian et al. (2022) 28 vs. 26 participants | Hypertonic 2.5% saline 6 mL
OKS (2, 4 weeks)a | OKS: 20.3 (7.6) | 19.2 (6.5) | 2 weeks: 21.1 (7.8) 4 weeks: 21.5 (7.8) | 2 weeks: 21.6 (6.6) 4 weeks: 24.5 (7.2) | 2 weeks: −0.5 (NR) 4 weeks: −3.0 (NR) | NR |
Ewart et al. (2024)22 | 1 RCT; Bayat et al. (2023) 28 vs. 28 participants | Corticosteroid injections (Triamcinolone 40 mg [with 0.5% lidocaine]) WOMAC Total (1, 3 months)a | 43.0 (6.3) | 41.8 (7.9) | 1 month: NR 3 months: NR | 1 month: NR 3 months: NR | 1 month: 2.02 (−1.5 to 5.6) 3 months: −9.64 (−12.0 to −6.2) | 1 month: 0.262 3 months: < 0.001 |
Ewart et al. (2024)22 | 1 RCT; Rezasoltani et al. (2020) 30 vs. 30 participants | 3 comparators (all with home exercise):
KOOS ADL (3 months)a | 39.6 (14.1) | PT: 34.7 (12.9) | NR | PT: NR | PT: NR | PT: NR |
Ewart et al. (2024)22 | 1 RCT; Rezasoltani et al. (2020) 30 vs. 30 participants | 3 comparators (all with home exercise):
KOOS ADL (3 months)a | 39.6 (14.1) | Botulinum neurotoxin: 36.8 (10.0) | NR | Botulinum neurotoxin: NR | Botulinum neurotoxin: NR | Botulinum neurotoxin: NR |
Ewart et al. (2024)22 | 1 RCT; Rezasoltani et al. (2020) 30 vs. 30 participants | 3 comparators (all with home exercise):
KOOS ADL (3 months)a | 39.6 (14.1) | HA: 33.7 (13.6) | NR | HA: NR | HA: NR | HA: NR |
Physical performance | ||||||||
Ewart et al. (2024)22 | 1 RCT; Dumais et al. (2012) 21 vs. 24 participants | Home exercise program only TUG (16 weeks) | NR | NR | NR | NR | NR | 0. 89 |
Ewart et al. (2024)22 | 1 RCT; Baygutalp et al. (2021) 25 vs. 25 participants | 2 comparators:
TUG, ROM Active (6, 12 weeks)a | Physical performance TUG 11.8 (2.3) | Ozone with home exercise 13.8 (2.6) | NR | Ozone with home exercise: NR | Ozone with home exercise: NR | Ozone with home exercise:
|
Ewart et al. (2024)22 | 1 RCT; Baygutalp et al. (2021) 25 vs. 25 participants | 2 comparators:
TUG, ROM Active (6, 12 weeks)a | Physical performance TUG 11.8 (2.3) | Home exercise only 12.6 (2.9) | NR | Home exercise only: NR | Home exercise only: NR | Home exercise only:
|
Ewart et al. (2024)22 | 1 RCT; Baygutalp et al. (2021) 25 vs. 25 participants | 2 comparators:
TUG, ROM Active (6, 12 weeks)a | Physical performance ROM 126.0 (13.8) | Ozone with home exercise 125.8 | NR | Ozone with home exercise: NR | Ozone with home exercise: NR | Ozone with home exercise
|
Ewart et al. (2024)22 | 1 RCT; Baygutalp et al. (2021) 25 vs. 25 participants | 2 comparators:
TUG, ROM Active (6, 12 weeks)a | Physical performance ROM 126.0 (13.8) | Home exercise only 129.8 (10.6) | NR | Home exercise only: NR | Home exercise only: NR | Home exercise only:
|
Ewart et al. (2024)22 | 1 RCT; Rahimzadeh et al. (2014) 26 vs. 20/24 participants | 2 comparators:
ROM (2, 4, 12 weeks) | 101.0 (1.4) | Erythropoietin 98.1 (1.6) | 2 weeks: 106.0 (1.4) 4 weeks: 110.0 (1.3) 12 weeks: 113.0 (2.2) | Erythropoietin:
| Erythropoietin:
| Erythropoietin: NR |
Ewart et al. (2024)22 | 1 RCT; Rahimzadeh et al. (2014) 26 vs. 20/24 participants | 2 comparators:
ROM (2, 4, 12 weeks) | 101.0 (1.4) | Pulsed radio frequency 95.0 (2.0) | 2 weeks: 106.0 (1.4) 4 weeks: 110.0 (1.3) 12 weeks: 113.0 (2.2) | Pulsed radio frequency:
| Pulsed radio frequency:
| Pulsed radio frequency: NR |
Pain intensity or severity | ||||||||
Ewart et al. (2024)22 | SR with MA (3 RCTs) 81 vs. 79 participants | PT or home exercise program VAS at short-term follow-up (1 to 1.5 month) | NR | NR | NR | NR | SMD = −0.76 (−1.59 to 0.07) | NR |
Ewart et al. (2024)22 | SR with MA (3 RCTs) 81 vs. 79 participants | PT or home exercise program VAS at medium-term follow-up (3 to 4 months) | NR | NR | NR | NR | SMD = −1.42 (−2.19 to −0.65) | NR |
Ewart et al. (2024)22 | 1 RCT; Babaeian et al. (2022) 28 vs. 26 participants | Hypertonic 2.5% saline 6 mL VAS (2, 4 weeks) | 77.5 (19.8) | 83.2 (14.6) | 2 weeks: 71.0 (20.4) 4 weeks: 68.2 (19.9) | 2 weeks: 75.5 (18.9) 4 weeks: 70.0 (18.5) | 2 weeks: −4.5 4 weeks: −1.8 | 2 weeks: NR 4 weeks: NR |
Ewart et al. (2024)22 | 1 RCT; Waluyo et al. (2021) 44 vs. 32 participants | Intra-articular HA, 10 mg NRS (12 weeks) | 4.85 (1.71) | 3.48 (1.53) | 1.46 (1.3) | 1.86 (1.52) | −0.4 (NR) | 0.042 |
Ewart et al. (2024)22 | 1 RCT; Rezasoltani et al. (2020) 30 vs. 30 participants | 3 comparators (all with home exercise):
VAS (1 week, 1, 3 months)a | 6.5 (1.3) | PT: 7.2 (1.1) | 1 week: 2.8 (NR) 1 month: 2.8 (NR) 3 months: 2.5 (NR) | PT:
| PT:
| PT:
|
Ewart et al. (2024)22 | 1 RCT; Rezasoltani et al. (2020) 30 vs. 30 participants | 3 comparators (all with home exercise):
VAS (1 week, 1, 3 months)a | 6.5 (1.3) | Botulinum neurotoxin: 6.6 (1.6) | 1 week: 2.8 (NR) 1 month: 2.8 (NR) 3 months: 2.5 (NR) | Botulinum neurotoxin:
| Botulinum neurotoxin:
| Botulinum neurotoxin:
|
Ewart et al. (2024)22 | 1 RCT; Rezasoltani et al. (2020) 30 vs. 30 participants | 3 comparators (all with home exercise):
VAS (1 week, 1, 3 months)a | 6.5 (1.3) | HA: 6.7 (0.7) | 1 week: 2.8 (NR) 1 month: 2.8 (NR) 3 months: 2.5 (NR) | HA:
| HA:
| HA:
|
Ewart et al. (2024)22 | 1 RCT; Rahimzadeh et al. (2014) 26 vs. 20/24 participants | 2 comparators:
VAS (2, 4, 12 weeks) | 7.1 (1.0) | Erythropoietin: 6.7 (1.0) | 2 weeks: 4.5 (1.4) 4 weeks: 4.7 (1.4) 12 weeks: 5.5 (1.6) | Erythropoietin:
| Erythropoietin:
| Erythropoietin: NR |
Ewart et al. (2024)22 | 1 RCT; Rahimzadeh et al. (2014) 26 vs. 20/24 participants | 2 comparators:
VAS (2, 4, 12 weeks) | 7.1 (1.0) | Pulsed radiofrequency waves: 7.1 (1.4) | 2 weeks: 4.5 (1.4) 4 weeks: 4.7 (1.4) 12 weeks: 5.5 (1.6) | Pulsed radiofrequency waves:
| Pulsed radiofrequency waves:
| Pulsed radiofrequency waves: NR |
Health-related quality of life | ||||||||
Ewart et al. (2024)22 | 1 RCT; Ozturk et al. (2023) 31 vs. 32 participants | Hot packs + home exercise program SF-36 Physical Score, SF-36 Mental score (12 weeks) | NR | Physical: NR | NR | NR | NR | NR |
Ewart et al. (2024)22 | 1 RCT; Ozturk et al. (2023) 31 vs. 32 participants | Hot packs + home exercise program SF-36 Physical Score, SF-36 Mental score (12 weeks) | NR | Mental: NR | NR | NR | NR | NR |
Ewart et al. (2024)22 | 1 RCT; Sert et al. (2020) 22 vs. 22 participants | Home exercise SF-36 Physical score, SF-36 Mental score (6, 18 weeks) | 45.4 (10.9) | Physical: 35.0 (9.3) | 6 weeks: 52.7 (9.1) 18 weeks: 53.5 (6.8) | 6 weeks: 41.2 (10.4) 18 weeks: 41.1 (11.7) | 6 weeks: 0.0 18 weeks: 7.4 | 6 weeks: NR 18 weeks: 0.016 |
Ewart et al. (2024)22 | 1 RCT; Sert et al. (2020) 22 vs. 22 participants | Home exercise SF-36 Physical score, SF-36 Mental score (6, 18 weeks) | 45.4 (10.9) | Mental: 44.1 (8.7) | 6 weeks: 52.7 (9.1) 18 weeks: 53.5 (6.8) | 6 weeks: 45.9 (10.0) 18 weeks: 49.6 (10.9) | 6 weeks: 6.8 18 weeks: 3.9 | 6 weeks: NR 18 weeks: NR |
ADL = Activities of Daily Living; CI = confidence interval; HA = hyaluronic acid; KOOS = Knee Injury and Osteoarthritis Outcome Score; MA = meta-analysis; NR = not reported; NRS = numerical rating scale; OKS = Oxford Knee Score; PRP = Platelet-Rich Plasma; PT = physical therapy; RCT = randomized controlled trial; ROM = range of motion; SD = standard deviation; SF-36 = Short Form (36) Health Survey; SMD = standardized mean difference; SR = systematic review; TENS = transcutaneous electrical nerve stimulation; TUG = timed up and go; VAS = visual analogue scale; vs. = versus; WOMAC = Western Ontario and McMaster Universities Arthritis Index.
aAdditional results related to this outcome measure are available in the original SR.22
Table 10: Summary of Findings by Outcome and Comparator — Plantar Fasciitis; Dextrose Prolotherapy vs. Placebo
Citation | Evidence source, number of participants (intervention vs. comparator) | Comparator, outcome measure | Baseline, mean (SD) | Follow-up, mean (SD) | Relative effect, mean difference (95% CI) | P value (between groups) | ||
|---|---|---|---|---|---|---|---|---|
Intervention | Comparator | Intervention | Comparator | |||||
Pain-related functioning | ||||||||
Ewart et al. (2024)22 | 1 RCT; Mansiz-Kaplan et al. (2020) 32 vs. 33 participants | Normal saline Modified FFI‑Total (7, 15 weeks)a | 202 (32.4) | 190 (38.6) | 7 weeks: 20.1 (28.9) 15 weeks: 14.4 (23.1) | 7 weeks: 113.4 (50.8) 15 weeks: 118.9 (47.6) | 7 weeks: −93.3 (NR) 15 weeks: −104.5 (NR) | 7 weeks: < 0.001 15 weeks: < 0.001 |
Ewart et al. (2024)22 | 1 RCT; Umay Altas et al. (2018) 15 vs. 15 participants | Normal saline FFI-Total (3 months)a | NR | NR | NR | NR | Median change (range) = 34.7 (23.2 to 45.3) | 0.001 |
Pain intensity or severity | ||||||||
Ewart et al. (2024)22 | 1 RCT; Mansiz-Kaplan et al. (2020) 32 vs. 33 participants | Normal saline VAS during activity (7, 15 weeks)a | NR | NR | NR | NR | NR | NR |
Ewart et al. (2024)22 | 1 RCT; Umay Altas et al. (2018) 15 vs. 15 participants | Normal saline VAS (3 months) | Median (range): 8.0 (5.0 to10.0) | Median (range): 6.0 (4.0 to 9.0) | NR | NR | NR | NR |
CI = confidence interval; FFI = foot function index; NR = not reported; RCT = randomized controlled trial; SD = standard deviation; SR = systematic review; VAS = visual analogue scale; vs. = versus.
aAdditional results related to this outcome measure are available in the original SR.22
Table 11: Summary of Findings by Outcome and Comparator — Plantar Fasciitis; Dextrose Prolotherapy vs. Other Comparators
Citation | Evidence source, number of participants (intervention vs. comparator) | Comparator, outcome measure | Baseline, mean (SD) | Follow-up, mean (SD) | Relative effect, mean difference (95% CI) | P value (between groups) | ||
|---|---|---|---|---|---|---|---|---|
Intervention | Comparator | Intervention | Comparator | |||||
Pain-related functioning | ||||||||
Qafesha et al. (2026)24 | SR with MA (1 RCTs, 1 non‑RCT) 45 vs. 45 participants | Corticosteroid injections Walking VAS change (0.5 month) | NR | NR | NR | NR | 1.85 (0.68 to 3.02) | 0.002 |
Qafesha et al. (2026)24 | SR with MA (1 RCTs, 1 non‑RCT) 45 vs. 45 participants | Corticosteroid injections Walking VAS change (3 months) | NR | NR | NR | NR | −0.44 (−0.96 to 0.08) | 0.10 |
Ewart et al. (2024)22 | 1 RCT; Asheghan et al. (2021) 31 vs. 31 participants | ESWT, 2,000 shocks (2 bars pressure, 10 Hz) to heel FAAM-ADL (6, 12 weeks) FAAM-Sport (6, 12 weeks) | FAAM-ADL: 72.4 (12.8) | 74.2 (10.2) | 6 weeks: 87.5 (8.7) 12 weeks: 90.0 (8.9) | 6 weeks: 88.3 (7.2) 12 weeks: 91.3 (6.8) | 6 weeks: −0.8 (NR) 12 weeks: −1.3 (NR) | NR |
Ewart et al. (2024)22 | 1 RCT; Asheghan et al. (2021) 31 vs. 31 participants | ESWT, 2,000 shocks (2 bars pressure, 10 Hz) to heel FAAM-ADL (6, 12 weeks) FAAM-Sport (6, 12 weeks) | FAAM-Sport: 70.1 (11.8) | 72.6 (12.3) | 6 weeks: 83.3 (10.8) 12 weeks: 85.8 (9.3) | 6 weeks: 88.7 (11.1) 12 weeks: 92.3 (10.2) | 6 weeks: −5.4 (NR) 12 weeks: −6.5 (NR) | NR |
Ewart et al. (2024)22 | 1 RCT; Kesikburun et al. (2022) 14 vs. 15 participants | ESWT, 1,800 to 2,000 shocks (0.20 to 0.30 mJ/mm2, 4 to 6 Hz) to heel and 3,000 to 3,500 shocks (1.8 to 3.0 bars pressure, 15 to 21 Hz) to foot muscles FFI (6, 12 weeks) | 70.5 (15.4) | 62.7 (12.2) | 6 weeks: 43.6 (32.9) 12 weeks: 29.3 (27.7) | 6 weeks: 42.1 (21.5) 12 weeks: 27.4 (25.8) | 6 weeks: 1.5 (NR) 12 weeks: 1.9 (NR) | NR |
Ewart et al. (2024)22 | 1 RCT; Ersen et al. (2018) 29 vs. 31 participants | PT and home exercises FFI-Total (21, 42, 90, 360 days)a | 57.7 (13.6) | 56.9 (12.8) | 21 days: 52.7 (15.3) 42 days: 38.6 (15.8) 90 days: 31.1 (17.0) 360 days: 26.0 (20.3) | 21 days: 53.9 (14.0) 42 days: 51.3 (16.9) 90 days: 47.8 (20.7) 360 days: 34.3 (25.2) | 21 days: 53.9 (14.0) 42 days: 51.3 (16.9) 90 days: 47.8 (20.7) 360 days: 34.3 (25.2) | 21 days: 0.235 42 days: < 0.001 90 days: < 0.001 360 days: 0.113 |
Ewart et al. (2024)22 | 1 RCT; Karakilic et al. (2003) Participants NR | Phonophoresis, 1.5W/cm2 1 MHz FFI-Total (1, 3 months)a | 61.8 (9.1) | 63.0 (9.0) | 1 month: 27.0 (20.7) 3 months: 27.9 (21.8) | 1 month: 27.9 (20.6) 3 months: 35.5 (25.2) | 1 month: −0.9 (NR) 3 months: −7.6 (NR) | NR |
Ewart et al. (2024)22 | 1 RCT; Kim et al. (2014) 11 vs. 10 participants | PRP approximately 2 mL, ultrasound guided FFI-Total (10, 28 weeks)a | 132.5 (31.1) | 151.5 (37.9) | 10 weeks: 123.7 (47.4) 28 weeks: 97.7 (52.5) | 10 weeks: 123.8 (45.4) 28 weeks: 81.6 (55.3) | 10 weeks: −0.1 (NR) 28 weeks: 16.1 (NR) | 10 weeks: 0.88 28 weeks: 0.60 |
Physical performance | ||||||||
Qafesha et al. (2026)24 | SR with MA (4 RCTs) 128 vs. 126 participants | Corticosteroid injections FFI change (1 month) | NR | NR | NR | NR | 18.81 (0.06 to 37.55) | 0.05 |
Qafesha et al. (2026)24 | SR with MA (4 RCTs, 1 non-RCT) 128 vs. 126 participants | Corticosteroid injections FFI change (3 months) | NR | NR | NR | NR | - 5.47 (−9.03 to −1.92) | 0.003 |
Pain intensity or severity | ||||||||
Qafesha et al. (2026)24 | SR with MA (3 RCTs) 88 vs. 86 participants | Corticosteroid injectionsb General VAS score change (1 month) | NR | NR | NR | NR | 1.85 (0.05 to 3.64) | 0.04 |
Qafesha et al. (2026)24 | SR with MA (3 RCTs, 1 non-RCT) 118 vs. 116 participants | Corticosteroid injectionsb General VAS score change (3 months) | NR | NR | NR | NR | - 0.20 (−1.17 to 0.77) | 0.68 |
Qafesha et al. (2026)24 | SR with MA (2 RCTs, 1 non‑RCT) 45 vs. 45 participants | Corticosteroid injections Morning VAS score change (0.5 to 1 month) | NR | NR | NR | NR | 1.26 (0.49 to 2.02) | 0.001 |
Qafesha et al. (2026)24 | SR with MA (2 RCTs, 1 non‑RCT) 85 vs. 85 participants | Corticosteroid injections Morning VAS score change (3 months) | NR | NR | NR | NR | 0.10 (−0.29 to 0.50) | 0.61 |
Ewart et al. (2024)22 | 1 RCT; Asheghan et al. (2021) 31 vs. 31 participants | ESWT, 2,000 shocks (2 bars pressure, 10 Hz) to heel VAS (6, 12 weeks) | 74.7 (11.2) | 72.3 (13.2) | 6 weeks: 53.3 (10.1) 12 weeks: 44.2 (9.5) | 6 weeks: 56.6 (12.5) 12 weeks: 40.8 (10.3) | 6 weeks: −3.3 (NR) 12 weeks: 3.4 (NR) | 6 weeks: NR 12 weeks: NR |
Ewart et al. (2024)22 | 1 RCT; Kesikburun et al. (2022) 14 vs. 15 participants | ESWT, 1,800 to 2,000 shocks (0.20 to 0.30 mJ/mm2, 4 to 6 Hz) to heel and 3,000 to 3,500 shocks (1.8 to 3.0 bars pressure, 15 to 21 Hz) to foot muscles VAS (6, 12 weeks) | 80.9 (18.1) | 74.6 (14.8) | 6 weeks: 48.1 (37.9) 12 weeks: 34.0 (34.1) | 6 weeks: 48.9 (23.4) 12 weeks: 33.9 (32.2) | 6 weeks: −0.8 (NR) 12 weeks: 0.1 (NR) | 6 weeks: NR 12 weeks: NR |
Ewart et al. (2024)22 | 1 RCT; Ersen et al. (2018) 29 vs. 31 participants | PT and home exercises VAS (21, 42, 90, 360 days) | 6.9 (1.5) | 6.7 (1.4) | 21 days: 5.9 (1.9) 42 days: 4.3 (2.2) 90 days: 3.1 (2.4) 360 days: 2.4 (2.6) | 21 days: 6.0 (1.5) 42 days: 5.7 (2.1) 90 days: 5.0 (2.8) 360 days: 3.7 (3.0) | 21 days: −0.1 (NR) 42 days: −1.4 (NR) 90 days: −1.9 (NR) 360 days: −1.3 (NR) | 21 days: 0.319 42 days: 0.001 90 days: 0.002 360 days: 0.042 |
Health-related quality of life | ||||||||
Ewart et al. (2024)22 | 1 RCT; Karakilic et al. (2003) Participants NR | Phonophoresis, 1.5W/cm2 1 MHz QoL SF-36 General Health (1, 3 months)a | 41.0 (16.3) | 36.0 (15.1) | 1 month: 56.7 (15.9) 3 months: 56.9 (17.2) | 1 month: 48.0 (15.2) 3 months: 44.9 (15.5) | 1 month: 8.7 (NR) 3 months: 12.0 (NR) | NR |
CI = confidence interval; ESWT = extracorporeal shock wave therapy; FAAM = Foot and Ankle Ability Measure; FAOS = Foot and Ankle Outcome Score; FFI = foot function index; MA = meta-analysis; NR = not reported; PRP = Platelet-Rich Plasma; PT = physical therapy; QoL = quality of life; RCT = randomized controlled trial; SD = standard deviation; SF-36 = Short Form (36) Health Survey; SMD = standardized mean difference; SR = systematic review; VAS = visual analogue scale; vs. = versus.
aAdditional results related to this outcome measure are available in the original SR.22
bSubgroup analysis separating studies based on their injection guidance method [ultrasound‐guided studies (2 studies) and palpation‐guided studies (2 studies)] is also available for these outcomes in this publication.24
Table 12: Summary of Findings by Outcome and Comparator — Shoulder Pain (Mixed Rotator Cuff Pathology and Subacromial Bursitis); Dextrose Prolotherapy vs. Placebo
Citation | Evidence source, number of participants (intervention vs. comparator) | Comparator, outcome measure | Baseline, mean (SD) | Follow-up, mean (SD) | Relative effect, mean difference (95% CI) | P value (between groups) | ||
|---|---|---|---|---|---|---|---|---|
Intervention | Comparator | Intervention | Comparator | |||||
Pain-related functioning | ||||||||
Ewart et al. (2024)22 | SR with MA (3 RCTs) 74 vs. 75 participants | Normal saline DASH, SPADI, ASES or WORC scores at short-term follow-up (3 to 6 weeks) | NR | NR | NR | NR | SMD = - 0.29 (−1.15 to 0.57) | NR |
Ewart et al. (2024)22 | SR with MA (3 RCTs) 74 vs. 75 participants | Normal saline DASH, SPADI, ASES or WORC scores at medium-term follow-up (3 months) | NR | NR | NR | NR | SMD = - 0.30 (−1.01 to 0.41) | NR |
Physical performance | ||||||||
Ewart et al. (2024)22 | 1 RCT; Chang et al. (2021) 25 vs. 25 participants | Normal saline ROM: Forward Flexion, Abduction (1 week, 1, 3 months) | Flexion: 146.8 (23.04) | 144.60 (25.66) | 1 week: 160.8 (17.0) 1 month: 163.6 (14.2) 3 months: 168.8 (11.8) | 1 week: 150.2 (24.0) 1 month: 157.0 (20.2) 3 months: 160.2 (22.80) | 1 week: 10.6 (NR) 1 month: 6.6 (NR) 3 months: 8.6 (NR) | NR |
Ewart et al. (2024)22 | 1 RCT; Chang et al. (2021) 25 vs. 25 participants | Normal saline ROM: Forward Flexion, Abduction (1 week, 1, 3 months) | Adduction: 117.4 (23.04) | 115.60 (27.20) | 1 week: 138.4 (32.2) 1 month: 138.6 (31.5) 3 months: 153.0 (29.5) | 1 week: 127.8 (31.3) 1 month: 137.6 (30.7) 3 months: 144.0 (31.3) | 1 week: 10.6 (NR) 1 month: 1.0 (NR) 3 months: 9 (NR) | NR |
Ewart et al. (2024)22 | 1 RCT; Sam et al. (2023) 26 vs. 25 participants | Normal saline ROM: Forward Flexion, Abduction, Adduction, External Rotation, Internal Rotation (12 weeks) | Flexion: 129.60 (16.10) | 123.87 (19.64) | 151.05 (29.70) | 140.75 (31.47) | 10.3 (NR) | 0.31 |
Ewart et al. (2024)22 | 1 RCT; Sam et al. (2023) 26 vs. 25 participants | Normal saline ROM: Forward Flexion, Abduction, Adduction, External Rotation, Internal Rotation (12 weeks) | Extension: 45.92 (16.10) | 44.75 (18.99) | 53.16 (11.81) | 47.75 (10.57) | 5.41 (NR) | 0.13 |
Ewart et al. (2024)22 | 1 RCT; Sam et al. (2023) 26 vs. 25 participants | Normal saline ROM: Forward Flexion, Abduction, Adduction, External Rotation, Internal Rotation (12 weeks) | Abduction: 125.00 (16.10) | 117.13 (24.00) | 153.68 (26.71) | 140.50 (32.96) | 13.18 (NR) | 0.25 |
Ewart et al. (2024)22 | 1 RCT; Sam et al. (2023) 26 vs. 25 participants | Normal saline ROM: Forward Flexion, Abduction, Adduction, External Rotation, Internal Rotation (12 weeks) | Adduction: 47.63 (16.10) | 49.50 (22.09) | 57.37 (10.46) | 56.00 (7.71) | 1.37 (NR) | 0.87 |
Ewart et al. (2024)22 | 1 RCT; Sam et al. (2023) 26 vs. 25 participants | Normal saline ROM: Forward Flexion, Abduction, Adduction, External Rotation, Internal Rotation (12 weeks) | External rotation: 43.68 (16.10) | 46.75 (26.03) | 66.58 (21.67) | 55.00 (22.77) | 11.58 (NR) | 0.11 |
Ewart et al. (2024)22 | 1 RCT; Sam et al. (2023) 26 vs. 25 participants | Normal saline ROM: Forward Flexion, Abduction, Adduction, External Rotation, Internal Rotation (12 weeks) | Internal rotation: 61.05 (16.10) | 53.13 (25.34) | 75.00 (12.91) | 71.25 (14.13) | 3.75 (NR) | 0.42 |
Pain intensity or severity | ||||||||
Ewart et al. (2024)22 | SR with MA (3 RCTs) 74 vs. 75 participants | Normal saline VAS or NRS scores at short-term follow-up (3 to 6 weeks) | NR | NR | NR | NR | SMD = - 0.33 (−1.47 to 0.81) | NR |
Ewart et al. (2024)22 | SR with MA (3 RCTs) 74 vs. 75 participants | Normal saline VAS or NRS scores at medium-term follow-up (3 to 4 months) | NR | NR | NR | NR | SMD = - 0.62 (−3.18 to 1.94) | NR |
Ewart et al. (2024)22 | 1 RCT; Bertrand et al. (2016) 27 vs. 24/26 participants | 2 comparators, both with PT/home exercise:
VAS (3, 9 months) | 7.3 (0.4) | Normal Saline (same injection technique): 6.9 (0.5) | NR | Normal Saline (same injection technique): NR | Normal Saline (same injection technique): NR | Normal Saline (same injection technique): NR |
Ewart et al. (2024)22 | 1 RCT; Bertrand et al. (2016) 27 vs. 24/26 participants | 2 comparators, both with PT/home exercise:
VAS (3, 9 months) | 7.3 (0.4) | Normal Saline (superficial injection only): 6.9 (0.4) | NR | Normal Saline (superficial injection only): NR | Normal Saline (superficial injection only): NR | Normal Saline (superficial injection only): NR |
ASES = American Shoulder and Elbow Surgeons Standardized Shoulder Assessment; DASH = disability of the arm, shoulder, and hand; MA = meta-analysis; NR = not reported; NRS = numerical rating scale; PT = physical therapy; RCT = randomized controlled trial; ROM = range of motion; SPADI = shoulder pain and disability index; SMD = standardized mean difference; SR = systematic review; VAS = visual analogue scale; vs. = versus; WORC = Western Ontario Rotator Cuff Index.
Table 13: Summary of Findings by Outcome and Comparator — Shoulder Pain (Mixed Rotator Cuff Pathology and Subacromial Bursitis); Dextrose Prolotherapy vs. Other Comparators
Citation | Evidence source, number of participants (intervention vs. comparator) | Comparator, outcome measure | Baseline, mean (SD) | Follow-up, mean (SD) | Relative effect, mean difference (95% CI) | P value (between groups) | ||
|---|---|---|---|---|---|---|---|---|
Intervention | Comparator | Intervention | Comparator | |||||
Pain-related functioning | ||||||||
Thamrongskulsiri et al. (2025)26 | 1 retrospective case-control study; Lee et al. (2015) 57 vs. 53 participants | Active control Both groups received PT (regular exercise education by physical therapists) SPADI (12 months) | NR | NR | 43.8 (11.6) | 51.1 (14.4) | −7.30 (−12.21 to −2.39) | NR |
Ewart et al. (2024)22 | SR with MA (3 RCTs) 75 vs. 72 participants | Corticosteroid injection SPADI or ASES and WORC scores at short-term follow-up (3 to 6 weeks) | NR | NR | NR | NR | SMD = 0.86 (−0.32 to 2.04) | NR |
Ewart et al. (2024)22 | SR with MA (3 RCTs) 75 vs. 72 participants | Corticosteroid injection SPADI or ASES and WORC scores at medium-term follow-up (12 weeks) | NR | NR | NR | NR | SMD = 0.58 (−2.19 to 3.36) | NR |
Ewart et al. (2024)22 | 1 RCT; Mofrad et al. (2021) 33 vs. 33 participants | PT (hot packs, TENS, therapeutic ultrasound) with home exercise program Modified SPADI total (2 weeks, 3 months)a | 78.1 (9.0) | 62.6 (5.8) | 2 weeks: 30.9 (24.5 to 36.2) 3 months: 35.7 (30.0 to 41.0) | 2 weeks: 34.3 (32.0 to 37.2) 3 months: 31.3 (30.1 to 32.6) | 2 weeks: −3.4 (NR) 3 months: 4.4 (NR) | NR |
Ewart et al. (2024)22 | 1 RCT; Bertrand et al. (2016) 27 vs. 24/26 participants | 2 comparators, both with PT/home exercise:
VAS (3, 9 months) | 74.76 (18.54) | 68.62 (20.40) | 3 weeks: 53.17 (16.44) 6 weeks: 31.30 (14.19) 12 weeks: 16.12 (12.82) 1 year: 7.66 (10.64) | 3 weeks: 58.70 (18.49) 6 weeks: 41.97 (16.42) 12 weeks: 37.25 (20.32) 1 year: 34.94 (10.64) | 3 weeks: −5.53 (NR) 6 weeks: −10.67 (NR) 12 weeks: −21.13 (NR) 1 year: −27.28 (NR) | 3 weeks: 0.12 6 weeks: 0.01 12 weeks: < 0.001 1 year: < 0.001 |
Physical performance | ||||||||
Thamrongskulsiri et al. (2025)26 | 1 retrospective case-control study; Lee et al. (2015) 57 vs. 53 participants | Active control Both groups received PT (regular exercise education by physical therapists) ROM: Forward Flexion, Abduction, Internal rotation, External rotation (12 months) | Flexion: NR | NR | 169.1 (11.7) | 163.1 (16.9) | 6.00 (0.53 to 11.47) | NR |
Thamrongskulsiri et al. (2025)26 | 1 retrospective case-control study; Lee et al. (2015) 57 vs. 53 participants | Active control Both groups received PT (regular exercise education by physical therapists) ROM: Forward Flexion, Abduction, Internal rotation, External rotation (12 months) | Abduction: NR | NR | 165.5 (16.7) | 153.1 (27.1) | 12.40 (3.91 to 20.89) | NR |
Thamrongskulsiri et al. (2025)26 | 1 retrospective case-control study; Lee et al. (2015) 57 vs. 53 participants | Active control Both groups received PT (regular exercise education by physical therapists) ROM: Forward Flexion, Abduction, Internal rotation, External rotation (12 months) | Internal rotation: NR | NR | 58.3 (19.8) | 54.9 (19.6) | 3.40 (−3.97 to 10.77) | NR |
Thamrongskulsiri et al. (2025)26 | 1 retrospective case-control study; Lee et al. (2015) 57 vs. 53 participants | Active control Both groups received PT (regular exercise education by physical therapists) ROM: Forward Flexion, Abduction, Internal rotation, External rotation (12 months) | External rotation: NR | NR | 86.8 (13.9) | 81 (14.1) | 5.80 (0.56 to 11.04) | NR |
Ewart et al. (2024)22 | 1 RCT; Seven et al. (2017) 60 vs. 60 participants | PT (stretching and exercises in clinic) ROM: Forward Flexion, Abduction, Internal rotation, External rotation (1 year) | Forward Flexion: 126.89 (40.89) | 133.75 (34.84) | 176.57 (9.50) | 166.36 (16.95) | −7.9 (NR) | < 0.001 |
Ewart et al. (2024)22 | 1 RCT; Seven et al. (2017) 60 vs. 60 participants | PT (stretching and exercises in clinic) ROM: Forward Flexion, Abduction, Internal rotation, External rotation (1 year) | Abduction: 125.96 (40.89) | 128.52 (34.54) | 175.26 (12.15) | 164.65 (17.92) | 10.61 (NR) | 0.001 |
Ewart et al. (2024)22 | 1 RCT; Seven et al. (2017) 60 vs. 60 participants | PT (stretching and exercises in clinic) ROM: Forward Flexion, Abduction, Internal rotation, External rotation (1 year) | Internal rotation: 59.73 (40.89) | 56.47 (15.64) | 68.77 (4.25) | 66.02 (7.11) | 2.75 (NR) | 0.02 |
Ewart et al. (2024)22 | 1 RCT; Seven et al. (2017) 60 vs. 60 participants | PT (stretching and exercises in clinic) ROM: Forward Flexion, Abduction, Internal rotation, External rotation (1 year) | External rotation: 77.19 (40.89) | 79.31 (17.30) | 88.94 (4.09) | 86.59 (9.69) | 2.35 (NR) | 0.10 |
Ewart et al. (2024)22 | 1 RCT; Lin et al. (2023) 28 vs. 26 participants | Corticosteroid injections (Triamcinolone 40 mg) ROM: Forward Flexion, Abduction, External Rotation, Internal Rotation (12 weeks) | Flexion: 144.6 (9.5) | 142.8 (10.6) | 140.5 (12.8) | 157.2 (7.1) | −16.7 (NR) | < 0.001 |
Ewart et al. (2024)22 | 1 RCT; Lin et al. (2023) 28 vs. 26 participants | Corticosteroid injections (Triamcinolone 40 mg) ROM: Forward Flexion, Abduction, External Rotation, Internal Rotation (12 weeks) | Abduction: 137.3 (9.5) | 136.3 (14.1) | 133.9 (15.2) | 157.5 (12.4) | −23.6 (NR) | < 0.001 |
Ewart et al. (2024)22 | 1 RCT; Lin et al. (2023) 28 vs. 26 participants | Corticosteroid injections (Triamcinolone 40 mg) ROM: Forward Flexion, Abduction, External Rotation, Internal Rotation (12 weeks) | Internal rotation: 44.6 (9.5) | 43.8 (9.8) | 45.4 (6.7) | 54.2 (4.4) | −8.8 (NR) | < 0.001 |
Ewart et al. (2024)22 | 1 RCT; Lin et al. (2023) 28 vs. 26 participants | Corticosteroid injections (Triamcinolone 40 mg) ROM: Forward Flexion, Abduction, External Rotation, Internal Rotation (12 weeks) | External rotation: 57.9 (9.5) | 55.4 (11.0) | 53.6 (4.9) | 61.5 (5.1) | −16.7 (NR) | < 0.001 |
Pain intensity or severity | ||||||||
Thamrongskulsiri et al. (2025)26 | 1 retrospective case-control study; Lee et al. (2015) 57 vs. 53 participants | Active control Both groups received PT (regular exercise education by physical therapists) VAS for pain 12 months) | NR | NR | 2.7 (1) | 4.6 (1.4) | −1.90 (−2.36 to −1.44) | NR |
Ewart et al. (2024)22 | SR with MA (3 RCTs) 75 vs. 72 participants | Corticosteroid injection VAS score at short-term follow-up (3 to 6 weeks) | NR | NR | NR | NR | SMD = 0.85 (−0.36 to 2.06) | NR |
Ewart et al. (2024)22 | SR with MA (3 RCTs) 75 vs. 72 participants | Corticosteroid injection VAS score at medium-term follow-up (3 months) | NR | NR | NR | NR | SMD = 0.22 (−0.68 to 1.13) | NR |
Health-related quality of life | ||||||||
Ewart et al. (2024)22 | 1 RCT; Seven et al. (2017) 60 vs. 60 participants | PT (stretching and exercises in clinic) WORC (3, 6, 12 weeks, 1 year) | 32.21 (17.49) | 37.77 (16.03) | 3 weeks: 52.25 (16.43) 6 weeks: 72.07 (14.48) 12 weeks: 84.98 (12.13) 1 year: 90.37 (10.12) | 3 weeks: 46.59 (15.28) 6 weeks: 59.98 (16.03) 12 weeks: 66.14 (17.11) 1 year: 69.08 (10.12) | 3 weeks: 5.66 (NR) 6 weeks: 12.09 (NR) 12 weeks: 18.84 (NR) 1 year: 21.29 (NR) | 3 weeks: 0.08 6 weeks: < 0.001 12 weeks: < 0.001 1 year: < 0.001 |
ASES = American Shoulder and Elbow Surgeons Standardized Shoulder Assessment; DASH = disability of the arm, shoulder, and hand; MA = meta-analysis; NR = not reported; NRS = numerical rating scale; PT = physical therapy; RCT = randomized controlled trial; ROM = range of motion; SPADI = shoulder pain and disability index; SMD = standardized mean difference; SR = systematic review; TENS = transcutaneous electrical nerve stimulations; VAS = visual analogue scale; vs. = versus; WORC = Western Ontario Rotator Cuff Index.
aAdditional results related to this outcome measure are available in the original SR.22
Table 14: Summary of Findings by Outcome and Comparator — Shoulder Pain (Supraspinatus Tendinopathy Only); Dextrose Prolotherapy vs. Placebo or Other Comparator
Citation | Evidence source, number of participants (intervention vs. comparator) | Comparator, outcome measure | Baseline, mean (SD) | Follow-up, mean (SD) | Relative effect, mean difference (95% CI) | P value (between groups) | ||
|---|---|---|---|---|---|---|---|---|
Intervention | Comparator | Intervention | Comparator | |||||
Pain-related functioning | ||||||||
Ewart et al. (2024)22 | 1 RCT; Lin et al. (2022) 29 vs. 28 participants | Normal saline (volume NR) in supraspinatus tendon insertion site, ultrasound guided SPADI (2, 6, 12 weeks) | 54.8 (10.7) | 57.5 (12.9) | 2 weeks: 43.2 (12.0) 6 weeks: 50.5 (14.3) 12 weeks: 48.5 (16.0) | 2 weeks: 52.9 (16.1) 6 weeks: 51.3 (16.1) 12 weeks: 49.3 (14.5) | 2 weeks: −9.7 (NR) 6 weeks: −0.80 (NR) 12 weeks: −0.80 (NR) | 2 weeks: 0.01 6 weeks: 0.83 12 weeks: 0.85 |
Ewart et al. (2024)22 | 1 RCT; Abd Karim et al. (2023) 32 vs. 32 participants | PRP 2 mL in the lesion, ultrasound-guided; and home exercise program SPADI (3, 6 weeks, 3, 6 months) | 43.02 (23.12) | 47.79 (20.78) | 3 weeks: 37.20 (22.32) 6 weeks: 28.76 (20.93) 3 months: 24.40 (21.85) 6 months: 22.08 (20.88) | 3 weeks: 39.67 (23.93) 6 weeks: 36.54 (22.78) 3 months: 30.49 (23.81) 6 months: 28.49 (22.72) | 3 weeks: −2.47 (NR) 6 weeks: −7.78 (NR) 3 months: −6.09 (NR) 6 months: −6.41 (NR) | 3 weeks: 0.76 6 weeks: 0.90 3 months: 0.90 6 months: 0.51 |
Ewart et al. (2024)22 | 1 RCT; George et al. (2018) 7 vs. 5 participants | PT DASH (12 weeks) | 60.14 (NR) | 56.86 (NR) | 43.89 (NR) | 46.68 (NR) | −2.79 (NR) | 0.36 |
Physical performance | ||||||||
Ewart et al. (2024)22 | 1 RCT; Abd Karim et al. (2023) 32 vs. 32 participants | PRP 2 mL in the lesion, ultrasound-guided; and home exercise program ROM: Forward Flexion, Abduction, External Rotation, Internal Rotation (6 months) | Forward Flexion: 133.39 (32.56) | 126.70 (37.33) | 155.18 (30.93) | 144.40 (36.29) | 10.78 (NR) | 0.27 |
Ewart et al. (2024)22 | 1 RCT; Abd Karim et al. (2023) 32 vs. 32 participants | PRP 2 mL in the lesion, ultrasound-guided; and home exercise program ROM: Forward Flexion, Abduction, External Rotation, Internal Rotation (6 months) | Abduction: 146.29 (32.56) | 138.00 (34.50) | 161.00 (25.84) | 156.07 (26.84) | 4.93 (NR) | 0.58 |
Ewart et al. (2024)22 | 1 RCT; Abd Karim et al. (2023) 32 vs. 32 participants | PRP 2 mL in the lesion, ultrasound-guided; and home exercise program ROM: Forward Flexion, Abduction, External Rotation, Internal Rotation (6 months) | Internal rotation: 57.50 (32.56) | 67.03 (27.55) | 82.00 (20.92) | 86.00 (15.56) | −4 (NR) | 0.37 |
Ewart et al. (2024)22 | 1 RCT; Abd Karim et al. (2023) 32 vs. 32 participants | PRP 2 mL in the lesion, ultrasound-guided; and home exercise program ROM: Forward Flexion, Abduction, External Rotation, Internal Rotation (6 months) | External rotation: 54.82 (32.56) | 55.67 (29.99) | 78.75 (20.53) | 73.00 (22.65) | 5.75 (NR) | 0.43 |
Ewart et al. (2024)22 | 1 RCT; Lin et al. (2022) 29 vs. 28 participants | Normal saline (volume NR) in supraspinatus tendon insertion site, ultrasound guided ROM: Forward Flexion, Abduction, External Rotation, Internal Rotation (12 weeks) | Forward Flexion: 150.5 (14.0) | 152.2 (9.0) | 156.5 (13.7) | 155.3 (9.1) | 1.2 (NR) | 0.71 |
Ewart et al. (2024)22 | 1 RCT; Lin et al. (2022) 29 vs. 28 participants | Normal saline (volume NR) in supraspinatus tendon insertion site, ultrasound guided ROM: Forward Flexion, Abduction, External Rotation, Internal Rotation (12 weeks) | Abduction: 141.1 (14.0) | 140.96 (11.24) | 146.6 (14.8) | 144.75 (11.03) | 1.85 (NR) | 0.59 |
Ewart et al. (2024)22 | 1 RCT; Lin et al. (2022) 29 vs. 28 participants | Normal saline (volume NR) in supraspinatus tendon insertion site, ultrasound guided ROM: Forward Flexion, Abduction, External Rotation, Internal Rotation (12 weeks) | Internal rotation: 44.8 (14.0) | 45.8 (6.2) | 44.6 (6.4) | 47.0 (10.3) | −1.2 (NR) | 0.64 |
Ewart et al. (2024)22 | 1 RCT; Lin et al. (2022) 29 vs. 28 participants | Normal saline (volume NR) in supraspinatus tendon insertion site, ultrasound guided ROM: Forward Flexion, Abduction, External Rotation, Internal Rotation (12 weeks) | External rotation: 57.6 (14.0) | 59.6 (8.8) | 56.7 (6.5) | 54.5 (9.8) | 2.2 (NR) | 0.31 |
Ewart et al. (2024)22 | 1 RCT; Cole et al. (2017) 17 vs. 19 participants | Corticosteroid injections (Methylprednisolone 40 mg [with 0.5% lignocaine]) in subacromial bursa and supraspinatus tendon (hypoechoic or anechoic areas), ultrasound-guided ROM: Forward Flexion, Abduction, External Rotation (6 weeks, 3, 6 months) | Forward Flexion: 167 (3) | 161 (7) | 6 weeks: 169 (3) 3 months: 173 (2) 6 months: 172 (2) | 6 weeks: 165 (4) 3 months: 172 (3) 6 months: 165 (7) | 6 weeks: 4 (NR) 3 months: 1 (NR) 6 months: 7 (NR) | 6 weeks: 0.38 3 months: 0.70 6 months: 0.31 |
Ewart et al. (2024)22 | 1 RCT; Cole et al. (2017) 17 vs. 19 participants | Corticosteroid injections (Methylprednisolone 40 mg [with 0.5% lignocaine]) in subacromial bursa and supraspinatus tendon (hypoechoic or anechoic areas), ultrasound-guided ROM: Forward Flexion, Abduction, External Rotation (6 weeks, 3, 6 months) | Abduction: 166 (3) | 153 (8) | 6 weeks: 168 (6) 3 months: 175 (0) 6 months: 175 (2) | 6 weeks: 158 (8) 3 months: 163 (7) 6 months: 163 (8) | 6 weeks: 10 (NR) 3 months: 12 (NR) 6 months: 12 (NR) | 6 weeks: 0.3 3 months: 0.1 6 months: 0.15 |
Ewart et al. (2024)22 | 1 RCT; Cole et al. (2017) 17 vs. 19 participants | Corticosteroid injections (Methylprednisolone 40 mg [with 0.5% lignocaine]) in subacromial bursa and supraspinatus tendon (hypoechoic or anechoic areas), ultrasound-guided ROM: Forward Flexion, Abduction, External Rotation (6 weeks, 3, 6 months) | External rotation: 67 (3) | 60 (4) | 6 weeks: 55 (3) 3 months: 65 (3) 6 months: 61 (3) | 6 weeks: 58 (4) 3 months: 57 (5) 6 months: 63 (5) | 6 weeks:-3 (NR) 3 months: 8 (NR) 6 months: −2 (NR) | 6 weeks: 0.45 3 months: 0.18 6 months: 0.79 |
Pain intensity or severity | ||||||||
Ewart et al. (2024)22 | 1 RCT; Lin et al. (2022) 29 vs. 28 participants | Normal saline (volume NR) in supraspinatus tendon insertion site, ultrasound guided VAS (2, 6, 12 weeks) | 5.8 (1.2) | 5.7 (1.2) | 2 weeks: 3.7 (1.0) 6 weeks: 5.7 (1.0) 12 weeks: 5.6 (1.1) | 2 weeks: 5.3 (1.00) 6 weeks: 5.3 (1.3) 12 weeks: 5.0 (1.5) | 2 weeks: −1.6 (NR) 6 weeks: 0.4 (NR) 12 weeks: 0.6 (NR) | 2 weeks: 0.00 6 weeks: 0.20 12 weeks: 0.0 |
Ewart et al. (2024)22 | 1 RCT; Abd Karim et al. (2023) 32 vs. 32 participants | PRP 2 mL in the lesion, ultrasound-guided; and home exercise program 10-point NRS (3, 6 weeks, 3, 6 months) | 5.86 (2.41) | 6.40 (2.70) | 3 weeks: 4.04 (2.40) 6 weeks: 3.39 (2.48) 3 months: 2.82 (2.42) 6 months: 2.71 (2.66) | 3 weeks: 4.60 (2.54) 6 weeks: 4.23 (2.45) 3 months: 3.47 (2.57) 6 months: 3.50 (2.78) | 3 weeks: −0.56 (NR) 6 weeks: −0.84 (NR) 3 months: −0.65 (NR) 6 months: −0.79 (NR) | 3 weeks: 0.55 6 weeks: 0.73 3 months: 0.73 6 months: 0.41 |
Ewart et al. (2024)22 | 1 RCT; George et al. (2018) 7 vs. 5 participants | PT Pain score: 1 to 5, subset of DASH (12 weeks) | 3.29 (NR) | 3.20 (NR) | 1.86 (NR) | 2.40 (NR) | −0.54 (NR) | 0.25 |
Ewart et al. (2024)22 | 1 RCT; Cole et al. (2017) 17 vs. 19 participants | Corticosteroid injections (Methylprednisolone 40 mg [with 0.5% lignocaine]) in subacromial bursa and supraspinatus tendon Pain severity or intensity: 5-point Likert (activities above the head), (6 weeks, 3, 6 months)a | 2.3 (0.2) | 2.6 (0.2) | 6 weeks: 2.1 (0.2) 3 months: 1.9 (0.2) 6 months: 1.7 (0.2) | 6 weeks: 2.4 (0.2) 3 months: 2.2 (0.3) 6 months: 1.7 (0.3) | 6 weeks: −0.3 (NR) 3 months: −0.3 (NR) 6 months: 0.0 (NR) | 6 weeks: 0.5 3 months: 0.42 6 months: 0.99 |
ASES = American Shoulder and Elbow Surgeons Standardized Shoulder Assessment; DASH = disability of the arm, shoulder, and hand; MA = meta-analysis; NR = not reported; NRS = numerical rating scale; PRP = platelet-rich plasma; PT = physical therapy; RCT = randomized controlled trial; ROM = range of motion; SPADI = shoulder pain and disability index; SMD = standardized mean difference; SR = systematic review; VAS = visual analogue scale; vs. = versus.
aAdditional results related to this outcome measure are available in the original SR.22
Table 15: Summary of Findings by Outcome and Comparator — Elbow Pain; Dextrose Prolotherapy vs. Placebo
Citation | Evidence source, number of participants (intervention vs. comparator) | Comparator, outcome measure | Baseline, mean (SD) | Follow-up, mean (SD) | Relative effect, mean difference (95% CI) | P value (between groups) | ||
|---|---|---|---|---|---|---|---|---|
Intervention | Comparator | Intervention | Comparator | |||||
Pain-related functioning | ||||||||
Ewart et al. (2024)22 | 1 RCT; Ciftci et al. (2023) 20 vs. 22 participants | Normal saline 1 mL with same injection method Quick DASH (3, 12 weeks) | 55.45 (15.64) | 59.99 (14.05) | 3 weeks: 28.97 (18.58) 12 weeks: 9.45 (7.35) | 3 weeks: 53.74 (13.81) 12 weeks: 39.99 (11.04) | 3 weeks: −24.77 (NR) 12 weeks: −30.54 (NR) | 3 weeks: 0.003 12 weeks: < 0.001 |
Ewart et al. (2024)22 | 1 RCT; Akcay et al. (2020) 30 vs. 30 participants | Normal saline 4.5 mL, with same injection method; and home exercise program DASH (4, 8, 12 weeks) | Median (range): 65.8 (48.2 to 74.0) | Median (range): 60.0 (46.6 to 74.1) | 4 weeks median (range): 48.3 (37.5 to 56.6) 8 weeks Median: 35.0 (14.1 to 46.6) 12 weeks Median: 29.1 (5.0 to 55.0) | 4 weeks median (range): 55.8 (40.0 to 68.3) 8 weeks median (range): 44.0 (25.8 to 49.1) 12 weeks median (range): 41.6 (13.0 to 52.5) | 4 weeks: −7.5 (NR) 8 weeks: −9 (NR) 12 weeks: −12.5 (NR) | NR |
Physical performance | ||||||||
Ewart et al. (2024)22 | 1 RCT; Ciftci et al. (2023) 20 vs. 22 participants | Normal saline 1 mL with same injection method Grip strength (3, 12 weeks) | 58.50 (40.20) | 44.75 (26.38) | 3 weeks: 62.25 (39.48) 12 weeks: 71.50 (38.04) | 3 weeks: 43.21 (23.53) 12 weeks: 42.50 (20.22) | 3 weeks: 19.04 (NR) 12 weeks: 29.0 (NR) | 3 weeks: 0.664 12 weeks: 0.126 |
Ewart et al. (2024)22 | 1 RCT; Akcay et al. (2020) 30 vs. 30 participants | Normal saline 4.5 mL, with same injection method; and home exercise program Grip strength (4, 8, 12 weeks) | Median (range): 0.25 (0.15 to 0.36) | Median (range): 0.33 (0.20 to 0.40) | 4 weeks median (range): 0.30 (0.25 to 0.40) 8 weeks median (range): 0.40 (0.25 to 0.40) 12 weeks median (range): 0.40 (0.30 to 0.42) | 4 weeks median (range): 0.35 (0.25 to 0.45) 8 weeks median (range): 0.38 (0.30 to 0.50) 12 weeks median (range): 0.40 (0.30 to 0.51) | 4 weeks: −0.05 (NR) 8 weeks: 0.02 (NR) 12 weeks: 0.0 (NR) | NR |
Ewart et al. (2024)22 | 1 RCT; Scarpone et al. (2008) 12 vs. 12 participants | Normal saline 1.5 mL with same injection method Grip strength (2, 4 months) | 29.8 (18.0) | 32.8 (20.6) | 8 weeks: 46.4 (23.9) 16 weeks: 54.2 (23.4) | 8 weeks: 59.6 (30.2) 16 weeks: 63.1 (29.9) | 8 weeks: −13.2 (NR) 16 weeks: −8.9 (NR) | NR |
Pain intensity or severity | ||||||||
Ewart et al. (2024)22 | 1 RCT; Ciftci et al. (2023) 20 vs. 22 participants | Normal saline 1 mL with same injection method 10-point VAS activity (3, 12 weeks)a | 6.69 (1.24) | 6.18 (0.88) | 3 weeks: 3.74 (1.65) 12 weeks: 1.39 (1.10) | 3 weeks: 6.92 (1.57) 12 weeks: 6.05 (1.16) | 3 weeks: −3.2 (NR) 12 weeks: −4.7 (NR) | 3 weeks: 0.38 12 weeks: < 0.001 |
Ewart et al. (2024)22 | 1 RCT; Akcay et al. (2020) 30 vs. 30 participants | Normal saline 4.5 mL, with same injection method; and home exercise program VAS motion (4, 8, 12 weeks)a | median (range): 9.0 (8.0 to 10.0) | median (range): 9.0 (8.0 to 10.0) | 4 weeks median (range): 6.0 (4.0 to 9.0) 8 weeks median (range): 4.0 (2.0 to 7.0) 12 weeks median (range): 3.0 (1.0 to 6.0) | 4 weeks median (range): 7.0 (5.0 to 8.0) 8 weeks median (range): 5.0 (4.0 to 7.0) 12 weeks median (range): 4.0 (3.0 to 6.0) | 4 weeks: −1.0 (NR) 8 weeks: −1.0 (NR) 12 weeks: −1.0 (NR) | 4 weeks: 0.16 8 weeks: 0.20 12 weeks: 0.12 |
Ewart et al. (2024)22 | 1 RCT; Scarpone et al. (2008) 12 vs. 12 participants | Normal saline 1.5 mL with same injection method 10-point Likert at rest (8, 16 weeks) | 5.1 (0.8) | 4.5 (1.7) | 8 weeks: 3.3 (0.9) 16 weeks: 0.5 (0.4) | 8 weeks: 3.6 (1.2) 16 weeks: 3.5 (1.5) | 8 weeks: −0.3 (NR) 16 weeks: −3.0 (NR) | 8 weeks: NR 16 weeks: ≤ 0.001 |
DASH = disability of the arm, shoulder, and hand questionnaire; MA = meta-analysis; NR = not reported; Quick DASH = shortened version of DASH (11 items); RCT = randomized controlled trial; ROM = range of motion; SPADI = shoulder pain and disability index; SMD = standardized mean difference; SR = systematic review; VAS = visual analogue scale; vs. = versus.
aAdditional results related to this outcome measure are available in the original SR.22
Table 16: Summary of Findings by Outcome and Comparator — Elbow Pain; Dextrose Prolotherapy vs. Other Comparators
Citation | Evidence source, number of participants (intervention vs. comparator) | Comparator, outcome measure | Baseline, mean (SD) | Follow-up, mean (SD) | Relative effect, mean difference (95% CI) | P value (between groups) | ||
|---|---|---|---|---|---|---|---|---|
Intervention | Comparator | Intervention | Comparator | |||||
Pain-related functioning | ||||||||
Ewart et al. (2024)22 | 1 RCT; Kaya et al. (2022) 30 vs. 30 participants | 3 comparators:
PRTEE total (1, 6 months) | 73.9 (15.9) | Steroid injectable: 59.2 (19.6) | 1 month: 19.1 (18.6) 6 months: 41.6 (26.1) | Steroid injectable:
| Steroid injectable: NR | Steroid injectable: NR |
Ewart et al. (2024)22 | 1 RCT; Kaya et al. (2022) 30 vs. 30 participants | 3 comparators:
PRTEE total (1, 6 months) | 73.9 (15.9) | ABI: 67.4 (16.4) | 1 month: 19.1 (18.6) 6 months: 41.6 (26.1) | ABI:
| ABI NR | ABI NR |
Ewart et al. (2024)22 | 1 RCT; Kaya et al. (2022) 30 vs. 30 participants | 3 comparators:
PRTEE total (1, 6 months) | 73.9 (15.9) | Wrist splint: 53.5 (16.2) | 1 month: 19.1 (18.6) 6 months: 41.6 (26.1) | Wrist splint:
| Wrist splint: NR | Wrist splint: NR |
Ewart et al. (2024)22 | 1 RCT; Bayat et al. (2019) 16 vs. 14 participants | Corticosteroid Injection (methylprednisolone 40 mg [+ 0.7% lidocaine]) with same injection method; and splint, home exercise program Quick DASH (1, 3 months) | 43.2 (20.8) | 52.2 (16.4) | 1 month: 24.3 (18.6) 3 months: 14.7 (21.1) | 1 month: 34.8 (18.1) 3 months: 34.6 (16.4) | 1 month: −10.5 (NR) 3 months: −19.9 (NR) | 1 month: 0.14 3 months: 0.01 |
Ewart et al. (2024)22 | 1 RCT; Ahadi et al. (2019) 17 vs. 16 participants | ESWT (2,000 J with 1.5 bars intensity, 10 Hz) Quick DASH (4, 8 weeks) | 47.82 (4.78) | 41.84 (3.04) | 4 weeks: 39.67 (4.30) 8 weeks: 37.39 (4.40) | 4 weeks: 22.25 (3.57) 8 weeks: 23.13 (3.20) | 4 weeks: 17.42 (NR) 8 weeks: 14.26 (NR) | 4 weeks: 0.003 8 weeks: 0.009 |
Ewart et al. (2024)22 | 1 RCT; Apaydin et al. (2020) 16 vs. 16 participants | HA 2 mL to most sensitive point of lateral epicondyle Quick DASH (6, 12 weeks) | 53.2 (18.7) | 53.1 (12.5) | 6 weeks: 20.6 (11.7) 12 weeks: 9.7 (6.4) | 6 weeks: 27.9 (11.1) 12 weeks: 24.7 (10.1) | 6 weeks: −7.2 (−15.0 to 0.98) 12 weeks: −15 (−21.1 to −8.9) | NR |
Ewart et al. (2024)22 | 1 RCT; Rabago et al. (2013b) 8 vs.10 participants | Waitlist PRTEE total (4, 8, 16, 32 weeks)a | 41.5 (6.4) | 50.9 (6.1) | 4 weeks: 27.4 (5.3) 8 weeks: 27.2 (5.9) 16 weeks: 22.8 (7.2) 32 weeks: 17.8 (5.55) | 4 weeks: 44.8 (5.1) 8 weeks: 46.7 (5.6) 16 weeks: 41.6 (6.9) 32 weeks: NR | 4 weeks: −17.4 (NR) 8 weeks: −19.5 (NR) 16 weeks: −14.4 (NR) 32 weeks: NR | 4 weeks: ≥ 0.05 8 weeks: ≥ 0.05 16 weeks:− ≥ 0.05 32 weeks: NR |
Ewart et al. (2024)22 | 1 RCT; Yelland et al. (2019) 40 vs. 40 participants | PT (manual therapy and therapeutic exercises), home exercise program PRTEE total (6, 12, 26, 52 weeks) | 31.6 (10.3) | 33.5 (10.0) | 6 weeks: 24.5 (14.6) 12 weeks: 18.2 (13.5) 26 weeks: 8.9 (8.2) 52 weeks: 4.9 (7.4) | 6 weeks: 19.7 (14.3) 12 weeks: 12.2 (12.4) 26 weeks: 9.3 (10.4) 52 weeks: 4.4 (7.4) | 6 weeks: 4.8 (NR) 12 weeks: 6 (NR) 26 weeks: 8.9 (NR) 52 weeks: 0.5 (NR) | 6 weeks: ≥ 0.05 12 weeks: ≥ 0.05 26 weeks: ≥ 0.05 52 weeks: ≥ 0.05 |
Physical performance | ||||||||
Ewart et al. (2024)22 | 1 RCT; Kaya et al. (2022) 30 vs. 30 participants | 3 comparators:
Grip strength (1, 6 months) | 22.3 (9.3) | Steroid injectable: 21.9 (10.8) | 1 month: −2.0 (4.9) 6 months: −5.95 (5.5) | Steroid injectable:
| Steroid injectable: NR | Steroid injectable: NR |
Ewart et al. (2024)22 | 1 RCT; Kaya et al. (2022) 30 vs. 30 participants | 3 comparators:
Grip strength (1, 6 months) | 22.3 (9.3) | ABI: 22.98 (7.98) | 1 month: −2.0 (4.9) 6 months: −5.95 (5.5) | ABI:
| ABI: NR | ABI: NR |
Ewart et al. (2024)22 | 1 RCT; Kaya et al. (2022) 30 vs. 30 participants | 3 comparators:
Grip strength (1, 6 months) | 22.3 (9.3) | Wrist splint: 28.3 (13.0) | 1 month: −2.0 (4.9) 6 months: −5.95 (5.5) | Wrist splint:
| Wrist splint: NR | Wrist splint: NR |
Ewart et al. (2024)22 | 1 RCT; Ahadi et al. (2019) 17 vs. 16 participants | ESWT (2000 J with 1.5 bars intensity, 10 Hz) Grip strength (4, 8 weeks) | 7.02 (0.64) | 7.28 (0.52) | 4 weeks: 8.02 (0.64) 8 weeks: 8.00 (0.64) | 4 weeks: 8.31 (0.49) 8 weeks: 8.36 (0.50) | 4 weeks: −0.29 (NR) 8 weeks: −0.36 (NR) | 4 weeks: 0.94 8 weeks: 0.77 |
Ewart et al. (2024)22 | 1 RCT; Deb et al. (2020) 42 vs. 42 participants | ESWT (2000 J with 1.9 bar intensity, 10 Hz) Grip strength (1, 3, 6 months) | 10.00 (0.99) | 9.69 (0.84) | 1 month: 11.99 (0.93) 3 months: 13.84 (0.87) 6 months: 15.44 (0.65) | 1 month: 10.74 (0.88) 3 months: 11.83 (0.96) 6 months: 13.1 (0.84) | 1 month: 1.25 (NR) 3 months: 2.01 (NR) 6 months: 2.34 (NR) | 1 month: ≤ 0.001 3 months: ≤ 0.001 6 months: ≤ 0.001 |
Ewart et al. (2024)22 | 1 RCT; Apaydin et al. (2020) 16 vs. 16 participants | HA 2 mL to most sensitive point of lateral epicondyle Grip strength (6, 12 weeks) | 19.87 (9.0) | 18.13 (8.6) | 6 weeks: 24.25 (9.1) 12 weeks: 27.19 (9.6) | 6 weeks: 22.06 (8.9) 12 weeks: 22.94 (8.5) | 6 weeks: 2.18 (0.06 to 4.53) 12 weeks: 4.25 (2.02 to 7.00) | NR |
Ewart et al. (2024)22 | 1 RCT; Rabago et al. (2013b) 8 vs. 10 participants | Waitlist Grip strength (4, 8, 16, 32 weeks) | 299.4 (61.7) | 181.7 (42.6) | 4 weeks: NR 8 weeks: 348.6 (56.8) 16 weeks: 364.4 (50.3) 32 weeks: 368.9 (49.9) | 4 weeks: NR 8 weeks: 210.1 (40.2) 16 weeks: 200.4 (53.0) 32 weeks: NR | 4 weeks: NR 8 weeks: 138.5 (NR) 16 weeks: 164.0 (NR) 32 weeks: NR | 4 weeks: NR 8 weeks: P < 0.05 16 weeks: P < 0.05 32 weeks: NR |
Pain intensity or severity | ||||||||
Ewart et al. (2024)22 | 1 RCT; Kaya et al. (2022) 30 vs. 30 participants | 3 comparators:
VAS (1, 6 months) | 73.9 (15.9) | Steroid injectable: 70.0 (15.6) | 1 month: 22.4 (23.1) 6 months: 56.0 (34.6) | Steroid injectable:
| Steroid injectable: NR | Steroid injectable: NR |
Ewart et al. (2024)22 | 1 RCT; Kaya et al. (2022) 30 vs. 30 participants | 3 comparators:
VAS (1, 6 months) | 73.9 (15.9) | ABI: 76.3 (16.1) | 1 month: 22.4 (23.1) 6 months: 56.0 (34.6) | ABI:
| ABI: NR | ABI: NR |
Ewart et al. (2024)22 | 1 RCT; Kaya et al. (2022) 30 vs. 30 participants | 3 comparators:
VAS (1, 6 months) | 73.9 (15.9) | Wrist splint: 66.3 (19.1) | 1 month: 22.4 (23.1) 6 months: 56.0 (34.6) | Wrist splint:
| Wrist splint: NR | Wrist splint: NR |
Ewart et al. (2024)22 | 1 RCT; Gupta et al. (2022) 130 vs. 130 participants | Corticosteroid Injection: (triamcinolone [with 2% lignocaine]) VAS (6, 12, 24, 52 weeks) | 68.79 (1.19) | 67.16 (2.89) | 6 weeks: 52.34 (1.15) 12 weeks: 43.46 (3.18) 24 weeks: 32.70 (2.40) 52 weeks: 21.84 (2.23) | 6 weeks: 49.13 (1.63) 12 weeks: 40.68 (2.77) 24 weeks: 32.06 (2.45) 52 weeks: 27.02 (2.23) | 6 weeks: 3.2 (NR) 12 weeks: 2.8 (NR) 24 weeks: 0.6 (NR) 52 weeks: −5.18 (NR) | 6 weeks: NR 12 weeks: NR 24 weeks: NR 52 weeks: NR |
Ewart et al. (2024)22 | 1 RCT; Bayat et al. (2019) 16 vs. 14 participants | Corticosteroid Injection (methylprednisolone 40 mg [with 0.7% lidocaine]) with same injection method; and splint, home exercise program VAS (1, 3 months) | 7.3 (1.5) | 7.2 (1.8) | 1 month: 5.3 (3.1) 3 months: 2.8 (3.2) | 1 month: 5.7 (2.6) 3 months: 5.2 (2.4) | 1 month: −0.4 (NR) 3 months: −2.4 (NR) | 1 month: 0.74 3 months: 0.03 |
Ewart et al. (2024)22 | 1 RCT; Ahadi et al. (2019) 17 vs. 16 participants | ESWT (2000 J with 1.5 bars intensity, 10 Hz) 10-point VAS (4, 8 weeks) | 7.35 (0.47) | 6.13 (0.32) | 4 weeks: 5.71 (0.50) 8 weeks: 5.47 (0.53) | 4 weeks: 3.19 (0.50) 8 weeks: 2.60 (0.40) | 4 weeks: 2.5 (NR) 8 weeks: 2.9 (NR) | 4 weeks: 0.01 8 weeks: 0.008 |
Ewart et al. (2024)22 | 1 RCT; Deb et al. (2020) 42 vs. 42 participants | ESWT (2000 J with 1.9 bar intensity, 10 Hz) VAS (1, 3, 6 months) | 7.57 (0.67) | 7.57 (0.50) | 1 month: 5.36 (0.82) 3 months: 3.17 (1.03) 6 months: 1.45 (0.59) | 1 month: 6.26 (0.77) 3 months: 4.45 (1.27) 6 months: 3.07 (0.92) | 1 month: −0.9 (NR) 3 months: −1.3 (NR) 6 months: −1.6 (NR) | 1 month: ≤ 0.001 3 months: ≤ 0.001 6 months: ≤ 0.001 |
Ewart et al. (2024)22 | 1 RCT; Apaydin et al. (2020) 16 vs. 16 participants | HA 2 mL to most sensitive point of lateral epicondyle VAS activity (6, 12 weeks)a | 7.00 (1.5) | 7.25 (0.8) | 6 weeks: 3.75 (1.4) 12 weeks: 2.19 (0.8) | 6 weeks: 4.94 (2.4) 12 weeks: 4.06 (2.3) | 6 weeks: −1.2 (−1.8 to −0.7) 12 weeks: −1.9 (−2.4 to −1.4) | 6 weeks: NR 12 weeks: NR |
Ewart et al. (2024)22 | 1 RCT; Yelland et al. (2019) 40 vs. 40 participants | PT (manual therapy and therapeutic exercises), home exercise program 10-point VAS worst pain in the last week (6, 12, 26, 52 weeks)a | 7.4 (1.6) | 7.3 (2.0) | 6 weeks: 5.4 (2.2) 12 weeks: 4.0 (2.5) 26 weeks: 2.0 (2.0) 52 weeks: 1.1 (2.0) | 6 weeks: 3.7 (2.6) 12 weeks: 2.5 (2.6) 26 weeks: 1.6 (2.1) 52 weeks: 0.9 (2.0) | 6 weeks: 1.7 (NR) 12 weeks: 1.5 (NR) 26 weeks: 0.4 (NR) 52 weeks: 0.2 (NR) | 6 weeks: ≥ 0.05 12 weeks: ≥ 0.05 26 weeks: < 0.05 52 weeks: ≥ 0.05 |
Health-related quality of life | ||||||||
Ewart et al. (2024)22 | 1 RCT; Yelland et al. (2019) 40 vs. 40 participants | PT (manual therapy and therapeutic exercises), home exercise program EuroQoL-5D (6 weeks, 3, 6 months, 1 year) | 82.7 (12.9) | 80.4 (16.9) | 6 weeks: 80.6 (11.8) 12 weeks: 83.1 (9.9) 26 weeks: 86.3 (12.1) 52 weeks: 88.5 (9.3) | 6 weeks: 83.9 (13.4) 12 weeks: 83.9 (13.6) 26 weeks: 87.2 (12.7) 52 weeks: 85.3 (9.3) | 6 weeks: −3.3 (NR) 12 weeks: −0.8 (NR) 26 weeks: −0.9 (NR) 52 weeks: 3.2 (NR) | 6 weeks: ≥ 0.05 12 weeks: NR 26 weeks: ≥ 0.05 52 weeks: ≥ 0.05 |
ABI = autologous blood injection; DASH = disability of the arm, shoulder, and hand questionnaire; ESWT = extracorporeal shockwave therapy; EuroQol-5D = European Quality of Life-5 dimensions; HA = hyaluronic acid; MA = meta-analysis; NR = not reported; PRTEE = Patient-rated Tennis Elbow Evaluation; PT = physical therapy; Quick DASH = shortened version of DASH (11 items); RCT = randomized controlled trial; ROM = range of motion; SPADI = shoulder pain and disability index; SR = systematic review; VAS = visual analogue scale; vs. = versus.
aAdditional results related to this outcome measure are available in the original SR.22
Table 17: Summary of Findings by Outcome and Comparator — Low Back Pain; Dextrose Prolotherapy vs. Placebo
Citation | Evidence source, number of participants (intervention vs. comparator) | Comparator, outcome measure | Baseline, mean (SD) | Follow-up, mean (SD) | Relative effect, mean difference (95% CI) | P value (between groups) | ||
|---|---|---|---|---|---|---|---|---|
Intervention | Comparator | Intervention | Comparator | |||||
Pain-related functioning | ||||||||
Ewart et al. (2024)22 | 1 RCT; Dechow et al. (1999) 36 vs. 38 participants | Normal saline 10 mL (with 0.5% lignocaine) ODI (1, 3, 6 months) | 33.99 (NR) | 33.06 (NR) | 1 month: 35.92 (NR) 3 months: 36.02 (NR) 6 months: 35.22 (NR) | 1 month: 33.06 (NR) 3 months: 33.59 (NR) 6 months: 34.56 (NR) | 1 month: 2.86 (NR) 3 months: 2.43 (NR) 6 months: 0.66 (NR) | NR |
Ewart et al. (2024)22 | 1 RCT; Klein et al. (1993) 39 vs. 40 participants | Normal saline 30 mL RMDQ (6 months) | 9.36 (3.6) | 8.25 (3.3) | 4.04 (3.71) | 4.38 (4.05) | −0.34 (NR) | 0.068 |
Ewart et al. (2024)22 | 1 RCT; Ongley et al. (1987) 40 vs. 41 participants | Normal saline 20 mL; home exercise program Modified RMDQ/WDI (1, 3, 6 months) | 11.45 (NR) | 11.82 (NR) | 1 month: 4.00 (NR) 3 months: 4.70 (NR) 6 months: 3.43 (NR) | 1 month: 8.37 (NR) 3 months: 8.49 (NR) 6 months: 8.29 (NR) | 1 month: −4.37 (NR) 3 months: −3.79 (NR) 6 months: −4.86 (NR) | 1 month: < 0.001 3 months: < 0.004 6 months: < 0.001 |
Ewart et al. (2024)22 | 1 RCT; Yelland et al. (2004) 54 vs. 56 participants | Normal saline 10 mL; 50% Modified RMDQ (12, 24 months) | 13.7 (5.0) | 14.3 (4.5) | 12 months: 8.0 (NR) 24 months: 8.6 (NR) | 12 months: 9.8 (NR) 24 months: 9.4 (NR) | 12 months: −1.8 (NR) 24 months: −0.8 (NR) | NR |
Physical performance | ||||||||
Ewart et al. (2024)22 | 1 RCT; Dechow et al. (1999) 36 vs. 38 participants | Normal saline 10 mL (with 0.5% lignocaine) ROM: Lumbar Flexion (1, 3, 6 months) | 4.83 (NR) | 5.28 (NR) | 1 month: 5.52 (4.86) 3 months: 5.45 (5.1) 6 months: 5.4 (4.8) | 1 month: 5.49 (NR) 3 months: 5.23 (NR) 6 months: 5.77 (NR) | 1 month: 0.03 (NR) 3 months: 0.22 (NR) 6 months: −0.37 (NR) | NR |
Ewart et al. (2024)22 | 1 RCT; Klein et al. (1993) 39 vs. 40 participants | Normal saline 30 mL (with 0.3% lignocaine); home exercise program B-200 Triaxial Dynamometer ROM: Rotation, Flexion-Extension, Side Flexion (6 months) | 81.9 (11.8) | 84.0 (9.9) | Rotation: 91.8 (8.6) Flexion-Extension: 100.5 (11.1) Side Flexion: 78.2 (11.4) | Rotation: 93.8 (6.2) Flexion-Extension: 102.3 (11.7) Side Flexion: 78.1 (11.7) | Rotation: −2 (NR) Flexion-Extension: −1.80 (NR) Side Flexion: 0.10 (NR) | NR |
Pain intensity or severity | ||||||||
Ewart et al. (2024)22 | 1 RCT; Dechow et al. (1999) 36 vs. 38 participants | Normal saline 10 mL (with 0.5% lignocaine) VAS (1, 3, 6 months) | 5.39 (NR) | 5.31 (NR) | 1 month: 5.2 (NR) 3 months: 5.1 (NR) 6 months: 5.19 (NR) | 1 month: 4.77 (NR) 3 months: 5.28 (NR) 6 months: 4.47 (NR) | 1 month: 0.43 (NR) 3 months: −0.18 (NR) 6 months: 0.72 (NR) | NR |
Ewart et al. (2024)22 | 1 RCT; Klein et al. (1993) 39 vs. 40 participants | Normal saline 30 mL VAS (6 months) | 4.88 (1.3) | 4.56 (1.12) | 2.85 (1.88) | 2.29 (1.67) | 0.56 (NR) | 0.056 |
Ewart et al. (2024)22 | 1 RCT; Ongley et al. (1987) 40 vs. 41 participants | Normal saline 20 mL; home exercise program VAS (1, 3, 6 months) | 3.78 (NR) | 3.99 (0.19) | 1 month: 2.13 (NR) 3 months: 1.77 (NR) 6 months: 1.50 (NR) | 1 month: 3.06 (0.29) 3 months: 2.93 (0.25) 6 months: 3.08 (0.28) | 1 month: −0.93 (NR) 3 months: −1.16 (NR) 6 months: −1.58 (NR) | 1 month: < 0.01 3 months: < 0.001 6 months: < 0.001 |
Ewart et al. (2024)22 | 1 RCT; Yelland et al. (2004) 54 vs. 56 participants | Normal saline 10 mL; 50% VAS (12, 24 months) | 51.9 (19.3) | 55.0 (20.7) | 12 months: 33.21 (NR) 24 months: 32.83 (NR) | 12 months: 36.79 (NR) 24 months: 37.17 (NR) | 12 months: −3.58 (NR) 24 months: −4.34 (NR) | 12 months: NR 24 months: NR |
DPQ = Dallas Pain Questionnaire; MA = meta-analysis; NR = not reported; ODI = Oswestry Disability Index; RCT = randomized controlled trial; RMDQ = Roland Morris Disability Questionnaire; ROM = range of motion; SR = systematic review; VAS = visual analogue scale; vs. = versus; WDI = Waddell Disability Index.
Table 18: Summary of Findings by Outcome and Comparator — Low Back Pain; Dextrose Prolotherapy vs. Other Comparators
Citation | Evidence source, number of participants (intervention vs. comparator) | Comparator, outcome measure | Baseline, mean (SD) | Follow-up, mean (SD) | Relative effect, mean difference (95% CI) | P value (between groups) | ||
|---|---|---|---|---|---|---|---|---|
Intervention | Comparator | Intervention | Comparator | |||||
Pain-related functioning | ||||||||
Ewart et al. (2024)22 | 1 observational cohort; Yildirim et al. (2021) 87 vs. 91 participants | Corticosteroid injections (20 mg methylprednisolone [with 0.25% bupivacaine]), injection at single-level facet joint ODI (3 months) | 55.93 (10.74) | 56.59 (10.47) | 39.13 (8.11) | 32.85 (7.50) | 6.28 (NR) | 0.000 |
Ewart et al. (2024)22 | 1 RCT; Kim et al. (2010) 24 vs. 26 participants | Corticosteroid injections (Intra-articular triamcinolone 40 mg [with 0.1% levobupivacaine]), fluoroscopy guided at sacroiliac joint ODI (2 weeks) | 33.9 (15.5) | 35.7 (20.4) | 11.1 (10.0) | 15.5 (10.7) | - 4.40 (NR) | NR |
Ewart et al. (2024)22 | 1 RCT; Raissi et al. (2022) 20 vs. 20 participants | Corticosteroid injections (2.5 mL triamcinolone), ultrasound-guided at sacroiliac joint DPQ (2, 8 weeks) | 217.89 (72.87) | 208.56 (70.69) | 2 weeks: 182.94 (84.62) 8 weeks: 195.83 (47.41) | 2 weeks: 165.54 (62.12) 8 weeks: 158.83 (78.81) | 2 weeks: 17.40 (NR) 8 weeks: 37.00 (NR) | NR |
Pain intensity or severity | ||||||||
Ewart et al. (2024)22 | 1 observational cohort; Yildirim et al. (2021) 87 vs. 91 participants | Corticosteroid injections (20 mg methylprednisolone [with 0.25% bupivacaine]), injection at single-level facet joint VAS (1, 15 days, 3 months) | 7.57 (0.98) | 8.45 (0.69) | 1 day: 3.48 (1.06) 15 days: 2.80 (0.85) 3 months: 3.11 (1.02) | 1 day: 1.67 (0.88) 15 days: 3.02 (1.45) 3 months: 5.38 (1.99) | 1 day: 1.81 (NR) 15 days: −0.22 (NR) 3 months: −2.27 (NR) | 1 day: 0.000 15 days: 0.225 3 months: 0.000 |
Ewart et al. (2024)22 | 1 RCT; Kim et al. (2010) 24 vs. 26 participants | Corticosteroid injections (Intra-articular triamcinolone 40 mg [with 0.1% levobupivacaine]), fluoroscopy guided at sacroiliac joint VAS (2 weeks) | 6.3 (NR) | 6.7 (NR) | 1.4 (1.1) | 1.9 (0.9) | −0.50 (NR) | NR |
Ewart et al. (2024)22 | 1 RCT; Raissi et al. (2022) 20 vs. 20 participants | Corticosteroid injections (2.5 mL triamcinolone), ultrasound-guided at sacroiliac joint VAS (2, 8 weeks, 9 months) | 8.17 (1.54) | 7.76 (1.70) | 2 weeks: 4.50 (2.12) 8 weeks: 4.11 (1.45) 9 months: 2.67 (1.24) | 2 weeks: 3.71 (2.12) 8 weeks: 4.48 (2.60) 9 months: 2.62 (1.63) | 2 weeks: 0.79 (NR) 8 weeks: −0.37 (NR) 9 months: 0.05 (NR) | 2 weeks: NR 8 weeks: NR 9 months: NR |
DPQ = Dallas Pain Questionnaire; MA = meta-analysis; NR = not reported; ODI = Oswestry Disability Index; RCT = randomized controlled trial; RMDQ = Roland Morris Disability Questionnaire; ROM = range of motion; SR = systematic review; VAS = visual analogue scale; vs. = versus.
Table 19: Summary of Findings by Outcome and Comparator — TMJ; Dextrose Prolotherapy vs. Placebo
Citation | Evidence source, number of participants (intervention vs. comparator) | Comparator, outcome measure | Baseline, mean (SD) | Follow-up, mean (SD) | Relative effect, mean difference (95% CI) | P value (between groups) | ||
|---|---|---|---|---|---|---|---|---|
Intervention | Comparator | Intervention | Comparator | |||||
Pain-related functioning | ||||||||
Saramantos et al. (2025)25 | SR with MA (3 RCTs) 46 vs. 43 participants | Placebo Subluxation / jaw mobility (time frame NS) | NR | NR | NR | NR | −1.18 (−2.15 to −0.20) | 0.02 |
Physical performance | ||||||||
Saramantos et al. (2025)25 | SR with MA (6 RCTs) 86 vs. 81 participants | Placebo MIO (3 or 5 months) | NR | NR | NR | NR | 0.84 (−2.12 to 3.80) | 0.58 |
Zhou et al. (2025)27 | SR with MA (3 RCTs) 48 vs. 27 participants | Placebo MMO score (1, 3, or 11.8 months) | NR | NR | NR | NR | −3.63 (−6.76 to −0.49) | 0.02 |
Ewart et al. (2024)22 | 1 RCT; Haggag et al. (2022) 15 vs. 15 participants | Normal saline 2 mL (with 4% articaine) with same injection method MMO (1, 3, 6 months) | 27.5 (NR) | 25.7 (NR) | 1 month: 40.8 (NR) 3 months: 41.3 (NR) 6 months: 41.7 (NR) | 1 month: 35.3 (NR) 3 months: 29.7 (NR) 6 months: 29.1 (NR) | 1 month: 5.5 (NR) 3 months: 11.6 (NR) 6 months: 12.6 (NR) | 1 month: 0.041 3 months: < 0.001 6 months: < 0.001 |
Pain intensity or severity | ||||||||
Saramantos et al. (2025)25 | SR with MA (5 RCTs) 80 vs. 75 participants | Placebo VAS for pain (3 or 5 months) | NR | NR | NR | NR | −1.10 (−1.58 to −0.62) | < 0.00001 |
Zhou et al. (2025)27 | SR with MA (2 RCTs) 42 vs. 21 participants | Placebo VAS for pain (1 month or 11.8 months) | NR | NR | NR | NR | −0.95 (−1.75 to −0.15) | 0.02 |
Ewart et al. (2024)22 | 1 RCT; Haggag et al. (2022) 15 vs. 15 participants | Normal saline 2 mL (with 4% articaine) with same injection method NRS (1, 3, 6 months) | 8.1 | 7.3 | 1 month: 2.3 3 months: 2.3 6 months: 2.1 | 1 month: 3.7 3 months: 5.6 6 months: 6.3 | 1 month: −1.4 (NR) 3 months: −3.3 (NR) 6 months: −4.2 (NR) | 1 month: 0.015 3 months: < 0.001 6 months: < 0.001 |
CI = confidence interval; MA = meta-analysis; MIO = maximal mal incisor opening; MMO = maximal mouth opening; NR = not reported; NRS = numerical rating scale; NS = not specified; RCT = randomized controlled trial; SD = standard deviation; SMD = standardized mean difference; SR = systematic review; TMJ = temporomandibular joint; VAS = visual analogue scale; vs. = versus.
Table 20: Summary of Findings by Outcome and Comparator — TMJ; Dextrose Prolotherapy vs. Other Comparators
Citation | Evidence source, number of participants (intervention vs. comparator) | Comparator, outcome measure | Baseline, mean (SD) | Follow-up, mean (SD) | Relative effect, mean difference (95% CI) | P value (between groups) | ||
|---|---|---|---|---|---|---|---|---|
Intervention | Comparator | Intervention | Comparator | |||||
Pain-related functioning | ||||||||
Saramantos et al. (2025)25 | SR with MA (2 RCTs) 42 vs. 42 participants | ABI VAS for pain (time frame NS) | NR | NR | NR | NR | −0.49 (−0.87 to −0.11) | 0.01 |
Ewart et al. (2024)22 | 1 observational Cohort; Elwerfelli et al. (2019) 7 vs. 7 participants | Arthrocentesis and lavage with 50 mL normal VAS (6 weeks) | NR | NR | NR | NR | NR | NR |
Ewart et al. (2024)22 | 1 RCT; Hassanien et al. (2020) 10 vs. 10 participants | Low-level laser therapy (980 nm wavelength, 0.2 Watt) VAS (2, 4 weeks) | 5.88 (2.36) | 4.38 (1.51) | 2 weeks: 3.75 (1.58) 4 weeks: 2.13 (0.99) | 2 weeks: 4.38 (2.07) 4 weeks: 3.50 (2.27) | 2 weeks: −0.6 (NR) 4 weeks: −1.4 (NR) | 2 weeks: NR 4 weeks: 0.138 |
Ewart et al. (2024)22 | 1 RCT; Mahmoud et al. (2018) 15 vs. 15 participants | 2 comparators:
VAS (1, 3, 6, 12 months) | 9.9 (NR) | Arthrocentesis with HA: 9.9 (NR) | 1 month: 4.2 (NR) 3 months: 3.3 (NR) 6 months: 3.7 (NR) 12 months: 3.7 (NR) | Arthrocentesis with HA:
| Arthrocentesis with HA:
| Arthrocentesis with HA:
|
Ewart et al. (2024)22 | 1 RCT; Mahmoud et al. (2018) 15 vs. 15 participants | 2 comparators:
VAS (1, 3, 6, 12 months) | 9.9 (NR) | PRP: 10.0 (NR) | 1 month: 4.2 (NR) 3 months: 3.3 (NR) 6 months: 3.7 (NR) 12 months: 3.7 (NR) | PRP:
| PRP:
| PRP:
|
Ewart et al. (2024)22 | 1 RCT; Priyadarshini et al. (2021) 17 vs. 17 participants | Occlusal splints NRS - Pain (1, 3, 6, 12 months) | 5.76 (1.95) | 5.35 (1.935) | 1 month: 0.59 (0.51) 3 months: 0.59 (0.51) 6 months: 0.47 (0.51) 12 months: 0.47 (0.51) | 1 month: 3.47 (2.04) 3 months: 3.41 (1.94) 6 months: 3.41 (1.87) 12 months: 3.29 (0.51) | 1 month: −2.9 (NR) 3 months: −2.8 (NR) 6 months: −2.9 (NR) 12 months: −2.8 (NR) | 1 month: ≤ 0.001 3 months: ≤ 0.001 6 months: ≤ 0.001 12 months: ≤ 0.001 |
Physical performance | ||||||||
Zhou et al. (2025)27 | SR with MA (3 RCTs) 61 vs. 61 participants | ABI MMO score (6 months) | NR | NR | NR | NR | −0.42 (−4.07 to 3.22) | 0.82 |
Ewart et al. (2024)22 | SR with MA (3 RCTs) 55 vs. 50 participants | ABI MMO score (6 months) | NR | NR | NR | NR | SMD = 0.71 (−1.34 to 2.76) | NR |
Ewart et al. (2024)22 | 1 observational Cohort; Elwerfelli et al. (2019) 7 vs. 7 participants | Arthrocentesis and lavage with 50 mL normal MMO (1 day, 1, 2, 3, 4, 5, 6 weeks) | 23.14 (3.53) | 24.43 (2.82) | 1 day: 34.43 (1.62) 1 week: 40.29 (1.98) 2 weeks: 41.86 (2.67) 3 weeks: 44.71 (1.25) 4 weeks: 45.29 (1.25) 5 weeks: 45.29 (1.25) 6 weeks: 45.29 (1.25) | 1 day: 34.14 (2.54) 1 week: 39.57 (2.57) 2 weeks: 39.43 (2.70) 3 weeks: 41.0 (1.25) 4 weeks: 41.43 (3.26) 5 weeks: 41.57 (3.05) 6 weeks: 41.57 (3.05) | 1 day: 0.3 (NR) 1 week: 0.7 (NR) 2 weeks: 2.4 (NR) 3 weeks: 3.7 (NR) 4 weeks: 3.9 (NR) 5 weeks: 3.7 (NR) 6 weeks: 3.7 (NR) | 1 day: 0.806 1 week: 0.571 2 weeks: 0.117 3 weeks: 0.035 4 weeks: 0.020 5 weeks: 0.018 6 weeks: 0.018 |
Ewart et al. (2024)22 | 1 RCT; Hassanien et al. (2020) 10 vs. 10 participants | Low-level laser therapy (980 nm wavelength, 0.2 Watt) MMO (2, 4 weeks) | 35.213 (3.776) | 32.750 (0.463) | 2 weeks: 39.488 (2.713) 4 weeks: 43.375 (1.707) | 2 weeks: 35.250 (1.282) 4 weeks: 37.375 (1.923) | 2 weeks: 4.2 (NR) 4 weeks: 6.0 (NR) | 2 weeks: 0.001 4 weeks: ≤ 0.001 |
Ewart et al. (2024)22 | 1 RCT; Mahmoud et al. (2018) 15 vs. 15 participants | 2 comparators:
MMO (1, 3, 6, 12 months) | 36.7 (NR) | Arthrocentesis with HA: 34.6 (NR) | 1 month: 40.5 (NR) 3 months: 41.5 (NR) 6 months: 39.8 (NR) 12 months: 39.1 (NR) | Arthrocentesis with HA:
| Arthrocentesis with HA:
| Arthrocentesis with HA:
|
Ewart et al. (2024)22 | 1 RCT; Mahmoud et al. (2018) 15 vs. 15 participants | 2 comparators:
MMO (1, 3, 6, 12 months) | 36.7 (NR) | PRP: 41.3 (NR) | 1 month: 40.5 (NR) 3 months: 41.5 (NR) 6 months: 39.8 (NR) 12 months: 39.1 (NR) | PRP:
| PRP:
| PRP:
|
Ewart et al. (2024)22 | 1 RCT; Priyadarshini et al. (2021) 17 vs. 17 participants | Occlusal splints MMO (1, 3, 6, 12 months) | 36.06 (11.003) | 33.88 (9.130) | 1 month: 40.65 (8.246) 3 months: 41.18 (8.017) 6 months: 41.35 (7.960) 12 months: 41.29 (7.967) | 1 month: 34.71 (8.402) 3 months: 34.65 (8.389) 6 months: 34.82 (8.346) 12 months: 35.06 (7.967) | 1 month: 5.9 (NR) 3 months: 6.5 (NR) 6 months: 6.5 (NR) 12 months: 6.2 (NR) | 1 month: 0.046 3 months: 0.027 6 months: 0.026 12 months: 0.032 |
ABI = autologous blood injection; CI = confidence interval; HA = hyaluronic acid; MA = meta-analysis; MIO = maximal mal incisor opening; MMO = maximal mouth opening; NR = not reported; NRS = numerical rating scale; NS = not specified; PRP = Platelet-Rich Plasma; RCT = randomized controlled trial; SD = standard deviation; SMD = standardized mean difference; SR = systematic review; TMJ = temporomandibular joint; VAS = visual analogue scale; vs. = versus.
Table 21: Summary of Findings by Pain Conditions and Comparator — Other Pain Conditions
Citation | Evidence source, number of participants (intervention vs. comparator) | Comparator, outcome measure | Baseline, mean (SD) | Follow-up, mean (SD) | Relative effect, mean difference (95% CI) | P value (between groups) | ||
|---|---|---|---|---|---|---|---|---|
Intervention | Comparator | Intervention | Comparator | |||||
Non-arthritis knee pain | ||||||||
Ewart et al. (2024)22 | 1 RCT; Babaei-Ghazani et al. (2023) 25 vs. 25 participants | 2 comparators:
Pes anserine bursitis; WOMAC (1, 8 weeks)a | 59.3 (16.8) | Corticosteroid: 63.2 (13.3) | 1 week: 56.7 (21.5) 8 weeks: 38.1 (15.5) | Corticosteroid:
| Corticosteroid:
| Corticosteroid: NR |
Ewart et al. (2024)22 | 1 RCT; Babaei-Ghazani et al. (2023) 25 vs. 25 participants | 2 comparators:
Pes anserine bursitis; WOMAC (1, 8 weeks)a | 59.3 (16.8) | Oxygen-ozone: 58.6 (11.2) | 1 week: 56.7 (21.5) 8 weeks: 38.1 (15.5) | Oxygen-ozone:
| Oxygen-ozone:
| Oxygen-ozone: NR |
Ewart et al. (2024)22 | 1 RCT; Wu et al. (2022) 35 vs. 35 participants | Normal saline 4 mL (with 0.5% lidocaine), ultrasound-guided Osgood-Schlatter disease; VISA-P (3 weeks, 6, 12 months) | 49.1 (5.9) | 49.4 (5.7) | 3 weeks: 76.2 (1.1) 6 months: 80.8 (1.1) 12 months: 83.1 (1.3) | 3 weeks: 50.8 (1.1) 6 months: 74.6 (1.1) 12 months: 77.6 (1.3) | 3 weeks: 25.4 (NR) 6 months: 6.2 (NR) 12 months: 5.5 (NR) | 3 weeks: < 0.0001 6 months: < 0.0001 12 months: 0.0026 |
Ewart et al. (2024)22 | 1 observational study; Cho et al. (2017) 10 vs. 10 participants | Supervised exercise program only Chronic patellar tendinopathy; VISA-P (6, 12 weeks)a | 52.4 (9.7) | 59.9 (13.8) | 6 weeks: 57.2 (12.8) 12 weeks: 62.6 (11.1) | 6 weeks: 73.7 (11.9) 12 weeks: 78.1 (10.6) | 6 weeks: −6.1 (NR) 12 weeks: 0.9 (NR) | NR |
Other types of foot pain (not plantar fasciitis) | ||||||||
Ewart et al. (2024)22 | 1 observational study; Akpancar et al. (2019) 27 vs. 27 participants | 2 mL PRP intra-articular and 2 mL PRP at tibial edge and talar dome adjacent to the joint Osteochondral lesions of the talus; AOS (21 days, 3, 6, 12 months)a | 129.4 (20.0) | 137.4 (20.9) | 21 days: 75.2 (23.3) 3 months: 51.4 (28.3) 6 months: 36.9 (25.8) 12 months: 29.9 (25.9) | 21 days: 86.5 (28.0) 3 months: 49.9 (20.5) 6 months: 33.3 (15.6) 12 months: 30.1 (19.5) | 21 days: −11.3 (NR) 3 months: 1.5 (NR) 6 months: 3.6 (NR) 12 months: −0.2 (NR) | 21 days: 0.13 3 months: 0.84 6 months: 0.57 12 months: 0.98 |
Ewart et al. (2024)22 | 1 RCT; Hadianfard et al. (2023) 16 vs. 16 participants | Corticosteroid injections (Methylprednisolone acetate 40 mg [with 1% lidocaine]) Hallux rigidus; MOXFQ (1, 4, 8 weeks)a | 45.5 (NR) | 49.6 (NR) | 1 week: 29.1 (NR) 4 weeks: 33.1 (NR) 8 weeks: 33.1 (NR) | 1 week: 28.6 (NR) 4 weeks: 33.1 (NR) 8 weeks: 33.8 (NR) | 1 week: −0.5 (NR) 4 weeks: 0.0 (NR) 8 weeks: −0.7 (NR) | 1 week: 0.93 4 weeks: 1.0 8 weeks: 0.82 |
Ewart et al. (2024)22 | 1 RCT; Yelland et al. (2011) 14 vs. 15 participants | Eccentric loading exercises only Achilles tendinosis; VISA-A (6 weeks, 3, 6, 12 months) | 50.3 (NR) | 57.6 (NR) | 6 weeks: 74.5 (NR) 3 months: 76.4 (NR) 6 months: 81.6 (NR) 12 months: 91.5 (NR) | 6 weeks: 70.3 (NR) 3 months: 79.7 (NR) 6 months: 76.3 (NR) 12 months: 81.5 (NR) | 6 weeks: 4.2 (NR) 3 months: −3.3 (NR) 6 months: 5.3 (NR) 12 months: 10.0 (NR) | 6 weeks: 0.005 3 months: NR 6 months: NR 12 months: 0.007 |
Hand pain conditions | ||||||||
Ewart et al. (2024)22 | 1 RCT; Hooper et al. (2011) 20 vs. 19 participants | 1% lidocaine 5 mL using same injection technique Midcarpal or scapholunate ligament laxity; PRWE (3, 12 months) Physical performance: Grip strength, flexion, extension, supination, pronation (12 months) | PRWE 43.4 (11.9) | 42.2 (14.9) | NR | NR | NR | 3 months: 0.48 12 months: 0.04 |
Ewart et al. (2024)22 | 1 RCT; Hooper et al. (2011) 20 vs. 19 participants | 1% lidocaine 5 mL using same injection technique Midcarpal or scapholunate ligament laxity; PRWE (3, 12 months) Physical performance: Grip strength, flexion, extension, supination, pronation (12 months) | Physical performance NR | NR | NR | NR | NR | Grip strength: 0.40 Flexion: 0.50 Extension: 0.59 Supination: 0.53 Pronation: 0.90 Ulnar deviation: 0.65 Radial deviation: 0.22 |
Ewart et al. (2024)22 | 1 RCT; Jahangiri et al. (2014) 30 vs. 30 participants | Corticosteroid injections (40 mg methylprednisolone acetate [with 2% lidocaine]) in the snuffbox and intra- and peri-articular locations Osteoarthritis of first carpometacarpal (CMC) joint; HAQDI (1, 2, 6 months) Lateral Pinch Strength (1, 2, 6 months)a | HAQDI 4.6 (1.8) | 4.37 (1.4) | NR | NR | 1 month: −0.5 (NR) 2 months: −1.0 (NR) 6 months: −1.0 (NR) | 1 month: 0.15 2 months: 0.01 6 months: 0.01 |
Ewart et al. (2024)22 | 1 RCT; Jahangiri et al. (2014) 30 vs. 30 participants | Corticosteroid injections (40 mg methylprednisolone acetate [with 2% lidocaine]) in the snuffbox and intra- and peri-articular locations Osteoarthritis of first carpometacarpal (CMC) joint; HAQDI (1, 2, 6 months) Lateral Pinch Strength (1, 2, 6 months)a | Lateral pinch strength 9.6 (3.4) | 11.6 (3.6) | NR | NR | 1 month: −2.9 (NR) 2 months: −1.1 (NR) 6 months: −0.8 (NR) | 1 month: 0.005 2 months: 0.25 6 months: 0.45 |
Ewart et al. (2024)22 | 1 RCT; Ustun et al. (2023) 23 vs. 23 participants | Paraffin wax Bilateral hand osteoarthritis; DHI (2 weeks, 1, 3 months)a | 16.76 (10.73) | 8.90 (5.38) | 2 weeks: 9.43 (7.49) 1 month: 5.86 (4.22) 3 months: 5.57 (3.57) | 2 weeks: 4.52 (4.23) 1 month: 4.00 (3.38) 3 months: 3.90 (3.69) | 2 weeks: 4.91 (NR) 1 month: 1.86 (NR) 3 months: 1.67 (NR) | 2 weeks: 0.004 1 month: 0.20 3 months: 0.064 |
Other conditions | ||||||||
Ewart et al. (2024)22 | 1 observational study; Abd et al. (2019) 60 vs. 60 participants | Repetitive transcranial magnetic stimulation (rTMS) 10 Hz Fibromyalgia; FIQR (1, 2 months)a | 61.95 (9.75) | 65.00 (8.64) | 1 month: 48.42 (8.87) 2 months: 31.23 (10.67) | 1 month: 52.43 (11.27) 2 months: 51.71 (12.57) | 1 month: −4.01 (NR) 2 months: −20.48 (NR) | 1 month: 0.294 2 months: < 0.001 |
Ewart et al. (2024)22 | 1 RCT; Gul et al. (2020) 20 vs. 21 participants | PT or home exercise program Hip osteoarthritis due to developmental dysplasia; VAS (21 days, 3 months, 6 months, 12 months) | 7.83 (1.19) | 7.43 (1.12) | 21 days: 4.65 (1.40) 3 months: 3.82 (2.05) 6 months: 3.17 (2.44) 12 months: 3.26 (2.32) | 21 days: 5.52 (1.08) 3 months: 3.82 (2.05) 6 months: 4.56 (2.33) 12 months: 3.26 (2.32) | 21 days: −0.87 (NR) 3 months: −1.00 (NR) 6 months: −1.39 (NR) 12 months: −1.26 (NR) | 21 days: 0.024 3 months: 0.045 6 months: 0.027 12 months: 0.011 |
Ewart et al. (2024)22 | 1 observational study; Senturk et al. (2017) 21 vs. 13 participants | 5 mg/kg naproxen sodium twice daily Tietze syndrome; VAS (1 day, 1 week, 4 weeks) | 7.1 (1.2) | 7.2 (1.2) | 1 day: 2.2 (0.9) 1 week: 2.1 (1.0) 4 weeks: 1.5 (0.7) | 1 day: 2.6 (1.0) 1 week: 2.1 (1.0) 4 weeks: 2.6 (0.8) | 1 day: −0.40 (NR) 1 week: −0.70 (NR) 4 weeks: −1.10 (NR) | 1 day: NR 1 week: NR 4 weeks: 0.001 |
AOS = Ankle Osteoarthritis Scale; CI = confidence interval; DHI = Duruoz Hand Index; FIQR = Revised Fibromyalgia Impaction Questionnaire; KL = Kellgren-Lawrence; HAQDI = Health Assessment Questionnaire Disability Index; MOXFQ = Manchester-Oxford foot questionnaire; NR = not reported; OKS = Oxford Knee Score; PRP = platelet-rich plasma; PRWE = Patient Rated Wrist Evaluation; PT = physical therapy; RCT = randomized controlled trials; SD = standard deviation; SMD = standardized mean difference; SR = systematic review; VAS = visual analogue scale; VISA-A = Victorian Institute of Sport Assessment-Achilles; VISA-P = Victorian Institute of Sport Assessment-Patella; vs. = versus; WOMAC = Western Ontario and McMaster Universities Arthritis Index.
aAdditional results related to this study are available in the original SR.22
Appendix 6: Overlap Between Included Systematic Reviews
Please note that this appendix has not been copy-edited.
Table 22: Overlap in Relevant Primary Studies Between Included Systematic Reviews
Primary study citation | Qafesha et al. (2026)24 | Saramantos et al. (2025)25 | Thamrongskulsiri et al. (2025)26 | Zhou et al. (2025)27 | Ewart et al. (2024)22 |
|---|---|---|---|---|---|
Abd EL, et al. J Back Musculoskelet Rehabil. 2019;32(1):55-62. | No | No | No | No | Yes |
Abd Karim S, et al. J Sports Med Phys Fit. 2023;63(5):674-684. | No | No | No | No | Yes |
Ahadi T, et al. Pain med. 2019;20(9):1745-1749. | No | No | No | No | Yes |
Akcay S, et al. J Altern Complement Med. 2020;26(12):1159-1168. | No | No | No | No | Yes |
Akpancar S, Gul D. Med Sci Monit. 2019;25:5640-5647. | No | No | No | No | Yes |
Apaydin H, et al. J Altern Complement Med. 2020;26(12):1169-1175. | No | No | No | No | Yes |
Arafat S, Elbaz M. Egypt Dent J. 2019;65(3):2125-2131. | No | No | No | Yes | Yes |
Asheghan M, et al. J Foot Ankle Surg. 2021;27(6):643-649. | No | No | No | No | Yes |
Babaeian Z, et al. J Rehabilit Sci Res. 2022;9(2):60-64. | No | No | No | No | Yes |
Babaei-Ghazani A, et al. Am J Phys Med Rehabil. 2023 | No | No | No | No | Yes |
Bayat M, et al. Orthop Res Rev. 2019;11:167-175. | No | No | No | No | Yes |
Bayat M, et al. Anesthesiol Pain Med. 2023;13(2):e134415. | No | No | No | No | Yes |
Baygutalp F, et al. Appl Sci. 2021;11(21)9991. | No | No | No | No | Yes |
Bertrand H, et al. Arch Phys Med Rehabil. 2016;97(1):17-25. | No | No | Yes | No | Yes |
Bhargava D, et al. J Maxillofac Oral Surg. 2023;22(1):110-118. | No | Yes | No | Yes | Yes |
Calisal E, et al. MBSJOHS. 8(2022):249-257. | Yes | No | No | No | No |
Chang Y-J, et al. Arch Phys Med Rehabil. 2021;102(2):245-250. | No | No | Yes | No | Yes |
Chhapane A, et al. J Maxillofac Oral Surg. 2024;23(2):278-284. | No | No | No | Yes | Yes |
Cho SI, et al. Gazz Med Ital Arch Sci Med. 2017;176(6):330-337. | No | No | No | No | Yes |
Ciftci YGD, et al. Arch Phys Med Rehabil. 2023; 104(2):179-187. | No | No | No | No | Yes |
Cole B, et al. Shoulder Elb. 2018; 10(3):170-178. | No | No | No | No | Yes |
Deb D, et al. Int J Res Med Sci. 2020; 8:4056. | No | No | No | No | Yes |
Derby R, et al. Pain Physician. 2004;7(1):63-66. | No | No | No | No | Yes |
Dumais R, et al. Pain medicine. 2012;13(8):990‑9. | No | No | No | No | Yes |
Elwerfelli A, et al. Alex Dent J. 2019;44:1-7. | No | No | No | No | Yes |
Ersen O, et al. Turk J Phys Med Rehabil. 2018;64(1):59-65. | No | No | No | No | Yes |
George J, et al. Scientifica. 2018;4384159. | No | No | No | No | Yes |
Gibaly A, et al. Clin Oral Investig. 2024, 28, 475. | No | Yes | No | No | No |
Gul D, et al. Med Sci Monit. 2020;26:e919166. | No | No | No | No | Yes |
Gupta GK, et al. JFMPC. 2022;11(10):6345-6349. | No | No | No | No | Yes |
Hadianfard M, et al. Iran Rehabil J. 2023; 21(1):127‑134. | No | No | No | No | Yes |
Haggag MA, et al. J. Cranio-Maxillofac Surg. 2022; 50(5):426-431. | No | Yes | No | No | Yes |
Hashemi M, et al. Anesthesiol Pain Med. 2015;5(5):e27585. | No | No | No | No | Yes |
Hassanien N, et al. Egypt Dent J. 2020;66:95-106. | No | No | No | No | Yes |
Hooper RA, et al. Int Musculoskelet Med. 2011;33(3):100-106. | No | No | No | No | Yes |
Hosseini B, et al. Open Access Rheumatol.: Res Rev. 2019;11:269-274. | No | No | No | No | Yes |
Hsieh R-L, et al. Arch Phys Med Rehabil. 2022;103(8): 1505-1514. | No | No | No | No | Yes |
Jahangiri A, et al. J Orthop Sci. 2014;19(5):737-43. | No | No | No | No | Yes |
Karakilic GD, et al. J Foot Ankle Surg. 2023 | Yes | No | No | No | Yes |
Kaya SS, et al. Turk J Phys Med Rehabil. 2022;68(2): 205-213. | No | No | No | No | Yes |
Kazempour Mofrad M, et al. J Clin Rheumatol. 2021; 27(4):136-142. | No | No | Yes | No | Yes |
Kesikburun S, et al. J Foot Ankle Surg. 2022;61(1):48‑52. | No | No | No | No | Yes |
Kilic S, et al. Int J Oral Maxillofac Surg. 2016;45(7):813-9. | No | Yes | No | Yes | Yes |
Kim WM, et al. J Altern Complement Med. 2010;16(12) 1285-90. | No | No | No | No | Yes |
Kim E, et al. PM R. 2014;6(2):152-8. | No | No | No | No | Yes |
Lee DH, et al. Arch Phys Med Rehabil 2015;96:2027‑32. | No | No | Yes | No | No |
Lin L-C, et al. Eur J Phys Rehabil Med. 2019;55(4):480-487. | No | No | Yes | No | Yes |
Lin L-C, et al. Arch Phys Med Rehabil. 2022;103(2):237-244. | No | No | Yes | No | Yes |
Lin L-C, et al. Am J Phys Med Rehabil. 2023;102(10):867-872. | No | No | No | No | Yes |
Louw WF, et al. Mayo Clin Proc. 2019;94(5):820-832. | No | Yes | No | No | Yes |
Mahmoud N, et al. Egypt Dent J. 2018;64:1055-1069. | No | No | No | No | Yes |
Mansiz-Kaplan B, et al. Am J Phys Med Rehabil. 2020;99(4):318-324. | No | No | No | No | Yes |
Mofrad M, et al. JCR. 2021;27(4):136-142. | No | No | No | No | Yes |
Mousa BF, et al. Benha Med J. 2025;42(8):11-22. | Yes | No | No | No | No |
Moussa MS, et al. Int J Health Sci (Qassim). 2022; 3610-3620. | No | No | No | Yes | No |
Mruthyunjaya SP, et al. J Musculoskelet Res. 2023;26(1):2350002. | No | No | No | No | Yes |
Mustafa R, et al., et al. J. Craniofacial Surg. 2018;29(5):e461-e465. | No | Yes | No | Yes | Yes |
Nasiri A, et al. Adv Biomed Res. 2021;10:12. | No | No | No | No | Yes |
Ozturk MU, et al. Clin Rheumatol. 2023;42(12):3321-3331. | No | No | No | No | Yes |
Pandey SK, et al. Natl J Maxillofac Surg. 2022;13(3):398-404. | No | No | No | No | Yes |
Pishgahi A, et al. IJAAI. 2020;19(3):243-252. | No | No | No | No | Yes |
Priyadarshini S, et al. J Cranio-Maxillofac. Surg. 2021;49(1):24-28. | No | Yes | No | No | Yes |
Puranik RG, et al. Indian J Orthop Surg. 2025;11(2):111-117. | Yes | No | No | No | No |
Rabago D, et al. Ann Fam Med. 2013a;11(3):229-37. | No | No | No | No | Yes |
Rabago D, et al. Am J Phys Med Rehabil. 2013b;92(7):587-96. | No | No | No | No | Yes |
Rahimzadeh P, et al. JRMS. 2014;19(8):696-702. | No | No | No | No | Yes |
Rahimzadeh P, et al. Clin Interv Aging. 2018;13:73‑79. | No | No | No | No | Yes |
Raissi G, et al. J Iran Med Counc. 2022;5(4):668-676. | — | — | No | No | Yes |
Raissi G, et al. Foot Ankle Spec. 2023;16(1):9-19. | Yes | — | No | No | Yes |
Ravicumar C, et al. J Cranio-Maxillofac Surg. 2024:52:477-483. | No | Yes | No | No | No |
Reeves KD, et al. ATHM. 2000;6(2):68-80. | No | No | No | No | Yes |
Refai H, et al. Br J Oral Maxillofac. Surg. 2011;69(12):2962-70. | No | Yes | No | Yes | Yes |
Rezasoltani Z, et al. Int J Rehabil Res. 2020; 43(3):219-227. | No | No | No | No | Yes |
Sam N, et al. Med. 2023; 102(30):e34356. | No | No | No | No | Yes |
Sari A, et al. J Back Musculoskelet Rehabil. 2020;33(3):387-396. | No | No | Yes | No | Yes |
Scarpone M, et al. Clin J Sport Med. 2008;18(3):248‑54. | No | No | No | No | Yes |
Senturk E, et al. J Back Musculoskelet Rehabil. 2017;30(5):975-978. | No | No | No | No | Yes |
Sert AT, et al. J Altern Complement Med. 2020;26(5):409-417. | No | No | No | No | Yes |
Seven MM, et al. Orthop Traumatol Surg Res. 2017;103(3):427-433. | No | No | Yes | No | Yes |
Sit RWS, et al. Ann Fam Med. 2020;18(3):235-242. | No | No | No | No | Yes |
Soliman D, et al. Egypt Rheumatol Rehabil. 2016;43:47. | No | No | No | No | Yes |
Teymouri F, et al. Turk J Phys Med Rehabil. 2025;71(2):139-145. | Yes | No | No | No | No |
Ugurlar M, et al. J Foot Ankle Surg. 2018;57(5):913-918. | Yes | No | No | No | No |
Umay Altas E, et al. Med Bull. 2018;56(3):102-108. | No | No | No | No | Yes |
Ustun I, et al. Eur Rev Med Pharmacol Sci. 2023;27(20):9510-9520. | No | No | No | No | Yes |
Waluyo Y, et al. J Rehabil Med. 2021;53(5):jrm00196. | No | No | No | No | Yes |
Wu Z, et al. Arch Orthop Trauma Surg. 2022;142(9):2279-2285. | No | No | No | No | Yes |
Yelland MJ, et al. Br J Sports Med. 2011;45(5):421-8. | No | No | No | No | Yes |
Yelland M, et al. BMC Musculoskelet Disord. 2019;20(1):509. | No | No | No | No | Yes |
Yildirim T, et al. Turk Klin J Med Sci. 2021;41(1):1-6. | No | No | No | No | Yes |
Yildiz KM, et al. Med Int. 2023;3(5):45. | No | No | No | No | Yes |
Zarate MA, et al. J Altern Complement Med. 2020;26(11):1064-1073. | No | Yes | No | No | Yes |
ISSN: 2563-6596
Canada’s Drug Agency (CDA-AMC) is a pan-Canadian health organization. Created and funded by Canada’s federal, provincial, and territorial governments, we’re responsible for driving better coordination, alignment, and public value within Canada’s drug and health technology landscape. We provide Canada’s health system leaders with independent evidence and advice so they can make informed drug, health technology, and health system decisions, and we collaborate with national and international partners to enhance our collective impact.
Disclaimer: CDA-AMC has taken care to ensure that the information in this document was accurate, complete, and up to date when it was published, but does not make any guarantee to that effect. Your use of this information is subject to this disclaimer and the Terms of Use at cda-amc.ca.
The information in this document is made available for informational and educational purposes only and should not be used as a substitute for professional medical advice, the application of clinical judgment in respect of the care of a particular patient, or other professional judgments in any decision-making process. You assume full responsibility for the use of the information and rely on it at your own risk.
CDA-AMC does not endorse any information, drugs, therapies, treatments, products, processes, or services. The views and opinions of third parties published in this document do not necessarily reflect those of CDA-AMC. The copyright and other intellectual property rights in this document are owned by the Canadian Agency for Drugs and Technologies in Health (operating as CDA-AMC) and its licensors.
Questions or requests for information about this report can be directed to Requests@CDA-AMC.ca.