Drugs, Health Technologies, Health Systems
Health Technology Review
Dosing of Immune Checkpoint Inhibitors
Authors: Shahab Sayfi, Quenby Mahood, Yonda Lai, Jasmeen Dourka, Rodrigue Ndabashinze, Rebecca Raj, Dipika Neupane, Kelvin Chan, Andrea C. Tricco
PROSPERO registration number: 1071290
This health technology review was conducted by the Knowledge Translation Program through the Post-Market Drug Evaluation CoLab Network.
Key Messages
What Is the Issue?
Immune checkpoint inhibitors (ICIs) are cancer therapies that boost the immune system’s ability to fight cancer cells.
ICIs differ in their dosing regimens (e.g., in terms of the use of fixed versus weight-based dosing and the length of dosing intervals). The dosing approach may influence patient outcomes.
This report assessed clinical outcomes for the following ICIs: atezolizumab, avelumab, cemiplimab, dostarlimab, durvalumab, ipilimumab, nivolumab, pembrolizumab, and tremelimumab.
What Did We Do?
We reviewed and summarized the best available evidence comparing different dosing regimens for eligible ICIs.
We summarized the clinical safety, efficacy, and effectiveness outcomes, and the pharmacokinetic and pharmacodynamic outcomes.
We employed a narrative (descriptive) approach, rather than a quantitative synthesis (meta-analysis), because of the large variation in design, populations, and outcomes across the studies.
What Did We Find?
Most comparative evidence in our data relates to pembrolizumab and nivolumab, with less evidence available for the other ICIs and comparators.
Across studies evaluating fixed dosing versus weight-based dosing, survival and progression outcomes were often similar, and toxicity rates were usually comparable.
Evidence for pharmacokinetic and pharmacodynamic outcomes suggests that fixed-dose regimens may result in average drug exposure similar to that achieved with weight-based dosing, whereas extended-interval regimens may produce higher peak concentrations and lower trough concentrations.
What Does It Mean?
For several ICIs, particularly pembrolizumab and nivolumab, different dosing regimens (fixed versus weight-based) may result in similar overall outcomes. However, our confidence in these findings is limited due to the limited availability of evidence from large randomized controlled trials and the considerable amount of evidence from inconclusive nonrandomized studies.
Across multiple ICIs (e.g., avelumab, cemiplimab, durvalumab, pembrolizumab, nivolumab), the available evidence generally suggests no consistent or clinically meaningful differences in safety or efficacy between fixed and weight-based dosing, although this conclusion is limited by risk of bias.
Pharmacokinetic and pharmacodynamic evidence indicates that differences in average drug exposure between fixed dosing and weight-based dosing are mainly peak and trough concentration differences that are unlikely to be clinically meaningful.
For some ICIs (e.g., atezolizumab, dostarlimab, tremelimumab), evidence remains sparse or insufficient, and no firm conclusions can be drawn regarding comparative efficacy or safety between dosing strategies.
Abbreviations
AE
adverse event
AMSTAR 2
A MeaSurement Tool to Assess Systematic Reviews 2
AUC
area under the concentration–time curve
AUC0–t
area under the concentration–time curve from time 0 to last measurable time point
AUCss
area under the concentration–time curve at steady state
Cavg
average (mean) concentration
Cavgd28
average concentration over 28 days
Cavgss
average concentration at steady state
CDA-AMC
Canada’s Drug Agency
Cmax
maximum concentration
Cmax1
maximum concentration after first dose or first cycle
Cmaxss
maximum concentration at steady state
Cmin
minimum (trough) concentration
Cmin-d28
minimum concentration over 28 days (study-defined)
Cminss
minimum (trough) concentration at steady state
CR
complete response
Ctrough
trough concentration
CV
coefficient of variation
DL
dose level
ER
exposure-response
FDT
fixed-dose therapy, or fixed-dose treatment (study-defined)
ICI
immune checkpoint inhibitor
INESSS
Institut national d’excellence en santé et en services sociaux
IO
immuno-oncology
irAE
immune-related adverse event
IRR
infusion-related reaction
NSCLC
non–small cell lung cancer
ORR
objective response rate
OS
overall survival
PD
pharmacodynamics
pERC
pan-Canadian Oncology Drug Review Expert Review Committee
PFS
progression-free survival
PK
pharmacokinetics
PK/PD
pharmacokinetics and pharmacodynamics
PopPK
population pharmacokinetic
PR
partial response
PRISMA
Preferred Reporting Items for Systematic reviews and Meta-Analyses
RCC
renal cell carcinoma
RCT
randomized controlled trial
ROBINS-I
Risk Of Bias In Non-randomized Studies - of Interventions
rHuPH20
recombinant human hyaluronidase PH20
SC
subcutaneous
SD
standard deviation
TRAE
treatment-related adverse event
UC
urothelial carcinoma
WAT
weight-adjusted therapy (study-defined)
Introduction and Rationale
Background
The burden of cancer in Canada remains considerable, with approximately 247,100 new cases and roughly 88,100 deaths estimated in 2024.1 Cancer care, in practice, often involves combinations of surgery, radiation, systemic therapies (such as chemotherapy and targeted therapies), and immunotherapy, depending on the cancer type, stage, and patient values and preferences.2
Immune checkpoint inhibitors (ICIs), a subclass of immunotherapy or immuno-oncology (IO) drugs, have revolutionized the treatment strategies for various cancers. ICIs restore the immune system’s ability to recognize and subsequently destroy tumour cells.3 The mechanism of action of ICIs, which are typically a type of monoclonal antibody, involves blocking the PD-1/PD-L1 and CTLA-4 immune checkpoint pathways — mechanisms that tumours exploit to suppress immune responses. Key agents include anti–PD-1 drugs (e.g., nivolumab, pembrolizumab, cemiplimab, dostarlimab), anti–PD-L1 drugs (e.g., atezolizumab, avelumab, durvalumab), and anti–CTLA-4 drugs (e.g., ipilimumab, tremelimumab). These therapies are used across various settings of cancer care (neoadjuvant, adjuvant, and metastatic) for malignancies such as melanoma, non–small cell lung cancer (NSCLC), renal cell carcinoma (RCC), and Hodgkin lymphoma.4
There are, however, immune-related adverse events (irAEs) and autoimmune complications associated with the use of ICIs that could impact patients with pre-existing autoimmune conditions.5 Dosing regimens for ICIs are diverse, with some drugs approved for fixed dosing, others for weight-based dosing, and some offering both options. This variability, as shown by the evidence in the literature, has led to differences in pharmacoeconomic implications, clinical effectiveness, and safety in different patient populations.
Policy Issue
Before 2019, there was inconsistency in the dosing of ICIs recommended by the pan-Canadian Oncology Drug Review Expert Review Committee (pERC), which usually mirrored what the pivotal trials used. Jurisdictions asked Canada’s Drug Agency (CDA-AMC) to review the evidence comparing weight-based and fixed dosing for nivolumab and pembrolizumab, which resulted in the publication of a Technology Review on the dosing and timing of IO drugs.6 This led to broad policy changes implementing the use of weight-based dosing up to a cap for nivolumab and pembrolizumab.
Since then, more ICIs have been recommended for public reimbursement by pERC, and various combinations have also become available. To further inform their policy, jurisdictions used a review prepared by l’Institut national d’excellence en santé et en services sociaux (INESSS)7 that encompassed additional ICIs and indications. The evidence reviewed in this report was dated up to June 2022. Jurisdictions are requesting that CDA-AMC update this review to synthesize the latest evidence to inform the deliberations of local expert committees regarding optimal dosing of ICIs.
Policy Question
Should a weight-based dose (with or without a cap) or a fixed dose of ICIs be used for some or all oncology indications?
Purpose
Through a review of the literature since 2020, assess the clinical evidence comparing weight-based versus fixed-dose regimens of oncology ICIs, including studies evaluating subcutaneous formulations.
Through a review of the literature since 2020, assess the pharmacometric properties, including pharmacokinetic parameters and exposure-response models, that allow comparison of weight-based and fixed dosing for oncology ICIs, including studies evaluating subcutaneous formulations.
Research Questions
The project addressed the following research questions:
What are the comparative clinical efficacy, effectiveness, and safety of dosage regimens (weight-based with or without a cap versus fixed-dose, considering various dosing frequencies) for ICI drugs across all funded indications?
What are the comparative pharmacokinetics and pharmacodynamics of dosage regimens (weight-based with or without a cap versus fixed-dose, considering various dosing frequencies) for ICI drugs across all funded indications?
Protocol Development
A review protocol was developed a priori and was followed throughout the review process. The protocol and review followed the methods of the Cochrane Handbook for Systematic Reviews for Interventions, and the reporting followed the Preferred Reporting Items for Systematic reviews and Meta-Analyses (PRISMA) checklist for systematic reviews.8
We registered the project in advance in PROSPERO (Centre for Reviews and Dissemination, University of York) (PROSPERO registration number: CRD1071290).9
Opportunities for Feedback
Interested parties were given the opportunity to comment on the proposed project scope that informed this report. They were also given the opportunity to provide feedback on the draft included studies list and the draft report. Unpublished data identified as part of the feedback process was only included if the source of data was in the public domain.
Methods
Literature Search
We conducted a comprehensive literature search in July 2025 across MEDLINE, Embase, and the Cochrane Library to identify relevant studies on weight-based versus fixed-dose IO therapies. The search was informed by a previous search as described in an INESSS report7 and a CDA-AMC (formerly CADTH) Optimal Use report.6 The literature searches were comprised of concepts related to IO therapies, dosage, and pharmacokinetics (available in Appendix 1). While the INESSS report7 was updated to June 2022, we extended the searches to publications from January 2020, which was when the original INESSS search was conducted, to the present. While the INESSS report7 was updated to June 2022, it did not include 2 additional drugs of interest — ipilimumab and tremelimumab. Because these 2 drugs were not included in the original search, a secondary search focusing on these drugs was conducted and limited to publication dates from January 1, 2020, to the present. The searches were limited to English- and French-language documents. Conference abstracts were excluded from the Embase search. The searches were executed by an experienced information specialist and peer-reviewed by another using the PRESS (Peer Review of Electronic Search Strategies) checklist, and refined accordingly.10 Complete literature searches for each database are available in Appendix 1.
We identified grey literature using the CDA-AMC Grey Matters checklist,11 covering health technology assessments, regulatory reports, and clinical trial registries. Additional sources were identified by handsearching references and preprint repositories.
We searched MEDLINE, Embase, and the Retractions Watch Database in January 2026 to identify retracted publications. None of the included studies were identified as retractions.
Selection Criteria
We included studies that met the population, intervention, comparator, and study design criteria. Studies were not included or excluded only on the basis of reported outcomes.
Criteria | Description |
|---|---|
Population | Adult patients with cancer matching 1 of the approved indications for which ICIs are recommended for reimbursement. |
Interventions | Fixed dosing with:
Combinations of an ICI with 1 or more other anticancer drugs are in scope if they are recommended by pERC.12 Note: For ipilimumab, dosing is tumour-specific and based on findings from phase II dose-finding trials. As such, studies evaluating fixed vs. weight-based dosing may be limited or unavailable. Inclusion will depend on whether eligible comparative data exist. |
Comparators | Weight-based dosing (with or without a cap) of the same drugs as listed previously. |
Outcomes | RQ1:
RQ2:
|
Study design | RQ1:
RQ2:
|
AE = adverse event; AUCss = area under the concentration–time curve at steady state; Cavg1 = average concentration after first dose or first cycle (study-defined); ICI = immune checkpoint inhibitor; pERC = pan-Canadian Oncology Drug Review Expert Review Committee; PK/PD = pharmacokinetic and pharmacodynamic; RQ = research question; SAE = serious adverse event; vs. = versus.
Population and Subgroups
We included studies that enrolled adult patients with cancer receiving an eligible ICI drug for an approved indication for which the drug is recommended for reimbursement.
Intervention and Comparators
We compared fixed (“flat”) dosing versus weight-based dosing (with or without a cap) for eligible ICIs (any route and schedule), including in-scope, pERC-recommended combination regimens. We excluded studies not directly comparing fixed versus weight-based dosing, non-English publications, and conference abstracts
Outcomes Definition
For research question 1, we assessed clinical efficacy, effectiveness and safety (e.g., overall survival [OS], progression-free survival [PFS], objective response rate [ORR], and adverse events [AEs]), plus exposure-response (ER) and/or safety and system outcomes when reported. For research question 2, we assessed pharmacokinetics and pharmacodynamics (PK/PD) outcomes (drug exposure measures and pharmacodynamic parameters) when reported.
Study Designs
For research question 1, we included randomized controlled trials (RCTs) and comparative nonrandomized studies (and relevant systematic reviews), plus dose-response and ER analyses. For research question 2, we included PK/PD studies and population pharmacokinetic (PopPK) modelling and/or simulation studies (and relevant systematic reviews).
Exclusion Criteria
We excluded articles if they did not meet the selection criteria (Table 1), were duplicate records or publications, were published before 2020, were non-English, or were conference abstracts.
Study Selection Process
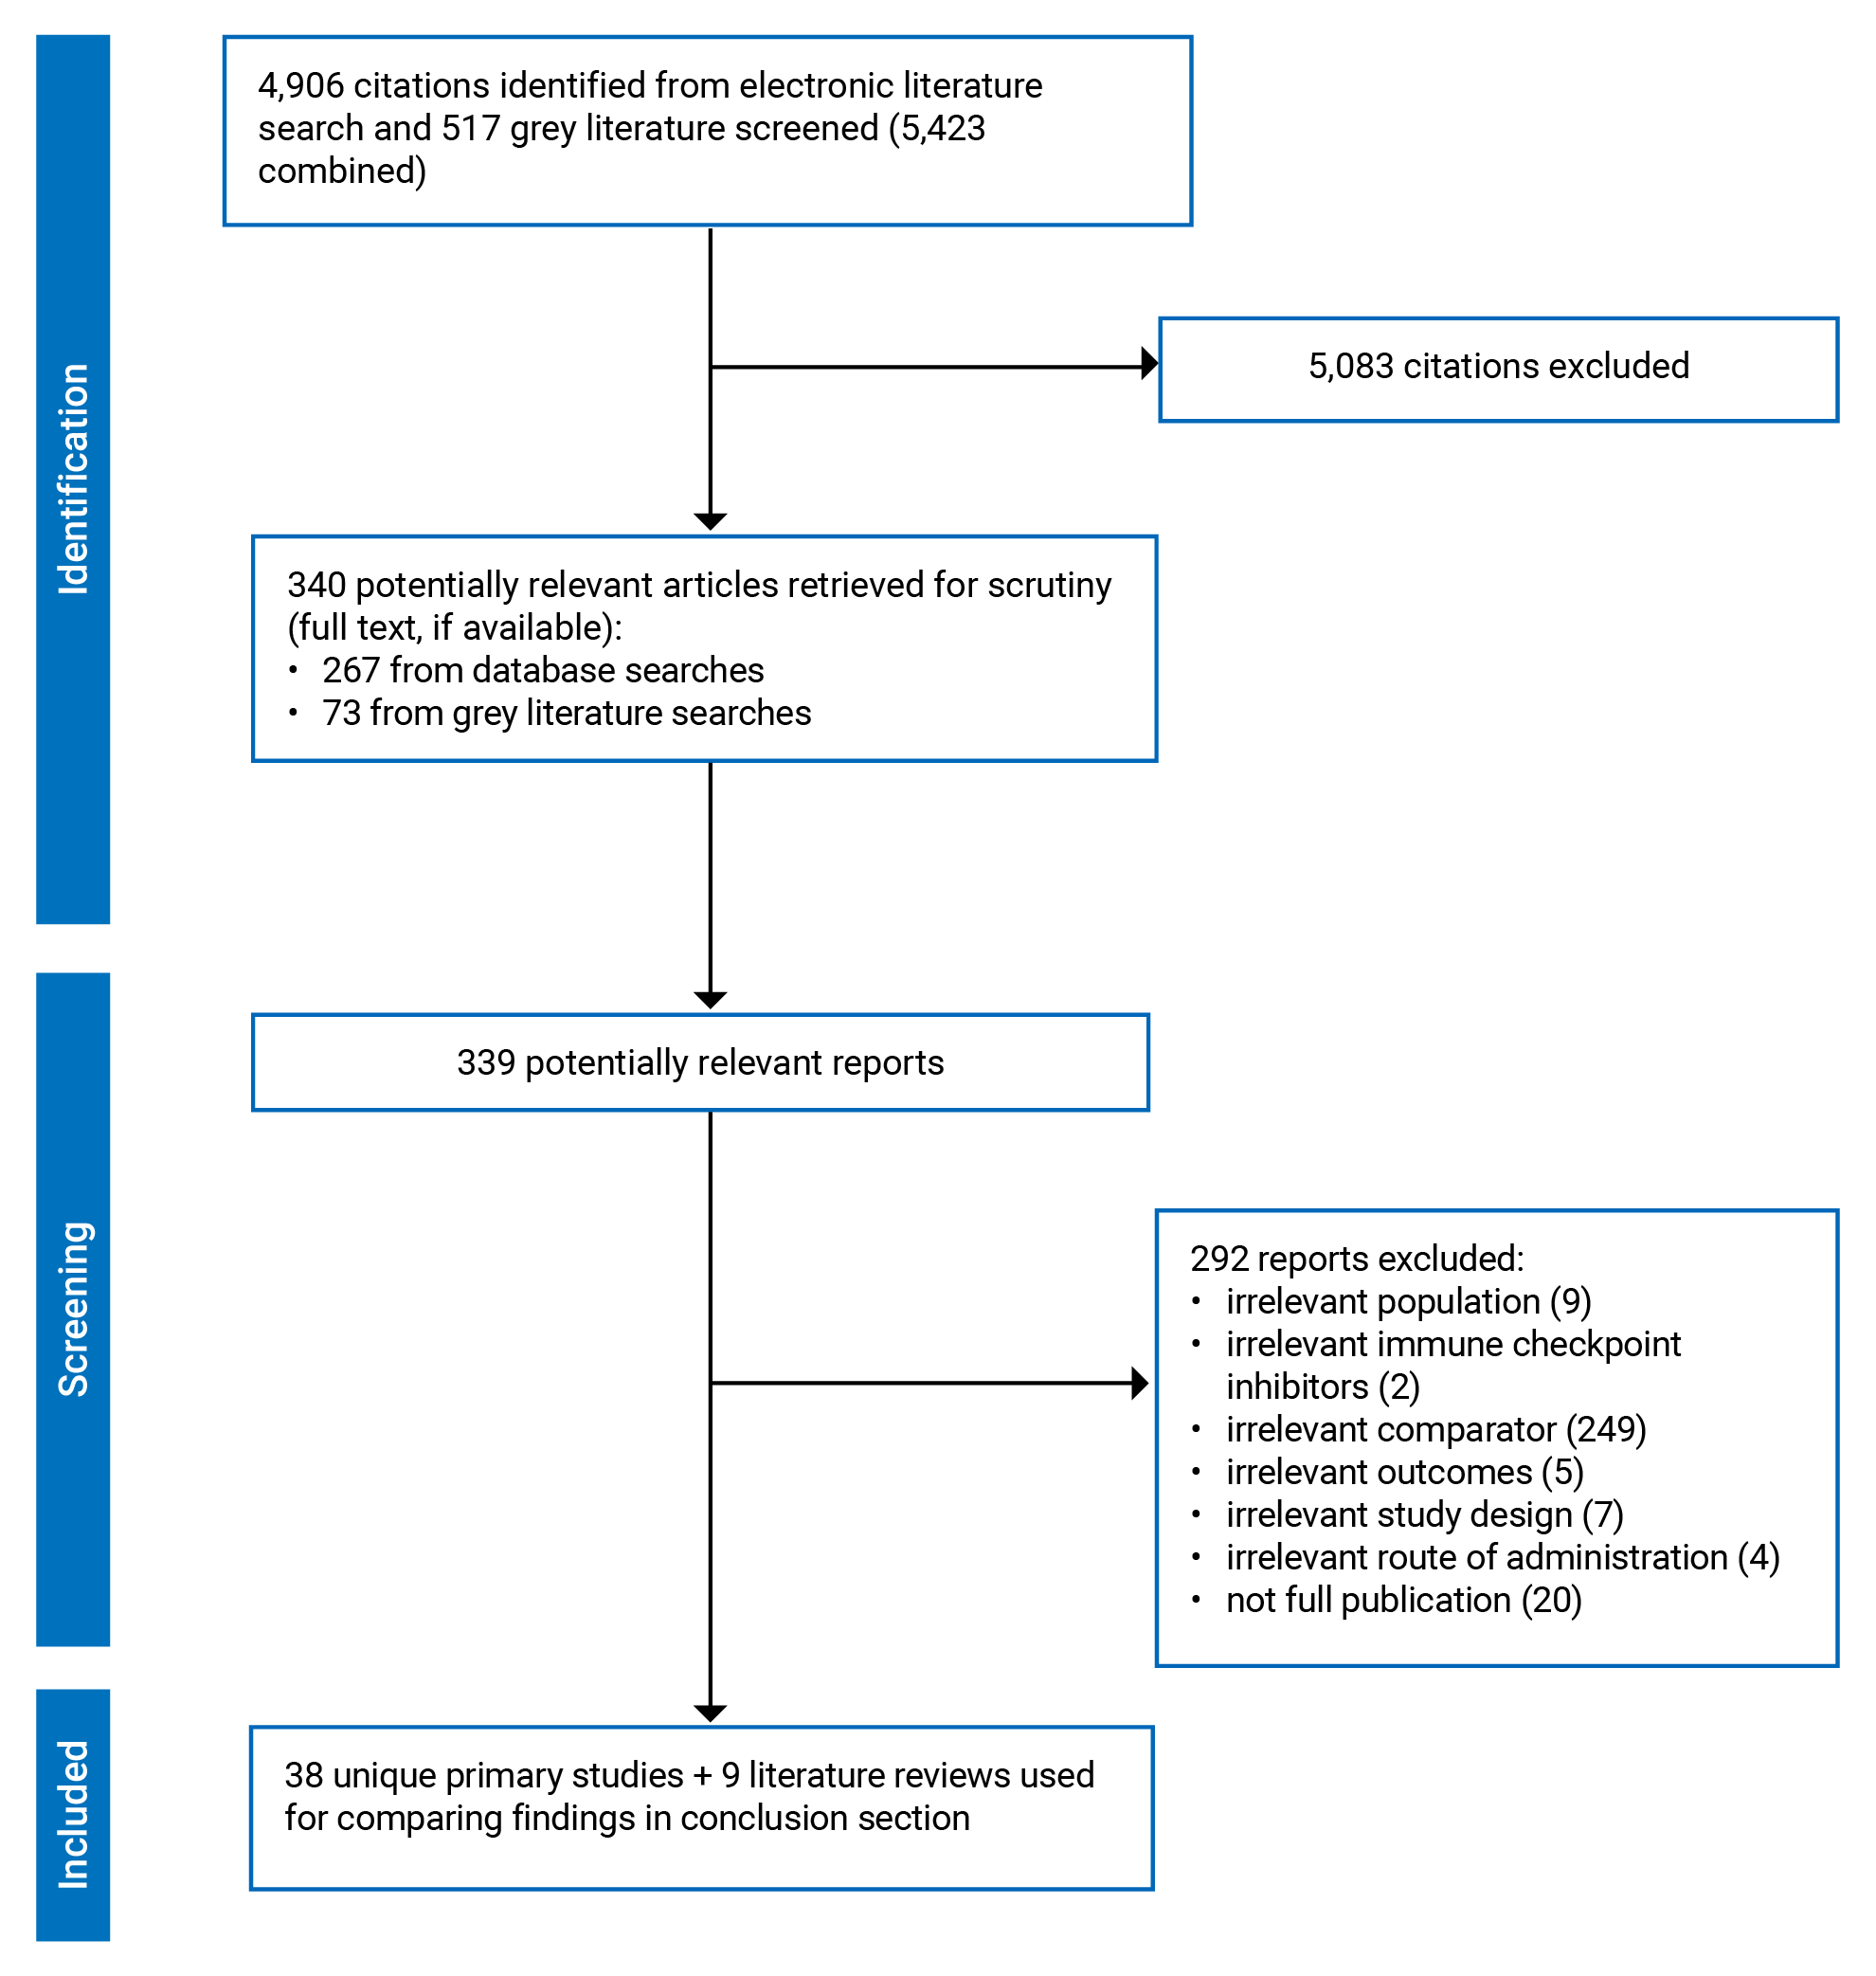
Search results were imported into DistillerSR, online software for systematic review management.13 The research team pilot-tested the inclusion criteria (Table 1) on a random sample of 50 titles and abstracts (or citations) for the first level of screening, and 25 full-text articles for the second level. Once a minimum agreement of 75% was achieved, 2 reviewers independently screened titles and abstracts for relevance to the clinical research questions. Full-texts of potentially relevant articles were retrieved and independently assessed for possible inclusion based on the predetermined selection criteria. The 2 reviewers then compared their chosen included and excluded studies and discussed their conflicts until consensus was reached. If a consensus was not reachable, a third person (the principal investigator and a clinical expert) helped with the judgment. The study selection process was presented in a PRISMA 2020 flow chart (Figure 1).8
Quality Assessment
We applied the revised Cochrane risk of bias tool for randomized trials (ROB 2) to each of the included RCTs that reported at least 1 outcome of interest.14 The ROB 2 tool contains 6 unique domains: sequence generation, allocation concealment, blinding, incomplete outcome data, selective outcome reporting, and other issues.
In a ROB table, each domain includes 1 or more signalling questions, and we created a form that was consistent with the ROB 2 template. The first part of the form characterizes the study’s information; the second part involves judgments related to methodological quality of the study by answering prespecified questions about the adequacy of the study in relation to the item, including a judgment of low, high, or unclear risk of bias.
For each unique RCT, we evaluated the quality of the original primary publication while consulting details from supporting literature (e.g., published protocol, ClinicalTrials.gov records, and appendices), as necessary.
We applied the Risk Of Bias In Nonrandomized Studies - of Interventions (ROBINS-I) tool for nonrandomized intervention studies.15 The tool assesses risk of bias across 7 domains: bias due to confounding, bias in selection of participants into the study, bias in classification of interventions, bias due to deviations from intended interventions, bias due to missing data, bias in measurement of outcomes, and bias in selection of the reported result. Judgments were made for each domain and summarized as an overall ROBINS-I risk-of-bias judgment for each study.
We employed the updated version of A MeaSurement Tool to Assess Systematic Reviews (AMSTAR 2) tool for systematic reviews.16 This tool contains 16 items and allows a thorough methodological evaluation of systematic reviews, from early stages (e.g., research question development and the defining of Population, Intervention, Comparator, Outcome [PICO] elements) through to the conduct of searching and screening, as well as data analysis and interpretation.
Before full assessment, we pilot-tested each risk-of-bias tool on a sample of 1 or 2 included studies to ensure consistent interpretation of criteria and clarify uncertainties. To promote agreement, we discussed the conflicts in detail. All quality assessments were conducted by 1 reviewer and verified by a second reviewer. Conflicts were resolved by discussion or the involvement of a third reviewer.
Following the risk-of-bias assessments, we used ROBINS-I-style tables (Table 3, Table 4, and Figure 2) to visualize the judgments using traffic-light displays.17
Data Extraction
We extracted the information using a standardized data abstraction form. We pilot-tested the data extraction form using a sample of 5 included studies to ensure consistency in data interpretation, refine the abstraction items, and improve clarity. We used the feedback from the pilot test to revise the form before commencing full data extraction.
For each included study, we primarily extracted data from the original publication, with supplementary information obtained from companion reports and trial registry records, when needed. When multiple publications for a single study were available (e.g., online appendices or companion publications reporting different outcomes or follow-up), the most recently adjudicated results for each outcome were extracted, with preference given to peer-reviewed sources.
The abstraction form captured data across 5 domains: study characteristics, participant characteristics, dosing and intervention characteristics, clinical efficacy and safety outcomes, and PK/PD outcomes. Extracted items encompassed information on study design, setting, cancer indication, and line of therapy; eligibility criteria and baseline characteristics (e.g., age; sex; Eastern Cooperative Oncology Group performance status; weight, body mass index, or body surface area; comorbidities; prior therapies); intervention and comparator details (drug, dose, route, frequency, duration, cotreatments, and dosing strategy); clinical outcomes (e.g., ORR, PFS, OS) and safety outcomes (e.g., AEs/SAEs, grade ≥ 3 events, discontinuations, treatment-related deaths) with measurement time points, including arm-level results and comparative effect estimates when reported; and PK/PD parameters (e.g., minimum (trough) concentration [Cmin] and maximum concentration [Cmax], area under the concentration–time curve [AUC] and area under the concentration–time curve at steady state [AUCss], average [mean] concentration [Cavg], half-life, target occupancy) and ER/exposure-safety findings, if available.
Data Analyses and Synthesis
We synthesized the studies descriptively by summarizing study characteristics, patient characteristics, risk-of-bias assessments, and outcome results.
Results
Selection of Primary Studies
Following deduplication, 5,423 records were screened based on title and abstract, and 339 records were assessed in full text. Of the full-text records, 292 were excluded with reasons (irrelevant population; irrelevant ICI; irrelevant comparator; irrelevant outcomes; irrelevant study design; published in a language other than English or French; full publication not available), and 38 unique primary studies were included in the final synthesis. We tabulated lists of included and excluded full-text records in Appendix 5 and 6, respectively. The study selection process is summarized in the PRISMA flow chart (Figure 1).
Study and Patient Characteristics
Of the 38 primary studies, there were 2 RCTs, 22 nonrandomized studies, and 14 modelling and/or simulation studies. Most studies were conducted in high-income countries, with multicentre designs being most common in RCTs and nonrandomized studies. Nivolumab was the most frequently evaluated ICI across all study designs, followed by pembrolizumab. Hospital settings were most common in RCTs and nonrandomized studies. Most studies predominantly included male participants. Eastern Cooperative Oncology Group performance status and prior therapies were often reported, yet comorbidities were frequently not reported, especially in nonrandomized studies. In addition, we found 9 review articles, assessed their methodological quality, and compared their findings with our results in the Conclusions and Implications for Decision- or Policy-Making section.18-26 Study characteristics are available in Table 8 Appendix 2.
Table 2: Summary of Intervention and Patient Characteristics From Primary Studies (n = 38)
Characteristics | Summary: n (%) | ||
|---|---|---|---|
RCTs (n = 2) | Nonrandomized studies (n = 22) | Modelling and/or simulation studies (n = 14) | |
Country income classificationa |
|
|
|
Centre |
|
|
|
Reported ICI(s) |
|
|
|
Study setting |
|
|
|
Funding source type |
|
|
|
Sexb |
|
|
|
Age |
|
|
|
ECOG performance status reported |
|
|
|
Weight, BSA, or BMI range |
|
|
|
Comorbidities |
|
|
|
Prior therapies |
|
|
|
BMI = body mass index; BSA = body surface area; ECOG = Eastern Cooperative Oncology Group; GNI = gross national income; ICI = immune checkpoint inhibitor; NA = not applicable; NR = not reported; RCT = randomized controlled trial.
aHigh-income = GNI per capita ≥ US$13,935 USD; middle-income = GNI per capita between US$1,136 and US$13,935.27
bValues represent the number (%) of studies in which more than 50% of participants were female or male.
Critical Appraisal
Overall, methodological quality for the included studies was generally at serious risk of bias. The included reviews commonly had weaknesses in prespecification of their methodology and in the search, selection, and extraction processes, and there was a limited assessment of heterogeneity and publication bias — factors that can deviate the effect estimates from the true effects.
For the RCTs, both included studies were judged to have some concerns, particularly due to the absence of prespecified analysis plans in their protocols, the open-label design that may have introduced assessment bias, and nonrigorous statistical approaches (e.g., analyzing treated rather than randomized patients).
Similarly, the included nonrandomized studies were characterized by serious risk of bias, largely due to confounding.
Regarding relevance to Canada, populations, interventions, comparators, and outcomes were generally clinically applicable, but generalizability is constrained by several factors. For example, some evidence came from settings outside of Canada where treatment access, monitoring practices, and supportive care may differ from oncology practice in Canada. Furthermore, factors such as tumour type, baseline prognosis, patient characteristics, and variation in care delivery and monitoring may impact clinical outcome results.
Table 3: Risk-of-Bias Assessment Using RoB 2 for the Included RCTs
First author (year) | Risk of bias domain | |||||
|---|---|---|---|---|---|---|
Randomizationa | Deviationb | Missing datac | Measurementd | Results selectione | Overall risk-of-bias | |
Albiges (2025)28 | Low | Low | Low | Low | Some | Some |
Herrera (2021)29 | Low | Some | Low | Some | Low | Some |
RCT = randomized controlled trial.
aIndicates bias arising from the randomization process.
bIndicates bias due to deviations from the intended intervention.
cIndicates bias due to missing outcome data.
dIndicates bias in the measurement of the outcome.
eIndicates bias in the selection of the reported results.
Table 4: Risk-of-Bias Assessment Using ROBINS-I for the Included Nonrandomized Studies
First author (year) | Risk-of-bias domain | |||||||
|---|---|---|---|---|---|---|---|---|
Confoundinga | Participant selectionb | Classificationc | Deviationd | Missing datae | Measurementf | Results selectiong | Overall risk of bias | |
Campo Le Brun (2025)30 | Serious | Low | Low | Moderate | Moderate | Moderate | Moderate | Serious |
Horisaki (2025)31 | Serious | Low | Low | Moderate | Moderate | Moderate | Moderate | Serious |
Hughes (2025)32 | Serious | Low | Low | Moderate | Moderate | Moderate | Moderate | Serious |
Smeenk (2025)33 | Serious | Low | Low | Moderate | Moderate | Moderate | Moderate | Serious |
Staender (2025)34 | Serious | Low | Low | Moderate | Moderate | Moderate | Moderate | Serious |
Chaitesipaseut (2024)35 | Serious | Serious | Low | Moderate | Moderate | Low | Moderate | Serious |
Grit (2024)36 | Serious | Low | Low | Moderate | Moderate | Moderate | Moderate | Serious |
Leroy (2024)37 | Serious | Low | Low | Moderate | Moderate | Moderate | Moderate | Serious |
Patel (2024)38 | Serious | Serious | Low | Moderate | Moderate | Moderate | Moderate | Serious |
Rischin (2024)39 | Serious | Low | Low | Moderate | Low | Moderate | Moderate | Serious |
Berard (2023)40 | Serious | Low | Low | Moderate | Moderate | Moderate | Moderate | Serious |
Samlowski (2023)41 | Serious | Serious | Low | Moderate | Moderate | Moderate | Moderate | Serious |
Fujiwara (2022)42 | Serious | Low | Low | Moderate | Moderate | Moderate | Moderate | Serious |
Hijmering-Kappelle (2022)43 | Serious | Serious | Low | Moderate | Low | Moderate | Moderate | Serious |
Iikura (2022)44 | Serious | Moderate | Low | Moderate | Moderate | Moderate | Moderate | Serious |
Okada (2022)45 | Serious | Low | Low | Moderate | Low | Moderate | Moderate | Serious |
Patnaik (2022)46 | Serious | Low | Low | Moderate | Moderate | Moderate | Moderate | Serious |
To (2022)47 | Serious | Low | Low | Moderate | Moderate | Moderate | Moderate | Serious |
Juergens (2020)48 | Serious | Low | Low | Moderate | Moderate | Moderate | Moderate | Serious |
Kato (2020)49 | Serious | Low | Low | Moderate | Moderate | Moderate | Moderate | Serious |
Rischin (2020)50 | Serious | Low | Low | Moderate | Moderate | Moderate | Moderate | Serious |
aIndicates bias due to confounding.
bIndicates bias in the selection of the participants.
cIndicates bias in the classification of the interventions.
dIndicates bias due to deviations from the intended interventions.
eIndicates bias due to missing data.
fIndicates bias in the measurement of the outcomes.
gIndicates bias in the selection of the reported results.
Figure 2: Risk-of-Bias Assessment Using AMSTAR 2 for the Included Reviews
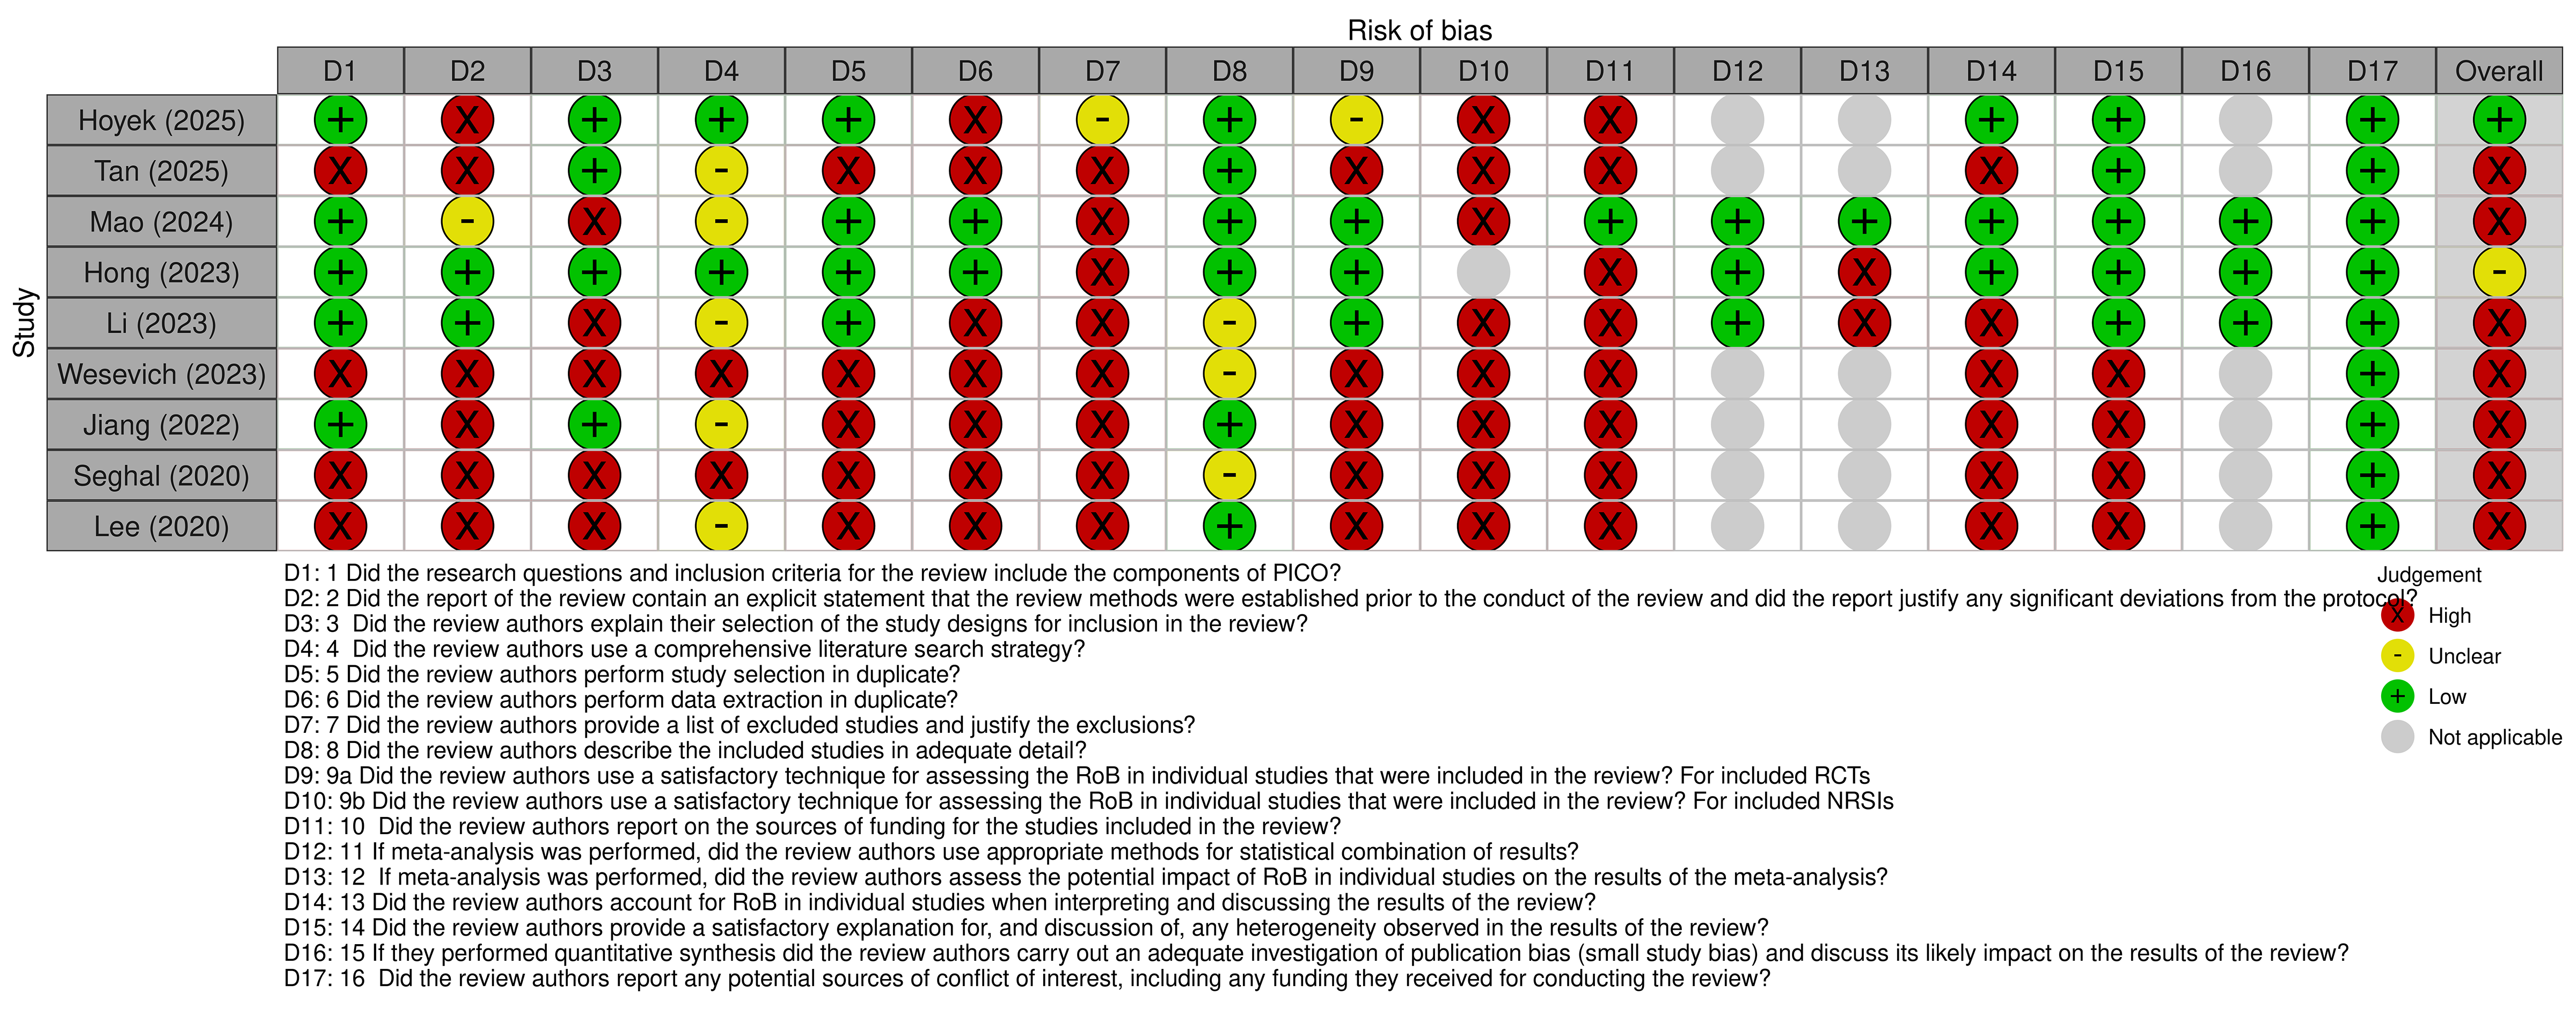
NRSI = nonrandomized study of interventions; PICO = population, intervention, comparator, and outcomes; RCT = randomized controlled trial; RoB = risk of bias.
Findings
Limited direct “head-to-head” clinical evidence comparing fixed versus weight-based (or alternative) dosing makes the interpretation and clinical decisions more challenging; therefore, definitive conclusions cannot be made.
Studies on nivolumab and pembrolizumab generally suggest that fixed dosing results are similar to those of weight-based dosing for survival and cancer control, and serious immune-related side effects are usually similar across dosing regimens.
Evidence for PK/PD outcomes suggests that fixed-dose regimens may result in average drug exposure similar to that achieved with weight-based dosing, whereas extended-interval regimens may produce higher peak concentrations and lower trough concentrations.
Efficacy, Effectiveness, and Safety Outcomes
Safety, efficacy, and effectiveness outcomes are summarized by publication in Table 13 Appendix 3.
Atezolizumab
Only 1 study reported on this ICI.
Patel38 was a retrospective cohort study including 100 patients treated with nivolumab (n = 47), pembrolizumab (n = 36), durvalumab (n = 9), or atezolizumab (n = 8). The study included 3 dosing groups — arm 1 (conventional dose; fixed approved dosing), arm 2 (per-body-weight dose), and arm 3 (low dose) — with low-dose atezolizumab defined as 1 mg/kg every 3 weeks. The study is at serious risk of bias, mainly because of serious confounding, given that the nonrandomized dosing groups differed in ICI type, tumour type, clinical setting, and concomitant treatments, and no adjusted analysis was reported. Clinical outcomes were presented only at the overall dosing-group level, not separately by drug. In the palliative setting, arm 1 had complete response (CR) in 2 of 18 patients (11.1%), partial response (PR) in 11 of 18 patients (61.1%), and progressive disease in 5 of 18 patients (27.8%), corresponding to an ORR of 72.2%. Arm 2 had CR in 2 of 23 patients (8.7%), PR in 12 of 23 patients (52.2%), and progressive disease in 9 of 23 patients (39.1%), corresponding to an ORR of 60.9%. Arm 3 had CR in 0 of 37 patients (0%), PR in 28 of 37 patients (75.7%), and progressive disease in 9 of 37 patients (24.3%), corresponding to an ORR of 75.7%. Median follow-up was 10.2 months for conventional, fixed dosing, 9.8 months for per-weight dosing, and 3.9 months for low-dose treatment. Median OS was reported only for the overall cohort (6.8 months, range 4.6 to 9.0), with no arm-specific OS estimates provided. Safety outcomes, including AEs and irAEs, were not reported.
Overall, the study suggests that weight-based and lower-dose ICI regimens may provide similar safety and efficacy outcomes to fixed-dose regimens.
Avelumab
A total of 3 studies (Herrera, Masters, and Novakovic)29,51,52 reported on this ICI.
Herrera29 was a phase Ib randomized, open-label, parallel-arm PK/PD clinical trial including 31 patients. It evaluated IV avelumab (1-hour infusion) across 4 fixed-dose regimens (70 mg every 2 weeks, 350 mg every 2 weeks, 500 mg every 2 weeks, and 500 mg every 3 weeks) and 1 weight-based dosing regimen (10 mg/kg every 2 weeks). The overall methodological quality of the trial was judged to have some concerns due to deviations from intended interventions (i.e., inclusion of dosing schedules that are lower intensity than those used in clinical practice), including inconsistent appropriate analyses across outcomes, and potential bias in outcome measurement arising from the unblinded open-label design.
Overall, the ORR across all randomized patients was 41.9%, with a median PFS of 5.7 months and a 1-year PFS rate of 18.2%. Among treated patients, any-grade treatment-related AEs (TRAEs) occurred in 86.7%, grade 3 or higher TRAEs in 43.3%, grade 3 or higher irAEs in 16.7%, and treatment discontinuation due to AEs in 19.4%; 1 treatment-related death due to pneumonitis was reported. Because each treatment arm was very small, arm-level efficacy comparisons should be interpreted cautiously; numerically, the 10 mg/kg every-2-weeks arm had a higher ORR than the 70 mg every-2-weeks, 350 mg every-2-weeks, and 500 mg every-2-weeks arms, but had a lower ORR than the 500 mg every-3-weeks arm.
Masters51 was a model-informed drug development study using PopPK modelling, simulation, and ER logistic regression analyses based on trial datasets, including 2,315 patients in the pooled PopPK dataset. The study compared weight-based avelumab 10 mg/kg IV every 2 weeks with flat-dose avelumab 800 mg IV every 2 weeks using simulated or reference flat-dose exposures. Safety outcomes were modelled for grade 3 and higher TRAEs, any-grade irAEs, and any-grade infusion-related reactions (IRRs). Overall, the ER analyses suggested a relatively flat relationship between avelumab exposure and these safety outcomes. For example, for any-grade irAEs, no exposure metric was statistically significantly associated with risk; the strongest, though still nonstatistically significant, association was for Cmax after a single dose, with an odds ratio of 1.000 (95% confidence interval [CI], 0.999 to 1.010) per mcg/mL increase.
Novakovic et al.52 was a pharmacometric study using PopPK modelling and simulation based on data from 3 clinical trials (1,827 patients enrolled). The study compared avelumab 10 mg/kg IV every 2 weeks (weight-based dosing) with avelumab 800 mg IV every 2 weeks (fixed dose). Model-based analyses suggested similar ER relationships between dosing strategies. The predicted probability of any-grade irAEs was slightly higher with fixed dosing compared with weight-based dosing (12.6% versus 11.4%). IRR probability was similar between regimens (approximately 24.7% with weight-based dosing, with comparable estimates for fixed dosing). Predicted objective response probabilities based on exposure metrics were 31.8% in metastatic Merkel cell carcinoma and 17.3% in urothelial carcinoma (UC) for the weight-based regimen, with no meaningful differences reported between dosing strategies.
Cemiplimab
Three studies reported on this ICI. Hughes et al.32 was a phase II, open-label, multicohort study evaluating cemiplimab in patients with metastatic cutaneous squamous cell cancer. The study included a weight-based regimen (3 mg/kg IV every 2 weeks; n = 59) and a fixed-dose regimen (350 mg IV every 3 weeks; n = 56). This study has a serious risk of bias mostly due to confounding and lack of adjusted analyses to control for baseline prognostic differences between groups. ORRs were similar between the weight-based and fixed-dose groups (50.8% versus 46.4%), with comparable CR rates (20.3% versus 19.6%) and PR rates (30.5% versus 26.8%). Median PFS was 18.4 months for the weight-based regimen and 21.7 months for the fixed-dose regimen, while median OS was 57.7 months and 48.4 months, respectively. Durability of response was also similar, with 12-month duration-of-response estimates of 89.5% and 88.5%. Safety outcomes were broadly comparable across dosing strategies, with grade ≥ 3 TRAEs reported in 50.8% of patients receiving weight-based dosing and 42.9% receiving fixed dosing.
Overall, these findings suggest similar efficacy and safety profiles between fixed-dose and weight-based cemiplimab in metastatic cutaneous squamous cell carcinoma.
Rischin et al. (2024)39 was an open-label, nonrandomized phase II sequential cohort study that compared pooled earlier cohorts (groups 1 to 3, including weight-based cemiplimab 3 mg/kg every 2 weeks and fixed 350 mg every 3 weeks; n = 193) with fixed-dose cemiplimab 600 mg every 4 weeks (group 4; n = 63) in advanced cutaneous squamous cell carcinoma. Methodological quality was at serious risk of bias for fixed-versus-weight-based inference because the comparison involved nonrandomized sequential cohorts and a mixed pooled comparator rather than a pure weight-based arm, and acknowledged baseline imbalances without adjusted head-to-head analyses. Safety outcomes were similar overall: any treatment-emergent adverse event occurred in 100% of both groups, grade 3 or higher treatment-emergent adverse events in 49% versus 54%, any TRAEs in 77% versus 83%, and grade 3 or higher TRAEs in 17% versus 16% for groups 1 to 3 versus group 4, respectively. Discontinuations and deaths due to AEs were somewhat more frequent in the fixed 600 mg every 4 weeks group. Efficacy for earlier groups was only reported contextually, with an integrated ORR of 46.1% (95% CI, 38.9 to 53.4), whereas the fixed 600 mg every 4 weeks group had an ORR of 61.9% (95% CI, 48.8 to 73.9), disease control of 77.8% (95% CI, 65.5 to 87.3), durable disease control of 76.2% (95% CI, 63.8 to 86.0), 12-month PFS of 65% (95% CI, 51 to 76), and 12-month OS of 73% (95% CI, 60 to 83).
Overall, the study concluded that cemiplimab 600 mg IV every 4 weeks showed strong and durable antitumour activity with acceptable safety in advanced cutaneous squamous cell carcinoma.
Rischin et al. (2020)50 was a phase II, open-label, nonrandomized, multicentre international study including 115 patients. It reported outcomes for fixed-dose cemiplimab 350 mg IV every 3 weeks (group 3, n = 56) and weight-based cemiplimab 3 mg/kg IV every 2 weeks (group 1, n = 59). The study was at serious risk of bias for fixed-versus-weight-based inference because it compared sequential, nonrandomized cohorts: group 3 opened only after group 1 had fully enrolled, the primary analyses for the 2 groups were statistically independent, and no adjusted direct head-to-head comparison was performed. In the fixed-dose group, ORR per independent central review was 41.1% (95% CI, 28.1 to 55.0), disease control rate was 64.3% (95% CI, 50.4 to 76.6), durable disease control rate was 57.1% (95% CI, 43.2 to 70.3), the 8-month Kaplan-Meier estimate for duration of response was 95.0% (95% CI, 69.5 to 99.3), and median time to response was 2.1 months (range 2.0 to 8.3). In the weight-based group, the corresponding values were ORR 49.2% (95% CI, 35.9 to 62.5), disease control rate 71.2% (95% CI, 57.9 to 82.2), durable disease control rate 61.0% (95% CI, 47.4 to 73.5), 12-month Kaplan-Meier duration-of-response estimate 88.9% (95% CI, 69.3 to 96.3), and median time to response 1.9 months (range 1.7 to 9.1). Safety outcomes showed that TRAEs occurred in 36 of 56 (64.3%) patients in the fixed-dose group and 46 of 59 (78.0%) patients in the weight-based group; grade 3 or higher TRAEs occurred in 7 of 56 (12.5%) and 9 of 59 (15.3%) patients, respectively. irAEs occurred in 32 of 56 (57.1%) versus 40 of 59 (67.8%) patients, with grade 3 or higher irAEs in 7 of 56 (12.5%) versus 8 of 59 (13.6%) patients. Overall, the study concluded that cemiplimab 350 mg IV every 3 weeks showed strong antitumour activity, with durable responses seen in both the fixed-dose and weight-based cohorts and a broadly similar safety profile across groups.
Dostarlimab
Only 1 study reported on this ICI.
Patnaik et al.46 was an open-label, first-in-human phase I cohort study evaluating weight-based and fixed dosing of dostarlimab. Part 1 assessed weight-based dose escalation using a 3 + 3 design (1, 3, and 10 mg/kg every 2 weeks), while part 2A evaluated fixed dosing using a modified 6 + 6 design (500 mg every 3 weeks and 1,000 mg every 6 weeks). The overall methodological quality is at serious risk of bias mainly due to lack of adjustment for important prognostic differences across groups, introducing potential confounding across the weight-based cohorts. PRs were observed in the 3 mg/kg (1 of 3, 33.3%) and 10 mg/kg (1 of 12, 8.3%) groups, whereas the 1 mg/kg cohort demonstrated stable disease in 2 of 6 patients (33.3%). In the fixed-dose cohorts, no PRs were reported; stable disease occurred only in the 1,000 mg every 6 weeks group (2/7, 28.6%). Safety outcomes were generally comparable across dosing strategies, with TRAEs reported in all participants and events of grade 3 or higher occurring in 14% to 50% of patients across cohorts.
Overall, the early-phase findings did not demonstrate a clear dose-response relationship in efficacy or major differences in safety between weight-based and fixed-dosing regimens.
Durvalumab
Four studies reported on this ICI.
Patel38 was a retrospective cohort study including 100 patients treated with nivolumab (n = 47), pembrolizumab (n = 36), durvalumab (n = 9), or atezolizumab (n = 8). The study included 3 dosing groups: arm 1 (conventional dose; fixed approved dosing), arm 2 (per-body-weight dose), and arm 3 (low dose), with low-dose atezolizumab defined as 1 mg/kg every 3 weeks. The study is at serious risk of bias, mainly because of serious confounding, given that the nonrandomized dosing groups differed in ICI type, tumour type, clinical setting, and concomitant treatments, and no adjusted analysis was reported. Clinical outcomes were pooled across ICI agents, tumour types, dosing regimens, and concomitant therapies and were presented only at the overall dosing-group level, not separately by drug. In the palliative setting, arm 1 had CR in 2 of 18 (11.1%) patients, PR in 11 of 18 (61.1%) patients, and PD in 5 of 18 (27.8%) patients, corresponding to an ORR of 72.2%. Arm 2 had CR in 2 of 23 (8.7%) patients, PR in 12 of 23 (52.2%) patients, and PD in 9 of 23 (39.1%) patients, corresponding to an ORR of 60.9%. Arm 3 had CR in 0 of 37 (0%), PR in 28 of 37 (75.7%) patients, and PD in 9 of 37 (24.3%) patients, corresponding to an ORR of 75.7%. Median follow-up was 10.2 months for conventional, fixed dosing, 9.8 months for per-weight dosing, and 3.9 months for low-dose treatment. Median OS was reported only for the overall cohort (6.8 months, range 4.6 to 9.0), with no arm-specific OS estimates provided. Safety outcomes, including AEs and irAEs, were not reported.
Overall, the study suggests that weight-based and lower-dose ICI regimens may provide comparable outcomes to fixed-dose regimens.
Fujiwara42 was a phase I, open-label trial with 65 participants. For the relevant part 2 cohorts, the study included 2 weight-based combination regimens — cohort 1: tremelimumab administered in 6 doses of 10 mg/kg every 4 weeks then 3 doses every 12 weeks plus 13 doses of durvalumab 15 mg/kg every 4 weeks, and cohort 2: 4 doses of tremelimumab 1 mg/kg every 4 weeks plus 4 doses of durvalumab 20 mg/kg every 4 weeks then 10 mg/kg every 2 weeks — compared with 1 fixed-dose combination regimen, cohort 3: 4 doses of tremelimumab 75 mg every 4 weeks plus 13 doses of durvalumab 1,500 mg every 4 weeks. The study is at serious risk of bias, mainly due to confounding, because the cohorts were small, nonrandomized, sequential, and unadjusted for baseline prognostic differences. This should also not be interpreted as a clean fixed- versus weight-based durvalumab comparison, given that the accompanying tremelimumab regimens also differed across cohorts. Using a crude pooled comparison of the 2 weight-based cohorts versus the fixed-dose cohort, objective response was lower in the fixed-dose arm (0 of 6 patients, 0%) than in the pooled weight-based arms (2 of 10 patients, 20.0%). Disease control was 33.3% (2 of 6 patients) in the fixed-dose arm versus 20.0% (2 of 10 patients) in the pooled weight-based arms. Incidence of AEs was similar with either dosing option: any AE occurred in 100% versus 90.0%, grade 3 or higher AEs in 50.0% versus 50.0% of patients, and serious AEs in 50.0% versus 50.0% of patients, respectively. Adverse events leading to discontinuation occurred in 16.7% of fixed-dose patients versus 40.0% of pooled weight-based patients. The available data suggest that both weight-based and fixed-dose tremelimumab plus durvalumab regimens were safe and tolerable.
Juergens et al.48 was a phase Ib, multicentre, multicohort dose-escalation trial (Rolling Six design) with 136 participants. The study evaluated both weight-based and fixed-dose durvalumab regimens across sequential dose-escalation cohorts, including 15 mg/kg every 3 weeks and fixed doses of 1,125 mg every 3 weeks and 1,500 mg every 3 weeks. The study is at serious risk of bias overall, largely due to confounding, because dosing strategies were implemented in nonrandomized, sequential cohorts and were combined with varying tremelimumab regimens, without adjustment for baseline or clinical differences. Clinical outcomes were reported according to treatment regimen rather than dosing strategy. Durvalumab monotherapy (N = 24) achieved an ORR of 29% (CR 4%; PR 25%), while combination therapy with tremelimumab (N = 112) showed a higher ORR of 42% (CR 2%; PR 40%). Safety outcomes also differed by regimen, with irAEs occurring in 46% (grade ≥ 3: 4%) of monotherapy patients and 77% (grade ≥ 3: 24%) of combination therapy patients. However, outcomes were not stratified by dosing strategy (fixed versus weight-based), and the presence of cointerventions and sequential cohort design precludes a valid comparison between dosing approaches.
Hijmering-Kappelle et al.43 was a retrospective single-centre cohort study of 66 patients comparing weight-based durvalumab (10 mg/kg every 2 weeks) with fixed extended-interval durvalumab (1,500 mg every 4 weeks) in stage III NSCLC. The study is at serious risk of bias due to nonrandomized escalation to fixed dosing after patients remained free of early toxicity, causing confounding and selection bias without adjusted analyses. Fixed and weight-based durvalumab showed broadly similar safety and efficacy: grade 3 or higher AEs were similar overall (11.5% versus 7.6%) and in the escalation window (10.5% versus 10.9%), treatment discontinuation was somewhat lower with fixed dosing (3 versus 5 patients), and median PFS and OS were not reached in either group.
Ipilimumab
None of the included studies reported on this ICI.
Nivolumab
Fifteen studies provided data on this ICI.
Albiges et al.,28 the largest trial in our included studies for this ICI, was a phase III, open-label, randomized, noninferiority trial (CheckMate 67T; NCT04810078) with 495 patients. The study is at some risk of bias, mostly due to a lack of analysis plans in the protocol. It evaluated subcutaneous (SC) nivolumab 1,200 mg plus 20,000 units of recombinant human hyaluronidase PH20 (rHuPH20) every 4 weeks versus IV nivolumab 3 mg/kg every 2 weeks. SC nivolumab plus rHuPH20 (1,200 mg every 4 weeks) and IV nivolumab (3 mg/kg every 2 weeks) had similar efficacy. ORR was higher with SC (24.2% versus 18.2% at 8 months or more; 26.6% versus 20.6% at 15 months or more), while disease control rate (DCR) (approximately 63%), time to response (approximately 3.7 months), PFS (hazard ratio [HR] = 1.06), and 6- and 12-month OS rates were broadly similar. AEs, on the other hand, were common in both arms, but grade 3 or 4 TRAEs and discontinuations were slightly lower with SC (grade 3 or 4 TRAE 11.7% versus 17.1% IV). Immune-mediated AEs were generally similar with no new safety signals, and treatment-related deaths were rare (≤ 1.2%). SC nivolumab demonstrated comparable pharmacokinetic profiles and ORRs to IV administration, meeting noninferiority criteria.
Campo le Brun30 was a prospective cohort study with 348 patients. The study is at serious risk of bias mostly due to residual confounding and selection bias. Dosing strategy was closely linked to calendar time (weight-adjusted nivolumab was used before 2018, whereas flat-dose nivolumab was used after the dosing regimen changed in 2018), baseline imbalances existed before weighting, BRAF status differed between groups, and the authors explicitly acknowledge temporal bias and exclusion bias from removing patients who changed dosing regimen. Grade 3 or 4 irAEs occurred in 13.1% (21 of 160) of patients receiving weight-adjusted dosing and 11.7% (22 of 188) receiving fixed dosing (P = 0.8). Any-grade irAEs occurred in 63.1% of the weight-adjusted group and 67.0% of the fixed-dose group (P = 0.5). No grade 5 toxicities were reported. Efficacy outcomes numerically favoured the fixed-dose strategy. ORR was 48.4% with fixed dosing versus 40.0% with weight-adjusted dosing (P = 0.14), and DCR was 66.0% versus 61.2% (P = 0.42). After inverse probability of treatment weighting, median OS was 37.0 months with fixed dosing compared with 24.8 months with weight-adjusted dosing. Median PFS was 3.7 months versus 3.1 months, respectively. The HR for OS comparing fixed versus weight-adjusted dosing was 0.74 (95% CI, 0.54 to 1.01), and for PFS, it was 0.84 (95% CI, 0.65 to 1.07). Landmark survival estimates at 6, 12, 18, and 24 months were also consistently higher in the fixed-dose group. Safety outcomes were similar between dosing strategies.
Overall, there were no differences in the rates of severe irAEs or median PFS between patients receiving weight-based versus fixed-dose nivolumab. Similarly, median OS was not statistically significantly different between the groups.
Horisaki31 was a retrospective cohort study of 153 patients with advanced melanoma and is best judged to be at a serious overall risk of bias, primarily due to confounding. Although the authors measured several baseline characteristics and performed multivariable analyses, important residual confounding remains likely, especially from treatment line, prior therapies, melanoma subtype or severity, body weight, and possible calendar-time effects related to evolving uptake of fixed-dose regimens. The study included both fixed-dose nivolumab (240 mg every 2 weeks; 480 mg every 4 weeks) and weight-based nivolumab (2 mg/kg every 3 weeks; 3 mg/kg every 2 weeks). However, the reported direct outcome comparisons were limited. The study reported a fixed-dose versus fixed-dose comparison for 480 mg every 4 weeks versus 240 mg every 2 weeks, and a weight-based versus weight-based comparison for 3 mg/kg every 2 weeks versus 2 mg/kg every 3 weeks. For the latter, outcomes were broadly similar: ORR was 24.3% versus 14.6% (P = 0.278), DCR was 40.5% versus 46.3% (P = 0.606), median PFS was 2.6 versus 3.1 months (P = 0.753), and median OS was 18.9 versus 11.8 months (P = 0.892). Any-grade irAEs occurred in 48.6% versus 46.3%, and grade 3 or higher irAEs occurred in 10.8% versus 19.5%, respectively.
The study concluded that more frequent nivolumab dosing may provide short-term benefits in patients living in Japan with advanced melanoma, but long-term efficacy and safety outcomes were comparable across the different dosing regimens.
Staender34 was a retrospective cohort study with 47 patients. The study has an overall serious risk of bias, primarily due to confounding, because treatment allocation was related to changes in dosing practice over time (weight-adapted dosing used earlier and fixed dosing introduced later), and the analysis did not adequately adjust for baseline differences between groups. Weight-adapted therapy (study-defined) (WAT) was compared with fixed-dose therapy (FDT) for anti–PD-1 monotherapy using nivolumab or pembrolizumab. WAT used nivolumab 3 mg/kg every 2 weeks or pembrolizumab 2 mg/kg every 3 weeks, while FDT used nivolumab 240 mg every 2 weeks or 480 mg monthly and pembrolizumab 200 mg every 3 weeks or 400 mg every 6 weeks. Median PFS was 174 days in the WAT group and 208 days in the FDT group; median OS was 980 days in the WAT group and not reached in the FDT group. However, there were no statistically significant differences between groups for either PFS (log-rank P = 0.595) or OS (log-rank P = 0.502), and HRs with confidence intervals were not reported. The authors reported no difference in irAEs between WAT and FDT.
Leroy37 was a retrospective cohort study including 337 patients. The study is at serious risk of bias, primarily due to potential confounding from differences in calendar period, given that the cohorts were treated during different, partly overlapping time periods, and baseline patient characteristics were not fully adjusted in the analysis. The study compared weight-based nivolumab (3 mg/kg every 2 weeks) with fixed dosing (480 mg every 4 weeks). The cumulative incidence of grade 3 or higher irAEs at 12 months was 6.1% in both groups, with no statistically significant difference (HR = 0.54; 95% CI, 0.21 to 1.36; P = 0.19). Discontinuation due to irAEs occurred in 14.3% (10 of 70) of patients receiving weight-based dosing and 21.3% (57 of 267) receiving fixed dosing. In terms of efficacy, 12-month OS was higher in the fixed-dose group (88.0%) compared with the weight-based group (52.6%), with a statistically significant difference (log-rank P < 0.001; HR not reported). The findings showed no meaningful difference between the weight-based and fixed-dose groups in the rate of severe irAEs. However, OS appeared to be higher in the fixed-dose group.
Patel38 was a retrospective cohort study including 100 patients treated with nivolumab (n = 47), pembrolizumab (n = 36), durvalumab (n = 9), or atezolizumab (n = 8). The study included 3 dosing groups: arm 1 (conventional dose; fixed approved dosing), arm 2 (per-body-weight dose), and arm 3 (low dose), with low-dose atezolizumab defined as 1 mg/kg every 3 weeks. The study is at serious risk of bias, mainly because of serious confounding, given that the nonrandomized dosing groups differed in ICI type, tumour type, clinical setting, and concomitant treatments, and no adjusted analysis was reported. Clinical outcomes were presented only at the overall dosing-group level, not separately by drug. In the palliative setting, arm 1 had CR in 2 of 18 (11.1%) patients, PR in 11 of 18 (61.1%) patients, and PD in 5 of 18 (27.8%) patients, corresponding to an ORR of 72.2%. Arm 2 had CR in 2 of 23 (8.7%) patients, PR in 12 of 23 (52.2%) patients, and PD in 9 of 23 (39.1%) patients, corresponding to an ORR of 60.9%. Arm 3 had CR in 0 of 37 (0%) patients, PR in 28 of 37 (75.7%) patients, and PD in 9 of 37 (24.3%) patients, corresponding to an ORR of 75.7%. Median follow-up was 10.2 months for conventional, fixed dosing, 9.8 months for per-weight dosing, and 3.9 months for low-dose treatment. Median OS was reported only for the overall cohort (6.8 months, range 4.6 to 9.0), with no arm-specific OS estimates provided. Safety outcomes, including AEs and irAEs, were not reported.
Overall, the study suggests that weight-based and lower-dose ICI regimens may provide similar safety and efficacy outcomes to fixed-dose regimens.
Samlowski41 was a retrospective cohort study with 191 patients. This study is at serious risk of bias, mainly because treatment allocation was not randomized and important residual confounding likely remains despite propensity score matching. This study evaluated 4 real-world adjuvant nivolumab dosing arms in melanoma: de novo fixed-dose 480 mg every 4 weeks (C1), switch to 480 mg every 4 weeks after prior 240 mg or 3 mg/kg every 2 weeks (C2), de novo weight-based 3 mg/kg every 2 weeks (C3), and de novo fixed-dose 240 mg every 2 weeks (C4). Compared with the weight-based 3 mg/kg every 2 weeks arm, the fixed-dose arms showed broadly similar treatment duration and safety. Median treatment duration was 10.2 months with fixed 480 mg every 4 weeks, 10.7 months with fixed 240 mg every 2 weeks, and 8.3 months with weight-based 3 mg/kg every 2 weeks. The proportion with at least 1 TRAE was also similar across groups (60.0%, 58.2%, and 54.5%, respectively), as were premature discontinuation rates (32.5%, 41.8%, and 40.9%). Although significant TRAEs appeared somewhat lower with fixed 480 mg every 4 weeks (17.5%) and fixed 240 mg every 2 weeks (20.0%) than with weight-based dosing (27.3%), the small size of the weight-based cohort limits strong conclusions.
Overall, the study suggests that fixed-dose nivolumab was generally comparable to weight-based dosing in this adjuvant melanoma setting.
Iikura44 was a retrospective cohort study with 113 patients. This study is at serious overall risk of bias, driven mainly by confounding, because treatment allocation was nonrandomized and the groups differed in baseline characteristics, particularly prior treatment burden, without multivariable adjustment. The study compared weight-based nivolumab 3 mg/kg every 2 weeks with fixed-dose nivolumab 240 mg every 2 weeks. Overall, fixed dosing showed safety outcomes that were broadly similar to weight-based dosing, with no statistically significant differences in overall immune-related toxicity or treatment discontinuation due to irAEs. Any-grade irAEs occurred in 19.4% of patients receiving fixed dosing versus 29.9% with weight-based dosing (P = 0.264), while grade 2 or higher irAEs occurred in 19.4% versus 23.3% of patients, respectively (P = 0.808). Discontinuation due to irAEs was also less frequent with fixed dosing (2.8% versus 9.1%), although this difference was not statistically significant. At the category level, most grade 2 or higher irAE types were infrequent and generally comparable across groups, except for rash, which was significantly more common in the 240 mg fixed-dose group (P = 0.028).
Overall, these findings suggest that fixed-dose nivolumab had a broadly similar safety profile to weight-based dosing, with the main notable difference being a higher rate of grade or higher rash in the fixed-dose arm.
Okada45 was a retrospective cohort study with 199 patients. The study is at serious risk of bias, primarily due to confounding, given that patients received nivolumab 3 mg/kg or 240 mg fixed dosing according to different calendar periods rather than random allocation, and the analysis did not adequately adjust for important prognostic factors or secular trends. The study compared weight-based nivolumab 3 mg/kg every 2 weeks with fixed-dose nivolumab 240 mg every 2 weeks. Overall, fixed dosing showed similar efficacy and safety to weight-based dosing, with no statistically significant differences between groups. The fixed-dose group had a numerically higher ORR (25% versus 15%) and DCR (57% versus 46%), but these differences were not statistically significant (P = 0.15 for both). Survival outcomes were also comparable: median OS was 10.9 months with fixed dosing versus 9.5 months with weight-based dosing (HR = 0.89; 95% CI, 0.57 to 1.37; P = 0.59), and median PFS was 3.8 versus 3.7 months (HR = 1.01; 95% CI, 0.71 to 1.44; P = 0.95). In terms of safety, any-grade irAEs occurred in 21% of patients receiving fixed dosing compared with 28% in the weight-based group, with no statistically significant difference (P = 0.24). Grade 3 or higher irAEs were not reported by arm. There were no treatment-related deaths in the weight-based group, whereas 1 grade 5 event (0.9%) due to interstitial lung disease occurred in the fixed-dose group. Overall, these findings suggest that fixed-dose nivolumab 240 mg every 2 weeks provides comparable efficacy and broadly similar safety to weight-based dosing at 3 mg/kg every 2 weeks.
Kato49 was a retrospective cohort study with 19 patients. This study is at serious risk of bias, driven primarily by confounding. Notably, serum albumin was significantly greater in the fixed-dose group compared to the weight-based group. Serum albumin is an indicator of the level of cachexia, with low serum albumin suggesting a worsened disease severity. Thus, the difference in serum albumin observed in this study suggests a source of residual confounding associated with prognosis and clinical status. The study compared 3 mg/kg every 2 weeks with 240 mg every 2 weeks. In this small study, the flat-dose group appeared to have numerically better survival and lower toxicity, whereas the weight-based group showed a numerically higher response rate, but none of the reported between-group differences were statistically significant. Specifically, ORR was 45.5% (5 of 11) with weight-based dosing versus 25.0% (2 of 8) with flat dosing (P = 0.63). Any-grade irAEs occurred in 72.7% (8 of 11) of the weight-based group and 50.0% (4 of 8) of the flat-dose group (P = 0.38), whereas grade 3 to 4 irAEs were reported in 54.6% (6 of 11) versus 12.5% (1 of 8), respectively (P = 0.15). For efficacy, the 12-month PFS rate was 53.0% with weight-based dosing compared with 87.5% with flat dosing, and the 12-month OS rate was 80.8% versus 100%, respectively. Median PFS and OS were not reached, and HRs were not reported, so the survival comparison is descriptive only.
Overall, this study suggests no clear statistically significant difference between fixed and weight-based nivolumab dosing for survival and toxicity, although the flat-dose regimen showed numerically lower toxicity and higher 12-month survival rates in this very small sample.
Gandhi53 was a prospective comparative study including 25 patients. The study compared conventional weight-based nivolumab dosing (3 mg/kg IV every 2 or 3 weeks) with a low fixed dose of 40 mg IV every 2 or 3 weeks. Clinical outcomes appeared broadly similar between the 2 dosing strategies. At 3 months, the ORR was 18.2% (2 of 11) in the weight-based group and 11.1% (1 of 9) in the low fixed-dose group. Median PFS was 4.3 months (95% CI, 1.46 to 7.07) with weight-based dosing and 5.8 months (95% CI, 3.39 to 8.26) with low fixed dosing, with no statistically significant difference between groups (P = 0.31). Safety outcomes differed by end point. Any AEs occurred in 100% (14 of 14) of patients receiving weight-based dosing compared with 63.6% (7 of 11) in the low fixed-dose group. However, irAEs of any grade were more frequent in the low fixed-dose group (85.7% [6 of 11]) than in the weight-based group (64.3% [9 of 14]). Grade 3 or higher irAEs were reported only in the weight-based group (28.6% [4 of 14]) and not in the low fixed-dose group (0 of 11). No patients discontinued treatment because of AEs, and no treatment-related deaths were reported in either group.
Overall, this small study suggests broadly similar efficacy between weight-based and low fixed-dose nivolumab, with no statistically significant difference in PFS.
Sheng54 was a model-informed benefit-risk assessment that incorporated PopPK modelling together with descriptive safety data from clinical trial datasets. The study evaluated nivolumab 3 mg/kg IV every 2 weeks, 240 mg IV every 2 weeks, and 10 mg/kg IV every 2 weeks. For this paper, the relevant comparison is fixed dosing at 240 mg every 2 weeks versus weight-based dosing at 3 mg/kg every 2 weeks. Chinese exposure simulations included patients receiving 240 mg every 2 weeks (n = 314) and 3 mg/kg every 2 weeks (n = 294). Chinese safety data came from the CheckMate 077 trial (240 mg, n = 20; 3 mg/kg, n = 15) and the CheckMate 078 trial (3 mg/kg, safety n = 241), whereas global pooled safety data included 3 mg/kg (n = 1,375) and 10 mg/kg (n = 131). In the Chinese CheckMate 077 cohort, any-grade AEs occurred in 90.0% of patients receiving 240 mg every 2 weeks and 100.0% receiving 3 mg/kg every 2 weeks; grade 3 or 4 AEs occurred in 10.0% and 6.7%, respectively. In the CheckMate 078 trial, 97.9% of patients who were living in China and receiving 3 mg/kg every 2 weeks had any-grade AEs, and grade 3 or 4 AEs occurred in 43.2%, grade 5 AEs in 4.1%, SAEs in 36.5%, and AEs leading to discontinuation in 16.6%. The study also reported model-predicted PK exposure metrics (Cmin, Cmax, and Cavg at first dose and steady state), which supported similar exposure between the 240 mg fixed-dose and 3 mg/kg weight-based regimens. The higher-dose 10 mg/kg every 2 weeks group showed greater toxicity, with grade 3 or 4 AEs in 50.4% of patients and grade 5 AEs in 13.7%.
Overall, the study suggests that nivolumab 240 mg every 2 weeks yields comparable predicted PK exposure to 3 mg/kg every 2 weeks, whereas descriptive safety findings do not suggest a major difference, although direct comparison is limited by small and unequal safety datasets.
Zhao55 was a model-informed drug development study that used PopPK simulations, ER analyses for safety and efficacy, and intratumoral receptor occupancy modelling. The study included a PK simulation dataset of 3,203 patients, a safety ER dataset of 2,560 patients, and efficacy ER datasets of 1,615 patients for OS and 1,579 patients for ORR. The study evaluated nivolumab weight-based dosing (3 mg/kg every 2 weeks) alongside fixed dosing regimens of 240 mg every 2 weeks and 480 mg every 4 weeks across multiple tumour types. Model-based predictions suggested similar efficacy across regimens. Predicted ORR differed by no more than approximately 2 percentage points between dosing strategies, and predicted OS values were likewise very similar across melanoma, RCC, squamous NSCLC, and nonsquamous NSCLC. Predicted safety outcomes were also comparable. Time-to-event modelling showed similar cumulative probabilities of grade 2 or higher immune-mediated AEs (IMAEs), grade 2 or higher TRAEs, and TRAEs leading to discontinuation or death across regimens. Logistic ER models also predicted similar probabilities of grade 2 or higher IMAEs, grade 3 or higher AEs, and AEs leading to discontinuation or death.
Overall, the study found negligible differences between fixed-dose and weight-based nivolumab regimens in modelled safety and efficacy outcomes.
Sanghavi et al.56 was a model-based ER and benefit-risk analysis with 448 patients in the adjuvant melanoma efficacy dataset from the CheckMate 238 trial and 3,008 patients in the pooled safety dataset across 14 studies. It compared weight-based nivolumab 3 mg/kg every 2 weeks with fixed dosing of 240 mg every 2 weeks and 480 mg every 4 weeks. Predicted efficacy was essentially identical across regimens: 1- and 2-year recurrence-free survival and distant metastasis-free survival were nearly the same for fixed and weight-based dosing. Predicted safety was also very similar. For grade 3 and higher AEs, the 6-month probability was 0.206 with 3 mg/kg, 0.2056 with 240 mg, and 0.1967 with 480 mg; at 12 months, it was 0.2892, 0.2887, and 0.2769, respectively. For grade 2 and higher IMAEs, the 6-month probability was 0.2275 with 3 mg/kg, 0.2280 with 240 mg, and 0.2516 with 480 mg; at 12 months, it was 0.3135, 0.3142, and 0.3445, respectively.
Overall, fixed-dose nivolumab showed comparable predicted efficacy and broadly similar predicted safety to weight-based dosing, with only a small increase in predicted grade 2 and higher IMAEs for 480 mg every 4 weeks.
Bei et al.57 conducted a model-based quantitative clinical pharmacology study incorporating PopPK modelling, ER analyses for safety and efficacy, and an overall benefit-risk assessment. The safety ER dataset included 273 patients living in Japan, the efficacy ER dataset included 134 patients living in Japan, and the PopPK modelling and simulation dataset included 3,939 patients in total, of whom 420 were living in Japan. The study compared nivolumab weight-based dosing (3 mg/kg every 2 weeks) with fixed dosing (240 mg every 2 weeks) using model-based predictions of efficacy and safety across multiple tumour types. Overall, the findings suggested that the fixed-dose and weight-based regimens produced similar outcomes, with no clinically meaningful differences. For efficacy, the predicted 1-year and 2-year OS probabilities were nearly identical between regimens across squamous NSCLC, nonsquamous NSCLC, and RCC; in melanoma, predicted survival was numerically slightly higher with 3 mg/kg, but the confidence intervals overlapped. Predicted ORR was also similar between dosing strategies, with no meaningful differences within tumour type. For safety, the study evaluated AEs leading to discontinuation or death, grade 3 or higher AEs, and grade 2 or higher IMAEs. Predicted safety event proportions were very similar between regimens across tumour types, and the authors concluded that 240 mg was associated with either no change or only negligible increases of up to 2%, which were not statistically significant. In summary, Bei et al. suggests that nivolumab 240 mg every 2 weeks provides similar predicted survival, response, and safety outcomes to 3 mg/kg every 2 weeks, supporting fixed dosing as an alternative to weight-based dosing.
Pembrolizumab
Eight studies reported on this ICI.
Smeenk33 was a real-world, retrospective bicentre cohort study including 766 patients and is judged to have a serious overall risk of bias, primarily due to confounding. Treatment allocation was strongly associated with institution and calendar period, leaving substantial potential for residual confounding despite an inverse probability of treatment weighting adjustment. The study compared 2 pembrolizumab dosing strategies: a hybrid weight-banded fixed dosing approach (100, 150, or 200 mg every 3 weeks based on body weight, or doubled every 6 weeks) and standard flat dosing (200 mg every 3 weeks or 400 mg every 6 weeks). The hybrid dosing arm showed numerically improved outcomes compared with flat dosing, with longer median OS (17.7 versus 11.8 months), higher 1-year OS (61% versus 50%), and longer median PFS (6.4 versus 4.6 months). HRs also favoured hybrid dosing for both OS (HR = 0.76; 95% CI, 0.65 to 0.90) and PFS (HR = 0.82; 95% CI, 0.70 to 0.96).
Safety and treatment-course measures were broadly similar between groups. The study concluded that OS in the hybrid dosing group was comparable to that observed with flat dosing, demonstrating noninferiority.
Staender34 was a retrospective cohort study with 47 patients. The study has an overall serious risk of bias, primarily due to confounding, because treatment allocation was related to changes in dosing practice over time (weight-adapted dosing used earlier and fixed dosing introduced later), and the analysis did not adequately adjust for baseline differences between groups. Weight-adapted dosing (WAT) was compared with FDT for anti–PD-1 monotherapy using nivolumab or pembrolizumab. WAT used nivolumab 3 mg/kg every 2 weeks or pembrolizumab 2 mg/kg every 3 weeks, whereas FDT used nivolumab 240 mg every 2 weeks or 480 mg monthly and pembrolizumab 200 mg every 3 weeks or 400 mg every 6 weeks. Median PFS was 174 days in the WAT group and 208 days in the FDT group; median OS was 980 days in the WAT group and not reached in the FDT group. However, there were no statistically significant differences between groups for either PFS (log-rank P = 0.595) or OS (log-rank P = 0.502), and HRs with confidence intervals were not reported. The authors reported no difference in irAEs between WAT and FDT.
Chaitesipaseut et al.35 was a retrospective cohort study including 1,413 patients and was determined to have a serious overall risk of bias, primarily due to residual confounding. The analysis adjusted for a limited set of covariates, while important clinical confounders were likely unmeasured, and treatment selection may have been influenced by prognostic factors. The study compared fixed-dose and weight-based pembrolizumab. The fixed-dose group received 200 mg every 3 weeks or 400 mg every 6 weeks, whereas the weight-based group received 2 mg/kg every 3 weeks or 4 mg/kg every 6 weeks. The OS rate at the end of follow-up was similar between groups (36.6% versus 37.7%), with an adjusted HR for mortality of 1.06 (95% CI, 0.84 to 1.32). All-cause emergency department visits (15.6% versus 14.5%) and hospitalizations (19.7% versus 17.4%) were also comparable. Composite irAEs were reported in 21.0% of the fixed-dose group and 23.2% of the weight-based group.
Results were consistent with noninferiority and suggested similar efficacy and safety between fixed-dose and weight-based pembrolizumab.
Grit et al.36 was a retrospective cohort study with 1,966 participants. The study is at serious risk of bias, primarily due to residual confounding, given that several important prognostic variables (e.g., performance status, brain metastases, and body weight) were not fully accounted for. The study compared standard fixed dosing of pembrolizumab (200 mg every 3 weeks or 400 mg every 6 weeks) with a weight-banded fixed dosing strategy (< 65 kg: 100 mg every 3 weeks or 200 mg every 6 weeks; 65 kg to 90 kg: 150 mg every 3 weeks or 300 mg every 6 weeks; ≥ 90 kg: standard dosing). Median OS was 15.2 months (95% CI, 14.2 to 17.2) with standard dosing and 18.1 months (95% CI, 15.4 to 23.0) with weight-banded fixed dosing. The adjusted HR for OS was 0.83 (95% CI, 0.69 to 1.003; P = 0.053), consistent with noninferiority. Time to next treatment or death was also similar between groups (adjusted HR = 0.87; 95% CI, 0.74 to 1.03). No comparative safety outcomes were reported. The study concluded that a modified pembrolizumab dosing strategy using partially lower doses appears to preserve clinical effectiveness in NSCLC.
Patel38 was a retrospective cohort study including 100 patients treated with nivolumab (n = 47), pembrolizumab (n = 36), durvalumab (n = 9), or atezolizumab (n = 8). The study included 3 dosing groups: arm 1 (conventional dose; fixed approved dosing), arm 2 (per-body-weight dose), and arm 3 (low dose), with low-dose atezolizumab defined as 1 mg/kg every 3 weeks. The study is at serious risk of bias, mainly because of serious confounding, given that the nonrandomized dosing groups differed in ICI type, tumour type, clinical setting, and concomitant treatments, and no adjusted analysis was reported. Clinical outcomes were presented only at the overall dosing-group level, not separately by drug. In the palliative setting, arm 1 had CR in 2 of 18 (11.1%) patients, PR in 11 of 18 (61.1%) patients, and PD in 5 of 18 (27.8%) patients, corresponding to an ORR of 72.2%. Arm 2 had CR in 2 of 23 (8.7%) patients, PR in 12 t of 23 (52.2%) patients, and PD in 9 of 23 (39.1%) patients, corresponding to an ORR of 60.9%. Arm 3 had CR in 0 of 37 (0%) patients, PR in 28 of 37 (75.7%) patients, and PD in 9 of 37 (24.3%) patients, corresponding to an ORR of 75.7%. Median follow-up was 10.2 months for conventional, fixed dosing, 9.8 months for per-weight dosing, and 3.9 months for low-dose treatment. Median OS was reported only for the overall cohort (6.8 months, range 4.6 to 9.0), with no arm-specific OS estimates provided. Safety outcomes, including AEs and irAEs, were not reported.
Overall, the study suggests that weight-based and lower-dose ICI regimens may provide similar efficacy and safety outcomes to fixed-dose regimens.
Berard40 was a retrospective cohort study including 279 patients. The study is at serious risk of bias, mainly due to residual confounding, because the dosing strategy appears to have been influenced by evolving provincial guidance, likely calendar-time and centre effects, limited covariate adjustment, and treatment switching from fixed dosing to weight-based capped dosing. The study compared pembrolizumab fixed dosing (200 mg) with weight-based capped dosing (2 mg/kg up to a maximum of 200 mg). OS did not differ between strategies, with an adjusted HR for fixed-dose versus weight-based capped dose of 0.97 (95% CI, 0.61 to 1.53; P = 0.88). Across the overall cohort, median PFS was 9.4 months (95% CI, 6.6 to 11.2) and median OS was 17.3 months (95% CI, 12.9 to Not Reached). Landmark outcomes for the overall cohort were also reported at 6, 12, and 24 months. For toxicity, irAEs causing treatment delay or interruption occurred in 28.6% (14 of 49) of patients in the fixed-dose group and 27.4% (63 of 230) in the weight-based capped-dose group. The median number of cycles before an irAE–related delay or interruption was 5 (range 1 to 36) in the fixed-dose group and 6 (range 1 to 34) in the weight-based capped-dose group.
The study concluded that use of weight-based dosing does not appear to have a negative impact on patient outcomes.
To47 was a retrospective chart review cohort study including 64 patients. The study is at serious risk of bias, primarily due to confounding, given that dose allocation was nonrandom and likely influenced by financial and clinical factors. Important baseline and treatment differences existed between groups, including body weight, line of therapy, and cointerventions, and not all key confounders appear to have been adequately controlled. The study compared a lower-dose, weight-based pembrolizumab strategy (2 mg/kg or 100 mg fixed every 3 weeks) with standard fixed-dose pembrolizumab 200 mg every 3 weeks. Median OS was 22.7 months in the lower-dose, weight-based group and not reached in the fixed-dose group, with no statistically significant difference between groups. The fixed-dose group showed higher PFS (6.1 versus 4.5 months; log-rank P = 0.046), although the adjusted analysis did not demonstrate a significant difference. ORR was substantially higher with fixed dosing (53.6% versus 13.9%; P = 0.001), whereas DCR was numerically higher (78.6% versus 63.9%; P = 0.202). In terms of safety, any-grade irAEs were more frequent with fixed dosing (32% versus 11%; P = 0.038), whereas grade 3 or 4 irAEs were similar between groups (7.1% versus 2.8%; P = 0.577). Discontinuation due to toxicity was reported only overall (3 of 64, 5%) and not by treatment arm.
Overall, fixed-dose pembrolizumab showed higher observed PFS and ORR, no difference in OS, and more any-grade irAEs.
Lala (2020)58 was a PK modelling and simulation (population PK + simulations) study with 2,799 patients. The study evaluated the safety of several pembrolizumab dosing strategies, including fixed dosing (200 mg every 3 weeks or 400 mg every 6 weeks) and weight-based dosing (2 mg/kg every 3 weeks, 10 mg/kg every 2 weeks, and 10 mg/kg every 3 weeks). Safety data were primarily reported for the weight-based dosing groups. In the 2 mg/kg every 3 weeks cohort (N = 740), any AEs occurred in 20.0%, grade 3 to 5 AEs in 5.0% of patients, SAEs in 5.5%, discontinuation due to AEs in 2.0%, and deaths due to AEs in 0.3%. In the 10 mg/kg every 2 weeks cohort (N = 660), any AEs occurred in 21.5% of patients, grade 3 to 5 AEs in 5.3%, SAEs in 5.0%, discontinuation due to AEs in 3.0%, and no deaths due to AEs were reported. In the 10 mg/kg every 3 weeks pooled cohort (N = 1,399), any AEs occurred in 21.7%, grade 3 to 5 AEs in 5.7%, SAEs in 5.9%, and discontinuation due to AEs in 3.4%.
The study concluded that established ER evidence indicates that efficacy and safety were expected to be comparable to the 200 mg and 2 mg/kg every 3 weeks regimens across tumour types.
Tremelimumab
Two studies reported on this ICI.
Fujiwara42 was a phase I, open-label trial with 65 participants. For the fixed-versus-weight-based comparison in part 2, 3 cohorts were included: Cohort 1 (weight-based) — 6 doses of tremelimumab 10 mg/kg every 4 weeks then 3 doses every 12 weeks plus 13 doses of durvalumab 15 mg/kg every 4 weeks; cohort 2 (weight-based) — 4 doses of tremelimumab 1 mg/kg every 4 weeks plus 4 doses of durvalumab 20 mg/kg every 4 weeks then 10 mg/kg every 2 weeks (up to 22 doses); and cohort 3 (fixed-dose) — 4 doses of tremelimumab 75 mg every 4 weeks plus 13 doses of durvalumab 1,500 mg every 4 weeks. The study is at serious risk of bias, driven mainly by confounding, because the cohorts were nonrandomized, sequential, very small, and unadjusted for baseline prognostic differences. Moreover, this is not a pure tremelimumab fixed-versus-weight-based comparison because the accompanying durvalumab regimens also differed across cohorts. Pooling the 2 weight-based cohorts, the fixed-dose arm showed lower objective response than the weight-based arms (0 of 6, 0% versus 2 of 10, 20.0%), while disease control was numerically 33.3% in the fixed-dose arm versus 20.0% in the pooled weight-based arms (2 of 6 versus 2 of 10). Toxicity was substantial in both approaches, with any AE reported in 100% versus 90.0%, grade 3 or higher AEs in 50.0% versus 50.0%, and serious AEs in 50.0% versus 50.0% of fixed-dose and pooled weight-based patients, respectively.
The data reported in the study suggest that both weight-based and fixed-dose tremelimumab plus durvalumab regimens were safe and tolerable.
Juergens et al.48 was a phase Ib, multicentre, multicohort dose-escalation trial (Rolling Six design) including 136 participants. The study evaluated both weight-based and fixed-dose regimens of durvalumab and tremelimumab across sequential dose levels. Durvalumab dosing included weight-based regimens (15 mg/kg every 3 weeks) and fixed dosing (1,125 mg and 1,500 mg every 3 weeks), while tremelimumab was administered using both weight-based dosing (1 mg/kg and 3 mg/kg) and fixed dosing (56 mg and 75 mg every 3 weeks). The study is at serious risk of bias overall, primarily due to confounding, given that dosing strategies were evaluated in sequential, nonrandomized cohorts without adjustment for baseline or clinical differences. Efficacy and safety outcomes were reported for durvalumab monotherapy (N = 24) and durvalumab plus tremelimumab (N = 112), but not stratified by tremelimumab dosing strategy (fixed versus weight-based). Durvalumab monotherapy achieved an ORR of 29% (CR 4%, PR 25%), while combination therapy demonstrated a higher ORR of 42% (CR 2%, PR 40%). Immune-related AEs were more frequent with combination therapy (77% versus 46%; grade ≥ 3: 24% versus 4%). However, because outcomes were pooled across multiple tremelimumab dose levels and regimens, no direct comparison between fixed-dose and weight-based tremelimumab could be made.
PK/PD Outcomes
These outcomes are summarized by publication in Table 14 Appendix 4.
Atezolizumab
Ter Heine et al.59 was a PK modelling and simulation study that included 500 virtual patients and compared reference dosing regimens with alternative, weight-banded fixed-dosing regimens across multiple ICIs. An alternative weight-banded fixed-dosing atezolizumab regimen (< 70 kg: 840 mg; ≥ 70 kg: 1,200 mg) was compared with the reference fixed dose of 1,200 mg every 3 weeks. The alternative regimen yielded consistently lower modelled exposure, with ratios of 0.82 for cycle 1 trough concentration, steady-state trough concentration, cycle 1 AUC, and AUCss, suggesting an approximately 18% reduction in exposure relative to the fixed-dose regimen.
The study concluded alternative dosing schedules could reduce drug waste and costs while keeping exposure, effectiveness, and safety similar, based on strong clinical pharmacology data. These regimens may be practical to use in routine care without needing another clinical trial.
Avelumab
Herrera29 was a phase Ib randomized, open-label, parallel-arm PK/PD clinical trial including 31 patients. It evaluated IV avelumab (1-hour infusion) across 4 fixed-dose regimens (70 mg every 2 weeks, 350 mg every 2 weeks, 500 mg every 2 weeks, and 500 mg every 3 weeks) and 1 weight-based dosing regimen (10 mg/kg every 2 weeks). The overall methodological quality of the trial was judged to have some concerns due to deviations from intended interventions (i.e., inclusion of dosing schedules that are a lower intensity than those used in clinical practice), including inconsistent appropriate analyses across outcomes, and potential bias in outcome measurement arising from the unblinded open-label design. Fixed-dose avelumab regimens generally produced lower systemic exposure than the weight-based regimen of 10 mg/kg every 2 weeks, but the PK profiles were broadly comparable. The most relevant fixed-dose comparison, 500 mg every 2 weeks, showed lower AUC over the dosing interval than 10 mg/kg every 2 weeks at both cycle 1 day 1 (15,436 h × mcg/mL versus 23,780 h × mcg/mL) and cycle 2 day 1 (21,053 h × mcg/mL versus 27,196 h × mcg/mL), and lower Cmax at both time points (143 versus 271 mcg/mL at cycle 1; 195 versus 273 mcg/mL at cycle 2). However, trough concentrations at cycle 2 day 1 were more similar between regimens (12.1 mcg/mL for 500 mg every 2 weeks versus 14.4 mcg/mL for 10 mg/kg every 2 weeks), suggesting that fixed dosing may still maintain comparable sustained exposure over the dosing interval. Terminal half-life was also similar across regimens, with values around 105.1 to 110.2 hours for 500 mg every 2 weeks and 93.1 to 101.5 hours for 10 mg/kg every 2 weeks.
Overall, this study suggests that although fixed-dose avelumab, particularly 500 mg every 2 weeks, yields lower overall and peak exposure than weight-based dosing, it may provide broadly similar trough concentrations and elimination characteristics. Also, the target occupancy exceeded 90% across all treatment arms throughout the dosing interval.
Masters51 was a model-informed drug development study involving PopPK modelling, modelling and simulation, and ER (logistic regression) analyses using trial datasets, with 2,315 patients in the pooled PopPK dataset. PopPK and ER modelling demonstrated that fixed-dose avelumab (800 mg every 2 weeks) produced exposure metrics (AUC, Cmax, trough concentration [Ctrough]) that overlapped with those of weight-based dosing (10 mg/kg every 2 weeks), with no meaningful differences across body weight ranges.
Overall, this study suggests similar results for weight-based and fixed dosing for PK outcomes.
Novakovic et al.52 was a pharmacometric study using PopPK modelling and simulation based on pooled data from 3 clinical trials (1,827 patients enrolled). The study compared weight-based avelumab (10 mg/kg IV every 2 weeks) with fixed dosing (800 mg IV every 2 weeks). Across 1,663 patients, systemic exposure during the first dosing interval (AUC from time 0 to 336 hours) was comparable between regimens, with median values of 23,160 mg × h/L (range 7,438 to 51,742) for the weight-based dose and 25,913 mg × h/L (range 5,689 to 54,763) for the fixed dose. Variability in exposure was also similar (the coefficient of variation [CV] was 29.0% versus 27.1%, respectively). Exposure varied across body weight strata with fixed dosing, showing relatively higher exposure in lower-weight patients and lower exposure in higher-weight patients, whereas weight-based dosing resulted in more consistent exposure across weight groups.
Overall, this study suggests similar systemic exposure, yet higher exposure may occur in lower-weight patients.
Cemiplimab
Yang60 was a PopPK modelling and simulation study using pooled clinical trial PK data, focusing on 548 patients. The weight-based dosing regimens considered in this study were 1 mg/kg IV every 2 weeks, 3 mg/kg IV every 2 weeks, and 3 mg/kg every 3 weeks. The fixed dosing regimens considered were 200 mg IV every 2 weeks and 350 mg every 3 weeks. The study reported that the weight-based and fixed dosing regimens of cemiplimab demonstrated comparable exposure profiles at a steady state. Specifically, when comparing the commonly used regimens of 3 mg/kg every 2 weeks (weight-based) and 350 mg every 3 weeks (fixed dose), the reported steady-state exposure across body weight quartiles was similar. For 3 mg/kg every 2 weeks, the AUC over 6 weeks at steady state ranged from 3,280 day × mg/L to 4,200 day × mg/L and the trough concentration at steady state ranged from 58.4 mg/L to 74.0 mg/L, whereas for 350 mg every 3 weeks, the AUC over 6 weeks at steady state ranged from 3,190 day × mg/L to 4,510 day × mg/L and the trough concentration at steady state ranged from 49.0 mg/L to 70.3 mg/L. These overlapping exposure ranges across weight quartiles suggest that fixed dosing achieves pharmacokinetic exposures comparable to weight-based dosing, with no substantial impact of body weight on drug exposure. The elimination half-life at steady state was also consistent across patient groups, reported as approximately 544.8 hours in responders and 448.8 hours in patients whose disease did not respond to treatment, further supporting stable PK across dosing strategies. The findings suggest that fixed-dose cemiplimab 350 mg every 3 weeks provides pharmacokinetic exposure comparable to weight-based 3 mg/kg every 2 weeks, with body weight having only a modest, not clinically meaningful, effect on exposure.
Rischin et al. (2024)39 was an open-label, nonrandomized phase II sequential cohort study that compared pooled earlier cohorts (groups 1 to 3, including weight-based cemiplimab 3 mg/kg every 2 weeks and fixed 350 mg every 3 weeks; n = 193) with fixed-dose cemiplimab 600 mg every 4 weeks (group 4; n = 63) in advanced cutaneous squamous cell carcinoma. Methodological quality was at serious risk of bias for fixed-versus-weight-based inference because the comparison involved nonrandomized sequential cohorts and a mixed pooled comparator rather than a pure weight-based arm and acknowledged baseline imbalances without adjusted head-to-head analyses. Based on observed steady-state concentrations at weeks 17 to 19, Ctrough/Cmin was similar between regimens, with mean concentrations of 68.4 mg/L for the weight-based group and 62.7 mg/L for the fixed-dose group. Cmax was also very similar, with mean concentrations of 150 mg/L and 151 mg/L, respectively. Half-life and AUC were not reported for this direct fixed-versus-weight-based comparison. Overall, these data suggest broadly comparable steady-state exposure between the weight-based and fixed-dose regimens.
Paccaly et al.61 was a pooled PopPK modelling and simulation analysis with 505 patients. The study found that fixed-dose cemiplimab 350 mg IV every 3 weeks produced PK exposure broadly similar to weight-based cemiplimab 3 mg/kg IV every 2 weeks. After the first dose, the fixed-dose regimen had higher Cmax, slightly higher Ctrough, and slightly higher AUC over 6 weeks. At steady state, the fixed-dose regimen still had a higher Cmax, but Ctrough was slightly lower than with weight-based dosing, while overall AUC remained very similar. Half-life was reported overall rather than by arm, increasing from 12.5 days after the first dose to 19.2 days at steady state.
Overall, the modelling reported in this study supports that fixed dosing provides comparable overall exposure to weight-based dosing.
Dostarlimab
Patnaik et al.46 was an open-label, first-in-human phase I cohort study. Patnaik et al. compared weight-based dostarlimab regimens of 1 mg/kg, 3 mg/kg, and 10 mg/kg every 2 weeks with fixed-dose regimens of 500 mg every 3 weeks and 1,000 mg every 6 weeks. Across these cohorts, fixed dosing produced PK profiles broadly comparable to the higher weight–based regimens. In the weight-based groups, terminal half-life ranged from 10.2 to 20.5 days, while in the fixed-dose groups it was 14.5 days for 500 mg every 3 weeks and 19.6 days for 1,000 mg every 6 weeks. The 500 mg every 3 weeks fixed regimen showed PK values close to the 10 mg/kg every 2 weeks regimen, with AUC over the dosing interval of 35,730 versus 36,480 mcg × h/mL to 63,670 mcg × h/mL, Cmax of 171.1 versus 228.4 mcg/mL to 251.1 mcg/mL, and Ctrough of 39.17 versus 53.15 mcg/mL to 60.63 mcg/mL. The 1,000 mg every 6 weeks fixed regimen produced the highest overall exposure, with AUC over the dosing interval 95,820 mcg × h/mL and Cmax 309.4 mcg/mL, while maintaining a Ctrough of 40.20 mcg/mL, still within the general range observed with higher weight–based dosing. Clearance (CL) was also similar across regimens, ranging from 0.160 L/day to 0.302 L/day for weight-based dosing and 0.212 L/day to 0.216 L/day for fixed dosing, with broadly comparable volume of distribution during terminal phase (Vz) and volume of distribution at steady state (Vss) values.
Overall, these findings suggest that fixed dosing achieved predictable and sustained exposure comparable to weight-based dosing, supporting the PK feasibility of 500 mg every 3 weeks and 1,000 mg every 6 weeks as alternatives to weight-based regimens. Regarding PD outcomes, PD-1 receptor occupancy was essentially complete across both weight-based and fixed-dose dostarlimab regimens, except for 1 patient in the 1 mg/kg cohort.
Durvalumab
Fujiwara42 was a phase I, open-label trial with 65 participants that included both weight-based and fixed-dose regimens, but the comparison should be interpreted cautiously because the cohorts did not use equivalent durvalumab doses and also differed in the accompanying tremelimumab regimen. The weight-based cohorts received durvalumab 15 mg/kg every 4 weeks (cohort 1) or 4 doses of 20 mg/kg every 4 weeks then 10 mg/kg every 2 weeks (cohort 2), whereas the fixed-dose cohort received durvalumab 1,500 mg every 4 weeks (cohort 3). In the single-dose PK analysis, exposure was numerically highest in the fixed-dose cohort: AUC from time 0 to last measurable time point (AUC0–t) 4,680 day mcg/mL, Cmax 439 mcg/mL, and Cmin 77.7 mcg/mL for 1,500 mg every 4 weeks, compared with AUC0–t 3,390, Cmax 353, Cmin 55.4 for 20 mg/kg every 4 weeks and AUC0–t 2,980, Cmax 278, Cmin 40.9 for 15 mg/kg every 4 weeks. After multiple doses, the fixed-dose cohort also showed higher steady-state exposures than the weight-based 20 mg/kg cohort, with Cmaxss 847 versus 404 mcg/mL and Cminss 200 versus 94.6 mcg/mL. Overall, this study suggests that fixed-dose durvalumab 1,500 mg every 4 weeks produced higher PK exposure than the tested weight-based regimens, but because this was not a head-to-head comparison of equivalent fixed versus weight-based dosing, the findings are best considered descriptive rather than definitive evidence of superiority of 1 dosing strategy over the other.
Juergens et al.48 represents a phase Ib, multicentre, multicohort dose-escalation trial (Rolling Six design) with 136 participants. Durvalumab PK was evaluated across both weight-based (15 mg/kg every 3 weeks) and fixed-dose regimens (1,125 mg and 1,500 mg every 3 weeks), administered either as monotherapy or in combination with tremelimumab. Overall, exposure metrics were broadly comparable across dosing strategies. Mean peak concentrations (Cmax) ranged from 320 mcg/mL for 15 mg/kg monotherapy to 378 mcg/mL to 474 mcg/mL for fixed-dose regimens, while trough concentrations (Ctrough) were within a similar range across regimens (approximately 54.6 mcg/mL to 84.5 mcg/mL). Notably, fixed dosing (1,125 mg and 1,500 mg) produced Ctrough values (54.6 mcg/mL to 78.5 mcg/mL) that overlapped with those observed for weight-based dosing (59.7 mcg/mL to 84.5 mcg/mL), despite variability across dose levels and combination arms. Although AUC was not reported, the comparable Cmax and Ctrough profiles suggest that fixed dosing achieves similar systemic exposure to weight-based dosing, supporting PK comparability across these dosing approaches.
Ter Heine et al.59 was a PK modelling and simulation study that included 500 virtual patients and compared reference dosing regimens with alternative, weight-banded fixed-dosing regimens across multiple ICIs. The reference dosing regimen for this ICI was every 4 weeks: 20 mg/kg; whereas the alternative dosing regimens were durvalumab (every 2 weeks): less than 60 kg: 480 mg; 60 kg to 80 kg: 600 mg; more than 80 kg: 720 mg; and durvalumab (every 4 weeks): less than 60 kg: 960 mg; 60 kg to 80 kg: 1,200 mg; more than 80 kg: 1,440 mg. According to the findings, durvalumab every 2 weeks versus every 4 weeks produced very similar exposure, with the geometric mean ratios for Ctrough and AUC being 0.87 at both the end of cycle 1 and at steady state.
Ipilimumab
Ter Heine et al.59 was a PK modelling and simulation study that included 500 virtual patients. Ipilimumab exposure was evaluated by comparing a reference weight-based regimen (1 mg/kg every 6 weeks) with an alternative weight-banded fixed-dose strategy (< 60 kg: 50 mg; 60 kg to 90 kg: 75 mg; > 90 kg: 100 mg). PK modelling demonstrated equivalent exposure between dosing approaches, with geometric mean ratios of 1.0 for Ctrough (both at end of first cycle and steady state) and 1.0 for AUC (both early and steady state). These findings indicate that the alternative weight-banded fixed dosing strategy achieves virtually identical systemic exposure to standard weight-based dosing, suggesting no meaningful PK differences between the regimens.
Nivolumab
Albiges et al.,28 the largest trial in our included studies for this ICI, was a phase III, open-label, randomized, noninferiority trial (CheckMate 67T; NCT04810078) with 495 patients. There is some concern of bias, mostly due to lack of analysis plans in the protocol. It evaluated SC nivolumab 1,200 mg plus rHuPH20 20,000 units every 4 weeks versus IV nivolumab 3 mg/kg every 2 weeks. Overall, the fixed-dose SC regimen produced substantially higher exposure than the weight-based IV regimen. In the SC arm, geometric mean exposures were an average concentration over 28 days (Cavgd28) of 77.343 mcg/mL, minimum (trough) concentration at steady state (Cminss) of 122.227 mcg/mL, maximum concentration after first dose or first cycle (Cmax1) of 108 mcg/mL, minimum concentration over 28 days (study-defined) (Cmin-d28) of 50.8 mcg/mL, maximum concentration at steady state (Cmaxss) of 230 mcg/mL, average concentration at steady state (Cavgss) of 182 mcg/mL, and week-17 Ctrough 123 mcg/mL. In the IV weight-based arm, corresponding values were Cavgd28 36.875 mcg/mL, Cminss 68.901 mcg/mL, Cmax1 91 mcg/mL, Cmin-d28 31.9 mcg/mL, Cmaxss 160 mcg/mL, Cavgss 92.5 mcg/mL, and week-17 Ctrough 66.3 mcg/mL. The reported geometric mean ratios confirmed higher exposure with fixed SC dosing, with Cavgd28 ratio 2.098 (90%, CI 2.001 to 2.200) and Cminss ratio 1.774 (90% CI 1.633 to 1.927) versus the weight-based IV regimen. SC nivolumab (1,200 mg every 4 weeks) was noninferior to IV weight-based nivolumab (3 mg/kg every 2 weeks) in terms of pharmacokinetics and ORR, with comparable safety and no new safety signals identified. Additionally, with respect to pharmacodynamics, at day 29, fixed-dose SC nivolumab and weight-based IV nivolumab showed similarly high PD-1 receptor occupancy on circulating CD3+, CD4+, and CD8+ T cells, with slightly higher median occupancy in the fixed-dose SC group for CD3+ (97.0% versus 94.7%) and CD4+ (98.3% versus 93.1%) cells and nearly identical occupancy for CD8+ cells (96.8% versus 96.3%). These results indicated broadly comparable pharmacodynamic target engagement between dosing strategies.
Kato49 was a retrospective cohort study with 19 patients. This study is at serious risk of bias, driven primarily by confounding. Notably, serum albumin was significantly greater in the fixed-dose group compared to the weight-based group. Serum albumin is an indicator of the level of cachexia, with low serum albumin suggesting a worsened disease severity. Thus, the difference in serum albumin observed in this study suggests a source of residual confounding associated with prognosis and clinical status. The study compared 3 mg/kg every 2 weeks with 240 mg every 2 weeks and found consistently higher trough concentrations with flat dosing across cycles 2 to 5. Mean (standard deviation [SD]) Cmin values for 3 mg/kg every 2 weeks were 14.2 (1.9), 21.5 (2.4), 33.0 (4.6), and 31.4 (4.1) before cycles 2, 3, 4, and 5, respectively, whereas corresponding values for 240 mg every 2 weeks were 27.5 (2.4), 43.3 (4.2), 57.9 (7.0), and 58.6 (8.8).
Between-group differences were statistically significant at all measured time points (P < 0.01, P < 0.01, P = 0.01, and P = 0.02, respectively), suggesting that fixed 240 mg every 2 weeks produced substantially higher trough exposure than weight-based 3 mg/kg every 2 weeks.
Gandhi53 represents a prospective, PK study with 25 patients. The study compared a weight-based conventional regimen (3 mg/kg IV every 2 weeks or every 3 weeks) with a fixed low-dose regimen (40 mg flat IV every 2 weeks or every 3 weeks) in a PK analysis. The terminal half-life was broadly similar between groups (264 hours for 3 mg/kg versus 283 hours for 40 mg), but systemic exposure was substantially lower with fixed low-dose nivolumab: Cmax was 47.3 mcg/mL with 3 mg/kg versus 9.06 mcg/mL with 40 mg, and AUC0–t was 238 mcg × day/mL versus 44.3 mcg × day/mL, respectively. Dose-normalized AUC0–t was relatively close (0.0014 versus 0.0011 day/mL/mg), suggesting broadly comparable exposure per mg administered, but the absolute exposure achieved with the 40 mg fixed dose remained markedly lower than with the 3 mg/kg weight-based regimen.
Zhao et al. (2024)62 was a model-based PopPK analysis using phase I or II CheckMate 8KX trial SC nivolumab data pooled with 19 historical IV nivolumab studies, with 3,540 total in the PopPK dataset; 82 patients received SC nivolumab in the CheckMate 8KX trial and 3,458 came from 19 historical IV studies, comparing weight-based nivolumab 3 mg/kg IV every 2 weeks, with 10 mg/kg IV every 2 weeks as an upper safe-exposure reference, versus fixed-dose nivolumab 720 mg SC every 4 weeks, 960 mg SC every 4 weeks, and 1,200 mg SC every 4 weeks (with rHuPH20) in model-based simulations. PK results showed that 720 mg SC every 4 weeks gave exposure similar to 3 mg/kg IV every 2 weeks, while 960 mg and 1,200 mg SC every 4 weeks gave higher trough and average exposure, but all SC regimens remained below the 10 mg/kg IV every 2 weeks benchmark; SC dosing also had a lower, delayed peak concentration than IV dosing.
Ter Heine et al.59 was a PK modelling and simulation study that included 500 virtual patients. The study compared standard reference regimens with alternative weight-banded fixed-dose strategies. The reference regimens were 3 mg/kg every 2 weeks and 360 mg every 3 weeks. The alternative regimens were every 2 weeks: less than 50 kg = 120 mg; 50 kg to 75 kg = 160 mg; 75 kg to 100 kg = 200 mg; more than 100 kg = 240 mg; and every 3 weeks: less than 60 kg = 280 mg; 60 kg to 90 kg = 320 mg; more than 90 kg = 360 mg. Compared with the reference regimens, the alternative dosing produced slightly lower exposures. For every 2 weeks, ratios of alternative to reference dosing were 0.90 for geometric mean trough concentration at the end of cycle 1, 0.91 at steady state, 0.87 for AUC at the end of cycle 1, and 0.90 for steady-state AUC. For every 3 weeks, the corresponding ratios were 0.82, 0.81, 0.83, and 0.82, respectively.
Overall, this suggests that the alternative weight-banded nivolumab regimens yielded exposures modestly less than the standard weight-based or flat reference regimens, with the alternative of every 2 weeks remaining closer to the reference than the every 3 weeks alternative.
Sanghavi et al.56 was a model-based ER and benefit-risk analysis with 448 patients in the adjuvant melanoma efficacy dataset from the CheckMate 238 trial and 3,008 patients in the pooled safety dataset across 14 studies. It compared weight-based nivolumab 3 mg/kg every 2 weeks with fixed dosing of 240 mg every 2 weeks and 480 mg every 4 weeks. For PK, 240 mg every 2 weeks produced nearly identical exposure to 3 mg/kg every 2 weeks, with very similar minimum concentration after first dose or first cycle (25.0 mcg/mL versus 24.7 mcg/mL), Cminss (96.8 mcg/mL versus 95.6 mcg/mL), Cmax1 (70.6 mcg/mL versus 69.5 mcg/mL), Cmaxss (171 mcg/mL versus 169 mcg/mL), and Cavgss (119 mcg/mL versus 118 mcg/mL). The 480 mg every 4 weeks regimen showed a different concentration profile, with higher peak concentrations (Cmax1 141 mcg/mL; Cmaxss 227 mcg/mL) and lower trough concentrations at steady state (Cminss 81.8 mcg/mL), but a similar average steady-state exposure (Cavgss 119 mcg/mL).
Overall, these findings suggest that fixed-dose nivolumab provides comparable overall PK exposure to weight-based dosing, with 240 mg every 2 weeks most closely matching the standard 3 mg/kg every 2 weeks regimen.
In Sheng et al. 54, 240 mg every 2 weeks (fixed dose) was evaluated against 3 mg/kg every 2 weeks and 10 mg/kg every 2 weeks. Compared with the standard weight-based 3 mg/kg every 2 weeks, the fixed 240 mg every 2 weeks regimen resulted in consistently higher exposure, with geometric mean increases of approximately 26% to 27% across all PK metrics (Cmin, Cmax, and Cavg at both cycle 1 and steady state). In contrast, when compared with the higher weight–based 10 mg/kg every 2 weeks regimen, the fixed dose produced substantially lower exposure, with reductions of approximately 60% to 62% across all PK parameters. Absolute exposure values supported these findings, with higher concentrations observed in the 240 mg group relative to 3 mg/kg, but markedly lower than 10 mg/kg.
Overall, these results indicate that fixed 240 mg every 2 weeks provides modestly higher exposure than standard weight-based dosing (3 mg/kg), while remaining substantially less than high-dose weight-based exposure (10 mg/kg), suggesting comparable exposure within the clinically relevant dosing range.
Zhao (2020)55 compared weight-based nivolumab 3 mg/kg IV every 2 weeks with fixed-dose nivolumab 240 mg IV every 2 weeks and 480 mg IV every 4 weeks. At steady state, 240 mg every 2 weeks produced PK exposure metrics very similar to 3 mg/kg every 2 weeks, with slightly higher concentrations overall: Cminss 70.6 mcg/mL versus 67.2 mcg/mL, Cmaxss 136.0 mcg/mL versus 129.1 mcg/mL, and Cavgss 91.2 mcg/mL versus 86.7 mcg/mL, corresponding to differences of about 5% across these measures. In contrast, 480 mg every 4 weeks maintained the same average steady-state concentration as 240 mg every 2 weeks (Cavgss 91.2 mcg/mL), but showed a different exposure pattern, with a lower trough concentration (Cminss 56.3 mcg/mL) and a higher peak concentration (Cmaxss 185.1 mcg/mL). AUC was not reported, so this comparison is based on Cminss, Cmaxss, and Cavgss only.
Overall, this modelling study suggests that fixed-dose 240 mg every 2 weeks provides PK exposure closely comparable to weight-based 3 mg/kg every 2 weeks, whereas fixed-dose 480 mg every 4 weeks maintains similar average exposure but produces greater peak-to-trough fluctuation.
Bei (2020)57 compared weight-based nivolumab 3 mg/kg IV every 2 weeks with fixed-dose nivolumab 240 mg IV every 2 weeks. Based on the reported PK modelling results, the fixed 240 mg every 2 weeks regimen produced higher modelled exposure than the 3 mg/kg every 2 weeks regimen across all reported parameters. Specifically, geometric mean Cavgd28 was 44.6 mcg/mL versus 32.5 mcg/mL, Cmin-d28 was 38.4 mcg/mL versus 27.9 mcg/mL, and Cmax1 was 76.1 mcg/mL versus 55.3 mcg/mL. Variability was broadly similar between regimens, with CVs of 21.4% versus 20.6% for Cavgd28, 27.7% versus 25.8% for Cmin-d28, and 21.0% versus 18.3% for Cmax1. These results correspond to approximately 37% higher exposure with 240 mg every 2 weeks than with 3 mg/kg every 2 weeks across all 3 PK parameters.
Overall, this study suggests that fixed dosing at 240 mg every 2 weeks results in modestly higher early nivolumab exposure than weight-based 3 mg/kg every 2 weeks, while maintaining similar variability.
Pembrolizumab
Cohen63 was an open-label, phase I, single-arm multicohort clinical trial (cohort B) with 101 patients. ROBINS-I was not applicable because this was a single-arm, nonrandomized study without a concurrent comparator group; although observed outcomes were compared with model-predicted exposures from other regimens, these were indirect external modelling benchmarks rather than a true nonrandomized intervention comparison. Pembrolizumab 400 mg every 6 weeks (fixed dosing) was evaluated and compared indirectly with model-predicted and historical exposures from both fixed (200 mg every 3 weeks) and weight-based regimens (2 mg/kg every 3 weeks and 10 mg/kg every 2 weeks). The geometric mean Cmax with 400 mg every 6 weeks was substantially lower than the high-dose weight-based regimen (10 mg/kg every 2 weeks), being approximately 42% lower at cycle 1 and 65% lower at steady state. In contrast, trough concentrations (Ctrough) were broadly comparable to standard regimens: compared with fixed 200 mg every 3 weeks, Ctrough was modestly lower (17% at cycle 1 and 22% at steady state), while compared with weight-based 2 mg/kg every 3 weeks, Ctrough was slightly higher (12% at cycle 1 and 4% at steady state).
Overall, these findings suggest that fixed dosing (400 mg every 6 weeks) achieves exposure levels comparable to standard weight-based and fixed regimens at clinically relevant trough levels, despite lower peak concentrations relative to higher-dose weight-based schedules.
Lala (2025)64 was a population PK model-based simulation using data from 3,607 patients. Simulated pembrolizumab regimens included fixed dosing (200 mg every 3 weeks, 400 mg every 6 weeks) and weight-based dosing (2 mg/kg every 3 weeks and an alternative 4 mg/kg regimen as reported). The 2 fixed regimens produced nearly identical geometric mean AUC values overall (1,744 mcg × mL for 200 mg every 3 weeks and 1,756 mcg × mL for 400 mg every 6 weeks), indicating similar total exposure between these fixed schedules. However, trough concentrations differed, with higher overall Ctrough for 200 mg every 3 weeks (28.3 mcg/mL) than for 400 mg every 6 weeks (17.9 mcg/mL). Compared with 2 mg/kg every 3 weeks, fixed dosing was associated with higher overall exposure, both for AUC (1,744 mcg × mL and 1,756 mcg × mL versus 1,293 mcg × mL) and Ctrough (28.3 mcg × mL and 17.9 mcg × mL versus 21.0 mcg/mL, depending on schedule). Across body weight strata, fixed dosing resulted in higher exposure in lower-weight patients and lower exposure in higher-weight patients, whereas weight-based dosing showed more consistent exposure across body weights. Despite these differences, the exposure distributions overlapped substantially across regimens. PD activity appears to be comparable across 400 mg every 6 weeks, 200 mg every 3 weeks, and 2 mg/kg every 3 weeks, based on similar exposure within the established flat ER range.
Ter Heine et al.59 was a PK modelling and simulation study that included 500 virtual patients. The study evaluated pembrolizumab 2 mg/kg every 3 weeks as the reference weight-based regimen versus an alternative weight-banded fixed-dose regimen of 100 mg every 3 weeks for patients less than 60 kg and 150 mg every 3 weeks for patients more than 60 kg. PK/PD modelling showed that the alternative regimen yielded equivalent predicted exposure to the reference regimen, with ratios of 1.0 for geometric mean Ctrough at the end of cycle 1, Ctrough at steady state, AUC at the end of cycle 1, and AUC at steady state. Overall, these findings suggest no meaningful difference in modelled pembrolizumab exposure between the fixed weight-banded and weight-based dosing strategies.
Lala (2020)58 is a PK modelling and simulation study (population PK + simulations) with 2,799 patients. The study evaluated fixed-dosing regimens of pembrolizumab (200 mg every 3 weeks and 400 mg every 6 weeks) against weight-based regimens (2 mg/kg every 3 weeks and 10 mg/kg every 2 weeks). Compared with the standard fixed regimen of 200 mg every 3 weeks, the 400 mg every 6 weeks regimen produced similar average exposure (Cavgss + 0.7%) but lower trough concentrations (Cminss −34%) and higher peak concentrations (Cmaxss + 59%). When compared with the weight-based 2 mg/kg every 3 weeks regimen, 400 mg every 6 weeks resulted in higher average exposure (Cavgss + 35%), modestly lower trough levels (Cminss −12%), and substantially higher peak concentrations (Cmaxss + 113%). In contrast, compared with the higher weight-based dose of 10 mg/kg every 2 weeks, 400 mg every 6 weeks yielded markedly lower overall exposure (Cavgss −81.8%) and peak concentrations (Cmaxss −65.6%), supporting its positioning within the established ER safety range. Overall, these findings suggest that fixed-dosing regimens provide comparable or clinically acceptable exposure relative to weight-based dosing, despite differences in peak and trough variability.
Tremelimumab
Fujiwara42 was a phase I, open-label trial with 65 participants and 3 cohorts: cohort 1 (weight-based) — 6 doses of tremelimumab 10 mg/kg every 4 weeks then 3 doses every 12 weeks plus 13 doses of durvalumab 15 mg/kg every 4 weeks; cohort 2 (weight-based) — 4 doses of tremelimumab 1 mg/kg every 4 weeks plus 4 doses of durvalumab 20 mg/kg every 4 weeks then 10 mg/kg every 2 weeks (up to 22 doses); and cohort 3 (fixed-dose) — 4 doses of tremelimumab 75 mg every 4 weeks plus 13 doses of durvalumab 1,500 mg every 4 weeks. Overall, systemic exposure was substantially higher with the higher weight–based dose (10 mg/kg) compared with both the lower weight–based (1 mg/kg) and fixed-dose (75 mg) regimens. Specifically, single-dose tremelimumab exposure (AUC0–t) was 2,010 day × mcg/mL for 10 mg/kg, compared with 153 mg/day for 1 mg/kg and 239 mg/day for the 75 mg fixed dose, with corresponding increases in Cmax and Cmin. Importantly, the fixed-dose (75 mg) produced slightly higher exposure than the low weight-based dose (1 mg/kg) (AUC 239 versus 153; Cmin 3.35 mcg/mL versus 2.71 mcg/mL), suggesting comparable or modestly greater exposure at lower dosing levels. At steady state, accumulation was also greater in the fixed-dose regimen than in the low weight-based regimen, with higher accumulation ratio values (e.g., Cmin: 2.03 versus 1.44) and higher steady-state concentrations (Cminss: 9.20 mcg/mL versus 4.14 mcg/mL), indicating greater drug accumulation and sustained exposure with fixed dosing. Similar patterns were observed for durvalumab, for which the fixed-dose combination (1,500 mg) yielded the highest exposure (AUC0–t 4,680 versus 3,390 and 2,980 in weight-based cohorts). Overall, these findings suggest that fixed dosing (75 mg) achieves exposure comparable to or higher than lower weight–based dosing (1 mg/kg), with greater accumulation over time, while higher weight–based dosing (10 mg/kg) predictably results in the greatest exposure. This supports the PK feasibility of fixed dosing, particularly at lower dose ranges, although no direct exposure-matching equivalence analysis was reported.
Juergens et al.48 was a phase Ib, multicentre, multicohort dose-escalation trial using a Rolling Six design (N = 136). The study evaluated tremelimumab PK across weight-based and fixed-dose regimens within durvalumab combination cohorts: 1 mg/kg every 3 weeks (dose level [DL] 1, DL2a), 3 mg/kg every 3 weeks (DL2b), 56 mg every 3 weeks (DL3), and 75 mg every 3 weeks (DL4). Based on the reported PK results, exposure with fixed-dose tremelimumab 75 mg every 3 weeks was broadly comparable to that observed with 1 mg/kg every 3 weeks, whereas 3 mg/kg every 3 weeks produced clearly higher concentrations. Specifically, the mean Cmax and Ctrough were 24.6 mcg/mL and 4.66 mcg/mL in DL1 and 25.6 mcg/mL and 4.34 mcg/mL in DL2a for 1 mg/kg, compared with 26.6 mcg/mL and 5.55 mcg/mL for the fixed 75 mg regimen. In contrast, the fixed 56 mg every 3 weeks regimen showed somewhat lower exposure (18.56 mcg/mL and 3.65 mcg/mL), while 3 mg/kg every 3 weeks yielded substantially higher values (73.2 mcg/mL and 13.5 mcg/mL). AUC was not reported, so comparisons are limited to peak and trough concentrations.
Overall, these findings suggest that fixed-dose tremelimumab 75 mg every 3 weeks achieves PK exposure similar to 1 mg/kg every 3 weeks, whereas 56 mg every 3 weeks may result in somewhat lower exposure and 3 mg/kg every 3 weeks in markedly higher exposure.
Hwang et al.65 conducted a PopPK modelling study using a pooled nonlinear mixed-effect modelling methodology (NONMEM) analysis, with external validation based on additional pooled studies, including 956 participants. The interventions and comparators included tremelimumab administered intravenously, both as monotherapy and in combination with durvalumab, across multiple phase I to III solid-tumour studies. Dosing regimens comprised weight-based dosing (e.g., 1 mg/kg, 3 mg/kg, and 10 mg/kg every 4 weeks) and flat dosing (e.g., 750 mg every 4 weeks for monotherapy; 75 mg every 4 weeks in combination). Tremelimumab had an estimated half-life of approximately 18 days (about 432 hours). The study did not provide a direct observed head-to-head comparison with summary AUC, Cmax, or Cmin estimates presented uniformly for fixed versus weight-based dosing; instead, it used model-based simulations. Reported exposure metrics included cycle 1 Cmin and Cmax by dose group and average exposure over the first 16 weeks for the comparison of 75 mg fixed dosing versus 1 mg/kg weight-based dosing. Simulation results suggested broadly comparable exposure, with overlap proportions of approximately 86.3% in patients more than 90 kg, 73.7% in those more than 110 kg, 72.0% in those less than 50 kg, and 63.6% in those less than 40 kg.
Overall, this study supports that fixed-dose tremelimumab 75 mg provides comparable model-predicted exposure to 1 mg/kg weight-based dosing, but the evidence comes from population PK modelling rather than a direct comparative PK/PD trial.
System- and Implementation-Related Outcomes
The studies included in our review did not contain any results pertaining to system- and implementation-related outcomes (e.g., preparation time, risk of repetitive strain injuries for staff, resource use, staff workflow, or satisfaction).
Limitations
This review is reported according to the PRISMA checklist (Appendix 7), but it has several important limitations that should be considered when interpreting the findings.
First, we did not conduct a quantitative meta-analysis. Because the included evidence was heterogeneous in terms of study designs (e.g., clinical trials, nonrandomized studies, PK/PD models), dosing, and intervention components, we summarized results descriptively rather than pooling effect estimates. As a result, we could not generate an overall quantitative estimate of effect, formally evaluate statistical heterogeneity, or explore modifiers (e.g., cancer type, line of therapy, dosing frequency) using meta-regression or subgroup meta-analyses.
Second, we did not apply the GRADE framework to assess confidence in the body of evidence.66 Without a structured certainty assessment, our ability to scientifically and clinically interpret the overall strength of the evidence is limited. In particular, it is more difficult to judge how methodological or analytical issues such as imprecision, inconsistency, indirectness, and publication bias affect the credibility and applicability of the conclusions.
Third, risk-of-bias assessment was challenging for PK/PD modelling studies. Although reporting guidance and checklists exist for pharmacometric and PK/PD model studies, there is no widely accepted, validated risk-of-bias tool tailored to these designs. Consequently, we could not apply a standardized approach to evaluate internal validity for this important subset of evidence.
Conclusions and Implications for Decision- or Policy-Making
Conclusions
Efficacy, Effectiveness, and Safety Outcomes
Overall, there was limited direct head-to-head clinical evidence comparing fixed versus weight-based dosing. Most comparative evidence involved pembrolizumab and nivolumab, with less evidence available for the other ICIs. Across studies evaluating fixed dosing versus weight-based dosing, patients often had comparable survival, progression, treatment response, and rate of serious side effects. However, the evidence was not rigorous for all ICIs. Many studies also had important methodological flaws in their design, conduct, and analysis, such as small sample sizes, nonrandomized designs, and differences between patient groups.
Pharmacokinetic and Pharmacodynamics Outcomes
The evidence suggests that fixed-dose and weight-based dosing often give patients a similar average drug exposure, whereas extended-interval regimens — such as dosing every 4 or 6 weeks — may produce higher peak drug concentrations and lower trough concentrations. Some studies also showed that fixed dosing may lead to higher exposure in lower-weight patients and lower exposure in higher-weight patients; however, these differences appeared minimal and were not explicitly linked to meaningful differences in clinical outcomes.
Overall Conclusion
Overall, the evidence suggests that fixed-dose and weight-based regimens often produce comparable clinical outcomes, particularly for nivolumab and pembrolizumab, which had the largest body of evidence. Evidence describing pharmacokinetics and pharmacodynamics suggested that fixed dosing results in a similar average drug exposure compared with weight-based dosing, though extended-interval regimens may produce higher peak and lower trough concentrations.
However, many of the included studies had weaknesses that make the results less reliable, and we could not draw firm conclusions for all drugs and cancer types. Decisions regarding ICI dosing policy should weigh the conclusions together with this uncertainty, while also considering patient burden, patient preferences, and health system resource impacts.
Comparison With the Previous INESSS Report: Key Differences and Similarities
INESSS Report (2022)
The INESSS report7 published in 2022 focused on 7 ICIs (atezolizumab, avelumab, cemiplimab, dostarlimab, durvalumab, nivolumab, pembrolizumab). The review examined scientific efficacy, safety and PK data from systematic reviews of primary studies, pharmacoeconomic data, and recommendations from clinical practice guidelines to examine different dosing strategies of different ICI drugs. These data were enriched with information specific to the Quebec context and with experiential knowledge provided by clinicians with different expertise and specialties. The results of this systematic review were presented in the form of a narrative synthesis. For each efficacy and safety end point, a summary statement of scientific evidence is provided, to which an overall level of scientific evidence was assigned. The recommendations were developed in collaboration with an advisory committee. The information on contextual and experiential data is presented in narrative form and is summarized in tables. Lastly, the overall quality of the initiative, its acceptability and applicability were evaluated using external reviewers who specialize in the field of interest and who did not take part in the work.
The methodological quality was assessed using R-AMSTAR (Revised Assessment of Multiple Systematic Reviews)67 to assess the quality of systematic reviews; the Public Health Agency of Canada Critical Appraisal of Analytical Studies tool or the Critical Appraisal Skills Programme tool for RCTs or non-RCTs, quasi-experimental studies, and nonrandomized (cohort) studies.68
The assessment of the scientific evidence of the statements answering the assessment questions is based on the examination of the body of scientific evidence according to the following 4 criteria: the methodological quality of the studies, coherence, clinical impact, and generalizability. The overall level of scientific evidence reflects the integration of the results of the 4 criteria for assessing scientific evidence to report confidence in the results of the scientific evidence. The quality of the scientific evidence was assessed by the assessors who conducted the systematic review to answer the assessment questions.
CDA-AMC Update (2026)
The current review included the 7 ICIs reported in the prior review and added 2 additional ICIs, ipilimumab and tremelimumab. Consistent with the INESSS report, our eligibility criteria encompassed different primary study designs, including RCTs, nonrandomized studies, and PK/PD modelling studies. We included systematic reviews to scan their references for additional records, assess their methodological quality, and compare their findings with our report (the overlap between selected flagged systematic reviews and the primary studies included in this review is provided in Appendix 8). We did not include clinical practice guidelines in this review. In contrast to the INESSS report that investigated a broad dosing regimen, this review targeted studies that evaluated a fixed-dosing regimen versus weight-based dosing for the ICI. Similarly, we performed a descriptive synthesis of the included studies to report on the evidence. Nevertheless, in descriptive systematic reviews, particularly when there are many included studies, synthesis statements are often limited to reporting the number of relevant studies and the direction and magnitude of effect estimates. There is no quantitative pooling of data in this synthesis strategy.
The largest difference between our review and the INESSS report7 is that the INESSS report7 involved clinical judgments to move from evidence to recommendations, which was beyond the scope of this report. To do this would require a systematic and evidence-based approach, including pooling data quantitatively when possible through meta-analyses, assessing the certainty of evidence using grading frameworks such as GRADE,66 and then moving from evidence to recommendations and guidelines using an evidence-to-decision framework.69 This framework would consider not only the pooled evidence, but also additional contextual factors such as patient values and preferences, feasibility, costs, and equity. We addressed this as a limitation in the report.
Lastly, this review appraised the quality (internal validity) of both primary and secondary included studies. In the INESSS report,7 quality appraisal was conducted using generic design tools such as those from the Public Health Agency of Canada and the Critical Appraisal Skills Programme.68 These tools are not study design–specific and may miss important and specific methodological issues linked to each design. We used Cochrane RoB 2 for RCTs,14 ROBINS-I for nonrandomized studies,15 and AMSTAR 2 for reviews.16 These tools are intended to assess internal validity only and may not be useful for informing aspects such as applicability (generalizability) and external validity. Assessing external validity would require additional clinical judgment beyond the scope of this review.
ICI-Specific Conclusions and Synthesis With Findings From the INESSS Report
We summarized and compared the findings from the INESSS report and this review in Table 5.
Atezolizumab
Safety and Efficacy Outcomes
Our included study (Patel, 2024)38 did not provide atezolizumab-specific comparisons between fixed and weight-based dosing because outcomes were reported only at the pooled ICI level and included very few patients receiving atezolizumab. At the overall group level, ORRs were 72.2% with fixed dosing, 60.9% with per-body-weight dosing, and 75.7% with low-dose treatment; however, OS was not reported by arm, and safety outcomes were not reported, so no conclusions can be drawn regarding comparative efficacy or safety for atezolizumab specifically. The external validity of this study to the context in Canada is limited because this was a single-centre study from India conducted in a resource-limited setting with multiple tumour types, various clinical settings, and mixed concurrent treatments, which the authors noted makes generalization difficult.
These findings are consistent with those of the INESSS report,7 which also found a lack of robust comparative data. The report concluded that the evidence is insufficient to assess differences in efficacy between fixed and weight-based dosing and that the available safety data are limited and of low certainty. Although some differences in AE rates were observed at higher weight–based doses (e.g., 20 mg/kg versus fixed 1,200 mg), these findings do not establish a clear or consistent advantage for either dosing strategy.
Systematic review evidence also aligns with this interpretation. The network meta-analysis by Hong et al.21 evaluated different fixed-dose regimens of atezolizumab and identified some variation in AE risk across doses; however, it did not include weight-based comparisons, limiting its applicability to the question of interest. Similarly, Wesevich et al.23 reported no direct clinical comparative data for atezolizumab dosing strategies, relying instead on PK simulations suggesting adequate exposure across alternative dosing approaches.
Taken together, the available evidence from the included study and external sources consistently demonstrates a lack of reliable, direct comparative evidence. Our findings do not support a clear conclusion regarding differences in efficacy or safety between fixed and weight-based dosing of atezolizumab.
PK/PD Modelling Outcomes
Our included PK/PD modelling study (Ter Heine)59 found that the alternative weight-banded fixed dosing regimen, compared with the reference fixed-dose regimen of atezolizumab 1,200 mg every 3 weeks, produced consistently lower modelled exposure across all reported PK parameters, with ratios of 0.82 for cycle 1 trough concentration, steady-state trough concentration, cycle 1 AUC, and steady-state AUC. These findings indicate an approximately 18% reduction in exposure with the weight-banded fixed dosing regimen relative to fixed dosing. External validity may be limited because the simulations were based on a representative population living in Europe, and the authors noted that populations with higher average body weight may receive higher doses. In addition, the study relied on modelled PK outcomes rather than real-world clinical data.
These findings are partially consistent with the INESSS report.7 INESSS similarly identified PK variation across atezolizumab dosing strategies but, overall, interpreted the exposure differences as modest and unlikely to be clinically important. In particular, the report noted that predicted AUC values were similar across regimens such as 840 mg every 2 weeks, 1,200 mg every 3 weeks, and 1,680 mg every 4 weeks, whereas Cmin and Cmax varied somewhat depending on schedule and body weight. Thus, both sources suggest that alternative atezolizumab dosing can alter exposure, but the included study found a more consistent reduction across trough and AUC measures than the broader equivalence suggested by INESSS.
The findings are more closely aligned with the narrative reviews by Wesevich et al.23 and Sehgal.26 Wesevich et al.23 summarized evidence indicating that alternative atezolizumab dosing maintained trough concentrations higher than the proposed PD target of 6 mcg/mL. Similarly, Sehgal26 reported that for atezolizumab 1,680 mg every 4 weeks versus 1,200 mg every 3 weeks, predicted Cmin was only modestly lower, AUC was slightly higher, and exposure remained above the target concentration considered sufficient for receptor saturation. Taken together, these reviews support the interpretation that, although alternative regimens may reduce exposure relative to standard fixed dosing, the reduction may still remain within a clinically acceptable and pharmacodynamically adequate range.
Overall, the included study suggests that weight-banded fixed dosing results in consistently lower systemic exposure than fixed dosing, whereas external evidence indicates that such reductions may still preserve pharmacodynamic sufficiency. Therefore, the direction of effect is broadly consistent with prior evidence showing some exposure differences between regimens, although the magnitude of reduction observed in the included study appears greater than that reported in the INESSS report.7
Avelumab
Safety and Efficacy Outcomes
Our included studies suggest that fixed-dose and weight-based avelumab have broadly similar efficacy and safety. In the small clinical trial by Herrera,29 response outcomes for the 10 mg/kg weight-based arm were generally within the range observed across the fixed-dose arms, without showing a clear advantage for 1 strategy overall. Applicability of this study is limited because the trial was very small, included a highly selected group of heavily pretreated patients, and evaluated several experimental dosing regimens, including doses that are not standard in routine practice. The 2 model-based studies, Masters51 and Novakovic,52 likewise found no meaningful ER differences between 800 mg fixed dosing and 10 mg/kg weight-based dosing for either efficacy or safety. Although Novakovic52 reported a slightly higher predicted rate of irAEs with fixed dosing, the difference was small, and overall both studies supported comparable safety profiles. For the Masters51 study, applicability is somewhat limited because the findings are based on pharmacokinetic modelling and simulations rather than direct clinical comparisons of outcomes, and the analysis relies on selected clinical trial populations with strict eligibility criteria. Although Novakovic52 used a large, pooled dataset, generalizability is likewise limited because the study relies on PK modelling and simulations rather than direct comparative clinical outcomes.
Overall, these findings are consistent with the INESSS report,7 which also concluded that efficacy and irAEs appear similar between fixed-dose (800 mg) and weight-based (10 mg/kg) avelumab, while noting that the certainty of evidence is limited. No additional literature reviews were identified for this ICI.
PK/PD Modelling Outcomes
Our included studies suggest that fixed-dose and weight-based avelumab produce broadly comparable PK profiles. In the small clinical PK/PD trial (Herrera),29 fixed dosing — particularly 500 mg every 2 weeks — resulted in lower overall exposure (AUC) and peak concentrations (Cmax) compared with weight-based dosing (10 mg/kg every 2 weeks), although trough concentrations (Ctrough) and terminal half-life were similar, indicating comparable sustained exposure and elimination. In contrast, larger model-based studies (Masters;51 Novakovic52) showed that fixed dosing (800 mg every 2 weeks) and weight-based dosing (10 mg/kg every 2 weeks) produced overlapping exposure metrics (AUC, Cmax, Ctrough) with no meaningful overall differences. These studies also found that fixed dosing leads to weight-dependent variability in exposure, whereas weight-based dosing results in more consistent exposure across body weight groups.
These findings are consistent with the INESSS report,7 which similarly concluded that PK parameters — including AUC, Cmax, and Cmin — are almost similar between 10 mg/kg and 800 mg every 2 weeks, with substantial overlap in exposure across body weight categories. INESSS7 also reported similar half-life across dosing regimens and noted weight-related variability in exposure with fixed dosing, while emphasizing that these differences are modest and unlikely to be clinically meaningful. No additional literature reviews were identified for this ICI.
Cemiplimab
Safety and Efficacy Outcomes
Across our included studies, fixed-dose and weight-based cemiplimab appeared broadly similar for efficacy and safety in advanced or metastatic cutaneous squamous cell carcinoma. Hughes et al.32 provided the clearest direct comparison, although generalizability was somewhat limited due to the nonrandomized design. Rischin et al. (2020)50 and Rischin et al. (2024)39 provided supportive but less direct evidence, but their generalizability was impacted by selected trial populations, and for Rischin et al. (2024),39 also by the small sample size and single-arm design. Overall, confidence in this conclusion remains limited by serious risk of bias, lack of adjusted head-to-head analyses, and some concerns about external validity.
These findings are consistent with both the INESSS report7 and the narrative review by Lee et al.25 The INESSS report7 concluded that overall response, disease control, time to response, duration of response, and AE rates were similar between cemiplimab 3 mg/kg every 2 weeks and 350 mg every 3 weeks in metastatic cutaneous squamous cell carcinoma, and our included studies support that same overall interpretation. Similarly, Lee et al.25 reported broadly similar ORRs, durable responses, and comparable rates of grade 3 or higher TRAEs across cemiplimab dosing strategies, which is consistent with the pattern observed in Hughes et al.32 and Rischin et al. (2020).50
PK/PD Modelling Outcomes
Across our included studies, fixed-dose and weight-based cemiplimab produced broadly similar PK exposure. Both the PopPK analyses (Yang,60 which included a large, diverse pooled clinical trial population across multiple tumour types and body weight ranges, although limited by reliance on modelling and trial populations, and Paccaly,61 which similarly incorporated a wide weight range and multiple malignancies but was also based on modelled and trial data) and the observed phase II data from Rischin et al. (2024)39 demonstrated comparable steady-state exposure between 350 mg every 3 weeks and 3 mg/kg every 2 weeks, with overlapping or very similar AUC, Ctrough or Cmin, and Cmax values. Although minor early differences and some variation across body weight groups were reported, these findings did not indicate a clear or clinically meaningful exposure advantage for either dosing strategy.
These findings are consistent with both the INESSS report7 and the narrative review by Lee et al.25 The INESSS report7 similarly concluded, based on Paccaly61 and Yang,60 that simulated AUC was comparable between 350 mg every 3 weeks and 3 mg/kg every 2 weeks and that although minimum and maximum concentrations may differ after the first dose, steady-state concentrations were similar across dosing strategies. INESSS7 also noted opposing exposure trends by body weight depending on dosing strategy but emphasized that overall AUC remained similar across a wide range of body weights. Likewise, Lee et al.25 reported comparable steady-state exposure between regimens, with AUCss values of 3.710 day × mg/L for 3 mg/kg every 2 weeks and 3.800 day × mg/L for 350 mg every 3 weeks, as well as a terminal half-life of approximately 19 days. Together, these external sources support the same overall conclusion as our included studies: fixed-dose cemiplimab provides PK exposure similar to weight-based dosing.
Dostarlimab
Safety and Efficacy Outcomes
Early-phase evidence from Patnaik et al.46 did not show a clear safety or efficacy advantage for either fixed or weight-based dostarlimab dosing, but interpretation is limited by small events, small cohorts, and serious methodological limitations. External validity is limited, because this early-phase, small, highly selected trial population (advanced solid tumours, trial-eligible patients, mainly US-based multicentre settings) may not fully reflect real-world oncology populations. Similarly, the INESSS report7 found no statistically significant differences across fixed-dose regimens and judged the evidence insufficient to determine whether fixed and weight-based dosing differ in efficacy or safety. No additional literature reviews were identified for this ICI.
PK/PD Modelling Outcomes
Our included study (Patnaik et al.)46 suggests that fixed-dose dostarlimab provides PK exposure broadly comparable to higher weight–based regimens, with 1,000 mg every 6 weeks producing higher overall exposure than 500 mg every 3 weeks.
This was consistent with the INESSS report,7 which also found increased exposure with higher fixed doses, although the evidence was interpreted more cautiously in the report because of very small sample sizes and reliance on modelling. No additional literature reviews were identified for this ICI.
Durvalumab
Safety and Efficacy Outcomes
Across the included studies, direct comparisons of fixed versus weight-based dosing were limited and at serious risk of bias. Patel38 and Fujiwara42 showed no consistent efficacy or safety advantage for either approach, Juergens48 did not report outcomes in a way that allowed a valid comparison by dosing strategy, and Hijmering-Kappelle43 found broadly similar safety and efficacy between fixed and weight-based durvalumab. Overall, the evidence does not suggest a clear clinical advantage of 1 dosing approach over the other. In terms of external validity, Patel was a resource-constrained single-centre study in India. By contrast, Juergens was a Canadian multicentre trial, whereas Hijmering-Kappelle’s real-world Dutch NSCLC study may also be reasonably transferable to practice in Canada, although its COVID-era dose-escalation design still limits generalizability.
These findings are broadly consistent with the INESSS report.7 INESSS7 concluded that there was insufficient evidence comparing fixed-dose with weight-based durvalumab, and our findings support that conclusion, given that the available direct comparative studies were few and methodologically limited. Although Hijmering-Kappelle43 provided a more direct comparison and suggested similar safety and efficacy between approaches, the serious risk of bias means this evidence is still not strong enough to establish superiority of either dosing strategy. No additional literature reviews were identified for this ICI.
PK/PD Modelling Outcomes
Included studies suggest broadly similar PK exposure between fixed and weight-based durvalumab, with 1 exception. Juergens et al.48 and Ter Heine et al.59 supported PK comparability across dosing strategies, whereas Fujiwara et al.42 found higher exposure with fixed dosing; however, that study used nonequivalent regimens, so its findings should be interpreted cautiously. In terms of external validity, Juergens et al.48 is particularly relevant to the context in Canada because it was a Canadian multicentre trial conducted across major oncology centres and under Health Canada oversight. By contrast, Fujiwara et al.42 was conducted only in patients living in Japan, and Ter Heine et al.59 was a European modelling study in virtual patients, so both may not be directly generalizable to routine practice in Canada.
Overall, this is consistent with the INESSS report,7 which also found that fixed and weight-based durvalumab produce similar exposure in modelling studies, with no clear evidence of clinically important over- or under-exposure. Fujiwara42 is the main partial inconsistency, but it has weak comparative evidence and does not materially change the overall conclusion of broad PK similarity. No additional literature reviews were identified for this ICI.
Ipilimumab
Safety and Efficacy Outcomes
We did not find any study reporting on this ICI regarding the safety and efficacy outcomes of interest, and the INESSS report7 did not include this ICI either. No additional literature reviews were identified for this ICI.
PK/PD Modelling Outcomes
Ter Heine et al.59 found that weight-banded fixed dosing of ipilimumab produced equivalent PK exposure to standard weight-based dosing. Compared with 1 mg/kg every 6 weeks, the alternative regimen (< 60 kg: 50 mg; 60 kg to 90 kg: 75 mg; > 90 kg: 100 mg) demonstrated similar Ctrough and AUC, with geometric mean ratios of 1.0 at both early and steady state, indicating no clinically meaningful PK/PD differences. External validity is limited, given that the model was based on a representative population living in Europe with similar clinical and regulatory contexts, but is limited by reliance on simulated rather than real-world data. The INESSS report7 did not contain this ICI either. No additional literature reviews were identified for this ICI.
Nivolumab
Safety and Efficacy Outcomes
Overall, our included studies are largely consistent with the INESSS summary.7 Across the randomized trial, several real-world comparative cohorts, and multiple model-informed analyses, the most common finding was that fixed-dose nivolumab and weight-based nivolumab produced broadly similar safety and efficacy outcomes, especially for ORR, PFS, OS, and immune-related toxicity. This aligns well with the INESSS7 conclusions that fixed dosing at 240 mg every 2 weeks or 480 mg every 4 weeks appears to have similar efficacy and similar adverse-effect rates compared with 3 mg/kg every 2 weeks, and that evidence for cross-dose comparisons more generally suggests little meaningful difference in response or toxicity.
For safety, the agreement is particularly strong. Most of our included comparative studies found no statistically significant difference in irAEs, grade 3 or higher toxicity, TRAEs, or discontinuation between fixed and weight-based dosing. This is very much in line with the INESSS statements7 that adverse-effect rates are similar between nivolumab dosing strategies. The model-based studies also supported this pattern, generally predicting negligible differences in safety outcomes across regimens.
External validity is somewhat limited: most evidence comes from retrospective, single-country or single-centre studies (e.g., Europe, India, Japan), which may not fully reflect broader oncology populations or practice in Canada. However, inclusion of some multicentre and international trial data (e.g., from the CheckMate 67T trial) improves generalizability, indicating findings are likely applicable to high-income settings like Canada, yet it is still constrained by selection bias and real-world heterogeneity.
For efficacy, our review also mostly supports the INESSS7 conclusions, though with a bit more nuance. Several studies found similar ORR, PFS, and OS between dosing strategies, and the modelling studies consistently predicted near-identical outcomes. However, a few nonrandomized studies showed numerically better survival or response with fixed dosing, such as Campo le Brun30 and Leroy.37 These findings do not clearly contradict INESSS,7 because they come from studies at serious risk of bias, where calendar-time effects, treatment selection, and residual confounding are likely explanations. As such, the apparent differences are better interpreted as uncertain signals from weaker real-world evidence rather than firm inconsistency.
There are also a few studies that are only partly informative for the fixed-versus-weight-based question. Horisaki31 did not report a direct fixed-versus-weight-based comparison; Gandhi53 compared weight-based dosing with a low fixed dose rather than the standard, approved fixed regimens; and Sheng,54 Zhao,55 Bei57, and Sanghavi56 were model-informed rather than direct clinical comparisons. Even so, their overall direction still supports the same general conclusion as INESSS:7 no major clinically meaningful difference between fixed and weight-based nivolumab dosing.
PK/PD Modelling Outcomes
Across the included PK/PD modelling and PK-focused studies of nivolumab, fixed dosing generally produced exposures that were either very similar to or modestly higher than standard weight-based dosing, although findings varied by regimen. Several modelling studies found that 240 mg every 2 weeks closely approximated 3 mg/kg every 2 weeks, with only small differences in steady-state exposure metrics such as Cmin, Cmax, and Cavg (e.g., Sanghavi,56 Zhao55). Other studies suggested somewhat higher exposure with fixed dosing: Bei (2020)57 reported an approximately 37% higher modelled early exposure with 240 mg every 2 weeks, Sheng et al.54 found approximately a 26% to 27% higher exposure versus 3 mg/kg every 2 weeks, and Kato49 observed significantly higher trough concentrations with 240 mg every 2 weeks in a small retrospective cohort. In contrast, Gandhi53 showed that a low fixed dose of 40 mg resulted in markedly lower absolute exposure than 3 mg/kg, indicating that equivalence does not hold for substantially reduced flat doses.
For alternative schedules and formulations, the exposure profile differed but remained broadly within a clinically relevant range. Zhao (2020)55 found that 480 mg every 4 weeks had similar average exposure to 240 mg every 2 weeks or 3 mg/kg every 2 weeks, but with lower troughs and higher peaks, while Albiges28 and Zhao (2024)62 showed that SC fixed-dose nivolumab regimens produced similar or higher overall exposure than IV weight-based dosing, with delayed and lower peak concentrations than IV administration. Ter Heine’s59 simulation study suggested that weight-banded fixed dosing regimens yielded slightly lower exposure than standard reference regimens, especially for dosing every 3 weeks, but the reductions were modest.
Overall, our findings are largely consistent with the INESSS report.7 Both our review and INESSS7 suggest that a fixed dosage of 240 mg every 2 weeks provides PK exposure broadly comparable to 3 mg/kg every 2 weeks, whereas 480 mg every 4 weeks maintains similar average exposure but with lower troughs and higher peaks. The main point of inconsistency is that some of our included studies, especially Kato,49 Bei,57 and Sheng,54 suggest fixed dosing may produce modestly higher exposure than weight-based dosing rather than near-equivalent exposure. This likely reflects differences in study design, populations, and whether evidence came from nonrandomized study data, trial-based PK analyses, or model-based simulations.
Our findings are also consistent with the Sehgal systematic review.26 Consistent with Sehgal,26 we found that extended-interval nivolumab dosing (480 mg every 4 weeks) leads to lower troughs, higher peaks, and similar time-averaged exposure compared with 3 mg/kg every 2 weeks. More broadly, both syntheses support the conclusion that approved fixed-dose and extended-interval nivolumab regimens achieve exposure within the range considered clinically acceptable, despite some shifts in peak-to-trough fluctuation.
Pembrolizumab
Safety and Efficacy Outcomes
Across our included studies, which were mostly retrospective cohort studies at serious risk of bias largely because of confounding, fixed and weight-based dosing strategies generally appeared to result in similar safety and efficacy outcomes, particularly for pembrolizumab. Larger real-world studies such as Chaitesipaseut et al.35 and Berard et al.40 found no meaningful differences in OS, PFS, or toxicity between fixed and weight-based approaches. Likewise, Staender et al.34 reported no statistically significant differences in survival or irAEs. Some studies suggested possible numerical differences between strategies: Smeenk et al.33 and Grit et al.36 observed longer survival with hybrid or weight-banded fixed dosing, whereas To et al.47 reported higher response rates and PFS with fixed dosing as well as a higher incidence of any-grade irAEs. However, these apparent differences were inconsistent across studies and should be interpreted cautiously given the high potential for residual confounding, nonrandom treatment allocation, and limited adjustment for baseline differences. In terms of external validity, these studies were conducted in routine-care settings across several health systems, including Canada (Quebec), Germany, India, the Netherlands, Taiwan, and the US, which supports some real-world generalizability. However, applicability to the context in Canada is still somewhat limited because most evidence came from retrospective cohorts from outside of Canada, although the Quebec study offers the most directly relevant Canadian data.
These findings are largely consistent with the INESSS report.7 Similar to INESSS,7 our review found that OS, PFS, response outcomes, and AE rates were generally comparable across fixed and weight-based pembrolizumab dosing strategies. Although a few of our included real-world studies suggested numerical advantages for either weight-banded fixed dosing or fixed dosing, these results were not consistent and were likely influenced by confounding and other design limitations. As a result, our synthesis supports the same overall conclusion as INESSS:7 current evidence does not show a clear efficacy or safety advantage for 1 dosing approach over another, and the available comparative evidence remains limited in certainty. No additional literature reviews were identified for this ICI.
PK/PD Modelling Outcomes
Across the included studies, fixed pembrolizumab dosing (e.g., 200 mg every 3 weeks or 400 mg every 6 weeks) generally produced comparable overall exposure (AUC and Cavg) to weight-based dosing (2 mg/kg every 3 weeks), despite differences in peak and trough concentrations. Extended-interval fixed dosing (400 mg every 6 weeks) tended to result in lower trough concentrations (Cmin or Ctrough) and higher peak concentrations (Cmax) compared with more frequent dosing schedules, while maintaining similar average exposure. Compared with weight-based regimens, fixed dosing often led to slightly higher exposure overall — particularly in lower-weight patients — whereas weight-based dosing produced more consistent exposure across body weights. Importantly, exposure distributions overlapped substantially across regimens; and modelling studies, including weight-banded fixed dosing approaches, consistently demonstrated no meaningful differences in predicted exposure. Overall, these findings suggest that fixed dosing provides clinically comparable and acceptable PK/PD profiles, with variability in peak and trough levels but no evidence of clinically meaningful differences in exposure. External validity is moderate: the evidence includes large multitumour population PK datasets, which supports generalizability, but much of it comes from modelling or simulation studies and selected trial populations rather than routine real-world practice. In addition, direct applicability to the context in Canada is reasonable but somewhat limited, because most studies were multinational or model-based rather than conducted specifically in oncology settings in Canada.
These findings are highly consistent with the INESSS report,7 which similarly shows that pembrolizumab exhibits linear PK, with dose-proportional increases in exposure. INESSS7 also reports that fixed dosing (200 mg every 3 weeks or 400 mg every 6 weeks) yields similar average exposure to standard regimens, but with lower trough and higher peak concentrations for extended-interval dosing. Additionally, both sources indicate that fixed dosing can result in higher exposure compared with 2 mg/kg in some cases (approximately 35%), while still maintaining adequate PD-1 receptor saturation. The influence of body weight on exposure under fixed dosing — higher exposure in lower-weight patients and lower exposure in higher-weight patients — is also consistent across both the included studies and INESSS7 findings. Overall, both sources suggest that fixed and weight-based dosing produce broadly comparable exposure within acceptable therapeutic ranges.
Similarly, the findings align with the systematic review by Sehgal et al. (2020),26 which reported comparable AUCs across fixed and weight-based regimens, alongside lower trough and higher peak concentrations with extended-interval fixed dosing. The review also noted that only a very small proportion of patients were predicted to fall below exposure thresholds, and only for a short duration, with overall exposure remaining within clinically effective and safe ranges. Taken together, the evidence consistently indicates that differences between dosing strategies are primarily quantitative (i.e., variability in PK parameters) rather than clinically meaningful, supporting the equivalence of fixed and weight-based dosing approaches.
Tremelimumab
Safety and Efficacy Outcomes
Across the included studies, there was no clear evidence that fixed dosing was meaningfully better or worse than weight-based dosing for safety or efficacy. In Fujiwara et al.,42 response appeared numerically lower with fixed dosing, whereas AEs were broadly similar across groups; however, the comparison was heavily limited by very small, nonrandomized cohorts and differences in the accompanying durvalumab regimens. In Juergens et al.,48 outcomes were not reported separately by tremelimumab dosing strategy, so no direct fixed-versus-weight-based comparison could be made. External validity to the context in Canada is moderate to high because this was a Canadian multicentre trial conducted in routine oncology centres in Canada using clinically relevant platinum-doublet backbones, although generalizability is still limited by its early-phase, nonrandomized design and heterogeneous mixed-tumour population. Overall, the evidence is sparse and at serious risk of bias. The INESSS report7 did not contain this ICI either. No additional literature reviews were identified for this ICI.
PK/PD Modelling Outcomes
Across studies, fixed-dose tremelimumab 75 mg produced PK exposure broadly similar to low weight-based dosing (1 mg/kg), whereas higher weight–based dosing (e.g., 3 mg/kg or 10 mg/kg) predictably resulted in greater exposure. Fujiwara42 and Juergens48 showed that 75 mg fixed dosing yielded comparable, and in some cases slightly higher, trough levels and accumulation than 1 mg/kg, whereas Hwang’s65 PopPK analysis demonstrated substantial exposure overlap across body weight groups. The Hwang study65 could be informative for the context in Canada, given its large, multinational population that included a centre in Canada (Princess Margaret Cancer Centre) and similar oncology practice settings, although generalizability remains limited by reliance on clinical trial populations and PK modelling. Overall, these findings support the PK feasibility of fixed dosing at standard lower dose levels, though the evidence is primarily based on early-phase studies and modelling rather than direct exposure-equivalence trials. The INESSS report7 did not contain this ICI either. No additional literature reviews were identified for this ICI.
Table 5: Comparison of INESSS Recommendations and CDA-AMC Findings on ICI Dosing Strategies
ICI | Doses and regimens described in INESSS report (2022) | INESSS report recommendations | Doses and regimens described in CDA-AMC update (2026) | Alignment of reports | Areas of consistency or divergence |
|---|---|---|---|---|---|
Atezolizumab | Fixed dosing:
Weight-based dosing:
| After analyzing all the information collected, the following dosages should be used for atezolizumab (in all approved indications):
or
or
| Fixed dosing:
Weight-banded fixed dosing:
| Safety and efficacy outcomes: Consistent PK/PD modelling outcomes: Somewhat consistent | Safety and efficacy outcomes: Both sources reported on limited available data to compare fixed dosing vs. weight-based dosing PK/PD modelling outcomes: Current review suggested lower exposure with weight-banded fixed dosing than the INESSS report. |
Avelumab | Fixed dosing:
Weight-based dosing:
| After analyzing all the information collected, the following avelumab dosage should be used (in all approved indications):
| Fixed dosing:
Weight-based dosing:
| Safety and efficacy outcomes: Consistent PK/PD modelling outcomes: Consistent | Safety and efficacy outcomes: Both reports found similar efficacy and immune-related safety between fixed-dose and weight-based avelumab PK/PD modelling outcomes: Both reports found broadly similar PK exposure between fixed-dose and weight-based avelumab, with modest weight-related variability. |
Cemiplimab | Fixed dosing:
Weight-based dosing:
| After analyzing all the information collected, the following cemiplimab dosage should be used (in all approved indications):
| Fixed dosing:
Weight-based dosing:
| Safety and efficacy outcomes: Consistent PK/PD modelling outcomes: Consistent | Safety and efficacy outcomes: Both reports found similar efficacy and immune-related safety between fixed-dose and weight-based cemiplimab. PK/PD modelling outcomes: Both reports consistently found comparable PK exposure between fixed-dose and weight-based cemiplimab. |
Dostarlimab | Fixed dosing:
Weight-based dosing:
| Not reported | Fixed dosing:
Weight-based dosing:
| Safety and efficacy outcomes: Consistent PK/PD modelling outcomes: Consistent | Safety and efficacy outcomes: Both reports found insufficient evidence to determine whether fixed- and weight-based dostarlimab differ in efficacy or safety. PK/PD modelling outcomes: Both reports found increased dostarlimab exposure with higher fixed-dose regimens. |
Durvalumab | Fixed dosing:
Weight-based dosing:
| After analyzing all the information collected, the following durvalumab dosages should be used (for all approved indications):
or
or
| Fixed dosing:
Weight-based dosing:
Weight-banded fixed dosing: Durvalumab (q.2.w.):
Durvalumab (q.4.w.):
| Safety and efficacy outcomes: Consistent PK/PD modelling outcomes: Consistent | Safety and efficacy outcomes: Both reports found insufficient comparative evidence for durvalumab, with no clear safety or efficacy advantage for either dosing strategy. PK/PD modelling outcomes: Both reports found broadly similar durvalumab PK exposure across dosing strategies, with no clear clinically important exposure differences. |
Ipilimumab | Not reported | Not reported | Weight-based dosing:
Weight-banded fixed dosing:
| Not applicable | Not applicable |
Nivolumab | Fixed dosing:
Weight-based dosing:
| After analyzing all the information collected, the following dosages should be used for nivolumab monotherapy (for all approved indications):
or
or
After analyzing all the information collected, the following dosages should be used for nivolumab in combination with ipilimumab:
| Fixed dosing:
Weight-based dosing:
| Safety and efficacy outcomes: Largely consistent PK/PD modelling outcomes: Somewhat consistent | Safety and efficacy outcomes: Both reports found broadly similar nivolumab safety and efficacy between fixed- and weight-based dosing, although the CDA-AMC review included more real-world and model-informed evidence, with some uncertain numerical differences, and in favour of the fixed-dose in a few nonrandomized studies. PK/PD modelling outcomes: The CDA-AMC report identified some studies suggesting modestly higher exposure with fixed dosing |
Pembrolizumab | Fixed dosing:
Weight-based dosing:
| After analyzing all the information collected, the following dosages should be used for pembrolizumab (in all approved indications):
or
| Fixed dosing:
Weight-banded fixed dosing:
or
Weight-based:
| Safety and efficacy outcomes: Consistent PK/PD modelling outcomes: Consistent | Safety and efficacy outcomes: Both reports found comparable efficacy and safety across dosing strategies, with no clear advantage for either approach. PK/PD modelling outcomes: Both reports found broadly comparable PK exposure across dosing strategies, with expected peak and trough and body weight-related variability. |
Tremelimumab | Not reported | Not reported | Fixed-dosing:
Weight-based dosing:
| Not applicable | Not applicable |
CDA-AMC = Canada’s Drug Agency; ICI = immune checkpoint inhibitor; INESSS = Institut national d’excellence en santé et en services sociaux; PK = pharmacokinetic; PK/PD = pharmacokinetics and pharmacodynamics; q.2.w. = every 2 weeks; q.3.w. = every 3 weeks; q.4.w. = every 4 weeks; q.6.w. = every 6 weeks; q.12.w. = every 12 weeks; vs. = versus.
Authors and Contributors
Authors
Shahab Sayfi contributed to conceptualization and methods; screening, data extraction, formal analysis, and critical appraisal; project administration and visualization; and drafting and revising the report.
Quenby Mahood designed and executed literature searches, drafted and edited the methods and results sections, and completed referencing.
Yonda Lai contributed to piloting, screening (title and abstract, and full-text), data extraction, and drafting and revising the report.
Jasmeen Dourka screened citations and grey literature at the title and abstract and full-text level; and reviewed and provided feedback on the draft report.
Rodrigue Ndabashinze contributed to the design of the systematic review and acquisition of data; performed study screening and selection, and data extraction from included studies; participated in analysis and interpretation of the study results and reviewed the draft report for important intellectual content, including the results, their interpretation, and the key messages and conclusions; and reviewed and approved the final version of the report.
Rebecca Raj contributed to the abstract and full-text article screening for eligible studies, and to the review and revision of the report.
Dipika Neupane contributed to the risk-of-bias assessment of included studies, and reviewed the draft and final report.
Kelvin Chan contributed to the design of the study, screening of citations, interpretation of results, and reviewing of the manuscript.
Andrea C. Tricco obtained funding, contributed to conceptualization and methods, interpreted results, and revised the report critically.
Contributors
Clinical Expert
This individual kindly provided comments on this report:
Scott Walker, MScPhm
Professor
Leslie Dan Faculty of Pharmacy, University of Toronto
Conflicts of Interest
Funding Declarations
Funding award declarations: Dr. Andrea Tricco holds a Tier 1 Canada Research Chair in Knowledge Synthesis for Knowledge Users and the Keenan Chair in Health Services Research Leadership. Dr. Rodrigue Ndabashinze was supported by the Irish Health Research Board and the HSC Public Health Agency (Grant number ESI-2021-001) in association with Evidence Synthesis Ireland/Cochrane Ireland.
No conflicts of interest were declared.
References
1.Brenner DR, Gillis J, Demers AA, et al. Projected estimates of cancer in Canada in 2024. CMAJ. 2024;196(18):E615-e623. PubMed
2.Cavalcanti IDL, Soares JCS. Advances in cancer treatment: from systemic chemotherapy to targeted therapy. Springer International Publishing; 2021: https://doi.org/10.1007/978-3-030-68334-4. Accessed 2026 Feb 20.
3.Shiravand Y, Khodadadi F, Kashani SMA, et al. Immune checkpoint inhibitors in cancer therapy. Curr Oncol. 2022;29(5):3044-3060. PubMed
4.Parvez A, Choudhary F, Mudgal P, et al. PD-1 and PD-L1: architects of immune symphony and immunotherapy breakthroughs in cancer treatment. Front Immunol. 2023;14:1296341. PubMed
5.Yin Q, Wu L, Han L, et al. Immune-related adverse events of immune checkpoint inhibitors: a review. Front Immunol. 2023;14:1167975. PubMed
6.Walker S, de Léséleuc L, Butcher R. Dosing and timing of immuno-oncology drugs (CADTH Technology Review: Optimal Use 360 Report) Ottawa: Canadian Agency for Drugs and Technology in Health; 2019: https://www.cda-amc.ca/sites/default/files/ou-tr/ho0008-dosing-timing-immuno-oncology-drugs.pdf. Accessed 2025 Jun 10.
7.Institut national d’excellence en santé et en services sociaux (INESSS). Update of the tool for choosing the dosage of monoclonal antibodies targeting PD-1 or PD-L1: supporting report developed by Catherine Awad and Geneviève Duplain Cyr. Québec City (QC): INESSS; 2023.
8.Page MJ, McKenzie JE, Bossuyt PM, et al. The PRISMA 2020 statement: an updated guideline for reporting systematic reviews. BMJ. 2021;372:n71. PubMed
9.Tricco A, Sayfi S, Mahood Q, Lai Y, Ndabashinze R. Comparative effectiveness and pharmacokinetics of weight-based vs. fixed-dose immuno-oncology therapy: a systematic review of anti-PD-1/PD-L1 monoclonal antibodies across approved and emerging indications. PROSPERO CRD420251071290. Centre for Reviews and Dissemination, University of York. 2026; https://www.crd.york.ac.uk/PROSPERO/view/CRD420251071290. Accessed 2026 Mar 18.
10.McGowan J, Sampson M, Salzwedel DM, Cogo E, Foerster V, Lefebvre C. PRESS Peer Review of Electronic Search Strategies: 2015 guideline statement. J Clin Epidemiol. 2016;75:40-46. PubMed
11.Grey Matters: a tool for searching health-related grey literature. Ottawa (ON): Canada's Drug Agency (CDA). 2025; https://greymatters.cda-amc.ca/.
12.Tricco A, Sayfi S, Conline M-C, Mahood Q, Rai Y, Ndabashinze R. Dosing of immune checkpoint inhibitors (Health Technology Review). 2026; https://www.cda-amc.ca/dosing-immune-checkpoint-inhibitors. Accessed 2026 Aug 05.
13.DistillerSR. Version 2.35. DistillerSR Inc. 2023; https://www.distillersr.com/. Accessed 2026 Feb 19.
14.Sterne JAC, Savovic J, Page MJ, et al. RoB 2: a revised tool for assessing risk of bias in randomised trials. BMJ. 2019;366:l4898. PubMed
15.Sterne JA, Hernan MA, Reeves BC, et al. ROBINS-I: a tool for assessing risk of bias in non-randomised studies of interventions. BMJ. 2016;355:i4919. PubMed
16.Shea BJ, Reeves BC, Wells G, et al. AMSTAR 2: a critical appraisal tool for systematic reviews that include randomised or non-randomised studies of healthcare interventions, or both. BMJ. 2017;358:j4008. PubMed
17.McGuinness L, Higgins JPT. Risk-of-Bias VISualization (robvis): an R package and Shiny web app for visualizing risk-of-bias assessments. Res Syn Meth. 2020:1-7. https://doi.org/10.1002/jrsm.1411. Accessed 2026 Feb 23.
18.Hoyek C, Zheng-Lin B, Bauernfeind JJ, et al. Overcoming financial and access barriers in global cancer care with low-dose immunotherapy: a systematic review. JCO Glob Oncol. 2025;11:e2400409. PubMed
19.Tan Z, Voller S, Sancho-Araiz A, Knibbe CAJ, Moes D. A systematic evaluation of the dosing regimens for approved targeted therapies and immune checkpoint inhibitors in metastatic renal cell carcinoma from a project optimus perspective. J Clin Pharmacol. 2025;02:02.
20.Mao YT, Wang Y, Chen XX, Liu CJ, Bao Q. Comparative severe dermatologic toxicities of immune checkpoint inhibitors in malignant melanoma: a systematic review and network meta-analysis. J Cosmet Dermatol. 2024;23(4):1165-1177. PubMed
21.Hong B, Zheng J, Chen R, et al. Pulmonary toxicity associated with immune checkpoint inhibitors-based therapy: current perspectives and future directions. Drug Saf. 2023;46(12):1313-1322. PubMed
22.Li Y, Liang X, Li H, Chen X. Comparative efficacy and safety of immune checkpoint inhibitors for unresectable advanced melanoma: a systematic review and network meta-analysis. Int Immunopharmacol. 2023;115:109657. PubMed
23.Wesevich A, Goldstein DA, Paydary K, Peer CJ, Figg WD, Ratain MJ. Interventional pharmacoeconomics for immune checkpoint inhibitors through alternative dosing strategies. Br J Cancer. 2023;129(9):1389-1396. PubMed
24.Jiang M, Hu Y, Lin G, Chen C. Dosing regimens of immune checkpoint inhibitors: attempts at lower dose, less frequency, shorter course. Front Oncol. 2022;12:906251. PubMed
25.Lee A, Duggan S, Deeks ED. Cemiplimab: a review in advanced cutaneous squamous cell carcinoma. Drugs. 2020;80(8):813-819. PubMed
26.Sehgal K, Costa DB, Rangachari D. Extended-interval dosing strategy of immune checkpoint inhibitors in lung cancer: will it outlast the COVID-19 pandemic? Front Oncol. 2020;10:1193. PubMed
27.World Bank Group. World Bank country and lending groups. 2026; https://datahelpdesk.worldbank.org/knowledgebase/articles/906519-world-bank-country-and-lending-groups. Accessed 2026 June 11.
28.Albiges L, Bourlon MT, Chacon M, et al. Subcutaneous versus intravenous nivolumab for renal cell carcinoma. Ann Oncol. 2025;36(1):99-107. PubMed
29.Herrera AF, Burton C, Radford J, et al. Avelumab in relapsed/refractory classical Hodgkin lymphoma: phase 1b results from the JAVELIN Hodgkins trial. Blood Adv. 2021;5(17):3387-3396. PubMed
30.Le Brun IC, Dalle S, Mortier L, et al. Methods of nivolumab administration in advanced melanoma: a comparison of patients' clinical outcomes treated with flat dose or weight-adjusted dose, a multicenter observational study. Cancer. 2025;131(1):e35679. PubMed
31.Horisaki K, Yoshikawa S, Omata W, Tsutsumida A, Kiyohara Y. The real-world efficacy and side effects of different nivolumab regimens in Japanese patients with advanced melanoma: a single-center retrospective study. Cancers (Basel). 2025;17(14):10. PubMed
32.Hughes BGM, Guminski A, Bowyer S, et al. A phase 2 open-label study of cemiplimab in patients with advanced cutaneous squamous cell carcinoma (EMPOWER-CSCC-1): final long-term analysis of groups 1, 2, and 3, and primary analysis of fixed-dose treatment group 6. J Am Acad Dermatol. 2025;92(1):68-77. PubMed
33.Smeenk MM, van der Noort V, Hendrikx JMA, Abedian Kalkhoran H, Smit EF, Theelen W. Pembrolizumab hybrid dosing is non-inferior to flat dosing in advanced non-small cell lung cancer: a real-world, retrospective bicenter cohort study. J Immunother Cancer. 2025;13(2):06.
34.Staender HF, Langan EA. Fixed-dose versus weight-adapted immune checkpoint inhibitor therapy in melanoma: a retrospective monocentric analysis of efficacy and immune-related adverse events. Cancers (Basel). 2025;17(7):28. PubMed
35.Chaitesipaseut L, Shah N, Truong TG, et al. Outcomes of weight-based vs. fixed dose of Pembrolizumab among patients with non-small cell lung cancer. J Oncol Pharm Pract. 2024;30(8):1352-1357. PubMed
36.Grit GF, van Geffen E, Malmberg R, et al. Real-world overall survival after alternative dosing for pembrolizumab in the treatment of non-small cell lung cancer: a nationwide retrospective cohort study with a non-inferiority primary objective. Lung Cancer. 2024;196:107950. PubMed
37.Leroy M, Desmedt E, Deramoudt L, et al. Retrospective comparison of a weight-based dose every 2 weeks with a fixed dose every month: a real-life analysis of nivolumab in the treatment of advanced melanoma. Melanoma Res. 2024;34(3):258-264. PubMed
38.Patel A, Hande V, Mr K, et al. Effectiveness of immune checkpoint inhibitors in various tumor types treated by low, per-weight, and conventional doses at a tertiary care center in Mumbai. JCO Glob Oncol. 2024;10:e2300312. PubMed
39.Rischin D, Hughes BGM, Basset-Seguin N, et al. High response rate with extended dosing of cemiplimab in advanced cutaneous squamous cell carcinoma. J Immunother Cancer. 2024;12(3):11. PubMed
40.Bérard G, Guevremont C, Marcotte N, Schroeder C, Bouchard N, Rajan R. Descriptive analysis of first-line non-small cell lung cancer treatment with pembrolizumab in tumors expressing PD-L1 >= 50% in patients treated in Quebec's university teaching hospitals (DALP-First Study). Curr Oncol. 2023;30(3):3251-3262. PubMed
41.Samlowski W, Robert NJ, Chen L, et al. Real-World nivolumab dosing patterns and safety outcomes in patients receiving adjuvant therapy for melanoma. Cancer Med. 2023;12(3):2378-2388. PubMed
42.Fujiwara Y, Takahashi Y, Okada M, et al. Phase I study of tremelimumab monotherapy or in combination with durvalumab in Japanese patients with advanced solid tumors or malignant mesothelioma. Oncologist. 2022;27(9):e703-e722. PubMed
43.Hijmering-Kappelle LBM, Hiltermann TJN, Bensch F. Safety and efficacy of extended interval dosing for immune checkpoint inhibitors in non-small cell lung cancer during the covid-19 pandemic. Clin Lung Cancer. 2022;23(2):143-150. PubMed
44.Iikura Y, Aoyama T, Hiraide M, et al. Safety evaluation of fixed-dose nivolumab in patients with gastric cancer. Health Sci Rep. 2022;5(4):e673. PubMed
45.Okada T, Fushimi C, Matsuki T, et al. Comparison of dosage of nivolumab in efficacy and safety for recurrent metastatic squamous cell carcinoma. Anticancer Res. 2022;42(3):1607-1613. PubMed
46.Patnaik A, Weiss GJ, Rasco DW, et al. Safety, antitumor activity, and pharmacokinetics of dostarlimab, an anti-PD-1, in patients with advanced solid tumors: a dose-escalation phase 1 trial. Cancer Chemother Pharmacol. 2022;89(1):93-103. PubMed
47.To SY, Kao LT, Shih JH, et al. Modified-dose pembrolizumab and prognostic outcomes among non-small cell lung cancer patients: A chart review study. Int J Environ Res Public Health. 2022;19(10):15. PubMed
48.Juergens RA, Hao D, Ellis PM, et al. A phase IB study of durvalumab with or without tremelimumab and platinum-doublet chemotherapy in advanced solid tumours: Canadian Cancer Trials Group Study IND226. Lung Cancer. 2020;143:1-11. PubMed
49.Kato R, Ikarashi D, Matsuura T, et al. Analyses of nivolumab exposure and clinical safety between 3-mg/kg dosing and 240-mg flat dosing in asian patients with advanced renal cell carcinoma in the real-world clinical setting. Transl Oncol. 2020;13(6):100771. PubMed
50.Rischin D, Migden MR, Lim AM, et al. Phase 2 study of cemiplimab in patients with metastatic cutaneous squamous cell carcinoma: primary analysis of fixed-dosing, long-term outcome of weight-based dosing. J Immunother Cancer. 2020;8(1):06.
51.Masters JC, Khandelwal A, di Pietro A, Dai H, Brar S. Model-informed drug development supporting the approval of the avelumab flat-dose regimen in patients with advanced renal cell carcinoma. CPT Pharmacometrics Syst Pharmacol. 2022;11(4):458-468. PubMed
52.Novakovic AM, Wilkins JJ, Dai H, et al. Changing body weight-based dosing to a flat dose for avelumab in metastatic merkel cell and advanced urothelial carcinoma. Clin Pharmacol Ther. 2020;107(3):588-596. PubMed
53.Gandhi KA, Shirsat A, Hj SK, et al. Pharmacokinetics and clinical outcomes of low-dose nivolumab relative to conventional dose in patients with advanced cancer. Cancer Chemother Pharmacol. 2024;94(5):659-668. PubMed
54.Sheng J, Zhang J, Baudelet C, Roy A. Clinical benefit-risk assessment of nivolumab 240 mg every 2 weeks in Chinese patients with advanced and metastatic solid tumors. J Clin Pharmacol. 2021;61(8):1045-1053. PubMed
55.Zhao X, Shen J, Ivaturi V, et al. Model-based evaluation of the efficacy and safety of nivolumab once every 4 weeks across multiple tumor types. Ann Oncol. 2020;31(2):302-309. PubMed
56.Sanghavi K, Vuppala P, Ivaturi V, Hamuro L, Roy A, Suryawanshi S. Nivolumab exposure-response analysis for adjuvant treatment of melanoma supporting a change in posology. CPT Pharmacometrics Syst Pharmacol. 2021;10(7):748-759. PubMed
57.Bei D, Osawa M, Uemura S, et al. Benefit-risk assessment of nivolumab 240 mg flat dose relative to 3 mg/kg Q2W regimen in Japanese patients with advanced cancers. Cancer Sci. 2020;111(2):528-535. PubMed
58.Lala M, Li TR, de Alwis DP, et al. A six-weekly dosing schedule for pembrolizumab in patients with cancer based on evaluation using modelling and simulation. Eur J Cancer. 2020;131:68-75. PubMed
59.Ter Heine R, van den Heuvel MM, Piet B, et al. A systematic evaluation of cost-saving dosing regimens for therapeutic antibodies and antibody-drug conjugates for the treatment of lung cancer. Target Oncol. 2023;18(3):441-450. PubMed
60.Yang F, Paccaly AJ, Rippley RK, Davis JD, DiCioccio AT. Population pharmacokinetic characteristics of cemiplimab in patients with advanced malignancies. J Pharmacokinet Pharmacodyn. 2021;48(4):479-494. PubMed
61.Paccaly AJ, Migden MR, Papadopoulos KP, et al. Fixed dose of cemiplimab in patients with advanced malignancies based on population pharmacokinetic analysis. Adv Ther. 2021;38(5):2365-2378. PubMed
62.Zhao Y, Sanghavi K, Roy A, et al. Model-based dose selection of subcutaneous nivolumab in patients with advanced solid tumors. Clin Pharmacol Ther. 2024;115(3):488-497. PubMed
63.Cohen G, Rapoport B, Chan SW, et al. Pembrolizumab 400 mg every 6 weeks as first-line therapy for advanced melanoma (KEYNOTE-555): results from cohort B of an open-label, phase 1 study. PLoS ONE. 2024;19(11):e0309778. PubMed
64.Lala M, Bardia A, Calles A, et al. Weight-based pembrolizumab dosing at 4 mg/kg every 6 weeks leads to exposures below approved doses with unestablished efficacy: a pharmacokinetic model-based simulation analysis. Target Oncol. 2025;20(6):955-965. PubMed
65.Hwang M, Chia YL, Zheng Y, et al. Population pharmacokinetic modelling of tremelimumab in patients with advanced solid tumours and the impact of disease status on time-varying clearance. Br J Clin Pharmacol. 2023;89(5):1601-1616. PubMed
66.Guyatt G, Agoritsas T, Brignardello-Petersen R, et al. Core GRADE 1: overview of the Core GRADE approach. BMJ. 2025;389:e081903. PubMed
67.Kung J, Chiappelli F, Cajulis OO, et al. From systematic reviews to clinical recommendations for evidence-based health care: Validation of Revised Assessment of Multiple Systematic Reviews (R-AMSTAR) for grading of clinical relevance. Open Dent J. 2010;4:84-91. PubMed
68.Critical Appraisal Skills Programme: CASP checklists. 2026; https://casp-uk.net/casp-tools-checklists/. Accessed 2026 Mar 26.
69.Alonso-Coello P, Schunemann HJ, Moberg J, et al. GRADE Evidence to Decision (EtD) frameworks: a systematic and transparent approach to making well informed healthcare choices. 1: Introduction. BMJ. 2016;353:i2016. PubMed
70.Public Health Agency of Canada. Infection prevention and control guidelines: critical appraisal tool kit. Ottawa (ON): PHAC; 2014: https://publications.gc.ca/collections/collection_2014/aspc-phac/HP40-119-2014-eng.pdf. Accessed 2026 Mar 26.
Appendix 1: Literature Search Methods
Please note that this appendix has not been copy-edited.
Table 6: Search Strategy Yield Summary
Database(s) searched | Date of search | Number of results |
|---|---|---|
Ovid MEDLINE(R) ALL 1946 to July 29, 2025 (OVID) | July 30, 2025 | 2,911 |
Embase Classic+Embase 1947 to 2025 July 25 (OVID) | July 30, 2025 | 4,929 |
Cochrane Database of Systematic Reviews 2005 to July 23, 2025 (OVID) | July 30, 2025 | 0 |
Cochrane Central Register of Controlled Trials June 2025 (OVID) | July 30, 2025 | 616 |
Note: The total of the database search results was 8,456 references. A total of 1,992 references were identified as duplicates and removed, leaving 6,464 references. A total of 1,558 references were removed because they had publication dates before 2020. These were retrieved because the field codes used for date limits in MEDLINE and Embase were broader than publication date and included the date the records were added to the database. This is a common practice when updating literature searches in these databases. The final number of references from the database searches was 4,906. Grey literature searches identified 517 references.
Table 7: Search Strategy — Ovid MEDLINE(R) ALL — 1946 to July 29, 2025
# | Searches | Results |
|---|---|---|
1 | Nivolumab/ | 6,410 |
2 | Pembrolizumab.nm. | 5,079 |
3 | (BMS936558 or BMS-936558 or CMAB819 or CMAB-819 or keytruda* or lambrolizumab* or MDX1106 or MDX-1106 or MK3475 or MK-3475 or nivolumab* or ONO4538 or ONO-4538 or opdivo* or pembrolizumab* or SCH900475 or SCH-900475).ti,ab,kf,ot. | 19,552 |
4 | Durvalumab.nm. | 923 |
5 | (durvalumab* or imfinzi* or medi4736 or medi-4736).ti,ab,kf,ot. | 2,342 |
6 | Avelumab.nm. | 494 |
7 | (avelumab* or bavencio* or “msb 0010682” or msb 0010718c or msb 10682 or msb 10718c or msb0010682 or msb0010718c or msb10682 or msb10718c or “pf 06834635” or pf 6834635 or pf06834635 or pf6834635).ti,ab,kf,ot. | 1,237 |
8 | Atezolizumab.nm. | 1,725 |
9 | (anti-PDL1 or atezolizumab* or mpdl 3280a or mpdl3280a or rg 7446 or rg7446 or tecentriq* or tecntriq*).ti,ab,kf,ot. | 4,544 |
10 | Cemiplimab.nm. | 191 |
11 | (cemiplimab* or libtayo* or regn 2810 or regn2810 or sar 439684 or sar439684).ti,ab,kf,ot. | 604 |
12 | dostarlimab.nm. | 79 |
13 | (“anb 011” or anb011 or dostarlimab* or gsk 4057190 or gsk4057190 or jemperli* or “tsr 042” or tsr042 or wbp 285 or wbp285).ti,ab,kf,ot. | 210 |
14 | Ipilimumab/ | 3,415 |
15 | (ipilimumab* or strentarga* or yervoy* or bms 734016 or bms734016 or cs 1002 or cs1002 or eb 1003 or eb1003 or hlx 13 or hlx13 or ibi 310 or ibi310 or “mdx 010” or mdx 101 or mdx010 or mdx101 or pbp 1701 or pbp1701).ti,ab,kf,ot. | 6,006 |
16 | tremelimumab.nm. | 308 |
17 | (tremelimumab* or Imjudo* or ticilimumab* or cp 675 206 or cp 675,206 or cp 675206 or cp675 206 or cp675,206 or cp675206 or medi 1123 or medi1123).ti,ab,kf,ot. | 686 |
18 | or/1-17 | 28,833 |
19 | Dose-Response Relationship, Drug/ | 429,022 |
20 | Drug Administration Schedule/ | 104,132 |
21 | Drug Dosage Calculations/ | 2,820 |
22 | (dosing* or dose* or dosage*).ti. | 251,776 |
23 | (fixed dosage* or fixed dose* or fixed dosing* or flat dosage* or flat dose* or flat dosing* or Q2W or Q3W or Q4W or Q6W or posolog* or administration schedule*).ti,ab,kf. | 17,674 |
24 | ((dose* or dosage* or dosing*) adj3 (model* or weight* or weight-based* or schedule* or regimen* or frequenc* or amount* or duration* or response* or calculation*)).ti,ab,kf. | 206,026 |
25 | (administration strategies or administration strategy or administration time* or daily dosage* or daily dose* or daily dosing* or different dosage* or different dose* or different dosing* or dosage* response relationship* or dose* response relationship* or dosing* response relationship* or dosage* design* or dose* design* or dosing* design* or dosage* interval* or dose* interval* or dosing* interval* or high* dosage* or high* dose* or high* dosing* or low* dosage* or low* dose* or low* dosing* or small* dosage*or small* dose* or small* dosing* or various dosage* or various dose* or various dosing* or recommended dose* or recommended dosing* or recommended dosage* or optimal dose* or optimal dosage* or optimal dosing* or dose* strategies or dose* strategy or dosage* strategies or dosage* strategy or dosing* strategies or dosing strategy).ti,ab,kf. | 497,574 |
26 | (Exposure adj4 response).ti,ab,kf. | 22,984 |
27 | exp Pharmacokinetics/ | 348,970 |
28 | (pharmacokinetic* or pharmaco-kinetic* or kinetic* or elimination half-life or washout or wash-out).ti,ab,kf. | 716,681 |
29 | (time adj3 “peak concentration*”).ti,ab,kf. | 1,132 |
30 | Area Under Curve/ | 47523 |
31 | (“area* under the curve*” or “area* under curve*”).ti,ab,kf. | 120,457 |
32 | Nivolumab/ad, pk [Administration & Dosage, Pharmacokinetics] | 1,045 |
33 | Ipilimumab/ad, pk [Administration & Dosage, Pharmacokinetics] | 560 |
34 | (pharmacodynamic* or pharmaco-dynamic*).ti,ab,kf. | 58,769 |
35 | Immune Checkpoint Inhibitors/ad, pk [Administration & Dosage, Pharmacokinetics] | 1,110 |
36 | or/19-35 | 2,155,287 |
37 | 18 and 36 | 3,906 |
38 | (2020* or 2021* or 2022* or 2023* or 2024* or 2025*).dt,ez,da. | 9,444,130 |
39 | 37 and 38 | 2,948 |
40 | limit 39 to (english or french) | 2,911 |
Table 8: Search Strategy — Embase Classic+Embase — 1947 to July 25, 2025
# | Searches | Results |
|---|---|---|
1 | *Nivolumab/ or *Pembrolizumab/ | 28,462 |
2 | (BMS936558 or BMS-936558 or CMAB819 or CMAB-819 or keytruda* or lambrolizumab* or MDX1106 or MDX-1106 or MK3475 or MK-3475 or nivolumab* or ONO4538 or ONO-4538 or opdivo* or pembrolizumab* or SCH900475 or SCH-900475).ti,ab,kf. | 47,602 |
3 | *Durvalumab/ | 4,037 |
4 | (durvalumab* or imfinzi* or medi4736 or medi-4736 or L01XC28).ti,ab,kf. | 6,680 |
5 | *Avelumab/ | 1,719 |
6 | (avelumab* or bavencio* or “msb 0010682” or msb 0010718c or msb 10,682 or msb 10718c or msb0010682 or msb0010718c or msb10682 or msb10718c or “pf 06834635” or pf 6834635 or pf06834635 or pf6834635).ti,ab,kf. | 3,032 |
7 | *Atezolizumab/ | 5,662 |
8 | (anti-PDL1 or atezolizumab* or mpdl 3280a or mpdl3280a or rg 7446 or rg7446 or tecentriq* or tecntriq*).ti,ab,kf. | 11,246 |
9 | *Cemiplimab/ | 885 |
10 | (cemiplimab* or libtayo* or regn 2810 or regn2810 or sar 439684 or sar439684).ti,ab,kf. | 1,426 |
11 | *dostarlimab/ | 397 |
12 | (“anb 011” or anb011 or dostarlimab* or gsk 4057190 or gsk4057190 or jemperli* or “tsr 042” or tsr042 or wbp 285 or wbp285).ti,ab,kf. | 569 |
13 | *ipilimumab/ | 7,166 |
14 | (ipilimumab* or strentarga* or yervoy* or bms 734016 or bms734016 or cs 1002 or cs1002 or eb 1003 or eb1003 or hlx 13 or hlx13 or ibi 310 or ibi310 or “mdx 010” or mdx 101 or mdx010 or mdx101 or pbp 1701 or pbp1701).ti,ab,kf. | 14,373 |
15 | *ticilimumab/ | 1,140 |
16 | (tremelimumab* or Imjudo* or ticilimumab* or cp 675 206 or cp 675,206 or cp 675206 or cp675 206 or cp675,206 or cp675206 or medi 1123 or medi1123).ti,ab,kf. | 1,818 |
17 | or/1-16 [ICI Drug Terms] | 70,296 |
18 | dose response/ | 413,851 |
19 | drug administration/ | 96,150 |
20 | dose calculation/ | 26,172 |
21 | (dosing* or dose* or dosage*).ti. | 408,354 |
22 | (fixed dosage* or fixed dose* or fixed dosing* or flat dosage* or flat dose* or flat dosing* or Q2W or Q3W or Q4W or Q6W or posolog* or administration schedule*).ti,ab,kf. | 47,348 |
23 | ((dose* or dosage* or dosing*) adj3 (model* or weight* or weight-based* or schedule* or regimen* or frequenc* or amount* or duration* or response* or calculation*)).ti,ab,kf. | 318,452 |
24 | (Exposure adj4 response).ti,ab,kf. | 30,791 |
25 | (administration strategies or administration strategy or administration time* or daily dosage* or daily dose* or daily dosing* or different dosage* or different dose* or different dosing* or dosage* response relationship* or dose* response relationship* or dosing* response relationship* or dosage* design* or dose* design* or dosing* design* or dosage* interval* or dose* interval* or dosing* interval* or high* dosage* or high* dose* or high* dosing* or low* dosage* or low* dose* or low* dosing* or small* dosage*or small* dose* or small* dosing* or various dosage* or various dose* or various dosing* or recommended dose* or recommended dosing* or recommended dosage* or optimal dose* or optimal dosage* or optimal dosing* or dose* strategies or dose* strategy or dosage* strategies or dosage* strategy or dosing* strategies or dosing strategy).ti,ab,kf. | 787,724 |
26 | exp pharmacokinetics/ | 968,297 |
27 | (pharmacokinetic* or pharmaco-kinetic* or kinetic* or elimination half-life or washout or wash-out).ti,ab,kf. | 940,002 |
28 | (time adj3 “peak concentration*”).ti,ab,kf. | 1,448 |
29 | exp area under the curve/ | 243,503 |
30 | (“area* under the curve*” or “area* under curve*”).ti,ab,kf. | 166,736 |
31 | nivolumab/do, pk [Drug Dose, Pharmacokinetics] | 441 |
32 | pembrolizumab/do, pk [Drug Dose, Pharmacokinetics] | 421 |
33 | durvalumab/do, pk [Drug Dose, Pharmacokinetics] | 116 |
34 | avelumab/do, pk [Drug Dose, Pharmacokinetics] | 81 |
35 | atezolizumab/do, pk [Drug Dose, Pharmacokinetics] | 166 |
36 | cemiplimab/do, pk [Drug Dose, Pharmacokinetics] | 40 |
37 | dostarlimab/do, pk [Drug Dose, Pharmacokinetics] | 12 |
38 | ipilimumab/do, pk [Drug Dose, Pharmacokinetics] | 386 |
39 | ticilimumab/do, pk [Drug Dose, Pharmacokinetics] | 100 |
40 | (pharmacodynamic* or pharmaco-dynamic*).ti,ab,kf. | 101,002 |
41 | immune checkpoint inhibitor/do, pk [Drug Dose, Pharmacokinetics] | 132 |
42 | or/18-41 [Dosage or Pharmacokinetic Terms] | 3,243,250 |
43 | 17 and 42 [Combining ICI Drugs + Dosage or Pharmacokinetic Terms] | 16,858 |
44 | limit 43 to dc = 20200101-20251231 | 11,520 |
45 | limit 44 to (english or french) | 11,451 |
46 | (conference review or conference abstract).pt. | 5,566,774 |
47 | 45 not 46 | 4,929 |
Table 9: Search Strategy — Cochrane Database of Systematic Reviews — 2005 to July 23, 2025
# | Searches | Results |
|---|---|---|
1 | (BMS936558 or BMS-936558 or CMAB819 or CMAB-819 or keytruda* or lambrolizumab* or MDX1106 or MDX-1106 or MK3475 or MK-3475 or nivolumab* or ONO4538 or ONO-4538 or opdivo* or pembrolizumab* or SCH900475 or SCH-900475).ti,ab,kw. | 8 |
2 | (durvalumab* or imfinzi* or medi4736 or medi-4736).ti,ab,kw. | 0 |
3 | (avelumab* or bavencio* or “msb 0010682” or msb 0010718c or msb 10682 or msb 10718c or msb0010682 or msb0010718c or msb10682 or msb10718c or “pf 06834635” or pf 6834635 or pf06834635 or pf6834635).ti,ab,kw. | 2 |
4 | (anti-PDL1 or atezolizumab* or mpdl 3280a or mpdl3280a or rg 7446 or rg7446 or tecentriq* or tecntriq*).ti,ab,kw. | 1 |
5 | (cemiplimab* or libtayo* or regn 2810 or regn2810 or sar 439684 or sar439684).ti,ab,kw. | 0 |
6 | (“anb 011” or anb011 or dostarlimab* or gsk 4057190 or gsk4057190 or jemperli or “tsr 042” or tsr042 or wbp 285 or wbp285).ti,ab,kw. | 0 |
7 | (ipilimumab* or strentarga* or yervoy* or bms 734016 or bms734016 or cs 1002 or cs1002 or eb 1003 or eb1003 or hlx 13 or hlx13 or ibi 310 or ibi310 or “mdx 010” or mdx 101 or mdx010 or mdx101 or pbp 1701 or pbp1701).ti,ab,kw. | 4 |
8 | (tremelimumab* or Imjudo* or ticilimumab ticarcillin* or cp 675 206 or cp 675,206 or cp 675206 or cp675 206 or cp675,206 or cp675206 or medi 1123 or medi1123).ti,ab,kw. | 0 |
9 | (immune checkpoint* blockade* or immune* checkpoint blocker* or immune checkpoint* inhibition* or immune checkpoint* inhibitor* or PD-1 inhibitor* or PD-1-PD-L1 blockade* or PD-L1 inhibitor* or PD-L1 blockade* or programmed cell death protein 1 inhibitor* or programmed death-ligand 1 inhibitor*).ti,ab,kw. | 22 |
10 | or/1-9 | 26 |
11 | (dosing* or dose* or dosage*).ti. | 173 |
12 | (fixed dosage* or fixed dose* or fixed dosing* or flat dosage* or flat dose* or flat dosing* or Q2W or Q3W or Q4W or Q6W or posolog* or administration schedule*).ti,ab,kw. | 172 |
13 | ((dose* or dosage* or dosing*) adj3 (model* or weight* or weight-based* or schedule* or regimen* or frequenc* or amount* or duration* or response* or calculation*)).ti,ab,kw. | 505 |
14 | (Exposure adj4 response).ti,ab,kw. | 2 |
15 | (administration strategies or administration strategy or administration time* or daily dosage* or daily dose* or daily dosing* or different dosage* or different dose* or different dosing* or dosage* response relationship* or dose* response relationship* or dosing* response relationship* or dosage* design* or dose* design* or dosing* design* or dosage* interval* or dose* interval* or dosing* interval* or high* dosage* or high* dose* or high* dosing* or low* dosage* or low* dose* or low* dosing* or small* dosage*or small* dose* or small* dosing* or various dosage* or various dose* or various dosing* or recommended dose* or recommended dosing* or recommended dosage* or optimal dose* or optimal dosage* or optimal dosing* or dose* strategies or dose* strategy or dosage* strategies or dosage* strategy or dosing* strategies or dosing strategy).ti,ab,kw. | 841 |
16 | (pharmacokinetic* or pharmaco-kinetic* or kinetic* or elimination half-life or washout or wash-out).ti,ab,kw. | 66 |
17 | (time adj3 “peak concentration*”).ti,ab,kw. | 0 |
18 | (“area* under the curve*” or “area* under curve*”).ti,ab,kw. | 6 |
19 | (pharmacodynamic* or pharmaco-dynamic*).ti,ab,kw. | 5 |
20 | or/11-19 | 1,338 |
21 | 10 and 20 | 1 |
22 | limit 21 to yr = ”2020-current” | 0 |
Table 10: Search Strategy — Cochrane Central Register of Controlled Trials — June 2025
# | Searches | Results |
|---|---|---|
1 | Nivolumab/ | 1,050 |
2 | Pembrolizumab.sh. | 349 |
3 | (BMS936558 or BMS-936558 or CMAB819 or CMAB-819 or keytruda* or lambrolizumab* or MDX1106 or MDX-1106 or MK3475 or MK-3475 or nivolumab* or ONO4538 or ONO-4538 or opdivo* or pembrolizumab* or SCH900475 or SCH-900475).ti,ab,kf,ot. | 7,014 |
4 | Durvalumab.sh. | 141 |
5 | (durvalumab* or imfinzi* or medi4736 or medi-4736).ti,ab,kf,ot. | 1,512 |
6 | Avelumab.sh. | 22 |
7 | (avelumab* or bavencio* or “msb 0010682” or msb 0010718c or msb 10682 or msb 10718c or msb0010682 or msb0010718c or msb10682 or msb10718c or “pf 06834635” or pf 6834635 or pf06834635 or pf6834635).ti,ab,kf,ot. | 475 |
8 | Atezolizumab.sh. | 144 |
9 | (anti-PDL1 or atezolizumab* or mpdl 3280a or mpdl3280a or rg 7446 or rg7446 or tecentriq* or tecntriq*).ti,ab,kf,ot. | 1,758 |
10 | Cemiplimab.sh. | 28 |
11 | (cemiplimab* or libtayo* or regn 2810 or regn2810 or sar 439684 or sar439684).ti,ab,kf,ot. | 219 |
12 | dostarlimab.sh. | 18 |
13 | (“anb 011” or anb011 or dostarlimab* or gsk 4057190 or gsk4057190 or jemperli* or “tsr 042” or tsr042 or wbp 285 or wbp285).ti,ab,kf,ot. | 168 |
14 | Ipilimumab/ | 615 |
15 | (ipilimumab* or strentarga* or yervoy* or bms 734016 or bms734016 or cs 1002 or cs1002 or eb 1003 or eb1003 or hlx 13 or hlx13 or ibi 310 or ibi310 or “mdx 010” or mdx 101 or mdx010 or mdx101 or pbp 1701 or pbp1701).ti,ab,kf,ot. | 2,054 |
16 | tremelimumab.sh. | 38 |
17 | (tremelimumab* or Imjudo* or ticilimumab* or cp 675 206 or cp 675,206 or cp 675206 or cp675 206 or cp675,206 or cp675206 or medi 1123 or medi1123).ti,ab,kf,ot. | 524 |
18 | or/1-17 | 11,099 |
19 | dose-response relationship, drug/ | 36,470 |
20 | Drug Administration Schedule/ | 27,469 |
21 | Drug Dosage Calculations/ | 317 |
22 | (dosing* or dose* or dosage*).ti. | 92,078 |
23 | (fixed dosage* or fixed dose* or fixed dosing* or flat dosage* or flat dose* or flat dosing* or Q2W or Q3W or Q4W or Q6W or posolog* or administration schedule*).ti,ab,kf. | 17,459 |
24 | ((dose* or dosage* or dosing*) adj3 (model* or weight* or weight-based* or schedule* or regimen* or frequenc* or amount* or duration* or response* or calculation*)).ti,ab,kf. | 44,058 |
25 | (administration strategies or administration strategy or administration time* or daily dosage* or daily dose* or daily dosing* or different dosage* or different dose* or different dosing* or dosage* response relationship* or dose* response relationship* or dosing* response relationship* or dosage* design* or dose* design* or dosing* design* or dosage* interval* or dose* interval* or dosing* interval* or high* dosage* or high* dose* or high* dosing* or low* dosage* or low* dose* or low* dosing* or small* dosage*or small* dose* or small* dosing* or various dosage* or various dose* or various dosing* or recommended dose* or recommended dosing* or recommended dosage* or optimal dose* or optimal dosage* or optimal dosing* or dose* strategies or dose* strategy or dosage* strategies or dosage* strategy or dosing* strategies or dosing strategy).ti,ab,kf. | 112,214 |
26 | (Exposure adj4 response).ti,ab,kf. | 2,365 |
27 | exp Pharmacokinetics/ | 20,456 |
28 | (pharmacokinetic* or pharmaco-kinetic* or kinetic* or elimination half-life or washout or wash-out).ti,ab,kf. | 94,909 |
29 | (time adj3 “peak concentration*”).ti,ab,kf. | 654 |
30 | Area Under Curve/ | 8,948 |
31 | (“area* under the curve*” or “area* under curve*”).ti,ab,kf. | 15,775 |
32 | (pharmacodynamic* or pharmaco-dynamic*).ti,ab,kf. | 20,149 |
33 | or/19-32 | 309,582 |
34 | 18 and 33 | 3,549 |
35 | limit 34 to yr = ”2020 -Current” | 2,055 |
36 | limit 35 to (english or french) | 2,047 |
37 | limit 36 to conference proceeding | 1,431 |
38 | 36 not 37 | 616 |
Table 11: Legends Within the Search Strategies Across the Databases
Syntax | Description |
|---|---|
/ | Subject Heading (MeSH or EmTree) |
exp | means that the narrower MeSH or EmTree headings underneath are included |
* | truncation (e.g., child* finds child or children or childhood etc.) |
.tw. | textword (word/phrase appears in title or abstract) |
.ti. | textword (word/phrase appears in the title field) |
.ab. | textword (word/phrase appears in the abstract field) |
.kf. | keyword field (author assigned keywords) |
.ot. | original title (word/phrase appears in the original title, which includes any non-English title in the original language) |
.sh. | subject heading (work/phrase appears in the subject heading field) |
adj# | adjacency operator (words are # adjacent to each other, in both directions) |
Appendix 2: Study Characteristics
Please note that this appendix has not been copy-edited.
Table 12: Study Characteristics
Author and Publication Year | Country | Study Design | Intervention and Comparator(s) | Sample Size | Cancer Type |
|---|---|---|---|---|---|
RCTs (n = 2) | |||||
Albiges, 202528 | Multinational (17 countries; enrolled across 73 sites) | Phase III, open-label, randomized, noninferiority trial |
| 495 | Advanced (not amenable to curative surgery or radiation therapy) or metastatic, histologically confirmed ccRCC with or without sarcomatoid features |
Herrera, 202129 | US and western Europe | Phase Ib randomized, open-label, parallel-arm pharmacokinetic/pharmacodynamic clinical trial |
| 31 | Classical Hodgkin lymphoma (cHL) |
Nonrandomized studies (n = 22) | |||||
Campo Le Brun, 202530 | France | Prospective cohort |
| 348 | Advanced melanoma (unresectable stage III to IV) |
Horisaki, 202531 | Japan | Retrospective cohort |
| 153 | Advanced melanoma (Stage IV) |
Hughes, 202532 | Australia, Germany, US (groups 1 to 3); Australia, Brazil, France, Germany, Greece, Italy, Spain (group 6) | Phase II, open-label, nonrandomized, multicohort study |
|
| Advanced CSCC, metastasic cutaneous squamous cell cancer (mCSCC), and Locally Advanced (laCSCC) |
Smeenk, 202533 | The Netherlands | Real-world, retrospective bicentre cohort study |
| 766 | Advanced NSCLC |
Staender, 202534 | Germany | Retrospective cohort study | Nivolumab and Pembrolizumab
| 47 | Melanoma |
Chaitesipaseut, 202435 | US | Retrospective cohort study |
| 1,413 | NSCLC |
Cohen, 202463 | South Africa, Australia, Sweden, and Spain | Open-label, phase I, single-arm multicohort clinical trial (cohort B) |
| 101 | Advanced melanoma |
Grit, 202436 | Netherlands | Retrospective cohort | Pembrolizumab
| 1,966 | NSCLC (Stage IIIB/IV) |
Leroy, 202437 | France | Retrospective cohort |
| 337 | Advanced melanoma |
Patel, 202438 | India | Retrospective study (cohort) | Pembrolizumab, nivolumab, atezolizimab, Durvalumab
| 100 | mNSCLC, extensive-stage small cell lung cancer, and biliary tract cancer |
Rischin, 202439 | International multicenter study | Open-label, nonrandomized phase II cohort comparison using sequential study groups |
|
| CSCC |
Berard, 202340 | Canada | Retrospective cohort |
| 279 | NSCLC |
Samlowski, 202341 | US | Retrospective study (cohort) |
| 191 | Melanoma |
Fujiwara, 202242 | Japan | Phase I, open-label trial (cohort) |
| 65 | Advanced solid tumours (part 2); study overall also includes malignant mesothelioma (part 1 expansion) |
Hijmering-Kappelle et al., 202243 | The Netherlands | Retrospective single-centre cohort study |
| 66 | NSCLC |
Iikura, 202244 | Japan | Retrospective cohort |
| 113 | Advanced gastric cancer |
Okada, 202245 | Japan | Retrospective cohort |
| 199 | Recurrent/metastatic squamous cell carcinoma of the head and neck (R/M SCCHN) |
Patnaik, 202246 | US | Open-label, first-in human, phase I study (cohort) |
| 34 | Advanced (unresectable) or metastatic solid tumours with disease progression after treatment with available standard-of-care treatments or treatment intolerance |
To, 202247 | Taiwan | Retrospective chart review study (cohort) |
| 64 | Advanced NSCLC |
Juergens, 202048 | Canada | Phase Ib, multicenter, multicohort dose-escalation trial (Rolling Six design) |
(Arm 1: Durvalumab + chemotherapy (DL0; no tremelimumab); arm 2: Durvalumab + Tremelimumab + chemotherapy (DL1; WBD, lower tremelimumab dose); arm 3: Durvalumab + Tremelimumab + chemotherapy (DL2a/2b; WBD, higher tremelimumab exposure); arm 4: Durvalumab + Tremelimumab + chemotherapy (DL3; fixed-ratio dosing); arm 5: Durvalumab + Tremelimumab + chemotherapy (DL4; fixed-ratio dosing, highest tested cohort / RP2D)) | 136 | Advanced/metastatic solid tumours (majority lung cancer; NSCLC subgroup reported) |
Kato, 202049 | Japan | Retrospective cohort study |
| 19 | RCC |
Rischin, 202050 | International, multicenter | Phase II, open-label, nonrandomized, multicenter, international study |
| 115 | mCSCC |
PK/PD modelling or simulation studies (n = 14) | |||||
Lala, 202564 | NA (modelling and Simulation) | PK modelling (population model-based simulation) |
| Dataset of 3,607 patients | PK model was based on patient data from studies that examined melanoma, (NSCLC) and RCC patients |
Gandhi, 202453 | India | Prospective PK study |
| 25 | Advanced solid tumours |
Zhao, 202462 | NA | Model-based PopPK analysis |
| 3,540 total in PopPK dataset | Advanced solid tumours; SC cohort included metastatic melanoma, RCC, NSCL, hepatocellular carcinoma, colorectal cancer, and urothelial carcinoma; pooled historical IV dataset also included multiple other tumour types |
Ter Heine, 202359 | NA | PK modelling and simulation (population PK; Monte Carlo; NONMEM) | Atezolizumab, durvalumab, ipilimumab, nivolumab, pembrolizumab
| 500 virtual patients | Lung cancer |
Hwang, 202365 | Multinational (US, Canada, Europe, Asia) | PopPK modelling; pooled-analysis model using NONMEM; external validation using additional pooled studies | Tremelimumab; Durvalumab
| Model development: 956 patients (pooled from 5 studies). External validation: 554 patients (pooled from 4 studies). | Advanced solid tumours (NSCLC, mesothelioma, SCCHN, urothelial, and so forth) |
Masters, 202251 | NA | Model-informed drug development: PopPK modelling + modelling/simulation; ER (logistic regression) analyses using trial datasets |
| aRCC combination-treatment analysis population: 488 patients (from 2 trials). Pooled PopPK dataset: 2,315 total (488 aRCC combo + 1,827 monotherapy) | aRCC in the combination dataset; reference monotherapy populations include solid tumours/UC/MCC (used for comparative exposure context) |
Paccaly, 202161 | NA | PopPK modelling and simulation analysis |
| 505 total patients pooled | Advanced malignancies overall; includes advanced CSCC |
Sanghavi, 202156 | NA | Model-based ER/benefit-risk analysis |
| 448 patients for adjuvant melanoma efficacy analysis; 3,008 patients for pooled safety analysis. | Melanoma in the adjuvant setting for efficacy; pooled safety dataset also included advanced solid tumours. |
Sheng, 202154 | China + global pooled populations | Model-informed benefit-risk assessment using popPK modelling + comparative safety/efficacy analyses across trial datasets |
| Exposure simulations: Chinese 240 mg q.2.w. n = 314; Chinese 3 mg/kg q.2.w. n = 294. Observed Chinese safety: CheckMate 077 (240 mg n = 20, 3 mg/kg n = 15) and CheckMate 078 (3 mg/kg n = 241). Global pooled safety: 3 mg/kg n = 1375, 10 mg/kg n = 131. | Advanced and metastatic solid tumours, including melanoma, and squamous and nonsquamous cell NSCLC |
Yang, 202,160 | NA | PopPK modelling + simulations using pooled clinical trial PK data |
| 548 patients pooled (11,178 PK observations); CSCC subset 178 patients (2,266 PK observations) | Advanced malignancies (including advanced CSCC) |
Lala, 202058 | NA | PK modelling and simulation (population PK + simulations) |
| 2,799 | Advanced melanoma and NSCLC |
Novakovic, 202052 | Mixed | Pharmacometrics / PopPK modelling + simulation using data from 3 clinical trials |
| The population PK model is developed from data in 1,827 patients enrolled across 3 clinical trials | mMCC; advanced/metastatic UC (plus “various advanced/metastatic solid tumors” in the pooled PK dataset) |
Zhao, 202055 | NA | Model-informed drug development: PopPK simulations + ER (safety and efficacy) + intratumoral receptor occupancy modelling |
| PK simulation dataset: 3,203; Safety E–R dataset: 2,560; Efficacy E–R datasets: OS 1,615 and ORR 1,579 | Multiple tumour types (melanoma; NSCLC; RCC; SCCHN; UC; classical Hodgkin lymphoma; plus other tumours in pooled safety) |
Bei, 202057 | Japan | Model-based quantitative clinical pharmacology (PopPK + ER safety/efficacy; benefit-risk assessment) |
| Safety E-R dataset: 273 patients living in Japan Efficacy E-R dataset: 134 patients living in Japan PopPK modelling/simulations: 3,939 total (420 living in Japan) | Multiple advanced cancers/tumour types (e.g., melanoma, NSCLC, RCC, colorectal cancer, cHL, UC, SCCHN) |
aRCC = advanced renal cell carcinoma; ccRCC = clear cell renal cell carcinoma; cHL = classical Hodgkin lymphoma; CL = clearance; CRC = colorectal cancer; CSCC = cutaneous squamous cell cancer; dMMR = deficient mismatch repair; ER = exposure-response; FDT = fixed-dose therapy; FD = fixed dose; HCC = hepatocellular carcinoma; ICI = immune checkpoint inhibitor; laCSCC = locally advanced cutaneous squamous cell cancer; mCRC = metastatic colorectal cancer; mCSCC = metastatic cutaneous squamous cell cancer; mMCC = metastatic Merkel cell carcinoma; mNSCLC = metastatic non–small cell lung cancer; mRCC = metastatic renal cell carcinoma; MGMT = O6-methylguanine-DNA methyltransferase; MSI-H = microsatellite instability–high; MSS = microsatellite stable; NCT = National Clinical Trial (ClinicalTrials.gov identifier); NMA = network meta-analysis; NR = not reported; NSCLC = non–small cell lung cancer; PD = progressive disease; PD-1 = programmed cell death protein 1; PK = pharmacokinetics; PopPK = population pharmacokinetic; q.12.w. = every 12 weeks; q.2.w. = every 2 weeks; q.3.w. = every 3 weeks; q.4.w. = every 4 weeks; q.6.w. = every 6 weeks; rHuPH20 = recombinant human hyaluronidase PH20; RCT = randomized controlled trial; RCC = renal cell carcinoma; RP2D = recommended phase 2 dose; SC = subcutaneous; SCCHN = squamous cell carcinoma of the head and neck; SCLC = small cell lung cancer; uHCC = unresectable hepatocellular carcinoma; UC = urothelial carcinoma; vs. = versus; WAT = weight-adapted therapy; WBD = weight-based dosing.
Appendix 3: Summary of Efficacy, Effectiveness, and Safety Outcomes
Please note that this appendix has not been copy-edited.
Table 13: Summary of Efficacy, Effectiveness, and Safety Outcomes
Author and publication year | Intervention characteristics | Results parameters (measurement time) | Results per arm | Fixed vs. weight-based dosing effect (95% CI) [P value] |
|---|---|---|---|---|
RCTs | ||||
Albiges, 202528 |
| Efficacy outcomes
|
ORR, n, % (95% CI) with minimum 8 months' follow-up: 60, 24.2% (95% CI, 19.0 to 30.0) BOR, n (%) with minimum 8 months' follow-up - CR:5 (2.0); PR: 55 (22.2); SD: 96 (38.7); PD: 62 (25.0); UTD: 30 (12.1) ORR, n, % (95% CI) with minimum 15 months' follow-up: 66, 26.6% (95% CI, 21.2 to 32.6) BOR, n (%) with minimum 15 months' follow-up - CR:5 (2.0); PR: 61 (24.6); SD: 89 (35.9); PD: 63 (25.4); UTD: 30 (12.1) DCR, n (%), 95% CI, 155 (62.5); 56.2 to 68.5 Median time to response, months (range): 3.71 (1.7 to 11.3); 6-month OS rate, % (95% CI): 83.8 (78.5 to 87.9); 12-month OS rate, % (95% CI): 72.4 (66.2 to 77.6); Median PFS, months (95% CI): 6.34 (5.13 to 7.49) Any grade AE, n (%): 230 (93.1); Any Grade 3/4 AE, n (%): 99 (40.1); Any grade TRAE, n(%): 152 (61.5); Any-grade 3/4 TRAE, n(%): 29 (11.7); All-causality AE leading to discontinuation, any grade, n(%): 31 (12.6); All-causality AE leading to discontinuation, grade 3/4, n(%): 31 (12.6); Any grade TRAE leading to discontinuation, n (%): 11 (4.5); Grade 3/4 TRAE leading to discontinuation, n (%): 7 (2.8); All-causality AEs that required immune-modulating medication, any grade, n (%): 94 (38.1); All-causality AEs that required immune-modulating medication, grade 3/4, n (%): 34 (13.8); Hypersensitivity/IRR TRAEs, any grade, n (%): 1 (0.4); Hypersensitivity/IRR TRAEs, grade 3/4, n (%): 1 (0.4); Any grade local site reaction TRAEs, n (%): 5 (2.0); Any grade local site reaction TRAEs, n (%): 18 (7.3); Grade 3/4 local site reaction TRAE, n (%): 0; Death: 3 (1.2) Any grade all-causality endocrine immune-mediated adverse events, n (%): Hypothyroidism/thyroiditis: 24 (9.7); adrenal insufficiency: 6 (2.4); hyperthyroidism: 3 (1.2); hypophysitis: 0 Grade 3/4 all-causality endocrine immune-mediated adverse event, n (%): Hypothyroidism/thyroiditis: 0; adrenal insufficiency: 2 (0.8); hyperthyroidism: 0; hypophysitis: 0 Any grade all-causality nonendocrine immune-mediated adverse events, n (%): Rash: 18 (7.3); hepatitis: 9 (3.6); diarrhea/colitis: 8 (3.2); pneumonitis: 7 (2.8); nephritis/renal dysfunction: 4 (1.6) Grade 3/4 all-causality nonendocrine immune-mediated adverse events, n (%): Rash: 2 (0.8); hepatitis: 7 (2.8); diarrhea/colitis: 1 (0.4); pneumonitis: 3 (1.2); nephritis/renal dysfunction: 0
ORR, n, % (95% CI) with minimum 8 months' follow-up: 45, 18.2% (95% CI, 13.6 to 23.6) BOR, n (%) with minimum 8 months' follow-up - CR:4 (1.6); PR: 41 (16.6); SD: 110 (44.5); PD: 66 (26.7); UTD: 26 (10.5) ORR, n, % (95% CI) with minimum 15 months' follow-up: 51, 20.6% (95% CI, 15.8 to 26.2) BOR, n (%) with minimum 15 months' follow-up - CR:7 (2.8); PR: 44 (17.8); SD: 104 (42.1); PD: 66 (26.7); UTD: 26 (10.5) DCR, n (%), 95% CI, 155 (62.8); 56.4 to 68.8 Median time to response, months (range): 3.68 (1.6 to 13.8); 6-month OS rate, % (95% CI): 86.4 (81.3 to 90.2); 12-month OS rate, % (95% CI): 72.9 (66.7 to 78.2); Median PFS, months (95% CI): 5.65 (5.19 to 7.39) Any grade AE, n (%): 231 (94.3); Any Grade 3/4 AE, n (%): 114 (46.5); Any grade TRAE, n(%): 161 (65.7); Any Grade 3/4 TRAE, n(%): 42 (17.1); All-causality AE leading to discontinuation, any grade, n(%): 34 (13.9); All-causality AE leading to discontinuation, grade 3/4, n(%): 24 (9.8); Any grade TRAE leading to discontinuation, n (%): 13 (5.3); Grade 3/4 TRAE leading to discontinuation, n (%): 9 (3.7); All-causality AEs that required immune-modulating medication, any grade, n (%): 106 (43.3); All-causality AEs that required immune-modulating medication, grade 3/4, n (%): 39 (15.9); Hypersensitivity/IRR TRAEs, any grade, n (%): 7 (2.9); Hypersensitivity/IRR TRAEs, grade 3/4, n (%): 0; Any grade local site reaction TRAEs, n (%): 5 (2.0); Grade 3/4 local site reaction TRAE, n (%): 0; Death: 2 (0.8) Any grade all-causality endocrine immune-mediated adverse events, n (%): Hypothyroidism/thyroiditis: 27 (11.0); adrenal insufficiency: 3 (1.2); hyperthyroidism: 11 (4.5); hypophysitis: 3 (1.2) Grade 3/4 all-causality endocrine immune-mediated adverse event, n (%): Hypothyroidism/thyroiditis: 1 (0.4); adrenal insufficiency: 0; hyperthyroidism: 0; hypophysitis: 2 (0.8) Any grade all-causality nonendocrine immune-mediated adverse events, n (%): Rash: 15 (6.1); hepatitis: 18 (7.3); diarrhea/colitis: 7 (2.9); pneumonitis: 7 (2.9); nephritis/renal dysfunction: 2 (0.8) Grade 3/4 all-causality nonendocrine immune-mediated adverse events, n (%):Rash: 3 (1.2); hepatitis: 12 (4.9); diarrhea/colitis: 0; pneumonitis: 2 (0.8); nephritis/renal dysfunction: 0 |
|
Herrera, 202129 |
| Efficacy outcomes
Safety outcomes
Follow-up / data cut-off
|
CR 1/6 = 16.7%; PR 1/6 = 16.7%; SD 1/6 = 16.7%; PD 2/6 = 33.3%; not evaluable 1/6 = 16.7%; ORR 2/6 = 33.3%
CR 0/7 = 0%; PR 0/7 = 0%; SD 4/7 = 57.1%; PD 1/7 = 14.3%; not evaluable 2/7 = 28.6%; ORR 0/7 = 0%.
CR 0/6 = 0%; PR 2/6 = 33.3%; SD 2/6 = 33.3%; PD 1/6 = 16.7%; not evaluable 1/6 = 16.7%; ORR 2/6 = 33.3%
CR 4/6 = 66.7%; PR 1/6 = 16.7%; SD 1/6 = 16.7%; PD 0/6 = 0%; not evaluable 0/6 = 0%; ORR 5/6 = 83.3%
CR 1/6 = 16.7%; PR 3/6 = 50.0%; SD 0/6 = 0%; PD 2/6 = 33.3%; not evaluable 0/6 = 0%; ORR 4/6 = 66.7%16.7%; ORR 3/6 = 55.6%. | ORR overall (all randomized): 13/31 = 41.9%; CR 6/31 = 19.4%; PR 7/31 = 22.6%. Median PFS 5.7 months; 1-year PFS rate 18.2%. Any-grade TRAE: 26/30 = 86.7%. Grade ≥ 3 TRAE: 13/30 = 43.3%. Treatment-related death (pneumonitis): 1/30 = 3.3%. Immune-related AEs: 9/30 = 30.0%; grade ≥ 3 irAEs: 5/30 = 16.7%. Discontinuation due to AEs: 6/31 = 19.4% (reported as a main reason for discontinuation). |
Nonrandomized studies | ||||
Campo Le Brun, 202530 |
| Safety:
Efficacy:
| WAD:
FD:
|
|
Horisaki, 202531 | Nivolumab
| Efficacy outcomes
Safety outcomes
| Arm 1 (240 mg q.2.w., n = 40): CR 1/40 (2.5%); PR 10/40 (25.0%); SD 8/40 (20.0%); PD 21/40 (52.5%); ORR 27.5%; DCR 47.5%. Median PFS 3.9 months; median OS 16.5 months. 6-month PFS 17/40 (42.5%); 12-month PFS 11/40 (27.5%). Any-grade irAE 17/40 (42.5%); Grade ≥ 3 irAE 3/40 (7.5%). Stopped due to irAE: 5/37 (13.5%)* Arm 2 (480 mg q.4.w., n = 35): CR 2/35 (5.7%); PR 2/35 (5.7%); SD 11/35 (31.4%); PD 20/35 (57.1%); ORR 11.4%; DCR 42.8%. Median PFS 3.6 months; median OS 9.4 months. 6-month PFS 12/35 (34.3%); 12-month PFS 4/35 (11.4%). Any-grade irAE 16/35 (45.7%); Grade ≥ 3 irAE 1/35 (2.9%). Stopped due to irAE: 2/31 (6.5%)* Arm 3 (2 mg/kg q.3.w., n = 41): CR 0/41 (0.0%); PR 6/41 (14.6%); SD 13/41 (31.7%); PD 22/41 (53.7%); ORR 14.6%; DCR 46.3%. Median PFS 3.1 months; median OS 11.8 months. 6-month PFS 13/41 (31.7%); 12-mo PFS 7/41 (17.1%). Any-grade irAE 19/41 (46.3%); Grade ≥ 3 irAE 8/41 (19.5%). Stopped due to irAE: 8/41 (19.5%)* Arm 4 (3 mg/kg q.2.w., n = 37): CR 2/37 (5.4%); PR 7/37 (18.9%); SD 6/37 (16.2%); PD 22/37 (59.5%); ORR 24.3%; DCR 40.5%. Median PFS 2.6 months; median OS 18.9 months. 6-month PFS 13/37 (35.1%); 12-mo PFS 8/37 (21.6%). Any-grade irAE 18/37 (48.6%); Grade ≥ 3 irAE 4/37 (10.8%). Stopped due to irAE: 4/36 (11.1%)* | Arm 2 vs. 1: ORR: 11.4% vs. 27.5% (P = 0.082). DCR: 42.8% vs. 47.5% (P = 0.687). Log-rank: PFS P = 0.841; OS P = 0.852. Multivariable Cox (vs. 240 mg q.2.w. reference): PFS HR 0.959 (95% CI, 0.561 to 1.642), P = 0.881; OS HR 1.028 (0.572 to 1.847), P = 0.928 Median PFS: 3.6 vs. 3.9 months (log-rank P = 0.841). Median OS: 9.4 vs. 16.5 months (log-rank P = 0.852). 6-month PFS: 12/35 (34.3%) vs. 17/40 (42.5%) (P = 0.487). 12-month PFS: 4/35 (11.4%) vs. 11/40 (27.5%) (P = 0.147). Any-grade irAE: 45.7% vs. 42.5% (P = 0.819) Grade ≥ 3 irAE: 2.9% vs. 7.5% (P = 0.618) Arm 4 vs. arm 3: ORR: 24.3% vs. 14.6% (P = 0.278). DCR: 40.5% vs. 46.3% (P = 0.606). Median PFS: 2.6 vs. 3.1 months (log-rank P = 0.753). Median OS: 18.9 vs. 11.8 months (log-rank P = 0.892). 6-month PFS: 13/37 (35.1%) vs. 13/41 (31.7%) (P = 0.812). 12-month PFS: 8/37 (21.6%) vs. 7/41 (17.1%) (P = 0.775). Arm 3 vs. 1: Multivariable Cox (vs. 240 mg q.2.w. reference): PFS HR 1.460 (95% CI, 0.848 to 2.513), P = 0.172; OS HR 1.316 (0.758 to 2.287), P = 0.329 Any-grade irAE: 46.3% vs. 48.6% (P = 1.000) Grade ≥ 3 irAE: 19.5% vs. 10.8% (P = 0.356) Arm 4 vs. 1: Multivariable Cox (vs. 240 mg q.2.w. reference): PFS HR 1.282 (95% CI, 0.761 to 2.160), P = 0.350; OS HR 1.299 (0.759 to 2.222), P = 0.3294 |
Hughes, 202532 |
| Efficacy outcomes
Safety outcomes
Follow-up / measurement timing
| Arm 1 = 3 mg/kg q.2.w. (weight-based; n = 59; mCSCC): CR 12/59 = 20.3%; PR 18/59 = 30.5%; SD 9/59 = 15.3%; PD 10/59 = 16.9%; Non-CR/non-PD 3/59 = 5.1%; Not evaluable 7/59 = 11.9%; ORR 30/59 = 50.8% (95% CI, 37.5 to 64.1). Median time to CR 11.1 months (3.7 to 22.1). Median PFS 18.4 months (95% CI, 7.3 to 53.2). Median OS 57.7 months (95% CI, 29.3 to NE). 48-month OS probability 57.1% (95% CI, 43.0 to 68.9). DOR estimates: 12-month 89.5%; 24-month 70.1%; 36-month 61.8%. Safety: any irTEAE 40/59 = 67.8%; grade ≥ 3 irTEAE 8/59 = 13.6%; serious irTEAE 6/59 = 10.2%; irTEAE leading to discontinuation 6/59 = 10.2%; irTEAE leading to death 0/59 = 0%; any grade ≥ 3 TEAE 30/59 = 50.8%. Arm 2 = 350 mg q.3.w. (fixed dose; n = 56; mCSCC): CR 11/56 = 19.6%; PR 15/56 = 26.8%; SD 8/56 = 14.3%; PD 14/56 = 25.0%; Non-CR/non-PD 2/56 = 3.6%; Not evaluable 6/56 = 10.7%; ORR 26/56 = 46.4% (95% CI, 33.0 to 60.3). Median time to CR 12.7 months (6.2 to 22.8). Median PFS 21.7 months (95% CI, 3.8 to 43.3). Median OS 48.4 months (95% CI, 29.5 to NE). 48-month OS probability 52.3% (95% CI, 37.9 to 64.9). DOR estimates: 12-month 88.5%; 24-month 84.6%; 36-month 84.6%. Safety: any irTEAE 35/56 = 62.5%; grade ≥ 3 irTEAE 6/56 = 10.7%; serious irTEAE 4/56 = 7.1%; irTEAE leading to discontinuation 2/56 = 3.6%; irTEAE leading to death 0/56 = 0%; any grade ≥ 3 TEAE 24/56 = 42.9%. | NR |
Smeenk, 202533 |
| Efficacy outcomes
Safety / treatment-course outcomes (proxies)
| Arm 1:
Arm 2:
|
|
Staender, 202534 | Anti-PD1 monotherapy (nivolumab or pembrolizumab).
| Efficacy outcomes
Outcome definitions / timing
Safety outcomes
| WAT group
FDT group
|
|
Chaitesipaseut, 202435 |
| Efficacy outcomes
Safety outcomes
Follow-up / measurement period
| Arm 1 (FD)
Arm 2 (WD)
| OS (rate at end of follow-up: June 30, 2022) Rate difference (RD): 1% (90% CI, −6%–8%), Noninferiority (NI) P value < 0.01 Kaplan-Meier log-rank test, P = 0.88 Adjusted HR of Mortality (FD vs. WBD): 1.06 (95% CI, 0.84 to 1.32); P value = 0.63 All-cause Emergency department Visits (Proportion of patients): RD: 1.1% (90% CI, −0.05 to 0.07); NI P value < 0.01 All-cause Hospitalizations (Proportion of patients): RD: 2.3% (90% CI, −0.04 to 0.09); NI P value < 0.01 Composite Incidence of irAEs (Up to 6 months after the last infusion) RD: −2.2% (90% CI, −0.09% to 0.05%); NI P value = 0.03. |
Grit, 202436 | Pembrolizumab Arm 1: Standard dosing: q.3.w. 200 mg; q.6.w. 400 mg. Arm 2: q.3.w. < 65 kg 100 mg; 65 to 90 kg 150 mg; ≥ 90 kg 200 mg. q.6.w. < 65 kg 200 mg; 65 to 90 kg 300 mg; ≥ 90 kg 400 mg. | Efficacy outcomes
Safety outcomes
| Arm 1:
Arm 2:
| Adjusted HR for OS (alt. dose vs. std dose) = 0.83 (95% CI, 0.69 to 1.003, P = 0.053) – established noninferiority (NI) because 95% CI falls within NI margin of 1.2 Adjusted HR for TTNT-D: 0.87 (95% CI, 0.74 to 1.03) |
Leroy, 202437 |
| Efficacy outcomes
Safety outcomes
| Arm 1:
Arm 2:
|
|
Patel, 202438 | Drugs: Nivolumab (n = 47), Pembrolizumab (n = 36), Durvalumab (n = 9), Atezolizumab (n = 8).
| Efficacy outcomes
Response assessment / follow-up
| Arm 1:
Arm 2:
Arm 3:
|
|
Rischin, 202439 |
| Efficacy outcomes
Safety outcomes
| Groups 1 to 3 pooled (n = 193): any TEAE 192 (100%); grade ≥ 3 TEAE 95 (49%); any treatment-related AE 148 (77%); grade ≥ 3 treatment-related AE 33 (17%); TEAEs leading to discontinuation 19 (10%); TEAEs leading to death 5 (3%); treatment-related AEs leading to discontinuation 16 (8%); treatment-related AEs leading to death 1 (1%). Earlier groups 1 to 3, contextual efficacy only: integrated analysis ORR 46.1% (95% CI, 38.9 to 53.4); ongoing responses at 12 months 87.8% (95% CI, 78.5 to 93.3). Group 4 fixed 600 mg q.4.w. (n = 63): any TEAE 63 (100%); grade ≥ 3 TEAE 34 (54%); any treatment-related AE 52 (83%); grade ≥ 3 treatment-related AE 10 (16%); TEAEs leading to discontinuation 11 (18%); TEAEs leading to death 6 (10%); treatment-related AEs leading to discontinuation 7 (11%); treatment-related AEs leading to death 1 (2%); ORR 39/63 = 61.9% (95% CI, 48.8 to 73.9); complete response 14/63 (22.2%); partial response 25/63 (39.7%); disease control 49/63 = 77.8% (95% CI, 65.5 to 87.3); durable disease control 48/63 = 76.2% (95% CI, 63.8 to 86.0); 12-month PFS 65% (95% CI, 51 to 76); 12-month OS 73% (95% CI, 60 to 83). | NR |
Berard, 202340 |
| Efficacy outcomes
Safety outcomes
| Arm 1:
Arm 2:
|
|
Samlowski, 202341 | Nivolumab adjuvant monotherapy (melanoma), real-world cohorts by regimen:
| Efficacy / treatment-course outcomes
Safety outcomes
Safety assessment window
| C1: de novo nivolumab 480 mg q.4.w. (n = 40)
C4: de novo nivolumab 240 mg q.2.w. (n = 55)
C3: de novo nivolumab 3 mg/kg q.2.w. (n = 22)
| NR |
Fujiwara, 202242 | Study part 1:
Study part 2:
| Efficacy outcomes (part 2)
Outcome definitions / timing
Safety outcomes (part 2)
Treatment exposure
Other
Efficacy outcomes (part 2)
Outcome definitions / timing
Safety outcomes (part 2)
Treatment exposure
Other
| Part 1: Cohort 1 (n = 4): Efficacy: ORR 0/4 = 0%; DCR 0/4 = 0%; durable DCR 0/4 = 0%. Response breakdown: CR 0/4 = 0%; PR 0/4 = 0%; SD ≥ 12w 0/4 = 0%; PD 4/4 = 100%; nonevaluable 0/4 = 0% Safety: Any AE 3/4 = 75%; grade ≥ 3 AE 1/4 = 25%; SAE 1/4 = 25%; AE leading to discontinuation 0/4 = 0%; any AESI 3/4 = 75%; treatment-related AESI 3/4 = 75% Cohort 2 (n = 4): Efficacy: ORR 0/4 = 0%; DCR 1/4 = 25%; durable DCR 1/4 = 25% Response breakdown: CR 0/4 = 0%; PR 0/4 = 0%; SD ≥ 12w 1/4 = 25%; PD 3/4 = 75%; nonevaluable 0/4 = 0%. Safety: Any AE 4/4 = 100%; grade ≥ 3 AE 3/4 = 75%; SAE 1/4 = 25%; AE leading to discontinuation 0/4 = 0%; any AESI 3/4 = 75%; treatment-related AESI 2/4 = 50% Part 2: Arm 1 = cohort 1 (WBD) n = 4. Efficacy: ORR 0/4 = 0%; DCR 0/4 = 0%; durable DCR 0/4 = 0%. Response breakdown: CR 0/4 = 0%; PR 0/4 = 0%; SD ≥ 12w 0/4 = 0%; PD 3/4 = 75%; nonevaluable 1/4 = 25%. Safety: Any AE 4/4 = 100%; grade ≥ 3 AE 2/4 = 50%; SAE 2/4 = 50%; AE leading to discontinuation 2/4 = 50%; any AESI 3/4 = 75%; treatment-related AESI 3/4 = 75%. DLT: Grade 4 myasthenia gravis (reported as a DLT) in 1/4 Arm 2 = cohort 2 (WBD) n = 6. Efficacy: ORR 2/6 = 33.3% (CR 1/6 = 16.7%; PR 1/6 = 16.7%); DCR 2/6 = 33.3%; durable DCR 2/6 = 33.3%. Response breakdown: CR 1/6 = 16.7%; PR 1/6 = 16.7%; SD ≥ 12w 0/6 = 0%; PD 4/6 = 66.7%; nonevaluable 0/6 = 0% Safety: Any AE 5/6 = 83.3%; grade ≥ 3 AE 3/6 = 50%; SAE 3/6 = 50%; AE leading to discontinuation 2/6 = 33.3%; any AESI 5/6 = 83.3%; treatment-related AESI 3/6 = 50% Arm 3 = cohort 3 (FD) n = 6 Efficacy: ORR 0/6 = 0%; DCR 2/6 = 33.3% (driven by SD ≥ 12 weeks 2/6 = 33.3%); durable DCR 0/6 = 0%. Response breakdown: CR 0/6 = 0%; PR 0/6 = 0%; SD ≥ 12w 2/6 = 33.3%; PD 3/6 = 50%; nonevaluable 1/6 = 16.7% Safety: Any AE 6/6 = 100%; grade ≥ 3 AE 3/6 = 50%; SAE 3/6 = 50%; AE leading to discontinuation 1/6 = 16.7%; any AESI 3/6 = 50%; treatment-related AESI 3/6 = 50%. DLT: Hyperglycemia (reported as a DLT) in 1/6 | NR |
Hijmering-Kappelle et al., 202243 | Weight-based standard dose: durvalumab 10 mg/kg IV every 2 weeks; Fixed extended-interval dose: durvalumab 1,500 mg IV every 4 weeks; adjuvant treatment in stage III NSCLC | Efficacy outcomes
Safety outcomes
| Weight-based SD (n = 17): 26 total AEs; grade ≥ 3 AEs 3 (11.5%). In escalation window (n = 15): 19 total AEs; grade ≥ 3 AEs 2 (10.5%). Treatment interruption 0. Treatment discontinuation 5. Fixed EI (n = 49): 79 total AEs; grade ≥ 3 AEs 6 (7.6%). In escalation window: 46 total AEs; grade ≥ 3 AEs 5 (10.9%). Treatment interruption 1. Treatment discontinuation 3. PFS/OS: median PFS and median OS not reached in both cohorts. | No formal fixed-vs.-weight-based effect estimate reported for survival or safety outcomes. Reported subgroup p-values for adverse events were: overall any-grade P = 0.75; overall grade ≥ 3 P = 0.58; escalation-window any-grade P = 0.11; escalation-window grade ≥ 3 P = 0.74. No confirmed HR, RR, OR, mean difference, 95% CI, or confirmed survival P value reported in the parsed text available here. |
Iikura, 202244 |
| Safety outcomes
| Arm 1: Any-grade irAE: 23/77 = 29.9% | Grade ≥ 2 irAE: 18/77 = 23.3%
Arm 2: Any-grade irAE: 7/36 = 19.4% | Grade ≥ 2 irAE: 7/36 = 19.4%
|
|
Okada, 202245 |
| Efficacy outcomes
Safety outcomes
Assessment details
| Arm 1:
Arm 2:
|
|
Patnaik, 202246 | Part 1 — Weight-Based Dose Escalation Arms
Part 2A — Fixed-Dose Arms
| Safety: Treatment-emergent adverse events (TEAEs) during the treatment period, including:
Efficacy:
| Arm: 1 mg/kg q.2.w. (n = 6) Efficacy: irPR 0/6 = 0%; SD 2/6 = 33.3% Safety: Any AE 6/6 (100%); Dostarlimab-related AE 6/6 (100.0%); Any grade ≥ 3 AE 3/6 (50.0%); Dostarlimab-related grade ≥ 3 AE 1/6 (16.7%); Any serious AE 2/6 (33.3%); Dostarlimab-related serious AE 0/6 (0%); Any AE → withdrawal 0/6 (0%); Dostarlimab-related AE → withdrawal 0/6 (0%); Any AE → interruption 1/6 (16.7%); Any immune-related AE 0/6 (0%) Arm: 3 mg/kg q.2.w. (n = 3) Efficacy: irPR 1/3 = 33.3%; SD 1/3 = 33.3% Safety: Any AE 3/3 (100%); Dostarlimab-related AE 2/3 (66.7%); Any grade ≥ 3 AE 1/3 (33.3%); Dostarlimab-related grade ≥ 3 AE 0/3 (0%); Any serious AE 0/3 (0%); Dostarlimab-related serious AE 0/3 (0%); Any AE → withdrawal 0/3 (0%); Dostarlimab-related AE → withdrawal 0/3 (0%); Any AE → interruption 2/3 (66.7%); Any immune-related AE 0/3 (0%) Arm: 10 mg/kg q.2.w. (n = 12) Efficacy: irPR 1/12 = 8.3%; SD 2/12 = 16.7% Safety: Any AE 12/12 (100%); Dostarlimab-related AE 9/12 (75.0%); Any grade ≥ 3 AE 6/12 (50.0%); Dostarlimab-related grade ≥ 3 AE 1/12 (8.3%); Any serious AE 6/12 (50.0%); Dostarlimab-related serious AE 1/12 (8.3%); Any AE → withdrawal 2/12 (16.7%); Dostarlimab-related AE → withdrawal 1/12 (8.3%); Any AE → interruption 3/12 (25.0%); Any immune-related AE 1/12 (8.3%) Arm: 500 mg q.3.w. (n = 6) Efficacy: irPR 0/6 = 0%; SD 0/6 = 0% (SD responses in part 2A occurred in 1,000 mg q.6.w. cohort) Safety: Any AE 6/6 (100%); Dostarlimab-related AE 5/6 (83.3%); Any grade ≥ 3 AE 1/6 (16.7%); Dostarlimab-related grade ≥ 3 AE 1/6 (16.7%); Any serious AE 1/6 (16.7%); Dostarlimab-related serious AE 0/6 (0%); Any AE → withdrawal 0/6 (0%); Dostarlimab-related AE → withdrawal 0/6 (0%); Any AE → interruption 2/6 (33.3%); Any immune-related AE 0/6 (0%) Arm: 1,000 mg q.6.w. (n = 7) Efficacy: irPR 0/7 = 0%; SD 2/7 = 28.6% Safety: Any AE 7/7 (100%); Dostarlimab-related AE 5/7 (71.4%); Any grade ≥ 3 AE 1/7 (14.3%); Dostarlimab-related grade ≥ 3 AE 1/7 (14.3%); Any serious AE 1/7 (14.3%); Dostarlimab-related serious AE 1/7 (14.3%); Any AE → withdrawal 1/7 (14.3%); Dostarlimab-related AE → withdrawal 1/7 (14.3%); Any AE → interruption 0/7 (0%); Any immune-related AE 1/7 (14.3%) | Fatigue: 1mg/kg q.2.w. 1(16.7); 3mg/kg q.2.w. 2(66.7); 10mg/kg q.2.w. 4(33.3); Part1 7(33.3); 500mg q.3.w. 2(33.3); 1,000mg q.6.w. 3(42.9); Part2A 5(38.5) Nausea: 1mg/kg q.2.w. 1(16.7); 3mg/kg q.2.w. 1(33.3); 10mg/kg q.2.w. 3(25.0); Part1 5(23.8); 500mg q.3.w. 1(16.7); 1,000mg q.6.w. 0; Part2A 1(7.7) Pruritus: 1mg/kg q.2.w. 2(33.3); 3mg/kg q.2.w. 1(33.3); 10mg/kg q.2.w. 1(8.3); Part1 4(19.0); 500mg q.3.w. 0; 1,000mg q.6.w. 0; Part2A 0 Arthralgia: 1mg/kg q.2.w. 1(16.7); 3mg/kg q.2.w. 1(33.3); 10mg/kg q.2.w. 1(8.3); Part1 3(14.3); 500mg q.3.w. 1(16.7); 1,000mg q.6.w. 0; Part2A 1(7.7) Decreased appetite: 1mg/kg q.2.w. 2(33.3); 3mg/kg q.2.w. 1(33.3); 10mg/kg q.2.w. 0; Part1 3(14.3); 500mg q.3.w. 1(16.7); 1,000mg q.6.w. 0; Part2A 1(7.7) Maculopapular rash: 1mg/kg q.2.w. 2(33.3); 3mg/kg q.2.w. 1(33.3); 10mg/kg q.2.w. 0; Part1 3(14.3); 500mg q.3.w. 0; 1,000mg q.6.w. 0; Part2A 0 Alopecia: 1mg/kg q.2.w. 0; 3mg/kg q.2.w. 1(33.3); 10mg/kg q.2.w. 1(8.3); Part1 2(9.5); 500mg q.3.w. 0; 1,000mg q.6.w. 0; Part2A 0 Vomiting: 1mg/kg q.2.w. 0; 3mg/kg q.2.w. 0; 10mg/kg q.2.w. 2(16.7); Part1 2(9.5); 500mg q.3.w. 0; 1,000mg q.6.w. 0; Part2A 0 Anemia: 1mg/kg q.2.w. 0; 3mg/kg q.2.w. 0; 10mg/kg q.2.w. 0; Part1 0; 500mg q.3.w. 1(16.7); 1,000mg q.6.w. 0; Part2A 1(7.7) Amylase increased: 1mg/kg q.2.w. 0; 3mg/kg q.2.w. 0; 10mg/kg q.2.w. 0; Part1 0; 500mg q.3.w. 1(16.7); 1,000mg q.6.w. 1(14.3); Part2A 2(15.4) Hypokalemia: 1mg/kg q.2.w. 1(16.7); 3mg/kg q.2.w. 0; 10mg/kg q.2.w. 0; Part1 1(4.8); 500mg q.3.w. 1(16.7); 1,000mg q.6.w. 1(14.3); Part2A 2(15.4) |
To, 202247 |
| Efficacy:
Safety:
Tumour assessment timing:
| Arm 1:
Arm 2:
|
|
Juergens, 202048 | Durvalumab:
Tremelimumab:
| Efficacy:
Safety:
Assessment/follow-up details:
| Durvalumab only (N = 24; dose level 0): ORR 7/24 = 29%; CR 1/24 = 4%; PR 6/24 = 25%; SD 10/24 = 42%; PD 6/24 = 25%; Inevaluable 1/24 = 4%. irAE any grade: 11/24 = 46% Durvalumab + tremelimumab irAEs from total; total: 97/136) . irAE grade ≥ 3: 1/24 = 4% durvalumab + tremelimumab grade ≥ 3 irAEs from total; total: 28/136) . Durvalumab + tremelimumab (N = 112; dose levels 1 to 4): ORR 47/112 = 42%; CR 2/112 = 2%; PR 45/112 = 40%; SD 50/112 = 45%; PD 12/112 = 11%; inevaluable 3/112 = 3%. irAE any grade: 86/112 = 77%. irAE grade ≥ 3: 27/112 = 24%. | NR |
Kato, 202049 |
| Efficacy:
Safety:
| Arm 1:
Arm 2:
|
|
Rischin, 202050 |
| Efficacy:
Safety:
| Fixed dose (cemiplimab 350 mg IV q.3.w.): ORR 41.1% (95% CI, 28.1 to 55.0); disease control rate 64.3% (95% CI, 50.4 to 76.6); durable disease control rate 57.1% (95% CI, 43.2 to 70.3); 8-month DOR 95.0% (95% CI, 69.5 to 99.3); median time to response 2.1 months (range 2.0 to 8.3); treatment-related adverse events any grade 36/56 (64.3%); treatment-related adverse events grade ≥ 3 7/56 (12.5%); immune-related adverse events any grade 32/56 (57.1%); immune-related adverse events grade ≥ 3 7/56 (12.5%). Weight-based dose (cemiplimab 3 mg/kg IV q.2.w.): ORR 49.2% (95% CI, 35.9 to 62.5); disease control rate 71.2% (95% CI, 57.9 to 82.2); durable disease control rate 61.0% (95% CI, 47.4 to 73.5); 12-month DOR 88.9% (95% CI, 69.3 to 96.3); median time to response 1.9 months (range 1.7 to 9.1); treatment-related adverse events any grade 46/59 (78.0%); treatment-related adverse events grade ≥ 3 9/59 (15.3%); immune-related adverse events any grade 40/59 (67.8%); immune-related adverse events grade ≥ 3 8/59 (13.6%). | NR |
PK/PD modelling or simulation studies | ||||
Gandhi, 202453 |
| Efficacy
Safety
| Arm 1:
Arm 2:
| Median PFS: P value = 0.31 ORR: no comparative effect estimate reported (no OR/HR). |
Masters, 202251 |
| Safety (modelled outcomes)
Assessment approach
| NR |
|
Sanghavi, 202156 |
| Efficacy
Safety
| RFS: 1 year: 3 mg/kg day 14 = 0.721 (0.679 to 0.766), 240 mg = 0.721 (0.679 to 0.766); 3 mg/kg day 28 = 0.721 (0.679 to 0.765), 480 mg = 0.721 (0.679 to 0.765). 2 years: 3 mg/kg day 14 = 0.644 (0.598 to 0.692), 240 mg = 0.644 (0.598 to 0.692); 3 mg/kg day 28 = 0.643 (0.598 to 0.692), 480 mg = 0.644 (0.599 to 0.693). DMFS: 1 year: 3 mg/kg day 14 = 0.8094 (0.7724 to 0.8483), 240 mg = 0.8095 (0.7724 to 0.8483); 3 mg/kg day 28 = 0.8094 (0.7724 to 0.8482), 480 mg = 0.8094 (0.7724 to 0.8482). 2 years: 3 mg/kg day 14 = 0.7164 (0.6726 to 0.7631), 240 mg = 0.7165 (0.6727 to 0.7632); 3 mg/kg day 28 = 0.7165 (0.6726 to 0.7632), 480 mg = 0.7165 (0.6726 to 0.7632). Grade 3+ AEs: 6 months: 3 mg/kg 0.206 (0.1686 to 0.2975), 240 mg 0.2056 (0.1721 to 0.2985), 480 mg 0.1967 (0.1644 to 0.2863). 12 months: 3 mg/kg 0.2892 (0.2395 to 0.4076), 240 mg 0.2887 (0.2443 to 0.409), 480 mg 0.2769 (0.2339 to 0.3936). Grade 2+ IMAEs: 6 months: 3 mg/kg 0.2275 (0.1879 to 0.2877), 240 mg 0.2280 (0.1877 to 0.2841), 480 mg 0.2516 (0.2079 to 0.3124). 12 months: 3 mg/kg 0.3135 (0.2621 to 0.3905), 240 mg 0.3142 (0.2618 to 0.3861), 480 mg 0.3445 (0.2883 to 0.4212). | NR |
Sheng, 202154 |
| Safety end points
Efficacy end point
| Arm 1 (3 mg/kg q.2.w.) Chinese (CheckMate 077; n = 15): AEs any grade 15/15 (100.0%); grade 3/4 1/15 (6.7%); grade 5 4/15 (26.7%). SAEs any grade 5/15 (33.3%); grade 3/4 0/15 (0%). AEs-DC any grade 2/15 (13.3%); grade 3/4 0/15 (0%) Chinese 2L NSCLC (CheckMate 078; efficacy analysis [ORR] n = 143; safety analysis n = 241): ORR: 22.2% (responders, n: 22) for squamous and 15.4% (responders, n: 22) for nonsquamous NSCLC AEs any grade 236/241 (97.9%); grade 3/4 104/241 (43.2%); grade 5 10/241 (4.1%). SAEs any grade 88/241 (36.5%); grade 3/4 50/241 (20.7%). AEs-DC any grade 40/241 (16.6%); grade 3/4 29/241 (12.0%) Global Patients: ORR: 20.0% for squamous (responders, n: 27) and 19.2% for nonsquamous NSCLC (responders, n: 56), from CheckMate 017 and CheckMate 057 respectively Arm 2 (240 mg q.2.w.) Chinese (CheckMate 077; n = 20): AEs any grade 18/20 (90.0%); grade 3/4 2/20 (10.0%); grade 5 0/20 (0%). SAEs any grade 6/20 (30.0%); grade 3/4 2/20 (10.0%). AEs-DC any grade 2/20 (10.0%); grade 3/4 1/20 (5.0%) Arm 3 (10 mg/kg q.2.w.) Global (safety analysis n = 131): AEs any grade 131/131 (100.0%); grade 3/4 66/131 (50.4%); grade 5 18/131 (13.7%). SAEs any grade 73/131 (55.7%); grade 3/4 49/131 (37.4%). AEs-DC any grade 28/131 (21.4%); grade 3/4 17/131 (13.0%) | NR |
Bei, 202057 |
| Safety end points analyzed (no specific time point stated): AE leading to discontinuation or death (AE-DC/D) Grade ≥ 3 AE (AE grade 3+) Immune-mediated AE grade ≥ 2 (AE-IM grade 2+) Efficacy end points analyzed: OS: 1-year and 2-year predicted mean survival probability ORR: predicted and compared between doses | Arm 1 (3 mg/kg) OS (predicted mean survival probability, 95% CI)
Predicted ORR
Predicted proportion of AE-DC/D
Predicted proportion of Grade ≥ 3 AE
Predicted proportion of Grade > 2 AE-IM
Arm 2 (240 mg flat q.2.w.) OS (predicted mean survival probability, 95% CI):
Predicted ORR
Predicted proportion of AE-DC/D
Predicted proportion of Grade ≥ 3 AE
Predicted proportion of Grade > 2 AE-IM
| Safety: “no change or a negligible increase (≤2%, not statistically significant) in the proportion of patients who may have an AE-DC/D, AE grade 3+ or AE-IM Grade 2 + for all tumour types in 240 mg compared to 3 mg/kg q.2.w.” Efficacy: “The mean OS for both regimens was similar at both time points for all other tumour types. “For predicted ORR, no differences were observed between doses within each tumor type assessed.” |
Lala, 202058 | Pembrolizumab Fixed:
Weight-based:
| Safety end points (pooled clinical data; time point not reported)
|
Additional arms:
| NR |
Novakovic, 202052 |
| Safety end points (modelled, any grade):
Efficacy end point (modelled):
| Group 1 (weight-based):
Group 2 (flat):
| NR |
Zhao, 202055 |
| Safety outcomes (modelled/predicted):
Efficacy outcomes (modelled/predicted):
| Arm 1 (3 mg/kg q.2.w.): ≥ Grade 2 IMAEs (using Cavgday as exposure),
≥ Grade 2 TRAEs (using Cavgday as exposure),
TRAEs-DC/C (using Cavgday as exposure),
OS (using Cavgd28 as exposure)
ORR (using Cavgd28 as exposure)
Arm 2 (240 mg q.2.w.): ≥ Grade 2 IMAEs (using Cavgday as exposure),
≥ Grade 2 TRAEs (using Cavgday as exposure),
TRAEs-DC/C (using Cavgday as exposure),
OS (using Cavgd28 as exposure)
ORR (using Cavgd28 as exposure)
Arm 3 (480 mg q.4.w.): ≥ Grade 2 IMAEs (using Cavgday as exposure),
≥ Grade 2 TRAEs (using Cavgday as exposure),
TRAEs-DC/C (using Cavgday as exposure),
OS (using Cavgd28 as exposure)
ORR (using Cavgd28 as exposure)
| “There were negligible differences between the three regimens in the probabilities of experiencing an AE.” “The predicted probability of experiencing grade 2 IMAEs, grade 2 TRAEs, and TRAEs-DC/D was similar with nivolumab 480mg q.4.w. compared with 3mg/kg q.2.w.” |
AE = adverse event; AE-DC/D = adverse event leading to discontinuation or death; AESI = adverse event of special interest; all-cause AE = adverse event of any cause; alloHCT = allogeneic hematopoietic cell transplant; ALT = alanine aminotransferase; AST = aspartate aminotransferase; AUC = area under the concentration–time curve; AUC0-336h = area under the concentration–time curve from 0 to 336 hours; AUC6wk,ss = area under the concentration–time curve over 6 weeks at steady state; AUCss = area under the concentration–time curve at steady state; BICR = blinded independent central review; BMI = body mass index; BOR = best overall response; CR = complete response; CTCAE = Common Terminology Criteria for Adverse Events; Cmax = maximum drug concentration; Cmax1 = maximum concentration after the first dose or first cycle; Cmaxss = maximum concentration at steady state; Cmin = minimum (trough) concentration; Cmin,1 = trough concentration after the first dose or first cycle (study-defined); Cmin-d28 = minimum concentration over days 1 to 28; Cminss = minimum (trough) concentration at steady state; Ctrough = trough concentration; Ctrough,ss = trough concentration at steady state; Cavg = average concentration; Cavgd28 = average concentration through days 1 to 28; Cavgss = average concentration at steady state; CV = coefficient of variation; DCR = disease control rate; DL = dose level; DLT = dose-limiting toxicity; DOR = duration of response; dMMR = deficient mismatch repair; ED = emergency department; ER = exposure-response; FDT = fixed-dose therapy; FD = fixed dose; FU = follow-up; G = grade; G ≥ 3 = grade 3 or higher; HCC = hepatocellular carcinoma; HR = hazard ratio; HR-QoL = health-related quality of life; ICI = immune checkpoint inhibitor; IL = interleukin; IMAE = immune-mediated adverse event; irAE = immune-related adverse event; irPR = immune-related partial response; irRECIST = immune Response Evaluation Criteria in Solid Tumours; IRR = infusion-related reaction; IPTW = inverse probability of treatment weighting; IQR = interquartile range; LA = locally advanced; mCRC = metastatic colorectal cancer; mMCC = metastatic Merkel cell carcinoma; MSS = microsatellite stable; NA = not applicable; NMA = network meta-analysis; NR = not reported; NSCLC = non–small cell lung cancer; NSQ NSCLC = nonsquamous non–small cell lung cancer; OR = odds ratio; ORR = objective response rate; OS = overall survival; PAEs = pulmonary adverse events; PD = progressive disease; PD-1 = programmed cell death protein 1; PD-L1 = programmed death-ligand 1; PFS = progression-free survival; PK = pharmacokinetics; PR = partial response; q.2.w. = every 2 weeks; q.3.w. = every 3 weeks; q.4.w. = every 4 weeks; q.6.w. = every 6 weeks; q.12.w. = every 12 weeks; rHuPH20 = recombinant human hyaluronidase PH20; RCC = renal cell carcinoma; RCT = randomized controlled trial; RD = risk difference; RECIST = Response Evaluation Criteria in Solid Tumours; RR = risk ratio; SAE = serious adverse event; SC = subcutaneous; SCLC = small cell lung cancer; SD = stable disease; SOC = standard of care; SQ NSCLC = squamous non–small cell lung cancer; ss = steady state; TEAE = treatment-emergent adverse event; Tr-PAEs = treatment-related pulmonary adverse events; TRAE = treatment-related adverse event; TTR = time to response; UC = urothelial carcinoma; UTD = unable to determine; vs. = versus; WAD = weight-adjusted dosing; WAT = weight-adjusted therapy (study-defined); WBD = weight-based dosing; WCD = weight-capped dosing.
Appendix 4: Summary of Pharmacodynamic and Pharmacokinetic Outcomes
Please note that this appendix has not been copy-edited.
Table 14: Summary of Pharmacodynamic and Pharmacokinetic Outcomes
Author and publication year | Intervention characteristics | t½ (h) | Cmin, Cmax, AUC, PD / target occupancy (%) |
|---|---|---|---|
RCTs | |||
Albiges, 202528 |
| NR | Nivolumab + rHuPH20 SC (n = 248)
Nivolumab IV (n = 247)
Geometric mean ratio (90% CI) of Cminss between both arms: 1.774 (1.633 to 1.927)
Median % PD-1receptor occupancy on circulating CD3+ T cells (IQR) at day 29 using the dataset with at least 8 months' follow-up: 97.0 (89.6, 104.2)
Median % PD-1receptor occupancy on circulating CD3+ T cells (IQR) at day 29 using the dataset with at least 8 months' follow-up: 94.7 (87.3, 102.4)
Median % PD-1receptor occupancy on circulating CD4+ T cells (IQR) at day 29 using the dataset with at least 8 months' follow-up: 98.3 (85.6, 106.1)
Median % PD-1receptor occupancy on circulating CD4+ T cells (IQR) at day 29 using the dataset with at least 8 months' follow-up: 93.1 (84.1, 100.1)
Median % PD-1 receptor occupancy on circulating CD8+ T cells (IQR) at day 29 using the dataset with at least 8 months' follow-up: 96.8 (84.5, 103.7)
|
Herrera, 202129 | Avelumab IV (1-hour infusion). Arms:
| Terminal half-life reported in days (convert to hours): Cycle 1 Day 1 (geo mean, CV%)
Cycle 2 Day 1 (geo mean, CV%)
| Cycle 1 Day 1: AUCtau (h × mcg/mL), geo mean (CV%)
Cmax (mcg/mL), geo mean (CV%)
Cycle 2 Day 1: AUCtau (h × mcg/mL), geo mean (CV%)
Cmax (mcg/mL), geo mean (CV%)
Ctrough (mcg/mL), geo mean (CV%) at Cycle 2 Day 1
|
Nonrandomized studies | |||
Cohen, 202463 |
| NR |
|
Rischin, 202439 |
| NR | Observed steady-state Ctrough or Cmin: Groups 1 and 2 (3 mg/kg q.2.w.): 68.4 mg/L mean (SD 26.1), median 72.0 (IQR 49.9 to 80.8), n = 96; Group 3 (350 mg q.3.w.): 62.7 mg/L mean (SD 28.3), median 65.3 (IQR 44.3 to 77.3), n = 34. Observed steady-state Cmax: Groups 1 and 2: 150 mg/L mean (SD 79.0), median 141 (IQR 113 to 162), n = 96; Group 3: 151 mg/L mean (SD 46.2), median 165 (IQR 129 to 181), n = 33. AUC: not directly reported for this fixed vs. weight-based comparison. |
Fujiwara, 202242 |
| NR | Reported as geometric mean (GMean) with geometric CV% (plus min/median/max) in the PK table. Units: AUC0–t in day × mcg/mL; concentrations in mcg/mL; times in days. Combination multiple dosing: tremelimumab PK
|
Patnaik, 202246 | Part 1 — Weight-Based Dose Escalation Arms
Part 2A — Fixed-Dose Arms
| Part 1 - weight-based dosing cohort (n = 21)
Part 2A- fixed-dose regimen cohort (n = 13)
1,000 mg q.6.w. (n = 7): t½: 19.6 (21.9) days | Part 1 - weight-based dosing cohort (n = 21) Cycle 1 PK parameters, Geometric mean (CV %)
AUC0–∞: 4,440 to 9,570 mcg × h/mL; AUC0–tau: 3,417 (31.7) mcg × h/mL; Cmax: 21.78 (25.6) mcg/mL; Tmax: 2.92 (1.52 to 2.95) h; Ctrough: 6.382 (35.9) mcg/mL; CL: 0.336 to 0.367 L/day; Vz: 3.97 to 7.50 L; Vss: 4.12 to 7.29 L
AUC0–∞: 5,872 (93.3) mcg × h/mL; AUC0–tau: 4,219 (63.8) mcg × h/mL; Cmax: 20.43 (17.7) mcg/mL; Tmax (median [range]): 1.50 (0.55 to 1.50) h; Ctrough: 2.622 (148.4) mcg/mL; CL: 0.326 (64.8) L/day; Vz: 6.84 (7.6) L; Vss: 6.73 (17.8) L
AUC0–∞: 26,630 (9.4) mcg × h/mL; AUC0–tau: 10,790 (9.7) mcg × h/mL; Cmax: 66.17 (9.6) mcg/mL; Tmax (median [range]): 1.52 (1.50 to 2.95) h; Ctrough: 23.70 (8.9) mcg/mL; CL: 0.189 (33.5) L/day; Vz: 5.20 (33.5) L; Vss: 5.11 (32.1) L
AUC0–∞: 59,830 (26.7) mcg × h/mL; AUC0–tau: 36,480 (24.4) mcg × h/mL; Cmax: 228.4 (22.2) mcg/mL; Tmax (median [range]): 1.52 (1.50 to 3.07) h; Ctrough: 60.63 (34.7) mcg/mL; CL: 0.302 (22.3)L/day; Vz: 4.43 (18.3) L; Vss: 4.33 (19.8) L
AUC0–∞: 101,900 (35.8) mcg × h/mL; AUC0–tau: 63,670 (28.2) mcg × h/mL; Cmax: 251.1 (19.2) mcg/mL; Tmax (median [range]): 1.50 (1.43 to 3.12) h; Ctrough: 53.15 (35.0) mcg/mL; CL: 0.160 (13.6) L/day; Vz: 4.73 (14.2) L; Vss: 4.57 (14.0) L Part 2A- fixed-dose regimen cohort (n = 13)
AUC0–∞: 55,510 (24.2) mcg × h/mL; AUC0–tau: 35,730 (20.2) mcg × h/mL; Cmax: 171.1 (20.0) mcg/mL; Tmax (median [range]): 0.96 (0.50 to 3.02) h; Ctrough: 39.17 (26.7) mcg/mL; CL: 0.216 (24.2) L/day; Vz: 4.51 (20.5) L; Vss: 4.38 (18.0) L
AUC0–∞: 113,500 (34.4) mcg × h/mL; AUC0–tau): 95,820 (29.3) mcg × h/mL; Cmax: 309.4 (30.8) mcg/mL; Tmax (median [range]): 1.52 (0.52 to 3.00) h; Ctrough: 40.20 (51.1) mcg/mL; CL: 0.212 (34.4) L/day; Vz: 5.97 (31.9) L; Vss: 5.77 (29.8) L Part 1 - weight-based dosing cohort (n = 21) Receptor Occupancy (RO): Full PD-1 receptor occupancy was achieved across all dose levels. Mean minimum concentration for full RO: 2.44 mcg/mL 1 patient (1 mg/kg) did not achieve full RO by Day 22 (1.51 mcg/mL), partly due to antidrug antibodies Part 2A- fixed dose regimen cohort (n = 13) Receptor Occupancy (RO): Both fixed-dose regimens achieved full PD-1 receptor occupancy over the dosing cycle. IL-2 functional assays confirmed full functional RO. |
Juergens, 202048 | Durvalumab:
Tremelimumab:
| NR | Units: mcg/mL Durvalumab (mean [SD]) — Cmax/Ctrough:
Tremelimumab (mean [SD]) — Cmax/Ctrough:
|
Kato, 202049 |
| NR |
Mean (SD) trough concentrations (Cmin) before cycles 2 to 5 of nivolumab Cmin1: 14.2 (1.9) Cmin2: 21.5 (2.4) Cmin3: 33.0 (4.6) Cmin4: 31.4 (4.1)
Mean (SD) trough concentrations (Cmin) before cycles 2 to 5 of nivolumab Cmin1: 27.5 (2.4) Cmin2: 43.3 (4.2) Cmin3: 57.9 (7.0) Cmin4: 58.6 (8.8)
Mean (SD) trough concentrations (Cmin) before cycles 2 to 5 of nivolumab Cmin1: P value < 0.01 Cmin2: P value < 0.01 Cmin3: P value = 0.01 Cmin4: P value = 0.02 |
PK/PD modelling or simulation studies | |||
Lala, 202564 | Pembrolizumab IV (simulated regimens):
| NR | C trough Group 1: 200 mg q.3.w.
Group 2: 400 mg q.6.w.
Group 3: 2 mg/kg q.3.w.
Group 4: 4 mg/kg q.6.w. (alternative regimen)
AUC Group 1: 200 mg q.3.w.
Group 2: 400 mg q.6.w.
Group 3: 2mg/kg q.3.w.
Group 4: 4 mg/kg q.6.w. (alternative regimen)
Overall (n = 3,607): Geometric mean (95% CI), ug/mL = 1,301 (1,285 to 1,317); 5th to 95th percentile = 676 to 2,299; 1st to 99th percentile = 498 to 2,757
|
Gandhi, 202453 |
|
|
|
Zhao, 202462 |
| NR | 3 mg/kg IV q.2.w.: Cmin-d28 27.5 mcg/mL, Cmax1 40.4 mcg/mL, Cavgd28 57.9 mcg/mL. 10 mg/kg IV q.2.w.: Cmin-d28 91.6 mcg/mL, Cmax1 135 mcg/mL, Cavgd28 193 mcg/mL. 720 mg SC q.4.w.: Cmin-d28 24.3 mcg/mL, Cmax1 39.4 mcg/mL, Cavgd28 55.8 mcg/mL. 960 mg SC q.4.w.: Cmin-d28 32.4 mcg/mL, Cmax1 52.5 mcg/mL, Cavgd28 74.4 mcg/mL. 1,200 mg SC q.4.w.: Cmin-d28 40.5 mcg/mL, Cmax1 65.6 mcg/mL, Cavgd28 93.0 mcg/mL. AUC was not directly reported in the main paper; Cavgd28 was used instead as the 28-day exposure summary. The paper states that SC dosing had reduced and delayed Cmax vs. IV, with peak concentrations occurring by about 7 days, and that 960 mg and 1,200 mg SC q.4.w. generally produced higher Cavgd28 and Cmin-d28 than 3 mg/kg IV q.2.w., while remaining less than 10 mg/kg IV q.2.w. |
Hwang, 202365 | Pooled population PK modelling of tremelimumab given IV as monotherapy and in combination with durvalumab across multiple phase I to 3 solid-tumour studies. Dosing regimens included weight-based (e.g., 1/3/10 mg/kg q.4.w.) and flat dose (e.g., 750 mg q.4.w. monotherapy; 75 mg q.4.w. combination). Maintenance schedules in some trials included q.12.w. after initial q.4.w. dosing. Objective was to evaluate the adequacy of exposure coverage when converting 1 mg/kg to a flat dose of 75 mg. | ~18 days ≈ 432 hour (variability not reported). | Figures show reported/used exposure metrics include cycle 1 Cmin and Cmax (by dose group) and model-based exposure comparisons for 75 mg vs. 1 mg/kg using average exposure over the first 16 weeks (overlap proportions). Specific numeric Cmin/Cmax/AUC values were not consistently presented as a single summary in the extracted sections.) Exposure overlap (simulation-based):
Study concluded that a flat dose (75 mg) was projected to provide comparable exposure to weight-based dosing (1 mg/kg) in adults. |
Ter Heine, 202359 | Reference dosing regimen:
Alternative dosing regimens:
| NR | Ratios of the alternative ICI dose regimen to the reference ICI dose regimen for the following metrics Atezolizumab (q.3.w.):
Durvalumab (q.2.w.):
Durvalumab (q.4.w.):
Ipilimumab (q.6.w.):
Nivolumab (q.2.w.):
Nivolumab (q.3.w.):
Pembrolizumab (q.3.w.):
|
Masters, 202251 |
| NR | Exposure metrics evaluated after single dose and at steady state: AUC, Cmax, Ctrough (and Cavg,ss in simulations). Units shown: AUCtau,ss (mg × h/L); Cmax,ss (mcg/mL); Ctrough,ss (mcg/mL). Numeric mean/CV% for Cmin/Cmax/AUC are not tabulated in text (presented mainly as boxplots/distributions). |
Paccaly, 202161 |
| Not reported in hours. Reported as: t½ after first dose = 12.5 days; t½ at steady state = 19.2 days. Converting to hours: 300 hour and 460.8 hour. These half-lives are overall cemiplimab PK parameters from the final PopPK model, not arm-specific. | After first dose: 3 mg/kg q.2.w.: Cmax 69.5 mg/L, Ctrough 18.9 mg/L, AUC0–6wk 1,880 day × mg/L; 350 mg q.3.w.: Cmax 107 mg/L, Ctrough 20.4 mg/L, AUC0–6wk 2,050 day × mg/L. At steady state: 3 mg/kg q.2.w.: Cmax,ss 135 mg/L, Ctrough,ss 65.7 mg/L, AUC6wk,ss 3,710 day × mg/L; 350 mg q.3.w.: Cmax,ss 166 mg/L, Ctrough,ss 58.7 mg/L, AUC6wk,ss 3,800 day × mg/L. Authors conclude exposures were similar at steady state. |
Sanghavi, 202156 |
| NR | 3 mg/kg q.2.w.: Cmin1 24.7 mcg/mL; Cmin-d28 42.8 mcg/mL; Cminss 95.6 mcg/mL; Cmax1 69.5 mcg/mL; Cmaxss 169 mcg/mL; Cavgd28 45 mcg/mL; Cavg1 34.4 mcg/mL; Cavgss 118 mcg/mL. 240 mg q.2.w.: Cmin1 25.0 mcg/mL; Cmin-d28 43.3 mcg/mL; Cminss 96.8 mcg/mL; Cmax1 70.6 mcg/mL; Cmaxss 171 mcg/mL; Cavgd28 45.6 mcg/mL; Cavg1 34.9 mcg/mL; Cavgss 119 mcg/mL. 480 mg q.4.w.: Cmin1 36.6 mcg/mL; Cmin-d28 36.6 mcg/mL; Cminss 81.8 mcg/mL; Cmax1 141 mcg/mL; Cmaxss 227 mcg/mL; Cavgd28 56.4 mcg/mL; Cavg1 56.4 mcg/mL; Cavgss 119 mcg/mL |
Sheng, 202154 |
| NR | Geomtric mean (CV %) reported for the following metrics: Group 1: Chinese 3 mg/kg q.2.w. (n = 294)
Group 2: Chinese 240 mg q.2.w. (n = 314)
Group 3: Global patients 10mg/kg q.2.w. (n = 148)
Difference in Geometric Mean (%) 240 mg q.2.w. vs. 3 mg/kg q.2.w. (Group 2 vs. Group 1):
Difference in Geometric Mean (%) 240 mg q.2.w. vs. 10 mg/kg q.2.w. (Group 2 vs. Group 3):
|
Yang, 202160 | Cemiplimab weight-based
fixed
| Elimination half-life reported as mean 22.7 days (responders) vs. 18.7 days (others) at steady state → ~544.8 hour vs. ~448.8 hour, respectively. | Cmin (Ctrough,ss) and AUC6wk,ss reported by body weight quartiles for 3 mg/kg q.2.w. and 350 mg q.3.w. Weight quartiles, kg: Q1 (30.9, 65.5), Q2 (65.5, 76.2), Q3 (76.2, 88.5), Q4 (88.5, 172) Summary across quartiles: 3 mg/kg q.2.w.: Mean AUC6wk,ss (SD) day × mg/L:
Mean Ctrough,ss (SD) mg/L
350 mg q.3.w.: Mean AUC6wk,ss (SD) day × mg/L:
Mean Ctrough,ss (SD) mg/L
Cmax: not numerically reported in the extracted tables (figure shows Cmax conceptually). |
Bei, 202057 |
| NR | Group 1: 3 mg/kg q.2.w.
Group 2: 240 mg q.2.w.
% Difference (240 mg q.2.w. vs. 3 mg/kg q.2.w.): Cavgd28: 37.2; Cmin-d28: 37.6; Cmax1: 37.6 |
Lala, 202058 | Pembrolizumab Fixed:
Weight-based:
| NR | Absolute values/units not reported; results are presented as % differences and described as based on geometric means from simulations. Key comparisons for 400 mg q.6.w. vs. 200 mg q.3.w.: Cavg,ss (AUCss) + 0.7%; Cmin,ss −34%; Cmax,ss + 59%; Cavg,wk6 + 16%; Cmin,wk6 − 41%; Cmax,wk6 + 108%. Key comparisons for 400 mg q.6.w. vs. 2 mg/kg q.3.w.: Cavg,ss + 35%; Cmin,ss −12%; Cmax,ss + 113%; Cavg,wk6 + 56%; Cmin,wk6 − 21%; Cmax,wk6 + 179% Key comparisons for 400 mg q.6.w. vs. 10 mg/kg q.2.w. (safety bound; only Cavg and Cmax shown): Cavg,ss −81.8%; Cmax,ss −65.6%; Cavg,wk6 −77.5%; Cmax,wk6 − 44.1%. AUC integrated over 42 days (trapezoidal), Cmin at end of interval (day 42 early; day 210 ss), Cmax at end of infusion (30 minutes after the dose; day 1 early; day 169 ss). |
Novakovic, 202052 |
| NR | Paper reports simulation/analysis of Ctrough, Cmax, AUC0–tau (tau = 336 hours) after single dose (first-cycle model) and multiple dose (steady-state model). Numeric AUC0–336h (mg × h/L), first dosing interval: Overall (N = 1,663): 10 mg/kg: 23,160 (range: 7,438 to 51,742) vs. 800 mg: 25,913 (range: 5,689 to 54,763). Weight Q1 (30.4 to ≤ 60.0 kg) [n = 415]: 10 mg/kg: 19,102 (8,271 to 36,965); 800 mg: 29,418 (14,191 to 54,763) Weight Q2 (60.0 to ≤ 60.0 kg) [n = 404]: 10 mg/kg: 22,221 (9,057 to 35,556); 800 mg: 27,170 (10,893 to 45,739) Weight Q3 (70.6 to ≤ 84.6 kg) [n = 435]: 10 mg/kg: 24,720 (12,970 to 51,742); 800 mg: 25,280 (13,627 to 51,103) Weight Q4 (84.4 to ≤ 204 kg) [n = 409]: 10 mg/kg: 27,681 (7,438 to 44,938); 800 mg: 22,583 (5,689 to 38,309) Variability AUC0–336h CV%): 27.1% (800 mg) vs. 29.0% (10 mg/kg). |
Zhao, 202055 |
| NR | Steady state (geometric mean [CV%],ug/mL):
After the first dose (geometric mean [CV%], ug/mL):
Over the first 28 days (geometric mean [CV%], ug/mL):
Difference between 3 mg/kg q.2.w. and 240 mg q.2.w., %:
Difference between 3 mg/kg q.2.w. and 480 mg q.4.w., %:
|
AUC = area under the concentration–time curve; AUC0–∞ = area under the curve from time 0 to infinity; AUC0–tau = area under the curve over one dosing interval (tau); AUC0–t = area under the curve from time 0 to last measurable time point; AUC6wk,ss = area under the curve over 6 weeks at steady state; AUCss = area under the curve at steady state; AUCtau = area under the curve over the dosing interval (tau); AUCtau,ss = area under the curve over the dosing interval at steady state; CL = clearance; CR = complete response; CSCC = cutaneous squamous cell carcinoma; CTCAE = Common Terminology Criteria for Adverse Events; Cavg = Average (Mean) Concentration; Cavg1 = average concentration after first dose or first cycle (study-defined); Cavgd28 = average concentration over 28 days; Cavgss = average concentration at steady state; Cavg,wk6 = average concentration over week 6 (study-defined window); Cmax = Maximum Concentration; Cmax1 = maximum concentration after first dose or first cycle; Cmaxss = maximum concentration at steady state; Cmin = Minimum (Trough) Concentration; Cmin,1 = minimum concentration after first dose or first cycle (study-defined); Cmin1 = minimum concentration after first dose or first cycle; Cmin-d28 = minimum concentration over 28 days (study-defined); Cminss = minimum (trough) concentration at steady state; Ctrough = trough concentration; Ctrough,ss = trough concentration at steady state; CV = coefficient of variation; DL = dose level; DLT = dose-limiting toxicity; ICI = immune checkpoint inhibitor; NSCLC = Non–Small Cell Lung Cancer; ORR = objective response rate; OS = overall survival; PD = Pharmacodynamics; PK = Pharmacokinetics; PK/PD = Pharmacokinetics/Pharmacodynamics; PK/PDy = pharmacokinetics and pharmacodynamics (as labelled in study); PopPK = population pharmacokinetic; PR = partial response; q.2.w. = every 2 weeks; q.3.w. = every 3 weeks; q.4.w. = every 4 weeks; q.6.w. = every 6 weeks; q.12.w. = every 12 weeks; RAC = accumulation ratio; RCT = randomized controlled trial; RECIST = Response Evaluation Criteria in Solid Tumours; rHuPH20 = recombinant human hyaluronidase PH20; SC = subcutaneous; SD = Stable Disease; STRIDE = Single Tremelimumab Regular Interval Durvalumab (regimen name); Tmax = time to maximum concentration; vs. = versus; Vss = volume of distribution at steady state; Vz = volume of distribution during terminal phase; WAT = weight-adjusted therapy (study-defined); irRECIST = Immune-Related Response Evaluation Criteria in Solid Tumours; t½ = elimination half-life.
Appendix 5: List of Included Studies
Please note that this appendix has not been copy-edited.
Study | Citation |
|---|---|
Review articles | |
Hoyek, 2025 | Hoyek C, Zheng-Lin B, Bauernfeind JJ, et al. Overcoming Financial and Access Barriers in Global Cancer Care With Low-Dose Immunotherapy: A Systematic Review. JCO Glob Oncol. 2025;11:e2400409. |
Tan, 2025 | Tan Z, Voller S, Sancho-Araiz A, Knibbe CAJ, Moes D. A Systematic Evaluation of the Dosing Regimens for Approved Targeted Therapies and Immune Checkpoint Inhibitors in Metastatic Renal Cell Carcinoma From a Project OPTIMUS Perspective. J Clin Pharmacol. 2025;02:02. |
Mao, 2024 | Mao YT, Wang Y, Chen XX, Liu CJ, Bao Q. Comparative severe dermatologic toxicities of immune checkpoint inhibitors in malignant melanoma: A systematic review and network meta-analysis. J. 2024;23(4):1165-1177. |
Hong, 2023 | Hong B, Zheng J, Chen R, et al. Pulmonary Toxicity Associated with Immune Checkpoint Inhibitors-Based Therapy: Current Perspectives and Future Directions. Drug Saf. 2023;46(12):1313-1322. |
Li, 2023 | Li Y, Liang X, Li H, Chen X. Comparative efficacy and safety of immune checkpoint inhibitors for unresectable advanced melanoma: A systematic review and network meta-analysis. Int Immunopharmacol. 2023;115:109657. |
Wesevich, 2023 | Wesevich A, Goldstein DA, Paydary K, Peer CJ, Figg WD, Ratain MJ. Interventional pharmacoeconomics for immune checkpoint inhibitors through alternative dosing strategies. Br J Cancer. 2023;129(9):1389-96. |
Jiang, 2022 | Jiang M, Hu Y, Lin G, Chen C. Dosing Regimens of Immune Checkpoint Inhibitors: Attempts at Lower Dose, Less Frequency, Shorter Course. Front Oncol. 2022;12:906251 |
Lee, 2020 | Lee A, Duggan S, Deeks ED. Cemiplimab: A Review in Advanced Cutaneous Squamous Cell Carcinoma. Drugs. 2020;80(8):813-819. |
Sehghal, 2020 | Sehgal K, Costa DB, Rangachari D. Extended-Interval Dosing Strategy of Immune Checkpoint Inhibitors in Lung Cancer: Will it Outlast the COVID-19 Pandemic? Front. 2020;10:1193. |
Randomized controlled trials | |
Albiges, 2024 | Albiges L, Bourlon MT, Chacon M, et al. Subcutaneous versus intravenous nivolumab for renal cell carcinoma. Ann Oncol. 2025;36(1):99-107. |
Herrera, 2021 | Herrera AF, Burton C, Radford J, et al. Avelumab in relapsed/refractory classical Hodgkin lymphoma: phase 1b results from the JAVELIN Hodgkins trial. Blood Adv. 2021;5(17):3387-3396. |
Nonrandomized studies | |
Campo Le Brun, 2025 | Le Brun IC, Dalle S, Mortier L, et al. Methods of nivolumab administration in advanced melanoma: A comparison of patients' clinical outcomes treated with flat dose or weight-adjusted dose, a multicenter observational study. Cancer. 2025;131(1):e35679. |
Horisaki, 2025 | Horisaki K, Yoshikawa S, Omata W, Tsutsumida A, Kiyohara Y. The Real-World Efficacy and Side Effects of Different Nivolumab Regimens in Japanese Patients with Advanced Melanoma: A Single-Center Retrospective Study. Cancers (Basel). 2025;17(14):10. |
Hughes, 2025 | Hughes BGM, Guminski A, Bowyer S, et al. A phase 2 open-label study of cemiplimab in patients with advanced cutaneous squamous cell carcinoma (EMPOWER-CSCC-1): Final long-term analysis of groups 1, 2, and 3, and primary analysis of fixed-dose treatment group 6. J Am Acad Dermatol. 2025;92(1):68-77. |
Smeenk, 2025 | Smeenk MM, van der Noort V, Hendrikx JMA, Abedian Kalkhoran H, Smit EF, Theelen W. Pembrolizumab hybrid dosing is non-inferior to flat dosing in advanced non–small cell lung cancer: a real-world, retrospective bicenter cohort study. J Immunother Cancer. 2025;13(2):06. |
Staender, 2025 | Staender HF, Langan EA. Fixed-Dose vs. Weight-Adapted Immune Checkpoint Inhibitor Therapy in Melanoma: A Retrospective Monocentric Analysis of Efficacy and Immune-Related Adverse Events. Cancers (Basel). 2025;17(7):28. |
Chaitesipaseut, 2024 | Chaitesipaseut L, Shah N, Truong TG, et al. Outcomes of weight-based vs. fixed dose of Pembrolizumab among patients with non–small cell lung cancer. J Oncol Pharm Pract. 2024;30(8):1352-1357. |
Cohen, 2024 | Cohen G, Rapoport B, Chan SW, et al. Pembrolizumab 400 mg every 6 weeks as first-line therapy for advanced melanoma (KEYNOTE-555): Results from cohort B of an open-label, phase 1 study. PLoS ONE. 2024;19(11):e0309778. |
Grit, 2024 | Grit GF, van Geffen E, Malmberg R, et al. Real-world overall survival after alternative dosing for pembrolizumab in the treatment of non–small cell lung cancer: A nationwide retrospective cohort study with a non-inferiority primary objective. Lung Cancer. 2024;196:107950. |
Leroy, 2024 | Leroy, M., Desmedt, E., Deramoudt, L., Vasseur, M., Odou, P., Béhal, H., ... and Simon, N. (2024). Retrospective comparison of a weight-based dose every 2 weeks with a fixed dose every month: a real-life analysis of nivolumab in the treatment of advanced melanoma. Melanoma Research, 34(3), 258-264. |
Patel, 2024 | Patel A, Hande V, Mr K, et al. Effectiveness of Immune Checkpoint Inhibitors in Various Tumor Types Treated by Low, Per-Weight, and Conventional Doses at a Tertiary Care Center in Mumbai. JCO Glob Oncol. 2024;10:e2300312. |
Rischin, 2024 | Rischin D, Hughes BGM, Basset-Seguin N, et al. High response rate with extended dosing of cemiplimab in advanced cutaneous squamous cell carcinoma. J Immunother Cancer. 2024;12(3):11. |
Berard, 2023 | Berard G, Guevremont C, Marcotte N, Schroeder C, Bouchard N, Rajan R. Descriptive Analysis of First-Line Non-Small Cell Lung Cancer Treatment with Pembrolizumab in Tumors Expressing PD-L1 ≥ 50% in Patients Treated in Quebec's University Teaching Hospitals (DALP-First Study). Curr. 2023;30(3):3251-3262. |
Samlowski, 2023 | Samlowski W, Robert NJ, Chen L, et al. Real-World nivolumab dosing patterns and safety outcomes in patients receiving adjuvant therapy for melanoma. Cancer Med. 2023;12(3):2378-2388. |
Fujiwara, 2022 | Fujiwara Y, Takahashi Y, Okada M, et al. Phase I Study of Tremelimumab Monotherapy or in Combination With Durvalumab in Japanese Patients With Advanced Solid Tumors or Malignant Mesothelioma. Oncologist. 2022;27(9):e703-e722. |
Hijmering-Kappelle, 2022 | Hijmering-Kappelle LBM, Hiltermann TJN, Bensch F. Safety and Efficacy of Extended Interval Dosing for Immune Checkpoint Inhibitors in Non-Small Cell Lung Cancer During the COVID-19 Pandemic. Clin Lung Cancer. 2022;23(2):143-150. |
Iikura, 2022 | Iikura Y, Aoyama T, Hiraide M, et al. Safety evaluation of fixed-dose nivolumab in patients with gastric cancer. Health Sci Rep. 2022;5(4):e673. |
Okada, 2022 | Okada T, Fushimi C, Matsuki T, et al. Comparison of Dosage of Nivolumab in Efficacy and Safety for Recurrent Metastatic Squamous Cell Carcinoma. Anticancer Res. 2022;42(3):1607-1613. |
Patnaik, 2022 | Patnaik A, Weiss GJ, Rasco DW, et al. Safety, antitumor activity, and pharmacokinetics of dostarlimab, an anti-PD-1, in patients with advanced solid tumors: a dose-escalation phase 1 trial. Cancer Chemother Pharmacol. 2022;89(1):93-103. |
To, 2022 | To SY, Kao LT, Shih JH, et al. Modified-Dose Pembrolizumab and Prognostic Outcomes among Non-Small Cell Lung Cancer Patients: A Chart Review Study. Int J Environ Res Public Health. 2022;19(10):15. |
Juergens, 2020 | Juergens RA, Hao D, Ellis PM, et al. A phase IB study of durvalumab with or without tremelimumab and platinum-doublet chemotherapy in advanced solid tumours: Canadian Cancer Trials Group Study IND226. Lung Cancer. 2020;143:1-11. |
Kato, 2020 | Kato R, Ikarashi D, Matsuura T, et al. Analyses of Nivolumab Exposure and Clinical Safety Between 3-mg/kg Dosing and 240-mg Flat Dosing in Asian Patients with Advanced Renal Cell Carcinoma in the Real-World Clinical Setting. Transl Oncol. 2020;13(6):100771. |
Rischin, 2020 | Rischin D, Migden MR, Lim AM, et al. Phase 2 study of cemiplimab in patients with metastatic cutaneous squamous cell carcinoma: primary analysis of fixed-dosing, long-term outcome of weight-based dosing. J Immunother Cancer. 2020;8(1):06. |
PK/PD modelling or simulation studies | |
Lala, 2025 | Lala M, Bardia A, Calles A, et al. Weight-Based Pembrolizumab Dosing at 4 mg/kg Every 6 Weeks Leads to Exposures Below Approved Doses with Unestablished Efficacy: A Pharmacokinetic Model-Based Simulation Analysis. Target Oncol. 2025;20(6):955-965. |
Gandhi, 2024 | Gandhi KA, Shirsat A, Hj SK, et al. Pharmacokinetics and clinical outcomes of low-dose nivolumab relative to conventional dose in patients with advanced cancer. Cancer Chemother Pharmacol. 2024;94(5):659-668. |
Zhao, 2024 | Zhao Y, Sanghavi K, Roy A, et al. Model-Based Dose Selection of Subcutaneous Nivolumab in Patients with Advanced Solid Tumors. Clin Pharmacol Ther. 2024;115(3):488-497. |
Hwang, 2023 | Hwang M, Chia YL, Zheng Y, et al. Population pharmacokinetic modelling of tremelimumab in patients with advanced solid tumours and the impact of disease status on time-varying clearance. Br J Clin Pharmacol. 2023;89(5):1601-1616. |
Ter Heine, 2023 | Ter Heine R, van den Heuvel MM, Piet B, et al. A Systematic Evaluation of Cost-Saving Dosing Regimens for Therapeutic Antibodies and Antibody-Drug Conjugates for the Treatment of Lung Cancer. Target. 2023;18(3):441-450. |
Masters, 2022 | Masters JC, Khandelwal A, di Pietro A, Dai H, Brar S. Model-informed drug development supporting the approval of the avelumab flat-dose regimen in patients with advanced renal cell carcinoma. CPT Pharmacometrics Syst Pharmacol. 2022;11(4):458-468. |
Paccaly, 2021 | Paccaly AJ, Migden MR, Papadopoulos KP, et al. Fixed Dose of Cemiplimab in Patients with Advanced Malignancies Based on Population Pharmacokinetic Analysis. Adv Ther. 2021;38(5):2365-2378. |
Sanghavi, 2021 | Sanghavi, K., Vuppala, P., Ivaturi, V., Hamuro, L., Roy, A., and Suryawanshi, S. (2021). Nivolumab exposure–response analysis for adjuvant treatment of melanoma supporting a change in posology. CPT: Pharmacometrics and Systems Pharmacology, 10(7), 748-759. |
Sheng, 2021 | Sheng J, Zhang J, Baudelet C, Roy A. Clinical Benefit-Risk Assessment of Nivolumab 240 mg Every 2 Weeks in Chinese Patients With Advanced and Metastatic Solid Tumors. J Clin Pharmacol. 2021;61(8):1045-1053. |
Yang, 2021 | Yang F, Paccaly AJ, Rippley RK, Davis JD, DiCioccio AT. Population pharmacokinetic characteristics of cemiplimab in patients with advanced malignancies. J Pharmacokinet Pharmacodyn. 2021;48(4):479-494. |
Bei, 2020 | Bei D, Osawa M, Uemura S, et al. Benefit-risk assessment of nivolumab 240 mg flat dose relative to 3 mg/kg Q2W regimen in Japanese patients with advanced cancers. Cancer Sci. 2020;111(2):528-535. |
Lala, 2020 | Lala M, Li TR, de Alwis DP, et al. A six-weekly dosing schedule for pembrolizumab in patients with cancer based on evaluation using modelling and simulation. Eur J Cancer. 2020;131:68-75. |
Novakovic, 2020 | Novakovic AM, Wilkins JJ, Dai H, et al. Changing Body Weight-Based Dosing to a Flat Dose for Avelumab in Metastatic Merkel Cell and Advanced Urothelial Carcinoma. Clin Pharmacol Ther. 2020;107(3):588-596. |
Zhao, 2020 | Zhao X, Shen J, Ivaturi V, et al. Model-based evaluation of the efficacy and safety of nivolumab once every 4 weeks across multiple tumor types. Ann Oncol. 2020;31(2):302-309. |
Appendix 6: List of Excluded Studies
Please note that this appendix has not been copy-edited.
Reason for exclusion | Citation |
|---|---|
Ineligible immune checkpoint inhibitor |
|
Ineligible outcomes |
|
Ineligible population |
|
Ineligible study design |
|
Irrelevant comparator |
|
Not full publication |
|
Appendix 7: PRISMA Checklist
Please note that this appendix has not been copy-edited.
Section and topic | Item # | Checklist item | Location where item is reported |
|---|---|---|---|
TITLE | |||
Title | 1 | Identify the report as a systematic review. | Page 1 |
ABSTRACT | |||
Abstract | 2 | Refer to the PRISMA 2020 for Abstracts checklist. | Page 2 |
INTRODUCTION | |||
Rationale | 3 | Describe the rationale for the review in the context of existing knowledge. | Page 8 |
Objectives | 4 | Provide an explicit statement of the objective(s) or question(s) the review addresses. | Page 9 |
METHODS | |||
Eligibility criteria | 5 | Specify the inclusion and exclusion criteria for the review and how studies were grouped for the syntheses. | Page 10 and 11 |
Information sources | 6 | Specify all databases, registers, websites, organisations, reference lists and other sources searched or consulted to identify studies. Specify the date when each source was last searched or consulted. | Page 10 |
Search strategy | 7 | Present the full search strategies for all databases, registers and websites, including any filters and limits used. | Page 10 |
Selection process | 8 | Specify the methods used to decide whether a study met the inclusion criteria of the review, including how many reviewers screened each record and each report retrieved, whether they worked independently, and if applicable, details of automation tools used in the process. | Page 12 |
Data collection process | 9 | Specify the methods used to collect data from reports, including how many reviewers collected data from each report, whether they worked independently, any processes for obtaining or confirming data from study investigators, and if applicable, details of automation tools used in the process. | Page 13 |
Data items | 10a | List and define all outcomes for which data were sought. Specify whether all results that were compatible with each outcome domain in each study were sought (e.g., for all measures, time points, analyses), and if not, the methods used to decide which results to collect. | Page 12 |
10b | List and define all other variables for which data were sought (e.g., participant and intervention characteristics, funding sources). Describe any assumptions made about any missing or unclear information. | Page 12 and 13 | |
Study risk-of-bias assessment | 11 | Specify the methods used to assess risk of bias in the included studies, including details of the tool(s) used, how many reviewers assessed each study and whether they worked independently, and if applicable, details of automation tools used in the process. | Page 13 |
Effect measures | 12 | Specify for each outcome the effect measure(s) (e.g., risk ratio, mean difference) used in the synthesis or presentation of results. | Page 13 |
Synthesis methods | 13a | Describe the processes used to decide which studies were eligible for each synthesis (e.g., tabulating the study intervention characteristics and comparing against the planned groups for each synthesis (item #5)). | Page 13 |
13b | Describe any methods required to prepare the data for presentation or synthesis, such as handling of missing summary statistics, or data conversions. | Page 13 | |
13c | Describe any methods used to tabulate or visually display results of individual studies and syntheses. | Page 13 | |
13d | Describe any methods used to synthesize results and provide a rationale for the choice(s). If meta-analysis was performed, describe the model(s), method(s) to identify the presence and extent of statistical heterogeneity, and software package(s) used. | Page 13 | |
13e | Describe any methods used to explore possible causes of heterogeneity among study results (e.g., subgroup analysis, meta-regression). | Page 13 | |
13f | Describe any sensitivity analyses conducted to assess robustness of the synthesized results. | Page 13 | |
Reporting bias assessment | 14 | Describe any methods used to assess risk of bias due to missing results in a synthesis (arising from reporting biases). | NA |
Certainty assessment | 15 | Describe any methods used to assess certainty (or confidence) in the body of evidence for an outcome. | NA |
RESULTS | |||
Study selection | 16a | Describe the results of the search and selection process, from the number of records identified in the search to the number of studies included in the review, ideally using a flow diagram. | Page 13 and 14 |
16b | Cite studies that might appear to meet the inclusion criteria, but which were excluded, and explain why they were excluded. | Page 13 and 14 | |
Study characteristics | 17 | Cite each included study and present its characteristics. | Page 16 and 17 |
Risk of bias in studies | 18 | Present assessments of risk of bias for each included study. | Page 17 to page 20 |
Results of individual studies | 19 | For all outcomes, present, for each study: (a) summary statistics for each group (where appropriate) and (b) an effect estimate and its precision (e.g., confidence/credible interval), ideally using structured tables or plots. | Page 21 to Page 38 |
Results of syntheses | 20a | For each synthesis, briefly summarize the characteristics and risk of bias among contributing studies. | Page 21 to Page 38 |
20b | Present results of all statistical syntheses conducted. If meta-analysis was done, present for each the summary estimate and its precision (e.g., confidence/credible interval) and measures of statistical heterogeneity. If comparing groups, describe the direction of the effect. | Page 21 to Page 38 | |
20c | Present results of all investigations of possible causes of heterogeneity among study results. | Page 21 to Page 38 | |
20d | Present results of all sensitivity analyses conducted to assess the robustness of the synthesized results. | Page 21 to Page 38 | |
Reporting biases | 21 | Present assessments of risk of bias due to missing results (arising from reporting biases) for each synthesis assessed. | NA |
Certainty of evidence | 22 | Present assessments of certainty (or confidence) in the body of evidence for each outcome assessed. | NA |
DISCUSSION | |||
Discussion | 23a | Provide a general interpretation of the results in the context of other evidence. | Page 38 to 51 |
23b | Discuss any limitations of the evidence included in the review. | Page 38 | |
23c | Discuss any limitations of the review processes used. | Page 38 | |
23d | Discuss implications of the results for practice, policy, and future research. | Page 38 | |
OTHER INFORMATION | |||
Registration and protocol | 24a | Provide registration information for the review, including register name and registration number, or state that the review was not registered. | Page 9 |
24b | Indicate where the review protocol can be accessed, or state that a protocol was not prepared. | Page 9 | |
24c | Describe and explain any amendments to information provided at registration or in the protocol. | Page 9 | |
Support | 25 | Describe sources of financial or non-financial support for the review, and the role of the funders or sponsors in the review. | Page156 |
Competing interests | 26 | Declare any competing interests of review authors. | Page 156 |
Availability of data, code and other materials | 27 | Report which of the following are publicly available and where they can be found: template data collection forms; data extracted from included studies; data used for all analyses; analytic code; any other materials used in the review. | Page 156 |
From: Page MJ, McKenzie JE, Bossuyt PM, Boutron I, Hoffmann TC, Mulrow CD, et al. The PRISMA 2020 statement: an updated guideline for reporting systematic reviews. BMJ 2021;372:n71. doi: 10.1136/bmj.n71. This work is licensed under CC BY 4.0. To view a copy of this license, visit https://creativecommons.org/licenses/by/4.0/
Appendix 8: Overlap Between Flagged Systematic Reviews
Please note that this appendix has not been copy-edited.
Table 18: Overlap in Relevant Primary Studies Between Selected Systematic Reviews
Primary Study Ref | Hoyek, 202518 | Tan, 202519 | Mao, 202420 | Hong, 202321 | Li, 202322 | Wesevich, 202323 | Jiang, 202224 | Lee, 202025 | Sehgal, 202026 |
|---|---|---|---|---|---|---|---|---|---|
RCTs | |||||||||
Albiges, 202528 | No | No | No | No | No | No | No | No | No |
Herrera, 202129 | No | No | No | No | No | No | No | No | No |
Nonrandomized studies | |||||||||
Campo Le Brun, 202530 | No | No | No | No | No | No | No | No | No |
Horisaki, 202531 | No | No | No | No | No | No | No | No | No |
Hughes, 202532 | No | No | No | No | No | No | No | No | No |
Smeenk, 202533 | No | No | No | No | No | No | No | No | No |
Staender, 202534 | No | No | No | No | No | No | No | No | No |
Chaitesipaseut, 202435 | No | No | No | No | No | No | No | No | No |
Cohen, 202436 | No | No | No | No | No | No | No | No | No |
Grit, 202437 | No | No | No | No | No | No | No | No | No |
Leroy, 202438 | No | No | No | No | No | No | No | No | No |
Patel, 202439 | No | No | No | No | No | No | No | No | No |
Rischin, 202440 | No | No | No | No | No | No | No | No | No |
Berard, 202341 | No | No | No | No | No | No | No | No | No |
Samlowski,202342 | No | No | No | No | No | No | No | No | No |
Fujiwara, 202243 | No | No | No | No | No | No | No | No | No |
Hijmering-Kappelle et al., 202244 | No | No | No | No | No | No | Yes | No | No |
Iikura, 202245 | No | No | No | No | No | No | No | No | No |
Okada, 202246 | No | No | No | No | No | No | No | No | No |
Patnaik, 202247 | No | No | No | No | No | Yes | No | No | No |
To, 202248 | No | No | No | No | No | No | No | No | No |
Juergens, 202049 | No | No | No | No | No | No | No | No | No |
Kato, 202050 | No | No | No | No | No | No | No | No | No |
Rischin, 202051 | No | No | No | No | No | No | No | Yes | No |
PK/PD modelling or simulation studies | |||||||||
Lala, 202552 | No | No | No | No | No | No | No | No | No |
Gandhi, 202453 | No | No | No | No | No | No | No | No | No |
Zhao, 202454 | No | Yes | No | No | No | No | No | No | No |
Hwang, 202356 | No | No | No | No | No | No | No | No | No |
Ter Heine, 202355 | No | Yes | No | No | No | No | No | No | No |
Masters, 202257 | No | No | No | No | No | No | No | No | No |
Paccaly, 202158 | No | No | No | No | No | Yes | No | No | No |
Sanghavi, 202159 | No | No | No | No | No | No | No | No | No |
Sheng, 202160 | No | No | No | No | No | No | No | No | No |
Yang, 202161 | No | No | No | No | No | No | No | No | No |
Bei, 202065 | No | Yes | No | No | No | No | No | No | No |
Lala, 202062 | No | No | No | No | No | No | Yes | No | Yes |
Novakovic, 202063 | No | No | No | No | No | No | No | No | No |
Zhao, 202064 | No | Yes | No | No | No | No | Yes | No | No |
ISSN: 2563-6596
This work was conducted by the Knowledge Translation Program (KTP) team, with collaborative contributions from the Canadian Cancer Real-world Evaluation (CCRE) Platform, through the Post-Market Drug Evaluation CoLab Network. It was supported by Canada’s Drug Agency (CDA-AMC) and its Post-Market Drug Evaluation Program through funding provided by Health Canada.
CDA-AMC is a pan-Canadian health organization. Created and funded by Canada’s federal, provincial, and territorial governments, we’re responsible for driving better coordination, alignment, and public value within Canada’s drug and health technology landscape. We provide Canada’s health system leaders with independent evidence and advice so they can make informed drug, health technology, and health system decisions, and we collaborate with national and international partners to enhance our collective impact.
CoLab is a pan-Canadian network of experts in applied research, scientific methods, and data analysis. CoLab members work with the Post-Market Drug Evaluation Program to produce credible and timely evidence on postmarket drug safety and effectiveness.
Disclaimer: CDA-AMC has taken care to ensure that the information in this document was accurate, complete, and up to date when it was published, but does not make any guarantee to that effect. Your use of this information is subject to this disclaimer and the Terms of Use at cda-amc.ca.
The information in this document is made available for informational and educational purposes only and should not be used as a substitute for professional medical advice, the application of clinical judgment in respect of the care of a particular patient, or other professional judgments in any decision-making process. You assume full responsibility for the use of the information and rely on it at your own risk.
CDA-AMC does not endorse any information, drugs, therapies, treatments, products, processes, or services. The views and opinions of third parties published in this document do not necessarily reflect those of CDA-AMC. The copyright and other intellectual property rights in this document are owned by the Canadian Agency for Drugs and Technologies in Health (operating as CDA-AMC) and its licensors.
This document is the property of the KTP Team. CDA-AMC has a nonexclusive, limited, royalty-free, worldwide, nontransferable, fully paid-up, and irrevocable license to use the report in support of its objects, mission, and reasonable operational requirements.