CADTH Reimbursement Review
Brolucizumab (Beovu)
Sponsor: Novartis Pharmaceuticals Canada Inc.
Therapeutic area: Diabetic macular edema
This multi-part report includes:
Clinical Review
Pharmacoeconomic Review
Stakeholder Input
Clinical Review
Abbreviations
AE
adverse event
ANOVA
analysis of variance
BCVA
best-corrected visual acuity
CI
confidence interval
CrI
credible interval
CSFT
central subfield thickness
DAA
disease activity assessment
DIC
deviance information criterion
DME
diabetic macular edema
DR
diabetic retinopathy
DRSS
diabetic retinopathy severity scale
ETDRS
Early Treatment Diabetic Retinopathy Study
HRQoL
health-related quality of life
IRF
intraretinal fluid
ITC
indirect treatment comparison
LOCF
last observation carried forward
LS
least squares
MID
minimal important difference
MMRM
mixed model for repeated measures
NEI VFQ-25
National Eye Institute Visual Functioning Questionnaire–25
NMA
network meta-analysis
OCT
optical coherence tomography
RCT
randomized controlled trial
SAE
serious adverse event
SAF
safety analysis set
SD
standard deviation
SRF
subretinal fluid
VEGF
vascular endothelial growth factor
WDAE
withdrawal due to adverse event
Executive Summary
An overview of the submission details for the drug under review is provided in Table 1.
Item | Description |
|---|---|
Drug product | Brolucizumab (Beovu), 6 mg (6 mg/0.05 mL solution) for intravitreal injection |
Indication | For the treatment of DME |
Reimbursement request | As per indication |
Health Canada approval status | NOC |
Health Canada review pathway | Standard review pathway |
NOC date | November 30, 2022 |
Sponsor | Novartis Pharmaceuticals Canada Inc. |
DME = diabetic macular edema; NOC = Notice of Compliance.
Introduction
Diabetic macular edema (DME) is a vision-threatening complication of diabetes mellitus (both type 1 and type 2). The persistent elevation of blood glucose in people with diabetes causes damage to the capillaries, such as those in the eye, resulting in diabetic retinopathy (DR).1 Some patients with DR and especially those with continually poorly managed blood glucose can experience swelling in the retina, known as DME.2 Generally, DME manifests as slowly progressive vision loss. The degree of vision loss can vary considerably and depends on the severity, duration, and location of intraretinal fluid (IRF), among other factors. Signs of DME include blurred vision, retinal hemorrhages, retinal detachment, colours appearing “washed out” or faded, changes in contrast sensitivity, impaired colour vision, gaps in vision (scotomas), and potentially permanent vision loss. Untreated DME is considered to be the leading cause of vision loss, visual disability, and legal blindness in people with DR.2-4 Patients’ health-related quality of life (HRQoL) and daily functioning will be significantly affected, and indirect costs due to lost productivity are high if patients are left untreated.5-7 It has been estimated that there are approximately 60,000 adults with DME in Canada who experience vision impairment requiring treatment.8,9
Current therapies for DME in Canada include non-pharmacological interventions (laser therapy and vitrectomy) and pharmacological interventions (intravitreal anti–vascular endothelial growth factor [VEGF] drugs and intravitreal steroids). Health Canada–approved anti-VEGF drugs for DME treatment include ranibizumab and aflibercept (with bevacizumab used off-label), while approved intravitreal steroids include dexamethasone.
Brolucizumab is a humanized VEGF inhibitor that suppresses endothelial cell proliferation in vitro and reduces neovascularization and vascular permeability.10 On November 30, 2022, brolucizumab was approved by Health Canada for the treatment of DME. The reimbursement criteria for brolucizumab requested by the sponsor are the same as the Health Canada indication. The recommended dose for brolucizumab is 6 mg (0.05 mL) administered by intravitreal injection every 6 weeks for the first 5 doses. Thereafter, the physician may modify treatment intervals based on disease activity, as assessed by visual acuity and/or anatomical parameters. In patients without disease activity, treatment up to every 12 weeks (3 months) could be considered. In patients with disease activity, treatment every 8 weeks (2 months) could be considered; however, the interval between 2 doses should not be less than every 8 weeks (2 months).
The objective of this report is to perform a systematic review of the beneficial and harmful effects of brolucizumab 6 mg for the treatment of patients with DME.
Stakeholder Perspectives
The information in this section is a summary of the input provided by the patient groups that responded to CADTH’s call for patient input and from the clinical expert consulted by CADTH for the purpose of this review.
Patient Input
Patient input was provided as a joint submission by 5 groups: Fighting Blindness Canada, Canadian Council of the Blind, Canadian National Institute for the Blind (CNIB), Vision Loss Rehabilitation Canada, and Diabetes Canada. The information used to inform the submission was based on an online survey of people in Canada living with DR or DME that was conducted in the first months of 2020 by the submitting organizations. A total of 67 people responded to the survey; many (44.4%) were aged 61 to 80 years (n = 54) and the majority (76.1%) of respondents reported DME or DR in both eyes. Most respondents were either working full time (38.9%) or were retired (33.3%) (n = 54). A separate survey conducted by Canadian Council of the Blind in April 2020 further supported the submission by providing data on the impact of the COVID-19 pandemic on people in Canada who are blind, deaf-blind, or partially sighted (n = 572).
Survey respondents emphasized that DR and DME have substantial and life-altering impacts on daily life, including on reading, driving, and using a phone. In addition to concern for their eyesight worsening, coping with everyday life and general safety when outside of the home were identified as notable concerns of respondents during the preceding month. The results of the Canadian Council of the Blind survey showed that fear, anxiety, loneliness, and other psychosocial impacts were intensified for patients with age-related macular edema and DR during the pandemic.
The majority (56.4%) of respondents indicated they were currently receiving injections for DR or DME; the most common therapeutic options were Lucentis (29.4%), Eylea (24.6%), Avastin (20.2%), and Ozurdex (13.5%). Most respondents (54.5%) indicated they were satisfied with their injections and 63.6% indicated the injections have helped them avoid losing more eyesight (n = 22). Of note, 31.8% of respondents reported missing injections in the last year. According to respondents (n = 6), the reasons for cancelled or delayed appointments in the past included being too busy (50.0%), feeling unwell (33.3%), not being able to find someone to take them to the appointment (16.7%), and fear of injections (16.7%). According to respondents (n = 22), the most difficult part of eye injection appointments was the long wait times (50.0%), finding someone to take them to and from the appointment (31.8%), anxiety or fear about the injection (27.3%), and taking time off work (27.3%). No survey respondents reported experience with brolucizumab.
The submitting organizations indicated that any treatment that reduces the physical, psychological, and logistical strain on patients would be preferred. The submitting organizations suggested this may be addressed by a treatment that is less invasive, or similarly invasive but administered less frequently. Further, the submitting organizations suggested that any treatment that can extend the interval between injections while still minimizing vision loss would be considered advantageous for patients living with vision loss, particularly in the context of the COVID-19 pandemic.
Clinician Input
Input From the Clinical Expert Consulted by CADTH
The clinical expert consulted by CADTH indicated the treatment goals for DME are to delay and, in some cases, reverse the progression of DME and/or DR and to improve vision-related and general quality of life. Considering that most patients are currently required to attend treatment visits once every 1 to 3 months, the clinical expert noted there is an unmet need for treatments that can be given at longer treatment intervals, without recurrence of disease, to reduce the burden on patients and caregivers associated with frequent treatment visits and to increase adherence to treatment regimes.
The clinical expert noted that brolucizumab is expected to have a place in therapy that is similar to that of other anti-VEGFs as a first-line or later line of treatment in patients with DME. Compared with other anti-VEGFs, treatment with brolucizumab is anticipated to reduce the burden of care by increasing the intervals between treatments while still maintaining therapeutic benefit, which could potentially address the unmet need related to frequent treatment visits.
The clinical expert indicated that patients with DR associated with vision loss secondary to centre-involving DME are suitable candidates for brolucizumab. The clinical expert stated that brolucizumab can be used in patients who are treatment-naive or those who require a change in therapy due to inadequate response to other anti-VEGF drugs. Patients who may not be suitable for treatment include those who present with major structural damage to the macular retina (e.g., macular atrophy or fibrosis), according to the expert.
The clinical expert noted that clinical evaluation and optical coherence tomography (OCT) should be performed for prognosis and follow-up at dosing visits. Key assessment outcomes included change in visual acuity and retinal thickness and the presence of retinal fluid. According to the expert, an optimal response to anti-VEGFs is generally achieved 6 to 12 months after initiation of therapy.
The clinical expert indicated that brolucizumab should be discontinued in patients experiencing treatment futility with proof of irreversible anatomic or functional damage, such as macular atrophy (schema) and fibrosis.
Regarding prescribing conditions, the clinical expert recommended retina subspecialty care as the most appropriate treatment setting for the prescription and administration of brolucizumab in urban areas; care by trained comprehensive ophthalmologists with experience and expertise in managing DME would be sufficient in rural settings.
Clinician Group Input
No input was received from any clinician groups for this submission.
Drug Program Input
Input was obtained from the drug programs that participate in the CADTH reimbursement review process. The following were identified as key factors that could potentially impact the implementation of a CADTH recommendation for brolucizumab:
considerations for initiation of therapy
system and economic issues.
The clinical expert consulted by CADTH provided advice on the potential implementation issues raised by the drug programs.
Clinical Evidence
Pivotal Studies and Protocol-Selected Studies
Description of Studies
Two studies, KESTREL (N = 566) and KITE (N = 360), met the inclusion criteria for the systematic review section. They were similarly designed phase III randomized controlled trials (RCTs) that evaluated the noninferiority of brolucizumab (6 mg every 8 weeks or every 12 weeks during maintenance, with every 16 weeks as an option after week 72 in the KITE trial in the event of disease stability, i.e., if no disease activity was observed in the last 2 disease activity assessment [DAA] visits) to aflibercept (2 mg every 8 weeks during maintenance). Noninferiority was based on an a priori noninferiority margin of 4 Early Treatment Diabetic Retinopathy Study [ETDRS] letters. The change from baseline in best-corrected visual acuity (BCVA) using ETDRS letters at week 52 in the full analysis set population was a primary end point. The dosing frequency for brolucizumab was determined by disease activity as assessed by visual acuity and/or anatomic parameters. Patient demographic and disease characteristics were generally well balanced across the arms in both trials at baseline. The mean age of enrolled patients at baseline in these studies ranged from 62.2 to 64.4 years, and the majority were male (greater than 58%) and white (greater than 73%). The mean time since the diagnosis of DME was 9.4 to 12.5 months in the KESTREL trial and 9.9 to 10.4 months in the KITE trial; the mean baseline central subfield thickness (CSFT) in these 2 studies ranged from 453 μm to 484 μm, and the mean baseline BCVA score ranged from 63.7 to 66.6 in both studies although, in the KITE trial, there was an imbalance in the number of ETDRS letters: 66.0 (SD = 10.8) in the brolucizumab group and 63.7 (SD = 11.7) in the aflibercept group. All enrolled patients were naive to anti-VEGF therapies. Outcomes included changes in BCVA, anatomical outcomes, DR severity, vision-related function, injection frequency, and safety, with a primary analysis at week 52 and data up to 100 weeks.
Efficacy Results
Key efficacy and safety results from the pivotal trials are presented in Table 2. The results of the KESTREL and KITE trials support the noninferiority of brolucizumab 6 mg (5 times the loading doses of every 6 weeks followed by maintenance injections every 8 weeks or every 12 weeks) versus aflibercept 2 mg (5 monthly loading doses followed by maintenance injections every 8 weeks) for the change in BCVA. The noninferiority of brolucizumab 6 mg to aflibercept 2 mg was demonstrated for the primary end point (change from baseline in BCVA at week 52 for the study eye) using a noninferiority margin of 4 letters (P < 0.001 for noninferiority). The between-group least squares (LS) mean difference for brolucizumab 6 mg versus aflibercept 2 mg in the KESTREL trial was −1.3 letters (95% confidence interval [CI], −2.9 to 0.3); the between-group LS mean difference in the KITE trial was 1.2 letters (95% CI, −0.6 to 3.1). In addition, several sensitivity analyses by the sponsor, as well as a supportive analysis using the per-protocol population, were consistent with the findings of the primary analyses. Results were consistent for change from baseline to week 100. Results of prespecified subgroup analyses (i.e., baseline BCVA categories and CSFT categories) were generally consistent with the overall population at week 52; however, the study was not powered to detect subgroup differences. Noninferiority of brolucizumab 6 mg to aflibercept 2 mg was also demonstrated for the mean change from baseline in BCVA averaged over the period from week 40 through week 52.
The change in retinal thickness (measured as CSFT) from baseline and patients with a CSFT of less than 280 µm were secondary outcomes in the studies. According to the expert, the reduction in retinal thickness correlates well with the improvement in visual acuity. In the KESTREL trial, the LS mean difference in the change from baseline in CSFT between the brolucizumab 6 mg arm and the aflibercept 2 mg arm was −5.1 µm (95% CI, −22.3 µm to 12.2 µm). Over the period from week 40 through week 52, the average LS mean of the change from baseline in CSFT between brolucizumab 6 mg and aflibercept 2 mg was −1.4 µm (95% CI, −17.9 µm to 15.0 µm). In the KITE trial, the LS mean difference in the change from baseline in CSFT to week 52 between the brolucizumab 6 mg arm and the aflibercept 2 mg arm was −32.8 µm (95% CI, −52.5 µm to −13.0 µm). Over the period from week 40 through week 52, the average LS mean of the change from baseline in CSFT between brolucizumab 6 mg and aflibercept 2 mg was −29.4 µm (95% CI, −48.6 µm to 10.2 µm; P = 0.001) in favour of brolucizumab. These differences between brolucizumab and aflibercept were similar at year 2.
The change from baseline in the NEI VFQ-25 composite score, which measures vision-related functions and some aspects of HRQoL, was a secondary outcome in the KESTREL and KITE trials, but not included in the statistical hierarchy. In the KESTREL trial, the LS mean estimates for change from baseline in the composite score were 7.1 for brolucizumab 6 mg and 8.1 for aflibercept 2 mg, with between-group LS mean differences of −1.0 (95% CI, −3.4 to 1.4) at week 52, and LS mean estimates of 6.2 for brolucizumab 6 mg and 6.4 for aflibercept 2 mg, with LS mean differences of −0.2 (95% CI, −2.9 to 2.6) at week 100. In the KITE trial, the LS mean estimates for change from baseline in the composite score were 9.1 for brolucizumab 6 mg and 6.5 for aflibercept 2 mg, with between-group LS mean differences of 2.5 (95% CI, 0.2 to 4.8) for the change from baseline at week 52, and LS mean estimates of 9.3 for brolucizumab 6 mg and 5.9 for aflibercept 2 mg, with LS mean differences of 3.4 (95% CI, 0.8 to 6.1) at week 100.
The ETDRS Diabetic Retinopathy Severity Scale (DRSS) was used to measure disease activity in patients with DME. Regression of DRSS is another clinically meaningful outcome in this study population; however, this outcome was not included in the statistical hierarchy. For most of the results for this outcome at week 52 and week 100, there was no evidence to suggest a difference between brolucizumab and aflibercept. Given the uncertainty in the analysis due to the lack of statistical testing and imprecision in the between-group differences, no definite conclusions on the change in disease severity can be drawn.
The pivotal trials measured the proportions of patients with the presence of IRF and subretinal fluid (SRF) as secondary outcomes. IRF and SRF are indicators of active disease. According to the clinical expert consulted by CADTH, IRF is a more relevant outcome than SRF in patients with DME, noting that SRF is uncommon in DME and is a marker for more severe DME. This outcome was not tested statistically due to a previous failure of the hierarchical testing procedure. A numerically lower proportion of patients treated with brolucizumab 6 mg had the presence of IRF and/or SRF compared with the aflibercept 2 mg group in both studies at week 52 and week 100.
Frequency of injection was noted to be an important outcome of interest by both patients and the clinical expert, as it may have implications on the frequency of adverse events (AEs), HRQoL, the burden of treatment, and patient adherence and, subsequently, can have an impact on the treatment effect. The proportion of patients treated with brolucizumab who were maintained on a schedule of every 12 weeks was reported descriptively in the studies. Among the patients who received treatment with brolucizumab, approximately half maintained a treatment interval of 12 weeks at week 52 in both studies, ||| ||| ||| ||| || |||||||| |||||||||| ||| |||| ||||||| || |||| ||| in the KESTREL and KITE trials, respectively. Among the patients who completed treatment with brolucizumab at week 100, the majority were being treated every 8 weeks (67.1% in the KESTREL trial and 52.5% in the KITE trial).
Harms Results
The safety profile for brolucizumab 6 mg was generally consistent with that of aflibercept 2 mg in the KESTREL and KITE trials. The proportion of patients reporting at least 1 ocular AE in the study eye up to week 100 was comparable across treatment arms in both studies (48.7% and 50.3% in the brolucizumab 6 mg and aflibercept 2 mg group, respectively, in the KESTREL trial; 40.8% and 40.9% in the brolucizumab 6 mg and aflibercept 2 mg group, respectively, in the KITE trial). Overall, the most frequently reported ocular AEs related to brolucizumab in both studies were cataract, conjunctival hemorrhage, vitreous detachment, vitreous floaters, intraocular pressure increased, diabetic retinal edema, dry eye, eye pain, posterior capsule opacification, conjunctivitis, and reduced visual acuity. Cataract was the most commonly reported ocular AE, which was anticipated because of the age of the study populations. Ocular serious AEs (SAEs) were reported with low frequency and were similar between the 2 treatment groups in both studies: 3.7% and 2.7% of patients in the KESTREL trial and 2.8% and 1.7% of patients in the KITE trial in the brolucizumab 6 mg group versus the aflibercept 2 mg group, respectively. The incidence of withdrawals due to AEs (WDAEs) was also similar between the 2 treatment groups: 1.6% and 1.1% of patients in the KESTREL trial and 2.8% and 2.2% of patients in the KITE trial in the brolucizumab group compared with the aflibercept group, respectively. There were 15 deaths in the KESTREL study, 8 (4.2%) in the brolucizumab group and 7 (3.7%) in the aflibercept group. In the KITE study, 13 (7.3%) deaths occurred in the brolucizumab group and 9 (5.0%) in the aflibercept group. According to the sponsor, none of the deaths were related to study treatment.
Table 2: Summary of Key Results From Pivotal and Protocol-Selected Studies
Results | KESTREL | KITE | ||
|---|---|---|---|---|
Brolucizumab 6 mg (N = 189) | Aflibercept 2 mg (N = 187) | Brolucizumab 6 mg (N = 179) | Aflibercept 2 mg (N = 181) | |
Efficacy (FAS) | ||||
Change from baseline in BCVA (letters read) at week 52a | ||||
n | 189 | 187 | 179 | 181 |
LS mean (95% CI) | 9.2 (8.1 to 10.3) | 10.5 (9.4 to 11.7) | 10.6 (9.3 to 11.9 | 9.4 (8.1 to 10.7) |
LS mean difference (brolucizumab minus aflibercept) (95% CI) | −1.3 (−2.9 to 0.3) | Reference | 1.2 (−0.6 to 3.1) | Reference |
P value (for noninferiority test, 4-letter margin), 1-sided | < 0.001 | Reference | < 0.001 | Reference |
Change from baseline in BCVA (letters read) at week 100a | ||||
n | 189 | 187 | 179 | 181 |
LS mean (95% CI) | 8.8 (7.4 to 10.3) | 10.6 (9.1 to 12.0) | 10.9 (9.3 to 12.6) | 8.4 (6.7 to 10.1) |
LS mean difference (brolucizumab minus aflibercept) (95% CI) | −1.7 (−3.8 to 0.4) | Reference | 2.6 (0.2 to 4.9) | Reference |
Change from baseline in CSFT at week 52, µmb | ||||
n | 189 | 187 | 179 | 180 |
LS mean (95% CI) | −165.5 (−177.6 to −153.3) | −160.4 (−172.6 to −148.2) | −197.2 (−211.1 to −183.2) | −164.4 (−178.3 to −150.4) |
LS mean difference (brolucizumab minus aflibercept) (95% CI) | −5.1 (−22.3 to 12.2) | Reference | −32.8 (−52.5 to −13.0) | Reference |
95% CI for treatment difference | — | Reference | — | Reference |
Change from baseline in CSFT at week 100, µmb | ||||
n | 189 | 187 | 179 | 180 |
LS mean (95% CI) | −173.2 (−186.0 to −160.4) | −170.3 (−183.2 to −157.4) | −202.3 (−218.1 to −186.4) | −173.1 (−188.9 to −157.3) |
LS mean difference (brolucizumab minus aflibercept) (95% CI) | −2.9 (−21.1 to 15.3) | Reference | −29.2 (−51.6 to −6.8) | Reference |
Change from baseline in NEI VFQ−25 composite score at week 52c | ||||
n | 148 | 157 | 143 | 150 |
LS mean | 7.1 | 8.1 | 9.1 | 6.5 |
LS mean difference (brolucizumab minus aflibercept) (95% CI) | −1.0 (−3.4 to 1.4) | Reference | 2.5 (0.2 to 4.8) | Reference |
Change from baseline in NEI VFQ−25 composite score at week 100c | ||||
n | 141 | 142 | 130 | 145 |
LS mean estimate | 6.2 | 6.4 | 9.3 | 5.9 |
LS mean difference (brolucizumab minus aflibercept) (95% CI) | −0.2 (−2.9 to 2.6) | Reference | 3.4 (0.8 to 6.1) | Reference |
Proportion of patients with ≥ 2-step improvement from baseline in the DRSS score for the study eye at week 52d | ||||
n of N (%) | 55 of 186 (29.6) | 40 of 184 (21.7) | 51 of 176 (29.0) | 49 of 177 (27.7) |
95% CI | (23.1 to 36.7) | (16.0 to 28.4) | (22.4 to 36.3) | (21.2 to 34.9) |
Proportion estimate (%) | 29.0 | 22.2 | 28.9 | 27.8 |
Between-group difference (%) (95% CI) | 6.7 (0.6 to 12.9) | Reference | 1.1(−5.6 to 7.8) | Reference |
Proportion of patients with ≥ 2-step improvement from baseline in the DRSS score for the study eye at week 100d | ||||
n of N (%) | 61 of 186 (32.8) | 54 of 184 (29.3) | 63 of 176 (35.8) | 55 of 177 (31.1) |
95% CI | (26.1 to 40.0) | (22.9 to 36.5) | (28.7 to 43.4) | (24.3 to 38.5) |
Proportion estimate (%) | 32.1 | 30.0 | 35.7 | 31.2 |
Between-group difference (%) (95% CI) | 2.2 (−4.0 to 8.4) | Reference | 4.5 (−1.7 to 10.8) | Reference |
Proportion of patients maintained on q.12.w. (KESTREL) or on q.12.w. or q.16.w. (KITE), % (95% CI)e | ||||
Up to week 64 | 52.0 (43.7 to 59.6) | NA | 45.5 (37.7 to 53.0) | NA |
Up to week 100 | 44.1 (35.7 to 52.1) | NA | 36.8 (29.1 to 44.5) | NA |
Last treatment interval among patients who completed treatment with brolucizumab at week 100, n of N (%) | ||||
q.8.w. | 98 of 146 (67.1) | NA | 74 of 141 (52.5) | NA |
q.12.w. | 48 of 146 (32.9) | NA | 32 of 141 (22.7) | NA |
q.16.w. | NA | NA | 35 of 141 (24.8) | NA |
Safety (safety set) | ||||
Patients with ≥ 1 ocular AE, n (%) | 92 (48.7) | 94 (50.3) | 73 (40.8) | 74 (40.9) |
Patients with ≥ 1 nonocular AE, n (%) | 146 (77.2) | 143 (76.5) | 136 (76.0) | 141 (77.9) |
Patients with ≥ 1 ocular SAE, n (%) | 7 (3.7) | 5 (2.7) | 5 (2.8) | 3 (1.7) |
Patients with ≥ 1 nonocular SAE, n (%) | 53 (28.0) | 54 (28.9) | 48 (26.8) | 58 (32.0) |
Patients with ≥ 1 ocular WDAE, n (%) | 3 (1.6) | 2 (1.1) | 5 (2.8) | 4 (2.2) |
Patients with ≥ 1 nonocular WDAE, n (%) | 2 (1.1) | 7 (3.7) | 10 (5.6) | 4 (2.2) |
Deaths, n (%) | 8 (4.2) | 7 (3.7) | 13 (7.3) | 9 (5.0) |
Notable harms, n (%) | ||||
Endophthalmitis | 0 | 1 (0.5) | 2 (1.1) | 1 (0.6) |
Intraocular inflammation | 8 (4.2) | 2 (1.1) | 4 (2.2) | 3 (1.7) |
Including retinal vasculitis | 1 (0.5) | 0 | 0 | 0 |
Retinal vascular occlusion | 3 (1.6) | 1 (0.5) | 1 (0.6) | 1 (0.6) |
Increased intraocular pressure | 11 (5.8) | 3 (1.6) | 6 (3.4) | 4 (2.2) |
Retinal detachment | 0 | 1 (0.5) | 0 | 1 (0.6) |
Retinal tear | NR | NR | 0 | 1 (0.6) |
Ocular hemorrhage (conjunctival hemorrhage, retinal hemorrhage, vitreous hemorrhage) | 20 (10.6) | 22 (11.8) | 10 (5.6) | 10 (5.5) |
ATEs | 10 (5.3) | 14 (7.5) | 13 (7.3) | 12 (6.6) |
Vitreous floaters | 10 (5.3) | 6 (3.2) | 4 (2.2) | 4 (2.2) |
Eye discomfort or eye pain | 6 (3.2) | 5 (2.7) | 6 (3.4) | 4 (2.2) |
Blurred vision | 3 (1.6) | 1 (0.5) | 1 (0.6) | 5 (2.8) |
AE = adverse event; ANOVA = analysis of variance; ATE = arterial thromboembolic event; BCVA = best-corrected visual acuity; CI = confidence interval; CSFT = central subfield thickness; DRSS = diabetic retinopathy severity scale; FAS = full analysis set; LS = least squares; NA = not applicable; NEI VFQ-25 = National Eye Institute Visual Functioning Questionnaire–25; NR = not reported; q.8.w. = every 8 weeks; q.12.w. = every 12 weeks; q.16.w. = every 16 weeks; SAE = serious adverse event; WDAE = withdrawal due to adverse event.
aAnalyzed using an ANOVA model with baseline BCVA categories (≤ 65 letters, > 65 letters), age categories (< 65 years, ≥ 65 years), and treatment as fixed-effect factors.
bAnalyzed using an ANOVA model with baseline CSFT categories (< 450 μm, ≥ 450 μm to < 650 μm, ≥ 650 μm), age categories (< 65 years, ≥ 65 years), and treatment as fixed-effects factors.
cAnalyzed using an analysis of covariance model with treatment as a fixed-effects factor and corresponding baseline value of the end point as a covariate.
dThe 95% CI for binomial proportions is based on the Clopper-Pearson exact method. The statistical model used logistic regression adjusting for baseline DRSS score categories (≤ 4, ≥ 5), age categories (< 65 years, ≥ 65 years), and treatment as fixed-effect factors. The 95% CI for the treatment difference was estimated using the bootstrap method.
eResults derived from the Kaplan-Meier analyses of the time needed to reach the interval of every 8 weeks that was estimated at week 60 and week 96, i.e., the time of the immediately preceding disease activity assessment visits.
Sources: Clinical Study Reports for KESTREL11 and KITE.12
Critical Appraisal
The KESTREL and KITE trials were similarly designed randomized, double-blind, active-controlled, noninferiority phase III trials comparing brolucizumab (6 mg and 3 mg in the KESTREL trial; 6 mg in the KITE trial) with aflibercept (2 mg). The overall designs of the KESTREL and KITE trials were appropriate for the objectives of the studies. There were no major concerns with regard to the method of randomization, stratification, allocation concealment, and masking for randomized assignment. The baseline characteristics of the study population were generally well balanced between treatment arms and across studies, with the exception that patients in the KITE study had a relatively large imbalance in the number of ETDRS letters between the 2 treatment arms and a somewhat thicker retina at baseline, and were more likely to have received prior ocular medications compared with those enrolled in the KESTREL study. However, the clinical expert thought these differences were unlikely to impact the results between the studies.
In the KESTREL and KITE trials, the results of change from baseline in BCVA at week 52 using the per-protocol population were consistent with those in the full analysis set. In both studies, sensitivity analyses were conducted to assess the robustness of the hypothesis testing resulting from the primary analysis. Various methods were used to account for missing data, such as the mixed model for repeated measures (MMRM) modelling assuming a missing-at-random mechanism, or a last observation carried forward (LOCF) approach. The missing-at-random assumption may be a concern, given that the primary reasons for discontinuation from the study included patient decision, death, and AEs. Further, the LOCF method assumes that patient outcomes do not change after patients drop out, which may not hold true in practice. Therefore, performing additional sensitivity analyses that do not assume that missing data are missing at random could be useful. However, the results of the sensitivity analyses confirmed those of the primary analysis, suggesting these approaches in handling missing data were unlikely to introduce bias in the primary end point. The risk of attrition bias due to missing data was of particular concern for the National Eye Institute Visual Functioning Questionnaire–25 (NEI VFQ-25), as the proportion of missing data was greater than 20% for some treatment groups.
Statistical hierarchy was used for multiplicity adjustment for selected outcomes. Some important outcomes were not included in the hierarchy, such as vision-related HRQoL assessed by NEI VFQ-25, change in retinal thickness, and change in DR severity. In addition, the statistical hierarchy failed relatively early on at some point. In the KESTREL trial, the noninferiority of brolucizumab 3 mg to aflibercept 2 mg was not achieved at week 52. As per the study protocol, confirmatory testing did not proceed to assess the superiority of brolucizumab versus aflibercept for the following outcomes in the hierarchical testing procedure, which limits drawing definite conclusions on these outcomes.
Based on the patients’ baseline characteristics, the study population in the KESTREL and KITE trials may not fully represent the typical population with DME in Canada who would be receiving anti-VEGF therapy. The inclusion criteria for the KESTREL and KITE trials were reasonable and reflective of the eligibility criteria for anti-VEGF treatment in clinical practice. Although all patients enrolled in the KESTREL and KITE trials were naive to anti-VEGF treatment, and exhaustive exclusion criteria were used in the 2 studies, the clinical expert consulted by CADTH indicated that brolucizumab can be used in a broader population, such as those with a blood glucose level that is poorly controlled, or those who had received previous anti-VEGF therapy.
In the 2 pivotal studies, patients in the brolucizumab group could have their dosing interval extended, reduced (once patients on brolucizumab dropped back to every 8 weeks because of disease activity, they could not extend the treatment interval for the rest of the study, which may contradict clinical practice), or maintained postrandomization, based on the assessments of disease activity. Changes in treatment interval and dosage were not allowed for the treatment with aflibercept, and these patients remained on a fixed interval of every 8 weeks during the maintenance phase; this is contrary to clinical practice, as the product monograph for aflibercept states the treatment interval can be extended after the first year of treatment. According to the clinical expert, patients in the real world may not receive as many loading doses as in the clinical trial and it is possible that the outcomes observed in practice could differ from those shown in the clinical trials.
Indirect Comparisons
Description of Studies
The sponsor-submitted indirect treatment comparisons (ITCs) provided indirect evidence on the efficacy and safety of brolucizumab relative to other anti-VEGFs for adult patients with DME. The active comparators for brolucizumab included aflibercept, ranibizumab, and bevacizumab. Relevant RCTs were identified through a systematic literature search. Forty-three RCTs were included in the network meta-analysis (NMA). Outcomes of change in BCVA, retinal thickness, change in disease activity, study discontinuation, and safety were evaluated in the study population. A Bayesian NMA approach was used for data synthesis.
Efficacy Results
The sponsor-submitted NMA provided indirect comparative evidence for brolucizumab versus other anti-VEGF drugs. After including 43 trials in an NMA, none of the treatments were favoured when brolucizumab was compared with other active treatments for the treatment of DME, such as aflibercept, ranibizumab, or bevacizumab, in improving visual acuity and lessening disease severity. For most comparisons, the effect estimate was too imprecise (i.e., wide 95% credible intervals [CrIs]) to draw a conclusion about the comparative effects. Treatment with brolucizumab was associated with a greater reduction in retinal thickness than bevacizumab or ranibizumab. In addition, the ITC results suggested that patients treated with brolucizumab may receive fewer injections compared with other anti-VEGFs, though these results were derived from a naive comparison rather than an NMA and, in particular, should be interpreted with caution. The key limitations for the ITC are significant heterogeneity (in study design and patient characteristics) across the included RCTs, and imprecision around the effect estimates (i.e., wide 95% CrIs), which precluded drawing a conclusion for most outcome comparisons. This limits the conclusions that can be drawn from this ITC.
Harms Results
The risk of ocular AEs, nonocular AEs, and study discontinuation were evaluated in the NMA. The results suggested that none of the treatments were favoured for reduction in the risk of ocular or nonocular AEs. For all comparisons, the effect estimate was too imprecise (i.e., wide 95% CrIs) to draw a conclusion about the comparative effects. Limitations to the NMA preclude making firm conclusions about the relative risks of harm for brolucizumab compared with other anti-VEGFs.
Critical Appraisal
In the sponsor-provided ITC, the degree of heterogeneity (such as the patients’ disease characteristics at baseline) between the included studies was difficult to assess because of incomplete reporting of study characteristics. Description of trial design, sample size, and disease duration were reported. However, the ITC failed to report information related to the methods used for handling missing data. There was considerable variability in study design, year of conduct, sample size, and treatment regimen. The risk of bias in the included trials was assessed using a checklist from National Institute for Health and Care Excellence (NICE), but further details on how the risk-of-bias assessment was carried out were not provided.
Similarly, inadequate information about and variability in the baseline patient characteristics reported contribute to heterogeneity in the studies included in the ITC. Clinical trial eligibility criteria were described for the trials that were ultimately included in the NMA. However, many individual studies failed to report or inadequately reported patient characteristics, resulting in gaps in the extracted ITC data. There was a lack of information about key baseline characteristics, such as the presence of significant diabetic macular ischemia, patient’s previous treatment and response, presence of IRF, and presence of systemic comorbidities, including hypertension, chronic kidney disease, obesity, or cardiac conditions.
Most of the patients’ baseline characteristics were presented graphically. Even though some of these characteristics were comparable, such as age (which ranged from 58 to 66 years) and hemoglobin A1C level (which ranged from 7.3 to 8.7), heterogeneity still exists. The mean time since diagnosis of DME ranged from 1.2 to 3.4 years. The duration of diabetes ranged from 10 to 18 years in the included studies. Based on data from 26 trials, the mean BCVA scores ranged from 33 to 71 letters. Based on data from 25 trials, the mean retinal thickness at baseline ranged from 321 µm to 596 µm, and the majority of studies included patients with a retinal thickness of more than 400 µm. There was also heterogeneity in the reporting of methods for measuring retinal thickness and in the results of changes in retinal thickness. The apparent heterogeneity, based on the factors that were reported in combination with the inability to assess those that were not reported, means there is considerable uncertainty as to whether the assumptions related to homogeneity were met. The treatment effect of the study drug could differ by patient characteristics at baseline. Despite acknowledging the degree of heterogeneity, the technical report did not provide information on the assessments of heterogeneity (e.g., graphic representation of baseline characteristics, statistical tests) sufficient to fully understand the sources of heterogeneity. Therefore, it is plausible that the potential for heterogeneity could have influenced the comparative efficacy and safety estimates, and it is not possible to quantify or identify the direction of the bias. Several assumptions were made when defining treatment node assignment, for example: that a different dose did not impact the outcomes, that the ranibizumab 0.3 mg and 0.5 mg doses had similar efficacy, and that there were no significant differences in the effect of different regimens (aflibercept every 4 weeks, every 8 weeks, or as needed); it is uncertain whether these assumptions are valid.
For injection frequency, the ITC examined brolucizumab every 8 weeks and every 12 weeks. Data were pooled without conducting an NMA. Although drug administration with fixed treatment intervals according to a specific protocol is commonly observed in clinical trials, the clinical expert consulted by CADTH indicated that, in the real world, the treatment regimen could be more flexible, based on the patient’s response. Therefore, the findings from clinical trials may not reflect clinical practice.
Other Relevant Evidence
This section includes a summary of 1 additional relevant study, KINGFISHER,13 which was included in the sponsor’s submission to CADTH, as it was considered by the sponsor to provide further information on the safety of brolucizumab in patients with DME. The study compared the efficacy and safety of brolucizumab versus aflibercept in patients with DME, but the treatment intervals used for both drugs were shorter than the recommended intervals (beyond the loading phase) in the respective Health Canada–approved monographs.14,15
The frequency of dosing for brolucizumab was selected based on previous studies that have suggested that, for some patients with DME, frequent dosing (i.e., every 4 weeks) with anti-VEGF therapy may be required to improve and maintain functional and anatomical outcomes.13 The clinical expert consulted by CADTH did not consider the efficacy results for the treatment intervals used in the KINGFISHER study to be relevant or generalizable to clinical practice; therefore, they are not included in this summary. However, given the frequency of administration, the clinical expert suggested that the safety data may provide information on whether intraocular inflammation and retinal vasculitis are idiosyncratic AEs related to brolucizumab itself rather than to the frequency of intravitreal injections.
Description of Study
One multicentre, randomized, double-blinded, active-controlled, parallel-group, prospective, phase III study, KINGFISHER,13 was conducted to evaluate the efficacy and safety of brolucizumab versus aflibercept in the treatment of adult patients with visual impairment due to DME. The primary objective was to demonstrate that brolucizumab was noninferior to aflibercept with respect to change in visual acuity from baseline up to week 52.
A total of 346 and 171 patients were randomized to brolucizumab 6 mg administered every 4 weeks and aflibercept 2 mg administered every 4 weeks, respectively. The 48-week double-blind treatment period was followed by a 4-week follow-up period up to week 52. Patients were evaluated every 4 weeks for the duration of the study. Only 1 eye was selected as the study eye and treated with the study drug. Study discontinuation rates were 10.1% and 8.8% in the brolucizumab and aflibercept arms, respectively. A total of 189 patients (54.6%) in the brolucizumab arm and 94 patients (55.0%) in the aflibercept arm received all 13 injections following the regimen of every 4 weeks.
The inclusion and exclusion criteria used in the KINGFISHER study13 were generally consistent with the eligibility criteria used in the pivotal KESTREL11 and KITE12 studies. The KINGFISHER study included adult patients with type 1 or type 2 diabetes who were diagnosed with visual impairment due to DME involving the centre of the macula and had a hemoglobin A1C level of 12% or less at screening. Of note, patients could either be treatment-I or could have previously received anti-VEGF therapy but could not have received any anti-VEGF therapies or undergone any intraocular surgery or laser photocoagulation within the 3-month period before baseline.
The mean age of patients was 60.9 years (SD = 10.59) in the brolucizumab arm and 60.2 years (SD = 9.31) in the aflibercept arm. There was a higher proportion of males than females in both arms (56.1% in the brolucizumab arm and 61.4% in the aflibercept arm). The mean time since diagnosis with DME was 20.6 months (SD = 29.94) and 18.2 months (SD = 25.60) in the brolucizumab and aflibercept arms, respectively. The mean BCVA score was 61.3 letters (SD = 10.14) and 60.5 letters (SD = 11.27 μm) in the brolucizumab and aflibercept arms, respectively. The mean CSFT was 514.1 μm (SD = 138.94 μm) and 511.2 μm (SD = 156.29 μm) in the brolucizumab and aflibercept arms, respectively. Most patients in both treatment arms had mild to moderately severe nonproliferative DR: 75.6% in the brolucizumab arm (n = 167) and 76.3% in the aflibercept arm (n = 90). Prior anti-VEGF treatment in the study eye was reported in 95 patients (27.5%) and 52 patients (30.4%) in the brolucizumab and aflibercept arms, respectively.
Harms Results
A total of 105 patients (30.3%) in the brolucizumab arm and 59 patients (34.5%) in the aflibercept arm reported at least 1 ocular AE. The most common ocular AE reported in the brolucizumab arm was vitreous detachment in 10 patients (2.9%). A total of 3 patients (0.9%) in the brolucizumab arm reported at least 1 serious ocular AE: vitreous hemorrhage in 2 patients (0.6%), and cataract subcapsular and retinal vasculitis in 1 patient (0.3%) each. No patients in the aflibercept arm reported any serious ocular AEs. | ||||| || | |||||||| |||||| ||| | |||||||| |||||| |||||||| |||| ||||| ||||||||| || ||| |||||||||||| ||| ||||||||||| ||||| ||||||||||||| ||| || || |||||| ||| |||| ||| |||| |||||| |||||| ||||| |||||||||| || ||||||| || || ||| |||||||| || |||||||| |||||| ||| | |||||||| ||||||| ||||||||||||||
Intraocular inflammation was reported in 14 patients (4.0%) in the brolucizumab arm versus 5 patients (2.9%) in the aflibercept arm. Retinal vasculitis was reported in 3 patients (0.9%) in the brolucizumab arm versus 1 patient (0.6%) in the aflibercept arm. Retinal vascular occlusion was reported in 1 patient in each arm (0.3% versus 0.6% in the brolucizumab and aflibercept arms, respectively). |||||||| |||||||||||||| |||||| |||| |||||||| || || |||||||| |||||| || ||| |||||||||||| ||| |||||| | |||||||| |||||| || ||| ||||||||||| |||| ||||||||||| |||||||| ||||||||| ||||||||| ||| |||||||| || | |||||||| |||||| || ||| |||||||||||| ||| |||||| | |||||||| |||||| || ||| ||||||||||| ||||. No reports of endophthalmitis were recorded.
Critical Appraisal
The trial was at low risk of bias due to the randomization; the 2 arms were generally balanced with respect to baseline demographic and disease characteristics. The trial was double-blind; however, there was some potential for unmasking because the personnel providing the injections were aware of the assigned treatment. The likelihood of unmasking and potential for bias in the reporting of subjective outcomes (i.e., some harms) is uncertain. The trial was powered for the safety assessment according to FDA recommendations. Attrition was relatively low and balanced across the arms, suggesting a low risk of attrition bias.
The clinical expert consulted by CADTH for this review advised that the results of the KINGFISHER study would not be generalizable to the patient population and clinical practice in Canada because the frequency of administration, every 4 weeks, is not a relevant treatment interval. Further, aflibercept is rarely administered every 4 weeks in clinical practice.
Conclusions
Brolucizumab 6 mg (every 8 weeks or every 12 weeks during maintenance therapy), was found to be noninferior to aflibercept 2 mg every 8 weeks for the mean change in BCVA from baseline after 1 year of treatment in anti-VEGF-naive patients with DME, based on evidence from 2 double-blind phase III RCTs (the KESTREL and KITE trials). Results for mean change in BCVA after 100 weeks of treatment were generally consistent with the 1-year results. The results of other BCVA outcomes, retinal thickness, and presence of IRF and/or SRF did not contradict the primary end point findings, but their interpretation is limited by the lack of a noninferiority margin and lack of adjustment for multiple testing. The reduction from baseline in retinal thickness after 1 year of treatment was greater with brolucizumab versus aflibercept in the KITE trial; in the KESTREL trial, the effect estimate was too imprecise (i.e., wide 95% CIs) to draw a conclusion. The results for presence of IRF and/or SRF suggested that brolucizumab may have been favoured over aflibercept, but a firm conclusion cannot be drawn due to the lack of adjustment for multiplicity. Approximately half of the brolucizumab group in each trial maintained the dosing interval of every 12 weeks after 52 weeks of treatment, though conclusions cannot be drawn due to the lack of adjustment for multiplicity and issues regarding the generalizability of the treatment regimens.
The safety profile for brolucizumab was generally comparable with that of aflibercept in the KESTREL and KITE trials. Results from a supportive study, KINGFISHER, which used a more frequent dosing regimen (brolucizumab 6 mg every 4 weeks), showed a safety profile for brolucizumab every 8 weeks or every 12 weeks that was similar to that observed in the KESTREL and KITE trials.
There is no direct comparative evidence on brolucizumab versus any anti-VEGFs other than aflibercept. Evidence from 1 NMA suggested that for change from baseline in BCVA at 12 months, none of the treatments were favoured when brolucizumab 6 mg was compared with aflibercept, ranibizumab, and bevacizumab; however, imprecision around the effect estimates (i.e., wide 95% CrIs) precluded drawing a conclusion for most comparison outcomes. In addition, the NMA results suggested that treatment with brolucizumab may be favourable compared with ranibizumab and bevacizumab for reducing retinal thickness. However, the presence of heterogeneity in the study design and patient characteristics limits the conclusions that can be drawn from the NMA. The results of a naive ITC suggested that treatment with brolucizumab may be related to fewer injections compared with other anti-VEGF drugs, but a conclusion cannot be drawn.
Introduction
Disease Background
DME is a vision-threatening complication of diabetes mellitus (both type 1 and type 2). The persistent elevation of blood glucose in people with diabetes causes damage to the capillaries, such as those in the eye, resulting in DR.1 Some patients with DR and especially those with continually poorly managed blood glucose can experience swelling in the retina, known as DME.2 Generally, DME manifests as slowly progressive vision loss. The degree of vision loss can vary considerably and depends on the severity, duration, and location of IRF, among other factors. Clinically significant macular edema can be defined by retinal thickening at or within 500 µm of the centre of the macula.16,17 Signs of DME include blurred vision, retinal hemorrhages, retinal detachment, colours appearing “washed out” or faded, changes in contrast sensitivity, impaired colour vision, gaps in vision (scotomas), and potentially permanent vision loss. Untreated DME is considered to be the leading cause of vision loss, visual disability, and legal blindness in people with DR.2-4
Prevalence of macular edema in patients with type 1 diabetes, patients with type 2 diabetes treated with insulin therapy, and patients treated with antihyperglycemic therapies have been estimated at 11%, 15%, and 4%, respectively.18 A Canadian retrospective study using records from the Southwestern Ontario database estimated the prevalence of DME in adults with diabetes to be 15.7% and the prevalence of vision loss due to DME to be 2.56%.19 In this study, more than 50% of patients with DME experiencing vision loss were older than 60 years and more than 22% of patients with DME experiencing vision loss were patients within a First Nations community.19 Indigenous populations in Canada are disproportionally affected by diabetes,16 with higher prevalence rates of DR compared with the general population,20,21 although accurate data on vision loss in this population is limited.16 Based on the Ontario study’s estimates,19 and a 2020 Statistics Canada estimate of 2.3 million adults in Canada with diabetes, there are approximately 60,000 adults with DME in Canada who experience vision impairment requiring treatment.8,9 The incidence and prevalence of diabetes in Canada are projected to increase in the coming years in tandem with an aging population and rising rates of obesity, and this rise in diabetes cases is expected to lead to corresponding increases in DR and DME.16
Generally, vision loss is associated with significant morbidity, including increased falls, hip fractures, and mortality.22 In addition, it has been suggested that amputation and vision loss due to DR are independent predictors of early death among patients with type 1 diabetes.23 Progressive visual impairment typically results in significant decrements in daily functioning and quality of life, and indirect costs due to lost productivity are high if left untreated;5-7 therefore, early detection and treatment of DME is vital.24,25
Standards of Therapy
Current therapies for DME in Canada include non-pharmacological interventions (laser therapy and vitrectomy) and pharmacological interventions (intravitreal anti-VEGF drugs and intravitreal steroids). Health Canada–approved anti-VEGF drugs for DME treatment include ranibizumab and aflibercept (with bevacizumab used off-label), while approved intravitreal steroids include dexamethasone.
Macular laser photocoagulation (including focal, grid laser, or panretinal) therapy for DME was the standard of care for more than 25 years before the introduction of anti-VEGF drugs and is still widely used either alone or in combination with anti-VEGF treatment.17 Laser therapy has been shown to slow and/or stabilize vision loss, but has been minimally effective in restoring vision.26 Clinical studies have shown robust efficacy and safety for frequent (e.g., monthly or bimonthly) anti-VEGF injections for the treatment of DME patients.27-29 The results from these trials have demonstrated that treatment with anti-VEGF drugs substantially improves visual and anatomic outcomes compared with laser photocoagulation, and avoids the ocular side effects associated with laser treatment. Canadian evidence-based guidelines and clinical treatment algorithms recommend anti-VEGF injections as therapy (alone or in conjunction with focal laser therapy) for most patients with clinically significant DME involving central macular thickening. Cases without central macular thickening are recommended to receive focal laser treatment, while eyes with vitreomacular traction and macular edema are recommended as candidates for vitrectomy.16
The first of the anti-VEGF drugs to be approved in Canada for the treatment of DME was ranibizumab (a humanized recombinant monoclonal antibody fragment with anti-VEGF activity).30 The recommended dose of ranibizumab is 0.5 mg injected intravitreally once a month and continued until maximum visual acuity is achieved, confirmed by stable visual acuity for 3 consecutive monthly assessments performed while on the treatment.30 Other anti-VEGF therapies include aflibercept at the recommended dose of 2.0 mg administered by intravitreal injection monthly for the first 5 consecutive doses, followed by 1 injection every 2 months.15 After the first year, injections of aflibercept may be extended by increments of up to 2 weeks based on disease activity, although data on intervals longer than 4 months are limited.15 Bevacizumab, an anti-VEGF drug, is also used in the first line in clinical practice but does not have any Health Canada–approved indications for the treatment of DME and is reimbursed only in certain jurisdictions.
Although anti-VEGF therapies are widely accepted as the standard of care for patients with DME, they require frequent injections (8 to 12 per eye per year) to achieve desirable outcomes, creating a high treatment burden for patients and caregivers. Anti-VEGF therapies are also associated with an increased risk of cerebrovascular and cardiovascular events such as thromboembolic events; therefore, they may not be appropriate in all DME patients, especially in patients with prior stroke or other cardiovascular comorbidities.10,15,30-32 Some patients have an inadequate response to anti-VEGF treatment, although the frequency of suboptimal response is unclear. According to the clinical expert consulted for this review, around 10% of patients may have an inadequate response, while some studies have reported a suboptimal response in as high as 25%33 to 40%34 of patients on anti-VEGF therapy, depending on how suboptimal response was defined.34 There is limited evidence of the benefit and risks of continuous anti-VEGF injections among patients who did not respond well to prior anti-VEGF therapy.34
In Canada, intravitreal dexamethasone implants are indicated for use in DME patients who are pseudophakic. Triamcinolone acetonide monotherapy administered as an intravitreal steroid injection is considered for off-label use in Canada for the treatment of macular edema in pseudophakic patients, according to the clinical expert consulted for this CADTH review. These intravitreal corticosteroids are generally reserved for patients who do not respond well to anti-VEGF therapy.
Drug
Brolucizumab is a humanized VEGF inhibitor that binds to vascular endothelial growth factor A (VEGF-A) isoforms (e.g., VEGF110, VEGF121, and VEGF165), thereby preventing the binding of VEGF-A to its receptors, VEGFR-1 and VEGFR-2. By inhibiting VEGF-A binding, brolucizumab suppresses endothelial cell proliferation in vitro and reduces neovascularization and vascular permeability.10
On November 30, 2022, brolucizumab was approved by Health Canada for the treatment of patients with DME. The reimbursement criteria for brolucizumab requested by the sponsor are the same as the Health Canada indication.
As per the product monograph, the recommended dose for brolucizumab is 6 mg (0.05 mL) administered by intravitreal injection every 6 weeks for the first 5 doses. Thereafter, the physician may modify the treatment intervals based on disease activity, as assessed by visual acuity and/or anatomical parameters. In patients without disease activity, treatment up to every 12 weeks (3 months) could be considered. In patients with disease activity, treatment every 8 weeks (2 months) could be considered; however, the interval between 2 doses should not be less than every 8 weeks (2 months).10
A table describing key characteristics of commonly used anti-VEGF treatments for DME is presented in Table 3.
Table 3: Key Characteristics of Brolucizumab, Aflibercept, Ranibizumab, and Bevacizumab
Characteristics | Brolucizumab | Aflibercept | Ranibizumab | Bevacizumaba |
|---|---|---|---|---|
Mechanism of action | VEGF inhibitor (targets VEGF-A isoforms) | VEGF inhibitor (soluble decoy receptor that targets VEGF-A and PIGF) | VEGF inhibitor (an mAb that targets VEGF-A isoforms) | VEGF inhibitor (an mAb that targets VEGF) |
Indicationb | For the treatment of DME | No indication for DME (off-label) | ||
Route of administration | Intravitreal | |||
Recommended dose | 6 mg q.6.w. for 5 doses, then q.12.w. or q.8.w. based on disease activity. | 2 mg q.4.w. for 5 doses then q.8.w. (after first year, may be extended by increments of up to 2 weeks based on disease activity). There are limited data for treatment intervals longer than 4 months. | 0.5 mg q.4.w. until maximum VA is achieved and stable for 3 months. Thereafter monitor monthly, resume monthly injections if VA lost. | None. Off-label: 1.25 mg q.4.w. for approximately 6 loading doses, after which interval may be extended based on disease activity.c |
Serious adverse effects or safety issues |
|
|
|
|
ATE = arterial thromboembolic event (includes nonfatal stroke, nonfatal myocardial infarction, or vascular death); DME = diabetic macular edema; IOP = intraocular pressure; mAb = monoclonal antibody; PIGF = placental growth factor; q.4.w. = every 4 weeks; q.6.w. = every 6 weeks; q.8.w. = every 8 weeks; q.12.w. = every 12 weeks; q.16.w. = every 16 weeks; VA = visual acuity; VEGF = vascular endothelial growth factor; VEGF-A = vascular endothelial growth factor A.
aBevacizumab is used off-label in the treatment of DME.
bHealth Canada–approved indication.
cBased on expert opinion.
Sources: Product monographs for Beovu,10 Eylea,15,31 Lucentis,30 and Avastin.32
Stakeholder Perspectives
Patient Group Input
This section was prepared by CADTH staff based on the input provided by patient groups. The full original patient input(s) received by CADTH have been included in the stakeholder section at the end of this report.
Patient input was provided as a joint submission by 5 groups: Fighting Blindness Canada, Canadian Council of the Blind, CNIB, Vision Loss Rehabilitation Canada, and Diabetes Canada. The information used to inform the submission was based on an online survey of people in Canada living with DR or DME that was conducted in the first months of 2020 by the submitting organizations. A total of 67 people responded to the survey; many (44.4%) were between the ages of 61 and 80 years (n = 54) and the majority (76.1%) of respondents reported DME or DR in both eyes. Most respondents were either working full time (38.9%) or were retired (33.3%) (n = 54). A separate survey conducted by Canadian Council of the Blind in April 2020 further supported the submission by providing data on the impact of the COVID-19 pandemic on people living in Canada who are blind, deaf-blind, or partially sighted (n = 572).
Survey respondents emphasized that DR and DME have substantial and life-altering impacts on daily life, including on reading, driving, and using a phone. In addition to the concern for their eyesight worsening, coping with everyday life and general safety when outside of the home were identified as notable concerns of respondents during the preceding month. The results of the Canadian Council of the Blind survey showed that fear, anxiety, loneliness, and other psychosocial impacts were intensified for patients with age-related macular edema and DR during the pandemic.
The majority (56.4%) of respondents indicated they were currently receiving injections for DR or DME; the most common therapeutic options were Lucentis (29.4%), Eylea (24.6%), Avastin (20.2%), and Ozurdex (13.5%). Most (54.5%) respondents indicated they were satisfied with their injections and 63.6% indicated the injections have helped them avoid losing more eyesight (n = 22). Of note, 31.8% of respondents reported missing injections in the last year. According to respondents (n = 6), the reasons for cancelled or delayed appointments in the past included being too busy (50.0%), feeling unwell (33.3%), not being able to find someone to take them to the appointment (16.7%), and fear of injections (16.7%). According to respondents (n = 22), the most difficult part of eye injection appointments was the long wait times (50.0%), finding someone to take them to and from the appointment (31.8%), anxiety or fear about the injection (27.3%), and taking time off work (27.3%). No survey respondents reported experience with brolucizumab.
The submitting organizations indicated that any treatment that reduces the physical, psychological, and logistical strain on patients would be preferred. The submitting organizations suggested this may be addressed by a treatment that is less invasive, or similarly invasive but administered less frequently. Further, the submitting organizations suggested that any treatment that can extend the interval between injections while still minimizing vision loss would be considered advantageous for patients living with vision loss, particularly in the context of the COVID-19 pandemic.
Clinician Input
Input From Clinical Experts Consulted by CADTH
All CADTH review teams include at least 1 clinical specialist with expertise regarding the diagnosis and management of the condition for which the drug is indicated. Clinical experts are a critical part of the review team and are involved in all phases of the review process (e.g., providing guidance on the development of the review protocol; assisting in the critical appraisal of clinical evidence; interpreting the clinical relevance of the results; and providing guidance on the potential place in therapy). The following input was provided by 1 clinical specialist with expertise in the diagnosis and management of DME.
The clinical expert consulted by CADTH indicated that the treatment goals for DME with current therapies are to delay and, in some cases, reverse the progression of DME and/or DR, and to improve vision-related and general quality of life. While current anti-VEGF treatments for DME have been useful for treating DME over the past 10 to 15 years, they need to be given intravitreally by trained clinicians at treatment visits once every 1 to 3 months on an ongoing basis, often for years. This frequent administration poses a significant burden on patients and caregivers, especially in Canada where travel distances can be long and more challenging in winter. The clinical expert noted that longer-acting treatments would fill a significant unmet medical need by improving the convenience of the treatment regimen and reducing the burden on patients and caregivers. It could also improve outcomes by, in part, increasing adherence to treatment regimes. Additionally, the expert noted that not all patients respond to available treatments and, in some cases, a patient’s disease may become refractory to current treatment options.
Place in Therapy
According to the clinical expert, brolucizumab is expected to have a place in therapy that is similar to other anti-VEGFs as a first-line or later line of treatment in patients with DME. Treatment with brolucizumab is anticipated to reduce the burden of care by increasing the intervals between treatments while still maintaining therapeutic benefit compared with other anti-VEGFs, which could potentially address the unmet need related to frequent treatment visits.
In the clinical expert’s opinion, there are no clinical reasons to make it mandatory that patients first try other treatments before initiating brolucizumab. Brolucizumab is expected to be prescribed as a first-line (or later-line) treatment for DME and, as with any of the existing treatments, earlier initiation is important to achieve the best clinical outcomes.
Patient Population
Patients with DR associated with vision loss secondary to centre-involving macular edema are the best candidates for brolucizumab, according to the clinical expert. The clinical expert indicated that brolucizumab can be used in patients who are treatment-naive or require a change in therapy due to an inadequate response to other anti-VEGF drugs. Patients with better baseline visual acuity, centre-involving edema of recent onset, and better control of diabetes and comorbid conditions may be more likely to benefit from treatment. Patients who present with major structural damage to the macular retina (e.g., macular atrophy or fibrosis) may not be suitable candidates for treatment. Suitability for treatment would be assessed using clinical exam, IV fluorescein angiography, and OCT, potentially with the addition of OCT angiography. As OCT is used in current clinical practice, misdiagnosis is unlikely to occur. OCT is used not only for diagnosis but also for prognosis and follow-up.
Assessing Response to Treatment
The clinical expert noted that clinical evaluation and OCT should be performed at almost every dosing visit to assess treatment response with a treat-and-extend approach to achieve the longest sustainable interval without recurrence, and that monitoring between dosing visits would not be required. Key assessment outcomes include change in visual acuity, retinal thickness, injection frequency, and the presence of retinal fluid.
The clinical expert reported that optimal response to anti-VEGFs is generally achieved 6 to 12 months after initiation of therapy. In their experience, the majority of patients can achieve stabilized vision and improved quality of life, and about 50% to 65% of patients can achieve improvement in visual acuity.
The clinical expert noted that when assessing the magnitude of change in visual acuity, it is crucial to keep in mind that patients with better vision at baseline generally have less room for improvement than those with poor baseline vision. As such, the clinical expert reported there is no agreed-upon threshold indicative of a clinically meaningful change in visual acuity in patients with DME.
The clinical expert noted that the presence of SRF or IRF is an indicator of active disease that prompts the modification of the treatment plan, often involving a reduction in the injection interval.
Discontinuing Treatment
The clinical expert indicated that brolucizumab should be discontinued in patients experiencing treatment futility with proof of irreversible anatomic or functional damage, such as macular atrophy (ischemia) and fibrosis.
Prescribing Conditions
The clinical expert recommended retina subspecialty care as the most appropriate treatment setting for the prescription and administration of brolucizumab, especially in urban areas. In rural settings, trained comprehensive ophthalmologists with experience and expertise in managing DME may also be able to provide care.
Clinician Group Input
No input was received from any clinician groups for this submission.
Drug Program Input
The drug programs provide input on each drug being reviewed through CADTH’s reimbursement review processes by identifying issues that may impact their ability to implement a recommendation. The implementation questions and corresponding responses from the clinical experts consulted by CADTH are summarized in Table 4.
Table 4: Summary of Drug Plan Input and Clinical Expert Response
Drug program implementation questions | Clinical expert response |
|---|---|
Considerations for initiation of therapy | |
The inclusion criteria for the pivotal trials (KESTREL and KITE) included:
However, this is not consistent with the drug plan coverage criteria for currently listed anti-VEGFs (for example, the reimbursement criteria for Eylea in Ontario require a hemoglobin A1C value of less than 12%, while in PEI, a hemoglobin A1C value of 11% or less plus a central retinal thickness of 250 µm or greater are required for the initial coverage) and may raise issues if the recommendation is to “list in a similar manner.” Question 1: Are the ophthalmologic measures in the inclusion criteria for the KESTREL and KITE trials generally used in clinical practice in Canada? Question 2: The hemoglobin A1C criterion has resulted in pushback from prescribers, who feel it is inappropriate to require control of metabolic parameters before starting treatment (i.e., it would have no effect on treatment). In your opinion, is there a role for the hemoglobin A1C criterion in the initiation of treatment with anti-VEGFs? How often would the patients require treatment with anti-VEGFs for DME when they do not meet the hemoglobin A1C requirement? | Question 1: The clinical expert noted that the retinal eligibility criteria in the pivotal trials are consistent and realistic with respect to clinical practice. However, the expert did not support using the hemoglobin A1C criterion for reimbursement of treatment with brolucizumab. The reasons included the following:
Question 2: Patients with a hemoglobin A1C value consistently higher than 12% are less likely to benefit from anti-VEGF therapy in general. The expert indicated that they would not withhold treatment in these cases; however, the clinical expert emphasized blood sugar control, hypertension control, and cholesterol lowering as important strategies for the long-term preservation of vision in patients with diabetic retinopathy, especially DME. |
The reimbursement criteria for anti-VEGFs in at least 2 jurisdictions indicate that coverage of an alternative anti-VEGF will not be provided for the patients whose disease has failed to respond to a previous anti-VEGF therapy. Question 3: Should patients with DME who have not responded or adhered to a previous anti-VEGF be eligible for coverage if they switch to brolucizumab? | Question 3: The expert disagreed with this condition and indicated that patients should be eligible for reimbursement of brolucizumab therapy even if their disease has failed to respond to other anti-VEGFs. |
System and economic issues | |
The sponsor noted that bevacizumab (off-label treatment for DME) is not funded in all CADTH-participating jurisdictions. As such, its economic analysis was only against licensed treatments; the results suggest that at the submitted price ($1,390.00 per prefilled syringe), brolucizumab is a cost-saving option. Note that “cost-saving” will depend on the frequency of administration. Question 4 for CADTH (CDEC): Should bevacizumab also be considered in the economic evaluation? | Question 4: The clinical expert suggested that bevacizumab should be included in the budget impact analysis. Although DME is not a Health Canada–approved indication for bevacizumab, this drug is being used as an off-label therapy in clinical practice. |
BCVA = best-corrected visual acuity; CDEC = CADTH Canadian Drug Expert Committee; CSFT = central subfield thickness; DME = diabetic macular edema; SD-OCT = spectral domain optical coherence tomography; VEGF = vascular endothelial growth factor.
Clinical Evidence
The clinical evidence included in the review of brolucizumab is presented in 3 sections. The first section, the systematic review, includes pivotal studies provided in the sponsor’s submission to CADTH and Health Canada, as well as those studies that were selected according to an a priori protocol. The second section includes indirect evidence from the sponsor and indirect evidence selected from the literature that met the selection criteria specified in the review. The third section includes additional relevant sponsor-submitted studies that were considered to address important gaps in the evidence included in the systematic review.
Systematic Review (Pivotal and Protocol-Selected Studies)
Objectives
To perform a systematic review of the beneficial and harmful effects of brolucizumab 6 mg/0.05 mL solution for intravitreal injection for the treatment of DME.
Methods
Studies selected for inclusion in the systematic review included pivotal studies provided in the sponsor’s submission to CADTH and Health Canada, as well as those meeting the selection criteria presented in Table 5. Outcomes included in the CADTH review protocol reflect outcomes considered to be important to patients, clinicians, and drug plans.
Of note, the systematic review protocol presented subsequently was established before the granting of a Notice of Compliance by Health Canada.
Table 5: Inclusion Criteria for the Systematic Review
Criteria | Description |
|---|---|
Population | Patients with DME Subgroups:
|
Intervention | Brolucizumab 6 mg (0.05 mL) solution administered by intravitreal injection every 6 weeks for the first 5 doses. Thereafter, brolucizumab is administered every 12 weeks. Treatment intervals should be determined by the physician based on disease activity, and an interval of every 8 weeks could be considered. |
Comparator | Intravitreal VEGF inhibitors (e.g., aflibercept, ranibizumab, bevacizumaba) |
Outcomes | Efficacy outcomes:
Harms outcomes:
|
Study designs | Published and unpublished phase III and IV RCTs |
AE = adverse event; ATE = arterial thromboembolic event; CRT = central retinal thickness; DME = diabetic macular edema; DR = diabetic retinopathy; DRSS = Diabetic Retinopathy Severity Scale; ETDRS = Early Treatment Diabetic Retinopathy Study; HRQoL = health-related quality of life; IRF = intraretinal fluid; NEI VFQ-25 = National Eye Institute Visual Function Questionnaire–25; RCT = randomized controlled trial; SAE = serious adverse event; SRF = subretinal fluid; VEGF = vascular endothelial growth factor; WDAE = withdrawal due to adverse event.
Note: ATEs were defined as nonfatal stroke, nonfatal myocardial infarction, or vascular death (including deaths of unknown cause).
aOff-label treatment. There is no Health Canada–approved indication for the treatment of DME.
The literature search for clinical studies was performed by an information specialist using a peer-reviewed search strategy according to the PRESS Peer Review of Electronic Search Strategies checklist.35
Published literature was identified by searching the following bibliographic databases: MEDLINE All (1946–) through Ovid and Embase (1974–) through Ovid. All Ovid searches were run simultaneously as a multifile search. Duplicates were removed using Ovid deduplication for multifile searches, followed by manual deduplication in Endnote. The search strategy comprised both controlled vocabulary, such as the National Library of Medicine’s MeSH (Medical Subject Headings), and keywords. The main search concept was Beovu (brolucizumab). Clinical trial registries were searched: the US National Institutes of Health’s clinicaltrials.gov, WHO’s International Clinical Trials Registry Platform (ICTRP) search portal, Health Canada’s Clinical Trials Database, and the European Union Clinical Trials Register.
No filters were applied to limit the retrieval by study type. Retrieval was not limited by publication date or by language. Conference abstracts were excluded from the search results. Refer to Appendix 1 for the detailed search strategies.
The initial search was completed on July 28, 2022. Regular alerts updated the search until the meeting of the CADTH Canadian Drug Expert Committee (CDEC) on November 23, 2022.
Grey literature (literature that is not commercially published) was identified by searching relevant websites from the Grey Matters: A Practical Tool For Searching Health-Related Grey Literature checklist.36 Included in this search were the websites of regulatory agencies (FDA and European Medicines Agency). Google was used to search for additional internet-based materials. Refer to Appendix 1 for more information on the grey literature search strategy.
These searches were supplemented by reviewing bibliographies of key papers. In addition, the sponsor of the drug was contacted for information regarding unpublished studies.
Two CADTH clinical reviewers independently selected studies for inclusion in the review based on titles and abstracts, according to the predetermined protocol. Full-text articles of all citations considered potentially relevant by at least 1 reviewer were acquired. Reviewers independently made the final selection of studies to be included in the review, and differences were resolved through discussion.
Findings From the Literature
A total of 245 citations were identified from the literature search and 3 potentially relevant citations were identified from other sources. After screening, 4 reports of 2 unique studies were included in the systematic review (Figure 1). The included studies are summarized in Table 6.
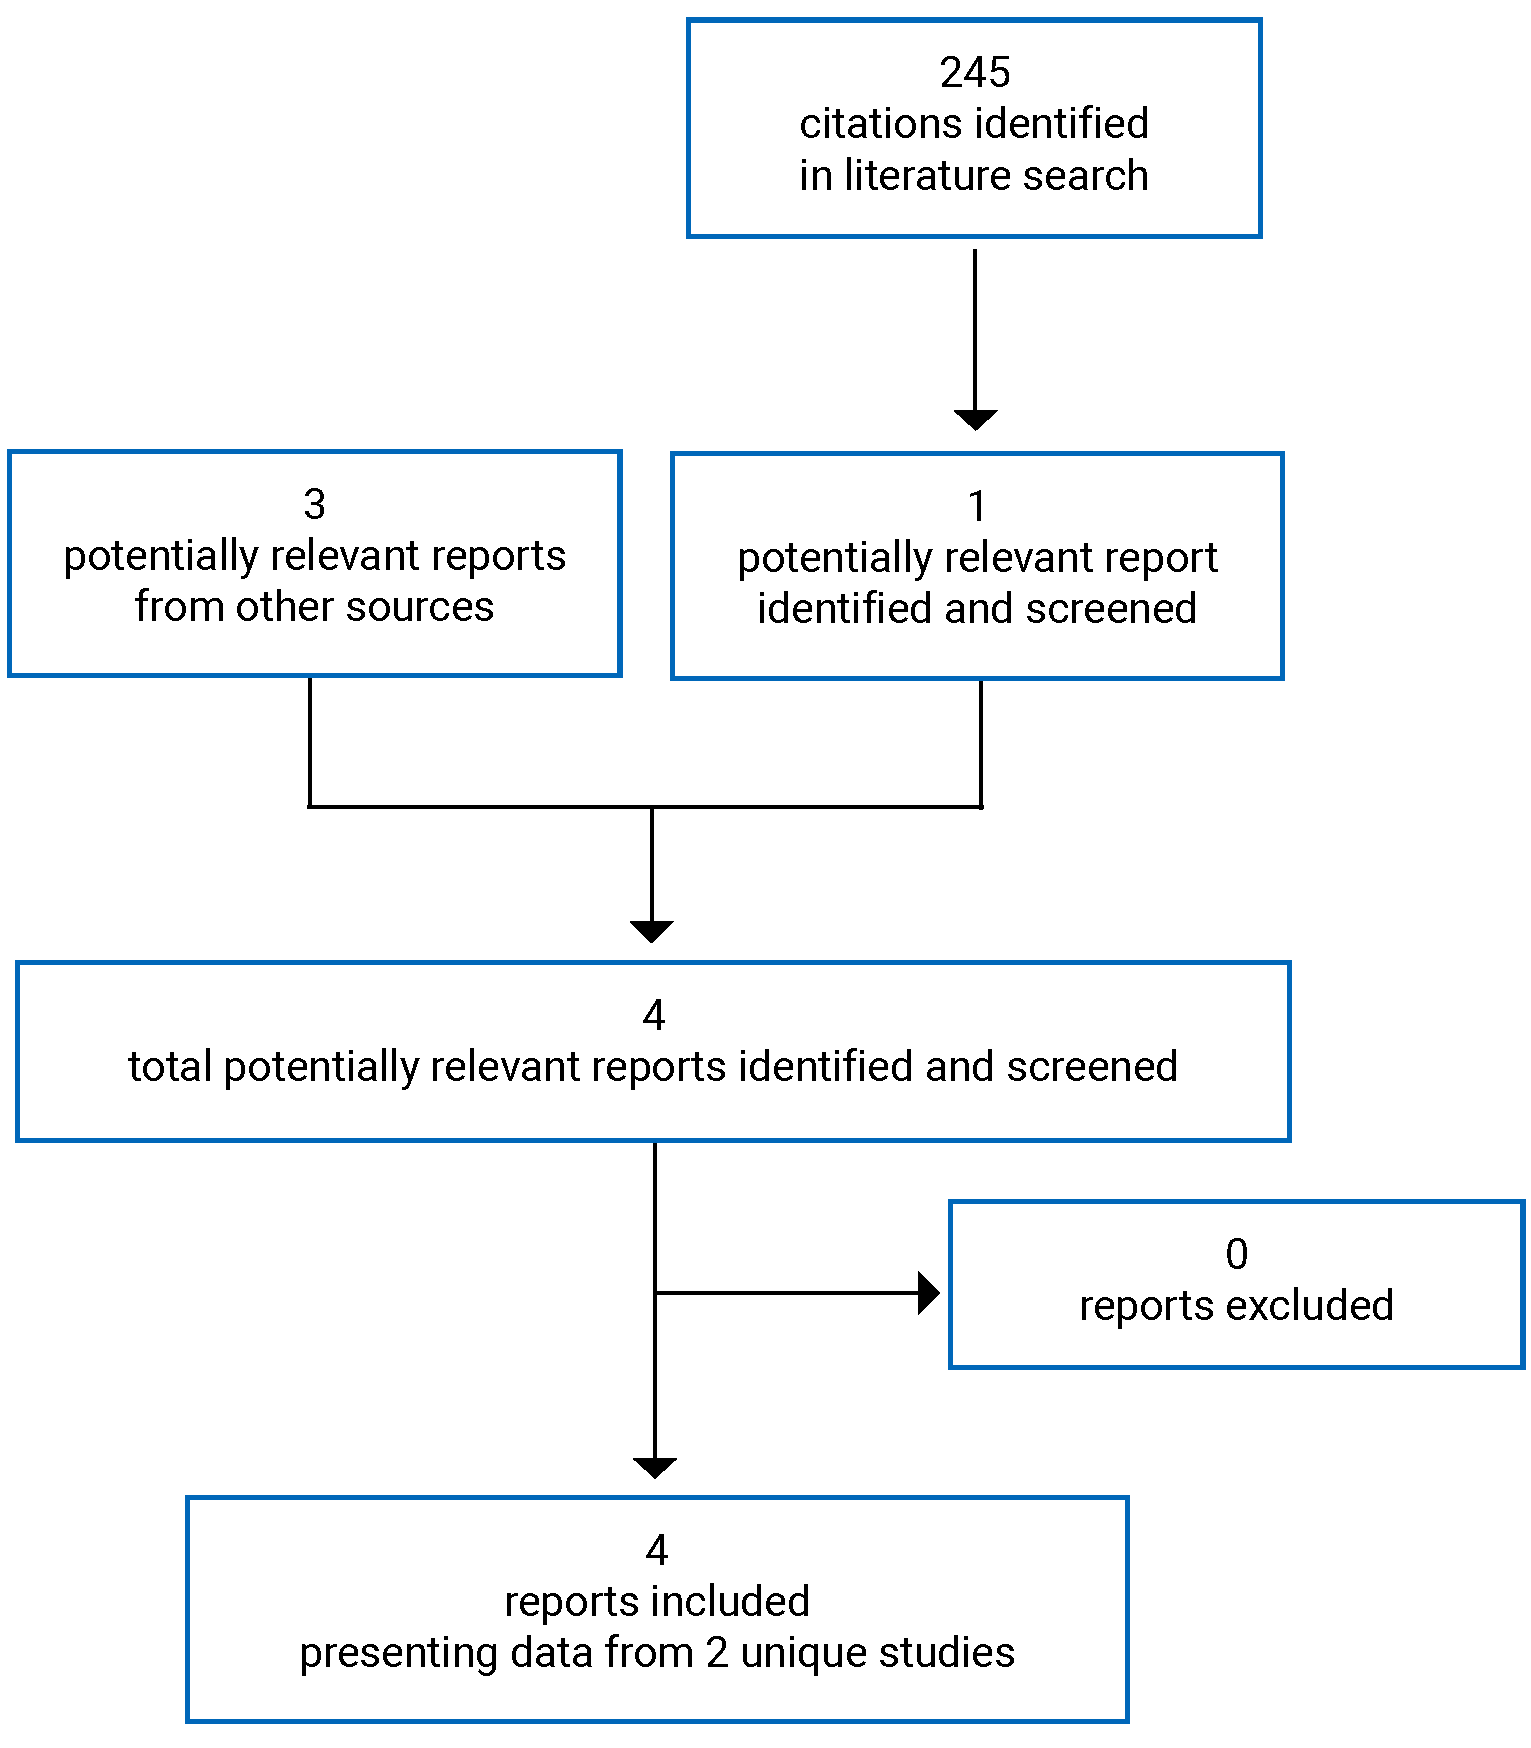
Table 6: Details of Included Studies
Details | KESTREL | KITE |
|---|---|---|
Designs and populations | ||
Study design | Phase III, double-blind, multicentre, active-controlled RCT | |
Locationsa | 117 sites in North America (including Canada), South America, Australia, Asia, Europe | 78 sites in Asia and Europe |
Patient enrolment dates | July 23, 2018 | July 27, 2018 |
Randomized (N) | 566 | 360 |
Inclusion criteria |
| |
Exclusion criteria |
Ocular treatments:
Systemic conditions or treatments:
| |
Drugs | ||
Intervention | Brolucizumab 6 mg or brolucizumab 3 mg IVT injections (5 × q.6.w. during loading phase, then q.12.w. or q.8.w. during maintenance phase) | Brolucizumab 6 mg (5 × q.6.w. IVT injections during loading phase, then q.12.w. or q.8.w. during maintenance phase with an option to extend the treatment interval to q.16.w. during the second year) |
Comparator(s) | Aflibercept 2 mg IVT injections (5 × q.4.w. during loading phase then q.8.w. during maintenance phase) | Aflibercept 2 mg IVT injections (5 × q.4.w. during loading phase then q.8.w. during maintenance phase) |
Duration | ||
Phase | ||
Screening | Up to 2 weeks | |
Double-blind | 96 weeks | |
Follow-up | 4 weeks | |
Outcomes | ||
Primary end point | Change from baseline in BCVA at week 52 | |
Secondary and exploratory end points | Secondary:
Exploratory:
| Secondary:
Exploratory:
|
Notes | ||
Publications | Brown et al. (2022)37 | |
ADA = antidrug antibody; AE = adverse event; BCVA = best-corrected visual acuity; CSFT = central subfield retinal thickness; DM = diabetes mellitus; DME = diabetic macular edema; DR = diabetic retinopathy; DRSS = Diabetic Retinopathy Severity Scale; ETDRS = Early Treatment Diabetic Retinopathy Study; IVT = intravitreal treatment; NEI VFQ-25 = National Eye Institute Visual Functioning Questionnaire–25; PDR = proliferative diabetic retinopathy; q.4.w. = every 4 weeks; q.6.w. = every 6 weeks; q.8.w. = every 8 weeks; q.12.w. = every 12 weeks; q.16.w. = every 16 weeks; RCT = randomized controlled trial; SD-OCT = spectral domain optical coherence tomography; VEGF = vascular endothelial growth factor.
Note: 1 additional report was included (submission).38
aInformation was obtained from Clinicaltrials.gov.
Sources: Clinical Study Reports for KESTREL11 and KITE.12
Description of Studies
Two studies were included in the systematic review: KESTREL11 and KITE.12 They were identically designed phase III, multicentre, randomized, double-blind, active-controlled, noninferiority trials that aimed to evaluate the efficacy and safety of brolucizumab compared with aflibercept in DME patients. Only treatment-naive patients were eligible for the studies.
The KESTREL trial (N = 566) was a 3-arm study designed to evaluate the efficacy and safety of brolucizumab 6 mg and 3 mg compared with aflibercept 2 mg in the study population. Patients were randomized using interactive response technology to 1 of the treatment arms in a ratio of 1:1:1, stratified by Japanese ethnicity. The dose of 3 mg was not recommended in the product monograph; therefore, results related to this dose were not included in this review.10 The KITE trial (N = 360) was a 2-arm study designed to evaluate the efficacy and safety of brolucizumab 6 mg compared with aflibercept 2 mg in patients with DME. Eligible patients were randomized using interactive response technology to 1 of the 2 treatment arms in a ratio of 1:1, stratified by systemic exposure sampling. All patients, investigators, and selected staff from the sponsor who had contact with patients or investigators or those who were involved in the direct conduct of the study until the final database lock were masked to the treatment assignment. In both studies, to ensure masking during study conduct, patients in both the brolucizumab arm and aflibercept arm received sham or active injections at every visit (except weeks 20, 28, and 100), and the investigational sites had masked and unmasked staff. The primary efficacy outcome in the 2 studies was change the from baseline in BCVA at week 52.
Both trials consisted of a screening period of up to 2 weeks followed by a 96-week double-blind phase. During the screening phase, patients were assessed for study eligibility based on prespecified inclusion and exclusion criteria.
Inclusion and Exclusion Criteria
The key inclusion criteria for both studies included patients aged 18 years or older with type 1 or 2 diabetes with macular thickening secondary to DME involving the centre of the fovea (CSFT ≥ 320 µm on spectral domain OCT), a hemoglobin A1C level of 0% or less, and BCVA scores of 78 to 23 letters using the ETDRS protocol (20/40 to 20/320 Snellen equivalent). Patients were excluded if they had active proliferative DR or had received previous treatment with any anti-VEGF drug or dexamethasone intravitreal implant. They were also excluded from the study if they had any active intraocular or periocular infection, active intraocular inflammation, or uncontrolled glaucoma in the study eye. The key inclusion and exclusion criteria for the trials are shown in Table 6. Only 1 eye was assigned as the study eye in the studies. If both eyes were eligible, the eye with the worse BCVA at baseline was selected (unless the other eye was deemed by investigators to be more suitable for treatment).
Baseline Characteristics
A summary of the baseline characteristics of the full analysis set population in both studies is shown in Table 7. Overall, the baseline demographic and ocular characteristics of patients were balanced between the treatment arms within each study. The mean age of patients enrolled was 62.2 to 64.4 years. The majority of the patients were male (58% to 67%) and white (73% to 84%). At baseline, the level of hemoglobin A1C was 7.4% to 7.7%, on average. The mean time since the diagnosis of DME was 9.4 to 12.5 months in the KESTREL trial and 9.9 to 10.4 months in the KITE trial; the mean baseline CSFT in these 2 studies ranged from 453 μm to 484 μm. The mean baseline BCVA score was approximately 64 letters in both studies although, in the KITE trial, there was an imbalance in the number of ETDRS letters: 66.0 letters (SD = 10.8) in the brolucizumab group and 63.7 letters (SD = 11.7) in the aflibercept group. IRF was present in almost all patients, while SRF was present in only a small portion of the study population (31% to 37%). The majority of the patients were categorized as having either mild or severe nonproliferative DR. In the KESTREL trial, the mean CSFT was 453.1 μm (SD = 123.4 µm) in the brolucizumab 6 mg arm and 475.6 μm (SD = 135.8 µm) in the aflibercept 2 mg arm. In the KITE trial, the mean CSFT was 481.1 µm (SD = 132.5 µm) in the brolucizumab 6 mg arm and 484.4 µm (SD = 134.6 µm) in the aflibercept 2 mg arm. Only a small number of patients had received prior ocular medications (2% to 3% in the KESTREL trial and 9% to 11% in the KITE trial). Concomitant use of ocular medications was reported in 31% to 37% of the patient population.
Table 7: Summary of Baseline Characteristics, FAS
Characteristic | KESTREL | KITE | ||
|---|---|---|---|---|
Brolucizumab 6 mg (N = 189) | Aflibercept 2 mg (N = 187) | Brolucizumab 6 mg (N = 179) | Aflibercept 2 mg (N = 181) | |
Age (years), mean (SD) | 62.4 (10.1) | 63.9 (10.1) | 62.3 (10.6) | 62.2 (9.5) |
Sex, n (%) | ||||
Male | 110 (58.2) | 126 (67.4) | 120 (67.0) | 115 (63.5) |
Female | 79 (41.8) | 61 (32.6) | 59 (33.0) | 66 (36.5) |
Race, n (%) | ||||
White | 158 (83.6) | 153 (81.8) | 133 (74.3) | 132 (72.9) |
Black or African American | 4 (2.1) | 7 (3.7) | 3 (1.7) | 1 (0.6) |
Asian | 25 (13.2) | 27 (14.4) | 43 (24.0) | 48 (26.5) |
Native Hawaiian or other Pacific Islander | 2 (1.1) | 0 (0) | 0 | 0 |
American Indian or Alaska Native [wording from original source] | 0 (0) | 1 (0.5) | 0 | 0 |
Diabetes type, m (%) | ||||
Type 1 | 12 (6.3) | 6 (3.2) | 19 (10.6) | 7 (3.9) |
Type 2 | 177 (93.7) | 181 (96.8) | 160 (89.4) | 174 (96.1) |
Hemoglobin A1C (%), mean (SD) | 7.7 (1.1) | 7.4 (1.1) | 7.6 (1.2) | 7.5 (1.2) |
Study eye, m (%) | ||||
OS | 98 (51.9) | 95 (50.8) | 95 (53.1) | 97 (53.6) |
OD | 91 (48.1) | 92 (49.2) | 84 (46.9) | 84 (46.4) |
Time since DME diagnosis (months), mean (SD) | 9.4 (19.5) | 9.6 (24.2) | 10.4 (16.6) | 9.9 (20.7) |
BCVA | ||||
Letters, n (SD) | 66.6 (9.7) | 65.2 (12.4) | 66.0 (10.8) | 63.7 (11.7) |
≤ 65 letters, m (%) | 74 (39.2) | 64 (34.2) | 65 (36.3) | 91 (50.3) |
> 65 letters, m (%) | 115 (60.8) | 123 (65.8) | 114 (63.7) | 90 (49.7) |
Macular edema type, m (%) | ||||
Focal | 59 (31.7) | 48 (26.4) | 63 (35.4) | 66 (37.7) |
Diffuse | 127 (68.3) | 134 (73.6) | 115 (64.6) | 109 (62.3) |
Cannot grade | 0 (0) | 0 (0) | 0 | 0 |
CSFT | ||||
μm, m (SD) | 453.1 (123.4) | 475.6 (135.8) | 481.1 (132.5) | 484.4 (134.6) |
< 450 μm, m (%) | 107 (56.6) | 96 (51.3) | 85 (47.5) | 82 (45.6) |
≥ 450 μm to < 650 μm, m (%) | 70 (37.0) | 71 (38.0) | 74 (41.3) | 79 (43.9) |
≥ 650 μm, m (%) | 12 (6.3) | 20 (10.7) | 20 (11.2) | 19 (10.6) |
Leakage on fluorescein angiography, m (%) | 186 (100) | 182 (100) | 178 (100) | 175 (100) |
IRF, m (%) | ||||
Present | 189 (100.0) | 184 (98.4) | 176 (98.3) | 179 (98.9) |
Absent | 0 | 3 (1.6) | 3 (1.7) | 2 (1.1) |
SRF, m (%) | ||||
Present | 62 (32.8) | 61 (32.6) | 56 (31.3) | 67 (37.0) |
Absent | 127 (67.2) | 126 (67.4) | 123 (68.7) | 114 (63.0) |
DRSS, m (%) | ||||
n | 186 | 184 | 176 | 177 |
1. DR absent | 0 | 0 | 3 (1.7) | 1 (0.6) |
2. Microaneurysms only | 1 (0.5) | 3 (1.6) | 0 | 2 (1.1) |
3. Mild NPDR | 57 (30.6) | 52 (28.3) | 49 (27.8) | 37 (20.9) |
4. Moderate NPDR | 54 (29.0) | 59 (32.1) | 55 (31.3) | 68 (38.4) |
5. Moderately severe NPDR | 15 (8.1) | 16 (8.7) | 30 (17.0) | 20 (11.3) |
6. Severe NPDR | 45 (24.2) | 40 (21.7) | 26 (14.8) | 34 (19.2) |
7. Mild PDR | 3 (1.6) | 7 (3.8) | 9 (5.1) | 7 (4.0) |
8. Moderate PDR | 8 (4.3) | 5 (2.7) | 3 (1.7) | 5 (2.8) |
9. High-risk PDR | 3 (1.6) | 2 (1.1) | 1 (0.6) | 2 (1.1) |
10. Very high-risk PDR | 0 | 0 | 0 | 0 |
11. Advanced PDR | 0 | 0 | 0 | 1 (0.6) |
12. Very advanced PDR | 0 | 0 | 0 | 0 |
Prior ocular medications, n (%) (safety set) | 6 (3.2) | 3 (1.6) | 16 (8.9) | 20 (11.0) |
Concomitant ocular medications, n (%) (safety set) | 65 (34.4) | 57 (30.5) | 67 (37.4) | 56 (30.9) |
Antibiotics | 7 (3.7) | 6 (3.2) | 8 (4.5) | 8 (4.4) |
Nonsteroidal anti-inflammatories | 9 (4.8) | 3 (1.6) | 5 (2.8) | 6 (3.3) |
Corticosteroids, plain | 15 (7.9) | 9 (4.8) | 13 (7.3) | 14 (7.7) |
Other ophthalmological drugs | 28 (14.8) | 23 (12.3) | 28 (15.6) | 28 (15.5) |
BCVA = best-corrected visual acuity; CSFT = central subfield thickness; DME = diabetic macular edema; DR = diabetic retinopathy; DRSS = Diabetic Retinopathy Severity Scale; FAS = full analysis set; IRF = intraretinal fluid; m = number of patients with assessment meeting the criterion for the given categorical variables; NPDR = nonproliferative diabetic retinopathy; OD = right eye; OS = left eye; PDR = proliferative diabetic retinopathy; SD = standard deviation; SRF = subretinal fluid.
Interventions
In both studies, patients randomized to the brolucizumab groups (brolucizumab 3 mg or 6 mg in the KESTREL trial, and brolucizumab 6 mg in the KITE trial) received 5 loading doses every 6 weeks followed by dosing every 12 weeks in the maintenance phase, with optional adjustment to every 8 weeks if disease activity was identified at predefined assessment visits. In the KITE trial, patients had the option to extend the treatment interval by 4 weeks at week 72.
In both studies, at the beginning of the maintenance phase, patients in the brolucizumab group were initially on a treatment schedule of every 12 weeks. The patients remained on that schedule as long as the masked investigator did not identify DME disease activity that, in their opinion, required more frequent anti-VEGF treatment. If a need for a regimen of every 8 weeks was determined to be appropriate, the patients were assigned to receive injections every 8 weeks thereafter, up to the end of the study. In the KITE study, a disease stability assessment was carried out at week 72 (i.e., no disease activity detected during the last 2 DAA visits). If disease stability was observed at week 72, injection intervals could be extended by 4 weeks (i.e., from every 12 weeks to every 16 weeks or from every 8 weeks to every 12 weeks).
In the 2 studies, patients who were randomized to the comparator group (aflibercept 2 mg) received 5 loading doses every 4 weeks followed by fixed dosing every 8 weeks in the maintenance phase. No treatment frequency adjustments were permitted in the aflibercept 2 mg arm.
In the KESTREL and KITE trials, if patients needed 8-week interval dosing at a previous DAA visit, rescue treatment was allowed with laser (focal and/or grid) photocoagulation, along with study treatment, from week 36 onward if DME worsened and caused a loss of 10 or more letters at 2 consecutive visits or 15 or more letters at 1 visit compared with the best previous measurement, with BCVA not better than baseline. Panretinal photocoagulation was permitted at any time during the study as deemed necessary by the investigator, and the patient was allowed to continue the study with the assigned study treatment.
Dose adjustments and/or interruptions were not permitted in either study unless the interruptions were warranted by an AE. Treatment frequency adjustments (from every 12 weeks to every 8 weeks in the KESTREL trial, or from every 16 weeks or every 12 weeks to every 8 weeks in the KITE trial) were permitted in the brolucizumab arms if DME disease activity was identified by the masked investigator in the prespecified DAA visits. No treatment frequency adjustments were permitted in the aflibercept 2 mg arm.
Outcomes
A list of the efficacy and harm end points identified in the CADTH review protocol that were assessed in the clinical trials included in this review is provided in Table 8. These end points are further summarized subsequently. A detailed discussion and critical appraisal of the outcome measures is provided in Appendix 3.
Table 8: Summary of Outcomes of Interest Identified in the CADTH Review Protocol
Outcome measure | KESTREL | KITE |
|---|---|---|
Change from baseline in visual acuity (i.e., ETDRS charts) | Primary and secondary | Primary and secondary |
Change from baseline in CSFT | Secondary | Secondary |
HRQoL | Secondary | Secondary |
Blindness (legal) | Not assessed | |
Change in vision-related function (i.e., NEI VFQ-25) | Secondary | Secondary |
Change from baseline in DR severity (e.g., ETDRS DRSS) | Secondary | Secondary |
Proportion of patients with presence of SRF or IRF | Secondary | Secondary |
Frequency of injections | Secondary | Secondary |
Harm outcomes | Secondary | Secondary |
AE = adverse event; CSFT = central subfield thickness; DR = diabetic retinopathy; DRSS = Diabetic Retinopathy Severity Scale; ETDRS = Early Treatment Diabetic Retinopathy Study; HRQoL = health-related quality of life; IRF = intraretinal fluid; NEI VFQ-25 = Visual Functioning Questionnaire–25; SAE = serious adverse event; SRF = subretinal fluid.
Change From Baseline in Visual Acuity
The change from baseline in BCVA (ETDRS letters) averaged at week 52 was the primary end point in both studies. Secondary end points of change in visual acuity included:
change from baseline in BCVA at each visit up to week 100
proportion of patients gaining 5, 10, 15, or more ETDRS letters in BCVA from baseline at each visit up to week 100
proportion of patients avoiding loss in BCVA of 5, 10, 15, or more ETDRS letters from baseline at each visit up to week 100.
These outcomes were also assessed over time (i.e., at all assessment time points through week 100).
The BCVA score was measured based on the ETDRS visual acuity chart assessed at a starting distance of 4 m. ETDRS charts consist of 70 letters that are distributed across 14 rows. Each row contains a series of 5 letters of equal difficulty, with standardized spacing between the letters and rows. The level of difficulty increases between successive rows as the size of the characters decreases. The BCVA score corresponds to the number of letters 1 can read from the ETDRS chart. The visual acuity letter score is equal to the total number of letters read correctly at 4 m plus 30. If fewer than 20 letters are read correctly at 4 m, the visual acuity letter score is equal to the total number of letters read correctly at 4 m plus the total number of letters in the first 6 lines read correctly at 1 m. The ETDRS letter score could result in a maximum score of 100, with higher scores indicating better visual acuity. Reading more lines (i.e., more letters) indicates better visual acuity.39,40 In terms of a minimal important difference (MID), no data were identified in patients with DME. For more information regarding the ETDRS refer to Appendix 3.
ETDRS results can be converted to Snellen fractions, another common measure of visual acuity, in which the numerator indicates the distance at which the chart was read, and the denominator indicates the distance at which a person may discern letters of a particular size. A larger denominator indicates worsening vision; for example, a person with 20/100 vision can read letters at 20 feet that a person with 20/20 vision could read at 100 feet.
Retinal Thickness
The retinal thickness of the study eye was measured using spectral domain OCT. This is a key anatomic parameter of the central macula and is defined as the average thickness of a 1 mm circular area centred around the fovea and measured from the Bruch membrane to the internal limiting membrane, inclusive. The change from baseline in CSFT from baseline at each visit up to week 100 was a secondary outcome in both studies. A reduction in CSFT is considered a favourable outcome in the treatment of DME; however, an MID has not been established. For more information on the use of OCT to measure changes in retinal thickness, refer to Appendix 3.
HRQoL and Vision-Related Function
Both studies measured the change from baseline in the NEI VFQ-25 composite score at week 52 (and over time) as a secondary end point. The NEI VFQ-25 was administered from baseline up to week 100 by masked site staff. The NEI VFQ-25 is a questionnaire developed to measure vision-targeted quality of life. The questionnaire consists of 25 items relevant to 11 vision-related constructs as well as a single-item, general-health component. The overall composite score ranges from 0 to 100, with 0 representing worst vision-related function and 100 representing best vision-related function. In addition, there are 12 subscale scores (e.g., near vision, distance vision, driving).41 The questionnaire has a reported MID of between 3.3 and 6.13 points for the overall composite score. A psychometric validation study of the NEI VFQ-25 specifically in patients with DME found that the MID for each NEI VFQ-25 domain ranged from 8.80 (general vision) to 14.40 (role difficulties) and produced a composite score MID of 3.33 to 6.13 points, depending on the approach used to estimate the MID.42 For more information on the properties of the NEI VFQ-25, refer to Appendix 3.
Blindness (Legal)
Legal blindness is defined as a BCVA of 20/200 or less in both eyes, measured with a Snellen chart, and/or a visual field of 20 degrees or narrower.43 This outcome was not assessed in either study.
Change From Baseline in DR Severity
The severity of DR was evaluated using the ETDRS DRSS score assessed by the central reading centre based on colour fundus photography images and fluorescein angiography in the study eye. The ETDRS DRSS is a scale that consists of 13 levels of graded photographic characteristics that were defined to categorize the severity of DR for individual eyes, ranging from no retinopathy to severe vitreous hemorrhage. Each of the 13 levels on the scale is defined by a set of criteria based on the presence and/or severity of abnormalities, with scores increasing in order of severity from 10 to 85. Higher scores on the scale indicate worsening of DR. Step progression refers to an increase in photographic level that can be used to describe the change (improvement or worsening) in DR over time.44 In the ETDRS, the proportion of eyes that progressed 2 or more levels at follow-up was relatively similar among all severity categories at the 1-year follow-up time point, establishing 2-step progression as a reasonable outcome measure for all baseline retinopathy levels.44 For more information regarding the DRSS, refer to Appendix 3. The end points related to DR were derived from the ETDRS DRSS score assessed by the central reading centre based on colour fundus photography images in the study eye at different visits. The proportion of patients with an improvement of 2 or more steps in DR severity from baseline on the ETDRS DRSS at week 52 was a secondary end point in both studies. Other end points included a 2-step or greater or 3-step or greater improvement or worsening from baseline over time on the ETDRS DRSS.
When the ETDRS DR severities were evaluable, they were categorized on the original scale with scores varying from 10 (DR absent) to 85 (very advanced proliferative DR). All DRSS values were then converted into a 12-level scale, allowing the derivation of the 2-step and 3-step change from baseline for each postbaseline assessment (weeks 28, 52, 76, and 100). All DRSS analyses presented in this report were based on the 12-level scale. The following table illustrates how the severity of DR was defined based on the original DRSS and a modified 12-point scale (Table 9).
Table 9: Definition of DRSS Using the Original DRSS and the 12-Point Scale
Original DRSS | 12-point scale | Definition of DRSS |
|---|---|---|
10 | 1 | DR absent |
20 | 2 | Microaneurysms only |
35 | 3 | Mild NPDR |
43 | 4 | Moderate NPDR |
47 | 5 | Moderately severe NPDR |
53 | 6 | Severe NPDR |
61 | 7 | Mild PDR |
65 | 8 | Moderate PDR |
71 | 9 | High-risk PDR |
75 | 10 | Very high-risk PDR |
81 | 11 | Advanced PDR |
85 | 12 | Very advanced PDR |
DR = diabetic retinopathy; DRSS = Diabetic Retinopathy Severity Score; NPDR = nonproliferative diabetic retinopathy; PDR = proliferative diabetic retinopathy.
Sources: Clinical Study Reports for KESTREL11 and KITE.12
Proportion of Patients With Presence of SRF or IRF
The proportion of patients with an absence of IRF and/or SRF at week 52 and over time were measured as secondary end points. SRF and IRF located specifically in the central subfield (within a 1 mm diameter of the centre of the macula) were of interest.
Frequency of Injections
The proportion of patients in the brolucizumab arm on a treatment interval of every 8 weeks, every 12 weeks, or every 16 weeks at 1 year and 2 years as well as the treatment intervals in this arm over time were secondary outcomes of the studies. The time to first need for treatment every 8 weeks in the study population was reported in both studies, which identified disease activity that, according to the masked investigator, required more frequent anti-VEGF treatment.
Harm Outcomes
In both studies, the safety analysis included the incidence and severity of ocular and nonocular AEs occurring throughout the study period. The occurrence of AEs was assessed at all assessment time points.
Statistical Analysis
Sample Size Calculation
In the KESTREL trial, a sample size of 160 patients per arm was required to demonstrate noninferiority (using a noninferiority margin of 4 ETDRS letters) between brolucizumab 6 mg or 3 mg versus aflibercept 2 mg in the full analysis set population with respect to the change in BCVA from baseline at week 52, with 90% power at a 1-sided alpha level of 0.025, assuming equal means and a common SD of 11 letters. Considering a dropout rate of 10%, a total of 534 patients (178 per arm) were planned to be randomized.
Similarly, in the KITE trial, a sample size of 160 patients per arm was required to demonstrate noninferiority (using a noninferiority margin of 4 ETDRS letters) between brolucizumab 6 mg versus aflibercept 2 mg in the full analysis set population with respect to the change in BCVA from baseline at week 52, with 90% power at a 1-sided alpha level of 0.025, assuming equal means and a common SD of 11 letters. Considering a dropout rate of 10%, a total of 356 patients (178 per arm) were planned to be randomized.
Statistical Analysis for Efficacy Outcomes
In the KESTREL and KITE trials, the primary and relevant secondary efficacy end points were assessed using a hierarchical approach for multiple testing. The objective of the analyses on the primary and first key secondary end points was to demonstrate noninferiority of brolucizumab to aflibercept with respect to change from baseline in BCVA, using a margin of 4 ETDRS letters. Superiority testing for secondary end points was performed only if noninferiority was demonstrated for the change in BCVA from baseline to week 52, or from baseline to week 40 through to week 52.
In the KESTREL trial, the following noninferiority hypotheses are related to a noninferiority margin of 4 letters:
H1. Brolucizumab 6 mg is noninferior to aflibercept for change in BCVA from baseline to week 52.
H2. Brolucizumab 6 mg is noninferior to aflibercept for change in BCVA from baseline averaged over weeks 40 to 52.
H3. Brolucizumab 3 mg is noninferior to aflibercept for change in BCVA from baseline to week 52.
H4. Brolucizumab 3 mg is noninferior to aflibercept for change in BCVA from baseline averaged over weeks 40 to 52.
These 4 hypotheses were tested sequentially in the order of their numbering, i.e., confirmatory testing of the second, third, or fourth hypothesis required the rejection of each preceding null hypothesis. In this setting, each hypothesis was assessed at a 1-sided significance level of 0.025.
In the KITE study, the following noninferiority hypotheses are related to a noninferiority margin of 4 letters:
H1. Brolucizumab 6 mg is noninferior to aflibercept for change in BCVA from baseline to week 52.
H2. Brolucizumab 6 mg is noninferior to aflibercept for change in BCVA from baseline averaged over weeks 40 to 52.
These 2 alternative hypotheses were tested sequentially in the order of their numbering, i.e., confirmatory testing of the second hypothesis required rejection of the first null hypothesis. The average change from baseline in CSFT over the period from week 40 through week 52 was derived as the average of the changes from baseline to weeks 40, 44, 48, and 52. In this setting, each hypothesis was assessed at a 1-sided significance level of 0.025, while keeping the global type I error rate at 0.025.
Continuous variables were summarized using the number of observations, mean, standard deviation (SD), standard errors (SE), median, quartiles, and minimum and maximum values. Categorical variables were summarized with number of observations, the number of observations for each category, and the corresponding percentage. Where appropriate, 2-sided 95% CIs for point estimates of the mean or proportion were provided. For the between-treatment difference for brolucizumab versus aflibercept, point estimates and 95% CIs were provided as appropriate, unless otherwise specified.
Primary Outcome of the Studies
In both studies, the primary efficacy end point was the change from baseline in BCVA in the study eye at week 52. The first key secondary end point was the average change from baseline in BCVA in the study eye over the period from week 40 through week 52. For each patient, this end point was defined as the average of the changes from baseline to weeks 40, 44, 48, and 52.
The primary analysis of the primary and first key secondary end points was based on the full analysis set, with LOCF imputation of missing or censored BCVA values. An analysis of variance (ANOVA) model was used in data analyses. The model included treatment, baseline BCVA (≤ 65 letters to > 65 letters) and age category (< 65 years to ≥ 65 years) as factors. The 2-sided 95% CI for the LS mean difference (brolucizumab minus aflibercept) was presented in letters. Noninferiority was considered established if the lower limit of the corresponding 95% CI was greater than −4 letters. P value for treatment comparison (2-sided) and P value for noninferiority (4-letter margin) (1-sided) were presented.
Noninferiority Margin
In the KESTREL and KITE studies, a noninferiority margin of 4 ETDRS letters was used in the primary outcome analysis, where noninferiority would be demonstrated if the lower limit of the corresponding 95% CI of the difference in change in adjusted mean BCVA from baseline between brolucizumab and aflibercept was greater than −4 ETDRS letters. According to the clinical study reports, this noninferiority margin “provided assurance that both absolute efficacy and efficacy relative to the active comparator… could be established and any proof of noninferiority only occurred if the observed treatment differences were of no clinical relevance.”11,12
Secondary Outcomes of the Studies
Secondary efficacy end points in the pivotal studies are related to visual acuity (e.g., change from baseline in BCVA at each visit up to week 100), dosing regimen (e.g., proportion of patients maintained at every 12 weeks up to week 100 for brolucizumab treatment arms only), anatomy (e.g., CSFT determined by spectral domain OCT, proportion of patients with presence of SRF and/or IRF at each assessment visit) or status of DR (e.g., proportion of patients with an improvement or worsening of 2 or more or 3 or more steps from baseline in the ETDRS DRSS score at each assessment visit).
All secondary efficacy end points were summarized and presented descriptively based on the full analysis set, with LOCF imputation for missing or censored data. The continuous secondary end points related to BCVA and CSFT were analyzed using ANOVA models. The estimates of LS mean for each treatment and for the treatment differences for brolucizumab minus aflibercept, including 95% CIs for the treatment differences, were presented. For categorical variables (binary end points), frequency tables (count and percentage) were provided by time point. In addition, proportions and treatment differences in proportions along with 95% CIs were presented for each time point using logistic regression, with treatment, the corresponding baseline status (similar to the ones specified for the ANOVA models), and age categories as fixed effects.
Type I Error Control
In both studies, confirmatory hypothesis testing for the additional secondary end points was performed in case the proof of noninferiority related to BCVA was successful for the 4 hypotheses specified previously (for the KESTREL trial) for the primary and first key secondary end points (corresponding to H1, H2, H3, and H4), or for the 2 hypotheses specified previously (for the KITE trial) for the primary and first key secondary end points.
In the KESTREL trial, the additional hypotheses were linked to the following end points when the proof of noninferiority related to BCVA was successful for the first 4 hypotheses specified previously:
H5. Average change from baseline in CSFT over the period from week 40 through week 52 in the study eye
H6. Absence of fluid in the study eye at week 52 (“no” indicates absence of SRF and IRF)
H7. Change from baseline in CSFT at week 4 in the study eye
H8. Average change from baseline in BCVA over the period from week 40 through week 52 in the study eye
All tests were 1-sided tests for superiority of brolucizumab 6 mg versus aflibercept 2 mg only if:
each of the first 4 null hypotheses was rejected at a 1-sided significance level of 0.025
the entire alpha was distributed between the null hypotheses related to the superiority testing of H5 (90% of 0.025 = 0.0225) and H6 (10% of 0.025 = 0.0025).
The familywise type I error rate was controlled at the 1-sided 2.5% level across the tested null hypotheses using the closed testing procedure specified in Figure 2, using the graphical method of Bretz et al.45
Figure 2: Multiple Testing Strategy in the KESTREL Study
H = hypothesis.
Source: Clinical Study Report for KESTREL.11
In the KITE study, the additional efficacy hypotheses were linked to the following end points:
A. Average change from baseline in CSFT over the period from week 40 through week 52 in the study eye
B. Average change from baseline in BCVA over the period from week 40 through week 52 in the study eye
C. Fluid status “yes/no” in the study eye at week 52 (“no” indicates absence of SRF and IRF)
All tests were 1-sided tests for superiority of brolucizumab versus aflibercept. The alternative hypotheses were tested hierarchically in order (A, then B, then C), i.e., confirmatory testing of the hypothesis requires rejection of the previous null hypothesis. In this setting, each hypothesis was assessed at a 1-sided significance level of 0.025, while keeping the global type I error rate at 0.025.
Sensitivity Analyses
In the KESTREL and KITE trials, sensitivity analyses were conducted (in the full analysis set only) to assess the robustness of the hypothesis testing resulting from the primary analysis using the MMRM assuming missing at random. Other sensitivity analyses on the primary end point were also considered, such as a tipping point analysis or multiple imputation.
Subgroup Analyses
Subgroup analyses were performed in the year 1 Clinical Study Report, for the primary and key secondary efficacy variables only, to assess the consistency of treatment effect across various subgroups of interest. The prespecified subgroups in the KESTREL and KITE trials were:
age (< 65 years, ≥ 65 years)
gender (male, female)
diabetes type (type 1, type 2)
baseline hemoglobin A1C (< 7.5%, ≥ 7.5%)
baseline BCVA (≤ 65 letters, > 65 letters)
duration of DME since the primary diagnosis (≤ 3 months, > 3 months to < 12 months, ≥ 12 months)
DME type (focal, diffuse), as per central reading centre
baseline CSFT (< 450 μm, ≥ 450 μm to < 650 μm, ≥ 650 μm)
baseline status of IRF (presence, absence)
baseline status of SRF (presence, absence)
Ethnicity (Japanese, not Japanese) was another subgroup that was explored in the KESTREL trial. Only data for the subgroups defined in the CADTH review protocol are presented in this report.
Data Imputation Methods
In the KESTREL and KITE studies, the primary analysis of the primary and first key secondary end points was based on the full analysis set, with LOCF imputation of missing or censored BCVA values.
Missing data for all the secondary efficacy end points were imputed using the LOCF method.
Analysis Populations
The analysis populations in the KESTREL and KITE trials were defined using the same methods.
The full analysis set consisted of all randomized patients who received at least 1 intravitreal injection of the study treatment. This was the primary analysis set for all efficacy analyses. Patients were analyzed according to the treatment they were assigned to at randomization.
The per-protocol set was a subset of the full analysis set and excluded or censored patients with important protocol deviations and analysis restrictions that were expected to significantly affect the validity of the assessment of efficacy and/or safety at week 52, such as lack of compliance, missing data, prohibited concomitant medication, and deviations from the inclusion or exclusion criteria. The per-protocol set was not used in any analysis presented in the year 2 KESTREL and KITE Clinical Study Reports.
The safety analysis set (SAF) included all patients who received at least 1 intravitreal injection of the study drug. Patients in the SAF were analyzed according to the treatment arm from which they received the majority of treatments up to and including week 48. The SAF was used in the analysis of all safety variables.
Results
Patient Disposition
In the KESTREL study, of the 873 patients who were screened, 189 and 187 were randomized to the brolucizumab 6 mg group and aflibercept 2 mg group, respectively. Prior to week 100, 35 patients (18.5%) in the brolucizumab group and 34 patients (18.2%) in the aflibercept group withdrew prematurely from the study.
In the KITE study, out of 480 screened patients, 179 and 181 were randomized to the brolucizumab 6 mg group and aflibercept 2 mg group, respectively. Before week 100, the proportion of patients who discontinued the study before week 100 was higher in the brolucizumab group (36 patients; 20.1%) than in the aflibercept group (25 patients; 13.8%).
In both trials, the main reason for study discontinuation was “patient decision”: 10.1% and 7.5% in the brolucizumab 6 mg group and aflibercept 2 mg group, respectively in the KESTREL study; 7.8% and 3.9% in the brolucizumab 6 mg group and aflibercept 2 mg group, respectively, in the KITE study. Other reasons were AEs, death, and loss to follow-up.
Details of patient disposition are shown in Table 10.
Patient disposition | KESTREL | KITE | ||
|---|---|---|---|---|
Brolucizumab 6 mg | Aflibercept 2 mg | Brolucizumab 6 mg | Aflibercept 2 mg | |
Screened, N | 873 (including the 3 mg arm) | 480 | ||
Screening failure or not randomized, N | 307 (including the 3 mg arm) | 120 | ||
Randomized, N | 189 | 187 | 179 | 181 |
Completed study before week 100, n (%) | 154 (81.5) | 153 (81.8) | 143 (79.9) | 156 (86.2) |
Discontinued study before week 100, n (%) | 35 (18.5) | 34 (18.2) | 36 (20.1) | 25 (13.8) |
Reason for discontinuation, N (%) | ||||
Adverse events | 3 (1.6) | 7 (3.7) | 5 (2.8) | 4 (2.2) |
Death | 8 (4.2) | 7 (3.7) | 13 (7.3) | 9 (5.0) |
Lost to follow-up | 4 (2.1) | 4 (2.1) | 2 (1.1) | 2 (1.1) |
Physician decision | 0 | 1 (0.5) | 2 (1.1) | 3 (1.7) |
Progressive disease | 1 (0.5) | 0 | 0 | 0 |
Protocol deviation | 0 | 1 (0.5) | 0 | 0 |
Patient decision | 19 (10.1) | 14 (7.5) | 14 (7.8) | 7 (3.9) |
FAS, n (%) | 189 (100) | 187 (100) | 179 (100) | 181 (100) |
PP, n (%) | 152 (80.4) | 145 (77.5) | NR | |
Safety, n (%) | 189 (100) | 187 (100) | 179 (100) | 181 (100) |
FAS = full analysis set; NR = not reported; PP = per protocol.
Sources: Clinical Study Reports for KESTREL11 and KITE.12
Exposure to Study Treatments
The extent of exposure to the study drugs was calculated as the number of injections received for both active treatments and sham.
The mean number of active intravitreal treatment injections from baseline to week 96 was 10.6 weeks (SD = 3.0) in the brolucizumab 6 mg group and 13.0 weeks (SD = 3.2) in the aflibercept 2 mg group in the KESTREL study, and 10.3 weeks (SD = 2.8) in the brolucizumab 6 mg group and 13.2 weeks (SD = 3.1) in the aflibercept 2 mg group in the KITE study (Table 11). The median number of active injections of brolucizumab 6 mg was 11.0 in the KESTREL study and 10.0 in the KITE study, while the median number of active injections of aflibercept 2 mg was 15.0 in both studies.
Table 11: Summary of Study Treatment Exposure in the Study Eye (SAF Population)
Exposure | KESTREL | KITE | ||
|---|---|---|---|---|
Brolucizumab 6 mg (N = 189) | Aflibercept 2 mg (N = 187) | Brolucizumab 6 mg 6 mg (N = 179) | Aflibercept 2 mg (N = 181) | |
Baseline to week 96 | ||||
Number of active injections, mean (SD) | 10.6 (3.0) | 13.0 (3.2) | 10.3 (2.8) | 13.2 (3.1) |
Number of active injections, median | 11.0 | 15.0 | 10.0 | 15.0 |
SAF = safety analysis set; SD = standard deviation.
Sources: Clinical Study Reports for KESTREL11 and KITE.12
Efficacy
Only those efficacy outcomes and analyses of subgroups identified in the review protocol are reported subsequently.
Change From Baseline in Visual Acuity
Change From Baseline in BCVA (Primary End Point)
In the KESTREL study, for the change from baseline in BCVA at week 52, the LS mean difference in ETDRS letters between the brolucizumab 6 mg group and the aflibercept 2 mg group was −1.3 letters (95% CI, −2.9 to 0.3; P < 0.001). In the KITE study, the LS mean difference in ETDRS letters between the brolucizumab 6 mg group and the aflibercept 2 mg group at week 52 was 1.2 letters (95% CI, −0.6 to 3.1; P < 0.001). Both studies met the primary end point of noninferiority in the full analysis set population using a noninferiority margin of 4 letters. Supportive analyses using the per-protocol analysis sets in both the KESTREL and KITE studies were consistent with the primary analyses. In sensitivity analyses in both the KESTREL and KITE studies, the results of the sensitivity analyses (using the full analysis set and MMRM assuming missing at random) in the change from baseline in BCVA at week 52 for the study eye were consistent with the primary analysis. Results of prespecified subgroups of interest were generally consistent with those in the overall population at week 52 (data not shown).
Noninferiority of brolucizumab 6 mg to aflibercept 2 mg was also demonstrated for the average change from baseline in BCVA over the period from week 40 through week 52 in both studies. In the KESTREL trial, the LS mean difference in ETDRS letters between the brolucizumab 6 mg group and the aflibercept 2 mg group was −1.5 letters (95% CI, −3.0 to 0; P < 0.001). This outcome was not tested for superiority due to earlier failure in the testing hierarchy. In the KITE trial, the LS mean difference in ETDRS letters between the brolucizumab 6 mg group and the aflibercept 2 mg group was 0.9 letters (95% CI, −0.9 to 2.6; P < 0.001). While this outcome was tested for superiority in the KITE trial, the difference did not reach statistical significance.
Similar results were found for year 2. In the KESTREL trial, for the change from baseline in BCVA at week 100, the LS mean difference in ETDRS letters between the brolucizumab 6 mg group and the aflibercept 2 mg group was −1.7 letters (95% CI, −3.8 to 0.4). In the KITE trial, the LS mean difference in ETDRS letters between the brolucizumab 6 mg group and the aflibercept 2 mg group at week 100 was 2.6 letters (95% CI, 0.2 to 4.9).
Proportion of Patients With a Gain in BCVA of 15 or More Letters From Baseline or Gain of 84 Letters or More
The between-group differences in the adjusted proportions of patients who gained 15 or more ETDRS letters in BCVA from baseline, or reached a BCVA of 84 letters or more at week 100 with brolucizumab 6 mg versus aflibercept 2 mg were −3.0% (95% CI, −12.5% to 6.3%) in the KESTREL trial and 13.6% (95% CI, 3.3% to 23.5%) in the KITE trial.
Proportion of Patients With a Loss in BCVA of 15 or More Letters From Baseline
The between-group differences in the adjusted proportions of patients with a loss of 15 or more ETDRS letters in BCVA from baseline at week 100 with brolucizumab 6 mg versus aflibercept 2 mg were 1.1% (95% CI, −1.6% to 3.5%) in the KESTREL trial and −1.3% (95% CI, −4.8% to 2.0%) in the KITE trial.
Details of the change in visual acuity from baseline in the 2 studies are available in Table 12.
Table 12: Efficacy — BCVA-Related Outcomes, LOCF
Efficacy | KESTREL | KITE | ||
|---|---|---|---|---|
Brolucizumab 6 mg (N = 189) | Aflibercept 2 mg (N = 187) | Brolucizumab 6 mg (N = 179) | Aflibercept 2 mg (N = 181) | |
Change from baseline in BCVA (letters read) at week 52a (FAS) | ||||
n | 189 | 187 | 179 | 181 |
LS mean (SE) | 9.2 (0.57) | 10.5 (0.57) | 10.6 (0.66) | 9.4 (0.66) |
95% CI for LS mean | (8.1 to 10.3) | (9.4 to 11.7) | (9.3 to 11.9) | (8.1 to 10.7) |
LS mean difference (brolucizumab minus aflibercept) (SE) | −1.3 (0.81) | Reference | 1.2 (0.94) | Reference |
95% CI for treatment difference | (−2.9 to 0.3) | Reference | (−0.6 to 3.1) | Reference |
P value (for NI test, 4-letter margin), 1-sided | < 0.001 | Reference | < 0.001 | Reference |
Change from baseline in BCVA (letters read) at week 52a (PP) | ||||
n | 152 | 145 | 143 | 137 |
LS mean (SE) | 9.8 (0.61) | 11.4 (0.62) | 12.0 (0.57) | 10.7 (0.58) |
95% CI for LS mean | (8.7 to 11.0) | (10.1 to 12.6) | (10.9 to 13.2) | 9.6 (11.9) |
LS mean difference (brolucizumab minus aflibercept) (SE) | −1.5 (0.87) | Reference | 1.3 (0.82) | Reference |
95% CI for treatment difference | (−3.2 to 0.2) | Reference | (−0.3 to 2.9) | Reference |
P value (for NI test, 4-letter margin), 1-sided | NR | Reference | NR | Reference |
Change from baseline in BCVA (letters read) over the period from week 40 through week 52a (FAS) | ||||
n | 189 | 187 | NR | NR |
LS mean (SE) | 9.0 (0.53) | 10.5 (0.53) | 10.3 | 9.4 |
95% CI for LS mean | (7.9 to 10.0) | (9.4 to 11.5) | NR | NR |
LS mean difference (brolucizumab minus aflibercept) (SE) | −1.5 (0.75) | Reference | 0.9 | Reference |
95% CI for treatment difference | (−3.0 to −0.0) | Reference | (−0.9 to 2.6) | Reference |
P value (for NI test, 4-letter margin), 1-sided | < 0.001 | Reference | < 0.001 | Reference |
Change from baseline in BCVA (letters read) at week 100a (FAS) | ||||
n | 189 | 187 | 179 | 181 |
LS mean (SE) | 8.8 (0.75) | 10.6 (0.75) | 10.9 (0.85) | 8.4 (0.85) |
95% CI for LS mean | (7.4 to 10.3) | (9.1 to 12.0) | (9.3 to 12.6) | (6.7 to 10.1) |
LS mean difference (brolucizumab minus aflibercept) (SE) | −1.7 (1.06) | Reference | 2.6 (1.21) | Reference |
95% CI for treatment difference | (−3.8 to 0.4) | Reference | (0.2 to 4.9) | Reference |
Proportion of patients with BCVA ≥ 15-letter gain from baseline or BCVA ≥ 84 letters at week 100b | ||||
% of patients, n of N (%) | 76 of 189 (40.2) | 77 of 187 (41.2) | 89 of 179 (49.7) | 68 of 181 (37.6) |
95% CI | (33.2 to 47.6) | (34.0 to 48.6) | (42.2 to 57.3) | (30.5 to 45.1) |
Proportion estimates (%) | 39.2 | 42.2 | 50.4 | 36.9 |
Between-group difference, % (95% CI) | −3.0 (−12.5 to 6.3) | Reference | 13.6 (3.3 to 23.5) | Reference |
Proportion of patients with BCVA ≥ 15-letter loss from baseline at week 100b | ||||
% of patients, n of N (%) | 4 of 189 (2.1) | 2 of 187 (1.1) | 4 of 179 (2.2) | 6 of 181 (3.3) |
95% CI | (0.6 to 5.3) | (0.1 to 3.8) | (0.6 to 5.6) | (1.2 to 7.1) |
Proportion estimates (%) | 2.2 | 1.0 | 2.1 | 3.5 |
Between-group difference, % | 1.1 | Reference | −1.3 | Reference |
95% CI for treatment difference (%) | (−1.6 to 3.5) | Reference | (−4.8 to 2.0) | Reference |
BCVA = best-corrected visual acuity; CI = confidence interval; FAS = full analysis set; LOCF = last observation carried forward; LS = least squares; NI = noninferiority; NR = not reported; PP = per protocol; SE = standard error.
aAnalyzed using an analysis of variance model with baseline BCVA categories (≤ 65 letters, > 65 letters), age categories (< 65 years, ≥ 65 years), and treatment as fixed-effect factors.
bThe statistical model used logistic regression adjusting for baseline BCVA categories (≤ 65 letters, > 65 letters), age categories (< 65 years, ≥ 65 years), and treatment as fixed-effect factors. The 95% CI for the treatment difference was estimated using the bootstrap method.
Sources: Clinical Study Reports for KESTREL11 and KITE.12
Change From Baseline in Retinal Thickness
Change From Baseline in CSFT
In the KESTREL trial, patients in the brolucizumab 6 mg group had similar reductions in CSFT from baseline at week 52 compared with the aflibercept 2 mg group. The LS mean difference in the change from baseline in CSFT between the brolucizumab 6 mg arm and the aflibercept 2 mg arm was −5.1 µm (95% CI, −22.3 µm to 12.2 µm). At week 4, the LS mean difference in the change from baseline in CSFT between the 2 treatment groups was −2.1 μm (95% CI, −18.7 µm to 14.4 µm). Over the period from week 40 through week 52, the average LS mean for the change from baseline in CSFT between the brolucizumab 6 mg and aflibercept 2 mg groups was −1.4 µm (95% CI, −17.9 µm to 15.0 µm).
In the KITE trial, the LS mean difference in the change from baseline in CSFT to week 52 between the brolucizumab 6 mg arm and the aflibercept 2 mg arm was −32.8 µm (95% CI, −52.5 µm to −13.0 µm). At week 4, the LS mean difference in the change from baseline in CSFT between the 2 treatment groups was −15.4 μm (95% CI, −35.0 µm to 4.1 µm). Over the period from week 40 through week 52, the average LS mean for the change from baseline in CSFT between the brolucizumab 6 mg and aflibercept 2 mg groups was −29.4 µm (95% CI, −48.6 µm to −10.2 µm; P = 0.001) in favour of brolucizumab.
These differences between brolucizumab and aflibercept were similar at year 2. At week 100, the LS mean difference in the change from baseline in CSFT between the brolucizumab 6 mg arm and the aflibercept 2 mg arm was −2.9 µm (95% CI, −21.1 µm to 15.3 µm) in the KESTREL trial, and −29.2 µm (95% CI, −51.6 µm to −6.8 µm) in the KITE trial.
Proportion of Patients With a CSFT of Less Than 280 μm
In both the KESTREL and KITE trials, the proportion of patients at week 52 with CSFT less than 280 μm was higher in the brolucizumab 6 mg group compared with the aflibercept 2 mg group. The LS mean difference in the proportion of patients with CSFT less than 280 μm between the brolucizumab arm and the aflibercept arm was 13.4% (95% CI, 4.9% to 23.7%) in the KESTREL trial and 16.3% (95% CI, 5.7% to 25.9%) in the KITE trial.
At week 100, the proportion of patients with CSFT less than 280 μm was higher in the brolucizumab 6 mg group compared with the aflibercept 2 mg group. The LS mean difference in the proportion of patients with CSFT less than 280 μm between the brolucizumab arm and the aflibercept arm was 11.6% (95% CI, 2.3% to 21.6%) in the KESTREL trial and 14.7% (95% CI, 4.2% to 24.9%) in the KITE trial.
Details of retinal thickness–related outcomes are presented in Table 13.
Table 13: Efficacy — CSFT-Related Outcomes, FAS (LOCF)
Efficacy | KESTREL | KITE | ||
|---|---|---|---|---|
Brolucizumab 6 mg (N = 189) | Aflibercept 2 mg (N = 187) | Brolucizumab 6 mg (N = 179) | Aflibercept 2 mg (N = 181) | |
Change from baseline in CSFT at week 4, μma | ||||
n | 189 | 187 | 179 | 180 |
LS mean (SE) | −105.6 (5.92) | −103.4 (5.95) | −128.8 (7.03) | −113.4 (7.01) |
95% CI for LS mean | (−117.2 to −93.9) | (−115.1 to −91.7) | (−142.6 to −115.0) | (−127.1 to −99.6) |
LS mean difference (brolucizumab minus aflibercept) (SE) | −2.1 (8.41) | Reference | −15.4 (9.94) | Reference |
95% CI for treatment difference | (−18.7 to 14.4) | Reference | (−35.0 to 4.1) | Reference |
Change from baseline in CSFT at week 52, μma | ||||
n | 189 | 187 | 179 | 180 |
LS mean (SE) | −165.5 (6.2) | −160.4 (6.2) | −197.2 (7.1) | −164.4 (7.1) |
95% CI for LS mean | (−177.6 to −153.3) | (−172.6 to −148.2) | (−211.1 to −183.2) | (−178.3 to −150.4) |
LS mean difference (brolucizumab minus aflibercept) (SE) | −5.1 (8.8) | Reference | −32.8 (10.0) | Reference |
95% CI for treatment difference | (−22.3 to 12.2) | Reference | (−52.5 to −13.0) | Reference |
Change from baseline in CSFT over the period from week 40 through week 52, μma | ||||
n | 189 | 187 | 179 | 180 |
LS mean (SE) | −159.5 (5.88) | −158.1 (5.91) | −187.1 (6.91) | −157.7 (6.89) |
95% CI for LS mean | (−171.1 to −148.0) | (−169.7 to −146.5) | (−200.7 to −173.5) | (−171.2 to −144.1) |
LS mean difference (brolucizumab minus aflibercept) (SE) | −1.4 (8.36) | Reference | −29.4 (9.76) | Reference |
95% CI for treatment difference | (−17.9 to 15.0) | Reference | (−48.6 to −10.2) | Reference |
P value for superiority, 1-sided | — | — | 0.001 | Reference |
Change from baseline in CSFT at week 100, μma | ||||
n | 189 | 187 | 179 | 180 |
LS mean (SE) | −173.2 (6.5) | −170.3 (6.6) | −202.3 (8.1) | −173.1 (8.0) |
95% CI for LS mean | (−186.0 to −160.4) | (−183.2 to −157.4) | (−218.1 to −186.4) | (−188.9 to −157.3) |
LS mean difference (brolucizumab minus aflibercept) (SE) | −2.9 (9.3) | Reference | −29.2 (11.4) | Reference |
95% CI for treatment difference | (−21.1 to 15.3) | Reference | (−51.6 to −6.8) | Reference |
Proportion of patients with CSFT < 280 μm at week 52b | ||||
% of patients, n of N (%) | 102 of 189 (54.0) | 75 of 187 (40.1) | 103 of 179 (57.5) | 75 of 181 (41.4) |
95% CI | (46.6 to 61.2) | (33.0 to 47.5) | (49.9 to 64.9) | (34.2 to 49.0) |
Proportion estimates (%) | 53.7 | 40.3 | 57.5 | 41.2 |
Between-group difference, % | 13.4 | Reference | 16.3 | Reference |
95% CI for treatment difference | (4.9 to 23.7) | Reference | (5.7 to 25.9) | Reference |
Proportion of patients with CSFT < 280 μm at week 100b | ||||
% of patients, n of N (%) | 120 of 189 (63.5) | 97 of 187 (51.9) | 111 of 179 (62.0) | 85 of 181 (47.0) |
95% CI | (56.2 to 70.4) | (44.5 to 59.2) | (54.5 to 69.1) | (39.5 to 54.5) |
Proportion estimates (%) | 63.5 | 51.9 | 62.0 | 47.3 |
Between-group difference, % | 11.6 | Reference | 14.7 | Reference |
95% CI for treatment difference | (2.3 to 21.6) | Reference | (4.2 to 24.9) | Reference |
CI = confidence interval; CSFT = central subfield thickness; FAS = full analysis set; LOCF = last observation carried forward; LS = least squares; SE = standard error.
aAnalyzed using an analysis of variance model with baseline CSFT categories (< 450 μm, ≥ 450 μm to < 650 μm, ≥ 650 μm), age categories (< 65 years, ≥ 65 years), and treatment as fixed-effect factors.
bThe statistical model used logistic regression adjusting for baseline CSFT categories (< 450 μm, ≥ 450 μm to < 650 μm, ≥ 650 μm), age categories (< 65 years, ≥ 65 years), and treatment as fixed-effect factors. The 95% CI for the treatment difference was estimated using the bootstrap method.
Sources: Clinical Study Reports for KESTREL11 and KITE.12
Health-Related Quality of Life
No HRQoL tools other than the NEI VFQ-25 were used (Table 14).
Blindness (Legal)
Blindness was not assessed in the KESTREL or KITE trials.
Change From Baseline in Vision-Related Function
This outcome was measured using the NEI VFQ-25 composite score. In the KESTREL trial, the between-group LS mean differences for the change from baseline were −1.0 (95% CI, −3.4 to 1.4) at week 52 and −0.2 (95% CI, −2.9 to 2.6) at week 100. In the KITE trial, the between-group LS mean differences for the change from baseline were 2.5 (95% CI, 0.2 to 4.8) at week 52 and 3.4 (95% CI, 0.8 to 6.1) at week 100.
Details of the NEI VFQ-25 results are reported in Table 14.
Table 14: Efficacy — NEI VFQ-25 Outcomes, FAS (Observed)
Efficacy | KESTREL | KITE | ||
|---|---|---|---|---|
Brolucizumab 6 mg (N = 189) | Aflibercept 2 mg (N = 187) | Brolucizumab 6 mg (N = 179) | Aflibercept 2 mg (N = 181) | |
Change from baseline in NEI VFQ-25 composite score at week 52a | ||||
n | 148 | 157 | 143 | 150 |
LS mean estimate | 7.1 | 8.1 | 9.1 | 6.5 |
LS mean difference (brolucizumab minus aflibercept) | −1.0 | Reference | 2.5 | Reference |
95% CI for treatment difference | (−3.4 to 1.4) | Reference | (0.2 to 4.8) | Reference |
Change from baseline in NEI VFQ-25 composite score at week 100a | ||||
n | 141 | 142 | 130 | 145 |
LS mean estimate | 6.2 | 6.4 | 9.3 | 5.9 |
LS mean difference (brolucizumab minus aflibercept) | −0.2 | Reference | 3.4 | Reference |
95% CI for treatment difference | (−2.9 to 2.6) | Reference | (0.8 to 6.1) | Reference |
CI = confidence interval; FAS = full analysis set; LS = least squares; NEI VFQ-25 = National Eye Institute Visual Functioning Questionnaire–25.
aAnalyzed using an analysis of covariance model with treatment as a fixed-effect factor and corresponding baseline value of the end point as a covariate.
Sources: Clinical Study Reports for KESTREL11 and KITE.12
Change From Baseline in DR Severity
Proportion of Patients With an Improvement From Baseline of 2 or More Steps in the DRSS Score for the Study Eye
At week 52 in the KESTREL trial, the difference in the proportion of patients who achieved a 2-step or greater improvement on the ETDRS DRSS from baseline in the brolucizumab group compared with the aflibercept group was 6.7% (95% CI, 0.6% to 12.9%). In the KITE trial, the difference in the proportion of patients who achieved a 2-step or greater improvement on the ETDRS DRSS from baseline in the brolucizumab group compared with the aflibercept group was 1.1% (95% CI −5.6% to 7.8%). At week 100, the difference in the proportion of patients who achieved a 2-step or greater improvement on the ETDRS DRSS from baseline in the brolucizumab group compared with the aflibercept group was 2.2% (95% CI, −4.0% to 8.4%) in the KESTREL trial and −4.5% (95% CI, −1.7% to 10.8%) in the KITE trial.
Proportion of Patients With an Improvement of 3 or More Steps From Baseline in the DRSS Score for the Study Eye
At week 52, the difference in the proportion of patients who achieved an improvement of 3 or more steps on the ETDRS DRSS from baseline in the brolucizumab group compared with the aflibercept group was 3.9% (95% CI, −2.2% to 10.5%) in the KESTREL trial and −0.6% (95% CI, −7.1% to 5.7%) in the KITE trial. At week 100, the difference in the proportion of patients who achieved a 3-step or greater improvement on the ETDRS DRSS from baseline in the brolucizumab group compared with the aflibercept group was 0.4% (95% CI, −5.7% to 6.8%) in the KESTREL trial and 3.9% (95% CI, −2.3% to 10.0%) in the KITE trial (Table 15).
Table 15: Efficacy — ETDRS DRSS–Related Outcomes, FAS (LOCF)
Efficacy | KESTREL | KITE | ||
|---|---|---|---|---|
Brolucizumab 6 mg (N = 189) | Aflibercept 2 mg (N = 187) | Brolucizumab 6 mg (N = 179) | Aflibercept 2 mg (N = 181) | |
Proportion of patients with ≥ 2-step improvement from baseline in the DRSS score for the study eye at week 52a | ||||
n of N (%) | 55 of 186 (29.6) | 40 of 184 (21.7) | 51 of 176 (29.0) | 49 of 177 (27.7) |
95% CI | (23.1 to 36.7) | (16.0 to 28.4) | (22.4 to 36.3) | (21.2 to 34.9) |
Proportion estimate (%) | 29.0 | 22.2 | 28.9 | 27.8 |
Between-group difference (%) | 6.7 | Reference | 1.1 | Reference |
95% CI for treatment difference (%) | (0.6 to 12.9) | Reference | (−5.6 to 7.8) | Reference |
Proportion of patients with ≥ 2-step improvement from baseline in the DRSS score for the study eye at week 100a | ||||
n of N (%) | 61 of 186 (32.8) | 54 of 184 (29.3) | 63 of 176 (35.8) | 55 of 177 (31.1) |
95% CI | (26.1 to 40.0) | (22.9 to 36.5) | (28.7 to 43.4) | (24.3 to 38.5) |
Proportion estimate (%) | 32.1 | 30.0 | 35.7 | 31.2 |
Between-group difference (%) | 2.2 | Reference | 4.5 | Reference |
95% CI for treatment difference (%) | (−4.0 to 8.4) | Reference | (−1.7 to 10.8) | Reference |
Proportion of patients with ≥ 3-step improvement from baseline in the DRSS score for the study eye at week 52a | ||||
n of N (%) | 39 of 186 (21.0) | 30 of 184 (16.3) | 26 of 176 (14.8) | 27 of 177 (15.3) |
95% CI | (15.4 to 27.5) | (11.3 to 22.5) | (9.9 to 20.9) | (10.3 to 21.4) |
Proportion estimate (%) | 20.5 | 16.7 | 14.7 | 15.3 |
Between-group difference (%) | 3.9 | Reference | −0.6 | Reference |
95% CI for treatment difference (%) | (−2.2 to 10.5) | Reference | (−7.1 to 5.7) | Reference |
Proportion of patients with ≥ 3-step improvement from baseline in the DRSS score for the study eye at week 100a | ||||
n of N (%) | 44 of 186 (23.7) | 41 of 184 (22.3) | 37 of 176 (21.0) | 30 of 177 (16.9) |
95% CI | (17.7 to 30.4) | (16.5 to 29.0) | (15.3 to 27.8) | (11.7 to 23.3) |
Proportion estimate (%) | 23.2 | 22.8 | 20.9 | 17.0 |
Between-group difference (%) | 0.4 | Reference | 3.9 | Reference |
95% CI for treatment difference (%) | (−5.7 to 6.8) | Reference | (−2.3 to 10.0) | Reference |
CI = confidence interval; DRSS = Diabetic Retinopathy Severity Scale; ETDRS = Early Treatment Diabetic Retinopathy Study; FAS = full analysis set; LOCF = last observation carried forward.
aThe 95% CI for binomial proportions is based on the Clopper-Pearson exact method. The statistical model used logistic regression adjusting for baseline DRSS score categories (≤ 4, ≥ 5), age categories (< 65 years, ≥ 65 years), and treatment as fixed-effect factors. The 95% CI for the treatment difference was estimated using the bootstrap method.
Sources: Clinical Study Reports for KESTREL11 and KITE.12
Presence of SRF or IRF
Proportion of Patients with Presence of SRF and/or IRF
At week 52, the difference in the adjusted proportion of patients in the brolucizumab group compared with the aflibercept group with SRF and/or IRF present was −13.2% (95% CI, −23.2% to −3.8%) in the KESTREL trial and −18.4% (95% CI, −28.5% to −8.3%) in the KITE trial. In both the KITE and KESTREL trials, this outcome was not tested statistically due to previous failure of the hierarchical testing procedure.
At week 100, the difference in the adjusted proportion of patients in the brolucizumab group compared with the aflibercept group with SRF and/or IRF present was −12.4% (95% CI, −22.8% to −2.1%) in the KESTREL trial and −16.2% (95% CI, −26.4% to −5.9%) in the KITE trial.
Proportion of Patients with Leakage on Fluorescein Angiography
At week 100 in both studies, the difference in the adjusted proportion of patients with leakage on fluorescein angiography was −14.2% (95% CI, −24.7% to −3.4%) in the KESTREL trial and −19.1% (95% CI, −29.1% to 8.2%) in the KITE trial.
Results of presence of SRF and/or IRF and leakage on fluorescein angiography are shown in Table 16.
Table 16: Efficacy — SRF and IRF Outcomes, FAS (LOCF)
Efficacy | KESTREL | KITE | ||
|---|---|---|---|---|
Brolucizumab 6 mg (N = 189) | Aflibercept 2 mg (N = 187) | Brolucizumab 6 mg (N = 179) | Aflibercept 2 mg (N = 181) | |
Proportion of patients with presence of SRF and/or IRF at week 52a | ||||
n of N (%) | 114 of 189 (60.3) | 137 of 187 (73.3) | 97 of 179 (54.2) | 132 of 181 (72.9) |
95% CI | (53.0 to 67.3) | (66.3 to 79.5) | (46.6 to 61.6) | (65.8 to 79.3) |
Proportion estimate (%) | 60.4 | 73.5 | 54.5 | 72.9 |
Between-group difference (%) | −13.2 | Reference | −18.4 | Reference |
95% CI for treatment difference (%) | (−23.2 to −3.8) | Reference | (−28.5 to −8.3) | Reference |
Proportion of patients with presence of SRF and/or IRF at week 100a | ||||
n of N (%) | 79 of 189 (41.8) | 101 of 187 (54.0) | 73 of 179 (40.8) | 103 of 181 (56.9) |
95% CI | (34.7 to 49.2) | (46.6 to 61.3) | (33.5 to 48.4) | (49.4 to 64.2) |
Proportion estimate (%) | 41.8 | 54.2 | 40.7 | 56.9 |
Between-group difference (%) | −12.4 | Reference | −16.2 | Reference |
95% CI for treatment difference (%) | (−22.8 to −2.1) | Reference | (−26.4 to −5.9) | Reference |
Proportion of patients with leakage on FA at week 100b | ||||
n of N (%) | 80 of 188 (42.6) | 104 of 186 (55.9) | 84 of 179 (46.9) | 118 of 180 (65.6) |
95% CI | (35.4 to 50.0) | (48.5 to 63.2) | (39.4 to 54.5) | (58.1 to 72.5) |
Proportion estimate (%) | 41.9 | 56.1 | 46.6 | 65.7 |
Between-group difference (%) | −14.2 | Reference | −19.1 | Reference |
95% CI for treatment difference (%) | (−24.7 to −3.4) | Reference | (−29.1 to −8.2) | Reference |
CI = confidence interval; FA = fluorescein angiography; FAS = full analysis set; IRF = intraretinal fluid; LOCF = last observation carried forward; SRF = subfield fluid.
aThe 95% CI for binomial proportions is based on the Clopper-Pearson exact method. The statistical model used logistic regression adjusting for baseline fluid status (SRF and/or IRF), age categories (< 65 years, ≥ 65 years), and treatment as fixed-effect factors. The 95% CI for the treatment difference was estimated using the bootstrap method.
bThe 95% CI for binomial proportions is based on the Clopper-Pearson exact method. The statistical model used logistic regression adjusting for baseline leakage on FA status, age categories (< 65 years to ≥ 65 years), and treatment as fixed-effect factors. The 95% CI for the treatment difference was estimated using the bootstrap method.
Sources: Clinical Study Reports for KESTREL11 and KITE.12
Frequency of Injections
In the 2 studies, weeks 32 and 36 were the 2 DAA visits for the initial cycle of every 12 weeks (after the loading phase) for the brolucizumab arms. The proportion of patients in the brolucizumab arms and aflibercept arm with time to first need for treatment every 8 weeks at each DAA visit was summarized in Table 17.
In the KESTREL trial, for the brolucizumab 6 mg treatment group, the proportion of patients who maintained a treatment interval status of every 12 weeks was 52.0% (95% CI, 43.7% to 59.6%) up to week 52, and 44.1% (95% CI, 35.7% to 52.1%) up to week 100. Among the patients who completed the treatment study period, 67.1% in the brolucizumab 6 mg arm were on an 8-week treatment interval at week 100.
In the KITE trial, the proportion of patients treated with brolucizumab 6 mg who maintained a treatment interval of every 12 weeks was 45.5% (95% CI, 37.7% to 53.0%) up to week 52; 36.8% (95% CI, 29.1% to 44.5%) of patients maintained a treatment interval of either every 12 weeks or every 16 weeks through week 100. Among the patients who completed the treatment study period, 52.5% in the brolucizumab 6 mg arm at week 100 were on a treatment interval of every 8 weeks.
Table 17: Efficacy — Frequency of Injection, FAS (Observed)
Efficacy | KESTREL | KITE | ||
|---|---|---|---|---|
Brolucizumab 6 mg (N = 189) | Aflibercept 2 mg (N = 187) | Brolucizumab 6 mg (N = 179) | Aflibercept 2 mg (N = 181) | |
Treatment status among patients who completed treatment with brolucizumab at week 100, n of N (%) | ||||
Every 8 weeks | 98 of 146 (67.1) | NA | 74 of 141 (52.5) | NA |
Every 12 weeks | 48 of 146 (32.9) | NA | 32 of 141 (22.7) | NA |
Every 16 weeks | NA | NA | 35 of 141 (24.8) | NA |
Proportion of patients who needed treatment every 8 weeks at week 32a | ||||
N of N (%) | 32 of 159 (20.1) | 45 of 162 (27.8) | 40 of 165 (24.2) | 66 of 166 (39.8) |
95% CI | (14.2 to 27.2) | (21.0 to 35.3) | (17.9 to 31.5) | (32.3 to 47.6) |
CI = confidence interval; FAS = full analysis set; NA = not applicable.
aThe 95% CI for binomial proportions was based on the Clopper-Pearson exact method.
bResults derived from a Kaplan-Meier analysis of the time to first need for treatment every 8 weeks, which was estimated at week 60 and week 96, i.e., the immediately preceding disease activity assessment visits.
Harms
Only those harms identified in the review protocol are reported subsequently. Refer to Table 18 for detailed harms data.
Adverse Events
The proportion of patients reporting at least 1 ocular AE in the study eye up to week 100 was comparable across treatment arms in both studies (48.7% and 50.3% in the brolucizumab 6 mg group and aflibercept 2 mg group in the KESTREL trial, respectively; ||||| ||||| ||| ||||| || ||| |||||||||||| | || ||| ||||||||||| | || ||||||| ||||||||||||||.
The most common ocular AEs (3% or greater in any treatment group) reported in both studies were as follows. In the KESTREL trial, the proportion of patients in the brolucizumab and aflibercept groups, respectively, who reported an AE were 8.5% and 7.0% for cataract conjunctival hemorrhage, 5.8% and 1.6% for increased intraocular pressure, 5.3% and 1.6% for vitreous detachment, 5.3% and 3.2% for vitreous floaters, 4.8% and 2.1% for diabetic retinal edema, 3.2% and 0.5% for conjunctivitis, 3.2% and 2.7% for dry eye, 3.2% and 2.7% for eye pain, 3.2% and 1.6% for posterior capsule opacification, and 1.6% and 4.8% for reduced visual acuity. || ||||| ||| |||||||||| || |||||||| || ||| |||||||||||| ||| ||||||||||| ||||||| ||||||||||||| ||||||||| |||| || ||| |||| ||| ||||| ||| ||||||||| |||| ||| |||| ||| |||||||||||| ||||||||||| |||| ||| |||| ||| ||||||||| ||||||||||| ||||||||| |||| ||| |||| ||| ||||||||||||||| |||| ||| |||| ||| ||| |||| |||| ||| |||| ||| ||| ||||| ||| |||| ||| |||| ||| ||||||| |||||| |||||||.
In both the KESTREL and KITE trials, a comparable proportion of patients reported at least 1 nonocular AE between treatment arms: 77.2% and 76.5% for the KESTREL trial and ||||| ||| |||||| for the KITE trial in the brolucizumab 6 mg and aflibercept groups, respectively.
Ocular and nonocular AEs reported for the study eye were mainly mild and moderate in severity in each treatment arm in both studies.
Serious Adverse Events
Ocular SAEs were reported with low frequency in both studies: 3.7% and 2.7% in the KESTREL trial and 2.8% and 1.7% in the KITE trial among patients in the brolucizumab 6 mg group and aflibercept 2 mg group, respectively. Eye disorders, such as cataract, were the main ocular SAEs reported in the studies.
In KESTREL, the incidence of nonocular SAEs was 28.0% in the brolucizumab 6 mg group and 28.9% in the aflibercept group. The proportion of patients who experienced a specific nonocular SAE for the brolucizumab 6 mg and aflibercept groups, respectively, was: 6.9% and 9.1% for cardiac disorders; 9.0% and 7.5% for infections and infestations; 3.7% and 2.1% for metabolism and nutrition disorders; 3.2% and 1.6% for neoplasms; 3.2% and 7.0% for nervous system disorders; 4.2% and 2.1% for vascular disorders;3.7% and 4.8% for renal and urinary disorders, 2.6% and 3.2% for injury, poisoning, and procedural complications; and 3.7% and 3.2% for respiratory, thoracic, and mediastinal disorders.
|| ||||| ||| ||||||||| || |||||||||| |||| ||| ||||| || ||| |||||||||||| ||||| ||| ||||| || ||| ||||||||||| ||||| ||| |||||||||| || |||||||| ||| ||||||||||| | |||||||| |||||||||| ||| ||| ||| |||||||||||| ||| ||||||||||| ||||||| ||||||||||||| |||| |||| ||| |||| ||| ||||||| |||||||||| |||| ||| |||| ||| |||||||||| ||| ||||||||||||| |||| ||| |||| ||| |||||||||||||||| |||||||||| |||| ||| |||| ||| |||||||||| |||| ||| |||| ||| ||||||| |||||| |||||||||| ||| |||| ||| |||| ||| ||||| ||| ||||||| ||||||||||
Withdrawals Due to Adverse Events
The incidence of withdrawals due to AEs was 1.6% and 1.1% in the brolucizumab 6 mg and aflibercept groups, respectively, in KESTREL and |||| ||| |||| || ||| |||||||||||| ||| ||||||||||| ||||||| ||||||||||||| || |||||. The most common reason for discontinuing treatment was infections and infestations, such as endophthalmitis and uveitis.
Mortality
There were 15 deaths that occurred in the KESTREL study, 8 (4.2%) in the brolucizumab 6 mg group and 7 (3.7%) in the aflibercept group. || ||| |||| |||||| || |||||| |||||| |||||||| || ||| |||||||||||| ||||| ||| | |||||| || ||| ||||||||||| ||||||
The cause of death in the 2 studies were cardiac disorders, neoplasms, and infections and infestations. According to the sponsor, none of the deaths were suspected by the investigator to be related to study treatment.
Notable Harms
Ocular hemorrhage was the most commonly reported notable harm prespecified in the protocol of this review, occurring in 10.6% and 11.8% of patients in in the brolucizumab group and the aflibercept group, respectively in KESTREL, and |||| ||| |||| || |||||||| || ||| |||||||||||| ||||| ||| ||||||||||| |||||| |||||||||||| || |||||. Other common notable harms (greater than 5%) included increased intraocular pressure, arterial thromboembolic events, and vitreous floaters.
There were no reports of traumatic cataract, photophobia, or hypersensitivity reactions, which were specified as notable harms in the research protocol of this review.
Table 18: Summary of Harms — Safety Set, Up to Week 100
Harm outcomes | KESTREL | KITE | ||
|---|---|---|---|---|
Brolucizumab 6 mg N = 189 | Aflibercept 2 mg N = 187 | Brolucizumab 6 mg N = 179 | Aflibercept 2 mg N = 181 | |
Patients with ≥ 1 ocular AE | ||||
n (%) | 92 (48.7) | 94 (50.3) | || |||||| | || |||||| |
Most common ocular events,a n (%) | ||||
Cataract | 16 (8.5) | 13 (7.0) | || ||||| | || |||||| |
Conjunctival hemorrhage | 16 (8.5) | 19 (10.2) | | ||||| | | ||||| |
Intraocular pressure increased | 11 (5.8) | 3 (1.6) | | ||||| | | ||||| |
Vitreous detachment | 10 (5.3) | 3 (1.6) | |||||| | | ||||| |
Vitreous floaters | 10 (5.3) | 6 (3.2) | | ||||| | | ||||| |
Diabetic retinal edema | 9 (4.8) | 4 (2.1) | | ||||| | | ||||| |
Conjunctivitis | 6 (3.2) | 1 (0.5) | | ||||| | | ||||| |
Dry eye | 6 (3.2) | 5 (2.7) | | ||||| | | ||||| |
Eye pain | 6 (3.2) | 5 (2.7) | | ||||| | | ||||| |
Posterior capsule opacification | 6 (3.2) | 3 (1.6) | | ||||| | | ||||| |
Visual acuity reduced | 3 (1.6) | 9 (4.8) | | ||||| | | ||||| |
|||||||| |||| | | |||||||||| || | ||||
n (%) | 146 (77.2) | 143 (76.5) | ||| |||||| | ||| |||||| |
Most common nonocular events,b n (%) | ||||
Urinary tract infection | 21 (11.1) | 8 (4.3) | | ||||| | | ||||| |
Hypertension | 20 (10.6) | 23 (12.3) | || ||||| | || ||||| |
Nasopharyngitis | 18 (9.5) | 16 (8.6) | || ||||| | || ||||| |
Cough | 11 (5.8) | 10 (5.3) | | ||||| | || ||||| |
COVID-19 | 10 (5.3) | 8 (4.3) | | ||||| | | ||||| |
Diarrhea | 10 (5.3) | 6 (3.2) | | ||||| | | ||||| |
Anemia | 9 (4.8) | 9 (4.8) | | ||||| | | ||||| |
Diabetic nephropathy | 3 (1.6) | 2 (1.1) | | ||||| | | ||||| |
Proteinuria | 1 (0.5) | 0 | | ||||| | || ||||| |
|||||||| |||| | | |||||| ||| | ||||
n (%) | 7 (3.7) | 5 (2.7) | | ||||| | | ||||| |
Eye disorders | 7 (3.7) Cataract (5) and 1 each of:
| 5 (2.7) Cataract (3) and 1 each of:
| | ||||||||||||||| |||| ||||||| |||||| ||||||||| |||| ||||||| ||| | | |||||||||||||| |||| ||||||| |||||||||| |||| ||||||| |||| ||| |
Infections and infestations | 0 | 1 (0.5) (Endophthalmitis) | | |||||||||||||||||||||| |||| |||||||||| |||||| |||||| ||| | | |||||||||||||||||||||| ||| |
|||||||| |||| | | |||||||||| ||| | ||||
n (%) | 53 (28.0) | 54 (28.9) | || |||||| | || |||||| |
Blood and lymphatic system disorders | 1 (0.5) | 1 (0.5) | | ||||| | | ||||| |
Cardiac disorders | 13 (6.9) | 17 (9.1) | || ||||| | || ||||| |
Infections and infestations | 17 (9.0) | 14 (7.5) | || ||||| | || ||||| |
Gastrointestinal disorders | 5 (2.6) | 2 (1.1) | | ||||| | | ||||| |
Metabolism and nutrition disorders | 7 (3.7) | 4 (2.1) | | ||||| | | ||||| |
Neoplasms benign, malignant, and unspecified | 6 (3.2) | 3 (1.6) | | ||||| | | ||||| |
Nervous system disorders | 6 (3.2) | 13 (7.0) | | ||||| | || ||||| |
Vascular disorders | 8 (4.2) | 4 (2.1) | | ||||| | | ||||| |
Renal and urinary disorders | 7 (3.7) | 9 (4.8) | | ||||| | | ||||| |
Injury, poisoning, and procedural complications | 5 (2.6) | 6 (3.2) | | ||||| | | ||||| |
Respiratory, thoracic, and mediastinal disorders | 7 (3.7) | 6 (3.2) | | ||||| | | ||||| |
|||||||| |||| | | |||| | ||||
Ocular, n (%) | 3 (1.6)
| 2 (1.1)
| | |||||||||||||| |||| ||||||| |||||| ||||||||| |||| ||||||||||||| |||| ||||||||||||||| ||| | | |||||||||||||||||||||| |||| ||||||| |||||| ||||||||| |||| ||||||| |||| ||||||| |||| ||||||||| || |||| ||| |
Nonocular, n (%) | 2 (1.1)
| 7 (3.7) Cardiac disorders (3) and 1 each of:
| || |||||||||||||| ||||||||| |||| |||||| |||||| ||||||||| |||| ||||||| |||||| ||||||||| |||| |||||||||| ||| |||||||||||| |||| ||||||| ||||||||| ||| |||||||||| ||||||||||||| |||| |||||||||| ||| ||||||||| ||||||||| |||| ||||||||| ||| | | |||||||||||||| |||||| ||||||||| |||| ||||||||| |||| ||||| ||| ||||||| ||||||||| ||| |
Deaths | ||||
n (%) | 8 (4.2) | 7 (3.7) | || ||||| | | ||||| |
Cardiac disorders | 2 (1.1) | 2 (1.1) | | ||||| | | ||||| |
General disorders and administration | 1 (0.5) | 1 (0.5) | | ||||| | | ||||| |
Infections and infestations | 2 (1.1) | 2 (1.1) | | ||||| | | ||||| |
Neoplasms benign, malignant, and unspecified | 3 (1.6) | 0 | | ||||| | | ||||| |
Nervous system disorders | 0 | 1 (0.5) | | ||||| | | ||||| |
Respiratory, thoracic, and mediastinal disorders | 0 | 1 (0.5) | | ||||| | ||||| |
||||||| |||||| | ||| | ||||
Endophthalmitis | 0 | 1 (0.5) | | ||||| | | ||||| |
Intraocular inflammation | 8 (4.2) | 2 (1.1) | | ||||| | | ||||| |
Retinal vascular occlusion | 3 (1.6) | 1 (0.5) | | ||||| | | ||||| |
Increased intraocular pressure | 11 (5.8) | 3 (1.6) | | ||||| | | ||||| |
Retinal detachment | 0 | 1 (0.5) | ||||| | | ||||| |
Retinal tear | NR | NR | ||||| | | ||||| |
Traumatic cataract | NR | NR | |||| | |||| |
Ocular hemorrhage (conjunctival hemorrhage, retinal hemorrhage, vitreous hemorrhage) | 20 (10.6) | 22 (11.8) | || ||||| | || ||||| |
ATEs | 10 (5.3) | 14 (7;5) | || ||||| | || ||||| |
Vitreous floaters | 10 (5.3) | 6 (3.2) | | ||||| | | ||||| |
Eye discomfort or eye pain | 6 (3.2) | 5 (2.7) | | ||||| | | ||||| |
Blurred vision | 3 (1.6) | 1 (0.5) | | ||||| | | ||||| |
Photophobia | NR | NR | |||| | |||| |
Hypersensitivity reactions including anaphylaxis | NR | NR | |||| | |||| |
AE = adverse event; ATE = arterial thromboembolic event; NR = not reported; SAE = serious adverse event; WDAE = withdrawal due to adverse event.
aFrequency > 3%.
bFrequency > 5%.
Sources: Clinical Study Reports for KESTREL11 and KITE.12
Critical Appraisal
Internal Validity
The KESTREL and KITE trials were similarly designed randomized, double-blind, active-controlled, noninferiority phase III trials comparing brolucizumab (6 mg and 3 mg in the KESTREL trial; 6 mg in the KITE trial) with aflibercept (2 mg). The overall designs of the KESTREL and KITE trials were appropriate for the objectives of the studies. There were no major concerns with regard to the method of randomization, stratification, allocation concealment, and masking for randomized assignment. The baseline characteristics of the study population were generally well balanced between treatment arms and across studies, with the exception that patients in the KITE study had a relatively large imbalance in the number of ETDRS letters between the 2 treatment arms and a somewhat thicker retina at baseline, and more likely to have received prior ocular medications compared with those enrolled in the KESTREL study. However, the clinical expert thought these differences were unlikely to impact results between the studies.
In these 2 studies, by the end of the 2-year treatment, approximately 14% to 20% of the patients had discontinued the study earlier. The dropout rates were comparable in the KESTREL study, but somewhat imbalanced in the KITE study (20% in the brolucizumab group and 14% in the aflibercept group). There is some risk of attrition bias, which may have an impact on the study findings, such as the NEI VFQ-25, which was completed through a patient interview. The main reason for early withdrawal was “patient decision.” No further details were provided for this reason. The COVID pandemic had a significant impact on the study conduct (e.g., centre closed, missed treatments, and missed assessments). In the 2 studies, sensitivity analyses on COVID-19 exposure and impact were conducted for the primary and secondary end points. In addition, ocular and nonocular AEs and SAEs were analyzed based on COVID-19 exposure or impact subgroups. The results in the COVID-19–impacted and nonimpacted subgroups were generally consistent with those in the overall population.
As per the study designs, a different dosing schedule was used between the treatment arms in both the loading and maintenance phases. In the loading phase, the treatment schedule for brolucizumab was 1 dose every 6 weeks for 5 doses; for aflibercept, the treatment schedule was once a month for 5 months. In the maintenance phase in the KESTREL and KITE trials, the treatment interval for the brolucizumab groups could be either every 8 weeks or every 12 weeks. At week 72, patients in the KITE study also had the option to extend the treatment interval to every 16 weeks (from every 12 weeks) or to every 12 weeks (from every 8 weeks), based on disease activity and stability assessments. Intervals in the aflibercept arm could not be adjusted and were given at fixed 8-week intervals.
The studies concluded the noninferiority of brolucizumab 6 mg to aflibercept 2 mg based on primary outcome analyses in the full analysis set population. The noninferiority margin of 4 ETDRS letters for the primary end point, which was determined by the sponsor based on prior clinical trial data and clinical reasoning, aligned with recommended approaches. The patient populations in the KESTREL and KITE trials were similar to those of the confirmatory trials for aflibercept. The clinical rationale was considered reasonable by the clinical expert consulted by CADTH.
The enrolled sample sizes were adequate for the assessment of the primary outcome. Subgroup analyses were prespecified although no conclusion related to subgroup effects can be drawn due to the lack of sample size considerations, control for multiplicity, and statistical testing for treatment-by-subgroup interaction.
In the KESTREL and KITE trials, the results of change from baseline in BCVA at week 52 using the per-protocol population were consistent with those in the full analysis set. In both studies, sensitivity analyses were conducted to assess the robustness of the hypothesis testing resulting from the primary analysis. Various methods were used to account for missing data, such as the MMRM modelling assuming a missing-at-random mechanism, or LOCF approach. The missing-at-random assumption may be a concern, given that the primary reasons for discontinuation from the study included patient decision, death, and AEs. Further, the LOCF method assumes that patient outcomes do not change after they drop out, which may not hold true in practice.46 Therefore, performing additional sensitivity analyses that do not assume that missing data are missing at random could be useful. However, the results of the sensitivity analyses confirmed those of the primary analysis, suggesting these approaches in handling missing data were unlikely to introduce bias for the primary end point. The risk of attrition bias due to missing data was of particular concern for the NEI VFQ-25, as the proportion of missing data was greater than 20% for some treatment groups.
Statistical hierarchy was used for multiplicity adjustment for selected outcomes. Some important outcomes were not included in the hierarchy, such as vision-related HRQoL assessed by NEI VFQ-25, change in retinal thickness, and change in DR severity. In addition, the statistical hierarchy failed during testing of the BCVA outcomes in the KESTREL trial and during superiority testing for BCVA in the KITE trial. In the KESTREL trial, the noninferiority of brolucizumab 3 mg to aflibercept 2 mg was not achieved for the outcome of change in BCVA from baseline to week 52. As per the study protocol, there was no confirmatory testing to assess the superiority of brolucizumab versus aflibercept for the subsequent outcomes in the hierarchical testing procedure, which limits drawing definite conclusions for these outcomes.
External Validity
The study population in the KESTREL and KITE trials may not fully represent the typical population in Canada with DME who would be receiving anti-VEGF therapy. Based on patients’ baseline characteristics, there was an overrepresentation of males (DME being approximately evenly distributed between male and female patients in practice, according to the clinical expert) and a very low proportion of Black patients; also, there was no information for Indigenous patients. The inclusion criteria for the KESTREL and KITE trials were reasonable and reflective of the eligibility criteria for anti-VEGF treatment in clinical practice. Although all patients enrolled in the KESTREL and KITE trials were naive to treatment with anti-VEGF therapies and exhaustive exclusion criteria were used in the 2 studies, the clinical expert consulted by CADTH indicated that brolucizumab can be used in a broader population, such as those with a blood glucose level that is poorly controlled (patients with a hemoglobin A1C level higher than 10% were excluded from the KESTREL and KITE trials) or those who had previously received anti-VEGF therapy.
In both studies, the selection of outcome measures and study end points was reasonable. The validity of the outcome measures used in the KESTREL and KITE trials (such as BCVA assessed by number of ETDRS letters, disease status assessed by the ETDRS DRSS, retinal thickness assessed using OCT, and vision-related HRQoL assessed using the NEI VFQ-25) was evaluated. These were relevant clinical outcomes used in the clinical trials for DME; however, an MID has not yet been established in the study population for some of these outcomes (e.g., NEI VFQ-25). The 2-year study duration can be considered sufficient for the efficacy and safety assessment for brolucizumab, although the consequences of reduced injection frequency, such as treatment adherence and associated clinical benefit, need to be evaluated longer term.
In the 2 pivotal studies, patients in a brolucizumab group could have their dosing interval extended, reduced (once patients on brolucizumab dropped back to every 8 weeks because of disease activity, they could not extend the treatment interval for the rest of the study, which may contradict clinical practice), or maintained postrandomization based on the assessments of disease activity. Changes in treatment interval and dosage were not allowed for the treatment with aflibercept, and these patients remained on a fixed interval of every 8 weeks during the maintenance phase; this is contrary to the product monograph for aflibercept, which states that the treatment interval can be extended after the first year of treatment. The expert noted that patients in clinical trials normally receive more injections than they would in practice. Patients in the real world may not receive many loading doses and it is possible that the outcomes observed in practice could differ from those shown in the clinical trials.
Indirect Evidence
Objectives and Methods for the Summary of Indirect Evidence
As there was a lack of studies directly comparing brolucizumab with treatments other than aflibercept for patients with DME, a review of indirect evidence was undertaken.
CADTH conducted a literature search to identify potentially relevant ITCs in this patient population. A focused literature search for ITCs dealing with DME was run in MEDLINE All (1946–) on July 28, 2022. No limits were applied to the search. Titles, abstracts, and full-text articles were screened for inclusion by 1 reviewer based on the population, intervention, comparator, and outcome criteria outlined in Table 5. However, no published ITCs describing the relative efficacy and/or safety of brolucizumab versus other active therapies for patients with DME were identified.
The sponsor submitted an ITC in patients with DME.47
The objective of this section is to summarize and critically appraise the indirect evidence available in the sponsor-submitted ITC.
Description of Sponsor-Submitted ITC
The sponsor’s ITC included a systematic review of the literature to identify trials investigating brolucizumab and comparator interventions in adult patients with DME, and a corresponding NMA that compared brolucizumab with other active treatments.
In the sponsor-submitted ITC, brolucizumab was compared with other anti-VEGFs, corticosteroids, laser photocoagulation, any of the aforementioned drug therapies plus vitrectomy, anti-VEGF plus angiopoietin-2 (faricimab), and placebo and/or best supportive care. RCTs (blinded and open label) were included. Changes in visual acuity, retinal thickness, presence of SRF or IRF, and DR-related outcomes were evaluated. In addition, injection frequency, HRQoL, and safety outcomes were examined in this ITC.
The patient population, intervention and comparators, and outcome measures for study selection in this ITC are presented in Table 19.
Table 19: Study Selection Criteria and Methods for the Sponsor-Submitted ITC
Detail | Network meta-analysis portion |
|---|---|
Population | Adults (≥ 18 years) with confirmed DME |
Intervention | Any of the following listed therapies as monotherapy or combination therapy:
|
Comparator |
|
Outcome |
|
Study design | Published parallel-group RCT |
Publication characteristics | English language |
Exclusion criteria |
|
Databases searched |
|
Selection process | Articles were screened independently by 2 reviewers |
Data extraction process | Data were extracted independently by 2 reviewers |
Quality assessment | Risk of bias of each included RCT was assessed using the principles recommended in the Centre for Reviews and Dissemination guidance48 for undertaking reviews in health care. It was not reported how many reviewers were involved in appraising the risk of bias in the trials, whether they worked independently, and what mechanisms were in place to resolve disagreements. |
ang-2 = angiopoietin-2; DME = diabetic macular edema; HRQoL = health-related quality of life; ITC = indirect treatment comparison; NEI VFQ-25 = National Eye institute Visual Functioning Questionnaire–25; RCT = randomized controlled trial; SLR = systematic literature review; VEGF = vascular endothelial growth factor.
Source: Sponsor-submitted ITC.47
Methods of Sponsor-Submitted ITC
Objectives
The objective of this ITC was to compare the treatment efficacy and safety of brolucizumab relative to currently existing therapies for the treatment of DME.
Study Selection Methods
The eligible studies that were used to inform the ITC were identified through a systematic literature search conducted by the ITC authors. A search strategy was developed according to the predefined protocol. The searches were conducted in Embase, MEDLINE, and Cochrane Library in March 2020. Conference abstracts were searched to retrieve the latest clinical studies. Clinical trial registries were searched to identify relevant in-progress RCTs for the interventions of interest (although their results were not included in the synthesis) and the reference lists of included reports and relevant systematic reviews were screened. Thirty-two studies were identified from this search. Studies publishing results after March 2020 (KITE, KESTREL, YOSEMITE, and RHINE) were also included. An update of the systematic literature review was conducted in October 2021, and 7 additional studies were retrieved.
The population of interest was adult patients (> 18 years) with DME. The intervention of interest was brolucizumab (6 mg intravitreal injection every 8 weeks or every 12 weeks). Any of the following therapies listed as monotherapy or combination therapy were considered:
anti-VEGFs (ranibizumab, aflibercept, bevacizumab, brolucizumab)
corticosteroids (fluocinolone, dexamethasone)
laser photocoagulation
any of the previously specified plus vitrectomy procedures
anti-VEGF and anti–angiopoietin-2 (faricimab)
Relevant comparators also included placebo, best supportive care, and observation. The efficacy outcomes of interest included visual acuity outcomes (measured using BCVA scores, EDTRS letters, logMAR, and Snellen charts), anatomic outcomes (including change in retinal thickness and presence of SRF or IRF), and DR-related outcomes. Other evaluated outcomes were injection frequency (reported as the mean or median number of injections given at year 1 and year 2), safety, and HRQoL, which was measured with the NEI VFQ-25. The sponsor’s ITC reported outcomes at year 1 and year 2.
Study selection and data extraction were conducted by 2 independent reviewers, with arbitration by a third reviewer, as needed, to resolve disagreements. Details of the methods used to extract data from the included studies were described. The risk-of-bias assessment of each included RCT was conducted using a checklist recommended in the NICE guidelines.48 The number of reviewers involved in the risk-of-bias appraisals, whether they worked independently, and any mechanisms in place to resolve disagreements were not reported. The checklist contains questions related to the appropriateness of randomization, the treatment allocation, masking, the similarity of the prognostic factors between groups, any imbalance in the number of dropouts between groups, data reporting, and the appropriate use of statistical methods.
ITC Analysis Methods
A feasibility assessment was conducted to evaluate the suitability of available DME trials for NMAs. The objective of the feasibility assessment was to evaluate clinical heterogeneity and determine the suitability of conducting NMAs for the efficacy and safety outcomes of interest. To investigate potential between-trial heterogeneity, a qualitative assessment of heterogeneity was conducted based on trial design, eligibility criteria, baseline patient characteristics, trial-specific outcome definitions, and the definition of the treatment contrasts required for generating the network.
A number of effect modifiers for visual acuity outcomes were identified in the sponsor’s ITC. The frequency of injections, age, BCVA at baseline, and retinal thickness at baseline were considered related to BCVA outcomes. A covariate of interest was plotted versus BCVA, and a regression line (weighted by the sample size) was presented along with the adjusted R2 value. The results of the regression analyses suggested considerable clinical heterogeneity in the reporting of some outcomes in the available evidence. The plots may highlight variables that can be considered for covariate adjustment in the NMA analyses and therefore improve model fit.
Several assumptions were made when defining treatment node assignment:
The administered dose does not impact the outcomes, i.e., similar efficacy was assumed between the ranibizumab 0.3 mg and 0.5 mg doses and between the bevacizumab 1.25 mg and 1.5 mg doses.
Previous studies that examined the effect of different regimens (aflibercept every 4 weeks, every 8 weeks, or as needed) assumed there were no significant differences observed among the VEGF Trap-Eye treatment group.
It is unlikely that adding laser photocoagulation to an anti-VEGF regimen would make a difference to the BCVA outcomes, retinal thickness, or rates of discontinuation.
The relative efficacy of brolucizumab compared with other treatments for the patients with DME was evaluated using Bayesian NMAs for key efficacy outcomes: change from baseline in BCVA (continuous or categories), injection frequency, AEs, and all-cause discontinuation. Both fixed- and random-effect models were fit to all outcomes. Given the heterogeneity in the patient characteristics across the trials, the authors of this ITC expected random effects to be the most appropriate model for the data, unless there was compelling evidence in favour of the fixed-effects model (i.e., deviance information criterion [DIC] ≥ 3 in favour of the fixed-effect model). The total residual deviance was used to assess the model fit, considering that models with a total residual deviance similar to the number of data points often fit the data adequately. The models were run for 3 chains, each with 10,000 iterations after a burn-in of 10,000. Studies were classified as reporting results at year 1 if the absolute difference was less than 5 weeks from 52 weeks, or at year 2 if the absolute difference was less than 5 weeks from 104 weeks. Time points that did not meet these criteria were excluded from the analyses.
The safety and tolerability profile of brolucizumab was qualitatively compared with that of other treatments.
The NMA was conducted using JAGS 4.3.0. All other data analyses and plots were created using the statistical program R and its associated packages.
Methods of the ITC analyses are summarized in Table 20.
Table 20: ITC Analysis Methods
Characteristics | Description of analysis methods | |||
|---|---|---|---|---|
ITC methods | Bayesian NMA | |||
Priors a (models proposed for each of the outcomes) | Outcomes | Likelihood | Prior for mean change in treatment | Prior for SD |
Change in BCVA (continuous) | Normal-identity Bivariate normal-identity | delta (i) or d ~ dnorm(0,0.0001) | tau ~ dunif(0,5) | |
Change in BCVA (categories) | Binomial-logit (single categories) | delta (i) or d ~ dnorm(0,0.05) | tau ~ dunif(0,2) | |
Injection frequency | Simple pooling — no NMA model required | NA | NA | |
Adverse events | Binomial-cloglog | delta (i) or d ~ dnorm(0,0.0001) | tau ~ dunif(0,5) | |
All cause discontinuation | Binomial-cloglog | delta (i) or d ~ dnorm(0,0.0001) | tau ~ dunif(0,5) | |
Assessment of model fit | Total residual deviance was used, with DIC ≥ 3 in favour of the fixed-effect model.49 | |||
Assessment of consistency | Inconsistency was evaluated through the global inconsistency test. Studies that violated the assumption of inconsistency may be detected visually by the example plot (which compares the total residual deviance for a trial under the NMA and inconsistency assumptions). Studies that had a residual deviance of > 1 in the NMA model relative to the inconsistency model were highlighted as outliers. Inconsistency was also assessed through DIC scores. | |||
Assessment of convergence | Markov chain Monte Carlo models were run for 3 chains with 100,000 iterations after a burn-in of 10,000. A number of statistical tests were also used: Gelman Rubin statistic, the Geweke diagnostic, and the Raftery and Lewis Diagnostic. | |||
Outcomes |
| |||
Follow-up time points | Studies were classified as reporting results at year 1 if the absolute difference was < 5 weeks from 52 weeks, and as year 2 if the absolute difference was < 5 weeks from 104 weeks. Time points that did not meet these criteria were dropped from the analysis. | |||
Construction of nodes | Information on the molecule and addition of LP and/or DEX was used to define the treatment node. However, a more granular approach to grouping regimens was adopted when analyzing the number of injection frequencies. Methods used to construct the nodes:
| |||
Sensitivity analyses | Not conducted | |||
Subgroup analysis | Not conducted | |||
Methods for pairwise meta-analysis |
| |||
AE = adverse event; BCVA = best-corrected visual acuity; d = distribution; DEX = dexamethasone; DIC = deviance information criterion; dnorm = normal distribution; dunif = uniform distribution; ITC = indirect treatment comparison; LP = laser photocoagulation; NA = not applicable; NMA = network meta-analysis; SD = standard deviation.
aPrior on baselines: mu ~ dnorm(0,0.0001).
bOutcomes that were used to inform the pharmacoeconomic analysis for the submission.
Source: Sponsor-submitted ITC.47
Results of Sponsor-Submitted ITC
Summary of Included Studies
In total, 43 RCTs were identified and included in the NMA.
Sources of Heterogeneity Identified Across the Included RCTs
Study Design and Patient Characteristics at Baseline
The majority of the included studies were phase I, II, or III trials, and 3 studies were phase IV. Thirteen studies did not report the study phase. Eighteen studies were double-blinded, 8 were single-blinded, 1 was triple-blinded, and 7 were open-label studies. Blinding was unclear for the remaining 6 studies. The number of patients or study eyes ranged from 37 to more than 1,000 across the included trials. The length of follow-up varied from 48 weeks to 168 weeks, although the time points of interest for most of the outcomes were year 1 and year 2.
Most of the patients’ baseline characteristics were presented graphically. In general, across the included studies, patients’ baseline characteristics were comparable for mean age (ranged from 58 to 66 years) and hemoglobin A1C level (ranged from 7.3 to 8.7). The mean time since diagnosis of DME ranged from 1.2 to 3.4 years. The duration of diabetes ranged from 10 to 18 years in the included studies. Based on data from 26 trials, the mean BCVA scores ranged from 33 to 71 letters, indicating a visual acuity of between 20/40 and 20/320. Based on data from 25 trials, the mean retinal thickness at baseline ranged from 321 µm to 596 µm, and the majority of studies included patients with a retinal thickness of more than 400 µm.
Limited information was available on the number of patients with prior DME treatment. Among the studies that reported this information, 4 studies included only treatment-naive patients (100%). The proportion of patients who had received previous anti-VEGF therapy ranged from 5% to 43%.
Table 31 in Appendix 2 provides a description of trial characteristics and key patient characteristics at baseline across the included trials.
Outcome Measures
In the included studies, visual acuity was measured with a variety of methods, such as BCVA scores, EDTRS letters, logMAR, and Snellen charts. BCVA data were captured as the proportion of patients with a change in the number of ETDRS letters (gain of ≥ 5, ≥ 10, and ≥ 15 letters; and loss of ≥ 15, ≥ 10, ≥ 5, < 5, ≥ 0, ≥ 30, or < 10 letters), proportion of patients at a particular BCVA level, or mean change from baseline.
There was heterogeneity in the way retinal thickness was defined in the included trials, such as central retinal thickness, CSFT, central macular thickness, and central foveal thickness. However, the majority of the studies used similar definitions to measure retinal thickness. There was additional heterogeneity in the type of measurement used for retinal thickness.
Change in disease severity from baseline across the included studies was reported as proportion of patients who showed worsening, improvement (≥ 1 step, ≥ 2 steps, or ≥ 3 steps), or no change by steps on the ETDRS DRSS from baseline to specific time points.
Injection frequency was reported as the mean or median number of injections required at the end of year 1 and year 2.
Treatment Regimens
Treatments for DME vary considerably in molecule, dose, and treatment regimen (Table 32 in Appendix 2). Some collapsing and/or simplification of the treatment regimens was required to construct connected networks.
Results
Risk of Bias
Among the included RCTs, the majority of studies (66%) were at low risk of bias due to the randomization. Patient baseline characteristics were judged to be comparable in 80% of the studies, imbalanced in 18% of studies, and not reported in 2% of studies. Masking was judged to be adequate in 36% of studies and unclear in 30% of studies. Thirty-four percent of studies were judged to be at high risk of bias for masking (either open-label or the outcome assessor was unmasked). For withdrawals, 63% of studies were considered at low risk of bias. Thirty percent of studies were at unclear risk of bias and 7% were at high risk of bias in this domain. The risk of selective reporting was low in 80% of studies, unclear in 18% of studies, and high in 2% of studies. The details of the statistical analyses were clearly reported in 66% of studies and unclear in 30% of studies. Two studies (4%) used a per-protocol analysis and were judged at high risk of bias for this item.
BCVA Outcomes
Year 1
For the outcome of BCVA at year 1, 37 trials were included in the analysis. Results of a random-effects model (DIC = 282.78; total residual deviation of 76.17) are presented, as this model had a smaller DIC value compared with the fixed-effects model (DIC = 335.35; total residual deviation of 149.28). A graphic representation of the evidence network is presented in Figure 3. Most trials compared active treatments; the network did not include 1 closed loop involving brolucizumab as an intervention.
No treatment was favoured for the outcome of mean change from baseline on BCVA letters (95% CrIs contained the null) when brolucizumab was compared with aflibercept, bevacizumab, or ranibizumab. For the comparisons of brolucizumab with bevacizumab and brolucizumab with ranibizumab, the 95% CrIs were imprecise, precluding conclusions regarding potential differences in effects.
Figure 3: Network Diagram for the Outcome of Change in BCVA at Year 1
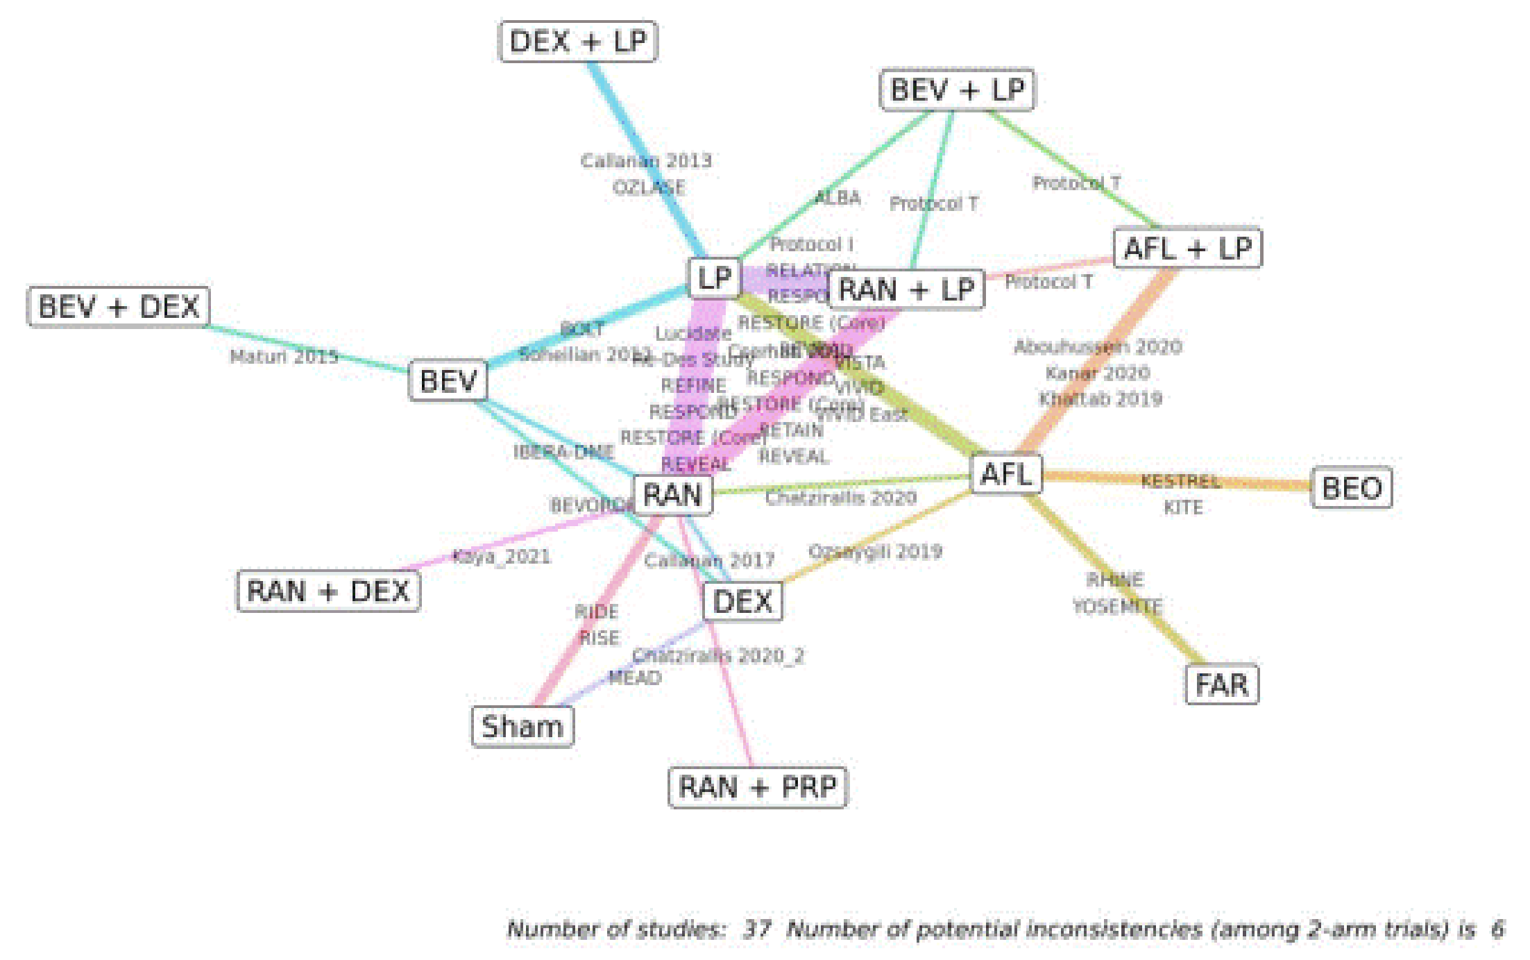
AFL = aflibercept; BCVA = best-corrected visual acuity; BEO = Beovu (brolucizumab); BEV = bevacizumab; DEX = dexamethasone; FAR = faricimab; LP = laser photocoagulation; PRP = panretinal photocoagulation; RAN = ranibizumab.
Source: Sponsor-submitted indirect treatment comparison.47
Year 2
For the outcome of BCVA at year 2, 14 trials were included in the analysis. Results of a random-effects model (DIC = 112.48; total residual deviation of 29.55) are presented, as this model had a similar DIC value compared with the fixed-effects model (DIC = 117.01; total residual deviation of 39.87). A graphic representation of the evidence network is presented in Figure 4. Most trials compared active treatments; the network did not include 1 closed loop involving brolucizumab as an intervention.
No treatment was favoured for the outcome of mean change from baseline on BCVA letters (95% CrIs contain the null) when brolucizumab was compared with aflibercept, ranibizumab, and bevacizumab for the outcome of BCVA. For all comparisons, the 95% CrIs were imprecise, precluding conclusions regarding potential differences in effects.
A bivariate model was fitted to the data to jointly analyze outcomes at year 1 and year 2, when a correlation between these 2 years was assumed. Results of a random-effects model were reported. Owing to imprecision in the effect estimates (i.e., wide 95% CrIs) for all comparisons, no conclusions could be drawn regarding potential differences in effects.
Figure 4: Network Diagram for the Outcome of Change in BCVA at Year 2
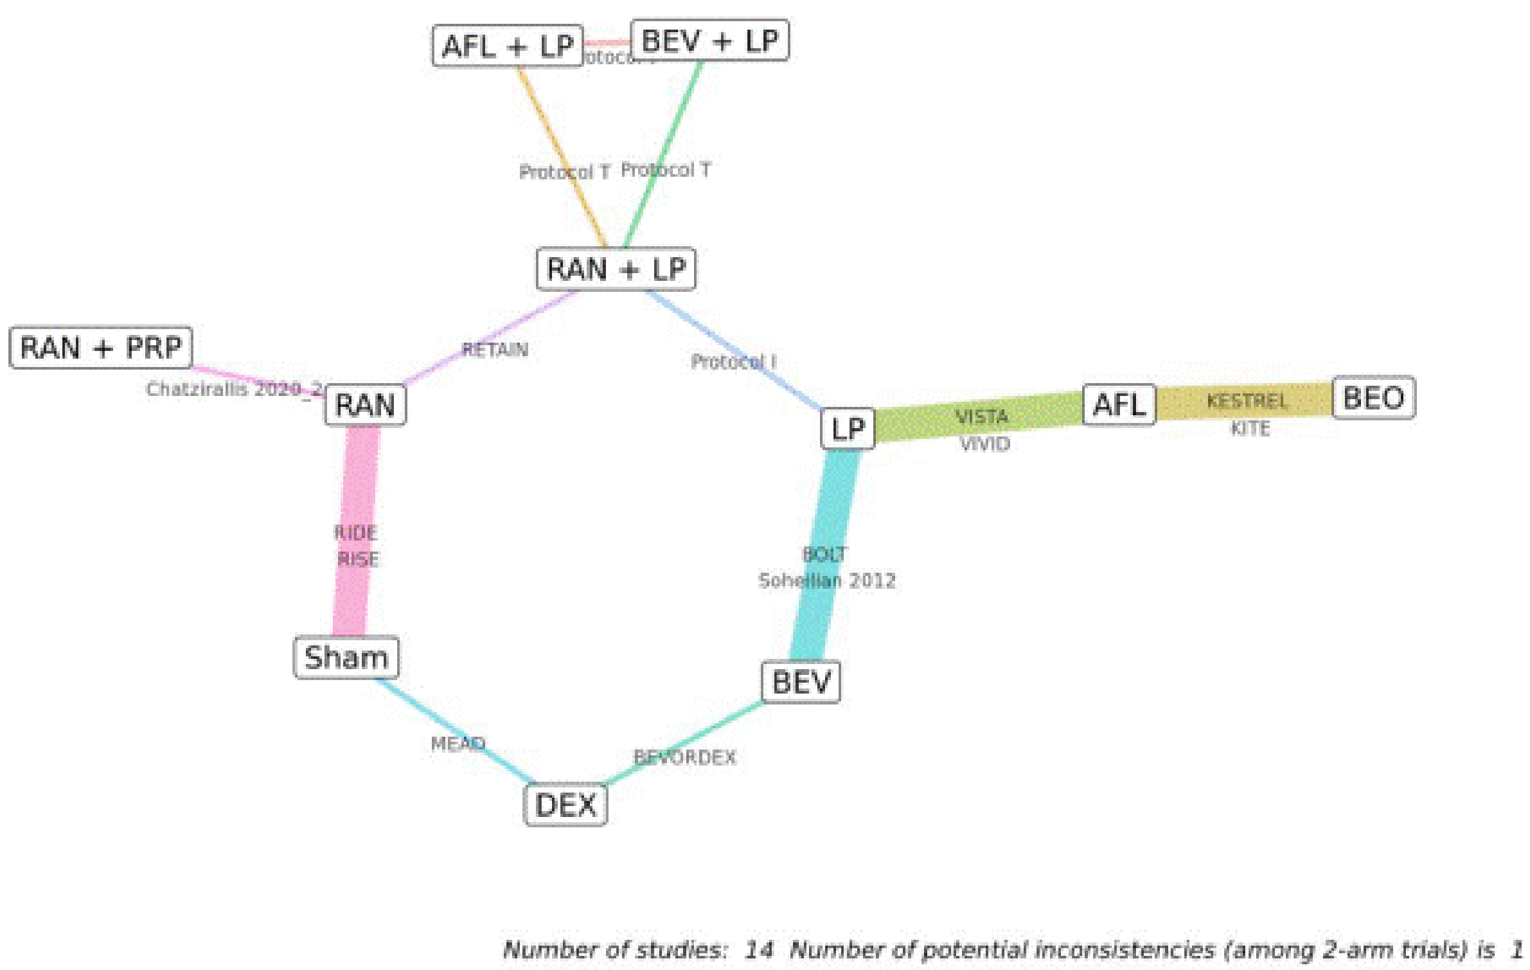
AFL = aflibercept; BCVA = best-corrected visual acuity; BEO = Beovu (brolucizumab); BEV = bevacizumab; DEX = dexamethasone; LP = laser photocoagulation; PRP = panretinal photocoagulation; RAN = ranibizumab.
Source: Sponsor-submitted indirect treatment comparison.47
The comparative results of change in BCVA outcomes are outlined in Table 21.
The relative risks of a gain or loss of 15 or more letters at year 1 and year 2 were evaluated in the NMA. No treatment was favoured for these outcomes on BCVA (95% CrIs contain 1) when brolucizumab was compared with aflibercept, bevacizumab, and ranibizumab, except that treatment with brolucizumab may be favourable (95% CrIs did not include 1) compared with ranibizumab for the outcome of gain of 15 letters or more at year 1; however, the 95% CrIs were very close to the null. For all comparisons, the 95% CrIs were imprecise, precluding conclusions regarding potential differences in effects (Table 22).
Diabetic Retinopathy Severity Score
The relative risks of a 2-step or greater improvement at year 1 and year 2 were evaluated in the NMA. For the results at year 1, 12 trials were included in the analysis. The results of the fixed-effects model (DIC = 396.98; total residual deviation of 28.7) are presented. For year 2, 5 trials were included in the analysis. The results of the fixed-effects model (DIC = 93.46; total residual deviation of 9.3) are presented.
No treatment was favoured for these outcomes on disease severity (95% CrIs contain 1) when brolucizumab was compared with aflibercept, bevacizumab, and ranibizumab. For all comparisons, the 95% CrIs were imprecise, precluding conclusions regarding potential differences in effects (Table 23).
Table 21: NMA Results — Mean Change in BCVA as Letters at Year 1 and Year 2
Comparators | Mean difference (95% CrI) BCVA mean change from baseline at year 1 | Mean difference (95% CrI) BCVA mean change from baseline at year 2 | BCVA mean change from year 1 to year 2 |
|---|---|---|---|
Brolucizumab vs. comparators | |||
Number of studies, model | 37 RCTS included, random-effects model | 14 RCTs included, random-effects model | Random-effects model |
Aflibercept | −0.08 (−2.86 to 2.78) | 0.3 (−4.11 to 4.79) | 0.37 (−4.32 to 5.11) |
Bevacizumab | 1.49 (−3.16 to 6.06) | 5.11 (−3.25 to 13.25) | 4.07 (−12.35 to 4.31) |
Ranibizumab | 1.79 (−1.74 to 5.36) | 3.22 (−6.44 to 12.44) | 1.61 (−7.85 to 10.64) |
BCVA = best-corrected visual acuity; CrI = credible interval; NMA = network meta-analysis; RCT = randomized controlled trial.
Source: Sponsor-submitted indirect treatment comparison.47
Table 22: NMA Results — Relative Risk of Gain or Loss of 15 or More Letters in BCVA at Year 1 and Year 2
Comparators | Gain of ≥ 15 letters at year 1, RR (95% CrI) | Gain of ≥ 15 letters at year 2, RR (95% CrI) | Lose ≥ 15 letters at year 1, RR (95% CrI) | Lose ≥ 15 letters at year 2, RR (95% CrI) |
|---|---|---|---|---|
Brolucizumab vs. comparators | Brolucizumab vs. comparators | |||
Number of studies, model | 21 RCTs included, random-effects model | 10 RCTs included, random-effects model | 15 RCTs included, random-effects model | 10 RCTs included, random-effects model |
Aflibercept | 1.04 (0.8 to 1.31) | 1.13 (0.79 to 1.53) | 0.45 (0.05 to 2.90) | 1.05 (0.27 to 3.88) |
Bevacizumab | 2.15 (0.96 to 5.43) | 0.55 (0.32 to 1.70) | 0.82 (0.03 to 40.22) | 28.33 (0.34 to 35,126.94) |
Ranibizumab | 1.74 (1.07 to 2.91) | 1.18 (0.5 to 4.03) | 0.15 (0.01 to 1.99) | 0.55 (0.06 to 8.07) |
BCVA = best-corrected visual acuity; CrI = credible interval; NMA = network meta-analysis; RCT = randomized controlled trial; RR = relative risk.
Note: Bolded numbers indicate that the 95% CrI excludes the null.
Source: Sponsor-submitted indirect treatment comparison.47
Table 23: NMA Results — Relative Risk of an Improvement of 2 or More Severity Steps in DRSS at Year 1 and Year 2
Comparators | Improvement of ≥ 2 steps at year 1, RR (95% CrI) | Improvement of ≥ 2 steps at year 2, RR (95% CrI) |
|---|---|---|
Brolucizumab vs. comparators | ||
Number of studies, model | 12 RCTs included, fixed-effects model | 5 RCTs included, fixed-effects model |
Aflibercept | 1.16 (0.69 to 1.70) | 1.13 (0.56 to 1.84) |
Bevacizumab | 1.28 (0.38 to 10.87) | 3.98 (0.55 to 48.19) |
Ranibizumab | 2.25 (0.70 to 6.51) | NA |
CrI = credible interval; DRSS = diabetic retinopathy severity score; NA = not available; NMA = network meta-analysis; RCT = randomized controlled trial; RR = relative risk.
Source: Sponsor-submitted indirect treatment comparison.47
Change in Retinal Thickness
The relative mean differences in the change in retinal thickness at year 1 and year 2 were evaluated in the NMA. Brolucizumab was favoured when compared with bevacizumab and ranibizumab (95% CrIs did not contain 0). When compared with aflibercept, no treatment was favoured (Table 24).
Table 24: NMA Results — Change in Retinal Thickness at Year 1 and Year 2
Comparators | Change in retinal thickness at year 1, RMD (95% CrI), µm | Change in retinal thickness at year 2, RMD (95% CrI), µm |
|---|---|---|
Brolucizumab vs. comparators | ||
Number of studies, model | 24 RCTs included, random-effects model | 12 RCTs included, random-effects model |
Aflibercept | −9.46 (−24.47 to 5.19) | −9.84 (−26.13 to 6.13) |
Bevacizumab | −47.25 (−81.23 to −12.4) | −96.62 (−143.33 to −50.95) |
Ranibizumab | −51.12 (−74.82 to −26.98) | −118.18 (−155.06 to −82.13) |
CrI = credible interval; NMA = network meta-analysis; RCT = randomized controlled trial; RMD = relative mean difference.
Note: Bolded numbers indicate that the 95% CrI excludes the null.
Source: Sponsor-submitted indirect treatment comparison.47
Serious Ocular and Nonocular AEs
The risks of serious ocular and nonocular AEs up to 2 years were evaluated in the NMA. None of the treatments was favoured when brolucizumab was compared with aflibercept, bevacizumab, or ranibizumab (95% CrIs contain 1). For all comparisons, the 95% CrIs were imprecise, precluding conclusions regarding potential differences in effects (Table 25).
Table 25: NMA Results — Risk of Serious Adverse Events
Comparators | Serious ocular AEs HR (95% CrI) | Serious nonocular AEs HR (95% CrI) |
|---|---|---|
Brolucizumab vs. comparators | Brolucizumab vs. comparators | |
Number of studies, model | 19 RCTs included, random-effects model | 12 RCTs included, random-effects model |
Aflibercept | 1.53 (0.47 to 5.31) | 0.87 (0.51 to 1.51) |
Bevacizumab | 5.93 (0.28 to 250.33) | 0.68 (0.12 to 3.70) |
Ranibizumab | 2.44 (0.32 to 16.67) | 0.90 (0.32 to 2.50) |
AE = adverse event; CrI = credible interval; HR = hazard ratio; NMA = network meta-analysis; RCT = randomized controlled trial.
Source: Sponsor-submitted indirect treatment comparison.47
Study Discontinuation
The risks of study discontinuation were evaluated in the NMA. No treatment was favoured when brolucizumab was compared with aflibercept and bevacizumab (95% CrIs contain 1). For these comparisons, the 95% CrIs were imprecise, precluding conclusions regarding potential differences in effects. Ranibizumab was favoured when it was compared with brolucizumab (Table 26).
Table 26: NMA Results — Risk of Study Discontinuation
Comparators | Study discontinuation, all-cause, HR (95% CrI) | Study discontinuation due to AEs, HR (95% CrI) |
|---|---|---|
Brolucizumab vs. comparators | Brolucizumab vs. comparators | |
Number of studies, model | 29 RCTs included, random-effects model | 16 RCTs included, random-effects model |
Aflibercept | 1.23 (0.84 to 1.81) | 0.71 (0.22 to 2.15) |
Bevacizumab | 1.84 (0.84 to 4.07) | NA |
Ranibizumab | 2.03 (1.15 to 3.66) | 1.26 (0.26 to 6.03) |
AE = adverse event; CrI = credible interval; HR = hazard ratio; NA = not available; NMA = network meta-analysis; RCT = randomized controlled trial.
Note: Bolded numbers indicate that the 95% CrI excludes the null.
Source: Sponsor-submitted indirect treatment comparison.47
Injection Frequency
Injection frequencies were not analyzed using an NMA model but assigned to a particular node and estimated using baseline pooling for both year 1 and year 2 time points. To obtain the pooled mean injection frequency, 2 approaches were considered in the ITC, 1 that obtains the pooled mean using fixed- and random-effects meta-analyses and 1 that uses a weighted average. Given the heterogeneity within the studies, it may be appropriate to use the random-effects estimate of mean injection frequency.
Injection frequencies differ substantially, primarily due to the different treatment regimens used and the study and locations. The average frequency of injection for brolucizumab was 6.9 (SD = 1.3) by the end of the first year, and 10.5 (SD = 2.9) by the end of the second year of treatment. As expected, as-needed and treat-and-extend regimens have fewer injections. It is possible that increased injection frequencies result in increased absolute BCVA gain; however, there was no evidence of treatment effect modification.
Table 27: Number of Injections Reported in the Sponsor-Submitted ITC
Treatment regimen | Time point | Number of injections, mean (SD) |
|---|---|---|
Brolucizumab 6 mg q.8.w. or q.12.w. | Year 2 | 10.45 (2.87) |
Brolucizumab 6 mg q.8.w. or q.12.w. | Year 1 | 6.90 (1.25) |
Brolucizumab 6 mg q.8.w. or q.12.w. | Year 2 | 10.45 (2.87) |
Aflibercept PRN | Year 1 | 5.39 (1.54) |
Aflibercept q.4.w. | Year 1 | 12.17 (2.41) |
Aflibercept q.8.w. | Year 1 | 8.55 (1.30) |
Aflibercept q.4.w. | Year 2 | 21.91 (5.8) |
Aflibercept q.8.w. | Year 2 | 13.30 (3.05) |
Ranibizumab PRN | Year 1 | 7.58 (2.85) |
Ranibizumab q.4.w. | Year 1 | 7.8 (2.94) |
Ranibizumab PRN | Year 2 | 11.34 (5.28) |
Ranibizumab q.4.w. | Year 2 | 21.2 (6.4) |
Ranibizumab T and E | Year 2 | 12.8 (3.7) |
Bevacizumab PRN | Year 1 | 9.84 (3.11) |
Bevacizumab PRN | Year 2 | 14.2 (7.9) |
ITC = indirect treatment comparison; PRN = pro re nata (as needed); q.4.w. = every 4 weeks; q.8.w. = every 8 weeks; q.12.w. = every 12 weeks; SD = standard deviation; T and E = treat and extend.
Source: Sponsor-submitted ITC.47
Critical Appraisal of Sponsor-Submitted ITC
The ITC was based on a systematic literature review that identified studies according to prespecified inclusion criteria. A comprehensive and transparent approach to the systematic review was provided, including a comprehensive search. The literature search was well reported, with a complete copy of the search strategy included in the report. Study selection and data extraction were performed by 2 reviewers independently and any disagreements were resolved through consensus, so the risk of bias and error in study selection and data extraction were minimized. A risk-of-bias evaluation for the studies included in the systematic literature review was performed, based on a tool that considers the appropriateness of randomization and allocation concealment, similarity at baseline across treatment groups in prognostic factors, masking, imbalances in dropouts, outcomes reporting, and intention-to-treat analysis. It was unclear whether the risk-of-bias assessments were performed in duplicate, so the potential for bias and error in the appraisals is uncertain. The results of the risk-of-bias assessment for the studies were included in the NMA, but it was not reported how the results of the quality appraisal factored into the NMA (e.g., sensitivity analyses excluding studies rated with a high risk of bias).
The inclusion criteria would allow a population that is relevant for settings in Canada. The comparisons reported in this ITC have generally incorporated relevant treatments for settings in Canada, including treatments that have extensive clinical use but lack a formal indication from Health Canada such as bevacizumab, which is used in clinical practice in Canada. However, not all outcomes considered important to patients, clinicians, and the drug plans were investigated according to the CADTH protocol, such as HRQoL and change in vision-related function.
The degree of heterogeneity (such as the patients’ disease characteristics at baseline) between the included studies was difficult to assess because of the incomplete reporting of study characteristics. Description of trial design, sample size, and disease duration were reported. However, the ITC failed to report information related to the methods used for handling missing data. There was considerable variability in study design (phase I through IV trials were included), year of conduct, sample size, and treatment regimen. This ITC report indicates that these trials included arms that were pooled for the NMA (various doses of a particular drug were lumped into a single node) for increased network connectivity. The degree of similarity between these trials was not reported. A sensitivity analysis addressing the effect of pooling these doses was not presented. Trials in different phases were included; however, a sensitivity analysis addressing the effect of pooling these types of trials was not presented.
Similarly, inadequate information about and variability in the baseline patient characteristics reported contribute to heterogeneity in the studies included in the ITC. Clinical trial eligibility criteria were described for the trials that were ultimately included in the NMA. However, many individual studies failed to report or inadequately reported patient characteristics, resulting in gaps in the extracted ITC data. There was a lack of information about key baseline characteristics, such as the presence of significant diabetic macular ischemia, the patient’s previous treatment and response, presence of IRF, and systemic comorbidities, including hypertension, chronic kidney disease, obesity, or cardiac conditions.
Most of the patients’ baseline characteristics were presented graphically. Even though some of the patients’ baseline characteristics were comparable, such as age (which ranged from 58 to 66 years) and hemoglobin A1C level (which ranged from 7.3 to 8.7), heterogeneity still exists. The mean time since diagnosis of DME ranged from 1.2 to 3.4 years. The duration of diabetes ranged from 10 to 18 years in the included studies. Based on data from 26 trials, the mean BCVA scores ranged from 33 to 71 letters. Based on data from 25 trials, the mean retinal thickness at baseline ranged from 321 µm to 596 µm, and the majority of studies included patients with a retinal thickness of more than 400 µm. There was also heterogeneity in the reporting of methods for measuring retinal thickness and in the results of changes in retinal thickness. The heterogeneity based on the factors that were reported in combination with the inability to assess those that were not reported means there is considerable uncertainty as to whether the assumptions related to transitivity were met. The treatment effect of the study drug could differ by patient characteristics at baseline. Despite acknowledging the degree of heterogeneity, the technical report did not provide information on the assessments of heterogeneity (e.g., graphic representation of baseline characteristics, statistical tests) that was sufficient to fully understand the sources of heterogeneity. Therefore, it is plausible that the potential for heterogeneity could have influenced the comparative efficacy and safety estimates, and it is not possible to quantify or identify the direction of the bias. Several assumptions were made when defining treatment node assignment, for example: that a different dose did not impact the outcomes, that the ranibizumab 0.3 mg and 0.5 mg doses had similar efficacy, and that there were no significant differences in the effect of different regimens (aflibercept every 4 weeks, every 8 weeks, or as needed); it is uncertain whether these assumptions are valid.
The analytical method used for the ITC was well reported. The authors provided a description of which studies were included in each of the analyses. The study outcomes in the ITC are of interest to the CADTH systematic review protocol and are clinically relevant. The analysis of the extracted data followed the framework suggested by NICE.50 The sponsor’s ITC reported on the number of burn-ins and convergence characteristics.
Additional limitations to the ITC include the following:
There was a weak connection between brolucizumab and the rest of the network: brolucizumab was only connected to the network through aflibercept through the KESTREL and KITE studies; this may contribute to uncertainty in the models. The networks consider a large number of interventions; therefore, collapsing and/or simplifying the treatment regimens was required. Although there are some closed loops for some networks, overall, the nodes were connected by few trials. The geometry of the networks likely contributed to uncertainty in the estimates for models (by limiting the ability to assess consistency) and the level of imprecision in certain comparisons as evidenced by wide CrIs. For almost all comparisons and outcomes (with a few exceptions), no conclusion could be drawn about the comparative effects because the 95% CrIs included multiple possible effects (i.e., appreciable benefit, appreciable harm, and little-to-no difference).
For injection frequency, brolucizumab every 8 weeks and every 12 weeks were examined in the ITC. The results of injection frequency were derived from data pooling without conducting an NMA. Although drug administration with fixed treatment intervals according to a specific protocol is commonly observed in clinical trials, the clinical expert consulted by CADTH indicated that, in the real world, the treatment regimen could be more flexible, based on the patient’s response. Therefore, the findings from the clinical trials may not reflect clinical practice.
Other Relevant Evidence
This section includes a summary of 1 additional relevant study, KINGFISHER,13 which was included in the sponsor’s submission to CADTH, as it was considered by the sponsor to provide further information on the safety of brolucizumab in patients with DME. The study compared the efficacy and safety of brolucizumab versus aflibercept in patients with DME, but the treatment intervals used for both drugs were shorter than the recommended intervals (beyond the loading phase) in the respective Health Canada–approved monographs.14,15
The frequency of dosing for brolucizumab was selected based on previous studies that have suggested that, for some patients with DME, frequent dosing (i.e., every 4 weeks) with anti-VEGF therapy may be required to improve and maintain functional and anatomical outcomes.13 The clinical expert consulted by CADTH did not consider the efficacy results for the treatment intervals used in the KINGFISHER trial to be relevant or generalizable to clinical practice; therefore, they are not included in this summary. However, given the frequency of administration used in the KINGFISHER trial, the clinical expert suggested the safety data reported would be of value. In particular, the clinical expert suggested that the safety data may provide information on whether intraocular inflammation and retinal vasculitis are idiosyncratic AEs related to brolucizumab itself rather than to the frequency of intravitreal injections.
KINGFISHER Study
Methods
One multicentre, randomized, double-blinded, active-controlled, parallel-group, prospective, phase III study, KINGFISHER,13 was conducted to evaluate the efficacy and safety of brolucizumab versus aflibercept in the treatment of adult patients with visual impairment due to DME. The primary objective was to demonstrate that brolucizumab was noninferior to aflibercept with respect to change in visual acuity from baseline up to week 52. The prespecified noninferiority margin was 4 ETDRS letters. Patients were screened and randomized between 2019 and 2020 and the last patient completed the last visit in 2021. It was unclear whether sites in Canada were included in the KINGFISHER study.
Patients who met all inclusion and none of the exclusion criteria during the 2-week screening period were randomized using interactive response technology at a 2:1 ratio to 1 of 2 treatment arms: brolucizumab 6 mg administered every 4 weeks or aflibercept 2 mg administered every 4 weeks. Randomization was stratified by baseline BCVA scores (≤ 34 and > 34 letters read). The 48-week double-blind treatment period was followed by a 4-week follow-up period up to week 52. Patients were evaluated every 4 weeks for the duration of the study.
Of note, only 1 eye was selected as the study eye and treated with the study drug. If both eyes were eligible, the eye with worse visual acuity was selected; however, the investigator could select the eye with better visual acuity for medical reasons or due to local ethical requirements. The unmasked investigator and staff administered the injections and performed postinjection safety assessments, while the masked investigator and staff performed study assessments.
Populations
Inclusion and Exclusion Criteria
The inclusion and exclusion criteria used in the KINGFISHER study13 were generally consistent with the eligibility criteria used in the pivotal KESTREL11 and KITE12 studies. The KINGFISHER study included adult patients (≥ 18 years of age) with type 1 or type 2 diabetes who were diagnosed with visual impairment due to DME. Visual impairment due to DME was defined as the eye with a BCVA score between 73 and 23 ETDRS letters, inclusive, and DME involving the centre of the macula with a CSFT of 320 μm or greater. Of note, patients could either be treatment-I or could have previously received anti-VEGF therapy but could not have received any injections within 3 months before baseline. Patients needed to have a hemoglobin A1C of 12% or less and mild to moderate proliferative DR; these characteristics may be associated with the need for frequent dosing of anti-VEGF therapy.
Patient Characteristics
A summary of baseline characteristics in the KINGFISHER study13 is available in Appendix 2.
The mean age of patients was 60.9 years (SD = 10.59) in the brolucizumab arm and 60.2 years (SD = 9.31) in the aflibercept arm. The proportion of patients who were male was 56.1% (n = 194) and 61.4% (n = 105) in the brolucizumab and aflibercept arms, respectively. The majority of patients were white in both treatment arms and the respective proportion was similar in the brolucizumab (83.8%; n = 290) and aflibercept (84.8%; n = 145) arms. The baseline diabetes characteristics were similar between the treatment arms, with 94.5% (n = 327) and 94.7% (n = 162) of patients documented with type 2 diabetes in the brolucizumab and aflibercept arms, respectively. The mean hemoglobin A1C was also similar between treatment groups: 7.84% (SD = 1.476) in the brolucizumab arm versus 7.98% (SD = 1.582) in the aflibercept arm.
The mean duration of diagnosis with DME was 20.6 months (SD = 29.94) and 18.2 months (SD = 25.60) repoIted in the brolucizumab and aflibercept arms, respectively. The study eye was the left eye in 173 patients (50.0%) in the brolucizumab arm and 92 patients (53.8%) in the aflibercept arm. The mean BCVA score was 61.3 letters (SD = 10.14) and 60.5 letters (SD = 11.27) in the brolucizumab and aflibercept arms, respectively. The mean CSFT was 514.1 μm (SD = 138.94) and 511.2 μm (SD = 156.29) in the brolucizumab and aflibercept arms, respectively. Most patients in both treatment arms had mild to moderately severe nonproliferative DR: 75.6% (167 out of 221) and 76.3% (90 out of 118) in the brolucizumab and aflibercept arms, respectively). Prior anti-VEGF treatment in the study eye was reported in 95 patients (27.5%) and 52 patients (30.4%) in the brolucizumab and aflibercept arms, respectively.
Interventions
The investigational drug was brolucizumab 6 mg (0.05 mL) solution for intravitreal injection. The comparator drug was aflibercept 2 mg (0.05 mL) solution for intravitreal injection. Treatments were administered every 4 weeks beginning in week 1 and up to and including week 48.
Panretinal photocoagulation was allowed at any time during the study as required, according to the investigator. Topical ocular corticosteroids were also allowed in the study eye as required. If cataract surgery or yttrium aluminum garnet laser was required in the study eye, it was scheduled such that it did not disturb the schedule of the study treatment. If the fellow eye developed visual impairment due to DME or any other disease during the study, the eye could also be treated with standard of care and other treatments according to clinical practice, at the discretion of the investigator.
Outcomes and Statistical Analysis
The primary end point was the change from baseline in BCVA at week 52 in the study eye using ETDRS-like charts (measure of the visual function of the retina).
A sample size of 357 patients (238 in the brolucizumab arm and 119 in the aflibercept arm) was required to assess noninferiority with respect to BCVA change from baseline at week 52, with 90% power at a 2-sided alpha of 0.05, assuming equal means and a common SD of 11 letters. To meet the FDA recommendation for safety assessment, data from at least 300 patients with 1 year of exposure to brolucizumab 6 mg administered every 4 weeks were required. Consequently, the total sample size was increased to 450 patients with a 2:1 ratio (300 in the brolucizumab arm and 150 in the aflibercept arm), resulting in a statistical power of 95% for assessing noninferiority. Finally, a total of 495 patients (330 in the brolucizumab arm and 165 in the aflibercept arm) were planned to be randomized to account for a dropout rate of 9%.
Safety analyses were descriptive only and the number and proportion of patients with ocular and nonocular AEs were summarized according to treatment arm. No imputations were performed for any missing values, with the exception of imputation for partial dates of AEs.
The SAF included all patients who received at least 1 intravitreal injection of the study drug and was used in the analysis of safety variables; patients were analyzed according to the treatment arm from which they received the majority of treatments, up to and including week 48.
Patient Disposition
A summary of patient disposition in the KINGFISHER study13 is provided in Table 28.
Of the 765 patients screened, 346 patients were randomized to the brolucizumab arm and 171 patients were randomized to the aflibercept arm. Study discontinuation rates were 10.1% and 8.8% in the brolucizumab and aflibercept arms, respectively. Discontinuation rates related to lost to follow-up were 2.9% in both treatment arms and discontinuation rates related to AEs were 0.9% and 0.6% in the brolucizumab and aflibercept arms, respectively.
Table 28: Summary of Patient Disposition
Disposition or reason | KINGFISHER | |
|---|---|---|
Brolucizumab 6 mg | Aflibercept 2 mg | |
Screened, N | 765 | |
Randomized, N | 346 | 171 |
Discontinued from study, N (%) | 35 (10.1) | 15 (8.8) |
Reason for discontinuation, N (%) | ||
Patient decision | 11 (3.2) | 4 (2.3) |
Lost to follow-up | 10 (2.9) | 5 (2.9) |
Death | 7 (2.0) | 5 (2.9) |
Physician decision | 4 (1.2) | 0 |
Adverse event | 3 (0.9) | 1 (0.6) |
FAS, N | 346 | 171 |
PPS, N | 277 | 127 |
SAF, N | 346 | 171 |
FAS = full analysis set; PPS = per-protocol set; SAF = safety analysis set.
Source: Clinical Study Report for KINGFISHER.13
Exposure to Study Treatment
A total of 189 patients (54.6%) in the brolucizumab arm and 94 patients (55.0%) in the aflibercept arm received all 13 injections following the regimen of every 4 weeks (safety set). The mean number of injections was 11.5 (SD = 2.74) in the brolucizumab arm and 11.6 (SD = 2.40) in the aflibercept arm.
Harms
Only those harms identified in the review protocol are reported subsequently. A summary of harms is provided in Table 29.
Ocular Adverse Events
A total of 105 patients (30.3%) in the brolucizumab arm and 59 patients (34.5%) in the aflibercept arm reported at least 1 ocular AE. ||| |||| |||||| |||||| ||||| |||||||| || ||| |||||||||||| ||| ||| |||||||| |||||||||| || || |||||||| ||||||| | ||||| || | |||||||| |||||| || ||| |||||||||||| ||| |||||||| || ||||| ||| ||||||| |||||| ||||||| |||||| |||||||| ||||||||||| || | |||||||| ||||||| ||| |||||||| ||||||||||| ||| ||||||| |||||||||| || | ||||||| |||||| ||||. No patients in the aflibercept arm reported any serious ocular AEs. A total of 7 patients (2.0%) and 3 patients (1.8%) withdrew from study treatment in the brolucizumab and aflibercept arms, respectively, due to an ocular AE, with the most common ocular event documented as related to an eye disorder, which was reported in 6 patients (1.7%) in the brolucizumab arm and 3 patients (1.8%) in the aflibercept arm.
Nonocular Adverse Events
A total of 209 patients (60.4%) in the brolucizumab arm and 96 patients (56.1%) in the aflibercept arm reported at least 1 nonocular AE. The most common nonocular event reported in the brolucizumab arm was COVID-19 and hypertension in 19 patients (5.5%) each. A total of 69 patients (19.9%) in the brolucizumab arm and 36 patients (21.1%) in the aflibercept arm reported at least 1 serious nonocular AE. The most common serious nonocular AEs were related to infections and infestations in 29 patients (8.4%) reported in the brolucizumab arm. A total of 10 patients (2.9%) and 5 patients (2.9%) withdrew from study treatment in the brolucizumab and aflibercept arms, respectively, due to a nonocular AE, with the most common nonocular event documented as related to infections and infestations, which were reported in 4 patients (1.2%) in the brolucizumab arm and 2 patients (1.2%) in the aflibercept arm.
Mortality
Deaths were reported in 7 patients (2.0%) in the brolucizumab arm, with the most common cause of death recorded as cardiac disorders in 2 patients (0.6%) and infections and infestations in 3 patients (0.9%). Deaths were reported in 5 patients (2.9%) in the aflibercept arm, with the most common cause of death recorded as cardiac disorders and infections and infestations in 2 patients (1.2%) each.
Notable Harms
Intraocular inflammation was reported in 14 patients (4.0%) in the brolucizumab arm versus 5 patients (2.9%) in the aflibercept arm. Retinal vasculitis was reported in 3 patients (0.9%) in the brolucizumab arm versus 1 patient (0.6%) in the aflibercept arm. Retinal vascular occlusion was reported in 1 patient in each arm (0.3% versus 0.6% in the brolucizumab and aflibercept arms, respectively). Arterial thromboembolic events were reported in 15 patients (4.3%) in the brolucizumab arm versus 9 patients (5.3%) in the aflibercept arm. Transient increased intraocular pressure was reported in 3 patients (0.3%) in the brolucizumab arm versus 2 patients (1.2%) in the aflibercept arm. No reports of endophthalmitis were recorded.
Table 29: Summary of Harms, Safety Set
Harms outcomes | KINGFISHER | |
|---|---|---|
Brolucizumab 6 mg (N = 346) | Aflibercept 2 mg (N = 171) | |
Patients with ≥ 1 ocular AE | ||
n (%) | 105 (30.3) | 59 (34.5) |
Most common ocular events,a n (%) | ||
Vitreous detachment | 10 (2.9) | 7 (4.1) |
Cataract | 9 (2.6) | 6 (3.5) |
Conjunctival hemorrhage | 9 (2.6) | 7 (4.1) |
Punctate keratitis | 9 (2.6) | 2 (1.2) |
Uveitis | 8 (2.3) | 1 (0.6) |
Vitreous floaters | 8 (2.3) | 5 (2.9) |
Dry eye | 7 (2.0) | 4 (2.3) |
Eye pain | 6 (1.7) | 5 (2.9) |
Corneal abrasion | 0 | 5 (2.9) |
Diabetic retinal edema | 0 | 4 (2.3) |
Patients with ≥ 1 ocular SAE | ||
n (%) | 3 (0.9) | 0 |
Vitreous hemorrhage | 2 (0.6) | 0 |
Cataract subcapsular | 1 (0.3) | 0 |
Retinal vasculitis | 1 (0.3) | 0 |
Patients with ≥ 1 ocular WDAE | ||
n (%) | 7 (2.0) | 3 (1.8) |
Most common ocular event, n (%) | ||
Eye disorder | 6 (1.7) | 3 (1.8) |
Uveitis | 3 (0.9) | 0 |
Patients with ≥ 1 nonocular AE | ||
n (%) | 209 (60.4) | 96 (56.1) |
Most common nonocular events,a n (%) | ||
COVID-19 | 19 (5.5) | 12 (7.0) |
Hypertension | 19 (5.5) | 15 (8.8) |
Acute kidney injury | 11 (3.2) | 5 (2.9) |
Urinary tract infection | 11 (3.2) | 2 (1.2) |
Chronic kidney disease | 10 (2.9) | 4 (2.3) |
Anemia | 9 (2.6) | 4 (2.3) |
Cellulitis | 9 (2.6) | 4 (2.3) |
Fall | 9 (2.6) | 4 (2.3) |
Nasopharyngitis | 8 (2.3) | 5 (2.9) |
Blood pressure increased | 7 (2.0) | 5 (2.9) |
Cerebrovascular accident | 7 (2.0) | 6 (3.5) |
Diabetes mellitus | 7 (2.0) | 0 |
Type 2 diabetes mellitus | 5 (1.4) | 4 (2.3) |
Blood creatinine increased | 4 (1.2) | 7 (4.1) |
Edema peripheral | 4 (1.2) | 4 (2.3) |
Pyrexia | 4 (1.2) | 4 (2.3) |
Back pain | 3 (0.9) | 4 (2.3) |
Cough | 3 (0.9) | 9 (5.3) |
Headache | 3 (0.9) | 7 (4.1) |
Nausea | 3 (0.9) | 4 (2.3) |
Influenza | 2 (0.6) | 4 (2.3) |
Patients with ≥ 1 nonocular SAEa | ||
n (%) | 69 (19.9) | 36 (21.1) |
Infections and infestations | 29 (8.4) | 11 (6.4) |
Cardiac disorders | 18 (5.2) | 6 (3.5) |
Renal and urinary disorders | 10 (2.9) | 2 (1.2) |
Nervous system disorders | 9 (2.6) | 8 (4.7) |
Injury, poisoning, and procedural complications | 7 (2.0) | 2 (1.2) |
Vascular disorders | 4 (1.2) | 5 (2.9) |
Patients with ≥ 1 nonocular WDAE | ||
n (%) | 10 (2.9) | 5 (2.9) |
Most common nonocular event, n (%) | ||
Infections and infestations | 4 (1.2) | 2 (1.2) |
Deaths | ||
n (%) | 7 (2.0) | 5 (2.9) |
Most common causes of deaths,b n (%) | ||
Cardiac disorders | 2 (0.6) | 2 (1.2) |
Infections and infestations | 3 (0.9) | 2 (1.2) |
Notable harms, n (%) | ||
Intraocular inflammationc | 14 (4.0) | 5 (2.9) |
Retinal vasculitisc | 3 (0.9) | 1 (0.6) |
Retinal vascular occlusion | 1 (0.3) | 1 (0.6) |
Endophthalmitis | 0 | 0 |
Arterial thromboembolic events | 15 (4.3) | 9 (5.3) |
Intraocular pressure increased, transient | 3 (0.9) | 2 (1.2) |
AE = adverse event; SAE = serious adverse event; WDAE = withdrawal (of treatment) due to adverse event.
Note: AEs with a start date on or after the date of administration of the first study treatment were included. AEs that started after the patient discontinued the study treatment and started an alternative treatment for diabetic macular edema in the study eye were censored.
Deaths on or after the date of study treatment administration were included. Deaths after the patient had discontinued from the study treatment and started an alternative treatment for diabetic macular edema in the study eye were included.
aFrequency ≥ 2% of patients in any treatment arm in the study eye.
bFrequency > 1 patient in any treatment arm.
cA patient who experienced retinal vasculitis may have experienced an intraocular inflammation and, therefore, may have also been included under intraocular inflammation.
Source: Clinical Study Report for KINGFISHER.13
Critical Appraisal
Internal Validity
The KINGFISHER study was a randomized, double-blind, active-controlled study. Randomization, stratified by baseline BCVA, was achieved using interactive response technology, which likely kept the allocation concealed until assignment to a treatment arm. The baseline demographic and disease characteristics were generally balanced between the arms. Since unmasked personnel administered the injections and performed the postinjection safety assessments, the likelihood of unmasking or revealing knowledge of the treatment received and the potential for introducing bias in subjective outcomes, such as reporting of subjective harms, is uncertain. Treatment groups were generally well balanced in terms of the discontinuation rates (10.1% in the brolucizumab arm versus 8.8% in the aflibercept arm); thus, the risk of attrition bias is probably low. Since the sample size calculation considered the FDA recommendation for safety assessment that requires data from at least 300 patients with 1 year of exposure to brolucizumab 6 mg administered every 4 weeks, the trial was powered for the safety assessment.
External Validity
The clinical expert consulted by CADTH for this review advised that the KINGFISHER study would not be generalizable to the patient population and clinical practice in Canada because the frequency of administration, every 4 weeks, is not a relevant treatment interval. Further, aflibercept is rarely administered every 4 weeks in clinical practice.
Discussion
Summary of Available Evidence
This report summarizes the evidence on brolucizumab for DME from 2 pivotal phase III RCTs (KESTREL and KITE), 1 other phase III RCT (KINGFISHER), and 1 ITC.
Two studies, KESTREL (N = 566) and KITE (N = 360), met the inclusion criteria for the systematic review section. They were similarly designed phase III RCTs that evaluated the noninferiority of brolucizumab (6 mg every 8 weeks or every 12 weeks during maintenance) to aflibercept (2 mg every 8 weeks during maintenance) through the change from baseline in BCVA (ETDRS letters) at week 52 in the full analysis set population as a primary end point. The mean age of enrolled patients at baseline in these studies ranged from 62.2 to 64.4 years, and the majority were male (more than 58%) and white (more than 73%). The median time since the diagnosis of DME was 9.4 to 12.5 months in the KESTREL trial and 9.9 to 10.4 months in the KITE trial; the mean baseline CSFT in these 2 studies ranged from 453 μm to 484 μm; and the mean baseline BCVA scores ranged from 63.7 to 66.6 letters in both studies, although, in KITE, there was an imbalance in the number of ETDRS letters: 66 (SD = 10.8) in the brolucizumab group and 63.7 (SD = 11.7) in the aflibercept group. All enrolled patients were naive to anti-VEGF therapies. Outcomes included changes in BCVA, anatomical outcomes, DR severity, vision-related function, injection frequency, and safety, with a primary analysis at week 52 and data up to 100 weeks.
The KINGFISHER trial (N = 517) was a phase III RCT evaluating the efficacy and safety of brolucizumab 6 mg every 4 weeks versus aflibercept 2 mg every 4 weeks in the treatment of adult patients with visual impairment due to DME. The treatment intervals used for both drugs were shorter than the recommended intervals (beyond the loading phase) in the respective Health Canada–approved monographs. The primary objective was to demonstrate that brolucizumab was noninferior to aflibercept with respect to change in visual acuity from baseline up to week 52. In this review, CADTH focused on the safety results of brolucizumab when a frequent dosing regimen (every 4 weeks) was adopted in the KINGFISHER trial.
One sponsor-submitted ITC was summarized and critically appraised. The sponsor performed an NMA to estimate the effectiveness and safety of brolucizumab in patients with DME compared with other anti-VEGFs (aflibercept, bevacizumab, ranibizumab), dexamethasone intravitreal implants, laser therapy, and placebo or sham. The outcomes of the NMA included change from baseline in BCVA, proportion of patients gaining or losing 10 or more or 15 or more ETDRS letters, retinal thickness, injection frequency, treatment discontinuation, and ocular and nonocular AEs.
Interpretation of Results
Efficacy
The results of the KESTREL and KITE trials support the noninferiority, but not superiority, of brolucizumab 6 mg (5 times the loading dose of every 6 weeks followed by maintenance injections every 8 weeks or every 12 weeks) versus aflibercept 2 mg (5 monthly loading doses followed by maintenance injections every 8 weeks) for the change in BCVA. The noninferiority of brolucizumab 6 mg to aflibercept 2 mg was demonstrated for the primary end point (change from baseline in BCVA at week 52 for the study eye) using a noninferiority margin of 4 letters. In addition, several sensitivity analyses by the sponsor as well as a supportive analysis using the per-protocol population were consistent with the findings of the primary analyses. Results were consistent for change from baseline to week 100. Results of prespecified subgroup analyses (i.e., baseline BCVA categories and CSFT categories) were generally consistent with the overall population at week 52; however, the study was not powered to detect subgroup differences. There was superiority testing in the KITE trial (but not the KESTREL trial) for change in BCVA from baseline averaged from week 40 to week 52 and the between-group difference did not reach significance. The results of the visual acuity-related efficacy outcomes, other than the change from baseline to week 52 and change from baseline averaged over week 40 to week 52 (e.g., patients whose ETDRS scores showed a gain or loss of 15 letters or greater and changes from baseline to week 100), need to be interpreted with caution, since they were not included in the statistical hierarchy.
The change in retinal thickness (measured as CSFT) from baseline and patients with a CSFT of less than 280 µm were secondary outcomes in the studies. According to the expert, the reduction in retinal thickness correlates well with the improvement in visual acuity. Reduction from baseline in retinal thickness averaged over week 40 to week 52 was greater with brolucizumab versus aflibercept (mean difference of 29 µm) in the KITE trial, with no evidence for a difference in the KESTREL trial. Therefore, the finding of superiority of brolucizumab over aflibercept for this outcome was inconsistent between the studies.
The change from baseline in the NEI VFQ-25 composite score, which measures vision-related functions and some aspects of HRQoL, was a secondary outcome in the KESTREL and KITE trials, but not included in the statistical hierarchy. Many subscales of NEI VFQ-25 reflected vision-related functions that were noted in the patient group input to be highly relevant to the functioning of patients with DME (i.e., general vision, mental health, social functioning, dependency, and driving). In the KESTREL and KITE studies, improvements in the composite score were observed in all treatment arms (improvement in score of 6.5 to 9.1 from baseline to week 52 per arm). Due to the lack of statistical testing for this outcome and the risk of attrition bias due to missing data (more than 20% of data were missing for some treatment groups), definitive conclusions on the change from baseline in vision-related functions cannot be made.
ETDRS DRSS was used to measure disease activity in patients with DME. Regression of DRSS is another clinically meaningful outcome in this study population; however, this outcome was not included in the statistical hierarchy. For most of the results for this outcome at week 52 and week 100, there was no evidence to suggest a difference between brolucizumab and aflibercept. Given the uncertainty in the analysis due to the lack of statistical testing and imprecision in the between-group differences, no definite conclusions on the change in disease severity can be drawn.
The pivotal trials measured the proportions of patients with presence of IRF or SRF as secondary outcomes. IRF and SRF are indicators of active disease. According to the clinical expert consulted by CADTH, IRF is a more relevant outcome than SRF in patients with DME, noting that SRF is uncommon in DME and is a marker for more severe DME. In both studies at week 52 and week 100, a numerically lower proportion of patients treated with brolucizumab had IRF and/or SRF present compared with the aflibercept group; however, this outcome was not tested statistically due to a previous failure of the hierarchical testing procedure.
The frequency of injection was noted to be an important outcome of interest by both patients and the clinical expert, as it has implications on the frequency of AEs, HRQoL, the burden of treatment, and patient adherence and, subsequently, has an impact on the treatment effect. The proportion of patients treated with brolucizumab maintained on a schedule of every 12 weeks was reported descriptively in the studies. Among the patients who received treatment with brolucizumab, approximately half maintained a treatment interval of 12 weeks at week 52 in both studies, and 44% and 37% of patients maintained the regimen of every 12 weeks at week 100 in the KESTREL and KITE trials, respectively. Among patients who completed treatment with brolucizumab at week 100, the majority of them were on the every 8 weeks schedule (67.1% in the KESTREL trial; 52.5% in the KITE trial). Differences in the number and frequency of injections between study arms must be considered in light of the study design, as patients in the brolucizumab group could have their treatment interval changed based on their DAAs (although once patients on brolucizumab dropped back to every 8 weeks because of disease activity, they could not extend the treatment interval for the rest of the study); however, changes in treatment interval and dosage were not allowed for the treatment with aflibercept and these patients remained on a fixed interval of every 8 weeks during the maintenance phase. Treatment with aflibercept in the trials was contrary to clinical practice, as the product monograph of aflibercept states that the treatment interval can be extended after the first year of treatment.31 Also, once patients on brolucizumab dropped back to every 8 weeks because of disease activity, they could not extend the treatment interval for the rest of the study, which also may not reflect clinical practice. Further, the clinical importance of the between-group difference in the number of injections is difficult to determine. It is unknown whether the number of injections that were avoided in 1 or 2 years would have a meaningful impact for patients on either HRQoL or on reducing disease burden. However, the expert noted that differences in injection frequency were expected to be small in the first year, given the standard loading doses, and greater differences might not be seen until later years of use.
The sponsor-submitted NMA provided indirect comparative evidence for brolucizumab versus other anti-VEGF drugs. After including 43 trials in an NMA, none of the treatments was favoured, in terms of improving visual acuity and lessening disease severity, when brolucizumab was compared with other active treatments, such as aflibercept, ranibizumab, and bevacizumab, for the treatment of DME; however, for most comparisons, the effect estimates were too imprecise (i.e., the 95% CrIs were wide) to draw a conclusion about comparative efficacy or harms. Treatment with brolucizumab was associated with a greater reduction in retinal thickness compared with bevacizumab and ranibizumab. In addition, patients treated with brolucizumab are likely to receive fewer injections compared with other anti-VEGFs, though these results were derived from data pooling without conducting an NMA and, in particular, should be interpreted with caution. The key limitations for the ITC is significant heterogeneity (in study design and patient characteristics) across the included RCTs and imprecision around the effect estimates (i.e., wide 95% CrIs), which precluded drawing a conclusion for most outcome comparisons. This limits the conclusions that can be drawn from this ITC.
Harms
The safety profile for brolucizumab 6 mg was generally consistent with that of aflibercept 2 mg in the KESTREL and KITE trials. The proportion of patients reporting at least 1 ocular AE in the study eye up to week 100 was comparable across treatment arms in both studies (48.7% and 50.3% in the brolucizumab 6 mg and aflibercept 2 mg group in the KESTREL trial, respectively; 40.8% and 40.9% in the brolucizumab 6 mg and aflibercept 2 mg group in the KITE trial, respectively). Overall, the most frequently reported ocular AEs related to brolucizumab in both studies were cataract, conjunctival hemorrhage, vitreous detachment, vitreous floaters, increased intraocular pressure, diabetic retinal edema, dry eye, eye pain, posterior capsule opacification, conjunctivitis, and reduced visual acuity. Cataract was the most commonly reported ocular AE, which was anticipated because of the age of the study populations. Ocular SAEs were reported with low frequency and the incidence of ocular SAEs was similar between the 2 studies (3.7% and 2.7% in the brolucizumab and aflibercept groups in the KESTREL trial, respectively, and 2.8% and 1.7% of patients in the brolucizumab and aflibercept groups in the KITE trial, respectively). In both studies, the incidence of withdrawals due to AEs was also similar between the 2 treatment groups (1.6% and 1.1% in the brolucizumab and aflibercept groups in the KESTREL trial, respectively, and 2.8% and 2.2% of patients in the brolucizumab and aflibercept groups in the KITE trial, respectively). There were 15 deaths in the KESTREL study, 8 (4.2%) in the brolucizumab group and 7 (3.7%) in the aflibercept group. In the KITE study, 13 (7.3%) deaths occurred in the brolucizumab group and 9 (5.0%) in the aflibercept group. According to the sponsor, none of the deaths were considered to be related to study treatment.
In the KINGFISHER study, with dosing every 4 weeks, a total of 105 patients (30.3%) in the brolucizumab arm and 59 patients (34.5%) in the aflibercept arm reported at least 1 ocular AE. A total of 3 patients (0.9%) in the brolucizumab arm reported at least 1 serious ocular AE. No patients in the aflibercept arm reported any serious ocular AE. A total of 7 patients (2.0%) and 3 patients (1.8%) withdrew from study treatment in the brolucizumab and aflibercept arms, respectively, due to an ocular AE. Intraocular inflammation was reported in 14 patients (4.0%) in the brolucizumab arm versus 5 patients (2.9%) in the aflibercept arm. Retinal vasculitis was reported in 3 patients (0.9%) in the brolucizumab arm versus 1 patient (0.6%) in the aflibercept arm. The results suggested that, when brolucizumab was administered using a more frequent dosing regimen, the safety outcomes were similar to those for the recommended treatment intervals, and no unusual safety signal was observed from this study. The clinical expert found it reassuring that SAEs of retinal vasculitis were not reported more frequently with the dosing of brolucizumab every 4 weeks.
The risk of ocular AEs, nonocular AEs, and study discontinuation were evaluated in the NMA. The results suggested that no treatment was favoured for reduction in the risk of ocular or nonocular AEs; however, all effect estimates were too imprecise (i.e., the 95% CrIs were wide) to draw a conclusion about the relative harms of the various treatments. Patients treated with brolucizumab were associated with a higher risk of all-cause study discontinuation compared with ranibizumab. Limitations to the NMA preclude making firm conclusions about relative risks of harm for brolucizumab compared with other anti-VEGFs.
Conclusions
Brolucizumab 6 mg every 8 weeks or every 12 weeks during maintenance therapy was found to be noninferior to aflibercept 2 mg every 8 weeks for the mean change in BCVA from baseline after 1 year of treatment in anti-VEGF-naive adult patients with DME, based on evidence from 2 double-blind phase III RCTs (KESTREL and KITE). Results for mean change in BCVA after 100 weeks of treatment were generally consistent with the 1-year results. The results of other BCVA outcomes, retinal thickness, and presence of IRF and/or SRF, did not contradict the primary end point findings, but their interpretation is limited by lack of a noninferiority margin and lack of adjustment for multiple testing. Reduction from baseline in retinal thickness after 1 year of treatment was greater with brolucizumab versus aflibercept in the KITE trial; in the KESTREL trial, the effect estimate was too imprecise (i.e., wide 95% CIs) to draw a conclusion. The results for presence of IRF and/or SRF suggested that brolucizumab may have been favoured over aflibercept, but a firm conclusion cannot be drawn due to the lack of adjustment for multiplicity. After 52 weeks of treatment, approximately half of the brolucizumab group in each trial maintained the dosing schedule of every 12 weeks, although conclusions cannot be drawn due to the lack of adjustment for multiplicity and issues regarding the generalizability of the treatment regimens.
The safety profile for brolucizumab was generally comparable with that of aflibercept in the KESTREL and KITE trials. Results from a supportive study, KINGFISHER, which used a more frequent dosing regimen (brolucizumab 6 mg every 4 weeks) showed a safety profile for brolucizumab every 8 weeks or every 12 weeks that was similar to that observed in the KESTREL and KITE trials.
There is no direct comparative evidence for brolucizumab compared with anti-VEGFs other than aflibercept. Evidence from 1 NMA suggested that for change from baseline in BCVA at 12 months, none of the treatments were favoured when brolucizumab 6 mg was compared with aflibercept, ranibizumab, and bevacizumab; however, imprecision around the effect estimates (i.e., wide 95% CrIs) precluded drawing a conclusion for most comparison outcomes. In addition, the NMA results suggested that treatment with brolucizumab may be favourable compared with ranibizumab and bevacizumab for reducing retinal thickness. However, the presence of heterogeneity in study design and patient characteristics limits the conclusions that can be drawn from the NMA. The results of a naive ITC suggested that treatment with brolucizumab may be related to fewer injections compared with other anti-VEGF drugs, but a conclusion cannot be drawn.
References
1.Cade WT. Diabetes-related microvascular and macrovascular diseases in the physical therapy setting. Physical therapy. 2008;88(11):1322-1335. PubMed
2.Mohamed Q, Gillies MC, Wong TY. Management of diabetic retinopathy: a systematic review. Jama. 2007;298(8):902-916. PubMed
3.Ciulla TA, Amador AG, Zinman B. Diabetic retinopathy and diabetic macular edema: pathophysiology, screening, and novel therapies. Diabetes Care. 2003;26(9):2653-2664. PubMed
4.Williams R, Airey M, Baxter H, Forrester J, Kennedy-Martin T, Girach A. Epidemiology of diabetic retinopathy and macular oedema: a systematic review. Eye (Lond). 2004;18(10):963-983. PubMed
5.Davidov E, Breitscheidel L, Clouth J, Reips M, Happich M. Diabetic retinopathy and health-related quality of life. Graefes Arch Clin Exp Ophthalmol. 2009;247(2):267-272. PubMed
6.Gonder JR, Walker VM, Barbeau M, et al. Costs and Quality of Life in Diabetic Macular Edema: Canadian Burden of Diabetic Macular Edema Observational Study (C-REALITY). J Ophthalmol. 2014;2014:939315. PubMed
7.Happich M, Reitberger U, Breitscheidel L, Ulbig M, Watkins J. The economic burden of diabetic retinopathy in Germany in 2002. Graefes Arch Clin Exp Ophthalmol. 2008;246(1):151-159. PubMed
8.Advocating for improved treatment and outcomes for diabetic macular edema in Canada: A report based on the Canadian National Multi-Stakeholder Expert Summit for Diabetic Macular Edema convened in Toronto, January 2015. Cambridge (MA): The Angiogenesis Foundation; 2015: https://angio.org/wp-content/uploads/2016/01/Canada-DME-WP.pdf. Accessed 2022 May 12.
9.Foundation TA. Advocating for Improved Treatment and Outcomes for Diabetic Macular Edema in Canada. 2015: https://angio.org/wp-content/uploads/2016/01/Canada-DME-WP.pdf.
10.Anonymous. Pharmacoeconomic Report: Brolucizumab (Beovu): (Novartis Pharmaceuticals Canada Inc.): Indication: Treatment of neovascular (wet) age-related macular degeneration (AMD). Canadian Agency for Drugs and Technologies in Health. 2020;07:07.
11.Clinical Study Report: CRTH258B2301. A two-year, three-arm, randomized, double masked, multicenter, phase III study assessing the efficacy and safety of brolucizumab versus aflibercept in adult patients with visual impairment due to diabetic macular edema (KESTREL) [internal sponsor's report]. Novartis; 2019.
12.Clinical Study Report: CRTH258B2302. A two-year, two-arm, randomized, double masked, multicenter, phase III study assessing the efficacy and safety of brolucizumab versus aflibercept in adult patients with visual impairment due to diabetic macular edema (KITE) [internal sponsor's report]. City (PROV): Novartis; 2020.
13.Clinical Study Report: CRTH258B2305. A 12-Month, 2-Arm, Randomized, Double-Masked, Multicenter Phase III Study Assessing the Efficacy and Safety of Brolucizumab every 4 weeks versus Aflibercept every 4 weeks in Adult Patients with Visual Impairment due to Diabetic Macular Edema (KINGFISHER). [internal sponsor's report] Novartis; 2021.
14.Beovu® brolucizumab injectionSingle-use pre-filled syringesSingle-use vials6 mg / 0.05 mL solution for intravitreal injection [product monograph]. Dorval (QC): Novartis Pharmaceuticals Canada Inc.; 2022 Apr 12.
15.Eylea (aflibercept injection): single use pre-filled syringes and single use vials for the treatment of a single eye. 2 mg / 0.05 mL solution for intravitreal injection [product monograph]. https://pdf.hres.ca/dpd_pm/00064117.PDF. Accessed September 15, 2022.
16.Hooper P, Boucher MC, Cruess A, et al. Excerpt from the Canadian Ophthalmological Society evidence-based clinical practice guidelines for the management of diabetic retinopathy. Can J Ophthalmol. 2017;52 Suppl 1:S45-s74. PubMed
17.Tennant MT. Ocular treatment of diabetic macular edema in Canada: where are we going? Can J Ophthalmol. 2011;46(3):221-224. PubMed
18.Klein R, Klein BE, Moss SE, Davis MD, DeMets DL. The Wisconsin epidemiologic study of diabetic retinopathy. IV. Diabetic macular edema. Ophthalmology. 1984;91(12):1464-1474. PubMed
19.Petrella RJ, Blouin J, Davies B, Barbeau M. Prevalence, Demographics, and Treatment Characteristics of Visual Impairment due to Diabetic Macular Edema in a Representative Canadian Cohort. J Ophthalmol. 2012;2012:159167. PubMed
20.Kaur H, Maberley D, Chang A, Hay D. The current status of diabetes care, diabetic retinopathy screening and eye-care in British Columbia's First Nations Communities. International journal of circumpolar health. 2004;63(3):277-285. PubMed
21.Maberley D, Walker H, Koushik A, Cruess A. Screening for diabetic retinopathy in James Bay, Ontario: a cost-effectiveness analysis. CMAJ: Canadian Medical Association journal = journal de l'Association medicale canadienne. 2003;168(2):160-164.
22.Vu HT, Keeffe JE, McCarty CA, Taylor HR. Impact of unilateral and bilateral vision loss on quality of life. Br J Ophthalmol. 2005;89(3):360-363. PubMed
23.Cusick M, Meleth AD, Agrón E, et al. Associations of mortality and diabetes complications in patients with type 1 and type 2 diabetes: early treatment diabetic retinopathy study report no. 27. Diabetes Care. 2005;28(3):617-625. PubMed
24.Kaiser PK. Prospective evaluation of visual acuity assessment: a comparison of snellen versus ETDRS charts in clinical practice (An AOS Thesis). Trans Am Ophthalmol Soc. 2009;107:311-324.
25.Sander B, Thornit DN, Colmorn L, et al. Progression of diabetic macular edema: correlation with blood retinal barrier permeability, retinal thickness, and retinal vessel diameter. Invest Ophthalmol Vis Sci. 2007;48(9):3983-3987. PubMed
26.Photocoagulation for diabetic macular edema. Early Treatment Diabetic Retinopathy Study report number 1. Early Treatment Diabetic Retinopathy Study research group. Arch Ophthalmol. 1985;103(12):1796-1806. PubMed
27.Wells JA, Glassman AR, Ayala AR, et al. Aflibercept, Bevacizumab, or Ranibizumab for Diabetic Macular Edema: Two-Year Results from a Comparative Effectiveness Randomized Clinical Trial. Ophthalmology. 2016;123(6):1351-1359. PubMed
28.Korobelnik JF, Do DV, Schmidt-Erfurth U, et al. Intravitreal aflibercept for diabetic macular edema. Ophthalmology. 2014;121(11):2247-2254. PubMed
29.Mitchell P, Bandello F, Schmidt-Erfurth U, et al. The RESTORE study: ranibizumab monotherapy or combined with laser versus laser monotherapy for diabetic macular edema. Ophthalmology. 2011;118(4):615-625. PubMed
30.Lucentis (ranibizumab injection): single use vials. Single use pre-filled syringes. 10 mg/mL solution for injection [product monograph]. https://pdf.hres.ca/dpd_pm/00064117.PDF. Accessed September 15, 2022.
31.Eylea (aflibercept injection): single use pre-filled syringes and single use vials for the treatment of a single eye. 2 mg / 0.05 mL solution for intravitreal injection [product monograph]. Mississauga (ON): Bayer Inc; 2022 Feb 10: https://pdf.hres.ca/dpd_pm/00064757.PDF. Accessed 2022 Apr 26.
32.Avastin (bevacizumab for injection): 100 mg and 400 mg vials (25 mg/mL solution for injection) [product monograph]. https://pdf.hres.ca/dpd_pm/00059621.PDF. Accessed September 15, 2022.
33.Regillo CD, Callanan DG, Do DV, et al. Use of Corticosteroids in the Treatment of Patients With Diabetic Macular Edema Who Have a Suboptimal Response to Anti-VEGF: Recommendations of an Expert Panel. Ophthalmic Surg Lasers Imaging Retina. 2017;48(4):291-301. PubMed
34.Gonzalez VH, Campbell J, Holekamp NM, et al. Early and Long-Term Responses to Anti-Vascular Endothelial Growth Factor Therapy in Diabetic Macular Edema: Analysis of Protocol I Data. Am J Ophthalmol. 2016;172:72-79. PubMed
35.McGowan J, Sampson M, Salzwedel DM, Cogo E, Foerster V, Lefebvre C. PRESS Peer Review of Electronic Search Strategies: 2015 guideline statement. Journal of clinical epidemiology. 2016;75:40-46. PubMed
36.Grey Matters: a practical tool for searching health-related grey literature. 2022; https://www.cadth.ca/grey-matters-practical-tool-searching-health-related-grey-literature.
37.Brown DM, Emanuelli A, Bandello F, et al. KESTREL and KITE: 52-Week Results From Two Phase III Pivotal Trials of Brolucizumab for Diabetic Macular Edema. Am J Ophthalmol. 2022;238:157-172. PubMed
38.Drug Reimbursement Review sponsor submission: Beovu®(brolucizumab, single-use pre-filled syringe, 6 mg / 0.05 mL solution for intravitreal injection [internal sponsor's package]. Dorval (QC): Novartis Pharmaceuticals Canada Inc; 2022 Jun 30.
39.Kniestedt C, Stamper RL. Visual acuity and its measurement. Ophthalmol Clin North Am. 2003;16(2):155-170, v. PubMed
40.Beck RW, Moke PS, Turpin AH, et al. A computerized method of visual acuity testing: adaptation of the early treatment of diabetic retinopathy study testing protocol. Am J Ophthalmol. 2003;135(2):194-205. PubMed
41.Mangione CM, Lee PP, Gutierrez PR, Spritzer K, Berry S, Hays RD. Development of the 25-item National Eye Institute Visual Function Questionnaire. Arch Ophthalmol. 2001;119(7):1050-1058. PubMed
42.Lloyd AJ, Loftus J, Turner M, Lai G, Pleil A. Psychometric validation of the Visual Function Questionnaire-25 in patients with diabetic macular edema. Health Qual Life Outcomes. 2013;11:10. PubMed
43.What is Blindness? https://www.cnib.ca/en/sight-loss-info/blindness/what-blindness?region=on_east.
44.Fundus photographic risk factors for progression of diabetic retinopathy. ETDRS report number 12. Early Treatment Diabetic Retinopathy Study Research Group. Ophthalmology. 1991;98(5 Suppl):823-833. PubMed
45.Bretz. A graphical approach to sequentially rejective multiple test procedures. 2008; https://onlinelibrary.wiley.com/doi/10.1002/sim.3495.
46.Little RJ, D'Agostino R, Cohen ML, et al. The prevention and treatment of missing data in clinical trials. The New England journal of medicine. 2012;367(14):1355-1360. PubMed
47.Brolucizumab for Diabetic Macular Edema: Network Meta-Analysis (Year 2 Data) [internal sponsor's report]. In: Drug Reimbursement Review sponsor submission: Beovu®(brolucizumab, single-use pre-filled syringe, 6 mg / 0.05 mL solution for intravitreal injection [internal sponsor's package]. Dorval (QC): Novartis Pharmaceuticals Canada Inc; 2022 Jun 30.
48.NICE. Specification for manufacturer/sponsor submission of evidence. 2012: https://www.nice.org.uk/media/default/about/what-we-do/nice-guidance/nice-technology-appraisals/specification-for-manufacturer-sponsor-submission-of-evidence-june-2012.doc.
49.Dias. Network meta-analysis for decision making (Chapter 7 Checking for inconsistency). 2018: https://onlinelibrary.wiley.com/doi/10.1002/9781118951651.ch7.
50.NICE. Single technology appraisal and highly specialised technologies evaluation: User guide for company evidence submission template. https://www.nice.org.uk/process/pmg24.
51.Sánchez-González MC, García-Oliver R, Sánchez-González JM, Bautista-Llamas MJ, Jiménez-Rejano JJ, De-Hita-Cantalejo C. Minimum Detectable Change of Visual Acuity Measurements Using ETDRS Charts (Early Treatment Diabetic Retinopathy Study). Int J Environ Res Public Health. 2021;18(15). PubMed
52.Early Treatment Diabetic Retinopathy Study Research Group. Grading Diabetic Retinopathy from Stereoscopic Color Fundus Photographs - An Extension of the Modified Airlie House Classification: ETDRS Report Number 10. Ophthalmology. 2020;127(4S):S99-S119. PubMed
53.Mangione CM, Berry S, Spritzer K, et al. Identifying the content area for the 51-item National Eye Institute Visual Function Questionnaire: results from focus groups with visually impaired persons. Arch Ophthalmol. 1998;116(2):227-233. PubMed
54.Goatman KA. A reference standard for the measurement of macular oedema. Br J Ophthalmol. 2006;90(9):1197-1202. PubMed
55.Diabetic Retinopathy Clinical Research Network Writing C, Bressler SB, Edwards AR, et al. Reproducibility of spectral-domain optical coherence tomography retinal thickness measurements and conversion to equivalent time-domain metrics in diabetic macular edema. JAMA Ophthalmol. 2014;132(9):1113-1122. PubMed
56.Virgili G, Menchini F, Casazza G, et al. Optical coherence tomography (OCT) for detection of macular oedema in patients with diabetic retinopathy. Cochrane Database Syst Rev. 2015(1).
57.GOEBEL W, FRANKE R. RETINAL THICKNESS IN DIABETIC RETINOPATHY: Comparison of Optical Coherence Tomography, the Retinal Thickness Analyzer, and Fundus Photography. RETINA. 2006;26(1):49-57. PubMed
58.Sadda SR, Tan O, Walsh AC, Schuman JS, Varma R, Huang D. Automated Detection of Clinically Significant Macular Edema by Grid Scanning Optical Coherence Tomography. Ophthalmology. 2006;113(7):1187.e1181-1187.e1112. PubMed
59.Strøm C, Sander B, Larsen N, Larsen M, Lund-Andersen H. Diabetic Macular Edema Assessed with Optical Coherence Tomography and Stereo Fundus Photography. Invest Ophthalmol Vis Sci. 2002;43(1):241-245. PubMed
60.Tangelder GJ, Van der Heijde RG, Polak BC, Ringens PJ. Precision and reliability of retinal thickness measurements in foveal and extrafoveal areas of healthy and diabetic eyes. Invest Ophthalmol Vis Sci. 2008;49(6):2627-2634. PubMed
61.Lammer J, Scholda C, Prünte C, Benesch T, Schmidt-Erfurth U, Bolz M. Retinal thickness and volume measurements in diabetic macular edema: a comparison of four optical coherence tomography systems. Retina. 2011;31(1):48-55. PubMed
62.Blackhurst DW, Maguire MG. Reproducibility of refraction and visual acuity measurement under a standard protocol. The Macular Photocoagulation Study Group. Retina. 1989;9(3):163-169. PubMed
63.Beck RW, Maguire MG, Bressler NM, Glassman AR, Lindblad AS, Ferris FL. Visual Acuity as an Outcome Measure in Clinical Trials of Retinal Diseases. Ophthalmology. 2007;114(10):1804-1809. PubMed
64.Vanden Bosch ME, Wall M. Visual acuity scored by the letter-by-letter or probit methods has lower retest variability than the line assignment method. Eye (Lond). 1997;11 (Pt 3):411-417. PubMed
65.Arditi A, Cagenello R. On the statistical reliability of letter-chart visual acuity measurements. Invest Ophthalmol Vis Sci. 1993;34(1):120-129. PubMed
66.Elliott DB, Sheridan M. The use of accurate visual acuity measurements in clinical anti-cataract formulation trials. Ophthalmic Physiol Opt. 1988;8(4):397-401. PubMed
67.Bailey IL, Bullimore MA, Raasch TW, Taylor HR. Clinical grading and the effects of scaling. Invest Ophthalmol Vis Sci. 1991;32(2):422-432. PubMed
68.Reeves BC, Wood JM, Hill AR. Vistech VCTS 6500 charts--within- and between-session reliability. Optom Vis Sci. 1991;68(9):728-737. PubMed
69.Lovie-Kitchin JE. Validity and reliability of visual acuity measurements. Ophthalmic Physiol Opt. 1988;8(4):363-370. PubMed
70.Rosser DA, Laidlaw DA, Murdoch IE. The development of a “reduced logMAR” visual acuity chart for use in routine clinical practice. Br J Ophthalmol. 2001;85(4):432-436. PubMed
71.Rosser DA, Cousens SN, Murdoch IE, Fitzke FW, Laidlaw DAH. How Sensitive to Clinical Change are ETDRS logMAR Visual Acuity Measurements? Invest Ophthalmol Vis Sci. 2003;44(8):3278-3281. PubMed
72.Mangione CM, Lee PP, Pitts J, Gutierrez P, Berry S, Hays RD. Psychometric properties of the National Eye Institute Visual Function Questionnaire (NEI-VFQ). NEI-VFQ Field Test Investigators. Arch Ophthalmol. 1998;116(11):1496-1504. PubMed
73.Matt G, Sacu S, Buehl W, et al. Comparison of retinal thickness values and segmentation performance of different OCT devices in acute branch retinal vein occlusion. Eye (Lond). 2011;25(4):511-518. PubMed
Appendix 1: Literature Search Strategy
Note that this appendix has not been copy-edited.
Clinical Literature Search
Overview
Interface: Ovid
Databases:
MEDLINE All (1946 to present)
Embase (1974 to present)
Note: Subject headings and search fields have been customized for each database. Duplicates between databases were removed in Ovid.
Date of search: July 28, 2022
Alerts: Bi-weekly search updates until project completion
Search filters applied: None
Limits:
Language limit: English- and French-language
Conference abstracts: Excluded
Syntax | Description |
|---|---|
/ | At the end of a phrase, searches the phrase as a subject heading |
MeSH | Medical Subject Heading |
.fs | Floating subheading |
exp | Explode a subject heading |
* | Before a word, indicates that the marked subject heading is a primary topic; or, after a word, a truncation symbol (wildcard) to retrieve plurals or varying endings |
# | Truncation symbol for one character |
? | Truncation symbol for one or no characters only |
adj# | Requires terms to be adjacent to each other within # number of words (in any order) |
.ti | Title |
.ot | Original title |
.ab | Abstract |
.hw | Heading word; usually includes subject headings and controlled vocabulary |
.kf | Keyword heading word |
.dq | Candidate term word (Embase) |
.pt | Publication type |
.mp | Mapped term |
.rn | Registry number |
.nm | Name of substance word (MEDLINE) |
.yr | Publication year |
.jw | Journal title word (MEDLINE) |
.jx | Journal title word (Embase) |
freq = # | Requires terms to occur # number of times in the specified fields |
medall | Ovid database code: MEDLINE All, 1946 to present, updated daily |
oemezd | Ovid database code; Embase, 1974 to present, updated daily |
cctr | Ovid database code; Cochrane Central Register of Controlled Trials |
Multidatabase Strategy
# Searches
(brolucizumab* or beovu* or vsiqq* or dlx 1008 or dlx1008 or esba 1008 or esba1008 or rth 258 or rth258 or XSZ53G39H5).ti,ab,kf,ot,hw,rn,nm.
1 use medall
*Brolucizumab/
(brolucizumab* or beovu* or vsiqq* or dlx 1008 or dlx1008 or esba 1008 or esba1008 or rth 258 or rth258).ti,ab,kf,dq.
3 or 4
5 not (conference abstract or conference review).pt.
6 use oemezd
2 or 7
remove duplicates from 8
Clinical Trials Registries
ClinicalTrials.gov
Produced by the US National Library of Medicine. Targeted search used to capture registered clinical trials.
Search -- brolucizumab OR beovu OR vsiqq OR “dlx 1008” OR dlx1008 OR “esba 1008” OR esba1008 OR “rth 258” OR rth258
WHO ICTRP
International Clinical Trials Registry Platform, produced by WHO. Targeted search used to capture registered clinical trials.
Search -- brolucizumab OR beovu OR vsiqq OR “dlx 1008” OR dlx1008 OR “esba 1008” OR esba1008 OR “rth 258” OR rth258
Health Canada’s Clinical Trials Database
Produced by Health Canada. Targeted search used to capture registered clinical trials.
Search -- brolucizumab OR beovu OR vsiqq OR “dlx 1008” OR dlx1008 OR “esba 1008” OR esba1008 OR “rth 258” OR rth258
EU Clinical Trials Register
European Union Clinical Trials Register, produced by the European Union. Targeted search used to capture registered clinical trials.
Search -- brolucizumab OR beovu OR vsiqq OR “dlx 1008” OR dlx1008 OR “esba 1008” OR esba1008 OR “rth 258” OR rth258
Grey Literature
Search dates: July 21, 2022, to July 25, 2022
Keywords: Search -- brolucizumab OR beovu OR vsiqq OR “dlx 1008” OR dlx1008 OR “esba 1008” OR esba1008 OR “rth 258” OR rth258
Limits: None
Updated: Search updated before the completion of stakeholder feedback period
Relevant websites from the following sections of the CADTH grey literature checklist Grey Matters: A Practical Tool for Searching Health-Related Grey Literature were searched:
Health Technology Assessment Agencies
Health Economics
Clinical Practice Guidelines
Drug and Device Regulatory Approvals
Advisories and Warnings
Drug Class Reviews
Clinical Trials Registries
Databases (free)
Health Statistics
Internet Search
Open Access Journals
Appendix 2: Detailed Outcome Data
Note that this appendix has not been copy-edited.
Table 31: Trial Characteristics of Studies Included in NMA
Study | Study phase, blinding, # eyes involved | Treatment regimens | Length of FU | Duration of diabetes, years, mean ± SD, (range) | Time since diagnosis of DME, years, mean ± SD (range) | Hemoglobin A1C, mean ± SD (range) |
|---|---|---|---|---|---|---|
Abouhussein 2020 | NR Open-label 40 | AFLI AFLI + laser | 52 wks | NR | NR | 8.2 ± 1.2 (7.7 to 9.8) 8.7 ± 1.1 (7.9 to 9.6) |
ADDENDUM | NR Open-label 43 | AFLI + navigated LP AFLI + conventional LP | 52 wks | 12.9 10.9 | NR | 59.3 64.1 |
ALBA | III NR 57 | LP BEVA + laser | 52 wks | NR | NR | 7.9 ± 1.0 7.8 ± 1.3 |
BEVORDEX | PII Single-blind 88 | BEVA DEXA implant | 52 wks | 16.7 ± 10.7 16.7 ± 10.3 | NR | 7.8 ± 2.1 7.7 ± 2.5 |
BOLT | NR Single-blind 80 | BEVA LP | 52 wks | 13.5 ± 8.3 14.75 ± 7.9 | 3 2 | 7.6 ± 1.4 (5.3 to 10.9) 7.5 ± 1.2 (5.4 to 10.6) |
Callanan 2013 | PII DB 253 | DEX implant 0.7 mg + LP LP | 52 wks | NR | 1.87 ± 2.48 2.35 ± 2.81 | NR |
Callanan 2017 | II Open-label 363 | DEX implant 0.7 mg q.5.m. RANI 0.5 mg | 52 wks | NR | 3.03 ± 4.84 2.48 ± 2.78 | 7.7 ± 1.4 7.5 ± 1.3 |
Chatzirallis 2020 | NR NR 112 | RANI AFLI | 78 wks | 11.1 ± 4.9 12.1 ± 4.2 | NR | NR |
Chatzirallis 2020 to 2 | NR NR NR | RANI RANI + PRP | 104 wks | NR | NR | 6.8 ± 1.3 6.5 ± 1.8 |
Cserhati 2013 (abstract) | NR NR 76 | Retinal photocoagulation + anti-VEGF Anti-VEGF | 52 wks | NR | NR | NR |
DA VINCI | II DB 221 | AFL q.4.w. + LP AFL q.8.w. + LP AFL q.4.w. or PRN LP | 52 wks | NR | NR | 8.08 ± 1.94 7.85 ± 1.72 7.93 ± 1.84 |
IBERA-DME | II DB 63 | BEVA RANI | 48 wks | 16.2 ± 8 15.9 ± 8 | 3.11 3.18 | 8.6 ± 1.3 8.7 ± 2 |
Kanar 2020 | NR NR 56 | AFLI AFLI + LP | 52 wks | 18.3 ± 2.24 18.8 ± 2.08 | NR | 8.02 ± 2.43 7.97 ± 2.47 |
Kaya 2021 | NR Open-label 68 | RANI RANI + DEX | 52 wks | 14.2 ± 5.8 13.6 ± 5.1 | NR | 7.0 ± 0.6 7.0 ± 0.8 |
KESTREL | PIII DB NR | BRO 6 mg q.8.w. or q.12.w. AFLI 2 mg q.8.w. | 104 wks | NR | NR | NR |
Khattab 2019 | IV NR 54 | AFL AFL + LP | 78 wks | 17.4 ± 4.2 17.8 ± 3.4 | NR | NR |
KITE | PIII DB NA | BRO 6 mg q.8.w. or q.12.w. AFLI 2 mg q.8.w. | 104 wks | NR | NR | NR |
Lucidate | IV Single-blind 37 | RANI LP | 48 wks | NR 18 | 1.8 2.7 | 7.93 ± 1.31 7.25 ± 0.92 |
Maturi 2015 | PIV Single-blind 40 | BEV + DEX BEV | 52 wks | NR | NR | NR |
MEAD | III Triple blind 1,048 | DEX Sham | 156 or 170 wks | 16.5 ± 9 15.9 ± 9.1 | 2 ± 2.2 2.2 ± 2.3 | 7.6 ± 1.2 7.5 ± 1.1 |
OZLASE | PIII Single-blind 80 | DEX + LP LP | 56 wks | 15 15 | 2.12* (0.63 to 3.38) 3.41* (1.96 to 6.96) | 7.9 ± 1.2 8 ± 1.4 |
Ozsaygili 2019 | NR Single-blind 98 | AFLI DEX | 52 wks | 10.2 10.4 | NR | 8.2 ± 0.6 8.4 ± 0.6 |
Protocol I | III Single-blind 854 | Prompt LP RANI + prompt LP RANI + deferred LP | NR | 16 18 17 | NR | 7.3 7.3 7.5 |
Protocol T | III DB 660 | AFL + LP BEV + LP RANI + LP | 52 or 104 wks | 15 17 16 | NR | 7.6 7.7 7.8 |
Re-Des Study | NR Open-label NR | LP RANI | 52 wks | NR | NR | NR |
READ-2 | II Open-label 126 | RANI LP RANI + LP | 156 wks | NR | NR | 7.39 7.77 7.59 |
REFINE | PIII DB 384 | RANI LP | 52 wks | 1.3 ± 2.01 1.1 ± 1.47 | NR | 7.44 ± 1.16 7.3 ± 1.05 |
RELATION | PIIIb DB 128 | RANI + LP LP | 52 wks | NR | 1 (0 to 8.8) 1.3 (0 to 20.6) | 7.5 ± 1 7.5 ± 1.2 |
RESPOND | IIIb Open-label 237 | RANI RANI + LP LP | 52 wks | 16.5 ± 9 18.5 ± 11.6 16.6 ± 10.7 | 1.6 ± 2.3 2.1 ± 3.1 1.7 ± 2.9 | 7.8 ± 1.3 7.7 ± 1.1 7.6 ± 1.3 |
RESTORE (CORE OLE) | III (a+b) DB for core study 345 | RANI RANI + LP LP | 12 to 36 mons | 15.23 ± 9.91 14.62 ± 9.84 12.93 ± 9.02 | 1.8 ± 1.98 1.99 ± 3.14 1.58 ± 1.96 | 7.23 ± 1.08 7.5 ± 1.1 7.28 ± 1.11 |
RETAIN | PIIIb Single-blind 372 | RANI T and E + LP RANI T and E RANI PRN | 104 wks | NR | 2.54 ± 3.2 2.64 ± 3.1 2.53 ± 3 | 7.8 ± 1.4 7.9 ± 1.3 8 ± 1.2 |
REVEAL | III DB 396 | RANI RANI + LP LP | 104 wks | 11.21 ± 8.2 11.33 ± 8.05 11.34 ± 8.85 | 1.24 ± 1.52 1.36 ± 2.08 1.51 ± 1.96 | 7.5 ± 1.02 7.4 ± 1.05 7.5 ± 1.1 |
RHINE | PIII DB NR | FAR q.8.w. FAR T and E AFLI | NR | NR | NR | 7.6 ± 1.2 7.7 ± 1.2 7.7 ± 1.2 |
RISE RIDE | III DB 759 | RANI 0.5 mg RANI 0.3 mg Sham | 104 wks | 15.3 ± 10.1 16 ± 9.8 16.6 ± 10.6 | 1.9 ± 2.4 1.6 ± 2.0 2.4 ± 3.2 | 7.6 ± 1.5 7.6 ± 1.3 7.6 ± 1.4 |
Soheilian 2012 | III DB 150 | BEV LP | 104 wks | 10.5 ± 3.2 10.5 ± 2.9 | NR | NR |
TREX-DME | I II NR 150 | RANI RANI T and E RANI + LP | 104 wks | 15.8 13.6 14.8 | NR | NR |
Vasquez 2019 (abstract) | NR NR NR | DEX AFLI | 52 wks | NR | NR | NR |
VIVID East | III DB 381 | AFLI LP | 52 wks | 12.9 ± 7.7 11.5 ± 7.9 12.6 ± 7.8 | NR | 7.6 ± 1.4 7.3 ± 1.3 7.3 ± 1.4 |
VIVID VISTA | III DB 872 | AFL q.4.w. AFL q.8.w. LP | 148 wks | 16.5 ± 9.9 17.6 ± 11.5 17.2 ± 9.5 | NR | 7.9 ± 1.6 7.9 ± 1.6 7.6 ± 1.7 |
Vujosevic 2014 (abstract) | NR NR NR | DEX | 156 wks | NR | NR | NR |
Weingessel 2020 | NR DB 50 | RANI + LP | 5 years | NR | NR | NR |
YOSEMITE | PIII DB NR | FAR q.8.w. FAR T and E AFLI | NR | NR | NR | 7.6 ± 1.1 7.6 ± 1.1 7.6 ± 1.1 |
AFLI = aflibercept; BEVA = bevacizumab; BRO = brolucizumab; DEX = dexamethasone; DB = double-blind; FAR = faricimab; FU = follow-up; LP = laser photocoagulation; NMA = network meta-analysis; NR = not reported; PRN = pro re nata; PRP = panretinal photocoagulation; q.4.w. = every 4 weeks; q.5.m. = every 5 months; q.8.w. = every 8 weeks; RANI = ranibizumab; T and E = treat and extend; VEGF = vascular endothelial growth factor; wks = weeks.
Source: Sponsor-submitted indirect treatment comparison.47
Table 32: Treatment Experience at Baseline in the Included Studies
Study name | Intervention | Naive (%) | Any (%) | Anti-VEGF (%) | Laser (%) | Steroids (%) | Others (%) |
|---|---|---|---|---|---|---|---|
VISTA | AFL q.4.w. | — | — | 43 | — | — | — |
AFL q.8.w. | — | — | 45 | — | — | — | |
LP | — | — | 41 | — | — | — | |
VIVID | AFL q.4.w. | — | — | 6 | — | — | — |
AFL q.8.w. | — | — | 11 | — | — | — | |
LP | — | — | 10 | — | — | — | |
DA VINCI | AFL (q.4.w.) + LP | — | — | 23 | 52 | 16 | — |
AFL (q.8.w.) + LP | — | — | 14 | 67 | 24 | — | |
AFL q.4.w./PRN + LP | — | — | 13 | 58 | 20 | — | |
LP | — | — | 23 | 50 | 27 | — | |
Protocol T | AFL + LP | — | — | 11 | 36 | — | 6 |
BEV + LP | — | — | 14 | 39 | — | 6 | |
RAN + LP | — | — | 13 | 37 | — | 5 | |
Khattab 2019 | AFL | — | — | 30 | 30 | — | — |
AFL + LP | — | — | 22 | 20 | — | — | |
RISE | RAN 0.5 mg | — | 82 | — | 72 | 40 | 17 |
RAN 0.3 mg | — | 75 | — | 69 | 31 | 16 | |
Sham | — | 74 | — | 68 | 28 | 17 | |
RIDE | RAN 0.5 mg | — | 69 | — | 62 | 29 | 20 |
RAN 0.3 mg | — | 69 | — | 58 | 26 | 22 | |
Sham | — | 71 | — | 65 | 28 | 16 | |
RESPOND | RAN | — | 61 | — | — | — | — |
RAN + LP | — | 75 | — | — | — | — | |
LP | — | 67 | — | — | — | — | |
IBERA-DME | BEV | — | — | 16 | 100 | 3 | — |
RAN | — | — | 18 | 100 | 4 | — | |
Callanan 2017 | DEX | — | 44 | 22 | 29 | — | — |
RAN | — | 45 | 21 | 26 | — | — | |
RELATION | RAN + LP | — | — | — | 73 | — | — |
LP | — | — | — | 63 | — | — | |
Protocol I | Prompt LP | 36 | — | 8 | 59 | 13 | — |
RAN + Prompt LP | 40 | — | 13 | 54 | 12 | — | |
RAN + Deferred LP | 39 | — | 11 | 54 | 19 | — | |
Maturi 2015 | BEV + LP | — | — | — | — | — | 95 |
BEV | — | — | — | — | — | 89 | |
OZLASE | DEX + LP | — | — | 5 | — | 0 | — |
LP | — | — | 5 | — | 3 | — | |
MEAD | DEX | — | — | 7 | 66 | 17 | — |
Sham | — | — | 7 | 69 | 17 | — | |
Sohellian 2012 | BEV | 100 | — | — | — | — | — |
LP | 100 | — | — | — | — | — | |
Kanar 2020 | AFL | 100 | — | — | — | — | — |
AFL + LP | 100 | — | — | — | — | — | |
Ozsaygili 2019 | AFL | 100 | — | — | — | — | — |
DEX | 100 | — | — | — | — | — | |
Vasquez 2019 | DEX | 100 | — | — | — | — | — |
AFL | 100 | — | — | — | — | — |
AFL = aflibercept; BEV = bevacizumab; DEX = dexamethasone; LP = laser; PRN = pro re nata; q.4.w. = once every 4 weeks; q.8.w. = once every 8 weeks; RAN = ranibizumab; VEGF = vascular endothelial growth factor.
Source: Sponsor-submitted indirect treatment comparison.47
Table 33: Summary of Baseline Characteristics, FAS
Characteristic | KINGFISHER | |
|---|---|---|
Brolucizumab 6 mg N = 346 | Aflibercept 2 mg N = 171 | |
Demographic characteristics | ||
Age (years), mean (SD) | 60.9 (10.59) | 60.2 (9.31) |
Sex, n (%) | ||
Male | 194 (56.1) | 105 (61.4) |
Female | 152 (43.9) | 66 (38.6) |
Race, n (%) | ||
White | 290 (83.8) | 145 (84.8) |
Black or African America | 41 (11.8) | 15 (8.8) |
Asian | 14 (4.0) | 7 (4.1) |
Native Hawaiian or Other Pacific Islander | 1 (0.3) | 0 |
American Indian or Alaska Native [wording from original source] | 1 (0.3) | 1 (0.6) |
Unknown | 1 (0.3) | 3 (1.8) |
Diabetes characteristics | ||
Diabetes type, m (%) | ||
Type 1 | 19 (5.5) | 9 (5.3) |
Type 2 | 327 (94.5) | 162 (94.7) |
Hemoglobin A1C (%), mean (SD) | 7.84 (1.476) | 7.98 (1.582) |
Ocular characteristics for the study eye | ||
Study eye, m (%) | ||
OS | 173 (50.0) | 92 (53.8) |
OD | 173 (50.0) | 79 (46.2) |
Time since DME diagnosis (months), mean (SD) | 20.6 (29.94) | 18.2 (25.60) |
BCVA | ||
Letters, mean (SD) | 61.3 (10.14) | 60.5 (11.27) |
≤ 34 letters, m (%) | 10 (2.9) | 10 (5.8) |
> 34 letters, m (%) | 336 (97.1) | 161 (94.2) |
≤ 65 letters, m (%) | 198 (57.2) | 104 (60.8) |
> 65 letters, m (%) | 148 (42.8) | 67 (39.2) |
CSFT (μm), mean (SD) | 514.1 (138.94) | 511.2 (156.29) |
IRF, m (%) | 344 (99.4) | 170 (99.4) |
SRF, m (%) | 128 (37.0) | 59 (34.5) |
DRSS, m (%)a | ||
N | 221 | 118 |
1 - DR absent | 3 (1.4) | 1 (0.8) |
2 - Microaneurysms only | 3 (1.4) | 0 |
3 - Mild NPDR | 53 (24.0) | 35 (29.7) |
4 - Moderate NPDR | 55 (24.9) | 31 (26.3) |
5 - Moderately severe NPDR | 59 (26.7) | 24 (20.3) |
6 - Severe NPDR | 26 (11.8) | 14 (11.9) |
7 - Mild PDR | 9 (4.1) | 3 (2.5) |
8 - Moderate PDR | 10 (4.5) | 6 (5.1) |
9 - High-risk PDR | 3 (1.4) | 3 (2.5) |
10 - Very high-risk PDR | 0 | 1 (0.8) |
11 - Advanced PDR | 0 | 0 |
12 - Very advanced PDR | 0 | 0 |
Prior and concomitant ocular therapies for the study eye (safety set) | ||
Prior anti-VEGF treatment, n (%) b | 95 (27.5) | 52 (30.4) |
Prior ocular medications, n (%) | 107 (30.9) | 55 (32.2) |
Antineovascularization drugs | 95 (27.5) | 52 (30.4) |
Bevacizumab | 57 (16.5) | 36 (21.1) |
Aflibercept | 43 (12.4) | 17 (9.9) |
Ranibizumab | 14 (4.0) | 8 (4.7) |
Concomitant ocular medications, n (%) | 86 (24.9) | 45 (26.3) |
Other ophthalmologicals | 35 (10.1) | 14 (8.2) |
Artificial tears (umbrella term) | 15 (4.3) | 5 (2.9) |
BCVA = best-corrected visual acuity; CSFT = central subfield thickness; DME = diabetic macular edema; DR = diabetic retinopathy; DRSS = Diabetic Retinopathy Severity Scale; FAS = full analysis set; IRF = intraretinal fluid; m = number of patients with assessment meeting the criterion for the given categorical variables; NA = not available; NPDR = nonproliferative diabetic retinopathy; PDR = proliferative diabetic retinopathy; SD = standard deviation; SRF = subretinal fluid; VEGF = vascular endothelial growth factor.
aPatients who received full/partial panretinal photocoagulation or local photocoagulation for new vessel (DRSS score of 60) at any visit were excluded from the analysis.
bReported prior anti-VEGF treatment in the study eye and fellow eye included bevacizumab, aflibercept, and ranibizumab (safety set).
Source: Clinical Study Report for KINGFISHER.13
Appendix 3: Description and Appraisal of Outcome Measures
Note that this appendix has not been copy-edited.
Aim
To describe the following outcome measures and review their measurement properties (validity, reliability, responsiveness to change, and the MID) in patients with DME:
BCVA as assessed by the ETDRS charts (letters)
DR status as assessed by the ETDRS DRSS
Visual-related quality of life as assessed by the NEI VFQ-25
CSFT as assessed by spectral domain OCT
Findings
Table 34: Summary of Outcome Measures and Their Measurement Properties
Outcome measure | Type | Conclusions about measurement properties | MID |
|---|---|---|---|
BCVA as assessed by the ETDRS charts (letters) | ETDRS charts present a series of 5 letters of equal difficulty in reading on each line, for a total of 14 lines (70 letters). Charts are used in a standard light box. The standard testing distance is 4 m. Visual acuity is documented as the smallest line read by each eye in the absence of any errors.39 ETDRS letters score can be calculated when 20 or more letters are read correctly at 4 m; the visual acuity letter score is equal to the total number of letters read correctly at 4 m plus 30. The maximum score in the ETDRS letter score is 100, with higher scores indicating better visual acuity.40 | Validity. No data were identified in patients with DME. Reliability. Two studies (study 1, n = 40 healthy eyes;51 study 2, n = 265, including 53 healthy eyes and 212 eyes with uncorrected refractive error, age-related macular degeneration, diabetic retinopathy, cataract, optic nerve, cornea, uveitis, glaucoma, amblyopia, or other40) reported the test–retest reliability to be moderate to almost perfect agreement (study 1, ICC = 0.580 to 0.866, depending on lighting and constrast;51 study 2, ICC = 0.9940). Responsiveness. No data were identified in patients with DME. | No data were identified in patients with DME. |
DR status as assessed by the ETDRS DRSS | The ETDRS DRSS is a diabetic retinopathy grading system based on stereoscopic fundus photographs. Seven standard fields in each eye are examined on fundus photographs and compared against standard reference photographs to assess ocular abnormalities.52 The ETDRS DRSS consists of 13 levels ranging from no retinopathy (level 10) to advanced proliferative diabetic retinopathy with posterior fundus obscured or centre of macula detached (level 85).44 Each level is defined by a set of graded photographic abnormalities (criteria) used to categorize the severity of diabetic retinopathy. The diabetic retinopathy severity level of an eye is the level at which any criterion is met, and any criterion in the higher level is not met. Step progression refers to an increase in level that can be used to describe change in diabetic retinopathy over time.44 | The ETDRS44 enrolled 3,711 patients with diabetes and diabetic retinopathy (with or without macular edema) in both eyes. Patients were randomly assigned to receive Aspirin 650 mg once daily or placebo, and 1 eye in each patient was randomly assigned to receive early photocoagulation while the fellow eye was assigned to deferral of photocoagulation. Validity. No data were identified in patients with DME. Reliability. Complete interrater (between 2 independent graders) agreement on the level was observed in 53% of eyes (assigned to deferral of photocoagulation) and agreement within 1 level occurred in 88% of eyes. The unweighted kappa statistic was 0.42, which increased to 0.65 with a weighting of 1 for exact agreement, 0.75 for 1-level disagreement, and 0 for all other disagreements.44 Responsiveness. No data were identified in patients with DME. | No data were identified in patients with DME. |
Vision-related quality of life as assessed by the NEI VFQ-25 | The NEI VFQ assesses the impact of visual impairment on the health-related quality of life across a broad range of eye conditions.53 The NEI VFQ-25 (a shortened version of the original 51-item questionnaire) is administered as an interview and consists of 25 items relevant to 11 subscales, in addition to a single-item general-health component.41 Each subscale score is the average score of all items in the subscale transformed to a 0 to 100 scale, with 0 indicating the worst possible score and 100 indicating the best possible score. The composite score is the unweighted average score of all items except for the general-health rating, which is considered a stand-alone item representing overall health status.41 | Lloyd et al.42 conducted a study to evaluate the psychometric properties of the NEI VFQ-25 in patients with DME who participated in a multicentred (including Canada), randomized, sham-controlled, double-blinded, parallel-group, phase II and III clinical trial (N = 235). Adult patients were randomized to receive either intravitreal pegaptanib injection or sham treatment. Validity. For concurrent validity, the Pearson correlation coefficient for the NEI VFQ-25 subscale scores and the EQ-5D VAS score ranged from 0.16 to 0.43 for role difficulties and general health, respectively. The Pearson correlation coefficient was 0.38 for the NEI VFQ-25 composite score with the EQ-5D VAS.42 For construct validity, the known groups validity was demonstrated by the higher NEI VFQ-25 subscale scores for patients who were documented with better ETDRS visual acuity. A higher mean NEI VFQ-25 composite score was reported in the quartile of patients with the best visual acuity, compared with the quartile of patients with the worst visual acuity; 72.1 (SD = 17.91) vs. 56.1 (SD = 18.00), respectively.42 For convergent validity, the NEI VFQ-25 subscales demonstrated low to moderate correlations with the ETDRS visual acuity score, ranging from 0.10 to 0.41 for the study eye, and 0.01 to 0.51 for the fellow eye.42 Reliability. For internal consistency reliability, the Cronbach alpha for the 8 multi-item subscales ranged from 0.58 to 0.85 for distance activities and vision-specific dependency, respectively. The Cronbach alpha for the NEI VFQ-25 composite score was 0.92 at baseline.42 Responsiveness. For responsiveness to change in patients who reported at least a 5-letter improvement in ETDRS visual acuity, the effect size, SRM, and Guyatt responsiveness statistic were generally consistent. For example, the effect size ranged from 0.02 to 0.55 for the social functioning and general vision subscales, respectively. The effect size for the composite score was 0.26.42 | Using the half-SD distribution-based approach, the MID for each NEI VFQ-25 subscale ranged from 8.80 (general vision) to 14.40 (role difficulties); the MID for the composite score was 6.13 (n = 197).42 Using the SEM distribution-based approach, the MID for each subscale ranged from 8.79 (driving) to 14.04 (role difficulties); the MID for the composite score was 3.33 (n = 197).42 |
CSFT as assessed by the SD-OCT | A noninvasive instrument used to create cross-sectional maps of the retinal structures and to quantify retinal thickness in patients with macular edema.54 Of note, OCT technology has shifted from TD-OCT to SD-OCT, as the latter can acquire data at a higher speed with better image resolution and reduced motion artifact.55 | Validity. A Cochrane review56 evaluated the diagnostic accuracy of any OCT model, including SD-OCT, for detecting DME or clinically significant macular edema in patients with diabetic retinopathy. For the diagnosis of DME, a total of 3 studies were included (n = 180, 343 eyes). Goebel et al.57 reported a sensitivity of 0.78 (95% CI, 0.66 to 0.87) and specificity of 0.82 (95% CI, 0.66 to 0.92) using a retinal thickness cut‐off of 230 µm for the central subfield. Sadda et al.58 reported a sensitivity of 0.84 (95% CI, 0.70 to 0.93) and specificity of 0.79 (95% CI, 0.54 to 0.94) using a retinal thickness cut‐off of 300 µm. Strom et al.59 reported a sensitivity of 1.00 (95% CI, 0.77 to 1.00) and specificity of 1.00 (95% CI, 0.95 to 1.00); retinal thickness cut-off was not reported. Reliability. For measurement precision of Stratus OCT 3, the average 95% limits of agreement were 36 µm, 29 µm, and 25 µm for foveal, parafoveal, and perifoveal thickness, respectively, in 15 patients with diabetes with macular edema. For measurement reliability, the ICCs were 0.96, 0.99, and 0.99 for foveal, parafoveal, and perifoveal thickness, respectively, in 15 patients with diabetes with macular edema.60 In 30 patients with DME, a comparison of measurements with 4 different OCT devices found good intradevice repeatability (Pearson correlation coefficient > 0.7; ICC > 0.9), but observed differences in retinal thickness values across different devices.61 The reproducibility of CSFT measurements using TD-OCT (Stratus device) and SD-OCT (Cirrus and Spectralis devices) in patients with diabetes with DME and in patients with diabetes without DME were compared using replicate scans of 531 and 717 eyes for the Cirrus/Stratus and Spectralis/Stratus group, respectively. The Bland-Altman coefficient of repeatability for relative change in CSFT was 7% for Spectralis, 14% for Cirrus, 12% to 15% for Stratus groups, respectively.55 Responsiveness. No data were identified in patients with DME. | No data were identified in patients with DME. |
BCVA = best-corrected visual acuity; CSFT = central subfield thickness; DME = diabetic macular edema; DRSS = Diabetic Retinopathy Severity Scale; ETDRS = Early Treatment Diabetic Retinopathy Study; HD-OCT = high-definition spectral domain optical coherence tomography; ICC = intraclass correlation coefficient; MID = minimal important difference; NEI VFQ-25 = National Eye Institute Visual Function Questionnaire-25; OCT = optical coherence tomography; SD = standard deviation; SD-OCT = spectral domain optical coherence tomography; SEM = standard error of measurement; SRM = standardized response mean; TD-OCT = time domain optical coherence tomography; VAS = visual analogue scale.
Early Treatment Diabetic Retinopathy Study Charts (Letters)
Based on the design created by Bailey and Lovie, the ETDRS charts were introduced for the ETDRS in the early 1980s to address the disadvantages of previous charts (i.e., Snellen-type charts) and meet the needs of researchers for a more standardized approach in measuring visual acuity.39 ETDRS charts present a series of 5 letters of equal difficulty in reading on each line with standardized spacing between letters and lines, for a total of 14 lines (70 letters). Sizes of the letters range from 58.18 mm to 2.92 mm, corresponding to a visual acuity of 20/200 to 20/10 or, 4/40 to 4/2 if read at a distance of 4 m. Letter size (height) increases geometrically per line by a factor of 1.2589 (or 0.1 log unit) moving up the chart. Ten Sloan letters were selected for the ETDRS chart: S, D, K, H, N, O, C, V, R, and Z. Of the 252 possible 5-letter combinations using the 10 selected letters, 28 combinations with the same “letter difficulty score” were selected for the charts.39
Charts are used in a standard light box. The standard chart testing distance is 4 m; however, a reduced distance of 1 m may also be used when visual acuity is severely impaired in patients with low vision.39 During an examination, the patient reads letter by letter down the chart and only 1 attempt is permitted per letter. Letters that are read correctly, including letters that are read correctly based on a guess, are marked on the score sheet. Visual acuity is documented as the smallest line read by each eye in the absence of any errors. Scoring for ETDRS charts was designed to produce a logarithmic of the minimal angle of resolution (logMAR) score (i.e., a difference of 0.1 logMAR unit between each line) in which individual letters score 0.02 logMAR units.39
ETDRS letters score can be calculated when 20 or more letters are read correctly at a distance of 4 m. The visual acuity letter score is equal to the total number of letters read correctly at 4 m plus 30. If less than 20 letters are read correctly at 4 m, the visual acuity letter score is equal to the total number of letters read correctly at 4 m plus the total number of letters read correctly at 1 m in the first 6 lines. The ETDRS letter score could result in a maximum score of 100, with higher scores indicating better visual acuity.40
Validity
No data on the validity of ETDRS charts in patients with DME was identified in the literature.
Reliability
Two studies (study 1, n = 40 healthy eyes;51 study 2, n = 265, including 53 healthy eyes and 212 eyes with uncorrected refractive error, age-related macular degeneration, DR, cataract, optic nerve, cornea, uveitis, glaucoma, amblyopia, or other40) assessed the test–retest reliability of the ETDRS charts and reported moderate to almost perfect agreement (study 1, intraclass correlation coefficient [ICC] = 0.580 to 0.866, depending on lighting and constrast;51 study 2, ICC = 0.9940).
According to a study in patients with age-related macular degeneration, ocular histoplasmosis, or idiopathic neovascularization, the reliability of ETDRS charts is dependent on the baseline visual acuity. For eyes with acuity better than 20/100, a change in visual acuity of 5 or more letters was associated with a greater than 90% probability of being a real change and not a difference due to chance. For eyes with acuity worse than 20/100, a change in visual acuity of 10 or more letters was required to draw the same conclusion.62,63
The test–retest variability (TRV) refers to the difference in visual acuity when a patient is tested and retested in the absence of any true clinical change. By using data on the repeatability and TRV of visual acuity tests, a change criterion can be established to determine if a measured change is true (beyond change criterion) or not (below change criterion). Literature-based estimates of the TRV for the ETDRS charts range from ± 0.07 to ± 0.19 logMAR.64-71 In 50 participants without any ocular abnormality (i.e., Snellen acuity of 6/8 or better), it was demonstrated that when the change criterion is high, the ability to detect a real change in score is low.64-71 For example, a change criterion of 0.19 logMAR demonstrated a sensitivity of 4% (95% CI, 0% to 14%) for a simulated change of 0.1 logMAR. When the change criterion was lowered to 0.11 logMAR, the sensitivity of the test increased to 38% (95% CI, 25% to 53%). Further, using a 0.11 logMAR change criterion and a simulated change of 0.2 logMAR (2 lines of letters), the sensitivity increased to 100% (1-sided 97.5% CI, 93% to 100%).68,71
Responsiveness to Change
No data on the responsiveness to change of ETDRS charts in patients with DME were identified in the literature.
Minimal Important Difference
No data on the MID in ETDRS charts in patients with DME were identified in the literature.
ETDRS Diabetic Retinopathy Severity Scale
The ETDRS Research Group modified the Airlie House classification of DR to create a DR grading system based on stereoscopic fundus photographs.52 Seven standard fields in each eye covering the macula, optic disc, and surrounding areas are examined on fundus photographs and compared with standard reference photographs. Fundus photographs are used to assess ocular abnormalities, such as hemorrhages and/or microaneurysms, soft exudates, and venous abnormalities. Each abnormality is graded independently using a single or multiple fields (i.e., it may be helpful to assess the abnormality using information gathered from relevant overlapping parts of adjoining fields).52 Photograph sets are generally graded as follows: grade 0 represents absence of the abnormality, grade 1 represents questionable presence, grades 2 to 5 represent the level of severity (i.e., definitely present, moderate, severe, and very severe) of the abnormality compared with the standard reference photograph, and grade 8 indicates the inability to grade. For abnormalities graded in multiple fields, the individual grades are combined into a summary grade (i.e., level of maximum severity/number of fields with that severity level).52
The ETDRS enrolled 3,711 patients with diabetes and DR (with or without macular edema) in both eyes.44 Patients were randomized to receive Aspirin 650 mg once daily or placebo, and 1 eye in each patient was randomized to receive early photocoagulation while the fellow eye was assigned to deferral of photocoagulation. An analysis of fundus photograph characteristics in patients with DR and assigned to deferral of photocoagulation over time led to the identification of photographic risk factors for progression from nonproliferative to proliferative DR.44 As a result of this analysis, the ETDRS DRSS was finalized, consisting of 13 levels ranging from no retinopathy (level 10) to advanced proliferative DR with posterior fundus obscured or centre of macula detached (level 85). Level 90 indicates the inability to grade, and levels 14 and 15 are not considered separate levels; instead, the are pooled with level 10 or 20. Each level is defined by a set of graded photographic abnormalities (criteria) used to categorize the severity of DR. The DR severity level of an eye is the level at which any criterion is met, and any criterion in the higher level is not met. Step progression refers to an increase in level that can be used to describe change in DR over time.44
Validity
No data on the validity of ETDRS DRSS in patients with DME was identified in the literature.
Reliability
Data on the reliability of the ETDRS DRSS in patients with diabetes and DR (with or without macular edema) was identified in the ETDRS44 described earlier.
To evaluate the reproducibility of the scale in the ETDRS,44 percent agreement between 2 independent graders, and unweighted and weighted kappa statistics were determined using baseline photographs of eyes that were assigned to deferral of photocoagulation. Complete interrater agreement on the level was observed in 53% of eyes and agreement within 1 level occurred in 88% of eyes.44 The unweighted kappa statistic was 0.42, which increased to 0.65 with a weighting of 1 for exact agreement, 0.75 for 1-level disagreement, and 0 for all other disagreements.44
Responsiveness to Change
No data on the responsiveness to change of the ETDRS DRSS in patients with DME was identified in the literature.
Minimal Important Difference
No data on the MID in ETDRS DRSS in patients with DME was identified in the literature.
National Eye Institute Visual Function Questionnaire–25
The National Eye Institute Visual Function Questionnaire (NEI VFQ) was developed to assess the impact of visual impairment on HRQoL. The original 51-item questionnaire was developed based on focus groups consisting of patients with different eye conditions (i.e., cataract, glaucoma, DR including DME, age-related macular degeneration, cytomegalovirus retinitis, and low vision), and thus may be used to assess HRQoL across a broad range of eye conditions.53 The original 51-item questionnaire is administered as an interview and consists of 12 subscales related to general vision, ocular pain, near vision, distance vision, vision-specific social functioning, vision-specific mental health, vision-specific role functioning, dependency due to vision, driving, peripheral vision, colour vision, and expectations for visual function, plus 1 general-health subscale.72
A shortened version of the original instrument, the NEI VFQ-25, was subsequently developed, which retained the multidimensional nature of the original questionnaire but is considered to be more feasible to administer in clinical trials. With the exception of “expectations for future vision,” all subscales listed earlier were retained in the NEI VFQ-25, with a reduced number of items within each subscale. Thus, the NEI VFQ-25 consists of 25 items relevant to 11 subscales, in addition to a single-item general-health component.41 Each NEI VFQ-25 subscale score is the average score of the items in the subscale transformed to a 0 to 100 scale, with 0 indicating the worst possible score and 100 indicating the best possible score. The composite NEI VFQ-25 score is the unweighted average score of all items except for the general-health rating, which is considered a stand-alone item representing overall health status.41
Validity
Lloyd et al.42 conducted a study to evaluate the psychometric properties of the NEI VFQ-25 in patients with DME who participated in a multicentre (including Canada), randomized, sham-controlled, double-blinded, parallel-group, phase II and III clinical trial. Adult patients were randomized to receive either intravitreal pegaptanib injection or sham treatment. Only 1 eye was treated; the treating physician selected the eye which could be either the better or worse eye. The primary end point was the proportion of patients who had an improvement of 10 letters or greater or 2 lines of improvement in vision per ETDRS at 1 year relative to baseline. Only randomized patients who received at least 1 dose of the study drug and completed the baseline and at least 1 postbaseline visual acuity assessment were included in the psychometric analyses (N = 235). Both the NEI VFQ-25 and EQ-5D (only the EQ-5D visual analogue scale [VAS] was used for the psychometric analyses) were administered.42
For concurrent validity, the NEI VFQ-25 subscale scores were compared with the EQ-5D VAS score. The hypothesis was that the correlation coefficient was moderate (not much greater than 0.30) because the NEI VFQ-25 is a disease-specific measure, while the EQ-5D VAS is a general measure of current health state.42 The Pearson correlation coefficient ranged from 0.16 to 0.43 (low to moderate) for role difficulties and general health, respectively. The following subscales demonstrated moderate (> 0.30) correlation with the EQ-5D VAS: general health (0.43), near activities (0.36), distance activities (0.33), social functioning (0.33), mental health (0.35), dependency (0.37), and driving (0.34). The Pearson correlation coefficient was 0.38 for the NEI VFQ-25 composite score and EQ-5D VAS.42
For construct validity, the known groups validity was evaluated based on the subgroups of patients according to their ETDRS visual acuity.42 Overall, known groups validity was demonstrated by the higher NEI VFQ-25 subscale scores for patients who were documented with better ETDRS visual acuity. Differences were demonstrated for all subscales, except for general health, ocular pain, and colour vision. A higher mean NEI VFQ-25 composite score was reported in the quartile of patients with the best visual acuity (ETDRS of 64 to 73 letters in the study eye), compared with the quartile of patients with the worst visual acuity (ETDRS of 35 to 52 letters); 72.1 (SD = 17.91) versus 56.1 (SD = 18.00), respectively.42
For construct validity, the convergent validity was evaluated by determining the correlation coefficients between NEI VFQ-25 and ETDRS scores.42 Overall, the subscales demonstrated low to moderate correlations with the ETDRS visual acuity score ranging from 0.10 to 0.41 for the study eye, and 0.01 to 0.51 for the fellow eye. The following subscales demonstrated poor (< 0.30) correlation with the ETDRS visual acuity score: role difficulties, colour vision, peripheral vision, and ocular pain.42 According to the multiple regression analyses, EQ-5D VAS and ETDRS visual acuity were the most consistent predictors of NEI VFQ-25 subscale scores (versus a hemoglobin A1C of < 7.6%, age, gender, ECOG, and duration of vision problems).42
Reliability
Data on the reliability of the NEI VFQ-25 in patients with DME was identified in the Lloyd et al.42 study described previously.
For internal consistency, the Cronbach alpha was determined for the multi-item subscales; an acceptable correlation between items within a subscale was prespecified at ≥ 0.70.42 The Cronbach alpha for the 8 multi-item subscales ranged from 0.58 to 0.85 for distance activities and vision-specific dependency, respectively. Therefore, internal consistency reliability was demonstrated in the following subscales with a Cronbach alpha of ≥ 0.70: ocular pain (0.70), near activities (0.73), mental health (0.78), role difficulties (0.77), dependency (0.85), and driving (0.75). The distance activities and social functioning (2-item subscales) did not meet the prespecified threshold for internal consistency. The Cronbach alpha for the NEI VFQ-25 composite score was 0.92 at baseline.42
Responsiveness to Change
Data on the responsiveness to change of the NEI VFQ-25 in patients with DME was identified in the Lloyd et al.42 study described previously.
For responsiveness to change, different statistical approaches were used with data collected among patients who reported at least a 5-letter improvement in ETDRS visual acuity in the study eye at week 54 relative to baseline.42 The effect size ranged from 0.02 to 0.55 for the social functioning and general vision subscales, respectively. The effect size for the NEI VFQ-25 composite was 0.26. The standardized response mean ranged from 0.03 to 0.56 for social functioning and general vision subscales, respectively. The standardized response mean for the NEI VFQ-25 composite was 0.43. The Guyatt responsiveness statistic ranged from 0.02 to 0.57 for social functioning and general vision subscales, respectively (n = 30). The Guyatt responsiveness statistic for the NEI VFQ-25 composite was 0.39 (n = 30).42
Minimal Important Difference
Estimations of the MID in the NEI VFQ-25 for patients with DME were identified in the Lloyd et al.42 study described previously.
Using the half-SD distribution-based approach, the MID for each NEI VFQ-25 subscale ranged from 8.80 (general vision) to 14.40 (role difficulties); the MID in the composite score was 6.13 (n = 197).
Using the standard error of measurement (SEM) distribution-based approach, the MID for each subscale ranged from 8.79 (driving) to 14.04 (role difficulties); the MID for the composite score was 3.33 (n = 197).42
CSFT Measured by the Spectral Domain OCT
OCT is a fast, noninvasive instrument used to create cross-sectional maps of the retinal structures and to quantify retinal thickness in patients with macular edema.54 OCT uses lasers centred on infrared wavelengths to record light reflected from interfaces between materials with different refractive indices, and from materials that scatter light. OCT devices can differentiate 3 reflecting layers thought to be the vitreous/retina, inner/outer photoreceptor segments, and the retinal pigment epithelium/choriocapillaris interfaces. Ultra-high-resolution machines can differentiate a fourth layer. During the OCT scan, a series of intersecting, radial cross-sections of the retina are measured. Resolution depends on the software as well as the hardware used and is better around the central axis than lateral areas.54,73 Of note, OCT technology has shifted from time domain OCT (TD-OCT) to spectral domain OCT, as the latter can acquire data at a higher speed with better image resolution and reduced motion artifact.55
Validity
A Cochrane review56 was conducted to evaluate the diagnostic accuracy of any OCT model, including spectral domain OCT, for detecting DME or clinically significant macular edema, defined as the most severe form of DME, in patients with DR. DME and clinically significant macular edema were diagnosed by fundus biomicroscopy or stereophotography as the reference standard. For the purposes of this review, only data pertaining to the diagnosis of DME is reported here. For the diagnosis of DME, a total of 3 studies were included (n = 180, 343 eyes). Goebel et al.57 reported a sensitivity of 0.78 (95% CI, 0.66 to 0.87) and specificity of 0.82 (95% CI, 0.66 to 0.92) using a retinal thickness cut‐off of 230 µm for the central subfield. Sadda et al.58 reported a sensitivity of 0.84 (95% CI, 0.70 to 0.93) and specificity of 0.79 (95% CI, 0.54 to 0.94) using a retinal thickness cut‐off of 300 µm. Strom et al.59 reported a sensitivity of 1.00 (95% CI, 0.77 to 1.00) and specificity of 1.00 (95% CI, 0.95 to 1.00); retinal thickness cut-off was not reported.
Reliability
Intradevice repeatability and interdevice reproducibility of measurements depend on a number of factors including retinal pathology, retinal region, region size, OCT model, equipment settings, manual or automated analysis, and operator experience.54
A study was conducted to evaluate the precision and reliability of measuring retinal thickness using Stratus OCT 3 and a retinal thickness analyzer in foveal, parafoveal, and perifoveal areas (n = 14 healthy participants, 28 eyes; 15 patients with diabetes and macular edema, 21 eyes; 31 patients with diabetes without macular edema, 57 eyes).60 For the purposes of this review, only data pertaining to OCT is reported here. For measurement precision (reproducibility), the average 95% limits of agreement (smaller limits denote higher precision) in patients with diabetes and macular edema were 36 µm, 29 µm, and 25 µm for foveal, parafoveal, and perifoveal thickness, respectively. In healthy participants, the average 95% limits of agreement were 8 µm, 5 µm, and 7 µm for foveal, parafoveal, and perifoveal thickness, respectively. For measurement reliability, the ICCs in patients with diabetes with macular edema were 0.96, 0.99, and 0.99 for foveal, parafoveal, and perifoveal thickness, respectively. In healthy participants, the ICCs were 0.97, 0.96, and 0.97 for foveal, parafoveal, and perifoveal thickness, respectively. The authors noted that the presence of macular edema can impact OCT measurement precision of para- and perifoveal areas.60
In a study of 30 patients with DME, a comparison of measurements by 4 different OCT devices (Spectralis HRA+OCT, Cirrus HD-OCT, 3-D OCT-1000, and Stratus OCT) found good intradevice repeatability (Pearson correlation coefficient > 0.7; ICC > 0.9), but observed differences in retinal thickness values across different devices.61
In another study, 1 of the objectives was to compare the reproducibility of CSFT measurements by TD-OCT (Stratus device) and spectral domain OCT (Cirrus and Spectralis devices) in patients with DME and in patients with diabetes but without DME. Replicate scans were obtained in 531 and 717 eyes for the Cirrus/Stratus and Spectralis/Stratus group, respectively. The Bland-Altman coefficient of repeatability for relative change in CSFT (the degree of change that could be expected due to measurement variability) was 7% for Spectralis, 14% for Cirrus, 12% to 15% for Stratus groups, respectively.55
Responsiveness to Change
No data on the responsiveness to change in CSFT as measured by OCT in patients with DME was identified in the literature.
Minimal Important Difference
No data on the MID for CSFT as measured by OCT in patients with DME was identified in the literature.
Pharmacoeconomic Review
Abbreviations
AE
adverse event
BCVA
best-corrected visual acuity
BIA
budget impact analysis
DME
diabetic macular edema
DR
diabetic retinopathy
ETDRS
Early Treatment Diabetic Retinopathy Study
ICER
incremental cost-effectiveness ratio
nAMD
neovascular age-related macular edema
NMA
network meta-analysis
QALY
quality-adjusted life-year
SD
standard deviation
VEGF
vascular endothelial growth factor
WTP
willingness to pay
Executive Summary
The executive summary comprises 2 tables (Table 1 and Table 2) and a conclusion.
Item | Description |
|---|---|
Drug product | Brolucizumab (Beovu), solution for intravitreal injection |
Submitted price | Brolucizumab, 6 mg per 0.05 mL, single-use prefilled syringe: $1,390.00 |
Indication | For the treatment of DME |
Health Canada approval status | NOC |
Health Canada review pathway | Standard review |
NOC date | November 30, 2022 |
Reimbursement request | As per indication |
Sponsor | Novartis Pharmaceuticals Canada Inc. |
Submission history | Previously reviewed: Yes Indication: Neovascular (wet) age-related macular degeneration Recommendation date: May 21, 2020 Recommendation: Recommended with clinical criteria and/or conditions |
DME = diabetic macular edema; NOC = Notice of Compliance.
Table 2: Summary of Economic Evaluation
Component | Description |
|---|---|
Type of economic evaluation |
|
Target population | Patients with DME |
Treatment | Brolucizumab |
Comparators |
|
Perspective | Canadian publicly funded health care payer |
Outcomes | QALYs, LYs |
Time horizon | Lifetime (37 years) |
Key data source | The target population (baseline characteristics) was based on pooled data from the phase III trials of brolucizumab, KITE and KESTREL. Comparative clinical efficacy data were derived from a sponsor-submitted NMA to inform change in BCVA, treatment discontinuation, and adverse event rates. A combination of data from clinical trials and a retrospective cohort study was used to inform the frequency of administration. |
Submitted results | The ICER for brolucizumab vs. bevacizumab was $60,021 (incremental costs: $31,353; incremental QALYs: 0.52). Brolucizumab was less costly and less effective than aflibercept (incremental costs = −$7,948; incremental QALYs = −0.0002), while ranibizumab was dominated (more costly, less effective) by brolucizumab. |
Key limitations | The comparative clinical efficacy and safety of brolucizumab is uncertain, as a result of heterogeneity in the sponsor’s NMA. The survival benefit predicted for brolucizumab is highly uncertain. The relative frequency of administration of brolucizumab and comparators is uncertain. Drug acquisition costs for bevacizumab may be overestimated. Health state utility values are uncertain and likely overestimated. The sponsor’s model did not adhere to best practices, including assuming that the injection frequency of each anti-VEGF drug is fixed and that the anti-VEGF unit prices are variable. |
CADTH reanalysis results | In the CADTH reanalysis, CADTH assumed that each vial of bevacizumab would be used for 30 doses, that the injection frequency of each anti-VEGF drug is variable, and that drug unit costs are fixed. CADTH was unable to correct for limitations such as the lack of robust comparative data, uncertain survival benefit, uncertain administration frequency, and uncertain health state utility values. Results of the CADTH reanalysis were consistent with those submitted by the sponsor. The sequential ICER for brolucizumab compared with bevacizumab, which was based on the results of the sponsor’s NMA and estimated injection frequency, was $61,621 per QALY gained (incremental costs: $31,899; incremental QALYs: 0.52). Under these assumptions, a 20% price reduction would be required for brolucizumab to be cost-effective compared with bevacizumab at a willingness-to-pay threshold of $50,000 per QALY. Given that these results are predicated on improved efficacy and reduced injection frequency with brolucizumab relative to comparators, these findings are highly uncertain, and a higher price reduction may be required. In scenario analyses that assumed equal efficacy, discontinuations, and injection frequency across treatments, brolucizumab was more costly (incremental costs: $37,413) than bevacizumab. Absence of robust data means there is no evidence to justify a price premium for brolucizumab over other anti-VEGF drugs for the treatment of DME. To ensure cost-effectiveness, brolucizumab should be priced no more per administration than the lowest-cost comparator used to treat DME that is funded. |
BCVA = best-corrected visual acuity; DME = diabetic macular edema; ICER = incremental cost-effectiveness ratio; LY = life-year; NMA = network meta-analysis; QALY = quality-adjusted life-year; VEGF = vascular endothelial growth factor.
Conclusions
Based on the CADTH Clinical Review, data from the KITE and KESTREL trials suggest that brolucizumab is noninferior to aflibercept (administered every 8 weeks) in terms of the mean change in best-corrected visual acuity (BCVA) from baseline after 1 year of treatment, with similar results found in year 2. The results for other outcomes (i.e., other BCVA outcomes, anatomical outcomes, vision-related function, health-related quality of life) did not contradict the primary end point findings; however, firm conclusions on the relative efficacy of brolucizumab versus aflibercept cannot be drawn due to a lack of noninferiority margin for secondary outcomes and a lack of adjustment for multiple testing. The results of the sponsor’s network meta-analysis (NMA) suggest that the mean difference in BCVA at year 1 and year 2 may be numerically improved with brolucizumab relative to bevacizumab and ranibizumab; however, these results were not statistically significant, indicating there may be no difference between brolucizumab and other anti–vascular endothelial growth factor (VEGF) drugs. As noted in the CADTH Clinical Review, the presence of heterogeneity in study design and patient characteristics limits the conclusions that can be drawn from the sponsor’s NMA.
CADTH undertook a reanalysis to assess the cost-effectiveness of brolucizumab relative to other anti-VEGF drugs, utilizing comparative effectiveness estimates from the sponsor’s NMA. This reanalysis addressed some limitations in the sponsor’s submission, including assuming that a higher number of bevacizumab doses would be drawn from each vial, the injection frequency of anti-VEGF drugs is variable, and the unit costs of anti-VEGF drugs are fixed. However, CADTH was unable to address limitations such as the lack of robust comparative clinical data, uncertain survival benefit, uncertain relative administration frequency, and uncertain health state utility values. As such, although the results of the CADTH reanalysis were in line with those submitted by the sponsor, these results should be considered uncertain owing to the limitations that could not be addressed. In CADTH’s sequential reanalyses, brolucizumab was not a cost-effective treatment for diabetic macular edema (DME) at a willingness-to-pay (WTP) threshold of $50,000 per quality-adjusted life-year (QALY). Brolucizumab was more costly and more effective than bevacizumab (incremental costs, $31,899; incremental QALYs, 0.52), resulting in an incremental cost-effectiveness ratio (ICER) of $61,621 per QALY. In CADTH’s reanalysis, a price reduction of 20% would be required for brolucizumab to be considered cost-effective compared with bevacizumab at a WTP threshold of $50,000 per QALY. These results, however, are based on the sponsor’s NMA and predicted frequency of administration with brolucizumab compared with other anti-VEGF drugs; as noted earlier, the CADTH Clinical Review was unable to draw conclusions on these outcomes.
The cost-effectiveness of brolucizumab relative to other anti-VEGF drugs is highly uncertain owing to a lack of robust comparative data, and there is insufficient evidence to suggest that brolucizumab should be priced higher than other anti-VEGF drugs for DME. It is uncertain whether, in clinical practice, brolucizumab will result in improved clinical outcomes (improved BCVA, reduced mortality, improved quality of life) or fewer administrations per year compared with other anti-VEGF drugs. Thus, to ensure cost-effectiveness, brolucizumab should be priced no more per administration than the lowest-cost anti-VEGF comparator that is funded.
Stakeholder Input Relevant to the Economic Review
This section is a summary of the feedback received from the patient groups, registered clinicians, and drug plans that participated in the CADTH review process.
Patient input was provided as a joint submission from 5 groups: Fighting Blindness Canada, Canadian Council of the Blind, Canadian National Institute for the Blind, Vision Loss Rehabilitation Canada, and Diabetes Canada. A total of 67 people living in Canada responded to a 2020 survey conducted by the submitting organizations. The mean age of the patients who responded was 57 years, and the majority reported having DME or diabetic retinopathy (DR) in both eyes. Respondents emphasized that DR and DME have substantial and life-altering impacts on daily life in areas such as reading, driving, and using a phone. In addition to concern for their eyesight worsening, coping with everyday life and general safety when outside of the home were identified as notable concerns by respondents. The submitting organizations emphasized the need for less invasive therapies, or similarly invasive therapies that could be administered less frequently. The majority of survey respondents indicated they were currently receiving injections for DR or DME, including Lucentis (ranibizumab), Eylea (aflibercept), Avastin (bevacizumab), and Ozurdex (dexamethasone implants). Most reported being satisfied with their injections and indicated the injections had helped them avoid losing more eyesight. About one-third of respondents reported missing injections in the previous year due to being too busy, feeling unwell, being unable to find someone to take them to the appointment, and fear of injections. Respondents indicated that the most difficult parts of eye injection appointments were long wait times, finding someone to take them to appointments, fear and anxiety about the injections, and taking time off work. No respondents had experience with brolucizumab.
No clinician group input was received for this review.
Drug plan input indicated that bevacizumab is commonly used off-label for DME and that faricimab is currently under review by CADTH for the treatment of DME. The plans noted that while the sponsor’s analysis suggests that brolucizumab may be cost-saving in jurisdictions that do not fund bevacizumab for DME, these savings will depend on the relative frequency of injections and are unlikely to be realized once biosimilar versions of ranibizumab and aflibercept become available. The plans also noted that in some jurisdictions, anti-VEGF therapies are funded through specialized retinal treatment programs.
Several of these concerns were addressed in the sponsor’s model:
The frequency of injections with each comparator was considered in the model.
Bevacizumab was included as a comparator in the pharmacoeconomic evaluation; however, the sponsor assumed in the budget impact analysis (BIA) that bevacizumab would have zero market share.
In addition, CADTH addressed some of these concerns as follows:
Biosimilar pricing for anti-VEGF drugs was considered by CADTH in scenario analyses.
CADTH was unable to address the following concerns raised from stakeholder input:
Faricimab was not considered as a comparator in the budget impact or economic analyses.
CADTH was unable to fully consider bevacizumab as a comparator in the BIA owing to the structure of the sponsor’s model and a lack of data about market share for bevacizumab.
Economic Review
The current review is for brolucizumab (Beovu) for the treatment of DME.
Economic Evaluation
Summary of Sponsor’s Economic Evaluation
Overview
The sponsor submitted a cost-utility analysis assessing brolucizumab, an anti-VEGF, compared with other anti-VEGF inhibitors in patients with DME.1 The modelled population was consistent with the KITE and KESTREL clinical trials2-4 for brolucizumab and is aligned with the reimbursement request and the Health Canada indication.5
Brolucizumab is available in single-use prefilled syringes containing 19.8 mg of brolucizumab in 0.165 mL of solution.5 The recommended dose of brolucizumab is 6 mg (0.05 mL) administered by intravitreal injection every 6 weeks for the first 5 doses. Thereafter, treatment may be individualized based on disease activity as assessed by visual acuity and/or anatomical parameters.5 In patients without disease activity, treatment up to every 12 weeks may be considered, while in patients with disease activity, treatment every 8 weeks may be considered; however, the treatment interval should not be less than 8 weeks. The submitted price of brolucizumab is $1,390.00 per prefilled syringe. The sponsor calculated the annual per-patient cost for brolucizumab to be $9,606 in the first year (based on 6.91 injections), $5,714 in the second year (based on 4.11 injections), and $4,170 in the third through fifth years (based on 3 injections).6,7 Comparators included aflibercept 2 mg, ranibizumab 0.5 mg, and off-label bevacizumab 1.25 mg, with injection frequencies derived from the sponsor’s internal analysis of data from a retrospective cohort study for aflibercept and ranibizumab,8 and a ratio from a randomized trial applied for bevacizumab relative to aflibercept’s frequency of use.9 These costs were based on the assumption that all vials were single-use and that any unused product would be wasted, with the exception of bevacizumab, where the sponsor assumed that 15 doses (1.25 mg each) could be obtained from each 100 mg vial. The number of injections and drug acquisition costs per year associated with each comparator are described in Table 11.
The clinical outcomes of interest were QALYs and life-years over a lifetime horizon (37 years). Discounting of 1.5% per annum was applied to both costs and outcomes with a half-cycle correction. The base-case perspective was that of the Canadian publicly funded health care system.
Model Structure
The sponsor submitted a Markov model1 consisting of 8 health states defined by visual acuity based on the following Early Treatment Diabetic Retinopathy Study (ETDRS) BCVA letter scores (Figure 1): greater than 85 letters, 76 to 85 letters, 66 to 75 letters, 56 to 65 letters, 46 to 55 letters, 36 to 45 letters, 26 to 35 letters, and 25 letters or fewer, plus an absorbing death state. Patients whose best-seeing eye had a visual acuity of 65 or fewer letters were considered visually impaired, while those whose vision in their best-seeing eye was 35 or fewer letters were considered legally blind. As each eye could be in any of the 8 BCVA-based states, there are 64 possible health states. All patients entered the model receiving DME treatment in at least 1 eye, and a proportion of patients were assumed to have bilateral DME at baseline. In each 1-year model cycle, patients’ visual acuity could remain stable, improve by 1 or 2 health states, or worsen by 1 or 2 health states. Patients who entered the model with DME in only 1 eye were at risk of developing DME in their second eye and were assumed to start treatment in the second eye if they were still receiving therapy for their initial eye. In each cycle, patients were at risk of discontinuing treatment, and those who discontinued treatment were assumed to discontinue treatment in both eyes (i.e., for patients with bilateral DME or who later developed it) (Figure 2). Patients were assumed to receive treatment for a maximum of 5 years per eye (e.g., a patient who started treatment for DME in the second eye in year 3 could continue treatment in that eye until year 8), after which time they received no additional treatment for DME.
Model Inputs
Baseline patient characteristics in the model were based on pooled data from the KITE and KESTREL clinical trials (63 years of age, 64% male), which enrolled patients with centre-involved DME with a study eye BCVA score of between 23 and 78 ETDRS letters and with a hemoglobin A1C level of 10% or less.2-4 The baseline distribution of patients across visual acuity health states (Table 11) was similarly based on a pooled analysis of the KITE and KESTREL trials. At baseline, 12.7% of patients were estimated to have bilateral DME, based on the VIVID and VISTA aflibercept trials, as the KITE and KESTREL trials did not report baseline bilateral DME.10 For patients with single-eye DME at baseline, the probability of developing second-eye DME was 38.2% in the first year and 14% for years 2 through 5, based on observations from the aflibercept VIVID and VISTA trials.10 The sponsor assumed that all patients who developed bilateral DME would initiate treatment in the second eye if they were still receiving treatment for their first eye.
Clinical efficacy and safety inputs for the model (i.e., change in BCVA score, discontinuation rates, and rates of adverse events [AEs]) were derived from a sponsor-submitted NMA.11 Injection frequency was derived from the KITE and KESTREL trials for brolucizumab and an internal analysis of patients who were followed for at least 24 months in the UK Medisoft retrospective cohort study8 for aflibercept and ranibizumab (analysis not provided). The sponsor estimated the frequency of bevacizumab injections by calculating the ratio of bevacizumab to aflibercept injections as reported in Wells et al. (2016)9 and applying that ratio to the frequency of aflibercept injections observed in the sponsor’s analysis of the UK Medisoft data.8
Transition probabilities for movement between model health states were derived from the sponsor’s NMA.11 To estimate the probability of gaining or losing a particular number of ETDRS letters in either year 1 or year 2, change in BCVA was assumed to follow a normal distribution, and cut-offs were used to estimate the probability of improving or worsening by 0, 1, or 2 health states. In this way, the sponsor assumed that a gain or loss of 15 letters or more would result in a move of 2 health states (i.e., either an improvement or worsening of 2 states); a gain or loss of 5 to 14 letters resulted in a move of 1 health state, and a gain or loss of fewer than 5 letters resulted in patients remaining in their current health state. Year 2 efficacy was assumed to be maintained for the remaining duration of treatment. The annual probability of discontinuation was assumed to be constant over time and was derived from the submitted NMA (10.7% for brolucizumab, 8.7% for aflibercept, 5.3% for ranibizumab, and 5.8% for bevacizumab).1 Patients who discontinued treatment were assumed to experience natural progression of DME, based on the sham-arm estimates from the NMA.
Age- and gender-specific mortality rates were based on general population data from Statistics Canada.12 The sponsor applied a diabetes-specific mortality multiplier of 1.9513 to the entire modelled population and additional multipliers of 1.23 or 1.54, where both eyes are visually impaired or legally blind, respectively.14 Rates of AEs were derived from the sponsor’s NMA. AEs included cataract, endophthalmitis, intraocular inflammation, gastrointestinal events, retinal detachment, retinal pigment epithelial tear, retinal tear, and stroke.
Utility values for each visual acuity–based health state were derived from a published regression analysis15 of a bilateral vision loss utility study where healthy people were given custom contact lenses to simulate the visual impairment associated with neovascular age-related macular degeneration (nAMD).16 Using this information, the sponsor calculated utility values for each combination of visual acuity states in the study and fellow eye.1 Disutilities associated with AEs were considered in the base case and obtained from published sources.1 No disutility was associated with intravitreal injections in the base case.
Costs included those related to drug acquisition, administration, AEs, disease management (i.e., visits to health care providers, monitoring), and costs associated with vision loss. Drug acquisition costs for brolucizumab were based on the sponsor’s submitted price1 and consistent with formulary list pricing for the nAMD indication.6 Acquisition costs were based on Ontario Drug Benefit Formulary list prices6 for ranibizumab and aflibercept and on the IQVIA DeltaPA wholesale price for bevacizumab17 assuming 15 doses (1.25 mg each) per 100 mg vial. Administration costs include ophthalmologist and technician time as well as injection fees and monitoring costs, including the use of fundus fluorescein angiography and optical coherence tomography, all based on the Ontario Schedule of Benefits for Physician Services.18 When treatment was bilateral, monitoring costs were unchanged, administration costs were increased by 1.85 times (based on expert opinion obtained by the sponsor), and drug acquisition costs were doubled. Costs associated with AEs were derived from the Ontario Case Costing Initiative19 or the Schedule of Benefits for Physicians Services. The cost of visual impairment (best-seeing eye BCVA of < 60 letters) or blindness (best-seeing eye BCVA of < 35 letters) was assumed to be 25% of the cost per patient with DR that was reported in a 2007 Canadian costing study,20,21 as elements of that cost overlapped with those already incorporated into the model, such as retinal specialist visits and treatment. All costs were inflated to 2022 Canadian dollars, if required.
Summary of Sponsor’s Economic Evaluation Results
The sponsor’s probabilistic findings were based on 2,000 iterations and are presented subsequently. Deterministic results were similar, although the deterministic results differed from the probabilistic results in that aflibercept was dominated by brolucizumab. Due to very small differences in QALYs between aflibercept and brolucizumab, the results of the sponsor’s sequential analyses were not stable between model runs.
The sponsor presented 2 base cases, 1 that included only comparators indicated for the treatment of DME and 1 that additionally included off-label use of bevacizumab. Given that bevacizumab is a relevant comparator for this indication based on clinical expert and drug plan input, the results presented subsequently pertain to the sponsor’s analyses that included bevacizumab.
Base-Case Results
In the sponsor’s base case, brolucizumab was associated with an estimated cost of $43,599 and 9.565 QALYs over a lifetime horizon (Table 3). In sequential analysis, brolucizumab was associated with an ICER of $60,021 compared with bevacizumab (incremental cost: $31,353; incremental QALYs: 0.52). Brolucizumab was less effective (incremental QALYs of 0.0002) and less costly ($7,948) than aflibercept; however, CADTH notes that the results of the sponsor’s probabilistic analysis were not stable with respect to the relationship between brolucizumab and aflibercept owing to very small QALY differences between the 2 drugs.
In the sequential analysis, brolucizumab had a 34% probability of being the most cost-effective option at a WTP threshold of $50,000 per QALY. The results of the sponsor’s analysis were driven by the increased drug acquisition costs associated with brolucizumab compared with bevacizumab (incremental cost: $31,353) (Table 12), the small differences in predicted QALYs between brolucizumab and aflibercept (incremental QALYs: 0.0002) (Table 3), and a predicted survival benefit for brolucizumab relative to bevacizumab (incremental life-years: 0.14) (Table 12). More than 87% to 98% of incremental QALYs were gained in the extrapolated portion of the model (i.e., after the first 2 years, as observed in the KITE and KESTREL trials), depending on the comparator. At the end of the 37-year time horizon, less than 0.05% of patients remained alive for all comparators.
Additional results from the sponsor’s submitted economic evaluation are available in Appendix 3.
Table 3: Summary of the Sponsor’s Economic Evaluation Results
Drug | Total costs ($) | Total QALYs | Sequential ICER ($/QALY) |
|---|---|---|---|
Bevacizumab | 12,246 | 9.0426 | Reference |
Brolucizumab | 43,599 | 9.5650 | 60,021 vs. bevacizumab |
Aflibercept | 51,548 | 9.5652 | 33,071,888a vs. brolucizumab |
Ranibizumab | 59,280 | 9.3422 | Dominated by brolucizumab and aflibercept |
ICER = incremental cost-effectiveness ratio; QALY = quality-adjusted life-year.
Note: The submitted analyses are based on the publicly available prices of comparators and may not reflect confidential, negotiated prices.
aDue to very small QALY differences, the ICER for aflibercept compared with brolucizumab was not stable.
Source: Sponsor’s pharmacoeconomic submission.1
Sensitivity and Scenario Analysis Results
The sponsor conducted several scenario analyses, including adopting an alternative time horizon and discount rates, as well as alternative assumptions related to injection-related disutility, long-term efficacy, treatment discontinuation, AE rates, mortality, injection frequency, and biosimilar drug acquisition costs for bevacizumab and ranibizumab. The ICER for brolucizumab compared with bevacizumab in these scenarios ranged from $52,887 to $363,883 per QALY. A shortened horizon of 5 years (ICER versus bevacizumab = $363,883 per QALY) and the assumption that efficacy would be maintained long-term (ICER versus bevacizumab = $145,304 per QALY) had the greatest impact on the ICER.
CADTH Appraisal of the Sponsor’s Economic Evaluation
CADTH identified several key limitations to the sponsor’s analysis that have notable implications on the economic analysis:
The comparative effectiveness and safety of brolucizumab is uncertain: The relative effectiveness and safety of brolucizumab is uncertain, as there have been no head-to-head trials of brolucizumab versus anti-VEGF drugs other than aflibercept. The results of the KITE and KESTREL trials suggest that brolucizumab is noninferior compared with aflibercept for improvement in visual acuity (i.e., change from baseline in BCVA). In the absence of head-to-head evidence for most comparators, the sponsor conducted an NMA11 to inform various parameters in the pharmacoeconomic model (e.g., change in BCVA score, discontinuation, rate of AEs) for all anti-VEGF drugs. The results of the sponsor’s NMA suggest that the mean difference in BCVA change from baseline at years 1 and 2 may be improved with brolucizumab compared with bevacizumab and ranibizumab, which has not been shown in clinical trials. While the point estimates suggest that brolucizumab may be favourable compared with bevacizumab and ranibizumab, the credible intervals for these estimates include the null value (i.e., the difference between treatments is not statistically significant), suggesting that none of the treatments are favoured. CADTH additionally notes that comparisons from the sponsor’s NMA regarding disease severity and discontinuation rates were also imprecise and associated with substantial uncertainty. Further, as noted in the CADTH Clinical Review, the sponsor’s NMA was limited by significant heterogeneity across the included randomized controlled trials in terms of study design and patient characteristics, which affects the interpretation of results.
Given the lack of head-to-head evidence for brolucizumab relative to anti-VEGF drugs other than aflibercept and limitations with the sponsor’s NMA, it is uncertain whether brolucizumab provides a net benefit above any comparator. The CADTH base case incorporates estimates from the sponsor’s NMAs that are subject to the limitations noted earlier. In scenario analyses, CADTH explored the impact of assuming equal efficacy and treatment discontinuation among all anti-VEGF drugs.
The survival benefit predicted for brolucizumab is highly uncertain: The sponsor’s base case predicts a survival advantage with brolucizumab relative to bevacizumab and ranibizumab (Table 12), which has not been shown in clinical trials. Based on CADTH’s exploration of the sponsor’s model, this survival benefit is driven by the use of the point estimates reported in the sponsor’s NMA for the change in BCVA for each anti-VEGF comparator, which numerically favoured brolucizumab over ranibizumab and bevacizumab; however, the sponsor’s estimates were associated with wide credible intervals that included the null value. As noted earlier, there are limitations with the sponsor’s NMA, including heterogeneity in the study design and patient characteristics, that limit the conclusions that can be drawn from the NMA.
In scenario analyses in which equal efficacy and treatment discontinuation among anti-VEGF comparators were assumed, the sponsor’s model no longer predicts a survival benefit with brolucizumab (Table 15).
The relative frequency of anti-VEGF injections is uncertain: In the pharmacoeconomic model, the sponsor used a combination of trial data and observational data to estimate the injection frequency for each anti-VEGF drug. For brolucizumab, the injection frequency in year 1 and year 2 was based on observations from the KITE and KESTREL trials.4 For aflibercept and ranibizumab, the injection frequency in year 1 and year 2 was based on the sponsor’s internal analysis of a retrospective cohort study conducted at 3 sites in the UK between 2010 and 2018.8 The injection frequency of bevacizumab was estimated by the sponsor by applying the ratio of injections identified in another trial9 to the number of aflibercept injections in the UK retrospective cohort study. For all anti-VEGF drugs, the sponsor assumed that 3 injections would be received per year from year 3 onward.
There is considerable uncertainty associated with these estimates. First, it is uncertain whether the injection frequencies observed from 2010 to 2018 at 3 UK sites are applicable to current practice in Canada. Second, the use of both clinical trial and observational data adds additional uncertainty to the relative injection frequency, as it is unclear what would occur if all comparators were used in the same population in clinical practice. Finally, the sponsor’s model assumed that the number of injections was fixed, without incorporating uncertainty around the estimated means. This is inappropriate because sizable standard deviations (SDs) were noted in all data sources used to estimate the frequency of injections.2,3,8 For example, regarding the number of injections per eye reported in the UK retrospective cohort study, the SDs that were reported were 24.6% and 39.3% of the mean number of injections in years 1 and 2, respectively, i.e., a year 1 mean of 7.7 anti-VEGF injections (SD = 1.9) and a year 2 mean of 5.6 injections (SD = 2.2). Thus, it is uncertain whether brolucizumab will result in fewer injections compared with other anti-VEGF drugs in clinical practice in Canada. The sponsor also conducted treatment regimen–based pooling of clinical trial data to compare the administration frequency of brolucizumab with other anti-VEGF drugs; however, as noted earlier, there was a high degree of heterogeneity between trial designs, with some trials featuring fixed treatment intervals of varying length and others allowing as-needed (i.e., pro re nata) dosing. The clinical expert input obtained by CADTH for this review indicated that all anti-VEGF therapies would be administered following a treat-and-extend approach rather than using fixed intervals or an as-needed approach, with the injection frequency based on the patient’s response to therapy.
In the base case, CADTH incorporated uncertainty into administration frequency by assuming SDs proportional to those reported in the UK retrospective cohort study for all comparators in years 1 and 2. CADTH explored the impact of assuming equal injection frequency for all treatments in scenario analyses.
Drug acquisition costs of bevacizumab may be overestimated: The sponsor assumed that 15 doses of bevacizumab (1.25 mg each) would be obtained from each 100 mg vial, consistent with a 2016 review of anti-VEGF therapies conducted by CADTH.22 However, the drug plan and clinical expert input provided for more recent reviews23,24 has indicated this may be an underestimate and that approximately 30 doses may be obtained per 100 mg vial. CADTH notes that a biosimilar bevacizumab product (Mvasi) is now available in Canada at a reduced price compared with the originator brand (Avastin) (Table 8).
In the CADTH base case, a 100 mg vial of bevacizumab was assumed to be used for 30 doses (1.25 mg each). Consistent with the sponsor’s assumption, CADTH adopted the unit price of Avastin in the base case and explored the impact of biosimilar pricing for bevacizumab in scenario analyses.
Utility values are overestimated and their applicability to DME is uncertain: The sponsor incorporated utility values derived from a regression analysis by Hodgson (2017)15 based on Czoski-Murray et al. (2009),16 a bilateral vision loss utility study where healthy people were given custom contact lenses to simulate the visual impairment associated with nAMD. The applicability of these utility values to patients with DME is unknown. Further, the resulting utility values from this analysis ranged from 0.901 (for patients whose BCVA is greater than 85 ETDRS letters in both eyes) to 0.365 (for patients with a BCVA of 25 or fewer letters in both eyes). This lacks face validity, as the general mean utility value for people in Canada aged 60 to 64 years is 0.842.25 Additionally, although health-related utility declines with age,25,26 the utilities adopted by the sponsor were based solely on visual acuity, which may further overestimate utility, and thus treatment effect, in later years of the model. Finally, the model incorporated lower utility values for patients whose study eye had lower visual acuity than their fellow eye compared with the opposite (e.g., a patient who can read 26 to 35 letters with their study eye and 76 to 85 letters with their fellow eye would have a utility of 0.636, while a patient who can read 76 to 85 letters with their study eye and 26 to 35 letters with their fellow eye would have a utility of 0.667). This difference in utility depending on the affected eye lacks face validity. The clinical expert feedback obtained by CADTH noted that quality-of-life changes associated with vision loss may vary, depending on whether a patient’s dominant or nondominant eye is most affected; however, it is unclear whether study eye versus fellow eye would have a similar effect.
The sponsor did not include disutility for intravitreal injection in the base case. This is likely a conservative assumption, given the patient input received by CADTH indicated that intravitreal injections are associated with fear and anxiety.
CADTH was unable to fully address this uncertainty in reanalyses owing to a lack of more plausible utility values. CADTH could only explore the impact of disutility associated with intravitreal injection in scenario analyses.
Poor modelling practices were employed: The sponsor’s submitted model included numerous IFERROR statements, which led to situations in which the parameter value could be overwritten with an alternative value without alerting the user. The systematic use of IFERROR statements makes thorough auditing of the sponsor’s model impractical, as it remains unclear whether the model is running inappropriately by overriding errors.
Additionally, parameter uncertainty was not adequately incorporated in the sponsor’s model. As noted earlier, the sponsor assumed the injection frequency for each anti-VEGF drug was fixed, despite contradictory evidence from clinical trials and observational studies. Further, the sponsor assumed that the unit cost of all anti-VEGF comparators was variable, following a gamma distribution with an SD of 10% of the mean. However, there is no uncertainty in the submitted price of brolucizumab. CADTH notes that, although there is uncertainty in the costs paid by public plans for the comparator anti-VEGFs, as the plans may have negotiated discounts or rebates, these costs will not be greater than the publicly available list prices and, thus, the cost of comparators is poorly represented by a gamma distribution around the list prices.
CADTH was unable to address limitations related to the sponsor’s use of IFERROR statements and notes that a thorough validation of the sponsor’s model was not possible. In reanalyses, CADTH incorporated uncertainty into the administration frequency for all anti-VEGF drugs, as described earlier, and adopted a fixed unit price for each anti-VEGF based on the sponsor’s submitted price for brolucizumab and the publicly available list prices for comparators.
Additionally, the following key assumptions were made by the sponsor and have been appraised by CADTH (Table 4).
Table 4: Key Assumptions of the Submitted Economic Evaluation (Not Noted as Limitations to the Submission)
Sponsor’s key assumption | CADTH comment |
|---|---|
37 years represents a lifetime time horizon. | Acceptable. The mean patient starting age was 63 years; the CADTH-obtained clinical expert feedback considered this reasonable. More than 99.9% of modelled patients were deceased by model year 37. |
The demographic distribution of participants in the KITE and KESTREL trial populations can be generalized to patients in Canada with DME. | Inappropriate. The proportions of patients with DME have been shown to be approximately equal between men and women in Canada,27 and men have been shown to be overrepresented in clinical trials for DME, which also appears true of the KITE and KESTREL trials. While race and ethnicity are not explicitly modelled, the underrepresentation of Black and Indigenous patients in clinical trials also limits generalizability to the general population in Canada.27,28 However, because the absence of race or ethnicity as a model input and gender only affects modelled longevity and not treatment effect or utility, changes in these assumptions would not be expected to substantially alter modelled results. |
A 1-year cycle length is appropriate. | Uncertain. The previous review of brolucizumab for nAMD noted that a 1-year cycle length was too long to capture changes in treatment benefit or the emergence of AEs likely to occur over a shorter duration.29 However, the clinical expert feedback obtained by CADTH for the current review of brolucizumab for the treatment of DME indicated this may be less of a concern in DME than nAMD. |
Mortality was based on Statistics Canada data for the age- and gender-specific general population, with increased mortality rates applied for diabetes, diabetic edema, and visual impairment and blindness. | The magnitude of the mortality multipliers applied by the sponsor is uncertain. To the general population mortality,12 the sponsor applied a mortality HR for visual impairment (BCVA of 36 to 65 letters; HR = 1.23) and legal blindness (BCVA of ≤ 35 letters; HR = 1.54) based on the findings of a generalized linear structural equation model by Christ et al. (2008).14 It is unclear whether “some” or “severe” visual impairment as self-reported by patients in this publication were reflective of the BCVA cut-offs selected by the sponsor. Further, the study population had a mean age of 44 years, substantially younger than participants in the KITE and KESTREL trials (mean age of 63 years). Finally, current patient management and care may have improved mortality since the survey was conducted (1986 to 1996). |
DME progression was assumed to be independent between eyes. | Uncertain. While there may be some correlation in disease progression between eyes, the clinical expert consulted by CADTH considered this a reasonable simplifying assumption. |
The proportion of patients with bilateral DME was assumed to be 12.7%. | Uncertain. The KITE and KESTREL trials did not report the proportion of patients with bilateral DME at baseline. To inform the pharmacoeconomic model, the sponsor assumed that 12.7% of patients will have bilateral DME based on the baseline data from the VIVID and VISTA aflibercept trials.10 The clinical expert feedback obtained by CADTH indicated this may underestimate the proportion of bilateral DME in clinical practice in Canada, which may be approximately 30%. In scenario analyses, CADTH assumed that 27% of patients have bilateral DME, based on observational data from the UK.8 This scenario did not have a substantial impact on the ICER. |
The maximum anti-VEGF treatment duration assumed per eye was 5 years based on the resolving nature of DME. | Acceptable, according to clinical expert feedback elicited by CADTH. |
Patients who develop DME in their second eye would begin treatment if the first eye were still being treated. | Uncertain. The clinical expert input received by CADTH for this review indicated this would vary by patient, although patients would generally receive treatment in their second eye if visual acuity began to decline. |
The sponsor adopted rates of AEs for bevacizumab from their NMA. | Uncertain. The sponsor’s NMA reports an unexpectedly low rate of AEs associated with bevacizumab. Utilizing these AE rates is a conservative assumption. |
AE = adverse event; BCVA = best-corrected visual acuity; DME = diabetic macular edema; HR = hazard ratio; ICER = incremental cost-effectiveness ratio; nAMD = neovascular age-related macular degeneration; NMA = network meta-analysis; VEGF = vascular endothelial growth factor.
CADTH Reanalyses of the Economic Evaluation
Reanalysis Results
CADTH undertook reanalyses that addressed some of the limitations within the sponsor’s model, as summarized in Table 5. CADTH was unable to address limitations related to the lack of robust comparative clinical data, uncertain survival benefit, uncertain relative administration frequency, and uncertain health state utility values. In light of these remaining limitations, CADTH conducted an exploratory reanalysis. All CADTH probabilistic reanalyses were based on 2,000 iterations. Summarized results are presented in Table 6; disaggregated results are presented in Table 13.
Table 5: CADTH Revisions to the Submitted Economic Evaluation
Stepped analysis | Sponsor’s value or assumption | CADTH value or assumption |
|---|---|---|
Changes to derive the CADTH reanalysis | ||
1. Number of administrations of bevacizumab per vial | 15 administrations (1.25 mg each) per 100 mg vial | 30 administrations (1.25 mg each) per 100 mg vial |
2. Probabilistic variation |
|
|
CADTH combined reanalysis | 1 + 2 | |
SD = standard deviation; VEGF = vascular endothelial growth factor.
aThe SDs for years 1 and 2 were based on those reported by Peto et al. (2022)8 in the first and second year of therapy relative to their means and applied to all comparators. This publication did not report data by individual anti-VEGF product.
Table 6: Summary of the Stepped Analysis of the CADTH Reanalysis Results
Stepped analysis | Drug | Total costs ($) | Total QALYs | Sequential ICER ($/QALY) |
|---|---|---|---|---|
Sponsor’s base case | Bevacizumab | 12,246 | 9.0426 | Reference |
Brolucizumab | 43,599 | 9.5650 | 60,021 vs. bevacizumab | |
Aflibercept | 51,548 | 9.5652 | 33,071,888a vs. brolucizumab | |
CADTH reanalysis 1 | Bevacizumab | 11,665 | 9.1021 | Reference |
Brolucizumab | 43,561 | 9.5988 | 64,208 vs. bevacizumab | |
Aflibercept | 51,517 | 9.6046 | 1,382,975a vs. brolucizumab | |
CADTH reanalysis 2 | Bevacizumab | 12,211 | 9.0909 | Reference |
Brolucizumab | 43,555 | 9.6027 | 61,246 vs. bevacizumab | |
Aflibercept | 51,514 | 9.5982 | Dominated by brolucizumaba | |
CADTH combined reanalysis (1 + 2) | Bevacizumab | 11,671 | 9.0548 | Reference |
Brolucizumab | 43,570 | 9.5724 | 61,621 vs. bevacizumab | |
Aflibercept | 51,561 | 9.5772 | 1,666,116a vs. brolucizumab |
ICER = incremental cost-effectiveness ratio; QALY = quality-adjusted life-year.
Note: All analyses were probabilistic. Ranibizumab was dominated in all stepped analyses.
aDue to very small QALY differences, the ICER for aflibercept compared with brolucizumab was not stable.
The results of the CADTH reanalysis were consistent with those submitted by the sponsor: brolucizumab was associated with higher costs and QALYs compared with bevacizumab (Table 13). In the sequential analysis, brolucizumab was associated with an ICER of $61,621 per QALY compared with bevacizumab (incremental costs: $31,899; incremental QALYs: 0.52). Brolucizumab was dominant over ranibizumab (less costly and associated with more QALYs). While the results showed that brolucizumab was less effective (incremental QALYs: 0.0048) and less costly ($7,992) than aflibercept (ICER: $1,666,116), in the CADTH reanalysis, these results were not stable between model runs owing to very small QALY differences between the 2 drugs. In the CADTH reanalysis, brolucizumab had a 32% probability of being the most cost-effective option at a WTP threshold of $50,000 per QALY.
Scenario Analysis Results
CADTH undertook price-reduction analyses based on the sponsor’s base case and CADTH’s reanalysis. Based on the CADTH reanalysis, a price reduction of 20% would be required for brolucizumab to be considered the optimal treatment at a WTP threshold of $50,000 per QALY gained (Table 7).
Table 7: CADTH Price-Reduction Analyses
Analysis | ICERs for brolucizumab vs. comparators ($/QALY) | |
|---|---|---|
Price reduction | Sponsor base case | CADTH reanalysis |
No price reduction |
|
|
10% | ||
20% |
|
|
ICER = incremental cost-effectiveness ratio; QALY = quality-adjusted life-year; WTP = willingness to pay.
Note: Only nondominated comparators are presented. The table reports the most cost-effective option depending on the willingness-to-pay (WTP) threshold per QALY for each assumed percentage price reduction for brolucizumab relative to the submitted price. The term WTP has been used to denote that if a value is above, below or between the values stated, then the treatment stated is the optimal treatment based on that WTP value or range.
aThe ICER for aflibercept relative to brolucizumab is not stable owing to the small difference in QALYs between brolucizumab and aflibercept.
CADTH undertook several scenario analyses to determine the impact of alternative assumptions on the cost-effectiveness of brolucizumab in the base case:
The efficacy of all comparators was assumed to equal aflibercept in terms of mean change in BCVA, and all comparators were assumed to have the overall annual average discontinuation rate reported in the NMA (7.62%).
The injection frequency for all comparators was assumed equal to that of brolucizumab.
Efficacy, treatment discontinuation, and injection frequency were assumed to be equal for all comparators.
A disutility due to injection was included, using a sponsor-provided option to do so.
A higher proportion (27%) of patients were assumed to have bilateral DME at baseline.
Biosimilars were assumed to be available for bevacizumab, ranibizumab, and aflibercept. The unit cost of each was assumed to be 67% of the cost of the originator brands, based on the relationship between Avastin and Mvasi (originator and biosimilar for bevacizumab, respectively).
Efficacy, discontinuation, and injection frequency were assumed equal for all comparators, and biosimilars were assumed to be available for bevacizumab, ranibizumab, and aflibercept.
The results of these analyses are presented in Appendix 4 (Table 14). The scenarios involving equal efficacy and discontinuation of all comparators (with or without also assuming equal administration frequency) resulted in brolucizumab being dominated by bevacizumab. In the scenario where equal administration frequency was assumed, the sequential ICER between brolucizumab and bevacizumab remained similar to the CADTH reanalysis at $66,172 per QALY gained, although the ICER between aflibercept and brolucizumab decreased. In the scenario where the drug acquisition cost of anti-VEGFs was reduced to reflect potential biosimilar pricing, brolucizumab was dominated by aflibercept (i.e., aflibercept was associated with higher incremental QALYs at a lower cost).
Issues for Consideration
Faricimab, an anti-VEGF inhibitor, recently received Health Canada approval for the treatment of DME30 and has received a positive draft recommendation from the CADTH Canadian Drug Expert Committee (CDEC).23 Due to the timing of the submission, faricimab was not included in the sponsor’s pharmacoeconomic analysis, and the cost-effectiveness of brolucizumab relative to faricimab is unknown.
Patients with a hemoglobin A1C greater than 10% were excluded from the KITE and KESTREL trials. Clinical expert feedback obtained by CADTH for this review indicated that, in clinical practice, brolucizumab would still be considered for these patients. Owing to a lack of clinical data, the cost-effectiveness of brolucizumab in patients with hemoglobin A1C above 10% is unknown.
A biosimilar for ranibizumab (Byooviz) was recently approved by Health Canada31 and a biosimilar version of aflibercept is currently under review by Health Canada.32 The reimbursement of these drugs may affect the cost-effectiveness of brolucizumab relative to aflibercept and ranibizumab. In a scenario analysis that assumed that biosimilars were available and reimbursed for bevacizumab, ranibizumab, and aflibercept, it was found that brolucizumab was dominated by aflibercept (i.e., aflibercept was associated with greater incremental QALYs at a lower cost).
CADTH’s analyses rely on publicly accessible list prices and do not reflect existing confidential prices negotiated by public plans. When existing confidential discounts for comparators are considered, greater price reductions for brolucizumab may be required to achieve cost-effectiveness. Given that brolucizumab has successfully undergone price negotiations (for treatment of nAMD)33 after a positive CDEC recommendation conditional on a price reduction,34 it is likely that the current unit cost paid by public drug plans for brolucizumab is lower than the submitted price.
Overall Conclusions
Based on the CADTH Clinical Review, data from the KITE and KESTREL trials suggest that brolucizumab is noninferior to aflibercept (administered every 8 weeks) in terms of the mean change in BCVA from baseline after 1 year of treatment, with similar results found in year 2. Results for other outcomes (i.e., other BCVA outcomes, anatomical outcomes, vision-related function, health-related quality of life) did not contradict the primary end point findings; however, firm conclusions on the relative efficacy of brolucizumab versus aflibercept cannot be drawn due to the lack of a noninferiority margin for secondary outcomes and a lack of adjustment for multiple testing. Results of the sponsor’s NMA suggest that the mean difference in BCVA at year 1 and year 2 may be numerically improved with brolucizumab relative to bevacizumab and ranibizumab; however, these results were not statistically significant, indicating there may be no difference between brolucizumab and other anti-VEGF drugs. As noted in the CADTH Clinical Review, the presence of heterogeneity in the study design and patient characteristics limits the conclusions that can be drawn from the sponsor’s NMA.
CADTH undertook a reanalysis to assess the cost-effectiveness of brolucizumab relative to other anti-VEGF drugs, utilizing comparative effectiveness estimates from the sponsor’s NMA. This reanalysis addressed some limitations in the sponsor’s submission, including assuming that a higher number of bevacizumab doses would be drawn from each vial, the injection frequency of anti-VEGF drugs is variable, and the unit costs of anti-VEGF drugs are fixed. However, CADTH was unable to address limitations, such as the lack of robust comparative clinical data, uncertain survival benefit, uncertain relative administration frequency, and uncertain health state utility values. As such, although the results of the CADTH reanalysis were in line with those submitted by the sponsor, these results should be considered uncertain owing to the limitations that could not be addressed. In CADTH’s sequential reanalyses, brolucizumab was not a cost-effective treatment for DME at a WTP threshold of $50,000 per QALY. Brolucizumab was more costly and more effective than bevacizumab (incremental costs: $31,899; incremental QALYs: 0.52), resulting in an ICER of $61,621 per QALY. In CADTH’s reanalysis, a price reduction of 20% would be required for brolucizumab to be considered cost-effective compared with bevacizumab at a WTP threshold of $50,000 per QALY. These results, however, are based on the sponsor’s NMA and predicted frequency of administration with brolucizumab compared with other anti-VEGF drugs; as noted earlier, the CADTH Clinical Review was unable to draw conclusions on these outcomes.
The cost-effectiveness of brolucizumab relative to other anti-VEGF drugs is highly uncertain owing to a lack of robust comparative data, and there is insufficient evidence to suggest that brolucizumab should be priced higher than other anti-VEGF drugs for DME. It is uncertain whether, in clinical practice, brolucizumab will result in improved clinical outcomes (improved BCVA, mortality, quality of life) or fewer administrations per year compared with other anti-VEGF drugs. Thus, to ensure cost-effectiveness, brolucizumab should be priced no more per administration than the lowest-cost anti-VEGF comparator that is funded.
References
1.Pharmacoeconomic evaluation [internal sponsor's report]. In: Drug Reimbursement Review sponsor submission: Beovu®(brolucizumab, single-use pre-filled syringe, 6 mg / 0.05 mL solution for intravitreal injection [internal sponsor's package]. Dorval (QC): Novartis Pharmaceuticals Canada Inc; 2022 Jun 30.
2.Clinical Study Report: CRTH258B2302. A two-year, two-arm, randomized, double masked, multicenter, phase III study assessing the efficacy and safety of brolucizumab versus aflibercept in adult patients with visual impairment due to diabetic macular edema (KITE) [internal sponsor's report]. City (PROV): Novartis; 2022.
3.Clinical Study Report: CRTH258B2301.A two-year, three-arm, randomized, double masked, multicenter, phase III study assessing the efficacy and safety of brolucizumab versus aflibercept in adult patients with visual impairment due to diabetic macular edema (KESTREL) [internal sponsor's report]. City (PROV): Novartis; 2022.
4.Brown DM, Emanuelli A, Bandello F, et al. KESTREL and KITE: 52-Week Results From Two Phase III Pivotal Trials of Brolucizumab for Diabetic Macular Edema. Am J Ophthalmol. 2022;238:157-172. PubMed
5.Beovu® brolucizumab injection Single-use pre-filled syringes 6 mg / 0.05 mL solution for intravitreal injection [product monograph]. Dorval (QC): Novartis Pharmaceuticals Canada Inc.; 2022 Apr 12.
6.Ontario Ministry of Health, Ontario Ministry of Long-Term Care. Ontario drug benefit formulary/comparative drug index. 2022; https://www.formulary.health.gov.on.ca/formulary/. Accessed 2022 Aug 08.
7.Saskatchewan Drug Plan: search formulary. 2022; https://formulary.drugplan.ehealthsask.ca/SearchFormulary. Accessed 2022 Aug 08.
8.Peto T, Akerele T, Sagkriotis A, Zappacosta S, Clemens A, Chakravarthy U. Treatment patterns and persistence rates with anti-vascular endothelial growth factor treatment for diabetic macular oedema in the UK: A real-world study. Diabet Med. 2022;39(4):e14746. PubMed
9.Wells JA, Glassman AR, Ayala AR, et al. Aflibercept, Bevacizumab, or Ranibizumab for Diabetic Macular Edema: Two-Year Results from a Comparative Effectiveness Randomized Clinical Trial. Ophthalmology. 2016;123(6):1351-1359. PubMed
10.Dhoot D. Incidence of New Diabetic Macular Edema in Fellow Eyes of Patients in the VISTA and VIVID studies. presented at: Retina Society 2020 VR meeting Sept 21 2020. . Santa Barbara CA (USA): California Retinal Consultants; 2020.
11.Brolucizumab for Diabetic Macular Edema: Network Meta-Analysis (Year 2 Data) [internal sponsor's report]. In: Drug Reimbursement Review sponsor submission: Beovu®(brolucizumab, single-use pre-filled syringe, 6 mg / 0.05 mL solution for intravitreal injection [internal sponsor's package]. Dorval (QC): Novartis Pharmaceuticals Canada Inc; 2022 Jun 30.
12.Table: 13-10-0114-01. Life expectancy and other elements of the life table, Canada, all provinces except Prince Edward Island. Ottawa (ON): Statistics Canada; 2022: https://www150.statcan.gc.ca/t1/tbl1/en/tv.action?pid=1310011401. Accessed 16 Aug 2022.
13.Preis SR, Hwang SJ, Coady S, et al. Trends in all-cause and cardiovascular disease mortality among women and men with and without diabetes mellitus in the Framingham Heart Study, 1950 to 2005. Circulation. 2009;119(13):1728-1735. PubMed
14.Christ SL, Lee DJ, Lam BL, Zheng DD, Arheart KL. Assessment of the effect of visual impairment on mortality through multiple health pathways: structural equation modeling. Invest Ophthalmol Vis Sci. 2008;49(8):3318-3323. PubMed
15.Hodgson N. Challenges associated with estimating utility in wet age-related macular degeneration: a novel regression analysis to capture the bilateral nature of the disease. Advances in Therapy. 2017;34(10):2360-2370. PubMed
16.Czoski-Murray C, Carlton J, Brazier J, Young T, Papo N, Kang H. Valuing condition-specific health states using simulation contact lenses. Value in Health. 2009;12(5):793-799. PubMed
17.DeltaPA. [Ottawa (ON)]: IQVIA; 2022: https://www.iqvia.com/. Accessed 2022 Aug 4.
18.Schedule of benefits for physician services under the Health Insurance Act: effective October 1, 2021. Toronto (ON): Ontario Ministry of Health; 2022: https://www.health.gov.on.ca/en/pro/programs/ohip/sob/physserv/sob_master.pdf. Accessed 2022 Aug 4.
19.Ontario Case Costing Initiative (OCCI). Toronto (ON): Ontario Health and Long-Term Care; 2017: https://data.ontario.ca/dataset/ontario-case-costing-initiative-occi. Accessed 2022 Aug 4.
20.Cruess A, Zlateva G, Xu X, Rochon S. Burden of illness of neovascular age-related macular degeneration in Canada. Can J Ophthalmol. 2007;42(6):836-843. PubMed
21.Cruess AF, Gordon KD, Bellan L, Mitchell S, Pezzullo ML. The cost of vision loss in Canada. 2. Results. Can J Ophthalmol. 2011;46(4):315-318. PubMed
22.CADTH Therapeutic Review: Anti–Vascular Endothelial Growth Factor Drugs for the Treatment of Retinal Conditions. Ottawa (ON): CADTH; 2016: https://www.cadth.ca/sites/default/files/pdf/TR0009_Anti-VEGF_TR_Science_Report.pdf. Accessed 2022 Oct 21.
23.CADTH Canadian Drug Expert Committee (CDEC) draft recommendation: Faricimab for DME. Ottawa (ON): CADTH; 2022: https://www.cadth.ca/sites/default/files/DRR/2022/SR0729%20Vabysmo%20-%20Draft%20CADTH%20Recommendation%20for%20Posting%20September%2015%2C%202022.pdf. Accessed 2022 Sept 15.
24.CADTH Canadian Drug Expert Committee (CDEC) recommendation: Faricimab for nAMD. Ottawa (ON): CADTH; 2022: https://www.cadth.ca/sites/default/files/DRR/2022/SR0719REC-Vabysmo.pdf. Accessed 2022 Oct 21.
25.Guertin JR, Feeny D, Tarride JE. Age- and sex-specific Canadian utility norms, based on the 2013-2014 Canadian Community Health Survey. CMAJ. 2018;190(6):E155-E161. PubMed
26.Janssen MF, Pickard AS, Shaw JW. General population normative data for the EQ-5D-3L in the five largest European economies. Eur J Health Econ. 2021;22(9):1467-1475. PubMed
27.Petrella RJ, Blouin J, Davies B, Barbeau M. Prevalence, Demographics, and Treatment Characteristics of Visual Impairment due to Diabetic Macular Edema in a Representative Canadian Cohort. J Ophthalmol. 2012;2012:159167. PubMed
28.Bowe T, Salabati M, Soares RR, et al. Racial, Ethnic, and Gender Disparities in Diabetic Macular Edema Clinical Trials. Ophthalmol Retina. 2022;6(6):531-533. PubMed
29.CADTH. CADTH Common Drug Review: Pharmacoeconomic Report Brolucizumab (Beovu) for nAMD. 2020: https://www.cadth.ca/sites/default/files/cdr/pharmacoeconomic/sr0632-beovu-pharmacoeconomic-review-report.pdf. Accessed 2022 Jul 7.
30.Vabysmo, faricimab 6mg/0.05mL solution for intravitrial injection [product monograph]. Mississauga (ON): Hoffmann-La Roche Ltd; 2022: https://pdf.hres.ca/dpd_pm/00066073.PDF. Accessed 2022 Aug 13.
31.Samsung Bioepis Co Ltd. Byooviz (ranibizumab) 10mg/mL solution for injection [product monograph]. Toronto (ON)2022: https://pdf.hres.ca/dpd_pm/00065001.PDF. Accessed 2022 Jul 27.
32.Drug and Health Product Submissions Under Review (SUR): New drug submissions under review. 2022. https://www.canada.ca/en/health-canada/services/drug-health-product-review-approval/submissions-under-review/new-drug-submissions-under-review.html. Accessed 2022 Aug 17.
33.pan-Canadian Pharmaceutical Alliance. Beovu (brolucizumab). 2021; https://www.pcpacanada.ca/negotiation/21223. Accessed 2022 Aug 17.
34.CADTH Canadian Drug Expert Committee (CDEC) final recommendation: Brolucizumab for nAMD. Ottawa (ON): CADTH; 2020: https://www.cadth.ca/sites/default/files/cdr/complete/SR0632%20Beovu%20-%20CDEC%20Final%20Recommendation%20%E2%80%93%20May%2025%2C%202020_for%20posting.pdf. Accessed 2022 Aug 17.
35.Novartis Pharmaceuticals Canada Inc. Lucentis ranibizumab product monograph. 2021; https://pdf.hres.ca/dpd_pm/00064117.PDF. Accessed May 6, 2022.
36.Bayer Inc. Eylea Aflibercept product monograph. 2022; https://pdf.hres.ca/dpd_pm/00064757.PDF. Accessed May 6, 2022.
37.Budget Impact Analysis [internal sponsor's report]. In: Drug Reimbursement Review sponsor submission: Beovu®(brolucizumab, single-use pre-filled syringe, 6 mg / 0.05 mL solution for intravitreal injection [internal sponsor's package]. Dorval (QC): Novartis Pharmaceuticals Canada Inc; 2022 Jun 30.
38.PharmaStat. [Ottawa (ON)]: IQVIA; 2022: https://www.iqvia.com/. Accessed 2022 Sept 15.
39.Non-Insured Health Benefits program: First Nations and Inuit Health Branch: Annual report 2020 to 2021. Indigenous Services Canada; 2022: https://www.sac-isc.gc.ca/eng/1645718409378/1645718500555. Accessed 2022 Sept 15.
Appendix 1: Cost Comparison Table
Note that this appendix has not been copy-edited.
The comparators presented in the following table have been deemed to be appropriate based on feedback from clinical experts. Comparators may be recommended (appropriate) practice or actual practice. Existing Product Listing Agreements are not reflected in the table and as such, the table may not represent the actual costs to public drug plans.
Table 8: CADTH Cost Comparison Table for Diabetic Macular Edema
Treatment | Strength / concentration | Form (vial size if single-use) | Price ($) | Recommended dosagea | Daily cost ($) | Annual cost ($) |
|---|---|---|---|---|---|---|
Brolucizumab (Beovu) | 120 mg/mL | 0.05 mL Solution for intravitreal injection | 1,390.0000b | 6 mg every 6 weeks for the first 5 doses followed by 6 mg every 12 weeks. In patients with disease activity, treatment every 8 weeks could be considered | Year 1: 26.73 to 30.55 Subsequent: 15.27 to 26.73 | Year 1: 9,730 to 11,120 (7 to 8 inj.) Subsequent: 5,560 to 9,730 (4 to 7 inj.) |
Anti-VEGF inhibitors | ||||||
Aflibercept (Eylea) | 40 mg/mL | 0.05 mL Solution for intravitreal injection | 1,418.0000 | 2 mg every 4 weeks for the first 5 doses followed by 2 mg every 8 weeks. After 12 months the treatment interval may be extended in 2-week increments | Year 1: 35.06 Subsequent: 27.27 | Year 1: 12,762 (9 inj.) Subsequent: 9,926 (7 inj.) |
Bevacizumab (Avastin) | 25 mg/mL | 4 mL 16 mL Solution for intravitreal injection | 519.1800c 2,076.7104c | 1.25 mg every 4 weeks for the first 3 doses followed by 1.25 mg every 8 to 12 weeksd | Year 1: 0.28 to 0.38e Subsequent: 0.19 to 0.33e | Year 1: 104 to 138 (6 to 8 inj.)e Subsequent: 69 to 121 (4 to 7 inj.)e |
Bevacizumab (Mvasi) | 25 mg/mL | 4 mL 16 mL Solution for intravitreal injection | 347.0000c 1,388.0000c | 1.25 mg every 4 weeks for the first 3 doses followed by 1.25 mg every 8 to 12 weeksd | Year 1: 0.19 to 0.25e Subsequent: 0.13 to 0.22e | Year 1: 69 to 93 (6 to 8 inj.)e Subsequent: 46 to 81 (4 to 7 inj.)e |
Faricimab (Vabysmo) | 120 mg/mL | 0.05 mL Solution for intravitreal injection | 1,350.0000f | 6 mg every 4 weeks for the first 4 doses followed by 6 mg at a dosing interval of up to every 16 weeks | Year 1: 22.18 to 51.75 to Subsequent: 11.09 to 48.05 | Year 1: 8,100 to 18,900 (6 to 14 inj.) Subsequent: 4,050 to 17,550 (3 to 13 inj.) |
Ranibizumab (Lucentis) | 10 mg/mL | 0.23 mL Solution for intravitreal injection | 1,616.5500 | 0.5 mg every 4 weeks for the first 3 doses followed by 0.5 mg up to every 12 weeks | Year 1: 39.83 Subsequent: 30.98 | Year 1: 14,549 (9 inj.) Subsequent: 11,316 (7 inj.) |
inj. = injections; VEGF = vascular endothelial growth factor.
Note: All prices are from the Ontario Drug Benefit Formulary (accessed September 2022), unless otherwise indicated, and do not include dispensing fees. Costs are based on 52 weeks per year.
aRecommended doses are from the respective product monographs, unless otherwise indicated, and may not represent typical clinical practice.5,30,35,36
bSponsor-submitted price.1
cWholesale price from IQVIA Delta PA (accessed September 2022).17
dBevacizumab is used off-label in this population and, as such, does not have a recommended dosage for DME in the product monograph. Dosing for bevacizumab was based on clinical expert input received by CADTH for this review.
eCosts for bevacizumab were calculated based on the assumption that 30 doses could be obtained per 100 mg (4 mL) vial. This assumption was validated by clinical experts and the drug plans.
fPrice submitted to CADTH for the review of faricimab for the treatment of diabetic macular edema.23
Appendix 2: Submission Quality
Note that this appendix has not been copy-edited.
Description | Yes/no | Comments |
|---|---|---|
Population is relevant, with no critical intervention missing, and no relevant outcome missing. | Yes | While the sponsor’s submission met the technical requirements for comparators at the time of submission, CADTH notes that faricimab was identified as a potentially relevant comparator by the clinical expert consulted by CADTH. Faricimab recently received Health Canada approval for DME and a positive draft recommendation from CDEC for this indication. |
Model has been adequately programmed and has sufficient face validity. | No | The model included numerous IFERROR statements, making validation difficult (refer to Key Limitations section). |
Model structure is adequate for decision problem. | Yes | No comment. |
Data incorporation into the model has been done adequately (e.g., parameters for probabilistic analysis). | No | Injection frequency, which is likely to be highly variable in clinical practice, was deterministic within the model. The unit cost of anti-VEGF drugs was inappropriately considered to be variable. |
Parameter and structural uncertainty were adequately assessed; analyses were adequate to inform the decision problem. | Yes | No comment. |
The submission was well organized and complete; the information was easy to locate (clear and transparent reporting; technical documentation available in enough details). | No | The pharmacoeconomic report contradicted itself or the model in a number of places. For example, Figure 2 and the Key Model Parameters table 4.17 imply that visual acuity classification is based on the worst seeing eye; however, the model classifies patients as being visually impaired or blind based on their best-seeing eye (i.e., both eyes must be < 56 letters or < 26 letters before a patient experiences costs or mortality associated with being visually impaired or blind). Treatment discontinuation was stated in section 4.12 of the submitted report to have no hard stopping rule and could continue for any number of years; however, Table 4.17 and the model limit treatment to 5 years per eye. |
Appendix 3: Additional Information on the Submitted Economic Evaluation
Note that this appendix has not been copy-edited.
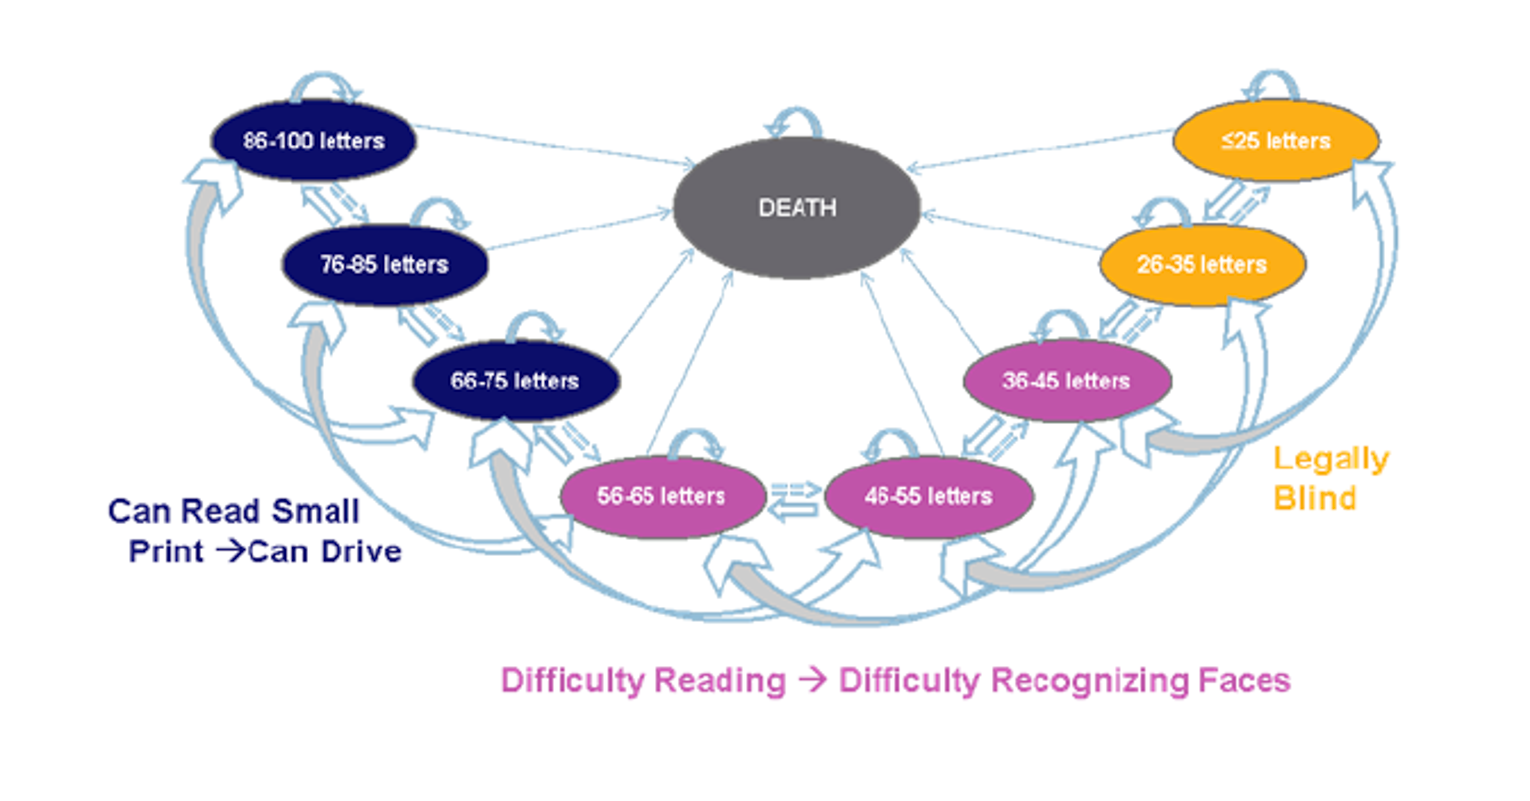
Figure 2: Unilateral and Bilateral Treatment Discontinuation Transitions
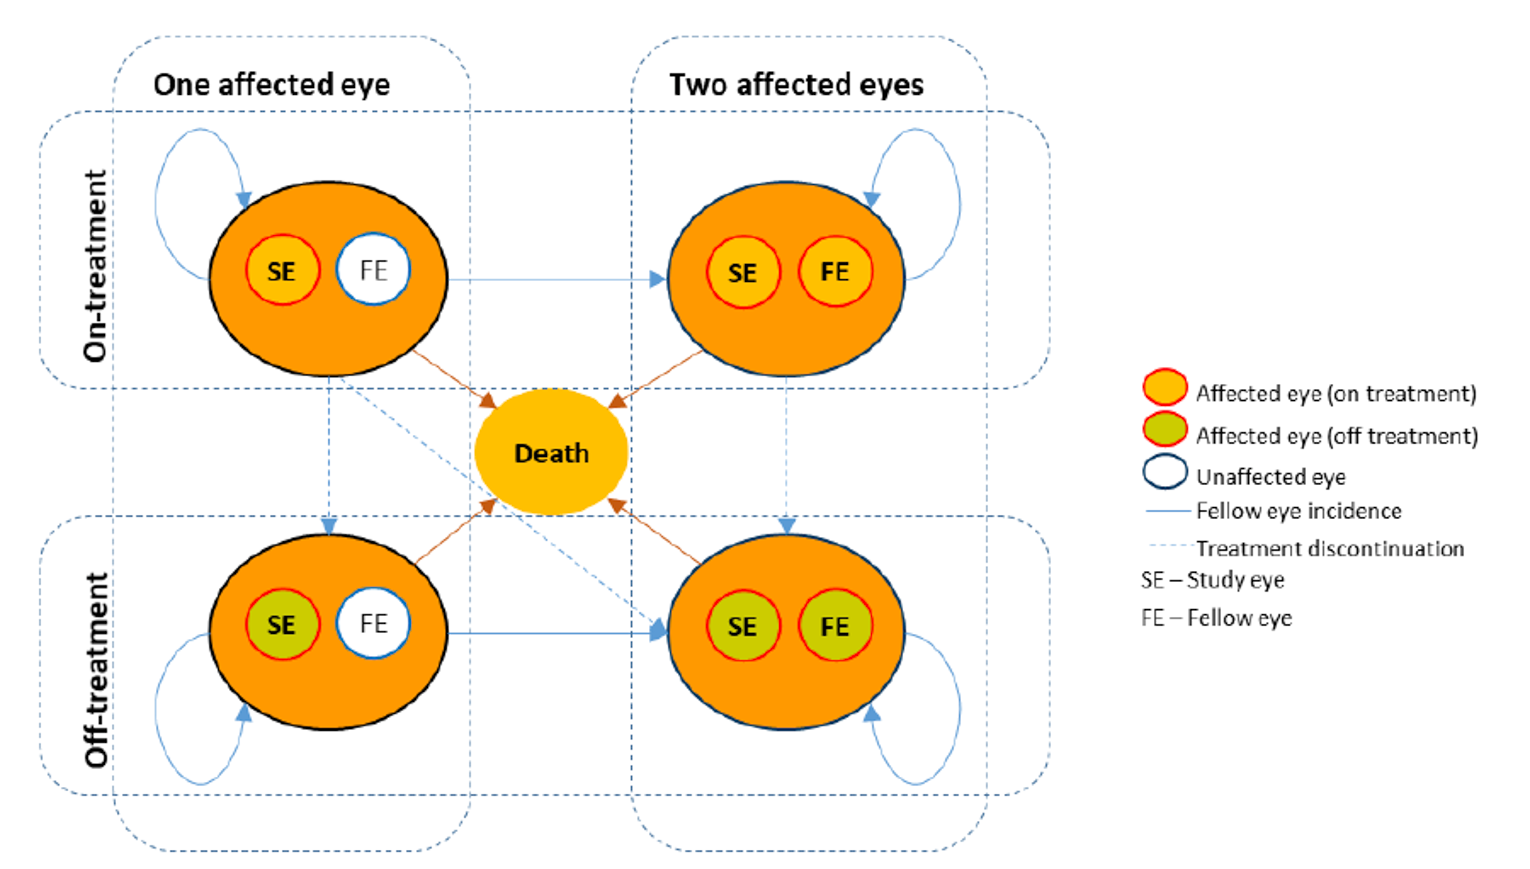
Source: Sponsor’s pharmacoeconomic submission.1
Table 10: Sponsor’s Baseline Visual Acuity Distribution
Study eye | Fellow eye | |||||||
|---|---|---|---|---|---|---|---|---|
86 to 100 letters | 76 to 85 letters | 66 to 75 letters | 56 to 65 letters | 46 to 55 letters | 36 to 45 letters | 26 to 35 letters | 0 to 25 letters | |
86 to 100 letters | 0.00% | 0.00% | 0.00% | 0.14% | 0.00% | 0.00% | 0.00% | 0.00% |
76 to 85 letters | 1.63% | 6.80% | 2.18% | 0.68% | 0.27% | 0.41% | 0.14% | 0.00% |
66 to 75 letters | 5.99% | 19.05% | 14.83% | 5.03% | 1.36% | 0.95% | 0.54% | 0.00% |
56 to 65 letters | 0.68% | 7.89% | 7.35% | 4.76% | 1.63% | 1.36% | 0.14% | 0.14% |
46 to 55 letters | 0.00% | 2.04% | 1.90% | 1.77% | 1.09% | 0.82% | 0.54% | 0.00% |
36 to 45 letters | 0.00% | 0.82% | 1.22% | 0.41% | 0.41% | 1.36% | 0.00% | 0.27% |
26 to 35 letters | 0.14% | 0.54% | 0.68% | 0.68% | 0.68% | 0.27% | 0.00% | 0.00% |
0 to 25 letters | 0.00% | 0.14% | 0.00% | 0.14% | 0.00% | 0.14% | 0.00% | 0.00% |
Source: Sponsor’s Pharmacoeconomic Submission,1 derived from KITE and KESTREL trials.
Table 11: Sponsor’s Assumed Injection Frequencies and Drug Acquisition Costs
Treatment | Year 1 | Year 2 | Years 3 to 5 |
|---|---|---|---|
Number of injections (Drug acquisition cost) | |||
Brolucizumab 6 mg | 6.91 ($9,606) | 4.11 ($5,714) | 3.00 ($4,170) |
Aflibercept 2 mg | 8.40 ($11,911) | 5.40 ($7,657) | 3.00 ($4,254) |
Ranibizumab 0.5 mg | 8.00 ($12,932) | 5.70 ($9,214) | 3.00 ($4,850) |
Bevacizumab 1.25 mg | 8.86 ($307) | 6.05 ($209) | 3.00 ($104) |
Note: Annual drug acquisition costs are based on publicly available prices and assume single-use vials or syringes, except for bevacizumab, for which the sponsor assumed that 15 doses (1.25 mg) would be obtained per 100 mg vial.
Source: Sponsor’s pharmacoeconomic submission.1 Injection frequency is derived from the KITE and KESTREL trials for brolucizumab,2,3 an internal analysis of data from a UK retrospective cohort study for aflibercept and ranibizumab (methods not provided), and a ratio derived from Wells et al. (2016)9 for bevacizumab and aflibercept applied to the UK cohort study data for bevacizumab.
Detailed Results of the Sponsor’s Base Case
Table 12: Disaggregated Results of the Sponsor’s Base Case
Parameter | Brolucizumab | Aflibercept | Ranibizumab | Bevacizumab |
|---|---|---|---|---|
Discounted LYs | ||||
Total | 14.3255 | 14.3290 | 14.2669 | 14.1845 |
Discounted QALYs | ||||
Total | 9.5650 | 9.5652 | 9.3422 | 9.0426 |
VA-related QALYs | 9.5726 | 9.5722 | 9.3468 | 9.0428 |
AE-related QALYs | −0.0076 | −0.0070 | −0.0046 | −0.0002 |
Mean number of injectionsa | ||||
Total injections | 25.73 | 30.37 | 31.09 | 32.84 |
Discounted costs ($) | ||||
Total | 43,599 | 51,548 | 59,280 | 12,246 |
Drug acquisition | 35,001 | 42,128 | 49,134 | 1,112 |
Administration | 4,286 | 5,061 | 5,175 | 5,475 |
Monitoring | 685 | 794 | 807 | 850 |
AE costs | 330 | 336 | 219 | 9 |
Costs of blindness | 3,298 | 3,230 | 3,945 | 4,800 |
Pairwise ICER of brolucizumab vs. comparator ($/QALY) | NA | 33,071,888b | Dominant | 60,021 |
ICER = incremental cost-effectiveness ratio; LY = life-year; NA = not applicable; QALY = quality-adjusted life-year; VA = visual acuity.
aMean number of injections was extracted by CADTH from the sponsor’s model (deterministic analysis). The model did not report number of injections for the probabilistic results.
bDue to small QALY difference between brolucizumab and aflibercept, this ICER is not stable.
Appendix 4: Additional Details on the CADTH Reanalyses and Sensitivity Analyses of the Economic Evaluation
Note that this appendix has not been copy-edited.
Detailed Results of CADTH Reanalysis
Table 13: Disaggregated Results of the CADTH Reanalysis
Parameter | Brolucizumab | Aflibercept | Ranibizumab | Bevacizumab |
|---|---|---|---|---|
Discounted LYs | ||||
Total | 14.3077 | 14.3128 | 14.2553 | 14.1667 |
Discounted QALYs | ||||
Total | 9.5724 | 9.5772 | 9.3761 | 9.0548 |
VA-related QALYs | 9.5800 | 9.5842 | 9.3807 | 9.0550 |
AE-related QALYs | −0.0076 | −0.0070 | −0.0046 | −0.0002 |
Mean number of injectionsa | ||||
Total injections | 25.73 | 30.37 | 31.09 | 32.84 |
Discounted costs ($) | ||||
Total | 43,570 | 51,561 | 59,232 | 11,671 |
Drug acquisition | 34,979 | 42,151 | 49,163 | 556 |
Administration | 4,280 | 5,061 | 5,175 | 5,473 |
Monitoring | 686 | 795 | 808 | 851 |
AE costs | 330 | 336 | 219 | 9 |
Costs of blindness | 3,295 | 3,219 | 3,867 | 4,782 |
Pairwise ICER of brolucizumab vs. comparator ($/QALY) | NA | 1,666,116a | Dominant | 61,621 |
AE = adverse event; ICER = incremental cost-effectiveness ratio; LY = life-year; NA = not applicable; QALY = quality-adjusted life-year; VA = visual acuity.
aDeterministic value; the sponsor’s probabilistic analysis was not programmed to report the number of injections received.
bBrolucizumab was less effective and less costly than aflibercept. Due to small QALY difference between brolucizumab and aflibercept, this ICER is not stable.
Scenario Analyses
Table 14: Summary of the CADTH Scenario Analyses
Stepped analysis | Drug | Total costs ($) | Total QALYs | Sequential ICER ($/QALYs) |
|---|---|---|---|---|
Sponsor’s base case | Bevacizumab | 12,246 | 9.0426 | Reference |
Brolucizumab | 43,599 | 9.5650 | 60,021 | |
Aflibercept | 51,548 | 9.5652 | 33,071,888a | |
Ranibizumab | 59,280 | 9.3422 | Dominated by brolucizumab and aflibercept | |
CADTH combined reanalysis | Bevacizumab | 11,671 | 9.0548 | Reference |
Brolucizumab | 43,570 | 9.5724 | 61,621 | |
Aflibercept | 51,561 | 9.5772 | 1,666,116 | |
Ranibizumab | 59,232 | 9.3761 | Dominated by brolucizumab and aflibercept | |
Scenario 1: Equal efficacy and discontinuationb | Bevacizumab | 10,164 | 9.6368 | Reference |
Brolucizumab | 46,322 | 9.6288 | Dominated by bevacizumab | |
Aflibercept | 53,915 | 9.6296 | Dominated by bevacizumab | |
Ranibizumab | 59,573 | 9.6323 | Dominated by bevacizumab | |
Scenario 2: Equal injection frequencyc | Bevacizumab | 10,430 | 9.0622 | Reference |
Brolucizumab | 43,550 | 9.5628 | 66,172 | |
Aflibercept | 44,883 | 9.5711 | 160,671 | |
Ranibizumab | 52,070 | 9.3304 | Dominated by brolucizumab and aflibercept | |
Scenario 3: Equal efficacy, discontinuation, and injectionsb,c | Bevacizumab | 8,981 | 9.6355 | Reference |
Brolucizumab | 46,394 | 9.6275 | Dominated by bevacizumab | |
Aflibercept | 47,140 | 9.6283 | Dominated by bevacizumab | |
Ranibizumab | 52,362 | 9.6311 | Dominated by bevacizumab | |
Scenario 4: Disutility for injections | Bevacizumab | 11,641 | 9.1087 | Reference |
Brolucizumab | 43,495 | 9.6205 | 62,238 | |
Aflibercept | 51,502 | 9.6168 | Dominated by brolucizumab | |
Ranibizumab | 59,297 | 9.3787 | Dominated by brolucizumab | |
Scenario 5: 27% of patients have bilateral DME at baselined | Bevacizumab | 12,069 | 9.0419 | Reference |
Brolucizumab | 45,727 | 9.5584 | 65,156 | |
Aflibercept | 54,102 | 9.5584 | Dominated by brolucizumaba | |
Ranibizumab | 9.3108 | 9.3108 | Dominated by brolucizumab | |
Scenario 6: Biosimilar drug acquisition costse | Bevacizumab | 11,447 | 9.0444 | Reference |
Aflibercept | 37,615 | 9.5556 | 51,198 | |
Ranibizumab | 43,050 | 9.3218 | Dominated by aflibercept | |
Brolucizumab | 43,556 | 9.5499 | Dominated by aflibercept | |
Scenario 7: Equal efficacy, discontinuation, and injections plus biosimilar drug costse | Bevacizumab | 8,815 | 9.6229 | Reference |
Aflibercept | 34,502 | 9.6156 | Dominated by bevacizumab | |
Ranibizumab | 37,973 | 9.6184 | Dominated by bevacizumab | |
Brolucizumab | 46,312 | 9.6148 | Dominated by bevacizumab |
AE = adverse event; DME = diabetic macular edema; ICER = incremental cost-effectiveness ratio; QALY = quality-adjusted life-year.
aDue to very small QALY differences, the ICER between aflibercept and bevacizumab was not stable.
bTreatment effect (mean change in BCVA) was set to equal that of aflibercept for all comparators, as the model was programmed such that the treatment effect of all comparators was relative to that of aflibercept. Discontinuation was set to 7.62% per year, the average of all treatments.1
cInjection frequencies for all comparators were set equal to that of brolucizumab.1
d27% was selected for this scenario based on observational data from the UK (patients treated bilaterally at baseline).8
eBiosimilar versions of aflibercept, bevacizumab, and ranibizumab were assumed to cost 67% of the list price of the originator brands based on the relationship between the bevacizumab originator product (Avastin) and biosimilar (Mvasi).17
Table 15: Disaggregated Results of CADTH Scenario 1 — Equal Efficacy and Discontinuationa
Parameter | Brolucizumab | Aflibercept | Ranibizumab | Bevacizumab |
|---|---|---|---|---|
Discounted LYs | ||||
Total | 14.3421 | 14.3421 | 14.3421 | 14.3421 |
Discounted QALYs | ||||
Total | 9.6288 | 9.6296 | 9.6323 | 9.6368 |
VA-related QALYs | 9.6370 | 9.6370 | 9.6323 | 9.6370 |
AE-related QALYs | −0.0082 | −0.0074 | −0.0047 | −0.0002 |
Mean number of injectionsb | ||||
Total injections | 25.73 | 30.37 | 31.09 | 32.84 |
Discounted costs ($) | ||||
Total | 46,322 | 53,915 | 59,573 | 10,164 |
Drug acquisition | 37,524 | 44,289 | 50,127 | 569 |
Administration | 4,589 | 5,314 | 5,274 | 5,595 |
Monitoring | 727 | 829 | 821 | 867 |
AE costs | 358 | 358 | 226 | 9 |
Costs of blindness | 3,124 | 3,124 | 3,124 | 3,124 |
Pairwise ICER of brolucizumab vs. comparator ($/QALY) | Dominated | Dominated | Dominated | Dominant |
AE = adverse event; ICER = incremental cost-effectiveness ratio; LY = life-year; NA = not applicable; QALY = quality-adjusted life-year; VA = visual acuity.
aTreatment effect (mean change in BCVA) was set to equal that of aflibercept for all comparators as the model was programmed such that the treatment effect of all comparators were relative to that of aflibercept. Discontinuation was set to 7.62% per year, the average of all treatments.1
bDeterministic value; the sponsor’s probabilistic analysis was not programmed to report the number of injections received.
Appendix 5: Submitted BIA and CADTH Appraisal
Note that this appendix has not been copy-edited.
Table 16: Summary of Key Take-Aways
Key take-aways of the BIA |
|---|
|
BIA = budget impact analysis; VEGF = vascular endothelial growth factor.
Summary of Sponsor’s BIA
In the submitted BIA, the sponsor assessed the introduction of brolucizumab for the treatment of DME.37 The BIA was undertaken from the perspective of a Canadian public payer over a 3-year time horizon (2024 to 2026) using a claims-based approach. The sponsor’s analysis included drug acquisition costs; dispensing fees and markups were not included in the base case. Data for the model were obtained from various sources including IQVIA databases for number of units reimbursed and reference scenario market share; clinical trial data and the sponsor’s submitted NMA for injection frequency;2,3,11 jurisdictional formularies for list prices of comparators; and internal forecasting for uptake of brolucizumab. Key inputs to the BIA are documented in Table 17.
Key assumptions included:
Brolucizumab will not displace any bevacizumab use and will not expand the anti-VEGF market.
All relevant public coverage of anti-VEGF therapies is captured in the IQVIA CompuScript database.
90% of patients receiving aflibercept and 90.4% of patients receiving ranibizumab are on a maintenance injection schedule at any given time.
More than 80% of relevant claims will come from Ontario.
Biosimilar versions of ranibizumab and aflibercept will not become reimbursed within the 3-year time horizon.
Table 17: Summary of Key Model Parameters
Parameter | Sponsor’s estimate (year 1 / year 2 / year 3) |
|---|---|
Target population | |
Forecasted units reimbursed for DMEa | |
Aflibercept | 373,856 / 399,079 / 424,303 |
Bevacizumab | 0 / 0 / 0 |
Ranibizumab | 144,405 / 147,356 / 150,306 |
Injections per year, induction year/subsequent yearsb | |
Brolucizumab | 6.91 / 4.11 |
Aflibercept | 8.40 / 5.40c |
Bevacizumab | 8.86 / 6.05 |
Ranibizumab | 8.00 / 5.70c |
Number of eyesd eligible for drug under review | 18,475 / 19,551 / 20,628 |
Market uptake (reference scenario, 3 years)a | |
Aflibercept | 80.4% / 81.1% / 81.8% |
Bevacizumab | 0 / 0 / 0 |
Ranibizumab | 19.6% / 18.9% / 18.2% |
Market uptake (new drug scenario, 3 years) | |
Brolucizumab | 2.7% / 6.9% / 11.0% |
Aflibercept | 78.3% / 75.6% / 72.8% |
Bevacizumab | 0 / 0 / 0 |
Ranibizumab | 19.0% / 17.5% / 16.1% |
Annual cost of treatment per patient (induction year/subsequent years) | |
Brolucizumab | $9,606 / $5,714 |
Afliberceptf | $11,911 / $7,657 |
Bevacizumab | $307 / $209 |
Ranibizumab | $12,932 / $9,214 |
DME = diabetic macular edema.
Costs are based on list prices for individual jurisdictional plans, where available.
Note: The sponsor’s model was reprogrammed by CADTH to report pan-Canadian totals and uptake proportions. Proportions vary by jurisdiction and do not include bevacizumab.
aProjected from historical data of units publicly reimbursed as reported by IQVIA CompuScript database (except NIHB which was projected from Pharmastat data); 14.8% of total ranibizumab claims and 22.7% of total aflibercept claims were assumed to be for DME based on Ontario limited use codes as reported in IQVIA Rx Dynamics data.1
cWeighted average assumes 90% of aflibercept patients and 90.4% of ranibizumab patients are in a subsequent year of therapy (i.e., on a maintenance schedule for dose administrations) in each modelled year, based on ODB data reported by IQVIA for ranibizumab and assumed for aflibercept. No bevacizumab patients are included. These led to a weighted average number of injections per year of 5.70 for aflibercept and 5.92 for ranibizumab. Patients initiating brolucizumab are all assumed to be in an induction year, while those continuing from a previous year are assumed to be in a subsequent year.
dThe sponsor’s model does not distinguish number of patients from number of eyes treated. Under the sponsor’s assumptions, the figures reported here are the number of eyes that are forecasted to be treated per year.
eAnnual cost was calculated by multiplying the number of estimated injections per year by the cost per injection.
fAnnual cost of aflibercept was lower in Saskatchewan due to a lower unit cost: $10,712 for the induction year, and $6,886 for subsequent years.
Summary of the Sponsor’s BIA Results
Results of the sponsor’s analysis suggest that the reimbursement of brolucizumab for the treatment of DME will be associated with an incremental savings of $879,512 in year 1, $4,139,190 in year 2, and $8,878,927 in year 3, for a 3-year incremental budgetary savings of $13,897,629.
CADTH Appraisal of the Sponsor’s BIA
CADTH identified several key limitations to the sponsor’s analysis that have notable implications on the results of the BIA:
The claims-based approach and forecasting may be inappropriate: The sponsor’s claims-based approach used IQVIA CompuScript, Pharmastat, and RxDynamics databases to estimate the number of aflibercept and ranibizumab units publicly reimbursed for DME in 2019 to 2021 and extrapolated these claims to years 1 through 3 (2024 to 2026) of the analysis through linear forecasting for most jurisdictions.37 However, linear forecasting was not used for the NIHB, likely due to the cessation of data sharing between NIHB and IQVIA in 2020.38 Instead, the number of units of aflibercept and ranibizumab reimbursed in the first quarter of 2020 were assumed to be constant for all future quarters. Linear forecasting was additionally not used for ranibizumab units reimbursed in Alberta, Saskatchewan, and Prince Edward Island; units were instead assumed to be the same as the fourth quarter of 2021. The rationale for this was not provided. CADTH notes that these assumptions do not account for future growth of the NIHB population nor the impact of the COVID-19 pandemic on ocular claims. Claims from 2020 likely reflect a lower number of claims than would be expected once more usual rates of ocular procedures resumed. As such, there is increased uncertainty that data projected from a time period, including such atypical changes in rates of treatment can be adequately generalized to future years. Finally, in using a claims-based approach, the sponsor’s model was insufficiently flexible to explore alternate scenarios assuming market share and displacement of anti-VEGF drugs.
In the CADTH base case, CADTH assumed that NIHB claims for both aflibercept and ranibizumab would increase to reflect population growth. CADTH additionally adjusted the forecasted number of ranibizumab claims by use of data from 2019 to 2021 rather than assuming stagnant growth in jurisdictions where its use is dropping (minimum of 0 claims per quarter). CADTH was unable to consider the inclusion of other comparators due to the inflexibility of the sponsor’s claims-based approach.
The lack of displacement of bevacizumab is uncertain: The sponsor assumed that brolucizumab would displace aflibercept and ranibizumab, but not bevacizumab (i.e., 0% of brolucizumab market share would come from bevacizumab); this assumption was not justified. Despite its off-label use, bevacizumab is reimbursed for the treatment of DME in several jurisdictions, is a relevant comparator according to clinical expert and drug plan input, and was included in the sponsor’s pharmacoeconomic evaluation. The assumption that brolucizumab will only displace indicated comparators is uncertain in the absence of other justification, especially given the sponsor’s assumption that brolucizumab would lead to fewer injections than bevacizumab, making it a potentially desirable option for patients and clinicians.
CADTH was unable to address this limitation owing to the combination of the structure of the sponsor’s model and a lack of data about market share for bevacizumab. If brolucizumab displaces bevacizumab, the cost savings realized by the drug plans may be lower than predicted by the sponsor’s and CADTH’s base case.
Potentially relevant comparators were omitted: As noted in the CADTH Issues for Consideration, the sponsor did not include faricimab in their analysis. Faricimab was recently approved by Health Canada for treatment of DME30 and has received a positive draft recommendation from CDEC,23 though the latter occurred after the submission of the current review. The clinical expert feedback obtained by CADTH for this review noted that brolucizumab and faricimab will be used in similar patient populations and together are likely to capture much of the DME market share and that it is likely faricimab will already be expanding into the publicly funded market when brolucizumab may also be entering it. At the submitted prices, the cost per dose of faricimab is less than the cost per dose of brolucizumab.1,23 As such, should faricimab be reimbursed by public plans, it may take up much of the predicted market share of brolucizumab with an uncertain relative annual cost.
This limitation could not be addressed by CADTH in reanalyses. Should faricimab become reimbursed before brolucizumab, any displacement of faricimab by brolucizumab may result in reduced or eliminated cost savings compared with current estimates.
Uncertainty in the predicted market uptake: The sponsor’s base case assumes that brolucizumab will displace 2.7% of claims in year 1, rising to 11.1% in year 3, varying by jurisdiction. The sponsor assumed that 90% of this displacement will be among patients who would otherwise be initiating their first year of therapy with an alternate anti-VEGF (incident users), while 10% of displacement would be among patients switching from another anti-VEGF drug (prevalent users). Clinical expert feedback received by CADTH noted that this may have been underestimated, predicting that 20% to 30% of patients would be likely to begin or be switched to an anti-VEGF with a potentially longer injection interval (i.e., brolucizumab or faricimab) within the first 3 years of such products being reimbursed. Additionally, clinical expert feedback indicated that a higher proportion (up to 50%) than predicted by the sponsor (10%) would be patients switching from another anti-VEGF in favour of a product with a potentially longer injection interval.
Due to the inflexibility of the sponsor’s model, CADTH could not explore scenarios where faricimab would already be expanding into the DME market in the reference scenario, with brolucizumab splitting this expanding share in the new drug scenario. CADTH conducted a scenario where 50% of brolucizumab uptake was from patients switching from a maintenance year of therapy with another anti-VEGF drug.
Uncertainty in the relative frequency of administration: In the BIA, the annual cost of brolucizumab and comparators was estimated similarly to the pharmacoeconomic model, using KITE and KESTREL data for brolucizumab, and a combination of clinical trial data and observational cohort data for ranibizumab and aflibercept. As such, the uncertainty in the relative injection frequency described in the CADTH Appraisal of the Sponsor’s Economic Evaluation also applies to the submitted BIA. Additionally, injection frequency is differentiated by loading year and mean subsequent year in the BIA rather than differentiated into years 1, 2, and 3+ as in the pharmacoeconomic model. As such, there is considerable uncertainty in the relative frequency of injections for the various comparators that will be observed in clinical practice.
CADTH conducted a scenario analysis that assumed equal frequency of injection for all comparators.
The price of drugs paid by public drug plans is uncertain: Both the sponsor’s and CADTH’s analyses are based on publicly available list prices for all comparators. Drug plan feedback indicated there are confidential negotiated prices for the comparators. Thus, actual costs paid by drug plans are unknown. Depending on the negotiated prices, the savings from reimbursing brolucizumab may be lower than predicted by the sponsor’s or CADTH’s base case or may result in increased costs to the drug plans.
CADTH was unable to incorporate the presence of confidential negotiated prices in the reanalysis.
CADTH Reanalyses of the BIA
Based on the identified limitations, the CADTH base case included a change to the forecasting of claims to better reflect changes in population and market share over the analysis horizon.
Table 18: CADTH Revisions to the Submitted Budget Impact Analysis
Stepped analysis | Sponsor’s value or assumption | CADTH value or assumption |
|---|---|---|
Changes to derive the CADTH base case | ||
1. Forecasting of claims | NIHB: aflibercept and ranibizumab have stagnant growth from Q1 2020 Ranibizumab in AB, SK, PE: stagnant growth from Q4 2021 | NIHB: forecast for both aflibercept and ranibizumab assumes growth equivalent to population growth (1.3% annually)39 starting with the average of quarterly claims made in 2019. Ranibizumab in AB, SK, PE: forecast from 2021 data (assuming a minimum of 0 claims per quarter) |
CADTH base case | 1 | |
AB = Alberta; NIHB = Non-Insured Health Benefits; PE = Prince Edward Island; Q = quarter; SK = Saskatchewan.
The results of the CADTH stepwise reanalysis are presented in summary format in Table 19 and a more detailed breakdown is presented in Table 20. Based on the CADTH base case, the estimated cost saving of the reimbursement of brolucizumab for the treatment of adult patients with DME are expected to be $874,107 in year 1, $4,119,735 in year 2, and $8,847,605 in year 3, for a 3-year total cost savings of $13,841,448. The predicted cost saving associated with the reimbursement of brolucizumab for DME are reliant on the assumption that brolucizumab will not displace bevacizumab.
Scenario analyses conducted by CADTH indicated that the BIA results are sensitive to the administrative frequency of each comparator and whether patients are primarily initiating brolucizumab rather than initiating another anti-VEGF or if a substantial proportion of patients switch from anti-VEGF therapies that are already being received.
Of note, CADTH was unable to explore the impact of the possibility that faricimab will have already entered the publicly reimbursed market for the treatment of DME before brolucizumab.
Table 19: Summary of the CADTH Reanalyses of the BIA
Stepped analysis | Three-year total |
|---|---|
Submitted base case | −$13,897,629 |
CADTH reanalysis 1: claims forecasting adjusted | −$13,841,448 |
CADTH base case | −$13,841,448 |
BIA = budget impact analysis.
Table 20: Detailed Breakdown of the CADTH Reanalyses of the BIA
Stepped analysis | Scenario | Year 0 (current situation) | Year 1 | Year 2 | Year 3 | Three-year total |
|---|---|---|---|---|---|---|
Submitted base case | Reference | $145,690,570 | $154,485,162 | $163,279,753 | $172,074,345 | $489,839,260 |
New drug | $145,690,570 | $153,605,650 | $159,140,563 | $163,195,417 | $475,941,631 | |
Budget impact | $0 | −$879,512 | −$4,139,190 | −$8,878,927 | −$13,897,629 | |
CADTH base case | Reference | $145,337,085 | $153,905,994 | $162,696,363 | $171,541,409 | $488,143,767 |
New drug | $145,337,085 | $153,031,887 | $158,576,628 | $162,693,804 | $474,302,319 | |
Budget impact | $0 | −$874,107 | −$4,119,735 | −$8,847,605 | −$13,841,448 | |
CADTH scenario A: Equal administration frequency | Reference | $145,337,085 | $153,905,994 | $162,696,363 | $171,541,409 | $488,143,767 |
New drug | $145,337,085 | $154,092,124 | $160,883,469 | $165,981,242 | $480,956,835 | |
Budget impact | $0 | $186,130 | −$1,812,895 | −$5,560,167 | −$7,186,931 | |
CADTH scenario B: 50% switch from maintenance therapya | Reference | $145,337,085 | $153,905,994 | $162,696,363 | $171,541,409 | $488,143,767 |
New drug | $145,337,085 | $153,689,082 | $160,171,754 | $165,341,055 | $479,201,890 | |
Budget Impact | $0 | −$216,913 | −$2,524,610 | −$6,200,354 | −$8,941,877 |
BIA = budget impact analysis.
Note: The sponsor’s model was reprogrammed by CADTH to also report the pan-Canadian Reference and New Drug scenarios in addition to the budgetary impact.
aThis scenario assumes that 50% of brolucizumab uptake is from patients switching from a previous anti-VEGF therapy.
Stakeholder Input
Patient Input
Fighting Blindness Canada, The Canadian Council of the Blind, CNIB, Vision Loss Rehabilitation Canada, Diabetes Canada
About Fighting Blindness Canada, The Canadian Council of the Blind, CNIB, Vision Loss Rehabilitation Canada, Diabetes Canada
Fighting Blindness Canada (FBC) is the largest charitable funder of vision research in Canada.
Over our 48-year history, FBC has contributed critical funding for the development of sight-saving treatments and cures for blinding eye diseases. By raising and stewarding funds, FBC is helping drive forward research that supports our goal of understanding why vision loss occurs, how it can be slowed and how sight can be restored.
We are an invaluable resource for individuals and families impacted by blindness, providing accurate eye health information through our website and educational events, as well as engaging with government and other stakeholders to advance better vision health policies.
The Canadian Council of the Blind (CCB) was founded in 1944 by schools of the blind and by returning blind Canadian war veterans and is recognized as the Voice of the Blind™ in Canada. The CCB is a membership-based not-for-profit, that brings together Canadians who are living with vision loss, those who are blind, deaf-blind, and the partially sighted. In doing so the Council maintains a vibrant network of active members in 80 chapters across Canada. Each chapter is unique to its geographic area and engages in a variety of social, recreational and community activities based on the interests of their local members.
A tireless advocate of the vision loss community the CCB works to promote a sense of purpose and self-esteem along with enabling the efforts of each member to achieve an enhanced quality of life. The Council through its lived experience constituency is proud of its efforts to break down barriers and remains dedicated to building public awareness and improving the well-being of people with seeing disabilities.
The Canadian Council of the Blind offers numerous programs to assist people living with vision loss, increase accessibility in all areas of vision loss life and bring awareness of vision issues to the public and government. The CCB leads initiatives that call for the provision of the very best in available medical treatments, research, and the fostering of patients’ rights without limitation or discrimination. It does this all while recognizing that vision loss and blindness are preventable.
Founded in 1918, CNIB is a non-profit organization driven to change what it is to be blind today. We deliver innovative programs and powerful advocacy that empower people impacted by blindness to live their dreams and tear down barriers to inclusion. Our work as a blind foundation is powered by a network of volunteers, donors and partners from coast to coast to coast.
Vision Loss Rehabilitation Canada (VLRC) is a health services organization. We provide training that enables people who are blind or partially sighted to develop or restore key daily living skills, helping enhance their independence, safety and mobility. Our certified specialists work closely with ophthalmologists, optometrists and other health care professionals, providing essential care on a referral basis in homes and communities.
The Vision of VLRC is to maximize health and independence for Canadians impacted by vision loss and our mission is to provide high-quality, integrated and accessible rehabilitation and health care services that enable Canadians impacted by vision loss to live the lives they choose.
Diabetes Canada (DC) is a national health charity representing millions of Canadians affected by diabetes. Diabetes Canada leads the fight against diabetes by helping people live healthy lives, preventing the onset and consequences of diabetes, and discovering a cure. It has a heritage of excellence and leadership, and its co-founder, Dr. Charles Best, along with Dr. Frederick Banting, is credited with the co-discovery of insulin. Diabetes Canada is supported in its efforts by a community-based network of volunteers, employees, health care professionals, researchers, and partners. By providing education and services, advocating on behalf of people living with diabetes, supporting research and translating it into practical applications, Diabetes Canada is delivering on its mission. Diabetes Canada will continue to change the world for those affected by diabetes through healthier communities, exceptional care, and high-impact research.
Information Gathering
Data shared in this submission were collected through an online survey made available to Canadians living with diabetic retinopathy (DR) or diabetic macular edema (DME) during the first months of 2020. Shared across networks associated with the submitting organizations, the survey is part of a larger research project titled VIEW DR/DME (Valuation and Interpretation of Experiences with DR/DME) that received ethics approval from Advarra, one of the largest independent providers of institutional review board (IRB) services in Canada.
The intent of the survey was to learn more about the lived experiences of Canadians living with DR and DME. The goal was not to learn more about experiences of Beovu or any other specific treatment (though we did gather data and insights related to experiences of treatment general).
Instead, the data and analysis that follows provide insights into the lives of those who live with DR and DME, and who must manage and navigate the often-daily barriers and burdens that accompany these diseases. Our belief is that these perspectives are crucial, and that they can be used to guide decision-making related to treatments that can address the physical, psychological, and socioeconomic burdens associated with DR and DME.
Overview of Respondents
A total of 67 Canadians responded to the survey. Seeing as DR affects approximately 500,000 Canadians, (Ballios BG, Park T, Chaudhary V, Hurley B, et al. Identifying gaps in patient access to diabetic screening eye examinations in Ontario: a provincially representative cross-sectional study. Can J Ophthalmol. 2021;56(4):223-230. https://doi.org/10.1016/j.jcjo.2020.10.018) this number may seem small, but it is difficult locating and engaging with individuals with DR and DME, at least partially as a result of low disease awareness. These challenges have been discussed in various research efforts, including an article published recently by researchers associated with FBC. (Andrews C, Yoganathan P, Pereira JA. Blind Spots: Gaps in Disease Knowledge and the Role of Patient Education for Canadians with Diabetic Macular Edema. Can J Diabetes. 2021;45(4):375-378. doi: 10.1016/j.jcjd.2020.10.001)
Out of these respondents, most were between either 61 and 80 (44.4%) or 41 and 60 (37%), with a mean age of 56.8 (SD = 13.2). Most were either working full time (38.9%) or retired (33.3%), and a majority resided in urban regions within Ontario (41.8%), British Columbia (14.9%), Alberta (13.4%), and Quebec (11.9%), followed by smaller groups within other provinces.
Table 1: Baseline Characteristics of Respondents (n = 67)
Characteristic | n (%) |
|---|---|
Age (n = 54) | |
Mean age (SD) | 56.8 (13.2) |
18 - 40 years | 9 (16.7) |
41 - 60 years | 20 (37.0) |
61 - 80 years | 24 (44.4) |
Over 80 years | 1 (1.9) |
Biological Sex (n = 54) | |
Female | 23 (42.6) |
Male | 31 (57.4) |
Intersex | 0 (0.0) |
Province (n = 67) | |
Ontario | 28 (41.8) |
British Columbia | 10 (14.9) |
Alberta | 9 (13.4) |
Quebec | 8 (11.9) |
Manitoba | 3 (4.5) |
Nova Scotia | 3 (4.5) |
Newfoundland | 2 (3.0) |
Yukon | 2 (3.0) |
New Brunswick | 1 (1.5) |
Saskatchewan | 1 (1.5) |
Location (n = 67) | |
Urban | 62 (92.5) |
Rural | 5 (7.5) |
DME/DR in one eye or both eyes (n = 67) | |
Both eyes | 51 (76.1) |
One eye | 10 (14.9) |
I don’t know | 6 (9.0) |
Other household members (n = 60) | |
Partner/spouse | 43 (71.7) |
My child(ren) | 16 (26.7) |
No one | 9 (15.0) |
Family member(s) other than partner and child | 3 (5.0) |
I live in a retirement home | 2 (3.3) |
Roommate/friend | 2 (3.3) |
I live in a nursing home/long-term care facility | 1 (1.7) |
Employment Status (n = 54) | |
Retired | 18 (33.3) |
Employed, working full-time | 21 (38.9) |
Employed, working part-time | 0 (0.0) |
Not employed, looking for work | 2 (3.7) |
Student | 1 (1.9) |
Unemployed due to illness or disability | 8 (14.8) |
Homemaker | 0 (0.0) |
Parental leave | 0 (0.0) |
Taking care of a family member | 1 (1.9) |
Other: Employed but on disability (2), self-employed (1) | 3 (5.6) |
Disease Experience
Respondents made it clear that both DR and DME have substantial and life-altering impacts on daily life. When asked which activities are most impact by their disease, they emphasized effects on reading, using a phone, and driving, activities that many individuals take for granted.
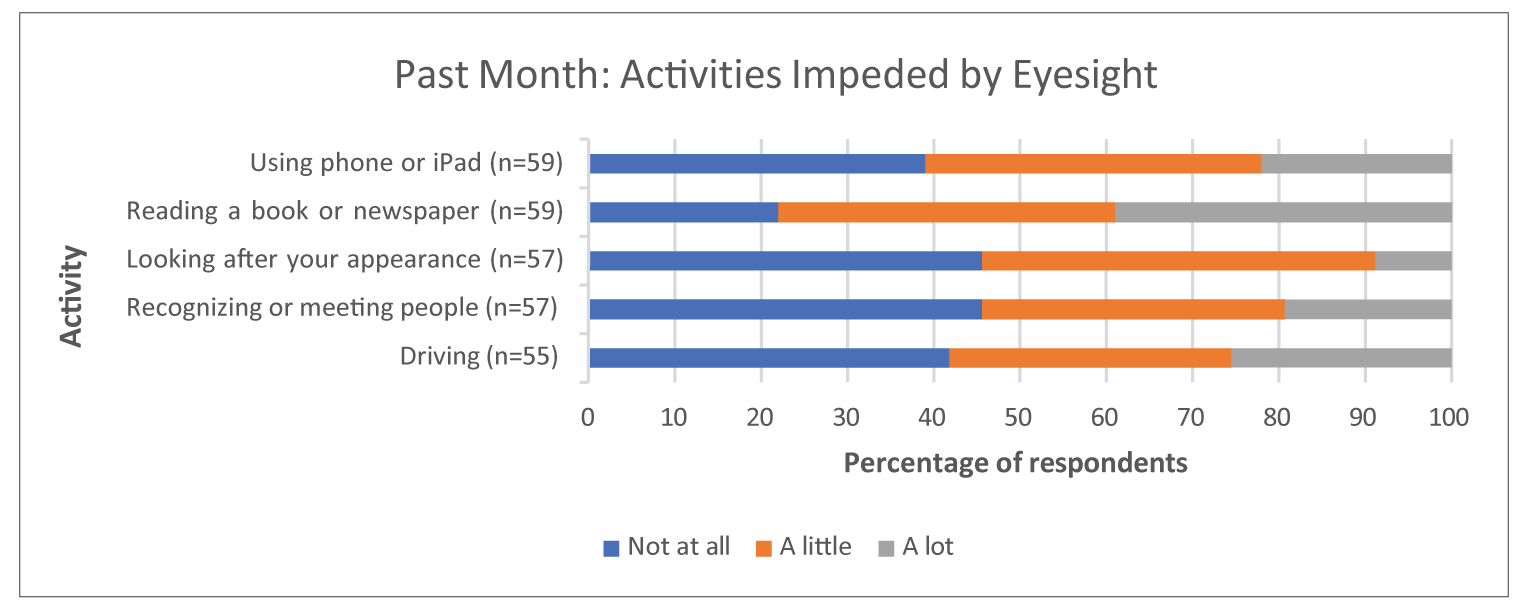
These difficulties were also framed in terms of “challenges.” When asked about the kinds of challenges they face as a result of DR or DME, a significant majority of respondents selected “worry that my condition might worsen in the future” (80.3%), followed by “not being able to do the daily activities I used to” (45.9%) and “explaining my condition to family and friends” (36.1%).
Table 2: Challenges with DMR/DR (n = 61)
Challenges | n (%) |
|---|---|
Worry that my condition might worsen in the future | 49 (80.3) |
Not being able to do the daily activities I used to | 28 (45.9) |
The long wait times for appointments | 18 (29.5) |
Explaining my condition to family and friends | 22 (36.1) |
Lack of social support | 14 (23.0) |
Finding answers to my questions about my condition | 18 (29.5) |
Socializing | 19 (31.1) |
Other* | 5 (8.2) |
*Getting the test I need prior to injections, working/finding work, no funding for technology or training, how long it takes to learn technology, getting appointments with my very busy retinologist.
The strong emphasis on worry in relation to the condition worsening implies the existence of emotional and psychological burdens as well; DR and DME may affect daily life as a result of lower visual acuity, but they may also lead to significant psychological strain in the form of a generalized anxiety related to the future. Following up on this notion, respondents were asked to specify their concerns over the last month, with many selecting that they are concerned about their eyesight worsening “all the time” or “a lot of the time.” Respondents also emphasized “coping with everyday life” and “general safety when out of the home” as notable concerns.
Recognizing that both DR and DME are complications of diabetes, it is useful to frame these considerations within the broader experiences of diabetes as a complex and impactful disease. Common symptoms of diabetes include extreme fatigue, unusual thirst, frequent urination and weight change (gain or loss). Diabetes requires considerable self- management, including eating well, engaging in regular physical activity, maintaining a healthy body weight, taking medication as prescribed, monitoring blood glucose, and managing stress. When Diabetes Canada asked Canadian diabetes patients how the disease impacts their lives, several described diabetes as a condition that must be dealt with 24 hours a day, 7 days a week, 365 days a year with no breaks and no holidays or time off. It is physically and mentally exhausting.
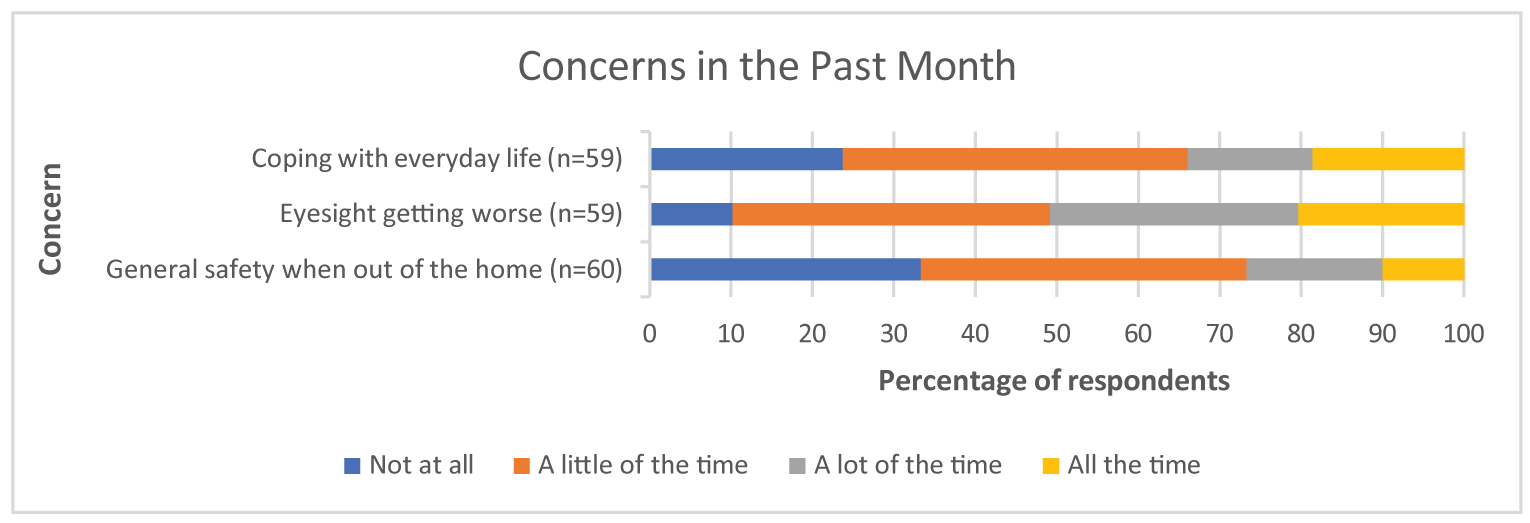
It is clear that DR and DME weigh heavily on the minds of affected individuals, here shown as persistent emotional and psychological factors. This notion was again carried forward in relation to both requiring assistance as well as feelings of loneliness and isolation. In both cases, a majority of respondents replied that they had both experiences (needing assistance and feelings of isolation) at least “a little of the time.”
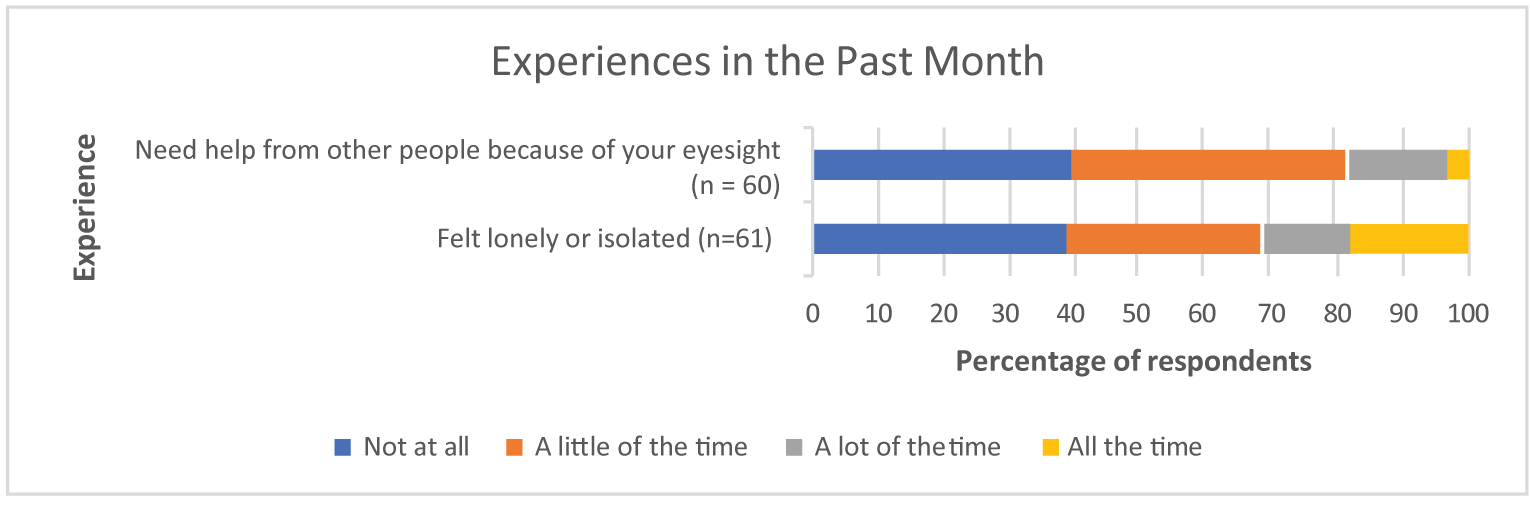
The experience of needing help also highlights the social dimensions of DR and DME, implying that the impacts of the diseases extend beyond one’s personal life to touch on friends and family members. Any analysis of these diseases should take into account the social dimensions of lived experience that are common across eye disease that affect visual acuity and make daily life more challenging.
Overall, it is clear that DR and DME have significant and life-altering impacts on the lives of those who are affected by them. Whether it be in relation to reading or worrying or relying on others, the diseases tend to affect the details and complexities of everyday living in a pervasive manner (as opposed to being a secondary or background consideration). For this reason, it is reasonable to conceptualize DR and DME as considerable burdens on the daily lives of patients.
Importantly, it is also reasonable to assume that these impacts have been more intensely felt during the COVID-19 pandemic, especially in relation to loneliness and isolation. This survey collected information before the full scale of the pandemic was known (or even possible to conceptualize)—as a result, the responses do not reflect the full impact of COVID-19 on the lives of patients with DR and DME. That said, the CCB conducted a separate survey in April of 2020 that was exclusively focused on the pandemic and its effects; it showed that fear, anxiety, loneliness, and other psychosocial impacts were intensified for patients with age-related macular edema (AMD) and DR during the pandemic. A follow-up study showed that almost 70,000 fewer eye injections for AMD and DR were performed in 2020 compared to 2019, and that 1,500 fewer patients received injections for AMD and 458 fewer patients received injections for DR in 2020 compared with 2019. A summary of these findings is below:
CCB Summary of the Impacts of COVID-19 for Patients Living with Vision Loss
In April 2020, the CCB conducted a survey on the impact of the COVID-19 pandemic on Canadians who are blind, deafblind or partially-sighted (Gordon K. “The impact of the COVID-19 pandemic on Canadians who are blind, deaf-blind, and partially-sighted” (2020). Available at: https://ccbnational.net/shaggy/wp-content/uploads/2020/05/COVID-19-Survey-Report-Final-wb.pdf). What we discovered was a community experiencing loneliness and living with considerable stress. Almost half the 572 respondents to the CCB survey (46%) said they hadn’t felt safe going outside the home since the initial lockdown. 47% of respondents said that they needed a sighted guide to assist them when they left home. Respondents said they were concerned about maintaining social distancing and having others maintain social distancing with them. Since most hospitals and doctors’ offices were not permitting anyone to accompany their patient, this meant that a substantial barrier existed for anyone requiring a sighted guide to access their doctor. This undoubtedly resulted in many people missing their regular appointments for anti-VEGF injections. Furthermore, 42% of respondents were worried about their ability to have someone accompany them to a doctor and almost half (49%) were worried about their ability to get transportation to a doctor, hospital, or testing site. About one third of respondents (36%) said that they had had an important medical appointment cancelled as a result of the COVID-19 pandemic. Many also expressed special concerns about treatment for their eye condition and were afraid that they may lose more vision as a result of missing appointments.
A subsequent study, commissioned by CCB and FBC, (Deloitte Access Economics, Addendum to the cost of vision loss and blindness in Canada. The impact of COVID-19. (report commissioned by the Canadian Council of the Blind), August 2021. Available at: https://ccbnational.net/shaggy/2021/10/12/the- impact-of-covid-19-an-addendum-to-the-cost-of-vision-loss-in-canada-study/) reported the extent of the cancelled appointments for anti-VEGF injections. This report estimated that almost 70,000 fewer eye injections for the treatment of age-related macular degeneration (AMD) and diabetic retinopathy/DME were performed in 2020 compared with 2019.
This study also reported that 458 fewer patients received injections for diabetic retinopathy and 1,500 fewer patients received injections for AMD in 2020 compared with 2019. When combined with other delayed or cancelled eye examinations and treatments it was estimated that an additional 1,437 people experienced vision loss due to the pandemic.
Any treatment that can extend the time between required injections can be expected to be a great advantage to people living with vision loss who are not venturing out of their homes for medical appointments. Such a medication would carry significant potential to minimize unnecessary vision loss.
Experiences With Currently Available Treatments
A majority of survey participants (56.4%) indicated that they currently receive injections as a treatment for DR or DME, with the most common brand being Lucentis (29.4%), followed by Eylea (24.6%), Avastin (20.2%), and Ozurdex (13.5%). The remainder of patients indicated that they did not know the brand of their injection.
Most respondents selected that their last injection was 1-5 years ago (26.9%), followed by more than 5 years ago (16.4%), 3-11 months ago (10.4%), and less than 3 months ago (4.5%).
Table 3: Timing of First Injection (n = 67)
First Injection | n (%) |
|---|---|
Less than 3 months ago | 3 (4.5) |
3-11 months ago | 7 (10.4) |
1-5 years ago | 18 (26.9) |
More than 5 years ago | 11 (16.4) |
I’ve never received injections for DME or DR | 28 (41.8) |
The low number of respondents (4.5%) who received injections more recently is disconcerting, potentially indicating high drop-off and nonadherence in relation to injections. If this is the case, it aligns with existing research showing that nonadherence to intravitreal injections is quite high (Okada M, Mitchell P, Finger RP, Eldem B, et al. Nonadherence and Nonpersistence to Intravitreal Injection Therapy for Neovascular Age-Related Macular Degeneration: A Mixed-Methods Systematic Review. Ophthalmology. 2021;128;2;234-247. https://doi.org/10.1016/j.ophtha.2020.07.060).)
Satisfaction, Adherence, and Assistance
The largest number of respondents showed that they are “satisfied” with their injections (54.5%) and that “they helped me avoid losing more eyesight” (63.6%).
Table 4: Level of Satisfaction with Injections (n = 22)
Level of satisfaction | n (%) |
|---|---|
Very dissatisfied | 1 (4.5) |
Dissatisfied | 1 (4.5) |
Neither satisfied nor dissatisfied | 7 (31.8) |
Satisfied | 12 (54.5) |
Very satisfied | 1 (4.5) |
Table 5: How the Injections Have Helped (n = 22)
Benefits | n (%) |
|---|---|
They helped me avoid losing more eyesight | 14 (63.6) |
They dried up fluid/blood in my eye(s) | 10 (45.4) |
They improved my eyesight | 7 (31.8) |
They have had no effect but I receive injections because my doctor recommends them | 3 (13.6) |
I don't know | 1 (4.5) |
Other* | 3 (13.6) |
*Think it’s helping, stopped proliferation of blood vessels, have tunnel vision in one eye but it started to get tightened much more than last year
A majority of respondents who receive injections also indicated that they have not missed an injection in the last year (68.2%). Despite this, the number of patients who have missed injections is sizeable (31.8%) and deserving of attention. Further, in a similar study on AMD conducted by our groups, the percentage of missed appointments was just below 20%. It is worth considering why patients with DR and DME appear to be missing more appointments that those with AMD. Additionally, since this data were collected before COVID, it is safe to assume that more appointments are being missed today then at the beginning of 2020. This notion is supported by findings from the CCB COVID study, which is referenced at the end of section 3 in this submission: “This study also reported that 1,500 fewer patients received injections for AMD and 458 fewer patients received injections for diabetic retinopathy in 2020 compared with 2019. When combined with other delayed or cancelled eye examinations and treatments it was estimated that an additional 1,437 people experienced vision loss due to the pandemic.” Clearly, missed injection appointments—and by extension all forms of nonadherence and non-persistence—require serious attention when developing policies and treatments for DR and DME and support the development and approval of new treatments which can reduce treatment burden.
Following up on this, our survey asked respondents why they have cancelled or delayed appointments in the past. Although the response rate for this question was quite low, most respondents indicated that they were too busy to attend the appointment (50%), followed by not feeling well (33.3%), being “unable to find someone to take me to the appointment” (16.7%), and being “scared to receive the injection” (16.7%).
Table 6: Reason for Cancellation or Delay (n = 6)
Reason | n (%) |
|---|---|
Unable to find someone to take me to the appointment | 1 (16.7) |
Unable to travel to appointment | 0 (0.0) |
Could not afford attending the appointment | 0 (0.0) |
Too busy to attend appointment | 3 (50.0) |
Did not know how important the injection was to my sight | 0 (0.0) |
Scared to receive the injection | 1 (16.7) |
Did not find previous injections helpful | 0 (0.0) |
I forgot about the appointment | 0 (0.0) |
I was not feeling well | 2 (33.3) |
Other | 0 (0.0) |
Regarding the inability to find someone to assist with travel, our questions did uncover a significant reliance on assistance in this area. When asked who helps them attend their injections appointments, over 80% of participants indicating receiving travel from either a spouse, family member, or friend. These individuals helped in a number of ways, including with travel (93.3%), with waiting at the appointment (80%), and with assistance in everyday tasks after the injection (33.3%).
Table 7: Type of Help Provided (n = 15)
Type of help | n (%) |
|---|---|
Help me after the injections with everyday tasks | 5 (33.3) |
Wait with me at the appointment | 12 (80.0) |
Travel with me or drive me to/from the appointment | 14 (93.3) |
Take care of things at home while I am away | 1 (6.7) |
Physical support at my appointment | 4 (26.7) |
Other | 1 (6.7) |
These responses once again underscore the degree to which DR and DME lead to a reliance on family and friends for caregiving and other forms of assistance, most commonly for travel to and from appointments.
Travel and Time Commitment
Almost half of the respondents indicating facing travel time of less than 30 minutes (45.5%) to get to their injection appointment, followed by 31 - 60 minutes (40.9%) and 1 - 2 hours (9.1%).
Table 8: Travel Time (One-Way) to Injection Appointment (n = 22)
Time | n (%) |
|---|---|
Less than 30 minutes | 10 (45.5) |
31-60 minutes | 9 (40.9) |
More than 1 hour, and less than 2 hours | 2 (9.1) |
More than 2 hour, and less than 4 hours | 0 (0.0) |
4 hours or longer | 1 (4.5) |
When asked how long they spend at their injection appointments, the larges group reported less than 1 hour (42.9%), followed by 1 - 2 hours (33.3%) and 2 - 4 hours (14.3%).
Table 9: Total Time Spent Per Appointment at Office of Doctor/Clinician for Injection Appointment (n = 21)
Time | n (%) |
|---|---|
Less than 1 hour | 9 (42.9) |
More than 1 hour, and less than 2 hours | 7 (33.3) |
2 hours or more, but less than 4 hours | 3 (14.3) |
4 hours or more, but less than 6 hours | 1 (4.8) |
More than 6 hours | 1 (4.8) |
In terms of the ease or difficulty of travel, responses were varied but skewed towards the easy end of the spectrum, with most respondents selecting that travel is either very easy (27.3%), easy (27.3%), or neither easy nor difficult (27.3%).
Table 10: What Is It Like to Travel to Your Injection Appointments? (n = 22)
Ease of travel | n (%) |
|---|---|
Very difficult | 0 (0.0) |
Difficult | 4 (18.2) |
Neither easy nor difficult | 6 (27.3) |
Easy | 6 (27.3) |
Very easy | 6 (27.3) |
That said, 4 individuals did report difficulty related to their travel, and when asked about the reasons, they selected distance from home (50%), poor condition of vehicle (25%), cost (25%), and difficultly related to taking public transit (25%).
Table 11: What Makes It Difficult for You to Travel to Your Injection Appointments (n = 4)
Reason | n (%) |
|---|---|
It is far from home | 2 (50.0) |
My vehicle is in poor condition | 1 (25.0) |
Poor road conditions | 0 (0.0) |
It is expensive to travel | 1 (25.0) |
Other* | 1 (25.0) |
*Alone it is impossible to take the metro, but with my daughter, difficulty is when I don’t hold her arm
Interestingly, although in these responses both travel and waiting appear as somewhat minimal concerns, both are flagged as the most difficult aspects of the injection routine in data from a different question. When asked what makes it difficult to travel to injection appointments, half of the respondents selected long wait times, while the remainder selected difficulties such as “finding someone to drive me to/from the appointment” (31.8%) and “taking time off work to attend” (27.3%).
Table 12: Most Difficult Part of Eye Injection Appointments (n = 22)
Reason | n (%) |
|---|---|
Anxiety or fear about the injection | 6 (27.3) |
Long waiting time at the appointment | 11 (50.0) |
Cost of travel to/from the appointment | 0 (0.0) |
Finding someone to drive me to/from the appointment | 7 (31.8) |
Finding someone to help me with my daily tasks after the injection | 0 (0.0) |
I don't find any part difficult | 4 (18.2) |
Scratchiness or pain in my eye after the appointment | 4 (18.2) |
Taking time off work to attend | 6 (27.3) |
Other* | 3 (13.6) |
*Spouse must take time off work to drive me, if I didn’t have my daughter I’d find difficulties in everything, hotel stay required (travel from Yukon to Vancouver) which is expensive.
When framed or conceptualized in terms of what is most difficult, then, both travel and waiting emerge as central concerns. It is also worth considering whether these issues are exacerbated in rural parts of Canada. Although a regional sub-analysis has not be conducted for this study, it is entirely possible that travel, waiting, and strain on caregivers are even more challenging for Canadians living in rural and remote parts of the country. This is certainly a factor that needs to be considered in the development of new treatments for these diseases.
Emotional and Physical Effects
In response to the question about difficulty, a significant number of patients also selected “anxiety or fear about the injection” (27.3%), highlighting the fact that injections into the eye are emotionally burdensome for some patients. This is interesting, considering that many patients also indicated being “satisfied” with their injections, as well as appreciative of the impact on their sight. It may show that those with DR or DME tend to manage their fear and anxiety in relation to injections as a matter of course. Injections still carry an emotional or psychological impact, but this has become internally managed in such a way as to be common or matter of fact.
The physical burdens of injections are not to ignored either. In response to the same question about the difficult aspects of injections, 18.2% of patients indicated “scratchiness or pain in the back of my eye” as a difficulty worth noting. It is clear that physical impacts are a factor for some patients, then. This is supported to some degree by the number of patients who experience some pain during the injection: when asked to indicate their pain level, a significant majority selected that the injections are “slightly painful” (81.8%). The remainder selected “not painful at all” (9.1%) and “painful” (9.1%).
Table 13: How Painful Is the Injection for You? (n = 22)
Reason | n (%) |
|---|---|
Not painful at all | 2 (9.1) |
Slightly painful | 18 (81.8) |
Painful | 2 (9.1) |
Extremely painful | 0 (0.0) |
Moving into the evening after the injection, our respondents showed an overall transition into a more painful experience. While 45.5% of patients indicated that the evenings are “not painful at all,” 40.9% selected “slightly painful” and 13.6% chose “painful.” As a result, over half of respondents indicated some form of eye pain lingering into the evening.
Table 14: How Painful Is the Injection for You in the Evening After? (n = 22)
Reason | n (%) |
|---|---|
Not painful at all | 10 (45.5) |
Slightly painful | 9 (40.9) |
Painful | 3 (13.6) |
Extremely painful | 0 (0.0) |
Vision was shown to be impacted post-injection as well, with the largest group of respondents selecting that their vision stayed blurry “until I go to sleep that night” (31.6%). This was followed by vision being blurry for 1 - 3 hours (26.3%) and for 4 - 6 hours (21.1%).
Table 15: After an Injection, for How Long Is Your Vision Blurry? (n = 19)
Frequency | n (%) |
|---|---|
Less than 1 hour | 3 (15.8) |
1-3 hours | 5 (26.3) |
4-6 hours | 4 (21.1) |
For at least 24 hours | 1 (5.3) |
Until I go to sleep that night | 6 (31.6) |
Given the prevalence of blurry vision among the cohort, it is unsurprising that they indicated a number of daily activities that become difficult or impossible post-injection. When asked about which activities they can longer do after an injection, the largest groups chose “watch TV” (57.1%) and “read” (57.1%), followed by “drive” (28.6%), “work” (21.4%), and “prepare meals (14.3%). All respondents to this question choose at least one activity that they can no longer do.
Table 16: Which of the Following Are You Unable to do After an Injection? (n = 14)
Activity | n (%) |
|---|---|
Watch TV | 8 (57.1) |
Read | 8 (57.1) |
Drive | 4 (28.6) |
Prepare meals | 2 (14.3) |
Provide care to family members | 0 (0.0) |
Work | 3 (21.4) |
None of the above activities | 0 (0.0) |
These responses emphasize the emotional and physical impacts of living with and treating DR and DME, making it clear that the diseases exact a physical and psychological toll that exists alongside the logistical and financial challenges associated with travel and time.
Improved Outcomes
Our survey did not ask patients for their views on improving their experiences and outcomes. That said, the responses to our survey make it clear that any treatment that reduces the physical, psychological, and logistical strain on patients would be preferred. In terms of physical and psychological strain, this could take the form of a treatment that is less invasive, or one that is similarly invasive but that is administered less frequently. The frequency of the treatment could play a role in the reduction of logistical demands as well: a treatment that is taken or received less often would require fewer travel appointment, would decrease dependency on caregivers, and potentially more.
Experience With Drug Under Review
None of the respondents indicated using Beovu. We did conduct an interview with a patient, living in Alberta who has diabetic macular edema. The story illustrates the complexity of the disease and the need for new treatments. These are her words:
“I started losing my vision 15 years ago and went through a three-year period of one eye surgery and treatment after the next. I stopped driving, had to leave the job that I loved, and dealt with mental health challenges as a result. It all started with my diagnosis of type 2 diabetes in 1992 – although I didn’t realize the connection at the time. In fact, I wasn’t made aware that vision loss was a complication of diabetes until the damage had been done.
In 2005, I developed a cataract in one eye. The cataract surgery didn’t go well. When I went to the doctor a couple weeks later for a check-up, he told me that my eye was hemorrhaging (bleeding) and referred me to a retina specialist. My visit to this specialist was a rude awakening. He told me that all the trouble I was having with my eye had begun with my diabetic retinopathy (DR). I had no idea what he was talking about. ‘You’ve known that you had DR for a couple years, right?’ he asked. Not only did I not know, but I’d never even heard the term before. The specialist was stunned, as was I.
My DR – which I’d just learned I had – had progressed to diabetic macular edema. Despite multiple surgeries and 16 rounds of laser surgery, the treatment didn’t work. I started taking anti-VEGFs and they worked for a short time, but I had to go from an eye injection every six weeks to every three and a half weeks eventually, to reduce and manage the bleeding and edema in my eye.
When my anti-VEGF treatments stopped working, I was put on a steroid treatment that has dramatically improved the bleeding in my eye. Unfortunately, it’s not covered by Alberta’s drug benefit program. For years, I was able to take advantage of my partner’s private plan, which covered a portion of the medication, but eventually the relationship ended, and so did my access to treatment. Despite the cost, fortunately, today I’m miraculously stable due to the longevity of this drug, but I make sacrifices to save the vision I have left.”
Companion Diagnostic Test
Not applicable.
Anything Else?
Researchers, health practitioners, policy experts, and others agree that diabetes is a growing and evolving epidemic, both globally and in Canada. As the incidence of diabetes grow, DR and DME will grow as well. A patient’s life is impacted by these diseases through a range of factors: life changes, loss of productivity, missed work/school hours, and more. As our data shows, DR and DME are diseases that weigh heavily on a patient’s mind, suggesting a strong psychological burden. Caregivers are impacted by the diseases as well, and in complex ways that are not always easy to measure or quantify.
DR and DME have these impacts, surely, but it is safe to assume that those impacts and associated burdens are more pronounced among vulnerable populations and those living outside of Canada’s urban centres. And during the COVID pandemic, it is also safe to assume that the burdens and challenges highlighted in patient responses have only become more pronounced. As the number of people living with diabetes in Canada increases, more patients in rural communities will need options that are effective, that help them comply with treatment programs, and that reduce the psychological toll of the disease.
In the context of diabetes, different people with diabetes require different medications and treatment modalities to help them effectively manage their disease. Their unique clinical profile, preferences and tolerance of therapy should direct prescribers to the most appropriate choice and combination of treatments for disease management. Many individuals with diabetic macular edema are also managing multiple other health conditions, highlighting the need for treatments that reduce the risk of non-compliance.
This submission is a snapshot of the experiences of a small number of DR and DME patients in Canada—not a complete or final one, of course, because no overview can be, but nevertheless one that is grounded in the lived experiences of patients who offered their time, expertise, and insights to participate in this process. The focus of this submission has been on expanding our understanding of how these individuals perceive their diseases and treatments; the burdens that impact their lives; the barriers they face as a result of vision loss and other factors; and the psychological and emotional tolls of the diseases. As organizations that represent patients with DR, DME, and other eye diseases, our overarching goal is to contribute meaningfully to the discussion and potential implementation of new treatments in this space—in particular, to guide that discussion along lines that are patient-centered, that focus on optimal and equitable outcomes, and that recognize the expertise of patients with lived experience of DR/DME and their value in the review process of new treatments.
We look forward to continuing to work with CADTH to support Canadians living with DR and DME, and to advance our collective understanding of how the diseases impact their lives.
Conflict of Interest Declaration — Fighting Blindness Canada, The Canadian Council of the Blind, CNIB, Vision Loss Rehabilitation Canada, Diabetes Canada
Did you receive help from outside your patient group to complete this submission? If yes, please detail the help and who provided it.
FBC contracted an independent consultant with expertise in patient centered research to draft this submission.
Did you receive help from outside your patient group to collect or analyze data used in this submission? If yes, please detail the help and who provided it.
FBC contracted JRL Research & Consulting to program and test the survey, perform qualitative interviews and clean and analyze the data.
List any companies or organizations that have provided your group with financial payment over the past 2 years AND who may have direct or indirect interest in the drug under review.
Table 17: Financial Disclosure for Fighting Blindness Canada
Company | $0 to 5,000 | $5,001 to 10,000 | $10,001 to 50,000 | In Excess of $50,000 |
|---|---|---|---|---|
Bayer | — | — | — | X |
Novartis | — | — | — | X |
Roche | — | — | — | X |
Abbvie-Allergan | — | — | — | X |
Table 18: Financial Disclosure for The Canadian Council of the Blind
Company | $0 to 5,000 | $5,001 to 10,000 | $10,001 to 50,000 | In Excess of $50,000 |
|---|---|---|---|---|
Bayer | — | — | — | X |
Novartis | — | — | — | X |
Table 19: Financial Disclosure for CNIB
Company | $0 to 5,000 | $5,001 to 10,000 | $10,001 to 50,000 | In Excess of $50,000 |
|---|---|---|---|---|
Astra Zeneca (CNIB) | — | — | X | — |
Bausch Foundation (CNIB) | — | — | X | — |
Bayer (CNIB) | — | — | — | X |
Johnson & Johnson (CNIB) | — | — | X | — |
Novartis (CNIB) | — | — | — | X |
Table 20: Financial Disclosure for Vision Loss Rehabilitation Canada
Company | $0 to 5,000 | $5,001 to 10,000 | $10,001 to 50,000 | In Excess of $50,000 |
|---|---|---|---|---|
No COI | — | — | — | — |
Table 21: Financial Disclosure for Diabetes Canada
Company | $0 to 5,000 | $5,001 to 10,000 | $10,001 to 50,000 | In Excess of $50,000 |
|---|---|---|---|---|
Novo Nordisk | — | — | — | X |
AstraZeneca | — | — | — | X |
Janssen | — | — | — | X |
Sanofi | — | — | — | X |
Bayer | — | — | X | — |
Clinician Input
No clinician group input has been received.
ISSN: 2563-6596
Disclaimer: The information in this document is intended to help Canadian health care decision-makers, health care professionals, health systems leaders, and policy-makers make well-informed decisions and thereby improve the quality of health care services. While patients and others may access this document, the document is made available for informational purposes only and no representations or warranties are made with respect to its fitness for any particular purpose. The information in this document should not be used as a substitute for professional medical advice or as a substitute for the application of clinical judgment in respect of the care of a particular patient or other professional judgment in any decision-making process. The Canadian Agency for Drugs and Technologies in Health (CADTH) does not endorse any information, drugs, therapies, treatments, products, processes, or services.
While care has been taken to ensure that the information prepared by CADTH in this document is accurate, complete, and up-to-date as at the applicable date the material was first published by CADTH, CADTH does not make any guarantees to that effect. CADTH does not guarantee and is not responsible for the quality, currency, propriety, accuracy, or reasonableness of any statements, information, or conclusions contained in any third-party materials used in preparing this document. The views and opinions of third parties published in this document do not necessarily state or reflect those of CADTH.
CADTH is not responsible for any errors, omissions, injury, loss, or damage arising from or relating to the use (or misuse) of any information, statements, or conclusions contained in or implied by the contents of this document or any of the source materials.
This document may contain links to third-party websites. CADTH does not have control over the content of such sites. Use of third-party sites is governed by the third-party website owners’ own terms and conditions set out for such sites. CADTH does not make any guarantee with respect to any information contained on such third-party sites and CADTH is not responsible for any injury, loss, or damage suffered as a result of using such third-party sites. CADTH has no responsibility for the collection, use, and disclosure of personal information by third-party sites.
Subject to the aforementioned limitations, the views expressed herein are those of CADTH and do not necessarily represent the views of Canada’s federal, provincial, or territorial governments or any third party supplier of information.
This document is prepared and intended for use in the context of the Canadian health care system. The use of this document outside of Canada is done so at the user’s own risk.
This disclaimer and any questions or matters of any nature arising from or relating to the content or use (or misuse) of this document will be governed by and interpreted in accordance with the laws of the Province of Ontario and the laws of Canada applicable therein, and all proceedings shall be subject to the exclusive jurisdiction of the courts of the Province of Ontario, Canada.
The copyright and other intellectual property rights in this document are owned by CADTH and its licensors. These rights are protected by the Canadian Copyright Act and other national and international laws and agreements. Users are permitted to make copies of this document for non-commercial purposes only, provided it is not modified when reproduced and appropriate credit is given to CADTH and its licensors.
Redactions: Confidential information in this document may be redacted at the request of the sponsor in accordance with the CADTH Drug Reimbursement Review Confidentiality Guidelines.
Stakeholder Input: The views expressed in each submission are those of the submitting organization or individual; not necessarily the views of CADTH or of other organizations. As such, they are independent of CADTH and do not necessarily represent or reflect the view of CADTH. No endorsement by CADTH is intended or should be inferred. By filing with CADTH, the submitting organization or individual agrees to the full disclosure of the information. CADTH does not edit the content of the submissions.
CADTH does use reasonable care to prevent disclosure of personal information in posted material; however, it is ultimately the submitter’s responsibility to ensure no identifying personal information or personal health information is included in the submission. The name of the submitting organization or individual and all conflict of interest information are included in the submission; however, the name of the author, including the name of an individual patient or caregiver submitting the patient input, are not posted.
Accessibility: CADTH is committed to treating people with disabilities in a way that respects their dignity and independence, supports them in accessing material in a timely manner, and provides a robust feedback process to support continuous improvement. All materials prepared by CADTH are available in an accessible format. Where materials provided to CADTH by a submitting organization or individual are not available in an accessible format, CADTH will provide a summary document upon request. More details on CADTH’s accessibility policies can be found here.
About CADTH: CADTH is an independent, not-for-profit organization responsible for providing Canada’s health care decision-makers with objective evidence to help make informed decisions about the optimal use of drugs, medical devices, diagnostics, and procedures in our health care system.
Funding: CADTH receives funding from Canada’s federal, provincial, and territorial governments, with the exception of Quebec.