Drugs, Health Technologies, Health Systems
Reimbursement Review
Guselkumab (Tremfya)
Sponsor: Janssen Inc.
Therapeutic area: Crohn disease
This multi-part report includes:
Clinical Review
Pharmacoeconomic Review
Clinical Review
Abbreviations
AE
adverse event
BIO-Failure
biologic therapy failure or intolerance
CD
Crohn disease
CDA-AMC
Canada’s Drug Agency
CDAI
Crohn’s Disease Activity Index
CI
confidence interval
CON-Failure
conventional therapy failure or intolerance
CRP
C-reactive protein
EOM
end of maintenance
FES
final efficacy and safety
GI Society
Gastrointestinal Society
GRADE
Grading of Recommendations Assessment, Development and Evaluation
HRQoL
health-related quality of life
IBD
inflammatory bowel disease
IBDQ
Inflammatory Bowel Disease Questionnaire
ICE
intercurrent event
ITC
indirect treatment comparison
LTE
long-term extension
MID
minimal important difference
NMA
network meta-analysis
NRI
nonresponse imputation
OR
odds ratio
PAS
primary analysis set
PRO
patient-reported outcome
PRO-2
patient-reported outcome 2
PY
patient-year
RCT
randomized controlled trial
SAE
serious adverse event
SC
subcutaneous
SD
standard deviation
SES-CD
Simple Endoscopic Score for Crohn’s Disease
SLR
systematic literature review
TNF
tumour necrosis factor
Executive Summary
An overview of the submission details for the drug under review is provided in Table 1.
Table 1: Background Information on the Application Submitted for Review
Item | Description |
|---|---|
Drug product | Guselkumab (Tremfya): 100 mg per 1 mL patient-controlled injector, 100 mg per 1 mL prefilled syringe, 200 mg per 2 mL prefilled syringe, 200 mg per 2 mL prefilled pen administered by subcutaneous injection. Guselkumab (Tremfya IV): 200 mg per 20 mL vial administered by IV infusion. |
Sponsor | Janssen Inc. |
Indication | For the treatment of adult patients with moderately to severely active Crohn’s disease |
Reimbursement request | As per indication |
Health Canada approval status | NOC |
Health Canada review pathway | Standard review |
NOC date | July 7, 2025 |
Recommended dosage | Induction dosage: 200 mg administered via IV infusion, or 400 mg administered via subcutaneous injection at week 0, week 4, and week 8. Maintenance dosage: 100 mg administered via subcutaneous injection at week 16 followed by every 8 weeks thereafter, or 200 mg administered by subcutaneous injection at week 12 and every 4 weeks thereafter. |
NOC = Notice of Compliance.
Source: Product monograph for Tremfya.1
Introduction
Crohn disease (CD) is a chronic form of inflammatory bowel disease (IBD) that can affect any part of the gastrointestinal tract, but most commonly affects the ileum (i.e., small intestine), colon (i.e., the beginning of the large intestine), and rectum.2,3 CD is typically diagnosed in adolescents and young adults, most commonly between the ages of 20 years and 30 years.4 In 2023, the incidence of IBD in Canada was estimated at 30 per 100,000 individuals, with CD accounting for 12.2 per 100,000.5 CD can manifest in 3 phenotypical forms: inflammatory, stricturing, and penetrating (fistulas and abscesses).6 Common symptoms of CD include abdominal pain, rectal bleeding, fatigue, vomiting, diarrhea, perianal disease, weight loss, and bloating.4,7,8 Potential complications of CD include malnutrition, anemia, bowel obstructions, fistulas, anal fissures, and intra-abdominal or other abscesses and ulcers.2,3 Risk factors for CD include cigarette smoking, a family history of IBD, prior infectious gastroenteritis, and frequent use of nonsteroidal anti-inflammatory drugs.9
The diagnosis of CD is established through a comprehensive assessment that integrates clinical evaluation with endoscopic, histological, radiological, and/or biochemical investigations.9 Therapeutic goals include inducing and maintaining clinical and endoscopic remission. Pharmaceutical treatments for CD include immunosuppressants, corticosteroids, tumour necrosis factor (TNF) alpha antagonists, interleukin inhibitors, Janus kinase inhibitors, and integrin inhibitors. The medical management of CD generally follows a stepwise approach, in which therapies are initiated sequentially and escalated to more advanced drugs or higher doses in cases of inadequate response. Not all patients respond to available treatments and their disease may become refractory to the current treatment regimens.
The objective of this report is to review and critically appraise the evidence submitted by the sponsor on the beneficial and harmful effects of guselkumab in the treatment of adult patients with moderately to severely active CD. The recommended induction dosage of guselkumab is either 200 mg administered by IV infusion, or 400 mg of guselkumab administered by subcutaneous (SC) injection at week 0, week 4, and week 8. For maintenance therapy, the recommended dosage of guselkumab is 100 mg administered by SC injection at week 16 and every 8 weeks thereafter, or 200 mg administered by SC injection at week 12 and every 4 weeks. The indication for guselkumab is for the treatment of adult patients with moderately to severely active CD, and the sponsor’s submitted reimbursement criteria align with this indication.
Perspectives of Patient, Clinicians, and Drug Programs
The information in this section is a summary of input provided by the patient and clinician groups that responded to the call by Canada’s Drug Agency (CDA-AMC) for input and from clinical experts consulted by CDA-AMC for the purpose of this review.
Patient Input
Two patient inputs were summarized for this review. The Gastrointestinal Society (GI Society) is a national charity with programs and services that support research, advocate for appropriate patient access to health care, and promote gastrointestinal and liver health. Crohn’s and Colitis Canada is a national, volunteer-based health charity focused on finding the cures for CD and ulcerative colitis. Information from both inputs was gathered from varied sources, which included published perspectives, online surveys, interviews with patients, and questionnaires.
The patient groups noted that CD often has a profound effect on patients’ quality of life, affecting physical, emotional, and social factors of patients at home, at school, or in the workplace. Disease severity may fluctuate, thus requiring routine testing, reassessments, and medication changes. The GI Society noted that patients with CD preferred sustained remission and treatment response over relieving any 1 symptom. In a survey conducted by Crohn’s and Colitis Canada, most respondents with moderate IBD (53%) and severe IBD (60%) believed that access to different treatment options could make them feel better. Both groups noted that treating CD requires a multifaceted strategy that allows for the management of symptom and disease consequences with therapies that target and reduce the underlying inflammation. Respondents in both patient group inputs highlighted that they had exposure to the following treatment options: systemic steroids, biologics and biosimilars, immunomodulators and antibiotics, sulfasalazine, 5-aminosalicylates, and nonsystemic steroids. The majority of patients with moderate to severe CD who participated in the surveys expressed that they continued to experience symptoms with current treatment options. Both patient groups expressed that patients need effective treatment options that mitigate symptoms and improve quality of life, are convenient, and can be accessed in a timely manner. Patients expressed that they desired fewer medications and treatments that are safe, can minimize the use of steroids, can be administered at home, and can be taken as pills.
Major concerns regarding the existing treatments identified by the GI Society included limited access to adequate treatment supplies and continuity of care given that some patients respond differently to various medications, and in some cases may stop responding to medications after using them for some time. Both groups noted that patients have varied preferences for medication administration, influenced by a range of factors. One group noted the importance of varied treatment options that can cater to individual needs, without a requirement to trial conventional therapies before accessing targeted treatments. Therefore, there is a need for new, effective treatments for patients that could improve quality of life and eliminate symptoms, pain, frustration, and hardship.
Clinician Input
Input From Clinical Experts Consulted for This Review
According to the clinical experts consulted by CDA-AMC, although a variety of treatment options are available for CD, not all patients respond adequately to existing therapies. The clinical experts consulted emphasized the importance of introducing highly effective treatments early in the disease treatment to optimize patient outcomes. Furthermore, the clinical experts identified a significant barrier to accessing biologics; a requirement was for patients whose disease had demonstrated an inadequate response to or inability to tolerate conventional therapy (i.e., immunomodulators) before initiating biologic treatment. Additionally, the clinical experts noted that the absence of clear guidance on the optimal sequencing of biologic therapies contributes to clinical uncertainty, often leading to treatment decisions being made without the support of robust comparative evidence.
The clinical experts indicated that guselkumab is unlikely to dramatically shift the current treatment paradigm for CD and is expected to be used similarly to other biologic therapies. Nonetheless, the clinical experts agreed that guselkumab should be accessible as a treatment option for patients with moderately to severely active CD and that it should not be reserved only for those who are intolerant of or have contraindications to other biologic drugs. The clinical experts also highlighted that a favourable safety profile makes it a viable alternative for patients who have experienced adverse effects with other therapies, such as anti-TNF drugs. According to the clinical experts consulted, guselkumab is considered appropriate for a broad population, including both patients with no prior exposure to biologics and patients with previous exposure to biologics — particularly those whose disease has not demonstrated improvement with or is intolerant of conventional therapies or other biologics. Patients best suited should have an established diagnosis of CD based on an ileocolonoscopy with active disease.
The clinical expert noted the following outcomes are used to determine patient response to treatment: clinical response or remission, endoscopic response or remission, and improved health-related quality of life (HRQoL). According to the clinical experts consulted, clinicians monitor response using a combination of symptom burden, endoscopic assessment, and biomarkers such as fecal calprotectin and C-reactive protein (CRP). The clinical experts indicated that the discontinuation of guselkumab may be considered in cases of primary nonresponse, worsening patient-reported outcomes (PROs), rising biomarkers, or adverse events (AEs) that cannot be adequately managed. The clinical experts emphasized that patients receiving guselkumab should be diagnosed, treated, and monitored by a specialist, such as a gastroenterologist or an internal medicine physician.
Clinician Group Input
No clinical group input was submitted for this review.
Drug Program Input
Input was obtained from the drug programs that participate in the CDA-AMC reimbursement review process. The following were identified as key factors that could potentially impact the implementation of a CDA-AMC recommendation for guselkumab:
relevant comparators
consideration for the initiation of therapy
consideration for the continuation or renewal of therapy
consideration of the discontinuation of therapy
consideration for the prescribing of therapy.
The clinical experts consulted by CDA-AMC provided advice on the potential implementation issues raised by the drug programs.
Clinical Evidence
Systematic Review
Description of Studies
Three multicentre, double-blind, randomized controlled trials (RCTs) — the GALAXI 2 study (N = 508), the GALAXI 3 study (N = 513), and the GRAVITI study (N = 347) — were included in the sponsor-submitted systematic literature review (SLR).
The GALAXI 2 and GALAXI 3 trials are identically designed, phase III, randomized, double-blind, placebo- and active-controlled (versus ustekinumab), parallel-group, multicentre trials. The primary objectives of both trials were to evaluate the clinical and endoscopic efficacy, and safety, of guselkumab in patients with moderately to severely active CD that has demonstrated an inadequate response to or failure to tolerate previous conventional therapy (oral corticosteroids and/or immunomodulators) or biologic therapy. Each trial included a 48-week main treatment phase, consisting of a 12-week induction period followed by a 36-week maintenance period. In both trials, patients in the guselkumab group received an induction dose of 200 mg intravenously every 4 weeks, followed by maintenance treatment with either 100 mg subcutaneously every 8 weeks (guselkumab regimen 1 [low dose]) or 200 mg SC every 4 weeks (guselkumab regimen 2 [high dose]). In the active control group, patients received a single weight-based IV dose of ustekinumab at week 0 (approximately 6 mg/kg), followed by SC maintenance dosing of 90 mg every 8 weeks. Patients were enrolled at 186 centres from 36 countries or territories (including 31 sites in Canada) in the GALAXI 2 trial, and 198 centres across 39 countries or territories (including 31 sites in Canada) in the GALAXI 3 trial.
The GRAVITI trial is a phase III, randomized, double-blind, placebo-controlled, parallel-group, multicentre study. The primary objectives of the GRAVITI trial were to evaluate the efficacy and safety of guselkumab in patients with moderately to severely active CD whose disease had demonstrated an inadequate response or intolerance to prior conventional therapy or biologic treatments. The 24-week main treatment phase included a 12-week induction period followed by a 12-week maintenance period; this was then followed by the extension treatment phase that included a 72-week maintenance period. During the GRAVITI trial, patients received guselkumab at a dose of 400 mg SC at week 0, week 4, and week 8 for induction, followed by either 100 mg SC every 8 weeks (guselkumab regimen 1 [low dose]) or 200 mg SC every 4 weeks (guselkumab regimen 2 [high dose]) for maintenance. Patients were enrolled at 143 centres from 23 countries or territories, including 5 sites in Canada.
Efficacy Results
Clinical Response at Week 12 and Clinical Remission at Week 48
GALAXI 2 and GALAXI 3 studies (IV induction and SC maintenance): In the GALAXI 2 study, the adjusted between-group difference compared to placebo was 38.1% (95% confidence interval [CI], 27.3% to 48.9%; P value < 0.001) for guselkumab regimen 1 (low dose) and 42.8% (95% CI, 31.6% to 53.9%; P value < 0.001) for guselkumab regimen 2 (high dose). In the GALAXI 3 study, the adjusted between-group difference compared to placebo was 34.2% (95% CI, 23.2% to 45.3%; P value < 0.001) for guselkumab regimen 1 and 35.0% (95% CI, 23.5% to 46.5%; P value < 0.001) for guselkumab regimen 2. Sensitivity, supportive, and subgroup analyses — including those conducted in patients with a history of biologic therapy inadequate response or intolerance (BIO-Failure group) and those with a history of conventional therapy inadequate response or intolerance (CON-Failure group) — were consistent with the primary analyses in both trials.
Clinical Response at Week 12 and Endoscopic Response at Week 48
GALAXI 2 and GALAXI 3 studies (IV induction and SC maintenance): In the GALAXI 2 study, the adjusted between-group difference compared to placebo was 33.7% (95% CI, 24.1% to 43.2%; P value < 0.001) for guselkumab regimen 1 and 32.9% (95% CI, 23.5% to 42.4%; P value < 0.001) for guselkumab regimen 2. In the GALAXI 3 study, the adjusted between-group difference compared to placebo was 27.9% (95% CI, 18.7% to 37.1%; P value < 0.001) for guselkumab regimen 1 and 30.8% (95% CI, 21.3% to 40.3%; P value < 0.001) for guselkumab regimen 2. Sensitivity, supportive, and subgroup analyses —including those conducted in the BIO-Failure and CON-Failure analysis subpopulations — were consistent with the primary analyses in both trials.
Clinical Response at Week 12 and 90-Day, Corticosteroid-Free Clinical Remission at Week 48
GALAXI 2 and GALAXI 3 studies (IV induction and SC maintenance): In the GALAXI 2 study, the adjusted between-group difference compared to placebo was 38.7% (95% CI, 28.4% to 48.9%; P value < 0.001) for guselkumab regimen 1 and 41.3% (95% CI, 30.6% to 52.0%; P value < 0.001) for guselkumab regimen 2. In the GALAXI 3 study, the adjusted between-group difference compared to placebo was 32.6% (95% CI, 21.7% to 43.6%; P value < 0.001) for guselkumab regimen 1 and 31.5% (95% CI, 20.1% to 42.8%; P value < 0.001) for guselkumab regimen 2.
Clinical Response at Week 12 and Endoscopic Remission at Week 48
GALAXI 2 and GALAXI 3 studies (IV induction and SC maintenance): In the GALAXI 2 study, the adjusted between-group difference compared to placebo was 24.0% (95% CI, 15.8% to 32.2%; P value < 0.001) for guselkumab regimen 1 and 30.0% (95% CI, 21.4% to 38.5%; P value < 0.001) for guselkumab regimen 2. In the GALAXI 3 study, the adjusted between-group difference compared to placebo was 18.2% (95% CI, 9.5% to 26.9%; P value < 0.001) for guselkumab regimen 1 and 16.7% (95% CI, 8.0% to 25.4%; P value < 0.001) for guselkumab regimen 2.
Clinical Remission at Week 12
GALAXI 2 and GALAXI 3 studies (IV induction and SC maintenance) and GRAVITI trial (SC induction and SC maintenance): In the GALAXI 2 study, the combined guselkumab induction dose group demonstrated an adjusted between-group difference of 25.1% (95% CI, 14.1% to 36.2%; P value < 0.001) compared to placebo. In the GALAXI 3 study, the combined guselkumab induction dose group demonstrated an adjusted between-group difference of 31.2% (95% CI, 21.1% to 41.3%; P value < 0.001) compared to placebo.
In the GRAVITI trial, the combined guselkumab induction dose group demonstrated an adjusted between-group difference of 34.9% (95% CI, 25.1% to 44.6%; P value < 0.001) compared to placebo. Sensitivity and subgroup analyses — including those in the BIO-Failure and CON-Failure analysis subpopulations — were consistent with the primary analyses.
Clinical Remission at Week 48
GRAVITI study (SC induction and SC maintenance): In the GRAVITI study, the adjusted between-group difference compared to placebo was 42.8% (95% CI, 31.6% to 54.0%; P value < 0.001) for guselkumab regimen 1 and 48.9% (95% CI, 37.9% to 59.9%; P value < 0.001) for guselkumab regimen 2.
Endoscopic Response at Week 12
GALAXI 2 and GALAXI 3 studies (IV induction and SC maintenance) and GRAVITI trial (SC induction and SC maintenance): In the GALAXI 2 study, the combined guselkumab induction dose group showed an adjusted between-group difference of 27.7% (95% CI, 19.3% to 36.1%; P value < 0.001) compared to placebo. In the GALAXI 3 study, the combined guselkumab induction dose group demonstrated an adjusted between-group difference of 22.1% (95% CI, 12.2% to 31.9%; P value < 0.001) compared to placebo.
In the GRAVITI trial, the combined guselkumab induction dose group demonstrated an adjusted between-group difference of 19.9% compared to placebo (95% CI, 10.2% to 29.6%; P value < 0.001). Sensitivity and subgroup analyses — including those conducted in the BIO-Failure and CON-Failure analysis subpopulations — were consistent with the primary analyses.
Endoscopic Response at Week 48
GRAVITI study (SC induction and SC maintenance): The adjusted between-group difference compared to placebo was 37.5% (95% CI, 27.3% to 47.7%; P value < 0.001) for guselkumab regimen 1 and 44.6% (95% CI, 34.1% to 55.0%; P value < 0.001) for guselkumab regimen 2.
Endoscopic Remission at Week 48
GRAVITI study (SC induction and SC maintenance): The adjusted between-group difference compared to placebo was 24.5% (95% CI, 15.2% to 33.9%; P value < 0.001) for guselkumab regimen 1 and 32.4% (95% CI, 22.6% to 42.3%; P value < 0.001) for guselkumab regimen 2.
Clinical Response at Week 12
GRAVITI study (SC induction and SC maintenance): The combined guselkumab induction dose group demonstrated an adjusted between-group difference of 40.3% compared to placebo (95% CI, 29.9% to 50.7%; P value < 0.001).
Deep Remission at Week 48
GRAVITI study (SC induction and SC maintenance): The adjusted between-group difference compared to placebo was 21.8% (95% CI, 13.1% to 30.6%; P value < 0.001) for guselkumab regimen 1 and 29.8% (95% CI, 20.5% to 39.2%; P value < 0.001) for guselkumab regimen 2.
Patient-Reported Outcomes
Inflammatory Bowel Disease Questionnaire (IBDQ) remission at week 12, GALAXI 2 and GALAXI 3 studies (IV induction and SC maintenance) and GRAVITI trial (SC induction and SC maintenance): In the GALAXI 2 study, the adjusted between-group difference compared to placebo was 19.1% (95% CI, 6.7% to 31.5%; P value = 0.003) for guselkumab regimen 1 and 10.5% (95% CI, –2.3% to 23.2%; P value = 0.108) for guselkumab regimen 2. In the GALAXI 3 study, the adjusted between-group difference compared to placebo was 23.7% (95% CI, 11.1% to 36.4%; P value < 0.001) for guselkumab regimen 1 and 16.5% (95% CI, 3.0% to 30.1%; P value = 0.017) for guselkumab regimen 2. In the GRAVITI trial, the adjusted between-group difference compared to placebo was 29.2% (95% CI, 17.4% to 41.0%; P value < 0.001) for guselkumab regimen 1 and 20.8% (95% CI, 9.2% to 32.4%; P value < 0.001) for guselkumab regimen 2.
IBDQ remission at week 48, GRAVITI study (SC induction and SC maintenance): The adjusted between-group difference compared to placebo was 36.6% (95% CI, 25.4% to 47.8%; P value < 0.001) for guselkumab regimen 1 and 30.7% (95% CI, 19.2% to 42.1%; P value < 0.001) for guselkumab regimen 2.
Patient-reported outcome 2 (PRO-2) remission at week 48, GRAVITI study (SC induction and SC maintenance): At week 48, the adjusted between-group difference compared to placebo was 41.1% (95% CI, 30.1% to 52.1%; P value < 0.001) for guselkumab regimen 1 and 53.2% (95% CI, 42.6% to 63.7%; P value < 0.001) for guselkumab regimen 2.
Summary of Efficacy Outcomes (Guselkumab Versus Ustekinumab)
GALAXI 2 and GALAXI 3 Studies (IV Induction and SC Maintenance)
Clinical Remission at Week 48 and Endoscopic Response at Week 48
Following the pooling of data from the GALAXI 2 and GALAXI 3 trials, the adjusted between-group differences compared to ustekinumab were 7.8% (95% CI, 0.1% to 15.6%; P value = 0.049) for guselkumab regimen 1 and 13.6% (95% CI, 5.9% to 21.3%; P value < 0.001) for guselkumab regimen 2. Comparisons from the individual GALAXI 2 and GALAXI 3 trials were not formally tested due to the failure of the statistical testing hierarchy. In the GALAXI 2 trial, the adjusted between-group difference compared to ustekinumab was 2.8% (95% CI, –0.6% to 21.0%) for guselkumab regimen 1 and 10.2% (95% CI, –0.6% to 21.0%) for guselkumab regimen 2. In the GALAXI 3 trial, the adjusted between-group difference compared to ustekinumab was 12.7% (95% CI, 1.7% to 23.7%) for guselkumab regimen 1 and 16.9% (95% CI, 5.8% to 27.9%) for guselkumab regimen 2.
Clinical Remission at Week 48
Following the pooling of data from the GALAXI 2 and GALAXI 3 trials, the adjusted between-group differences compared to ustekinumab were 2.6% (95% CI, –5.1% to 10.2%; P value = 0.512) for guselkumab regimen 1 and 7.3% (95% CI, –0.2% to 14.8%; P value = 0.058) for guselkumab regimen 2. Comparisons from the individual GALAXI 2 and GALAXI 3 trials were not formally tested due to the failure of the statistical testing hierarchy. In the GALAXI 2 trial, the adjusted between-group difference compared to ustekinumab was –0.6% (95% CI, –11.6% to 10.5%) for guselkumab regimen 1 and 9.5% (95% CI, –0.7 % to 19.8%) for guselkumab regimen 2. In the GALAXI 3 trial, the adjusted between-group difference compared to ustekinumab was 5.6% (95% CI, –5.2% to 16.5%) for guselkumab regimen 1 and 5.0% (95% CI, –6.1% to 16.1%) for guselkumab regimen 2.
Endoscopic Response at Week 48
Following the pooling of data from the GALAXI 2 and GALAXI 3 trials, the adjusted between-group differences compared to ustekinumab were 10.6% (95% CI, 2.7% to 18.5%; P = 0.009) for guselkumab regimen 1 and 15.6% (95% CI, 7.9% to 23.4%; P < 0.001) for guselkumab regimen 2. Comparisons from the individual GALAXI 2 and GALAXI 3 trials were not formally tested due to the failure of the statistical testing hierarchy. In the GALAXI 2 trial, the adjusted between-group difference compared to ustekinumab was 7.0% (95% CI, –4.4% to 18.3%) for guselkumab regimen 1 and 14.5% (95% CI, 3.6% to 25.4%) for guselkumab regimen 2. In the GALAXI 3 trial, the adjusted between-group difference compared to ustekinumab was 14.1% (95% CI, 2.9% to 25.2%) for guselkumab regimen 1 and 16.8% (95% CI, 5.7% to 28.0%) for guselkumab regimen 2.
Endoscopic Remission at Week 48
Following the pooling of data from the GALAXI 2 and GALAXI 3 trials, the adjusted between-group differences compared to ustekinumab were 8.5% (95% CI, 1.1% to 15.9%; P = 0.024) for guselkumab regimen 1 and 12.3% (95% CI, 4.9% to 19.7%; P = 0.001) for guselkumab regimen 2. Comparisons from the individual GALAXI 2 and GALAXI 3 trials were not formally tested due to the failure of the statistical testing hierarchy. In the GALAXI 2 trial, the adjusted between-group treatment difference compared to ustekinumab was 6.4% (95% CI, –4.3% to 17.1%) for guselkumab regimen 1 and 17.9% (95% CI, 7.3% to 28.4%) for guselkumab regimen 2. In the GALAXI 3 trial, the adjusted between-group difference compared to ustekinumab was 10.5% (95% CI, 0.1% to 20.9%) for guselkumab regimen 1 and 6.9% (95% CI, –3.3% to 17.0%) for guselkumab regimen 2.
Deep Remission at Week 48
Following the pooling of data from the GALAXI 2 and GALAXI 3 trials, the adjusted between-group differences compared to ustekinumab were 7.4% (95% CI, 0.3% to 14.6%; P = 0.040) for guselkumab regimen 1 and 11.3% (95% CI, 4.2% to 18.5%; P = 0.002) for guselkumab regimen 2. Comparisons from the individual GALAXI 2 and GALAXI 3 trials were not formally tested due to the failure of the statistical testing hierarchy. In the GALAXI 2 trial, the adjusted between-group difference compared to ustekinumab was 4.2% (95% CI, –6.2% to 14.7%) for guselkumab regimen 1 and 13.0% (95% CI, 2.7% to 23.4%) for guselkumab regimen 2. In the GALAXI 3 trial, the adjusted between-group difference compared to ustekinumab was 10.4% (95% CI, 0.4% to 20.4%) for guselkumab regimen 1 and 9.6% (95% CI, –0.1% to 19.4%) for guselkumab regimen 2.
IBDQ Remission at Week 48
In the GALAXI 2 study, the adjusted between-group difference compared to ustekinumab was 1.6% (95% CI, –9.9% to 13.2%; P value = 0.783) for guselkumab regimen 1 and 5.6% (95% CI, –5.5% to 16.7%; P value = 0.322) for guselkumab regimen 2. In the GALAXI 3 study, the adjusted between-group difference compared to ustekinumab was 10.1% (95% CI, –1.2% to 21.5%; P value = 0.080) for guselkumab regimen 1 and 2.1% (95% CI, –9.4% to 13.6%; P value = 0.725) for guselkumab regimen 2.
Harms Results
GALAXI 2 and GALAXI 3 Studies: IV Induction and SC Maintenance
Induction Period
In the GALAXI 2 study, the proportion of patients experiencing at least 1 AE was 38.5% in the guselkumab regimen 1 group, 47.3% in the guselkumab regimen 2 group, 48.3% in the ustekinumab group, and 40.8% in the placebo group. In the GALAXI 3 study, the proportion of patients experiencing at least 1 AE was 51.7% in the guselkumab regimen 1 group, 50.7% in the guselkumab regimen 2 group, 44.6% in the ustekinumab group, and 55.6% in the placebo group. In the GALAXI 2 study, the proportion of patients experiencing at least 1 serious adverse event (SAE) was 3.5% in the guselkumab regimen 1 group, 1.4% in the guselkumab regimen 2 group, 2.4% in the ustekinumab group, and 2.6% in the placebo group. In the GALAXI 3 study, the proportion of patients experiencing at least 1 SAE was 3.5% in the guselkumab regimen 1 group, 2.7% in the guselkumab regimen 2 group, 5.4% in the ustekinumab group, and 9.7% in the placebo group. In the GALAXI 2 trial, the proportion of patients who discontinued study treatment due to an AE was 2.6% in the placebo group, 0% in the guselkumab regimen 1 group, 1.4% in the guselkumab regimen 2 group, and 2.1% in the ustekinumab group. In the GALAXI 3 trial, the discontinuation rates due to AE were 6.9% in the placebo group, 2.8% in the guselkumab regimen 1 group, 3.3% in the guselkumab regimen 2 group, and 3.4% in the ustekinumab group. No deaths occurred during the induction period in either trial.
Maintenance Period
In the GALAXI 2 trial, the proportion of patients experiencing at least 1 AE was higher in the guselkumab regimen 1 group (74.1%), the guselkumab regimen 2 group (78.8%), and the ustekinumab group (78.3%) compared with the placebo group (50.0%). In the GALAXI 3 trial, the proportion of patients experiencing at least 1 AE was higher in the guselkumab regimen 1 group (79.0%), the guselkumab regimen 2 group (76.7%), and the ustekinumab group (79.1%) compared with the placebo group (56.9%). In the GALAXI 2 trial, the proportion of patients experiencing at least 1 SAE was higher in the guselkumab regimen 1 and ustekinumab groups (12.6% each) compared to the guselkumab regimen 2 group (4.1%) and placebo group (7.9%). In the GALAXI 3 trial, the proportion of patients experiencing at least 1 SAE was 8.4% in the guselkumab regimen 1 group, 10.0% in the guselkumab regimen 2 group, 10.8% in the ustekinumab group, and 13.9% in the placebo group. In the GALAXI 2 study, the proportion of patients who discontinued study treatment due to an AE during the maintenance period was 6.6% in the placebo group, 5.6% in the guselkumab regimen 1 group, 4.1% in the guselkumab regimen 2 group, and 6.3% in the ustekinumab group. In the GALAXI 3 study, the discontinuation rates due to an AE were 11.1% in the placebo group, 8.4% in the guselkumab regimen 1 group, 8.7% in the guselkumab regimen 2 group, and 8.8% in the guselkumab regimen 2 group. No deaths occurred during the maintenance period in either trial.
Notable Harms
In the GALAXI 2 study, 1 patient (0.7%) in the guselkumab regimen 1 group experienced major adverse cardiovascular events and 1 patient (0.7%) in the ustekinumab group experienced venous thromboembolism. In the GALAXI 3 study, 1 (0.7%) patient in the guselkumab regimen 1 group experienced active tuberculosis and 1 (0.7%) patient experienced a malignancy in the guselkumab regimen 2 group. Additionally, 4 patients experienced opportunistic infections, including 1 (1.4%) in the placebo group, 1 (0.7%) in the guselkumab regimen 1 group, and 2 (1.3%) in the guselkumab regimen 2 group.
GRAVITI Study: SC Induction and SC Maintenance
Induction Period
The proportion of patients who experienced at least 1 AE was 49.6% in the placebo group, 51.3% in the guselkumab regimen 1 group, and 41.7% in the guselkumab regimen 2 group. The proportion of patients experiencing at least 1 SAE was 2.6% in the guselkumab regimen 1 group, 1.7% in the guselkumab regimen 2 group, and 7.7% in the placebo group. The proportion of patients who discontinued study treatment during the induction period was 2.6% in the placebo group, 0% in the guselkumab regimen 1 group, and 0.9% in the guselkumab regimen 2 group. No deaths occurred during the induction period in the GRAVITI trial.
Maintenance Period
The proportion of patients who experienced at least 1 AE was 65.8% in the placebo group, 82.6% in the guselkumab regimen 1 group, and 80.0% in the guselkumab regimen 2 group. The proportion of patients experiencing at least 1 SAE during the maintenance period was 13.0% in the regimen 1 guselkumab group, 7.8% in the guselkumab regimen 2 group, and 13.7% in the placebo group. The proportion of patients who discontinued study treatment was 8.5% in the placebo group, 3.5% in the guselkumab regimen 1 group, and 2.6% in the guselkumab regimen 2 group. During the maintenance period, 1 (0.9%) patient died in the guselkumab regimen 1 group.
Notable Harms
In the GRAVITI study, 1 (0.7%) patient in the regimen 1 guselkumab group experienced a malignancy while in the placebo group, 1 (0.9%) patient experienced an opportunistic infection, and 1 (0.9%) patient experienced a venous thromboembolism.
Critical Appraisal
Randomization and allocation concealment for all 3 studies were conducted using appropriate methodology. A stratified, computerized randomization scheme was employed, and allocation concealment was ensured using interactive web response technology. Although there was some imbalance in baseline characteristics across the treatment groups in the GALAXI and GRAVITI trials (e.g., race, sex, several disease characteristics), these did not systematically favour any treatment group, and clinical experts did not believe these would impact the results of the pivotal trials. Additionally, they noted that the stratification factors used across all 3 trials (e.g., baseline Crohn’s Disease Activity Index [CDAI] and Simple Endoscopic Score for Crohn’s Disease [SES-CD] scores, prior biologic exposure) were deemed appropriate for minimizing confounding and ensuring balanced treatment groups. Major protocol deviations occurred in 17.5% of patients in the GALAXI 2 trial and 23.3% of patients in the GALAXI 3 trial. These deviations were balanced across treatment groups and did not appear to be related to the trial context. In the GRAVITI trial, major protocol deviations were reported in 36.8% of patients in the placebo group, 26.1% of patients in the guselkumab regimen 1 group, and 24.3% of patients in the guselkumab regimen 2 group through week 48. The uneven distribution of protocol deviations across treatment groups may potentially result in imbalanced comparisons of efficacy and safety of guselkumab relative to placebo. However, patients who received prohibited concomitant medications were addressed using a composite strategy, under which they were classified as nonresponse; this approach was considered reasonable by the review team.
The GALAXI and GRAVITI trials used a treat-through design, whereby participants remained on their assigned treatment regimen beyond the initial induction phase without rerandomization. Additionally, all 3 trials were conducted using a double-blind design, where patients, investigators, and outcome assessors were masked to treatment allocation from the time of randomization until unblinding as specified in the study protocols. In all 3 trials, the rate of treatment discontinuation before week 48 was higher in the placebo group compared to the active treatment groups. In both GALAXI trials, 49 patients crossed over to ustekinumab at week 12 due to clinical nonresponse but were still analyzed as part of the as-randomized placebo group at week 48, despite having received ustekinumab treatment from week 12 onward. In the GRAVITI trial, 44 patients in the placebo group meeting predefined criteria received guselkumab rescue treatment at week 12 or week 16. As a result, in all 3 trials, patients in the guselkumab groups who completed the study were exposed to treatment for a longer duration, potentially providing more opportunity to demonstrate efficacy or experience safety events. Dropouts for various reasons were reflected as intercurrent events (ICEs) within the trial estimands and typically considered as nonresponse, which was thought to be appropriate in most cases. Some dropouts were not clearly related to a lack of efficacy, and the nonresponse imputation (NRI) could have introduced bias, though rates of such ICEs were relatively limited in the GALAXI trials. At longer time points in the GRAVITI study, dropouts due to reasons potentially unrelated to a lack of response were increased in the placebo group compared to the guselkumab groups, which could have inflated the treatment effect estimates. After consideration of the ICEs, there were few missing data.
In general, the end points reported in all 3 trials were validated for use in patients with moderately to severely active CD. The statistical methods used to analyze the primary and secondary outcomes across all 3 trials were deemed appropriate. Multiplicity adjustments were adequately implemented for primary and secondary outcomes across all 3 trials. However, in the GALAXI trials, formal statistical testing of the long-term secondary end points comparing guselkumab with ustekinumab within the individual trials was precluded due to failure of the hierarchical testing strategy. Subgroup analyses, including those conducted in the BIO-Failure and CON-Failure analysis subpopulations, of the coprimary end points were conducted in all 3 trials as part of this review. However, the subgroup analyses were not adjusted for multiplicity and were likely underpowered to detect differences between subgroups; therefore, the findings should be considered supportive only. In all 3 trials, the use of concomitant therapies was generally balanced across treatment groups and, according to clinical experts, was unlikely to have confounded the study results. Overall, the proportion of patients who experienced SAEs was low across all 3 trials, with similar rates observed among all treatment groups.
In terms of external validity, the inclusion and exclusion criteria across all 3 trials were generally appropriate and reflective of patients eligible for guselkumab treatment in clinical practice. The clinical experts consulted noted that while certain exclusion criteria, such as strictures or a previous colectomy, are considered typical for clinical trials, they do not always reflect real-world practice where treatment decisions are often based on individual clinical judgment and may include patients typically excluded from trials. The Health Canada indication for guselkumab is for the treatment of adult patients with moderately to severely active CD. However, the GALAXI and GRAVITI trials included patients with moderately to severely active CD whose disease had demonstrated an inadequate response to or inability to tolerate previous conventional therapy or biologic therapy. The clinical experts noted that the trial design reflects real-world clinical practice; however, they emphasized that the distribution of patients with no prior exposure to biologics versus patients with previous exposure to biologics may differ between community and tertiary care settings. In the GALAXI 2 and GALAXI 3 trials, guselkumab was evaluated against both an active comparator (ustekinumab) and placebo. The active comparator used in these trials was appropriate because ustekinumab is currently used in clinical practice. The end points included in the trials were considered appropriate by the clinical experts, although they noted that the Harvey-Bradshaw Index is more commonly used in Canadian clinical practice than the CDAI score. Although there is a disconnect between tools used in trials and in clinical practice, clinical experts emphasized that the use of CDAI in trials does not pose a barrier to applying the results, because clinicians are well familiar with its components. The clinical experts considered the 48-week maintenance period following the 12-week induction period to be appropriate and sufficient for evaluating the long-term efficacy and safety of guselkumab in patients with CD.
GRADE Summary of Findings and Certainty of the Evidence
For pivotal studies and RCTs identified in the sponsor’s systematic review, the Grading of Recommendations Assessment, Development and Evaluation (GRADE) tool was used to assess the certainty of the evidence for outcomes considered most relevant to inform expert committee deliberations, and a final certainty rating was determined as outlined by the GRADE Working Group.10,11
The selection of outcomes for GRADE assessment was based on the sponsor’s Summary of Clinical Evidence12 consultation with clinical experts, and input received from patient and clinician groups and public drug plans. The following list of outcomes was finalized in consultation with expert committee members:
guselkumab compared with placebo — clinical response at week 12 and clinical remission at week 48, clinical response at week 12 and endoscopic response at week 48, clinical response at week 12 and 90-day, corticosteroid-free clinical remission at week 48, clinical response at week 12 and endoscopic remission at week 48, IBDQ remission at week 12, clinical remission at week 12 and week 48, endoscopic response at week 12 and week 48, endoscopic remission at week 48, IBDQ remission at week 48, and PRO-2 remission at week 48
guselkumab compared with ustekinumab — clinical remission at week 48, endoscopic response at week 48, endoscopic remission at week 48, clinical remission and endoscopic response at week 48, and IBDQ remission at week 48
harms — SAEs.
Results of GRADE Assessments
Table 2 and Table 3 present the GRADE summary of findings for guselkumab versus placebo (IV induction and SC maintenance, high and low dose) in the GALAXI trials and the GRAVITI study (SC induction and SC maintenance, high and low dose), respectively. Table 4 presents the GRADE summary of findings for guselkumab versus ustekinumab in the GALAXI 2 and GALAXI 3 trials (IV induction and SC maintenance, high and low dose).
Table 2: Summary of Findings for Guselkumab vs. Placebo for Patients With Crohn Disease — GALAXI Trials, IV Induction and SC Maintenance (Regimen 1 and Regimen 2)
Outcome and follow-up | Patients, N (study) | Effect | Certainty | What happens |
|---|---|---|---|---|
Clinical response and clinical remission | ||||
Proportion of patients with clinical responsea at week 12 and clinical remissionb at week 48 | 365 (GALAXI 2) 365 (GALAXI 3) | GALAXI 2
GALAXI 3
| Highe | Guselkumab regimens 1 and 2 result in a clinically important increase in the proportion of patients with clinical response at week 12 and clinical remission at week 48 when compared with placebo. |
Clinical response and endoscopic response | ||||
Proportion of patients with clinical responsea at week 12 and endoscopic responsef at week 48 | 365 (GALAXI 2) 365 (GALAXI 3) | GALAXI 2
GALAXI 3
| Highe | Guselkumab regimens 1 and 2 result in a clinically important increase in the proportion of patients with clinical response at week 12 and endoscopic response at week 48 when compared with placebo. |
Clinical response and 90-day, corticosteroid-free clinical remission | ||||
Proportion of patients with clinical responsea at week 12 and 90-day, corticosteroid-free clinical remissiong at week 48 | 365 (GALAXI 2) 365 (GALAXI 3) | GALAXI 2
GALAXI 3
| Highe | Guselkumab regimens 1 and 2 result in a clinically important increase in the proportion of patients with clinical response at week 12 and 90-day, corticosteroid-free clinical remission at week 48 when compared with placebo. |
Clinical response and endoscopic remission | ||||
Proportion of patients with clinical responsea at week 12 and endoscopic remissionh at week 48 | 365 (GALAXI 2) 365 (GALAXI 3) | GALAXI 2
GALAXI 3
| Highe | Guselkumab regimens 1 and 2 result in a clinically important increase in the proportion of patients with clinical response at week 12 and endoscopic remission at week 48 when compared with placebo. |
HRQoL: IBDQ remission | ||||
Proportion of patients with IBDQ remissioni Follow-up: 12 weeks | 365 (GALAXI 2) 365 (GALAXI 3) | GALAXI 2
GALAXI 3
| Guselkumab regimen 1:c Highe Guselkumab regimen 2:c Moderatej | Guselkumab regimen 1 results in a clinically important increase in the proportion of patients with IBDQ remission at week 12 when compared with placebo. Guselkumab regimen 2 likely results in a clinically important increase in the proportion of patients with IBDQ remission at week 12 when compared with placebo. |
Harms | ||||
Proportion of patients with SAEs Follow-up: 12 weeks | 365 (GALAXI 2) 365 (GALAXI 3) | GALAXI 2
GALAXI 3
| Lowk | Guselkumab regimens 1 and 2 may result in little to no difference in SAEs at week 12 when compared with placebo. |
Proportion of patients with SAEs Follow-up: 48 weeks | 365 (GALAXI 2) 365 (GALAXI 3) | GALAXI 2
GALAXI 3
| Lowk,l | Guselkumab regimen 1 may result in little to no difference in SAEs at week 48 when compared with placebo. Guselkumab regimen 2 may result in a clinically important decrease in SAEs at week 12 when compared with placebo. |
AP = abdominal pain; CD = Crohn disease; CDA-AMC = Canada’s Drug Agency; CDAI = Crohn’s Disease Activity Index; CI = confidence interval; HRQoL = health-related quality of life; IBDQ = Inflammatory Bowel Disease Questionnaire; MID = minimal important difference; NR = not reported; PRO-2 = patient-reported outcome 2; RCT = randomized controlled trial; SAE = serious adverse event; SC = subcutaneous; SES-CD = Simple Endoscopic Score for Crohn’s Disease; SF = stool frequency.
Notes: Study limitations (which refers to internal validity or risk of bias), inconsistency across studies, indirectness, the imprecision of effects, and publication bias were considered when assessing the certainty of the evidence. All serious concerns in these domains that led to the rating down of the level of certainty are documented in the Table 2 footnotes.
The statistical testing for IBDQ remission and PRO-2 remission was not adjusted for multiplicity in either GALAXI trial and should be considered as supportive evidence.
aClinical response was defined as either a reduction of 100 or more points from baseline in the CDAI score or a CDAI score of less than 150.
bClinical remission was defined as a CDAI score of less than 150.
cCombined guselkumab induction dose group: 200 mg every 4 weeks, administered via IV injection. Guselkumab regimen 1 (low dose) = 200 mg IV every 4 weeks, followed by 100 mg SC every 8 weeks. Guselkumab regimen 2 (high dose) = 200 mg IV every 4 weeks, followed by 200 mg SC every 4 weeks.
dIncluded patients in the placebo group who crossed over to ustekinumab after week 12.
eAn empirically derived MID was not identified for the between-group difference for this outcome. A difference of 5% between the groups was identified by the clinical experts consulted by CDA-AMC as a threshold of clinical importance for this outcome.
fEndoscopic response was defined as at least a 50% improvement from baseline in the SES-CD score or a SES-CD score of 2 or higher.
gEndoscopic remission was defined as a SES-CD score 4 or less and at least a 2-point reduction from baseline and with no subscore greater than 1 in any individual component.
hA 90-day, corticosteroid-free clinical remission was defined as not receiving corticosteroids for 90 days.
iIBDQ remission was defined as an IBDQ total score of at least 170. An empirically derived MID was not identified for the between-group difference for this outcome. A difference of 5% between the groups was identified by the clinical experts consulted by CDA-AMC as a threshold of clinical importance for this outcome.
jThe level of evidence was rated down 1 level for imprecision. Based on the MID identified by clinical experts (a difference of 5% between the groups), the 95% CI for the between-group difference crossed the MID threshold (i.e., included the possibility of little to no difference) for guselkumab regimen 2 in both GALAXI trials. Additionally, notable between-group imbalances in missing data were observed after applying the intercurrent event handling strategies.
kAn empirically derived MID was not identified for the between-group difference for this outcome. A difference of 3% to 5% between the groups was identified by the clinical experts consulted by CDA-AMC as a threshold of clinical importance for this outcome. The level of evidence was rated down 2 levels for imprecision and indirectness; the estimate was informed by a very low number of events and may be unstable. Additionally, there was indirectness related to the inclusion of worsening CD and other CD-related events such as an SAE. This complicates interpretation.
lAn empirically derived MID was not identified for the between-group difference for this outcome. A difference of 3% to 5% between the groups was identified by the clinical experts consulted by CDA-AMC as a threshold of clinical importance for this outcome. The level of evidence was rated down 2 levels for imprecision and indirectness; the estimate was informed by a very low number of events and may be unstable. There was some inconsistency in the result for regimen 1. Additionally, there was indirectness related to the inclusion of worsening CD and other CD-related events such as an SAE. This complicates interpretation because it is difficult to explain findings such as lower SAE rates with guselkumab compared with placebo at week 48 in the GALAXI 3 trial. A greater number of patients in the placebo group discontinued treatment while discontinuation rates were lower in the guselkumab groups; therefore, differences in treatment discontinuation and exposure between the study groups may influence the interpretation of harms outcomes.
Sources: Clinical Study Report for the GALAXI 2 trial12 and Clinical Study Report for the GALAXI 3 trial.13 Details included in the table are from the sponsor’s Summary of Clinical Evidence.
Table 3: Summary of Findings for Guselkumab vs. Placebo for Patients With Crohn Disease — GRAVITI Trial, SC Induction and SC Maintenance (Regimen 1 and Regimen 2)
Outcome and follow-up | Patients, N (study) | Effect | Certainty | What happens |
|---|---|---|---|---|
Clinical remission at week 12 | ||||
Proportion of patients with clinical remissiona Follow-up: 12 weeks | 347 (GRAVITI study) |
| High | Guselkumab induction results in a clinically important increase in the proportion of patients with clinical remission at week 12 when compared with placebo. |
Clinical remission at week 48 | ||||
Proportion of patients with clinical remissiona Follow-up: 48 weeks | 347 (GRAVITI) |
| High | Guselkumab regimens 1 and 2 result in a clinically important increase in the proportion of patients with clinical remission at week 48 when compared with placebo. |
Endoscopic response at week 12 | ||||
Proportion of patients with endoscopic responsed Follow-up: 12 weeks | 347 (GRAVITI) |
| High | Guselkumab induction results in a clinically important increase in the proportion of patients with endoscopic response at week 12 when compared with placebo. |
Endoscopic response at week 48 | ||||
Proportion of patients with endoscopic responsed Follow-up: 48 weeks | 347 (GRAVITI) |
| High | Guselkumab regimens 1 and 2 result in a clinically important increase in the proportion of patients with endoscopic response at week 48 when compared with placebo. |
Endoscopic remission | ||||
Proportion of patients with endoscopic remissione Follow-up: 48 weeks | 347 (GRAVITI) |
| High | Guselkumab regimens 1 and 2 result in a clinically important increase in the proportion of patients with endoscopic remission at week 48 when compared with placebo. |
Clinical remission and endoscopic response | ||||
Clinical remission and endoscopic response Follow-up: 48 weeks | 347 (GRAVITI) |
| High | Guselkumab regimens 1 and 2 result in a clinically important increase in the proportion of patients with clinical remission and endoscopic response at week 48 when compared with placebo. |
HRQoL: IBDQ remission | ||||
Proportion of patients with IBDQ remissionf Follow-up: 48 weeks | 347 (GRAVITI) |
| Moderateg | Guselkumab regimens 1 and 2 likely result in a clinically important increase in the proportion of patients with IBDQ remission at week 48 when compared with placebo. |
HRQoL: PRO-2 remission | ||||
Proportion of patients with PRO-2 remissionh Follow-up: 48 weeks | 347 (GRAVITI) |
| High | Guselkumab regimens 1 and 2 result in a clinically important increase in the proportion of patients with PRO-2 remission at week 48 when compared with placebo. |
Harms | ||||
Proportion of patients with SAEs Follow-up: 12 weeks | 347 (GRAVITI) |
| Lowi | Guselkumab regimens 1 and 2 may result in a clinically important decrease in SAEs at week 12 when compared with placebo. |
Proportion of patients with SAEs Follow-up: 48 weeks | 347 (GRAVITI study) |
| Lowj | Guselkumab regimen 1 may result in little to no clinically important difference in SAEs at week 48 compared to placebo. Guselkumab regimen 2 may result in a clinically important decrease in SAEs at week 48 when compared with placebo. |
AP = abdominal pain; CD = Crohn disease; CDA-AMC = Canada’s Drug Agency; CDAI = Crohn’s Disease Activity Index; CI = confidence interval; HRQoL = health-related quality of life; IBDQ = Inflammatory Bowel Disease Questionnaire; ICE = intercurrent event; MID = minimal important difference; NR = not reported; PRO-2 = patient-reported outcome 2; RCT = randomized controlled trial; SAE = serious adverse event; SC = subcutaneous; SES-CD = Simple Endoscopic Score for Crohn’s Disease; SF = stool frequency.
Notes: Study limitations (which refers to internal validity or risk of bias), inconsistency across studies, indirectness, the imprecision of effects, and publication bias were considered when assessing the certainty of the evidence. All serious concerns in these domains that led to the rating down of the level of certainty are documented in the Table 3 footnotes.
The statistical testing for IBDQ remission was not adjusted for multiplicity in the GRAVITI trial and should be considered as supportive evidence.
The statistical testing for endoscopic remission was not adjusted for multiplicity in the GRAVITI trial and should be considered as supportive evidence.
In the GRAVITI trial, the week 12 end points were based on comparisons between the combined guselkumab induction dose group and the placebo group. The end points assessed after week 12 were based on comparisons between each individual guselkumab group and the placebo group.
ICE category 5 methodology was used to handle treatment discontinuations (using a composite strategy), which is an approach accepted by regulatory authorities. However, because the exact reasons for discontinuations were not always clearly reported (e.g., whether they were linked to a lack of efficacy), there remains some uncertainty regarding potential bias. No downgrading for a risk of bias was applied for the end points at week 48, although some risk may have existed. Additional context is provided in the Executive Summary section.
aClinical remission was defined as a CDAI score of less than 150. An empirically derived MID was not identified for the between-group difference for this outcome. A difference of 12% between the groups was identified by the clinical experts consulted by CDA-AMC as a threshold of clinical importance for this outcome.
bCombined guselkumab induction dose group: 400 mg SC at week 0, week 4, and week 8, administered via SC injection. The guselkumab SC regimen 1 (low dose) equals guselkumab 400 SC every 4 weeks, followed by 100 mg SC every 8 weeks; the guselkumab SC regimen 2 (high dose) equals guselkumab 400 SC every 4 weeks, followed by 200 mg SC every 4 weeks.
cIncludes placebo patients who were rescued with guselkumab after week 12.
dEndoscopic response was defined as at least a 50% improvement from baseline in the SES-CD score. An empirically derived MID was not identified for the between-group difference for this outcome. A difference of 5% between the groups was identified by the clinical experts consulted by CDA-AMC as a threshold of clinical importance for this outcome.
eEndoscopic remission was defined as an SES-CD score of 4 or less and at least a 2-point reduction from baseline and with no subscore greater than 1 in any individual component. An empirically derived MID was not identified for the between-group difference for this outcome. A difference of 5% between the groups was identified by the clinical expert consulted by CDA-AMC as a threshold of clinical importance for this outcome.
fIBDQ remission was defined as an IBDQ total score of at least 170. An empirically derived MID was not identified for the between-group difference for this outcome. A difference of 5% between the groups was identified by the clinical expert consulted by CDA-AMC as a threshold of clinical importance for this outcome.
gThe level of evidence was rated down 1 level for serious study limitations. Notable between-group imbalances in missing data were observed after applying the ICE handling strategies.
hPRO-2 remission was defined as an AP mean daily score equal to or less than 1 and an SF mean daily score equal to or less than 3, and no worsening of the AP or SF score from baseline. An empirically derived MID was not identified for the between-group difference for this outcome. A difference of 5% between the groups was identified by the clinical experts consulted by CDA-AMC as a threshold of clinical importance for this outcome.
iAn empirically derived MID was not identified for the between-group difference for this outcome. A difference of 3% to 5% between the groups was identified by the clinical experts consulted by CDA-AMC as a threshold of clinical importance for this outcome. The level of evidence was rated down 2 levels for imprecision and indirectness; the estimate was informed by a very low number of events and may be unstable. Additionally, there was indirectness related to the inclusion of worsening CD and other CD-related events such as an SAE. This complicates interpretation because it is difficult to explain findings such as lower SAE rates with guselkumab compared with placebo.
jAn empirically derived MID was not identified for the between-group difference for this outcome. A difference of 3% to 5% between the groups was identified by the clinical experts consulted by CDA-AMC as a threshold of clinical importance for this outcome. The level of evidence was rated down 2 levels for imprecision and indirectness; the estimate was informed by a very low number of events and may be unstable. Additionally, there was indirectness related to the inclusion of worsening CD and other CD-related events such as an SAE. This complicates interpretation because it is difficult to explain findings such as lower SAE rates with guselkumab compared with placebo. A greater number of patients in the placebo group discontinued treatment while discontinuation rates in the guselkumab groups were lower; therefore, differences in treatment discontinuation and exposure between the study groups may influence the interpretation of harms outcomes.
Sources: Clinical Study Report for the GRAVITI trial.14 Details included in the table are from the sponsor’s Summary of Clinical Evidence.
Table 4: Summary of Findings for Guselkumab (Regimen 1 and Regimen 2) vs. Ustekinumab With Crohn Disease — GALAXI Trials, IV Induction and SC Maintenance
Outcome and follow-up | Patients, N (study) | Effect | Certainty | What happens |
|---|---|---|---|---|
Clinical remission | ||||
Proportion of patients with clinical remissiona Follow-up: 48 weeks | 432 (GALAXI 2) 441 (GALAXI 3) | Pooled GALAXI 2 and GALAXI 3e
GALAXI 2
GALAXI 3
| Moderateh | Guselkumab regimens 1 and 2 likely result in little to no clinically important difference in the proportion of patients with clinical remission at week 48 when compared with ustekinumab. |
Endoscopic response | ||||
Proportion of patients with endoscopic responseb Follow-up: 48 weeks | 432 (GALAXI 2) 441 (GALAXI 3) | Pooled GALAXI 2 and GALAXI 3e
GALAXI 2
GALAXI 3
| Guselkumab regimen 1: Lowi Guselkumab regimen 2: High | Guselkumab regimen 1 may result in a clinically important increase in the proportion of patients with endoscopic response at week 48 when compared with ustekinumab. Guselkumab regimen 2 results in a clinically important increase in the proportion of patients with endoscopic response at week 48 when compared with ustekinumab. |
Endoscopic remission | ||||
Proportion of patients with endoscopic remissionc Follow-up: 48 weeks | 432 (GALAXI 2) 441 (GALAXI 3) | Pooled GALAXI 2 and GALAXI 3f
GALAXI 2
GALAXI 3
| Moderatej | Guselkumab regimens 1 and 2 likely result in a clinically important increase in the proportion of patients with endoscopic remission at week 48 when compared with ustekinumab. |
Clinical remission and endoscopic response | ||||
Proportion of patients with clinical remission and endoscopic response Follow-up: 48 weeks | 432 (GALAXI 2) 441 (GALAXI 3) |
GALAXI 2
GALAXI 3
| Guselkumab regimen 1: Lowk Guselkumab regimen 2: High | Guselkumab regimen 1 may result in a clinically important increase in the proportion of patients with clinical remission and endoscopic response at week 48 when compared with ustekinumab. Guselkumab regimen 2 results in a clinically important increase in the proportion of patients with clinical remission and endoscopic response at week 48 when compared with ustekinumab. |
HRQoL: IBDQ remission | ||||
Proportion of patients with IBDQ remissiond Follow-up: 48 weeks | 432 (GALAXI 2) 441 (GALAXI 3) | GALAXI 2
GALAXI 3
| Guselkumab regimen 1: Lowk Guselkumab regimen 2: Moderatel | Guselkumab regimen 1 may result in little to no clinically important difference in the proportion of patients with IBDQ remission at week 48 when compared with ustekinumab. Guselkumab regimen 2 likely results in little to no clinically important difference in the proportion of patients with IBDQ remission at week 48 when compared with ustekinumab. |
Harms | ||||
Proportion of patients with SAEs Follow-up: 12 weeks | 432 (GALAXI 2) 441 (GALAXI 3) | GALAXI 2
GALAXI 3
| Lowm | Guselkumab regimens 1 and 2 may result in little to no clinically important difference in SAEs at week 12 when compared with ustekinumab. |
Proportion of patients with SAEs Follow-up: 48 weeks | 432 (GALAXI 2) 441 (GALAXI 3) | GALAXI 2
GALAXI 3
| Lowm | Guselkumab regimen 1 and regimen 2 may result in little to no clinically important difference in SAEs at week 48 when compared with ustekinumab. |
AP = abdominal pain; CD = Crohn disease; CDA-AMC = Canada’s Drug Agency; CDAI = Crohn’s Disease Activity Index; CI = confidence interval; HRQoL = health-related quality of life; IBDQ = Inflammatory Bowel Disease Questionnaire; MID = minimal important difference; NR = not reported; PRO-2 = patient-reported outcome 2; RCT = randomized controlled trial; SAE = serious adverse event; SC = subcutaneous; SES-CD = Simple Endoscopic Score for Crohn’s Disease; SF = stool frequency.
Notes: Study limitations (which refers to internal validity or risk of bias), inconsistency across studies, indirectness, the imprecision of effects, and publication bias were considered when assessing the certainty of the evidence. All serious concerns in these domains that led to the rating down of the level of certainty are documented in the table footnotes.
In the GALAXI trials, the hierarchical testing strategy precluded formal statistical testing of the long-term secondary end points comparing guselkumab with ustekinumab because the adjusted treatment difference for clinical remission at week 48 did not reach statistical significance.
In both GALAXI trials, all long-term end points comparing guselkumab relative to ustekinumab were analyzed separately, comparing each individual guselkumab regimen against ustekinumab.
aClinical remission was defined as a CDAI score of less than 150. An empirically derived MID was not identified for the between-group difference for this outcome. A difference of 12% between the groups was identified by the clinical experts consulted by CDA-AMC as a threshold of clinical importance for this outcome.
sEndoscopic response was defined as at least a 50% improvement from baseline in the SES-CD score or a SES-CD score of 2 or higher. An empirically derived MID was not identified for the between-group difference for this outcome. A difference of 5% between the groups was identified by the clinical experts consulted by CDA-AMC as a threshold of clinical importance for this outcome.
cEndoscopic remission was defined as an SES-CD score of 4 or less and at least a 2-point reduction from baseline and with no subscore greater than 1 in any individual component. An empirically derived MID was not identified for the between-group difference for this outcome. A difference of 5% between the groups was identified by the clinical experts consulted by CDA-AMC as a threshold of clinical importance for this outcome.
dIBDQ remission was defined as an IBDQ total score of at least 170.
eData were pooled for each guselkumab treatment group from the GALAXI 2 and GALAXI 3 studies and compared with the ustekinumab treatment group.
fUstekinumab: Approximately 6 mg/kg IV, followed by 90 mg SC every 8 weeks.
gGuselkumab regimen 1 (low dose) = 200 mg IV every 4 weeks, followed by 100 mg SC every 8 weeks. Guselkumab regimen 2 (high dose) = 200 mg IV every 4 weeks, followed by 200 mg SC every 4 weeks.
hThe level of evidence was rated down 1 level for serious imprecision. An empirically derived MID was not identified for the between-group difference for this outcome. Based on the MID identified by clinical experts (a difference of 12% between the groups), the point estimate suggests little to no difference, and the 95% CI for the between-group difference crossed the MID threshold.
iThe level of evidence was rated down 2 levels for serious imprecision and inconsistency. An empirically derived MID was not identified for the between-group difference for this outcome. Based on the MID identified by clinical experts (a difference of 5% between the groups), the point estimate suggests a benefit, and the 95% CI for the between-group difference crossed the MID threshold to include little to no difference. Additionally, inconsistency was observed between studies — while 1 study demonstrated a benefit based on the point estimate, the other study showed little to no difference. This inconsistency reduces the overall certainty of the evidence.
jThe level of evidence was rated down 1 level for serious imprecision. An empirically derived MID was not identified for the between-group difference for this outcome. A difference of 5% between the groups was identified by the clinical expert consulted by CDA-AMC as a threshold of clinical importance for this outcome, the point estimate suggested a benefit, and the 95% CI for the between-group difference crossed the MID threshold to include little to no difference.
kThe level of evidence was rated down 2 levels for serious imprecision and inconsistency. An empirically derived MID was not identified for the between-group difference for this outcome. A difference of 5% between the groups was identified by the clinical experts consulted by CDA-AMC as a threshold of clinical importance for this outcome, and the 95% CI for the between-group difference crossed the MID threshold. Additionally, inconsistency was observed between studies — while 1 study demonstrated a benefit based on the point estimate, the other study showed little to no difference. This inconsistency reduces the overall certainty of the evidence.
lThe level of evidence was rated down 1 level for study limitations. An empirically derived MID was not identified for the between-group difference for this outcome. Based on the MID identified by clinical experts (a difference of 5% between the groups), the 95% CI for the between-group difference crossed the MID threshold. Notable between-group imbalances in missing data were observed after applying the intercurrent event handling strategies.
mAn empirically derived MID was not identified for the between-group difference for this outcome. A difference of 3% to 5% between the groups was identified by the clinical experts consulted by CDA-AMC as a threshold of clinical importance for this outcome. The level of evidence was rated down 2 levels for imprecision and indirectness; the estimate was informed by a very low number of events and may be unstable. Additionally, there was indirectness related to the inclusion of worsening CD and other CD-related events such as an SAE. This complicates interpretation.
Sources: Clinical Study Report for the GALAXI 2 trial12 and Clinical Study Report for the GALAXI 3 trial.13 Details included in the table are from the sponsor’s Summary of Clinical Evidence.
Long-Term Extension Studies
Description of Studies
The parent pivotal studies, the GALAXI 2 and GALAXI 3 trials, were randomized, double-blind, placebo- and active-controlled, parallel-group, multicentre studies to evaluate the efficacy and safety of guselkumab in patients with moderately to severely active CD. The long-term extensions (LTEs) were designed to evaluate the long-term efficacy of clinical and endoscopic outcomes, and safety, to evaluate the benefit of treatment adjustment for patients with inadequate response between week 52 and week 80, and the impact of guselkumab on HRQoL. Patients continued with their assigned treatments throughout the LTE phase. Patients on guselkumab or ustekinumab maintained their dosages while those on placebo were discontinued after unblinding at week 48. The studies are ongoing and week 96 results are presented.
Efficacy Results
In the primary efficacy analysis set (all randomized patients with a screening SES-CD score of ≥ 6 [or ≥ 4 for participants with isolated ileal disease] who received ≥ 1 [partial or complete] dose of the study drug), rates of clinical remission were 59.4% in the pooled regimen 1 group (guselkumab 200 mg IV every 4 weeks to 100 mg SC every 8 weeks), 63.2% in the pooled regimen 2 group (guselkumab 200 mg IV every 4 weeks to 200 mg SC every 4 weeks), and █████ in the ustekinumab group at week 96. The rates of patients with corticosteroid-free clinical remission were 57% in the pooled regimen 1 group, 60.8% in the pooled regimen 2 group, and █████ in the pooled ustekinumab group at week 96. The rates of patients with endoscopic response were 44.1%, 44.6%, and █████ in the pooled regimen 1, regimen 2, and ustekinumab groups, respectively, at week 96. The rates of patients with clinical remission and endoscopic response were 40.6% and 41.6% in the pooled regimen 1 and regimen 2 groups, respectively, compared to █████ in the pooled ustekinumab group at week 96. In the primary efficacy analysis set, the rates of patients with deep remission (clinical remission and endoscopic response) were 26.2%, 29.4%, and ███ in the pooled regimen 1, regimen 2, and ustekinumab groups at week 96. Data on HRQoL was not presented.
In the LTE efficacy analysis set (consisting of all patients who had entered the LTE and had received ≥ 1 [partial or complete] dose of the study drug during the LTE), the rates of patients with clinical remission were 75.1%, 78.1%, and █████ in the pooled regimen 1, regimen 2, and ustekinumab groups, respectively, at week 96. The rates of patients with endoscopic response were 53.6%, 55.4%, and █████ in the pooled regimen 1, regimen 2, and ustekinumab groups at week 96. The rate of patients with endoscopic remission was 34.6%, 39.3%, and █████ in the pooled regimen 1, regimen 2, and ustekinumab groups at week 96.
Harms Results
In the LTE safety analysis set (consisting of randomized patients who entered the LTE and received ≥ 1 dose of study intervention [including a partial dose] during the LTE phase), 61.4%, 58.8%, and █████ of patients in the regimen 1, regimen 2, and ustekinumab groups, respectively, reported at least 1 AE. In total, 5.2%, 5.8%, and ████ of patients reported at least 1 SAE in the regimen 1, regimen 2, and ustekinumab groups, respectively. AEs leading to discontinuation were generally similar across treatment groups in the LTE. In total, 2%, 1.6%, ████ in the regimen 1, regimen 2, and ustekinumab groups, respectively, discontinued treatments in the LTE. There were no deaths reported in the guselkumab treatment groups. In total, ||| patient died in the ustekinumab group. Notable harms were not reported in the guselkumab treatment groups in the LTE phase. ███ ████████ ██ ███ ███████████ ████████ █ ██ ████ █████████████ ███ █ ███████
Critical Appraisal
Both pivotal studies of the LTEs (the GALAXI 2 and GALAXI 3 trials) were randomized, double-blind, placebo-controlled, parallel-group trials. There is a risk for selection bias for the main estimand (LTE patients) because only patients with continued treatment benefit (approximately 80% of randomized patients) in the opinion of the investigator were included.
The LTE phase was unblinded at week 48, which may have introduced bias in patient management, the reporting of AEs, and the assessment of subjective clinical outcomes. Concomitant treatments were provided or adjusted at the discretion of the investigator; the impact on estimates of efficacy cannot be quantified.
Overall, the statistical methods in the LTEs were appropriate. The strategy used to handle ICEs for the main estimands (LTE patients) was relevant and aligned with the guidance of regulatory bodies. However, it is not clear how many patients discontinued for reasons other than a lack of efficacy or an AE (ICE category 3) or who chose not to enter the LTE (ICE category 7). Because these ICEs are not clearly related to a lack of efficacy, imbalances in these occurrences could introduce bias in the randomized comparisons. However, no information was reported to adequately access the proportion of patients with these ICEs. There was no defined hierarchical testing procedure for the LTE phases in both LTEs and statistical analyses were not controlled for multiplicity. Thus, the results were considered exploratory. Rates of study discontinuation were generally low in both LTE studies and similar between groups, and were mostly attributed to withdrawal by patients, AEs, and a lack of efficacy. NRI was performed for missing data in the primary LTE analysis. The extent of missing data was not clear; therefore, any potential for a risk of bias arising from the imputation methods used cannot be ascertained.
In general, the population requested for reimbursement aligns with that of the Health Canada indication. The dosing and administration of guselkumab in the LTEs were consistent with the product monograph. According to the clinical experts, the patient eligibility criteria and baseline characteristics of the parent studies were generalizable to adults with moderately to severely active CD in the Canadian clinical setting. However, HRQoL was not reported in the LTE. Therefore, the impact of guselkumab on HRQoL in the long term is uncertain.
Indirect Comparisons
Description of Studies
A sponsor-submitted indirect treatment comparison (ITC) evaluated guselkumab versus relevant comparators (including adalimumab, infliximab, vedolizumab, ustekinumab, risankizumab, and upadacitinib) for moderately to severely active CD. An SLR (July 2023) identified 58 unique RCTs; of these, 37 double-blind RCTs informed the network meta-analysis (NMA). Analyses considered adults with a history of CON-Failure and/or BIO-Failure, assessed induction (approximately 12 weeks) and maintenance (approximately 1 year), and examined clinical remission, clinical response, endoscopic response, and a joint outcome of remission plus endoscopic response. The ITC used Bayesian random-effects NMAs, often adjusted for differences in baseline placebo response during induction. No safety data were included in these indirect comparisons.
Efficacy Results
During induction, results showed that in both the CON-Failure and BIO-Failure analysis populations, no active comparator significantly outperformed guselkumab. There were instances in which guselkumab appeared numerically more effective than vedolizumab or ustekinumab, albeit with wide credible intervals that highlight uncertainty in these estimates.
In the maintenance phase (with or without patients with a delayed response), numerical trends suggested that guselkumab may potentially exceed the efficacy of some comparators (e.g., vedolizumab, certain doses of upadacitinib); no significant advantage for any other active treatment over guselkumab was observed. Overall, there was no clear evidence showing any comparator to be more efficacious. However, wide credible intervals in several comparisons suggested that caution is needed when interpreting the relative treatment effects.
Harms Results
No safety or harms outcomes were included in the sponsor’s submitted ITC.
Critical Appraisal
The SLR’s search was last conducted in July 2023 and the NMA restricted evidence to double-blind RCTs, which may have excluded relevant open-label trials and more recent evidence. The GRAVITI trial was not included in the NMA, precluding conclusions about SC induction. Maintenance analyses incorporated complex normalization of different trial designs, including rerandomization, but relied on untested assumptions that may affect interpretability. Baseline risk adjustment was only applied during induction, despite potentially greater heterogeneity in the maintenance phase. Variations across trials — encompassing population differences, definitions of response, and outcome time points ranging from 4 weeks to 64 weeks — further introduced potential bias due to the violation of the underlying transitivity assumption and imprecision. Safety end points were not evaluated, limiting any comparative benefit-risk assessment. Additionally, data extraction and risk-of-bias assessment were conducted by a single reviewer with only secondary validation, which may have introduced human error bias. Several included trials had risk-of-bias concerns.
Studies Addressing Gaps in the Evidence From the Systematic Review
GALAXI 1 Study LTE Phase
Description of Studies
The GALAXI 1 study is a phase II, randomized, double-blind, placebo- and active-controlled, multicentre trial with an LTE component, designed to evaluate the efficacy and safety of guselkumab in adults with moderately to severely active CD. The LTE phase extended treatment to approximately 152 weeks and included patients who continued to derive benefit according to the investigator at the end of the 48-week maintenance period. The study was unblinded at 48 weeks. The study enrolled 220 patients in the guselkumab group and 71 patients in the ustekinumab group, with 151 patients and 48 patients, respectively, entering the LTE. Participants continued on their assigned SC treatment regimens throughout the extension period. The primary end point was clinical remission, defined by a CDAI score of less than 150 at week 144, with additional assessments of PROs and endoscopic end points. The study was not powered to detect differences between guselkumab and ustekinumab, and all outcomes beyond week 12 were considered exploratory. Three cohorts were defined: the all-randomized NRI set, which included every patient dosed from week 0, imputing discontinuations, nonentry, and ICEs as nonresponse; the LTE NRI set, which comprised those dosed during LTE with the same ICE rules plus CD-related surgery and AE-related discontinuation, assessed through week 144 using NRI; and finally, the LTE observed set, which included only patients on treatment without dose changes, reporting observed rates without imputations.
Efficacy Results
By week 144, clinical remission — as measured by the CDAI — remained stable in patients treated with guselkumab. In the LTE NRI cohort, 68.2% (103 of 151) of patients treated with guselkumab had CDAI remission while 54.1% (100 of 185) of patients had remission in the all-randomized NRI cohort and 95.4% (103 of 108) of patients in the LTE observed cohort. Ustekinumab yielded similar results: 64.6% (31 of 48) of patients in the LTE NRI cohort and 83.8% (31 of 37) of patients in the LTE observed cohort, and 46.0% (29 of 63) of patients in the all-randomized NRI analysis were in CDAI remission. PROs (PRO-2 remission) followed the same pattern — 64.2% and 51.4% of patients treated with guselkumab reached PRO-2 remission in the LTE NRI and all-randomized NRI cohorts, respectively, while 58.3% of patients treated with ustekinumab did so in the LTE NRI cohort.
Endoscopic assessments likewise demonstrated maintained benefit through week 144. In the guselkumab group, endoscopic response rates were 43.0% (LTE NRI) and 34.7% (all-randomized NRI), and endoscopic remission rates were 28.9% and 23.3%, respectively. Patients treated with ustekinumab had a 25.5% endoscopic response and 17.0% endoscopic remission in the LTE NRI cohort.
Harms Results
Guselkumab was well tolerated through 152 weeks, with overall AE rates comparable to those of ustekinumab. In the guselkumab group, there were 279.8 events per 100 patient-years (PYs) and 87.3% of patients experienced 1 or more AE; SAEs occurred at 10.6 per 100 PYs in 11.4% of patients, and 13.2% of patients discontinued due to AEs. Infections affected 51.8% of patients treated with guselkumab (65.8 events per 100 PYs), with serious infections in 5.5% of patients (3.3 events per 100 PYs) versus infections in 46.5% of patients (44.7 events per 100 PYs) and serious infections in 7.0% of patients (5.0 events per 100 PYs) in the ustekinumab group.
The most frequent individual AEs for guselkumab were COVID-19 at 15.0% (8.5 events per 100 PYs), headache at 13.6% (10.1 events per 100 PYs), nasopharyngitis at 12.7% (12.9 events per 100 PYs), CD events at 10.9% (7.5 events at 100 PYs), and pyrexia at 9.5% (8.0 events per 100 PYs). By comparison, ustekinumab‐treated patients reported lower rates of COVID-19 at 7.0% (3.6 events at 100 PYs) but similar frequencies of headache at 11.3% (5.7 events per 100 PYs) and nasopharyngitis at 11.3% (7.1 events per 100 PYs).
Critical Appraisal
The GALAXI 1 study’s LTE employed a robust “treat-through” design (i.e., participants remained on their originally randomized therapy through week 152). The prespecified analysis sets (all-randomized NRI, LTE NRI, and LTE observed) ensured methodological transparency. However, because only 80% of randomized patients entered the extension (investigator-judged to be benefiting), the LTE cohort lost its randomized basis and was susceptible to selection bias. Unblinding at week 48 may have influenced patient management, AE reporting, and subjective efficacy assessments while investigator-driven adjustments to concomitant medications further clouds causal inference. Although ICEs were handled per regulatory guidance, the absence of a complete ICE inventory and the unclear extent of missing data mean that imputation methods — and thus overall efficacy estimates — cannot be fully appraised.
Participants included patients with and without prior exposure to biologics with moderate to severe CD, reflecting a real-world treatment landscape and supporting broad applicability of safety and efficacy findings. The exclusion of individuals with certain comorbidities or complex complications limits the relevance of the results to the sickest or those with more severe or multifactorial disease presentations.
Neff-Baro et al. (2024)
Additional evidence by Neff-Baro et al. (2024)54 was reviewed to assess the predictive impact of endoscopic response after maintenance treatment (approximately 48 weeks) and long-term outcomes (approximately 96 weeks) in patients with moderately to severely active CD. A pooled post hoc analysis was conducted with data from the treatment groups (placebo excluded) of 2 RCTs (the IM-UNITI trial [a phase III maintenance trial of ustekinumab] and the GALAXI 1 trial [a phase II treat-through trial of guselkumab], total N = 461]), which enrolled adult patients diagnosed with moderately to severely active CD of at least 3 months’ duration (confirmed through CDAI scores).
Efficacy Results
Efficacy results at the end of maintenance (EOM): Overall, 75.3% of patients with endoscopic response at the EOM were in long-term clinical remission (i.e., week 92 for the IM-UNITI study and week 96 for the GALAXI 1 study) compared to 48.5% of patients without endoscopic response. The odds ratio (OR) for endoscopic response at the EOM was 1.91 (95% CI, 1.11 to 3.28). In total, 78.5% of patients with endoscopic response at the EOM were in long-term clinical response compared to 56.9% of patients without endoscopic response (OR = 1.65; 95% CI, 0.97 to 2.83). A total of 75.0% versus 54.4%, respectively, of patients with endoscopic response at the EOM were in long-term IBDQ remission compared to patients without endoscopic response (OR = 1.99; 95% CI, 1.16 to 3.41).
Harms Results
There were no harms results presented.
Critical Appraisal
The pooled post hoc analysis is limited by a lack of prespecification and an increased risk of type I error due to multiple group testing; thus, the evidence is exploratory. The model aimed to provide an indication of the ability of endoscopic response at week 48 to predict later outcomes among individual patients. It is not clear how variables were selected for inclusion within the regression models. It is possible that important predictors (confounders) were missed that might alter the observed associations had they been included. In general, the associations were estimated with imprecision, which indicates uncertainty in the estimated magnitude of association between endoscopic response at week 48 and later outcomes. There is a risk of bias in the estimated associations due to substantial missing data (approximately 15% to 35%) across the available outcomes, which does not appear to have been imputed. Finally, the study provides some information to suggest an association between endoscopic response at 48 weeks and later outcomes. However, the ideal evidence to validate a surrogate end point comes from RCTs that demonstrate the ability of the treatment effect (i.e., guselkumab versus placebo or other comparator) at 48 weeks to predict a clinically relevant treatment effect on patient-important outcomes at later time points.
Conclusions
Evidence from 3 phase III, double-blind RCTs — the GALAXI 2 and GALAXI 3 studies (IV induction, then SC maintenance), and the GRAVITI study (SC induction, then SC maintenance) — evaluated outcomes considered important to both patients and clinicians. These studies demonstrated high-certainty evidence that treatment with guselkumab results in a clinically important improvement in clinical and endoscopic outcomes, clinical response, and 90-day, corticosteroid-free clinical remission, as well as PRO-2 remission, at week 12 and week 48 compared with placebo in adults with moderately to severely active CD. Both GALAXI studies demonstrated moderate-certainty evidence that treatment with guselkumab likely results in a clinically important improvement in endoscopic remission at week 48, and little to no difference in clinical remission at week 48, when compared with ustekinumab. However, in both GALAXI trials, heterogeneity in the efficacy of guselkumab was observed between the 2 dosing regimens with respect to IBDQ remission at week 12 when compared with both placebo and ustekinumab, as well as a composite of clinical remission and endoscopic response at week 48 when compared with ustekinumab. Both GALAXI studies demonstrated high-certainty evidence for regimen 1 and moderate-certainty evidence for regimen 2 that treatment with guselkumab likely results in a clinically meaningful improvement in IBDQ remission at week 12 when compared with placebo. When compared with ustekinumab, both GALAXI studies demonstrated low-certainty evidence for regimen 1 and moderate-certainty evidence for regimen 2 that treatment with guselkumab likely results in little to no difference in IBDQ remission at week 48. Of note, in the analyses of the individual GALAXI 2 and GALAXI 3 trials, these end points were not formally tested.
Although the Health Canada indication is broader than the patient populations enrolled in the trials (i.e., trial patients whose disease had inadequate response or was unable to tolerate conventional or advanced therapy), the clinical experts consulted by CDA-AMC did not consider this discrepancy to affect the generalizability of the findings. No new safety signals were identified across the trials and the safety profile of guselkumab was considered consistent with that of other advanced therapies used in the management of CD based on expert opinion. The LTE phase of the GALAXI trials provided additional information on the longer-term benefits of guselkumab beyond 48 weeks for key efficacy and safety outcomes; however, because no formal inferential analyses were conducted, the findings are considered exploratory.
The results of the sponsor-submitted ITC demonstrated that, compared with active treatments, guselkumab often showed potential superiority over vedolizumab in achieving clinical remission and response; however, its comparative efficacy against other drugs — such as ustekinumab, risankizumab, and upadacitinib — was more variable, with results differing across specific analyses and outcome measures. Due to limitations of the ITC primarily related to the heterogeneity across studies, unverifiable assumptions made in the analysis, and imprecision in the treatment effect estimates, no definitive conclusions can be drawn regarding the relative efficacy of guselkumab compared with other relevant comparators. The sponsor-submitted ITC did not include the GRAVITI trial, precluding conclusions about the efficacy of SC induction versus relevant comparators. Additionally, there was not any comparative safety data.
Introduction
The objective of this report is to review and critically appraise the evidence submitted by the sponsor on the beneficial and harmful effects of guselkumab in the treatment of adult patients with moderately to severely active CD.
Disease Background
The content in this section has been informed by materials submitted by the sponsor and clinical expert input. The following has been summarized and validated by the review team.
CD is a chronic form of IBD that can affect any part of the gastrointestinal tract, but most commonly affects the ileum (i.e., the small intestine), colon (i.e., the beginning of the large intestine), and rectum.2,3 CD is most commonly diagnosed in adolescents and young adults, typically between the ages of 20 years and 30 years.4 In 2023, the incidence of IBD in Canada was estimated at 30 per 100,000 individuals, including 12.2 per 100,000 for CD.5 These rates correspond to more than 11,700 new cases of IBD diagnosed in 2023, including approximately 4,800 new cases of CD.5 CD can manifest in 3 phenotypic forms: inflammatory, stricturing, and penetrating (fistulas and abscesses).6 Common symptoms of CD include abdominal pain, rectal bleeding, fatigue, vomiting, diarrhea, perianal disease, weight loss, and bloating.4,7,8 CD may also cause complications in patients over time such as malnutrition, weight loss, anemia, bowel obstructions, fistulas, anal fissures, intra-abdominal and other abscesses, and ulcers.2,4 In addition, patients with colonic CD have an increased risk of developing colon cancer.4 Smoking, a family history of IBD, infectious gastroenteritis, and frequent use of nonsteroidal anti-inflammatory drugs have been identified as risk factors for CD.9
While some patients experience continuous and progressively active disease, approximately 20% of patients may enter a prolonged remission following initial presentation.7 Disease severity is measured using the CDAI, SES-CD, and Harvey-Bradshaw Index, which are designed to evaluate bowel-related symptoms including stool frequency, abdominal pain, arthritis or arthralgia, uveitis, skin or mouth lesions, and perianal disease. The classification of CD severity, as defined by the American College of Gastroenterology using the CDAI and the SES-CD, is summarized in Table 5. The diagnosis of CD is based on a combination of clinical evaluation and endoscopic, histological, radiological, and/or biochemical investigations.9 An ileocolonoscopy with multiple biopsy specimens is the first-line procedure for diagnosing CD.9 The endoscopic hallmark of CD is the patchy distribution of inflammation, with skip lesions, defined as areas of inflammation interposed between normal-appearing mucosa.9 Cross-sectional imaging using MRI and CT enterography and transabdominal ultrasonography are complementary to endoscopy and offer the opportunity to detect and stage inflammatory, obstructive, and fistulizing CD.9 The American College of Gastroenterology guidelines recommend routine laboratory evaluation for CD, including stool testing, an ileocolonoscopy with biopsies, and small bowel imaging to confirm diagnosis of CD.2 In alignment with this approach, the joint European Crohn’s and Colitis Organisation and the European Society of Gastrointestinal and Abdominal Radiology recommend a comprehensive diagnostic strategy incorporating clinical assessment, biochemical markers, stool testing, endoscopy, cross-sectional imaging, and histological evaluation.15 No companion diagnostic testing and no specific diagnostic technology is required for guselkumab and its comparators within the CD treatment landscape.
Table 5: Classification of Disease Severity in Crohn Disease
Status | Score |
|---|---|
CDAI | |
Remission | < 150 |
Mild to moderate | 150 to 220 |
Moderate to severe | > 220 to 450 |
Severe | > 450 |
SES-CD | |
Inactive | 0 to 2 |
Mild activity | 3 to 6 |
Moderate activity | 7 to 15 |
Severe activity | ≥ 16 |
CDAI = Crohn’s Disease Activity Index; SES-CD = Simple Endoscopic Score for Crohn’s Disease.
Source: American College of Gastroenterology.2
Standards of Therapy
Content within this section has been informed by materials submitted by the sponsor and clinical expert input. The following has been summarized and validated by the review team.
The treatment of CD is individualized based on disease location, extent, phenotype, and severity. Treatment goals for CD, as outlined in Canadian and American clinical practice guidelines,16,17 include inducing and maintaining clinical remission, reducing reliance on long-term corticosteroid use, and minimizing treatment-related side effects. Long-term goals include endoscopic healing, preventing disability, and normalizing HRQoL, while short- to intermediate-term goals focus on normalizing biomarkers of disease activity, such as CRP and fecal calprotectin. According to the clinical experts consulted by CDA-AMC, the key therapeutic goals for the treatment of CD include clinical response and remission, endomucosal remission, and histological remission. Several drug classes are used in the treatment of CD, including Janus kinase inhibitors, immunosuppressants (e.g., azathioprine, cyclosporine, methotrexate, 6-mercaptopurine), corticosteroids (e.g., prednisone), TNF alpha antagonists (e.g., infliximab, adalimumab), interleukin inhibitors, and integrin inhibitors (e.g., vedolizumab).2 With the exception of the TNF alpha antagonists, interleukin inhibitors, and vedolizumab, all are commonly referred to as conventional therapies. Treatment options highlighted are consistent with the input from the clinical experts consulted by CDA-AMC for this review. Current medical management follows a stepwise approach in which treatments are used sequentially, with escalation to newer therapies or higher doses when an adequate response is not achieved at each prior step.18 Surgical intervention, including total colectomy and ileostomy, may be considered for patients with severe complications or those whose disease does not respond adequately to medical therapy.2 According to the clinical experts consulted by CDA-AMC, despite the availability of multiple treatment options, there remains a need for more effective therapies for moderate to severe CD. The clinical experts emphasized that the early initiation of appropriate therapy is critical because the first advanced treatment often provides the greatest benefit; however, evidence to guide the optimal sequencing of biologic therapies remains limited.
Drug Under Review
Key characteristics of guselkumab are summarized in Table 6 with other treatments available for CD.
Guselkumab is a human immunoglobulin G lambda monoclonal antibody that selectively binds to the p19 subunit of interleukin-23 (IL-23) through the antigen-binding site, thereby inhibiting IL-23’s interaction with cell-surface IL-23 receptors.19 IL-23 is a naturally occurring cytokine involved in normal inflammatory and immune responses, and its levels are elevated in the colonic tissue of patients with CD.20 By blocking IL-23 signalling, guselkumab inhibits the downstream release of proinflammatory cytokines and chemokines, including interleukin-17A, interleukin-17F, and interleukin-22. Guselkumab is the only dual-acting selective IL-23 inhibitor shown to potently neutralize IL-23 through 2 mechanisms: it binds directly to soluble IL-23 and also to CD64 (FcγRI), a high-affinity Fc receptor expressed on cells that produce IL-23.19,20 This dual binding allows guselkumab to capture IL-23 at the site of production within the same cell, enhancing its local inhibitory effect.
The recommended induction dosage of guselkumab is 200 mg administered by IV infusion over a period of at least 1 hour, or 400 mg of guselkumab administered by SC injection at week 0, week 4, and week 8. For the SC formulation, each 400 mg dose is given as 2 injections of 200 mg. The recommended maintenance dosage of guselkumab is 100 mg administered by SC injection at week 16 and every 8 weeks thereafter. A dose of 200 mg administered by SC injection at week 12 and every 4 weeks thereafter may be considered for patients whose disease does not show adequate therapeutic benefit from guselkumab, or according to clinical judgment.1
The indication of guselkumab is for the treatment of adult patients with moderately to severely active CD. The reimbursement request aligns with the indication. The drug underwent a standard review by Health Canada, with a Notice of Compliance granted on July 7, 2025.
Guselkumab (Tremfya) has been previously approved by Health Canada for use in adult patients with moderate to severe plaque psoriasis who are candidates for systemic therapy or phototherapy,1 and was reviewed by CDA-AMC for this indication.
Table 6: Key Characteristics of Treatments Used for Crohn Disease
Treatment | Mechanism of action | Indicationa | Route of administration | Recommended dosage | Serious adverse effect or safety issue |
|---|---|---|---|---|---|
Guselkumab | A human IgG lambda monoclonal antibody that selectively binds to the p19 subunit of IL-23 via its antigen-binding site. It is a dual-acting, selective IL-23 inhibitor that potently neutralizes IL-23 through 2 mechanisms: by binding directly to soluble IL-23 and by engaging CD64, a receptor on IL-23–producing cells. | Moderately to severely active CD | IV formulation: IV (induction) and SC (maintenance) SC formulation: SC (induction) and SC (maintenance) | Adults (moderately to severely active CD) Induction: 200 mg administered by IV infusion over a period of at least 1 hour, or 400 mg administered by SC injection at week 0, week 4, and week 8 Maintenance: 100 mg administered by SC injection at week 16 and every 8 weeks thereafter. A dose of 200 mg administered by SC injection at week 12 and every 4 weeks thereafter may be considered for patients who do not show adequate therapeutic benefit from guselkumab, or according to clinical judgment. |
|
Risankizumab | Humanized IgG1 monoclonal antibody that binds to the p19 subunit of human IL-23 cytokine and inhibits IL-23 signalling in cell-based assays, including the release of the proinflammatory cytokine, IL-17. | Moderately to severely active CD who have had an inadequate response, intolerance, or demonstrated dependence to corticosteroids; or an inadequate response, intolerance, or loss of response to immunomodulators or biologic therapies | IV (induction) and SC (maintenance) | Adults (moderate to severe CD)
|
|
Ustekinumab | Human IgG1 monoclonal antibody; neutralizes cellular responses mediated by IL-12 and IL-23. | Moderately to severely active CD who have had an inadequate response, loss of response, or were intolerant to either conventional therapy (CS or immunomodulators) or 1 or more TNF antagonists, or who were CS-dependent | IV (induction) and SC (maintenance) | Adult CD
IV at week 0
|
|
Vedolizumab | IgG1 monoclonal antibody; binds to the human alpha 4 beta 7 integrin, acting as a gut-selective anti-inflammatory biologic. | Moderately to severely active CD who have had an inadequate response, lost response, or were intolerant to immunomodulators or a TNF antagonist; or have had an inadequate response or intolerance to, or demonstrated dependence on, a CS | IV (induction and maintenance) and SC (maintenance) | Adults (moderate to severe CD) IV formulation
SC formulation
|
|
Infliximab | Anti-TNF IgG1 kappa monoclonal antibody that neutralizes the biological activity of TNF alpha by specifically binding to its receptors. | Reduction of signs and symptoms, induction and maintenance of clinical remission and mucosal healing and reduction of CS use in adults with moderately to severely active CD who have had an inadequate response to a corticosteroid and/or aminosalicylate Adults with fistulizing CD that has not responded despite conventional treatment | IV | Adults (moderate to severe CD)
Adults (fistulizing CD)
| Serious infections
|
Adalimumab | Anti-TNF. Human IgG1 monoclonal antibody; binds and blocks TNF alpha and its interaction with p55 and p75 cell-surface TNF receptors. | Reducing signs and symptoms and inducing and maintaining clinical remission in adults with moderately to severely active CD who have had an inadequate response to conventional therapy Reducing signs and symptoms and inducing clinical remission in adults with moderately to severely active CD who have lost response or are intolerant to infliximab | SC | Adult CD
|
|
Upadacitinib | Upadacitinib is a selective JAK inhibitor that demonstrates activity against JAK1, JAK2, JAK3, and TYK2. | Moderately to severely active CD who have demonstrated prior treatment failure, i.e., an inadequate response to, loss of response to, or intolerance to at least 1 of conventional and/or biologic therapy | Oral | Adults (moderate to severe CD)
|
|
Anti-TNF = anti–tumour necrosis factor; CD = Crohn disease; CS = corticosteroid; IgG = immunoglobin G; IgG1 = immunoglobin G1; IL-12 = interleukin-12; IL-17 = interleukin-17; IL-23 = interleukin-23; JAK = Janus kinase; SC = subcutaneous; TNF = tumour necrosis factor.
aHealth Canada–approved indication.
Sources: Product monographs of guselkumab (Tremfya),1 risankizumab (Skyrizi),21 vedolizumab (Entyvio),22 infliximab (Remicade and Inflectra),23 ustekinumab (Stelara),24 adalimumab (Humira),25 and upadacitinib (Rinvoq).26
Perspectives of Patients, Clinicians, and Drug Programs
The full patient and clinician group submissions received by CDA-AMC are available in the consolidated patient and clinician group input document for this review on the project website.
Patient Group Input
This section was prepared by the review team based on the input provided by patient groups.
Two patient inputs were summarized for this review. The GI Society is a national charity with programs and services that support research, advocate for appropriate patient access to health care, and promote gastrointestinal and liver health. Crohn’s and Colitis Canada is a national, volunteer-based health charity focused on finding the cures for CD and ulcerative colitis and improving the lives of children and adults affected by these diseases.
Information from both inputs was gathered from varied sources. In addition to information published in the 2023 Impact of Inflammatory Bowel Disease in Canada report, Crohn’s and Colitis Canada conducted online surveys in 2022, gathering information from 1,706 patients living in Canada with CD and ulcerative colitis and caregivers, including 687 patients who identified as having moderate to severe CD. The GI Society gathered information through questionnaires, interviews, and surveys. Information was derived from the following: sources a 2015 survey on biologics and biosimilars completed by 423 people in Canada with IBD (CD or ulcerative colitis); a 2018 survey on unmet needs among people in Canada with IBD completed by 432 people; a 2020 survey completed by 579 respondents regarding unmet patient needs in IBD; a 2020 survey on biosimilars with 145 respondents, most of whom had IBD (some had other inflammatory conditions); a 2022 survey about the IBD patient journey completed by 54 respondents in Canada with IBD; a 2022 focus group that included persons living with IBD; a 2023 review of interviews with 7 individuals living with IBD; and a 2024 survey about the unmet needs of individuals living with IBD, with 514 respondents from Canada. In addition, information from a 2025 round table meeting with a dozen experts, including gastroenterologists and patients and patient groups across Canada, was included. Additional data from a 2020 focus group on people living with IBD and 1-to-1 interviews with patients were also analyzed by the GI Society patient group.
The patient groups noted that CD often has a profound effect on patients’ quality of life, affecting the physical, emotional, and social factors of patients at home, at school, or in the workplace. Disease severity may fluctuate, thus requiring routine testing, reassessments, and medication changes. The GI Society group noted that, “it is never just 1 flare that dominates the impact of the disease, but the constant concern that there will be future flares, possibly worse than the last, at unpredictable times, which can disastrously disrupt their lives.” Crohn’s and Colitis Canada also noted that given that patients are unable to predict when their next flare will occur and how they will control it, isolation, stress, and anxiety are common for these patients. Respondents in 1 patient group expressed concerns such as the fear of running out of medication, anxiety about determining when to go to the emergency department based on symptoms, pain, fear of going out due to disease, decreased quality of life, and fear and worry about being faced with mortality at a young age. When asked about their most common IBD-related symptoms that they had experienced within the past 2 weeks, respondents in the Crohn’s and Colitis Canada input noted that the most common were fatigue (100%), abdominal pain or cramps (99%), pain (98%), constipation (97%), gas (95%), bloating (79%), an urgency to use the bathroom (78%), and diarrhea (73%). The GI Society input highlighted that patients living with CD preferred sustained remission and treatment response over relieving any 1 symptom. In the survey conducted by Crohn’s and Colitis Canada, most respondents with moderate IBD (53%) and severe IBD (60%) believed that access to different treatment options could make them feel better.
Both groups noted that treating CD requires a multifaceted strategy that allows for the management of symptom and disease consequences with therapies that target and reduce the underlying inflammation. Importantly, the severity of their IBD plays an important role in deciding which medications are being used. In the Crohn’s and Colitis Canada 2022 survey, most patients reported having used a combination of medications to manage their CD, with systemic steroids (79%), biologics and biosimilars (83%), immunomodulators (65%), and antibiotics (61%) being the most common, followed by sulfasalazine and 5-aminosalicylates (45%), and nonsystemic steroids (43%). Results from 1 survey conducted by the GI Society reported that 63% of respondents indicated that they had experienced symptom reduction after using a biologic, while 23% of respondents confirmed remission. No patients interviewed had received guselkumab; however, most had received a biologic. Corticosteroids were not particularly supported among patient respondents in the surveys conducted by both groups; they expressed that systemic steroid use was a burden to their disease management. In the 2022 survey conducted by Crohn’s and Colitis Canada, patients expressed that they would take corticosteroids only if necessary and wished they could eliminate systemic steroids from their list of medications.
The majority of patients with moderate to severe CD who participated in the surveys conducted by both patient groups expressed that they continued to experience symptoms with current treatment options. In a 2020 survey conducted by the GI Society, 33% of respondents expressed that their IBD was not well controlled by their current medications. Both groups indicated that patients need effective treatment options that mitigate symptoms and improve quality of life, are convenient, and can be accessed in a timely manner. Patients expressed that they desired fewer medications and wanted treatments that are safe, that can minimize the use of steroids, and that can be administered at home, and taken as pills. Major concerns identified by the GI Society included limited access to adequate treatment supplies and continuity of care given that some patients respond differently to various medications, and in some cases may stop responding to medications after using them for some time. Both groups unanimously noted that patients have varied preferences for medication administration, influenced by a range of factors. One group noted the importance of varied treatment options that can cater to individual needs, without a requirement to trial conventional therapies before accessing targeted treatments. Therefore, there is a need for new, effective treatments for patients that could improve quality of life and eliminate symptoms, pain, frustration, and hardship.
Clinician Input
Input From Clinical Experts Consulted for This Review
All CDA-AMC review teams include at least 1 clinical specialist with expertise regarding the diagnosis and management of the condition for which the drug is indicated. Clinical experts are a critical part of the review team and are involved in all phases of the review process (e.g., providing guidance on the development of the review protocol, assisting in the critical appraisal of clinical evidence, interpreting the clinical relevance of the results, providing guidance on the potential place in therapy). The following input was provided by 2 clinical specialists with expertise in the diagnosis and management of CD.
Unmet Needs
The clinical experts consulted by CDA-AMC identified several significant unmet needs in the current treatment landscape for CD, particularly among patients with moderate to severe disease. Although a variety of treatment options are available, the clinical experts indicated that not all patients with CD respond adequately to existing therapies. One of the major challenges in managing CD, according to the clinical experts, is primary nonresponse or loss of response to therapy over time. The clinical experts highlighted the need for safe and effective therapies for both patients with no prior exposure to biologics and patients with previous exposure to biologics. The clinical experts consulted emphasized that treatment response and remission rates tend to diminish with each subsequent line of therapy, with the first advanced therapy often providing the most substantial benefit. As such, they underscored the importance of introducing highly effective treatments early in the disease treatment to optimize patient outcomes. Furthermore, the clinical experts identified a significant barrier to accessing biologics: the requirement for patients whose disease had demonstrated an inadequate response to conventional therapies (i.e., immunomodulators) before initiating biologic treatment. Additionally, the clinical experts indicated that the lack of clear guidance on the sequencing of biologic therapies contributes to clinical uncertainty, often resulting in treatment decisions being made in the absence of robust comparative evidence.
Place in Therapy
The clinical experts consulted by CDA-AMC indicated that guselkumab is unlikely to dramatically shift the current treatment paradigm for CD and is expected to be used similarly to other biologic therapies. However, the clinical experts consulted agreed that guselkumab should be available as a treatment option for patients with moderately to severely active CD and that it should not be reserved only for those who are intolerant of or have contraindications to other biologic drugs. The clinical experts emphasized that there is no clinical justification for requiring patients to first try other advanced therapies or conventional treatments — such as azathioprine or methotrexate — before initiating guselkumab. Instead, they supported an approach in which oral corticosteroids may be used initially, as was done in the clinical trials (i.e., 1 of the possible inclusion criteria), but without mandating the prior use of immunomodulators. The clinical experts also highlighted that a favourable safety profile makes it a viable alternative for patients who have experienced adverse effects with other therapies, such as anti-TNF drugs. The clinical experts consulted also suggested that combination therapies may represent a future direction in the management of IBD.
Patient Population
According to the clinical experts, guselkumab is considered appropriate for a broad population, including both patients with no prior exposure to biologics and patients with previous exposure to biologics, particularly those who have had conventional therapy or other biologics failure or intolerance. The clinical experts highlighted that patients best suited for treatment with guselkumab would be those who have a confirmed diagnosis of CD, supported by pathological and endoscopic evidence. According to the clinical experts, patients with stricturing disease — often characterized by fibrosis rather than active inflammation — may be least likely to benefit from treatment with guselkumab. The misdiagnosis of CD is considered extremely rare by clinical experts. The clinical experts highlighted that delays in accessing gastroenterology services and endoscopic procedures can pose significant challenges to timely diagnosis and the initiation of appropriate treatment.
Assessing the Response Treatment
The clinical experts noted that the following outcomes are used to determine response to treatment: clinical response or remission, endoscopic response or remission, and improvements in HRQoL. According to the clinical experts consulted, clinicians monitor response to treatment by integrating endoscopic findings, symptom burden, and biomarkers such as fecal calprotectin and CRP. The clinical experts noted that an initial assessment of treatment response is typically conducted between week 10 and week 12, often using the Harvey-Bradshaw Index in clinical practice. They also indicated that the CDAI is not routinely used in Canadian clinical practice. The clinical experts noted that a more comprehensive evaluation, which may include endoscopic or imaging-based assessments, is typically performed between 48 weeks and 52 weeks. According to the clinical experts, endoscopic evaluation is most commonly conducted between 6 months and 8 months after treatment initiation, although its use is selective due to limited availability and the associated burden on patients.
Discontinuing Treatment
The experts emphasized that treatment should not be discontinued solely based on limited improvement at week 12, recommending reassessment and consideration of dose escalation, or the addition of immunomodulators or corticosteroids. According to the clinical experts consulted, the assessment of the response to treatment is typically performed between 48 weeks and 52 weeks. Discontinuation may be considered in cases of primary loss of response, worsening PROs, rising biomarkers (e.g., fecal calprotectin), or AEs or symptoms that cannot be managed.
Prescribing Considerations
The clinical experts noted that patients receiving guselkumab should be diagnosed, treated, and monitored by a specialist, such as a gastroenterologist or an internal medicine physician.
Clinician Group Input
No clinician group input was submitted for this review.
Drug Program Input
Drug programs provide input on each drug being reviewed through the reimbursement review processes by identifying issues that may impact their ability to implement a recommendation. The implementation questions and corresponding responses from the clinical experts consulted for this review are summarized in Table 7.
Table 7: Summary of Drug Plan Input and Clinical Expert Response
Drug program implementation question | Clinical expert response |
|---|---|
Relevant comparators | |
The proposed place in therapy for guselkumab is within the moderately or severely active CD treatment landscape for patients who have disease that failed conventional therapy and patients who have disease that failed previous biologic treatments. Guselkumab is a second-in-class IL-23 inhibitor (risankizumab being the first). Ustekinumab was the active comparator in the GALAXI trials and is an IL-12/IL-23 inhibitor. The proposed place in therapy is in line with the trials and ustekinumab is a reasonable comparator in the drug plans’ opinion. | Comment from the drug plans to inform CDEC deliberations. |
Considerations for initiation of therapy | |
GALAXI included adults (18 years and older) with moderately or severely active CD of at least 3 months’ duration and the following disease criteria at baseline:
GRAVITI included adults (18 years and older) with a CD diagnosis of at least 3 months’ duration with colitis, ileitis, or ileocolitis, confirmed at any time in the past by radiography, histology, and/or endoscopy and with the following criteria at baseline:
Question for the expert: Are the scores used in the clinical trials reflective of what is used in clinical practice or is the Harvey-Bradshaw Index score a more commonly used score? Which scoring tool should be used? | The clinical experts noted that the Harvey-Bradshaw Index score is typically used to assess treatment eligibility in clinical practice. Although not universally used, some clinicians also apply the SES-CD for endoscopic assessment. According to the clinical experts, the CDAI is primarily used in clinical trials and is not practical for day-to-day care due to its complexity. Despite the disconnect between trial and clinical tools, the clinical experts indicated that the use of CDAI in trials is not a barrier to interpreting or applying trial results in practice because clinicians are familiar with its components. |
Trials excluded patients younger than 18 years, patients with complications of CD (e.g., symptomatic strictures or stenoses, short gut syndrome), current or suspected abscess, had a draining stoma or ostomy, prior exposure to IL12/23 or IL23 drugs (exception for those with limited exposure and no failure or intolerance to ustekinumab). Questions for the expert: 1. Could this be considered in patients younger than 18 years? 2. Are there specific complications of CD that would preclude use of guselkumab? 3. Should patients who had previous exposure to an IL/23 (risankizumab) or IL12/23 be eligible for treatment with guselkumab? | 1. The clinical experts were unable to comment on the use of guselkumab in patients younger than 18 years because such patients were not included in the pivotal trials. The clinical experts noted that the lack of timely regulatory approvals in the pediatric population is a significant challenge that delays access to effective treatments for children. 2. The clinical experts noted that an allergy to any component of the medications or preservatives would preclude the use of guselkumab. Patients with stricturing or penetrating disease are usually excluded from clinical trials due to limited expected efficacy because these cases often require surgical intervention rather than reflecting safety concerns. 3. The clinical experts noted that patients who had previous exposure to an IL-23 or IL-12/IL-23 should be eligible for treatment with guselkumab. The clinical experts noted that in clinical practice, patients may have a response to different formulations of advanced therapies in the same drug class. |
Per the sponsor’s submitted information, the proposed place in therapy for guselkumab is within the treatment options for moderately to severely active CD in patients for whom conventional therapy has failed, or who have not responded to previous biologic treatments Question for the expert: Should patients whose disease has failed a biologic be eligible for treatment with guselkumab? | The clinical experts noted that guselkumab should be available for patients with no prior exposure to biologics and patients with previous exposure to biologics, including those whose disease failed biologic therapy. |
Consider alignment with reimbursement criteria used by each of the drugs plans for other biologics for the treatment of CD. | Comment from the drug plans to inform CDEC deliberations. |
Considerations for continuation or renewal of therapy | |
Consider alignment with renewal criteria used by each of the drug plans for other biologics for the treatment of CD. | Comment from the drug plans to inform CDEC deliberations. |
Considerations for discontinuation of therapy | |
How would loss of response be defined? Would loss of response, absence of clinical benefit, or disease progression be determined by the scores related to clinical response (i.e., changes in CDAI scores) and endoscopic response (i.e., changes in SES-CD scores) used in the trials? | The clinical experts noted that it would be reasonable to use a Harvey-Bradshaw Index score to determine response to therapy. They noted that the SES-CD score may also be used but could potentially be limited by how quickly a repeat colonoscopy can be completed in clinical practice. The clinical experts emphasized the importance of objective measures beyond clinical symptoms, including biomarkers (CRP, fecal calprotectin) and imaging modalities, such as intestinal ultrasound, CTE, or MRE. The clinical experts noted that treatment response should be assessed 12 weeks after treatment initiation. The clinical experts indicated that increasing corticosteroid use without objective evidence of disease activity is not appropriate and may indicate a lack of treatment response. The clinical experts noted that dose escalation may be considered for patients who do not have a response to guselkumab at a dose of 100 mg. The clinical experts emphasized that treatment should not be discontinued solely based on limited improvement at week 12, recommending reassessment and consideration of dose escalation, or the addition of immunomodulators or corticosteroids. |
Consider alignment with discontinuation criteria used by each of the drug plans for other biologics for the treatment of CD. | Comment from the drug plans to inform CDEC deliberations. |
Considerations for prescribing of therapy | |
The recommended induction dosage is 200 mg of guselkumab administered by IV infusion or 400 mg of guselkumab administered by SC injection at week 0, week 4, and week 8. For the SC formulation, each 400 mg dose is given as 2 injections of 200 mg. The recommended maintenance dosage is 100 mg of guselkumab administered by SC injection at week 16 and every 8 weeks thereafter. A dose of 200 mg administered by SC injection at week 12 and every 4 weeks thereafter may be considered for patients who do not show adequate therapeutic benefit from guselkumab, or according to clinical judgment. | Comment from the drug plans to inform CDEC deliberations. |
Consider alignment with prescribing criteria used by each of the drug plans for other biologics for the treatment of CD. | Comment from the drug plans to inform CDEC deliberations. |
System and economic issues | |
The submitted unit price of guselkumab is $3,059.7400 for the 100 mg/1.0 mL solution for SC injection, $3,059.7400 for the 200 mg/2.0 mL solution for SC injection, and $3,059.7400 for the 200 mg/20.0 mL vial for IV infusion. Based on the sponsor’s submitted BIA, from the perspective of the Canadian public payer drug plans (excluding Quebec), the increase in net expenditure attributable to guselkumab was estimated to be $3,387,771, $3,965,366, and $7,911,414 in year 1 (2026), year 2 (2027), and year 3 (2028), respectively, resulting in a 3-year total budget impact of $15,264,551. | Comment from the drug plans to inform CDEC deliberations. |
Some comparators have successfully gone through price negotiations for the same indication. | Comment from the drug plans to inform CDEC deliberations. |
AP = abdominal pain; BIA = budget impact analysis; CD = Crohn disease; CDAI = Crohn’s Disease Activity Index; CDEC = Canadian Drug Expert Committee; CRP = C-reactive protein; CTE = computed tomography enterography; IL = interleukin; MRE = magnetic resonance enterography; SC = subcutaneous; SES-CD = Simple Endoscopic Score for Crohn’s Disease; SF = stool frequency.
Clinical Evidence
The objective of this Clinical Review Report is to review and critically appraise the clinical evidence submitted by the sponsor on the beneficial and harmful effects of guselkumab in the treatment of adult patients with moderately to severely active CD. In the clinical evidence submitted by the sponsor, the induction dose of guselkumab is 200 mg administered by IV infusion, or 400 mg administered by SC injection at week 0, week 4, and week 8. The maintenance dose of guselkumab is 100 mg administered by SC injection at week 16 and every 8 weeks thereafter, or 200 mg administered by SC injection at week 12 and every 4 weeks thereafter. The focus has been placed on comparing guselkumab to relevant comparators and identifying gaps in the current evidence.
A summary of the clinical evidence included by the sponsor in the review of guselkumab is presented in 4 sections with the CDA-AMC critical appraisal of the evidence included at the end of each section. The first section, the systematic review, includes pivotal studies and RCTs that were selected according to the sponsor’s systematic review protocol. The CDA-AMC assessment of the certainty of the evidence in this first section using the GRADE approach follows the critical appraisal of the evidence. The second section includes sponsor-submitted LTE studies. The third section includes indirect evidence from the sponsor. The fourth section includes an additional study that was considered by the sponsor to address important gaps in the systematic review evidence.
Included Studies
Clinical evidence from the following are included in the review and appraised in this document:
three pivotal studies or RCTs identified in the systematic review
one LTE study
one ITC
two additional studies addressing gaps in evidence.
Systematic Review
The content in this section has been informed by materials submitted by the sponsor. The following has been summarized and validated by the review team.
Description of Studies
Characteristics of the included studies are summarized in Table 8.
Table 8: Details of Studies Included in the Systematic Review
Detail | GALAXI 2 study | GALAXI 3 study | GRAVITI study |
|---|---|---|---|
Designs and populations | |||
Study design | Phase III, randomized, double-blind, placebo- and active-controlled, parallel-group, multicentre study | Phase III, randomized, double-blind, placebo-controlled, parallel-group, multicentre study | |
Locations | A total of 186 centres from 36 countries or territories (31 sites in Canada) | A total of 198 centres from 39 countries or territories (31 sites in Canada) | A total of 143 centres from 23 countries or territories (5 sites in Canada) |
Patient enrolment dates | Start date: January 8, 2020 Data cut-off date: October 20, 2023 End date: Ongoing | Start date: January 22, 2020 Data cut-off date: October 6, 2023 End date: Ongoing | Start date: February 22, 2022 Data cut-off date: March 1, 2024 End date: Ongoinga |
Randomized (N) | Randomized and treated:b N = 523 | Randomized and treated: N = 525 | Randomized: N = 350 |
Primary or full analysis setc | N = 508 Placebo (including placebo to ustekinumab crossover): N = 76 Guselkumab regimen 1: N = 143 Guselkumab regimen 2: N = 146 Ustekinumab: N = 143 | N = 513 Placebo (including placebo to ustekinumab crossover): N = 72 Guselkumab regimen 1: N = 143 Guselkumab regimen 2: N = 150 Ustekinumab: N = 148 | N = 347 Placebo (including placebo to guselkumab crossover): N = 117 Guselkumab regimen 1: N = 115 Guselkumab regimen 2: N = 115 |
Key inclusion criteria |
| ||
|
| ||
Exclusion criteria |
| ||
Drugs | |||
Intervention | Guselkumab regimen 1 (low dose): Induction: 200 mg IV at week 0, week 4, and week 8 Maintenance: At week 12, 100 mg SC every 8 weeks Guselkumab regimen 2 (high dose): Induction: 200 mg IV at week 0, week 4, and week 8 Maintenance: At week 16, 200 mg SC every 4 weeks | Guselkumab regimen 1 (low dose): Induction: 400 mg SC at week 0, week 4, and week 8 Maintenance: 100 mg SC every 8 weeks Guselkumab regimen 2 (high dose): Induction: 400 mg SC at week 0, week 4, and week 8 Maintenance: 200 mg SC every 4 weeks | |
Comparator(s) | Active comparator (ustekinumab): Induction: Weight-based IV dose approximating 6 mg/kg at week 0 Maintenance: At week 8, 90 mg SC every 8 weeks through week 40 Placebo: Induction: IV at week 0, week 4, and week 8 Maintenance: At week 12 through week 44 —
| Placebo: Induction: SC at week 0, week 4, and week 8 Maintenance: SC administered at the same frequency as the active groups through week 96 A patient in the placebo group who met at least 1 of the rescue criteriad at week 12 and week 16 received rescue treatment in a blinded fashion (guselkumab 400 mg SC at week 16, week 20, and week 24, followed by guselkumab 100 mg SC every 8 weeks). | |
Study duration | |||
Screening phase | 5 weeks | 5 weeks | |
Treatment phase | 48 weeks (includes a 12-week induction period and 36-week maintenance period). Extension treatment phase: Patients who completed the 48-week phase II or phase III trials may have been eligible to enter the LTE phase | Main treatment phase: 24 weeks (includes a 12-week induction period and 12-week maintenance period) Extension maintenance period: 72 weeks | |
Follow-up phase | Approximately 16 weeks after administration of the last study intervention dose | Approximately 12 weeks after administration of the last study intervention dose | |
Outcomes | |||
Primary end pointsd |
|
| |
Secondary and exploratory end points | Secondary end pointsd (guselkumab vs. placebo):
Secondary end pointsc (guselkumab vs. ustekinumab):
Exploratory (guselkumab vs. placebo):
Exploratory (guselkumab vs. ustekinumab):
| Secondary end points:
Other multiplicity-controlled end points:
Exploratory end points:
| |
Safety end points | The incidence of AEs, SAEs, AEs of special interest (malignancy, active tuberculosis, anaphylaxis, infections, MACE, and venous thromboembolism), clinical laboratory testing (hematology and serum chemistry), and C-SSRS | The incidence of AEs, SAEs, AEs of special interest (malignancy, active tuberculosis, anaphylaxis, infections, MACE, and venous thromboembolism), clinical laboratory testing (hematology and serum chemistry), and C-SSRS | |
Publication status | |||
Publications | Janssen Research & Development (2024) GALAXI 2 Week 48 Clinical Study Report CNTO1959CRD3001 ClinicalTrials.gov ID: NCT03466411 | Janssen Research & Development (2024) GALAXI 3 Week 48 Clinical Study Report CNTO1959CRD3001 ClinicalTrials.gov ID: NCT03466411 | Janssen Research & Development (2024) GRAVITI Week 48 Clinical Study Report CNTO1959CRD3004 ClinicalTrials.gov ID: NCT05197049 |
6-MP = 6-mercaptopurine; AE = adverse event; anti-TNF = anti–tumour necrosis factor; AP = abdominal pain; AZA = azathioprine; C-SSRS = Columbia-Suicide Severity Rating Scale; CD = Crohn disease; CDAI = Crohn’s Disease Activity Index; EQ VAS = EQ visual analogue scale; IBDQ = Inflammatory Bowel Disease Questionnaire; IL-12 = interleukin-12; IL-23 = interleukin-23; LTE = long-term extension; MACE = major adverse cardiovascular event; MTX = methotrexate; PRO-2 = patient-reported outcome 2; SAE = serious adverse event; SC = subcutaneous; SES-CD = Simple Endoscopic Score for Crohn’s Disease; SF = stool frequency; vs. = versus; WPAI:CD = Work Productivity and Activity Impairment Questionnaire in Crohn’s Disease.
Notes: Guselkumab IV regimen 1 (low dose) = guselkumab 200 mg IV every 4 weeks, followed by 100 mg SC every 8 weeks. Guselkumab IV regimen 2 (high dose) = 200 mg IV every 4 weeks, followed by 200 mg SC every 4 weeks.
Guselkumab SC regimen 1 (low dose) = guselkumab 400 mg SC every 4 weeks, followed by 100 mg SC every 8 weeks. Guselkumab SC regimen 2 (high dose) = guselkumab 400 SC every 4 weeks, followed by 200 mg SC every 4 weeks.
Patients may not have prior exposure to biologic therapy (i.e., infliximab, adalimumab, certolizumab pegol, vedolizumab, or approved biosimilars for these drugs) or may have been exposed to these biologic therapies and their disease did not demonstrate an inadequate response or intolerance.
aThe GRAVITI study is currently ongoing, and data presented in this report includes data up to March 1, 2024 (the date of the last visit of the last patient in the study through week 48).
bOne patient was randomized but not treated.
cThe primary analysis set in the GALAXI trials included all randomized patients who had received at least 1 (partial or complete) dose of study intervention and satisfied the SES-CD eligibility criteria. The full analysis set in the GRAVITI trial included all randomized patients who had received at least 1 dose of study intervention and excluded the 3 randomized patients.
dRescue criteria included a CDAI score > 220 and < 70-point reduction from the baseline CDAI score at both week 12 and week 16, or a SES-CD score increase by at least 50% from baseline at week 12.
Sources: Clinical Study Report for the GALAXI 2 trial,12 Clinical Study Report for the GALAXI 3 trial,13 Clinical Study Report for the and GRAVITI trial.14 Details included in the table are from the sponsor’s Summary of Clinical Evidence.
The GALAXI studies program consists of 3 separate studies conducted under a single protocol: a phase II dose-ranging study (the GALAXI 1 trial)27 and 2 identical phase III confirmatory studies (the GALAXI 2 and GALAXI 3 trials).12,13 The GALAXI 2 and GALAXI 3 trials are pivotal phase III RCTs evaluating the safety and efficacy of guselkumab (IV induction followed by SC maintenance) compared with placebo and an active control (ustekinumab) in patients with moderately to severely active CD. Additionally, the GRAVITI trial14 is a phase III RCT evaluating the safety and efficacy of guselkumab (SC induction followed by SC maintenance) compared with placebo for patients with moderately to severely active CD. For this review, 3 phase III trials (the GALAXI 2, GALAXI 3, and GRAVITI studies), included in the sponsor's submission, are summarized.
GALAXI 2 and GALAXI 3 Studies
The GALAXI 2 and GALAXI 3 trials are identically designed, phase III, randomized, double-blind, placebo- and active-controlled (versus ustekinumab) parallel-group, multicentre trials. The primary objectives of the GALAXI 2 and GALAXI 3 trials were to evaluate the clinical and endoscopic efficacy, and safety, of guselkumab (IV induction followed by SC maintenance) in patients with moderately to severely active CD whose disease has demonstrated an inadequate response to or an inability to tolerate previous conventional therapy or biologic therapy. Patients were enrolled at 186 centres from 36 countries or territories (including 31 sites in Canada) in the GALAXI 2 trial, and 198 centres across 39 countries or territories (including 31 sites in Canada) in the GALAXI 3 trial.
During the screening period, patients were evaluated for study eligibility in accordance with the study protocol. Following screening, patients were randomized using a permuted block randomization in a 2:2:2:1 ratio to receive 1 of 2 dose regimens of guselkumab (IV induction therapy followed by SC maintenance therapy), ustekinumab, or placebo, respectively. Each active study intervention and its matching placebo were identical in appearance. Allocation to treatment groups was conducted through a central randomization centre using an Interactive Web Response System. Randomization was stratified based on the baseline CDAI score (less than or equal to 300 versus greater than 300), the baseline SES-CD score (less than or equal to 12 versus greater than 12), prior BIO-Failure status (yes versus no), and baseline corticosteroid use (yes versus no). To ensure that the enrolled population was representative of patients with moderately to severely active CD, the diseases of a minimum of 25% and a maximum of 50% of the total enrolled population were required to have demonstrated an inadequate response, or intolerance, to at least 1 conventional CD therapy (CON-Failure).
Both the GALAXI 2 and GALAXI 3 studies employed a treat-through study design, whereby patients were randomized to treatment regimens at week 0 and continued on their assigned regimen through at least week 48 of each trial, unless otherwise specified (Figure 1). The primary and secondary end points of the trials were analyzed using data up to the cut-off date of October 2, 2023, for the GALAXI 2 study and October 16, 2023, for the GALAXI 3 study.
GRAVITI Study
The GRAVITI trial is a phase III, randomized, double-blind, placebo-controlled, parallel-group, multicentre study. The primary objectives of the GRAVITI trial were to evaluate the efficacy and safety of guselkumab (SC induction followed by SC maintenance) in patients with moderately to severely active CD. Patients were enrolled at 143 centres from 23 countries or territories, including 5 sites in Canada. The patients must have shown an inadequate response or intolerance to prior conventional therapy (i.e., oral corticosteroids) or immunomodulators (i.e., azathioprine, 6-mercaptopurine, or methotrexate), or biologic therapy (i.e., TNF antagonists or vedolizumab).
During the screening period, patients were evaluated for study eligibility in accordance with the study protocol. Following screening, patients were randomized using a permuted block randomization in a 1:1:1 ratio to receive 1 of 2 dose regimens of guselkumab (SC induction followed by SC maintenance) or placebo, respectively. Each active study intervention and its matching placebo were identical in appearance. Allocation to treatment groups was conducted through a central randomization centre using an Interactive Web Response System. Randomization was stratified based on the baseline CDAI score (less than or equal to 300 versus greater than 300), the baseline SES-CD score (less than or equal to 12 versus greater than 12), and prior BIO-Failure (yes versus no), defined as having demonstrated an inadequate response, or intolerance, to 1 or more biologic therapies. Patients whose disease had an inadequate response to or an inability to tolerate biologic therapy represented approximately 35% to 65% of the population. The GRAVITI trial employed a treat-through study design, whereby patients were randomized to treatment regimens at week 0 and continued on their assigned regimen through at least week 48, unless otherwise specified (Figure 2). The GRAVITI trial is ongoing, and this report presents 48-week data with a cut-off date of March 1, 2024.
Figure 1: Overview of Study Design of GALAXI 2 and GALAXI 3 Trials
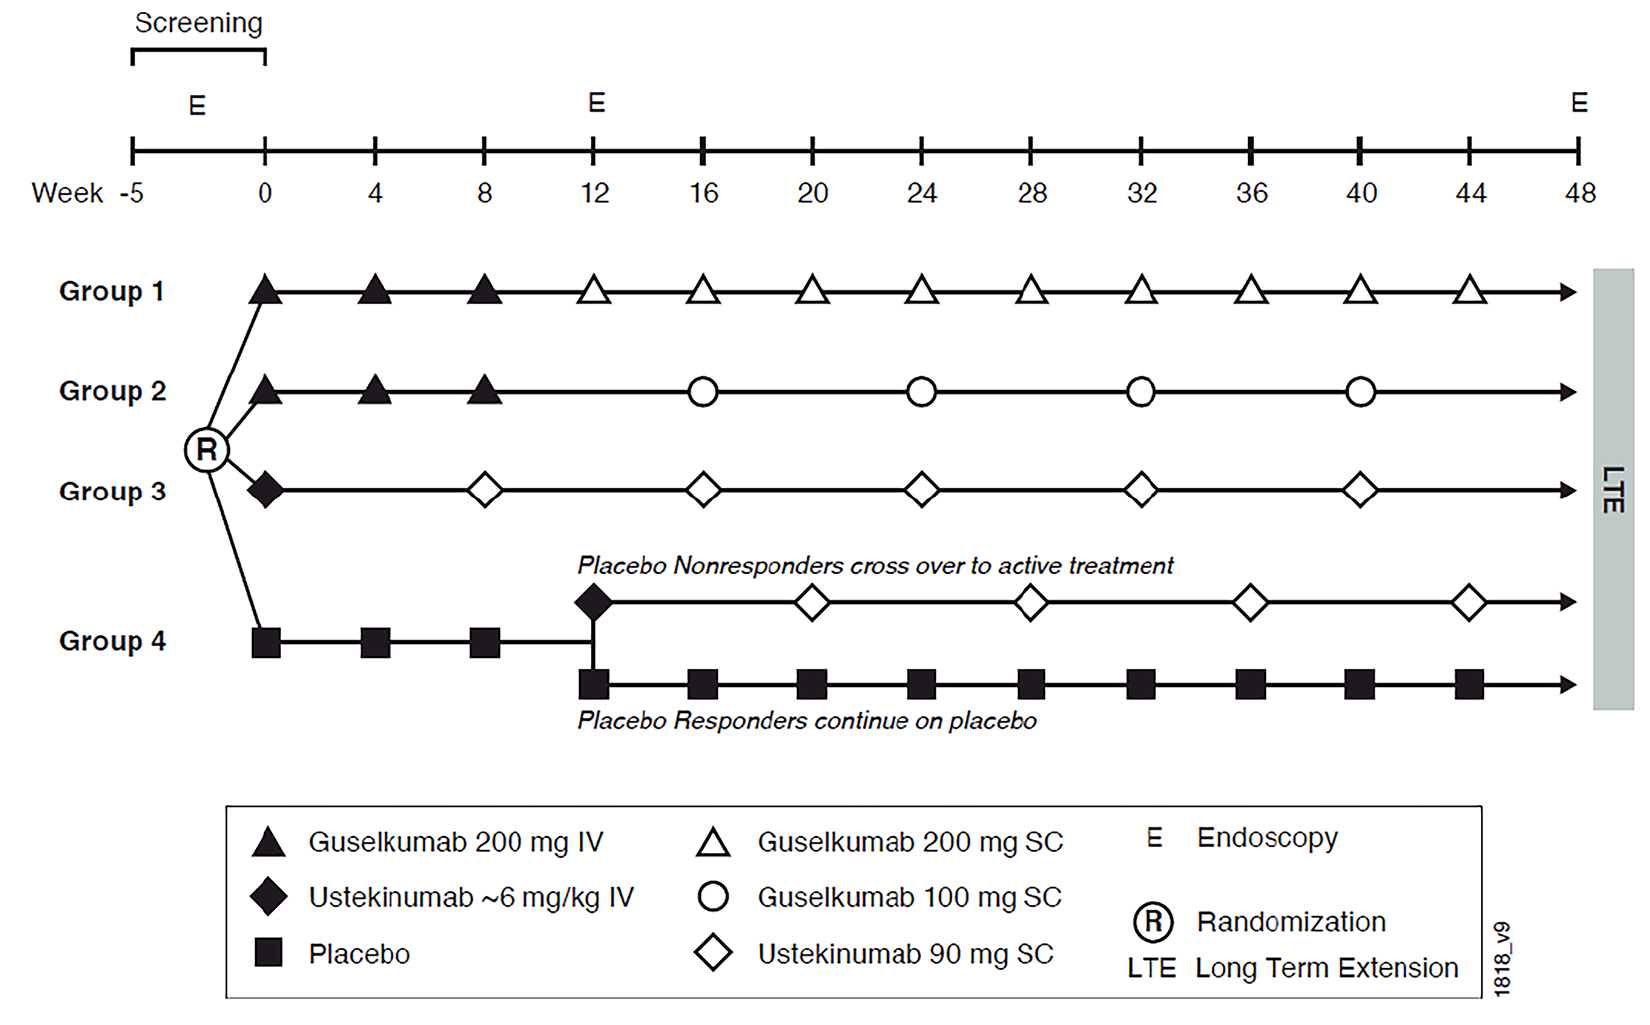
E = endoscopy; LTE = long-term extension; R = randomization; SC = subcutaneous.
Sources: Clinical Study Report for the GALAXI 2 trial12 and Clinical Study Report for the GALAXI 3 trial.13
Figure 2: Overview of Study Design of GRAVITI Trial
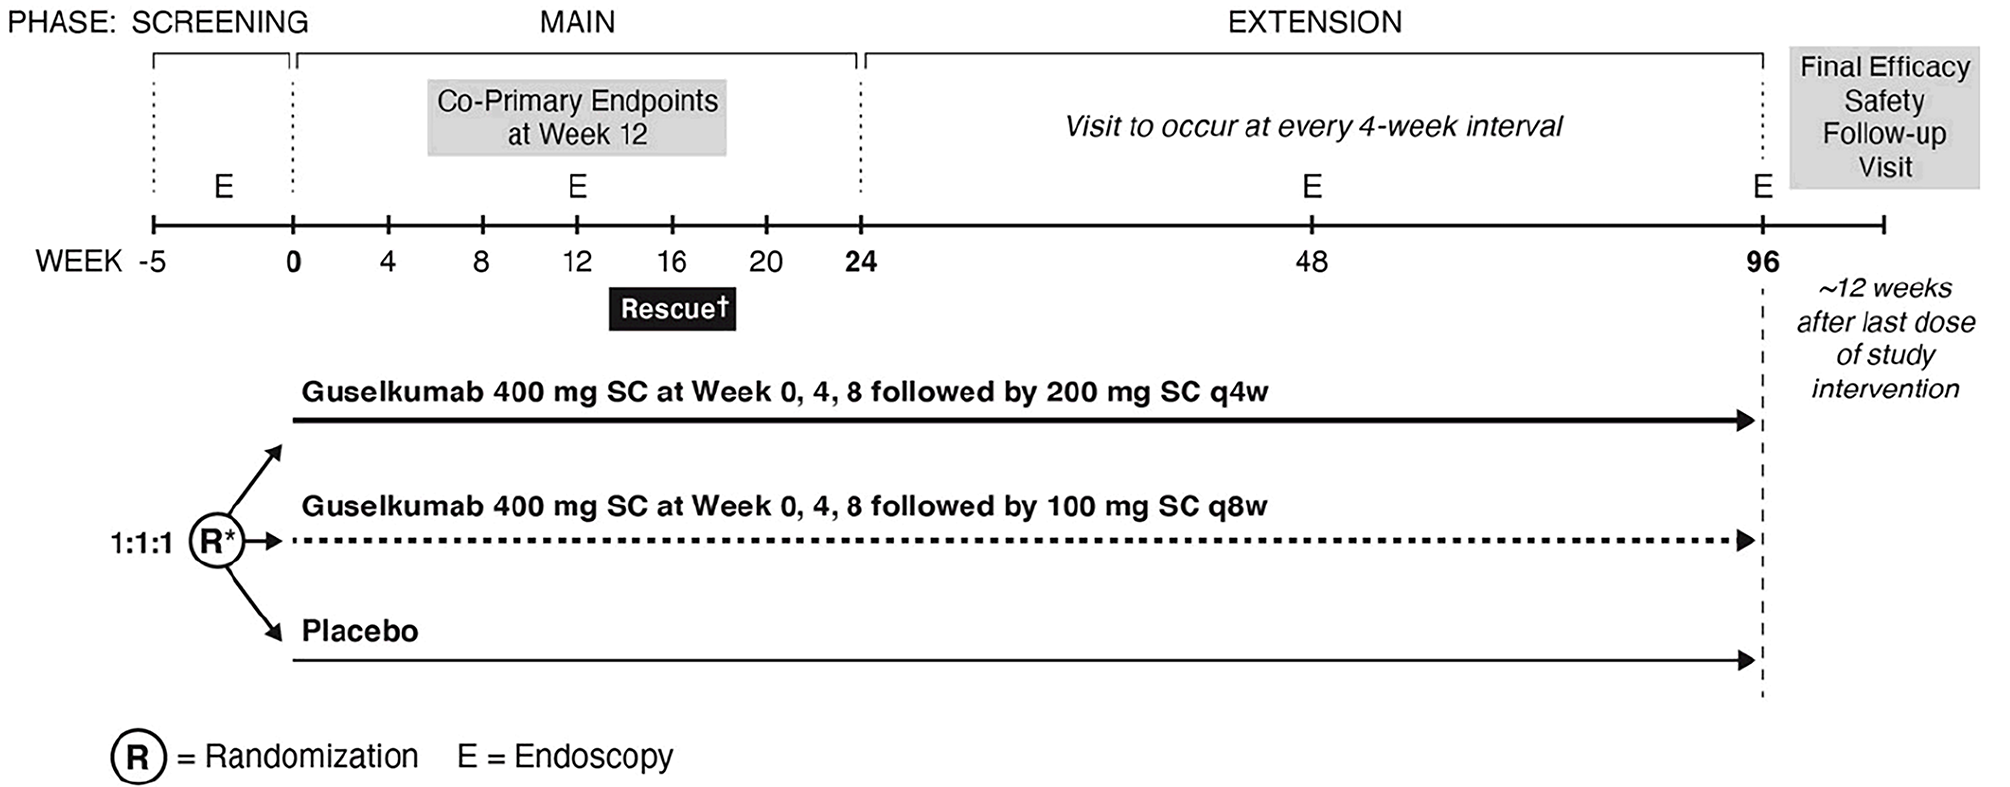
BIO-Failure = biologic therapy failure or intolerance; CDAI = Crohn’s Disease Activity Index; SC = subcutaneous; SES-CD = Simple Endoscopic Score for Crohn’s Disease; q4w = every 4 weeks; q8w = every 8 weeks.
* Stratified by baseline CDAI score, SES-CD score, and prior BIO-Failure status.
† Rescue initiated at week 16 upon meeting rescue criteria.
Source: Clinical Study Report for the GRAVITI trial.14
Populations
Inclusion and Exclusion Criteria
GALAXI 2 and GALAXI 3 Studies
Patients were eligible for enrolment in the GALAXI 2 and GALAXI 3 trials if they were 18 years or older and diagnosed with moderately to severely active CD for at least 3 months, with colitis, ileitis, or ileocolitis previously confirmed by radiography, histology, and/or endoscopy. Patients were required to have clinically active CD (a baseline CDAI score of greater than or equal to 220 but less than or equal to 450, along with either a mean daily stool frequency count greater than 3 or a mean daily abdominal pain score of greater than 1), and endoscopic evidence of ileocolonic CD (a screening endoscopy SES-CD score equal to or greater than 6, or greater than or equal to 4 for patients with isolated ileal disease). Additionally, to be eligible for enrolment in the trials, patients were required to be receiving oral corticosteroids and/or immunomodulators, have a history of corticosteroid dependence, or have a history of not responding to or tolerating at least 1 of the following therapies: oral corticosteroids, immunomodulators, or biologic therapy.
Patients whose disease demonstrated an inadequate response to or an inability to tolerate ustekinumab were excluded from the trials. Patients who had complications of CD (e.g., symptomatic strictures or stenoses, short gut syndrome) or had prior exposure to interleukin-12 (IL-12) and IL-23 drugs or IL-23 drugs were also excluded from the trials. Patients who received the following therapies within the specified period were not eligible for enrolment: IV corticosteroids received within 3 weeks of baseline, ustekinumab received within 16 weeks of baseline, vedolizumab received within 12 weeks of baseline, cyclosporine, tacrolimus, sirolimus, or mycophenolate mofetil received within 8 weeks of baseline, 6-thioguanine received within 4 weeks of baseline, anti-TNF therapy received within 8 weeks of baseline, or other immunomodulatory biologic drugs received within 12 weeks of baseline.
GRAVITI Study
Eligibility criteria for the GRAVITI trial were similar to those of the GALAXI trials, with some differences. To be included in the GRAVITI trial, patients had to have clinically active CD, as defined by a baseline CDAI score of greater than or equal to 220 but less than or equal to 450, along with either a mean daily stool frequency count of greater than or equal to 4 or a mean daily abdominal pain score of greater than or equal to 2. Patients without prior exposure to biologic therapy or with prior exposure to biologic therapy without inadequate response or intolerance were eligible for enrolment in the GRAVITI trial.
Interventions
GALAXI 2 and GALAXI 3 Studies
In the GALAXI 2 and GALAXI 3 trials, the 48-week main treatment phase consisted of a 12-week induction period followed by a 36-week maintenance period. Patients who completed the 48-week treatment phase of the GALAXI 2 and GALAXI 3 trials may have been eligible to enter the LTE phase.
The guselkumab dose regimens in the GALAXI 2 and GALAXI 3 trials were selected based on the efficacy and safety of the induction dose range (i.e., from 200 mg to 1,200 mg IV) and maintenance dose range (i.e., from 100 mg SC every 8 weeks to 200 mg SC every 4 weeks) evaluated in the phase II study (the GALAXI 1 trial).27 Patients were to remain on their assigned treatment regimens throughout the 48-week trial, with the exception of the placebo treatment group, outlined as follows. No other dose adjustments were planned during the GALAXI 2 and GALAXI 3 trials.
In the guselkumab regimen 1 group (low dose), patients received guselkumab 200 mg IV induction every 4 weeks from week 0 through week 8 (i.e., a total of 3 IV doses). At week 12, patients continued treatment with guselkumab 100 mg SC maintenance every 8 weeks through week 44.
In the guselkumab regimen 2 group (high dose), patients received guselkumab 200 mg IV induction every 4 weeks from week 0 through week 8 (i.e., a total of 3 IV doses). At week 16, patients continued treatment with guselkumab 200 mg SC maintenance every 4 weeks through week 40.
In the active control group, patients received a single ustekinumab IV induction dose at week 0 (a weight-based IV dose approximating 6 mg/kg). At week 8, patients received SC maintenance (90 mg of ustekinumab SC every 8 weeks) through week 40. Weight-based dosing for induction was as follows:
ustekinumab 260 mg (for weight less than or equal to 55 kg)
ustekinumab 390 mg (for weight greater than 55 kg and less than or equal to 85 kg)
ustekinumab 520 mg (for weight greater than 85 kg).
In the placebo group, patients received placebo IV every 4 weeks from week 0 through week 8 (i.e., a total of 3 IV doses). At week 12, patients continued treatment based on their clinical response status, which was defined as a reduction from baseline (i.e., week 0) in the CDAI score of 100 points or more or being in clinical remission (a CDAI score of less than 150).
The placebo response group continued placebo treatment from week 12 through week 44.
The placebo nonresponse group received a single ustekinumab IV induction dose at week 12 (with weight-based IV doses approximating 6 mg/kg). At week 20, patients received ustekinumab SC maintenance (90 mg SC every 8 weeks) through week 44.
Matching placebo (IV and SC), which was identical in appearance to the active study intervention, was administered to maintain the blind throughout the duration of the study. To maintain patient blinding, all patients regardless of treatment group were assessed for clinical response status at week 12. Once all randomized patients in the GALAXI trials had either completed the week 48 visit or terminated study participation before week 48, the treatment assignment information was unblinded for all patients in that study and made available for analysis.
GRAVITI Study
The 24-week main treatment phase includes a 12-week induction period followed by a 12-week maintenance period; this is then followed by the extension treatment phase, which comprises a 72-week maintenance period.
Patients were to remain on their assigned treatment regimens throughout the study, with the exception of the placebo treatment group, outlined as follows.
In the guselkumab regimen 1 group (low dose), patients received guselkumab at a dose of 400 mg SC at week 0, week 4, and week 8, followed by guselkumab at a dose of 100 mg SC every 8 weeks starting at week 12.
In the guselkumab regimen 2 group (high dose), patients received guselkumab at a dose of 400 mg SC at week 0, week 4, and week 8, followed by guselkumab at a dose of 200 mg SC every 4 weeks starting at week 16.
In the placebo group, patients received placebo SC every 4 weeks from week 0. All patients in the placebo group who met at least 1 of the rescue criteria at week 12 and week 16 received rescue treatment in a blinded fashion (i.e., guselkumab at a dose of 400 mg SC at week 16, week 20, and week 24, followed by guselkumab at a dose of 100 mg SC every 8 weeks). The rescue criteria were as follows: having a CDAI score of greater than 220 and less than a 70-point reduction from the baseline CDAI score at both week 12 and week 16, or having the SES-CD score increase by at least 50% from baseline at week 12. To maintain the blind, patients randomized to guselkumab who met at least 1 of the rescue criteria continued their assigned treatment regimen and received a blinded “sham” rescue with a matching placebo SC injection at week 16, week 20, and week 24.
Posttreatment Phase
No medications were required during the posttreatment phase to prevent or mitigate the risk of AEs related to guselkumab administration. Patients should consult a health care provider if signs or symptoms of clinically significant chronic or acute infection occur. There is no defined recovery time for guselkumab.
GALAXI 2, GALAXI 3, and GRAVITI Studies
Concomitant Medications
Patients who were receiving oral 5-ASA compounds, oral corticosteroids, conventional immunomodulators (i.e., azathioprine, 6-mercaptopurine, or methotrexate), antibiotics, and/or enteral nutrition for the treatment of CD at baseline should have maintained a stable dose through week 48, with the exception of oral corticosteroids. These therapies should not be initiated during the studies. Therapies could only be discontinued or reduced in dose after week 0 if investigator judgment required it because of toxicity or another medical necessity; even if the toxicity resolved, the therapy should not be restarted.
Corticosteroids had to be maintained at baseline doses through week 12, and all patients had to begin tapering corticosteroids at week 12, unless medically infeasible, as per the following schedule.
Oral corticosteroid (other than budesonide):
Prednisone at a dose of greater than 15 mg per day or equivalent; taper the daily dose by 5 mg per week until receiving 10 mg per day, then continue tapering at 2.5 mg per week until 0 mg per day.
Prednisone at a dose of 11 mg to 15 mg per day (or equivalent); taper the daily dose to 10 mg per day for 1 week, then continue at 2.5 mg per week until 0 mg per day.
Prednisone at a dose of less than or equal to 10 mg per day (or equivalent); taper the daily dose by 2.5 mg per week until 0 mg per day.
Oral budesonide: Taper the daily dose by 3 mg every 3 weeks until 0 mg per day.
From week 12 to week 48, patients were allowed to transiently use (i.e., for less than 4 weeks) increased doses of corticosteroids for reasons other than treatment for CD (e.g., stress doses of corticosteroids for surgery, asthma, adrenocortical insufficiency).
Prohibited Medications
Concomitant use of immunomodulatory drugs other than azathioprine, 6-mercaptopurine, or methotrexate, immunomodulatory biologic drugs (including, but not limited to, TNF antagonists, IL-23 antagonists, natalizumab, ustekinumab, rituximab, and vedolizumab), experimental CD medications, and thalidomide or related drugs were prohibited.
Dose Modification
No treatment or dose adjustment was permitted through week 48 in the GALAXI 2 and GALAXI 3 trials.
Discontinuation of Study Intervention
Discontinuation of a patient’s study intervention must be strongly considered under the following conditions:
persistent inadequate response or worsening of CD:
the patient had a change from baseline in the CDAI score of less than 70 points and has a CDAI score greater than 220 at both week 20 and week 24, or
the patient experienced AEs consistent with clinically significant worsening of CD at any time during the study.
The patient developed a serious infection, including but not limited to sepsis or pneumonia.
The patient reported suicidal behaviour.
The patient developed a severe injection-site or infusion reaction.
Outcomes
A list of efficacy end points assessed in this Clinical Review Report is provided in Table 9, followed by descriptions of the outcome measures. Summarized end points are based on outcomes included in the sponsor’s Summary of Clinical Evidence as well as any outcomes identified as important to this review according to the clinical experts consulted for this review and input from patient and clinician groups and public drug plans. Using the same considerations, CDA-AMC selected end points that were considered to be most relevant to inform expert committee deliberations and finalized this list of end points in consultation with members of the expert committee. The most important efficacy end points were assessed using GRADE; others are included in the report as supportive information. Select safety outcomes considered important for informing expert committee deliberations were also assessed using GRADE. A description of the efficacy outcome measures and their measurement properties that were used in both the induction and maintenance phases are presented in Table 10.
Table 9: Outcomes Summarized From GALAXI 2, GALAXI 3, and GRAVITI Studies
Outcome measure | Time point | GALAXI trials (IV induction and SC maintenance) Guselkumab vs. placebo | GALAXI trials (IV induction and SC maintenance) Guselkumab vs. ustekinumab | GRAVITI trial (SC induction and SC maintenance) Guselkumab vs. placebo |
|---|---|---|---|---|
Clinical response at week 12 and endoscopic remission at week 48a,b,c | Composite | Secondaryd | NA | NA |
Clinical response at week 12 and 90-day, corticosteroid-free clinical remission at week 48a,b,c | Composite | Secondaryd | NA | NA |
Clinical response at week 12 and clinical remission at week 48a,b,c | Composite | Coprimaryd | NA | NA |
Clinical response at week 12 and endoscopic response at week 48a,b,c | Composite | Coprimaryd | NA | NA |
Clinical remission at week 48 and endoscopic response at week 48b,c | Composite | NA | Secondary | Exploratory |
Clinical responsea,b,c | Week 12 | NA | NA | Secondaryd |
Clinical remissiona,b,c | Week 12 and week 48 | Week 12 Secondaryd | Week 48 Secondary | Week 12 Coprimaryd Week 48 Secondaryd |
Endoscopic responsea,b,c | Weeks 12 and 48 | Week 12 Secondaryd | Week 48 Secondary | Weeks 12 Coprimaryd Week 48 Other multiplicity-controlled end pointd |
Endoscopic remissiona,b,c | Week 48 | Week 12 Secondaryd | Week 48 Secondary | Week 48 Other multiplicity-controlled end pointd |
Deep remission (i.e., clinical remission and endoscopic remission)a,b,c | Week 48 | NA | Secondary | Exploratory |
IBDQ remissionb,c | Week 12 and week 48 | Week 12 Exploratory | Week 48 Exploratory | Week 48 Exploratory |
PRO-2 remissionb,c | Week 12 and week 48 | NA | NA | Week 48 Secondaryd |
Serious adverse eventa,b,c,d | Week 12 and week 48 | Exploratory | Exploratory | Exploratory |
IBDQ = Inflammatory Bowel Disease Questionnaire; NA = not applicable; PRO-2 = patient-reported outcome 2; SC = subcutaneous; vs. = versus.
aAn outcome that is commonly used in clinical practice to assess patients.
bAn outcome that is considered important according to patient group input.
cAn outcome that is considered important according to clinical expert input.
dStatistical testing for these end points was adjusted for multiple comparisons.
Sources: Clinical Study Report for the GALAXI 2 trial,12 Clinical Study Report for the GALAXI 3 trial,13 Clinical Study Report for the and GRAVITI trial.14 Details included in the table are from the sponsor’s Summary of Clinical Evidence.
GALAXI 2 and GALAXI 3 Studies
Coprimary End Points
The GALAXI trials defined 2 composite outcomes as coprimary end points. These were tested within each of the GALAXI 2 trial and the GALAXI 3 trial separately. They were:
the proportion of patients with clinical response at week 12 and clinical remission at week 48
the proportion of patients with clinical response at week 12 and endoscopic response at week 48.
Clinical response was defined as either a reduction of 100 or more points from the baseline in the CDAI score or a CDAI score of less than 150.
Endoscopic response was defined as a 50% or greater improvement from baseline in the SES-CD score or an SES-CD score of 2 or less.
Clinical remission was defined as a CDAI score of less than 150.
Crohn’s Disease Activity Index
The CDAI is a validated, multi-item measure of severity of illness derived as a weighted sum of 8 different CD-related components,28 including extraintestinal manifestations, abdominal mass, weight, hematocrit, the use of antidiarrheal drugs and/or opiate, the total number of liquid or very soft stools, abdominal pain or cramps, and general well-being. The average daily stool frequency, average daily abdominal pain score, and well-being were calculated from the patient diary. The items are scored individually and weighted, and do not contribute equally to the overall score. The CDAI score is derived from summing the weighted individual scores of 8 items and ranges from 0 to 600. A higher score indicates more severe disease. No information regarding minimal important difference (MID) of CDAI in patients with CD was identified.
Simple Endoscopic Score for Crohn’s Disease
The SES-CD is a scoring system that assesses 4 endoscopic items, including the size of ulcers, ulcerated surface, affected surface, and the presence of narrowing.28 Each item is to be scored from 0 to 3, with a total score ranging from 0 to 56. Higher scores indicate more severe disease, although no information regarding the MID was identified. SES-CD was demonstrated to have construct validity28 and high interrater reliability.29
Secondary End Points
Secondary end points included 3 sets of comparisons: short-term comparisons between guselkumab and placebo, long-term comparisons between guselkumab and placebo, and long-term comparisons between guselkumab and ustekinumab.
The first set of secondary end points (set 1) included the short-term comparisons between the combined guselkumab induction dose and placebo. The set 1 of secondary end points included the following outcomes that were relevant to this report:
the proportion of patients with endoscopic response at week 12
the proportion of patients with endoscopic remission at week 12
the proportion of patients with clinical remission at week 12
the proportion of patients with clinical response at week 12.
The second set of secondary end points (set 2) evaluated the long-term efficacy of each individual guselkumab treatment group (i.e., regimen 1 and regimen 2) versus placebo and included the following:
the proportion of patients with clinical response at week 12 and 90-day, corticosteroid-free clinical remission at week 48
the proportion of patients with clinical response at week 12 and endoscopic remission at week 48.
The end point 90-day, corticosteroid-free clinical remission was defined as not receiving corticosteroids for a duration of 90 days.
Endoscopic remission was defined as at least a 2-point reduction in the SES-CD score versus baseline, with no individual subcomponent score greater than 1.
The last set of secondary end points (set 3) evaluated the long-term efficacy of each individual guselkumab treatment group (i.e., regimen 1 and regimen 2) versus ustekinumab and included the following:
the proportion of patients with clinical remission at week 48
the proportion of patients with endoscopic response at week 48
the proportion of patients with clinical remission at week 48 and endoscopic response at week 48
the proportion of patients with endoscopic remission at week 48
the proportion of patients with deep remission at week 48.
Deep remission was defined as both clinical remission and endoscopic remission.
In addition to the coprimary and secondary end points, exploratory end points related to disease status, inflammatory biomarkers, HRQoL outcomes, and health economics were also analyzed.
GRAVITI Study
Coprimary End Points
The coprimary end points for the GRAVITI trial included:
the proportion of patients with clinical remission at week 12
the proportion of patients with endoscopic response at week 12.
Secondary End Points
In the GRAVITI trial, there were 3 secondary end points and 2 multiplicity-controlled end points, including:
the proportion of patients with clinical remission at week 24, which evaluated the efficacy of each individual guselkumab treatment group (i.e., regimen 1 and regimen 2) versus placebo
the proportion of patients with PRO-2 remission, which evaluated the combined guselkumab group (400 mg SC) versus placebo
the proportion of patients with clinical response at week 12, which evaluated the combined guselkumab group (400 mg SC) versus placebo.
Other multiplicity-controlled end points for the GRAVITI trial included the following:
the proportion of patients with endoscopic response at week 48
the proportion of patients with clinical remission at week 48.
Clinical remission was defined as a CDAI score of less than 150.
Clinical response was defined as either a reduction of 100 or more points from the baseline in the CDAI score or a CDAI score of less than 150.
In addition to the primary, secondary, and multiplicity-controlled week 48 end points, exploratory end points related to disease status, inflammatory biomarkers, HRQoL outcomes, and health economics were also analyzed.
GALAXI and GRAVITI Trials
Patient-Reported Outcomes
In the GALAXI and GRAVITI trials, PROs included PRO-2 remission and IBDQ remission.
PRO-2 remission was defined as a mean abdominal pain daily score of less than or equal to 1, and a mean stool frequency daily score of less than or equal to 3, and no worsening of abdominal pain or stool frequency from baseline.
IBDQ remission was defined as an IBDQ score of 170 or greater.
32-Item Inflammatory Bowel Disease Questionnaire
The 32-item Inflammatory Bowel Disease Questionnaire tool is a disease-specific, patient-reported, multidimensional HRQoL questionnaire that has been validated for CD. It comprises 32 Likert-scaled items that cover 4 domains: bowel symptoms, systemic symptoms, emotional function, and social function. Each question is scored on a 7-point scale where 1 corresponds to the poorest and 7 to the optimum function. The total score ranges from 32 points to 224 points, with higher scores indicating a better HRQoL. Each individual IBDQ dimension was calculated when 1 or fewer items were missing in the dimension. One study proposed that a clinically meaningful improvement is an increase of greater than or equal to 16 points in the total score or 0.5 points or more per question in patients with CD.30,31
Harms
The harms outcomes assessed were AEs, SAEs, deaths, withdrawal due to AEs, and AEs of special interest, including malignancy, active tuberculosis, anaphylaxis, infections and opportunistic infections, major adverse cardiovascular events (cardiovascular death, nonfatal myocardial infarction, or nonfatal stroke), hepatic disorders, and venous thromboembolism.
Table 10: Summary of Outcome Measures and Their Measurement Properties
Outcome measure | Type | Conclusion about measurement properties | MID |
|---|---|---|---|
IBDQ-32 | The IBDQ is a physician-administered questionnaire used to assess HRQoL in patients with IBD.31-33 It is a 32-item Likert-based questionnaire, divided into 4 dimensions (i.e., bowel symptoms [10 items], systemic symptoms [5 items], emotional function [12 items], and social function [5 items]). Patients are asked to recall symptoms and quality of life from the last 2 weeks, with responses graded on a 7-point Likert scale (1 being the worst situation and 7 being the best), with the total IBDQ score ranging between 32 and 224 (i.e., higher scores represent better quality of life). Scores of patients in remission typically range from 170 to 190. | This questionnaire has been validated in a variety of settings, countries, and languages.33,34 Discriminant validity: A review33 of 9 validation studies on the IBDQ in patients with IBD reported that the IBDQ was able to differentiate between patients with disease remission and patients with disease relapse. Responsiveness: Six studies evaluated the IBDQ for sensitivity to change and all found that changes in HRQoL correlated to changes in clinical activity in patients with CD.33 | A study conducted by Gregor et al.30 noted that a clinically meaningful improvement in quality of life would be an increase of at least 16 points in the IBDQ total score or 0.5 point or more per question in patients with CD. |
CDAI | CDAI is a disease-specific index used to assess severity of CD.35,36 The CDAI consists of 8 items, each of which is independently weighted, including stool frequency (weight = 2), abdominal pain (weight = 5), general well-being (weight = 7), the sum of 6 findings (weight = 20), antidiarrheal use (weight = 30), hematocrit (weight = 6), and body weight (weight = 1). The overall CDAI score is based on the sum of the weighted value of each item and ranges from 0 to 600, where a score of 150 is defined as the threshold between remission and active disease. Scores ranging between 150 and 219 indicate mild to moderate CD and scores ranging between 220 and 450 indicate moderate to severe CD, whereas scores greater than 450 indicate very severe CD.35,36 Item scores are derived using patient diaries, which are based on the 7 days preceding each visit. | Construct validity: The items included in the CDAI were selected by gastroenterologists and are based on accepted features of CD.35 Criterion validity: The CDAI does not demonstrate any significant correlation between the overall score and objective measurements such as mucosal healing. However, the lack of correlation may not be indicative of a lack of criterion validity due to the multifaceted nature of CD.35 Predictability is another component of criterion validity. One study showed that CDAI scores increased 2 months preceding exacerbations of CD and decreased 1 month following exacerbations of CD, thereby demonstrating criterion validity.35 Test-retest reliability: The index provided good to very good test-retest reliability evaluated based on 2 successive visits for 32 patients.35,37 The CDAI was subsequently re-evaluated and rederived using data collected from 1,058 patients and demonstrated little difference compared to the original formulation; therefore, the original version was recommended.38 | No information regarding MID of CDAI in patients with CD was identified. More recently, the FDA and EMA have suggested that a change of 100 points in CDAI is considered to be a more meaningful response (i.e., enhanced clinical response).36 |
SES-CD | The SES-CD was designed for the assessment of 4 endoscopic items, including the size of ulcers, ulcerated surface, affected surface, and the presence of narrowing.28 Each item is to be scored 0 to 3 with a total score ranging from 0 to 56. Higher scores indicate more severe disease. | Construct validity: Daperno et al. (2004)28 validated SES-CD against CDEIS in 70 patients with CD and found a strong correlation between the 2 instruments (multiple correlation coefficient = 0.920; 95% CI, 0.8740 to 0.9497). After construction of SES-CD, Daperno et al. (2004)28 validated SES-CD against CDEIS in a sample of 121 patients with CD. The Pearson and Spearman rank correlation coefficients between SES-CD and CDEIS were 0.887 (95% CI, 0.8418 to 0.9199) and 0.910 (95% CI, 0.8734 to 0.9364; P < 0.001), respectively. In a review, estimates of correlation between SES-CD and the CDAI ranged from 0.15 to 0.92.28 Intrarater and interrater reliability: Khanna et al. (2016)29 found in 50 patients with CD that the ICC for intrarater agreement for SES-CD was 0.91 (95% CI, 0.89 to 0.95). The corresponding ICC for interrater agreement was 0.83 (95% CI, 0.75 to 0.88). | No information regarding the MID of SES-CD in patients with CD was identified. |
CD = Crohn disease; CDAI = Crohn’s Disease Activity Index; CDEIS = Crohn’s Disease Endoscopic Index of Severity; CI = confidence interval; EMA = European Medicines Agency; HRQoL = health-related quality of life; IBD = inflammatory bowel disease; IBDQ = Inflammatory Bowel Disease Questionnaire; IBDQ-32 = 32-item Inflammatory Bowel Disease Questionnaire; ICC = intraclass correlation coefficient; MID = minimal important difference; SES-CD = Simple Endoscopic Score for Crohn’s Disease.
Statistical Analysis
Sample Size and Power Calculation
GALAXI 2 and GALAXI 3 Studies
The sample size for the GALAXI 2 and GALAXI 3 trials was determined to achieve at least 90% power to detect a treatment difference in the coprimary end points, using a chi-square test with a 2-sided significance level of 0.05.
For the coprimary end point of clinical response at week 12 and clinical remission at week 48, in each of the phase III trials, assuming a placebo rate of 8% to 10% and a 40% to 45% difference between guselkumab and placebo based on the phase II trial (the GALAXI 1 study), 140 patients in each guselkumab dose group and 70 patients in the placebo group were to provide greater than 99% power for this end point at the 2-sided significance level of 0.05. For the coprimary end point of clinical response at week 12 and endoscopic response at week 48, in each of the phase III trials, assuming a placebo rate of approximately 2% to 5% and a 30% to 35% difference between guselkumab and placebo based on the phase II trial (the GALAXI 1 study),27 140 patients in each guselkumab dose group and 70 patients in the placebo group were to provide greater than 99% power for this end point at the 2-sided significance level of 0.05.
GRAVITI Study
The sample size for this trial was determined to achieve at least 90% power to detect a treatment difference in the clinical remission and endoscopic response at week 12 between the combined guselkumab group (400 mg SC followed by 200 mg SC and 400 mg SC followed by 100 mg SC combined) and the placebo group, using a 2-sided chi-square test with a 2-sided significance level of 0.05. Assuming 15% clinical remission for the placebo group and 50% for the guselkumab group as well as a 13% endoscopic response for the placebo group and 30% for the guselkumab group, enrolling 212 patients in the combined guselkumab group and 106 patients in the placebo group was sufficient to achieve the prespecified statistical power.
Statistical Testing and Multiple Testing Procedures
The statistical analysis of efficacy outcomes in the induction and maintenance studies are summarized in sensitivity analyses for the coprimary end points and were conducted to assess the robustness of the findings under different data imputation methods. First, a tipping point analysis using Bernoulli draws was performed to impute missing clinical response status at week 12, clinical remission status at week 48, and endoscopic response status at week 48 in both the GALAXI 2 and GALAXI 3 trials, as well as clinical remission and endoscopic response at week 12 in the GRAVITI trial. These analyses were conducted after applying the ICE rules and were limited to cases where the proportion of missing data 5% or more.in any treatment group. Subsequently, the multiple imputation method was employed to impute missing CDAI and SES-CD scores, assuming the data were missing at random, also following application of the ICE rules.
Supportive Analyses
As a supportive analysis to the coprimary end points analysis, each coprimary end point was analyzed using the all-treated analysis set, defined as all randomized patients who received at least 1 (partial or complete) dose of study intervention, regardless of meeting the SES-CD eligibility criteria.
Statistical Model
GALAXI 2, GALAXI 3, and GRAVITI Studies
The proportion of patients meeting each of the coprimary end points was summarized by treatment group, along with the associated 95% CIs. The adjusted treatment difference (95% CI) between guselkumab and placebo was also presented. A common risk difference test employing Mantel-Haenszel stratum weights was used to compare each guselkumab treatment group (i.e., regimen 1 and regimen 2) to the placebo treatment group, adjusting for the stratification factors. In the GALAXI 2 and GALAXI 3 trials, the stratification variables included the baseline CDAI score (less than or equal to 300 versus greater than 300), the baseline SES-CD score (less than or equal to 12 versus greater than 12), prior BIO-Failure status (yes or no), and baseline corticosteroid use (yes or no). In the GRAVITI trial, the stratification variables included the baseline CDAI score (less than or equal to 300 versus greater than 300), the baseline SES-CD score (less than or equal to 12 versus greater than 12), and prior BIO-Failure status (yes or no). Each primary end point was assigned a 2-sided alpha of 0.05. In the GRAVITI trial, the stratification variables included the baseline CDAI score (less than or equal to 300 versus greater than 300), the baseline SES-CD score (less than or equal to 12 versus greater than 12), and prior BIO-Failure status (yes or no). The secondary end points of the trials were analyzed using the same methods as the coprimary end points.
At each time point, the CDAI score was calculated only if at least 4 of the 8 components were available. When at least 4 components were available, any missing values were imputed by carrying forward the last nonmissing value for that component. The total SES-CD score for each visit was calculated based on all endoscopic components of segments scored during that visit. If the total SES-CD score could not be calculated at a visit (i.e., none of the segments were scored), the score was considered missing. If the CDAI or SES-CD scores could not be calculated at a visit, they were considered missing for that visit. Patients with missing CDAI or SES-CD scores at a visit were considered as not achieving the end point associated with that visit, as measured by the CDAI or SES-CD score (i.e., NRI).
ICEs were taken into account when defining the estimands in the trials. An estimand refers to a precise definition of the primary targeted treatment effect defined by the following 5 attributes: the study intervention, the target population, the end point, ICEs and strategies for handling them, and the population-level summary. The following ICEs and corresponding strategies were considered for this study:
patients who underwent ICEs, including
a CD-related surgery (ICE category 1)
a prohibited change in CD medication, including by patients in the placebo group who crossed over to ustekinumab at week 12 (ICE category 2)
the discontinuation of the study intervention due to a lack of efficacy, or an AE of the worsening of CD (ICE category 3)
the discontinuation of the study intervention due to COVID-19–related reasons (excluding COVID-19 infection) or a regional crisis (ICE category 4)
the discontinuation of the study intervention for reasons other than those specified in ICE category 3 and ICE category 4 (ICE category 5).
ICEs in category 1 to category 3 and in category 5 were considered indicative of not achieving the end point and were handled using a composite strategy. For patients who discontinued the study intervention due to COVID-19–related reasons (excluding COVID-19 infection) or a regional crisis, their observed values were included, using a treatment policy strategy, if available. Patients with missing data for all other reasons were classified as the nonresponse group. A population-level summary was defined as the difference in proportions of those with a response between each guselkumab dose group (regimen 1 and regimen 2) and the placebo group.
The secondary end points of the trials, evaluating guselkumab versus placebo or the active comparator (ustekinumab), were analyzed using the same methods as those of the coprimary end points. The same ICEs and corresponding strategies were specified for the secondary end points. In the GALAXI 2 and GALAXI 3 trials, the analysis of the end points included in the first set of secondary end points (set 1, as described earlier) was based on within-study comparisons of the combined guselkumab induction dose group versus the placebo group in each GALAXI trial. The analysis of the end points included in set 2 involved comparisons within each trial of each guselkumab regimen (regimen 1 and regimen 2) versus the placebo group. The end points in set 3 were analyzed based on within-study comparisons of each guselkumab regimen (regimen 1 and regimen 2) versus the ustekinumab group. Additionally, the end points in set 3 were also analyzed using pooled data from the GALAXI 2 and GALAXI 3 trials.
In the GRAVITI trial, the end points at week 12 were based on comparisons of the combined guselkumab induction dose group (which received guselkumab 400 mg SC at week 0, week 4, and week 8) with the placebo group (because the induction dose is the same for each group). The end points assessed after week 12 were based on comparisons between each guselkumab group (regimen 1 and regimen 2) and the placebo group.
Multiplicity Considerations
GALAXI 2 and GALAXI 3 Studies
Within each trial, the type I error rate across the coprimary end points and secondary end points was controlled at a 2-sided significance level of 0.05 using a fixed-sequence testing procedure. The testing procedure began with sequential tests (within each phase III trial) to assess the superiority of each guselkumab dose group compared with placebo for the coprimary end points at the 2-sided significance level of 0.05 for each trial. If all P values were significant (i.e., P value < 0.05), after testing of the coprimary end points, the testing procedure continued with superiority tests for the secondary end points. However, if any of the tests of the coprimary end points within a trial were not significant (i.e., P value ≥ 0.05), all subsequent P values in the testing hierarchy were considered nominal. The secondary end points in both GALAXI trials were grouped into 5 tiers (graphical testing procedures are presented in Appendix 1). For the coprimary and secondary end points in tier 1, tier 4, and tier 5, the study hypotheses were tested separately within each of the GALAXI 2 and GALAXI 3 trials. For the secondary end points in tier 2 and tier 3, the hypotheses were tested for data pooled across both trials. Within each tier, the Hochberg procedure was used to test all end points in that tier with a 2-sided significance level of 0.05. If a test within a tier was not significant but other tests in the same tier met the Hochberg thresholds, other tests were declared significant. However, formal testing ceased and the P values for all end points in subsequent tiers were considered nominal.
IBDQ remission was an exploratory end point and was tested irrespective of the significance of the coprimary and secondary end points. Testing for IBDQ remission was not controlled for multiplicity and nominal P values were presented.
GRAVITI Study
The type I error rate for the comparison between guselkumab and placebo was controlled at a 2-sided significance level of 0.05 over the coprimary, secondary, and 2 week 48 exploratory end points. The testing procedure began with a fixed-sequence testing procedure for the coprimary and secondary end points. If any test of the coprimary and secondary end points in the sequence did not achieve significance at the 2-sided significance level of 0.05, the P values for all subsequent end points were considered nominal. In September 2023, there was a protocol amendment to add 2 multiplicity-controlled exploratory end points at week 48 to the testing hierarchy procedures. These were tested if all prior tests were statistically significant. For the week 48 multiplicity-controlled end points, the Hochberg procedure with a 2-sided significance level of 0.05 was used for all 4 tests and significance was achieved if a test met the Hochberg thresholds.
Subgroup Analyses
The prespecified subgroups of interest across the 3 trials — BIO-Failure and CON-Failure status and BIO-naive status (i.e., no prior exposure to biologic therapies such as TNF antagonists, vedolizumab, or ustekinumab) — were used to evaluate treatment effects for the coprimary and major secondary end points. The common risk difference test employing Mantel-Haenszel stratum weights was used to compare each guselkumab dose group to placebo while adjusting for the stratification factors. Results were shown as the point estimate and 95% CI for treatment differences between the guselkumab group and comparator group, without formal statistical testing. Subgroup analyses in the GALAXI 2 and GALAXI 3 studies were based on the primary analysis set (PAS), while those in the GRAVITI trial were based on the full analysis set.
Sensitivity Analyses
The sensitivity analyses performed for the primary and secondary outcomes are summarized in Table 11.
Sensitivity analyses for the coprimary end points were conducted to assess the robustness of the findings under different data imputation methods. First, a tipping point analysis using Bernoulli draws was performed to impute missing clinical response status at week 12, clinical remission status at week 48, and endoscopic response status at week 48 in both GALAXI trials, as well as clinical remission and endoscopic response at week 12 in the GRAVITI trial. These analyses were conducted after applying the ICE rules and were limited to cases where the proportion of missing data was 5% or more in any treatment group. Subsequently, the multiple imputation method was employed to impute missing CDAI and SES-CD scores, assuming the data were missing at random, also following application of the ICE rules.
Supportive Analyses
As a supportive analysis to the coprimary end points analysis, each coprimary end point was analyzed using the all-treated analysis set, defined as all randomized patients who received at least 1 (partial or complete) dose of study intervention, regardless of meeting the SES-CD eligibility criteria.
Table 11: Statistical Analysis of Efficacy End Points
End point | Statistical model | Adjustment factor | Handling of missing data | Sensitivity analysis |
|---|---|---|---|---|
GALAXI 2 and GALAXI 3 studies: IV induction and SC maintenance | ||||
Coprimary end points: Clinical response at week 12 and clinical remission at week 48 Clinical response at week 12 and endoscopic response at week 48 | Common risk difference using Mantel-Haenszel stratum weights and Sato variance estimator | Stratification factors: Baseline CDAI (≤ 300 or > 300), baseline SES-CD score (≤ 12 or > 12), BIO-Failure status (yes or no), and baseline corticosteroid use (yes or no) | Imputed as nonresponse group | Sensitivity analyses:
Supportive analyses:
|
Clinical response at week 12 and 90-day, corticosteroid-free clinical remission at week 48 | Same as coprimary end points | Same as coprimary end points | Same as coprimary end points | None |
Clinical response at week 12 and endoscopic remission at week 48 | Same as coprimary end points | Same as coprimary end points | Same as coprimary end points | None |
Clinical remission at week 48 and endoscopic response at week 48 | Same as coprimary end points | Same as coprimary end points | Same as coprimary end points | None |
Clinical response at week 12 | Same as coprimary end points | Same as coprimary end points | Same as coprimary end points | None |
Clinical remission at week 12 and week 48 | Same as coprimary end points | Same as coprimary end points | Same as coprimary end points | None |
Endoscopic response at week 12 and week 48 | Same as coprimary end points | Same as coprimary end points | Same as coprimary end points | None |
Endoscopic remission at week 12 and week 48 | Same as coprimary end points | Same as coprimary end points | Same as coprimary end points | None |
Deep remission (i.e., clinical remission and endoscopic remission) | Same as coprimary end points | Same as coprimary end points | Same as coprimary end points | None |
IBDQ remission at week 12 and week 48 | Same as coprimary end points | Same as coprimary end points | Same as coprimary end points | None |
GRAVITI study: SC induction and SC maintenance | ||||
Coprimary end points: Clinical remission at week 12 Endoscopic response at week 12 | Common risk difference using Mantel-Haenszel stratum weights and Sato variance estimator | Stratification factors: Baseline CDAI (≤ 300 or > 300), baseline SES-CD score (≤ 12 or > 12), BIO-Failure status (yes or no) | Imputed as nonresponse group | Sensitivity analyses:
Supportive analyses:
|
Clinical response at week 12 | Same as coprimary end points | Same as coprimary end points | Same as coprimary end points | None |
Endoscopic response at week 48 | Same as coprimary end points | Same as coprimary end points | Same as coprimary end points | None |
Clinical remission at week 48 | Same as coprimary end points | Same as coprimary end points | Same as coprimary end points | None |
Endoscopic remission at week 48 | Same as coprimary end points | Same as coprimary end points | Same as coprimary end points | None |
PRO-2 remission at week 48 | Same as coprimary end points | Same as coprimary end points | Same as coprimary end points | None |
IBDQ remission at week 48 | Same as coprimary end points | Same as coprimary end points | Same as coprimary end points | None |
ATAS = all-treated analysis set; BIO-Failure = biologic therapy failure or intolerance; CDAI = Crohn’s Disease Activity Index; IBDQ = Inflammatory Bowel Disease Questionnaire; PAS = primary analysis set; PRO-2 = patient-reported outcome 2; SC = subcutaneous; SES-CD = Simple Endoscopic Score for Crohn’s Disease.
Note: The modified PAS included the same population as the PAS but excluded patients who had data that could not be verified as specified by the Global Monitoring Plan due to an inability to access sites because of a major disruption (specifically, the regional crisis in Ukraine and Russia, or COVID-related site restrictions such as site closures, and other potential events that restrict site access).
Sources: Clinical Study Report for the GALAXI 2 trial,12 Clinical Study Report for the GALAXI 3 trial,13 Clinical Study Report for the GRAVITI trial.14 Details included in the table are from the sponsor’s Summary of Clinical Evidence.
Safety Analysis
In all 3 trials, safety analyses were carried out using the corresponding safety analysis described in the Analysis Populations section that follows. In general, patients were analyzed according to their assigned treatment group. However, patients originally assigned to placebo or ustekinumab who inadvertently received guselkumab at any point were analyzed as part of the guselkumab group from the time of first guselkumab administration onward.
Analysis Populations
The analysis populations are summarized in Table 12.
Table 12: Analysis Populations of GALAXI 2, GALAXI 3, and GRAVITI Studies
Study | Population | Definition | Application |
|---|---|---|---|
GALAXI 2 and GALAXI 3 studies: IV induction followed by SC maintenance | PAS (N = 508 in GALAXI 2 study and N = 513 in GALAXI 3 study) | All randomized patients who received at least 1 (partial or complete) dose of study intervention and satisfied the SES-CD eligibility criteriaa | Efficacy and sensitivity analyses |
PSAS (N = 508 in GALAXI 2 study and N = 513 in GALAXI 3 study) | All randomized patients who received at least 1 (partial or complete) dose of study intervention and satisfied the SES-CD eligibility criteriaa | Safety analyses | |
ATAS (N = 523 in GALAXI 2 study and N = 525 in GALAXI 3 study) | All randomized patients who received at least 1 (partial or complete) dose of study intervention | Supportive analyses | |
GRAVITI study: SC induction followed by SC maintenance | FAS (N = 347) | All randomized patients who received at least 1 dose of study intervention | Efficacy analyses |
Safety analysis set (N = 347) | All randomized patients who received at least 1 dose of study intervention | Safety analyses |
ATAS = all-treated analysis set; FAS = full analysis set; PAS = primary analysis set; PSAS = primary safety analysis set; SC = subcutaneous; SES-CD = Simple Endoscopic Score for Crohn’s Disease.
aScreening SES-CD score of at least 6, or at least 4 for patients with isolated ileal disease.
Sources: Clinical Study Report for the GALAXI 2 trial,12 Clinical Study Report for the GALAXI 3 trial,13 Clinical Study Report for the GRAVITI trial.14 Details included in the table are from the sponsor’s Summary of Clinical Evidence.
Results
Patient Disposition
A summary of patient disposition for the GALAXI 2, GALAXI 3, and GRAVITY trials is presented in Table 13, Table 14, and Table 15, respectively.
GALAXI 2 Study
In the GALAXI 2 trial, 524 patients were randomized, of whom 508 received treatment, including 76 patients in the placebo group, 143 patients in the guselkumab regimen 1 group (200 mg IV every 4 weeks, followed by 100 mg SC every 8 weeks), 146 patients in the guselkumab regimen 2 group (200 mg IV every 4 weeks, followed by 200 mg SC every 4 weeks), and 143 patients in the ustekinumab group. At week 12, 49 (64.4%) patients who had been randomized to placebo crossed over to ustekinumab. The proportion of patients who discontinued study treatment in the induction period was low across treatment groups, ranging from 0.7% to 3.9%. The proportion of patients who discontinued study treatment before completing the maintenance phase was notably higher in the placebo group (37.0%) compared with the guselkumab regimen 1 group (9.8%), the guselkumab regimen 2 group (4.1%), and the ustekinumab group (14.0%). In the placebo group, discontinuation was most commonly due to AEs related to the worsening of CD (18.5%), followed by patient withdrawal (7.4%) and a lack of efficacy (7.4%). These reasons were less frequently reported in the other treatment groups, with discontinuations due to the worsening of CD ranging from 0.7% to 2.8%, patient withdrawal ranging from 0% to 5.6%, and a lack of efficacy ranging from 0.7% to 2.8%.
GALAXI 3 Study
In the GALAXI 3 trial, 525 patients were randomized, of whom 513 received treatment, including 72 patients in the placebo group, 143 patients in the guselkumab regimen 1 group, 150 patients in the guselkumab regimen 2 group, and 148 patients in the ustekinumab group. At week 12, 49 (68.1%) patients who had been randomized to placebo crossed over to ustekinumab. The proportion of patients who discontinued study treatment during the induction period ranged from 1.3% to 4.2% across the treatment groups. The proportion of patients who discontinued study treatment before completing the maintenance phase was notably higher in the placebo group (34.8%) compared with the guselkumab regimen 1 group (15.4%), the guselkumab regimen 2 group (16.7%), and the ustekinumab group (18.2%). In the placebo group, discontinuation was most commonly due to AEs related to the worsening of CD (21.7%), followed by patient withdrawal (8.7%) and a lack of efficacy (4.3%). These reasons were less frequently reported in the other treatment groups, with discontinuations due to the worsening of CD ranging from 1.4% to 3.4%, patient withdrawal ranging from 2.0% to 4.2%, and a lack of efficacy ranging from 2.1% to 4.1%. One patient withdrew from the study due to a protocol deviation.
GRAVITI Study
In the GRAVITI trial, 350 patients were randomized, of whom 347 received the treatment, including 117 patients in the placebo group, 117 patients in the guselkumab regimen 2 group, and 115 patients in the guselkumab regimen 1 group. The proportion of patients who discontinued study treatment during the induction period was higher in the placebo group (10.3%) compared with the guselkumab regimen 1 group (1.7%) and the guselkumab regimen 2 group (0.9%). The proportion of patients who discontinued study treatment before completing the maintenance period was notably higher in the placebo group (26.5%) compared with the guselkumab regimen 2 group (10.4%) and the guselkumab regimen 1 group (4.3%). In the placebo group, discontinuation was most commonly due to patient withdrawal (7.7%), followed by AEs related to the worsening of CD (5.1%), and a lack of efficacy (5.1%). These reasons were less frequently reported in the guselkumab regimen 2 and guselkumab regimen 1 groups, with discontinuations due to patient withdrawal occurring in 1.7% of patients in both groups, due to the worsening of CD in 1.7% and 0.7% of patients, respectively, and due to a lack of efficacy in 0.9% and 2.6% of patients, respectively.
Table 13: Summary of Patient Disposition From GALAXI 2 Study — PAS
Characteristic | Placebo | Placebo followed by ustekinumab | Guselkumab regimen 1 | Guselkumab regimen 2 | Ustekinumab |
|---|---|---|---|---|---|
Randomized, N | 524 | ||||
Randomized and treated, N | 76 | 148 | 146 | 143 | |
Did not advance past screening, n (%) | 4 (5.2) | 9 (6.1) | 6 (4.1) | 6 (4.0) | |
Induction period | |||||
PAS, N | 76a | NA | 143 | 146 | 143 |
Discontinued study treatment during the induction period, n (%)b | 3 (3.9) | NA | 0 (0) | 2 (1.4) | 1 (0.7) |
Reason for discontinuation of study treatment, n (%) | |||||
Adverse event: Worsening of CD | 1 (1.3) | NA | 0 (0) | 0 (0) | 0 (0) |
Adverse event: Other | 0 (0) | NA | 0 (0) | 2 (1.4) | 1 (0.7) |
Patient refused further study treatment | 1 (1.3) | NA | 0 (0) | 0 (0) | 0 (0) |
Withdrawal by patient | 1 (1.3) | NA | 0 (0) | 0 (0) | 0 (0) |
Discontinued from study before week 12, n (%) | 4 (5.3) | NA | 1 (0.7) | 1 (0.7) | 1 (0.7) |
Reason for study termination, n (%) | |||||
Withdrawal by patient | 4 (5.3) | NA | 1 (0.7) | 1 (0.7) | 1 (0.7) |
Maintenance period | |||||
PAS, N | 27c | 49d | 143 | 146 | 143 |
Discontinued study treatment before completing maintenance dosing, n (%)e | 10 (37.0) | 3 (6.1) | 14 (9.8) | 6 (4.1) | 20 (14.0) |
Reason for discontinuation of study treatment, N (%) | |||||
Adverse event: Worsening of CD | 5 (18.5) | 0 (0) | 2 (1.4) | 1 (0.7) | 4 (2.8) |
Adverse event: Other | 0 (0) | 0 (0) | 2 (1.4) | 3 (2.1) | 3 (2.1) |
Withdrawal by patient | 2 (7.4) | 1 (2.0) | 4 (2.8) | 0 (0) | 8 (5.6) |
Lost to follow-up | 0 (0) | 0 (0) | 1 (0.7) | 0 (0) | 0 (0) |
Lack of efficacy | 2 (7.4) | 1 (2.0) | 4 (2.8) | 1 (0.7) | 3 (2.1) |
Patient refused further study treatment | 1 (3.7) | 0 (0) | 0 (0) | 0 (0) | 2 (1.4) |
Pregnancy | 0 (0) | 0 (0) | 1 (0.7) | 0 (0) | 0 (0) |
Week 20/24 nonresponse | 0 (0) | 0 (0) | 0 (0) | 1 (0.7) | 0 (0) |
Other | 0 (0) | 1 (2.0) | 0 (0) | 0 (0) | 0 (0) |
Discontinued from study before week 48, n (%) | 4 (14.8) | 2 (4.1) | 7 (4.9) | 3 (2.1) | 10 (7.0) |
Reason for study termination, n (%) | |||||
Withdrawal by patient | 4 (14.8) | 2 (4.1) | 6 (4.2) | 3 (2.1) | 9 (6.3) |
Lost to follow-up | 0 (0) | 0 (0) | 1 (0.7) | 0 (0) | 1 (0.7) |
PSAS, N | 76 | 143 | 146 | 143 | |
ATAS, N | 77 | 148 | 148 | 150 | |
ATAS = all-treated analysis set; CD = Crohn disease; NA = not applicable; PAS = primary analysis set; PSAS = primary safety analysis set; SC = subcutaneous.
Note: Guselkumab regimen 1 = 200 mg IV every 4 weeks, followed by 100 mg SC every 8 weeks. Guselkumab regimen 2 = 200 mg IV every 4 weeks, followed by 200 mg SC every 4 weeks.
aThe Placebo column includes all patients randomized to placebo. At week 12, patients who in the clinical response group continued placebo treatment and those in the nonresponse group crossed over to ustekinumab.
bStudy treatment discontinuation during induction = discontinued treatment before the week 12 visit and the week 8 dose is missing.
cPatients who did not receive a maintenance dose, and those who received placebo SC during the maintenance period.
dPatients who were not in clinical response to placebo induction dosing and crossed over to ustekinumab at week 12 and continued to receive ustekinumab SC dosing in the maintenance period.
eDiscontinuing study treatment before completing maintenance dosing means discontinued treatment before week 48 visit and the week 44 dose is missing.
Sources: Clinical Study Report for the GALAXI 2 trial.12 Details included in the table are from the sponsor’s Summary of Clinical Evidence.
Table 14: Summary of Patient Disposition From GALAXI 3 Study — PAS
Characteristic | Placebo | Placebo followed by ustekinumab | Guselkumab regimen 1 | Guselkumab regimen 2 | Ustekinumab |
|---|---|---|---|---|---|
Randomized, N | 525 | ||||
Randomized and treated, N | 76 | 148 | 151 | 150 | |
Did not advance past screening, n (%) | 6 (7.9) | 9 (6.1) | 19 (12.6) | 15 (10.0) | |
Induction period | |||||
PAS, N | 72a | NA | 143 | 150 | 148 |
Discontinued study treatment during the induction period, n (%)b | 3 (4.2) | NA | 4 (2.8) | 2 (1.3) | 5 (3.4) |
Reason for discontinuation of study treatment, n (%) | |||||
Adverse event: Worsening of CD | 1 (1.4) | NA | 0 (0) | 1 (0.7) | 1 (0.7) |
Adverse event: Other | 0 | NA | 0 (0) | 0 (0) | 1 (0.7) |
Withdrawal by patient | 2 (2.8) | NA | 3 (2.1) | 0 (0) | 0 (0) |
CD-related surgery | 0 (0) | NA | 0 (0) | 0 (0) | 1 (0.7) |
Initiated prohibited medication | 0 (0) | NA | 0 (0) | 0 (0) | 1 (0.7) |
Patient refused further study treatment | 0 (0) | NA | 0 (0) | 1 (0.7) | 0 (0) |
Pregnancy | 0 (0) | NA | 1 (0.7) | 0 (0) | 0 (0) |
Other | 0 (0) | NA | 0 (0) | 0 (0) | 1 (0.7) |
Discontinued from study before week 12, n (%) | 4 (5.6) | NA | 3 (2.1) | 3 (2.0) | 4 (2.7) |
Reason for study termination, n (%) | |||||
Withdrawal by patient | 4 (5.6) | NA | 3 (2.1) | 3 (2.0) | 4 (2.7) |
Maintenance period | |||||
PAS, N | 23c | 49d | 143 | 150 | 148 |
Discontinued study treatment before completing maintenance period, N (%)e | 8 (34.8) | 6 (12.2) | 22 (15.4) | 25 (16.7) | 27 (18.2) |
Reason for discontinuation, n (%) | |||||
Adverse event: Worsening of CD | 5 (21.7) | 1 (2.0) | 2 (1.4) | 3 (2.0) | 5 (3.4) |
Adverse event: Other | 0 | 3 (6.1) | 6 (4.2) | 7 (4.7) | 4 (2.7) |
Lack of efficacy | 1 (4.3) | 2 (4.1) | 3 (2.1) | 5 (3.3) | 6 (4.1) |
Withdrawal by patient | 2 (8.7) | 0 (0) | 6 (4.2) | 4 (2.7) | 3 (2.0) |
Pregnancy | 0 (0) | 0 (0) | 2 (1.4) | 1 (0.7) | 2 (1.4) |
Patient refused further study treatment | 0 (0) | 0 (0) | 0 (0) | 3 (2.0) | 2 (1.4) |
CD-related surgery | 0 (0) | 0 (0) | 0 (0) | 2 (1.3) | 1 (0.7) |
Lost to follow-up | 0 (0) | 0 (0) | 1 (0.7) | 0 (0) | 1 (0.7) |
Initiated prohibited medication | 0 (0) | 0 (0) | 0 | 0 (0) | 1 (0.7) |
Other: Other major disruption–relatedf | 0 (0) | 0 (0) | 1 (0.7) | 0 (0) | 0 (0) |
Discontinued from study before week 48, n (%) | 4 (17.4) | 3 (6.1) | 16 (11.2) | 13 (8.7) | 13 (8.8) |
Reason for study termination, N (%) | |||||
Withdrawal by patient | 4 (17.4) | 3 (6.1) | 14 (9.8) | 11 (7.3) | 12 (8.1) |
Lost to follow-up | 0 (0) | 0 (0) | 1 (0.7) | 1 (0.7) | 1 (0.7) |
Other: Other major disruption–relatedf | 0 (0) | 0 (0) | 1 (0.7) | 0 (0) | 0 (0) |
PSAS, N | 72 | 143 | 150 | 148 | |
ATAS, N | 76 | 148 | 151 | 150 | |
ATAS = all-treated analysis set; CD = Crohn disease; NA = not applicable; PAS = primary analysis set; PSAS = primary safety analysis set; SC = subcutaneous.
Note: Guselkumab regimen 1 = 200 mg IV every 4 weeks, followed by 100 mg SC every 8 weeks. Guselkumab regimen 2 = 200 mg IV every 4 weeks, followed by 200 mg SC every 4 weeks.
aThe Placebo column includes all patients randomized to placebo. At week 12, patients in the clinical response group continued placebo treatment and those who in the nonresponse group crossed over to ustekinumab.
bStudy treatment discontinuation during induction = discontinued treatment before the week 12 visit and the week 8 dose is missing.
cPatients who did not receive a maintenance dose, and those who received placebo SC during the maintenance period.
dPatients who were not in clinical response to placebo induction dosing and crossed over to ustekinumab at week 12 and continued to receive ustekinumab SC dosing in the maintenance period.
eDiscontinuing study treatment before completing maintenance dosing = discontinued treatment before the week 48 visit and the week 44 dose is missing.
fOther major disruption–related includes a regional crisis.
Sources: Clinical Study Report for the GALAXI 3 trial.13 Details included in the table are from the sponsor’s Summary of Clinical Evidence.
Table 15: Summary of Patient Disposition From GRAVITI Study — FAS
Characteristic | Placeboa | Placebo followed by guselkumabb | Guselkumab regimen 1 | Guselkumab regimen 2 |
|---|---|---|---|---|
Randomized, N | 350 | |||
Randomized and treated, N | 118 | 117 | 115 | |
Induction period | ||||
FAS, N | 117 | 115 | 115 | |
Patients who met the rescue criteria, n (%) | 44 (37.6) | 14 (12.2) | 14 (12.2) | |
Discontinued study treatment during the induction period, n (%) | 12 (10.3) | NA | 2 (1.7) | 1 (0.9) |
Reason for discontinuation, n (%) | ||||
Withdrawal by patient | 7 (6.0) | NA | 0 (0) | 0 (0) |
Lack of efficacy | 2 (1.7) | NA | 0 (0) | 0 (0) |
AE: Worsening of CD | 1 (0.9) | NA | 0 (0) | 0 (0) |
Other AE | 1 (0.9) | NA | 1 (0.9) | 0 (0) |
Death | 0 (0) | NA | 1 (0.9) | 0 (0) |
Lost to follow-up | 0 (0) | NA | 1 (0.9) | 0 (0) |
Protocol deviation | 1 (0.9) | NA | 0 (0) | 0 (0) |
Discontinued from study before week 12, n (%) | 7 (6.0) | NA | 2 (1.7) | 1 (0.9) |
Reason for termination, n (%) | ||||
Withdrawal by patient | 7 (6.0) | NA | 0 (0) | 1 (0.9) |
Death | 0 (0) | NA | 1 (0.9) | 0 (0) |
Loss to follow-up | 0 (0) | NA | 1 (0.9) | 0 (0) |
Maintenance period | ||||
Discontinued study treatment before completing maintenance period, n (%) | 31 (26.5) | 5 (11.4) | 12 (10.4) | 5 (4.3) |
Reason for discontinuation, n (%) | ||||
Withdrawal by patient | 9 (7.7) | 1 (2.3) | 2 (1.7) | 2 (1.7) |
Lack of efficacy | 4 (3.4) | 2 (4.5) | 3 (2.6) | 1 (0.9) |
AE: Worsening of CD | 6 (5.1) | 0 (0) | 2 (1.7) | 1 (0.9) |
Other AE | 4 (3.4) | 1 (2.3) | 2 (1.7) | 1 (0.9) |
Lost to follow-up | 1 (0.9) | 0 (0) | 1 (0.9) | 0 (0) |
Pregnancy | 1 (0.9) | 1 (2.3) | 0 (0) | 0 (0) |
Week 20/24 nonresponse | 1 (0.9) | 0 (0) | 1 (0.9) | 0 (0) |
Death | 0 (0) | 0 (0) | 1 (0.9) | 0 (0) |
Initiated prohibited medication | 1 (0.9) | 0 (0) | 0 (0) | 0 (0) |
Protocol deviation | 1 (0.9) | 0 (0) | 0 (0) | 0 (0) |
Other | 3 (2.6) | 0 (0) | 0 (0) | 0 (0) |
Discontinued from study before week 48, n (%) | 16 (13.7) | 2 (4.5) | 5 (4.3) | 1 (0.9) |
Reason for termination, n (%) | ||||
Withdrawal by patient | 13 (11.1) | 2 (4.5) | 3 (2.6) | 1 (0.9) |
Lost to follow-up | 3 (2.6) | 0 (0) | 1 (0.9) | 0 (0) |
Death | 0 (0) | 0 (0) | 1 (0.9) | 0 (0) |
SAS, N | 117 | 115 | 115 | |
AE = adverse event; CD = Crohn disease; FAS = full analysis set; NA = not applicable; SAS = safety analysis set; SC = subcutaneous.
Note: Guselkumab regimen 1 equals 200 mg IV every 4 weeks, followed by 100 mg SC every 8 weeks. Guselkumab regimen 2 equals 200 mg IV every 4 weeks, followed by 200 mg SC every 4 weeks.
aIncludes data from all placebo patients, excluding data after a patient was rescued with guselkumab.
bIncludes data from placebo patients who were rescued with guselkumab. Data in this group occurred after a patient crossed over to guselkumab.
Sources: Clinical Study Report for the GRAVITI trial.14 Details included in the table are from the sponsor’s Summary of Clinical Evidence.
Protocol Deviation
In the GALAXI 2 trial, the proportion of major protocol deviations was 10.5% in the placebo group, 20.3% in the guselkumab regimen 1 group, 14.4% in the guselkumab regimen 2 group, and 19.6% in the ustekinumab group through week 48; this was primarily attributed to not meeting eligibility criteria (5.3%, 6.3%, 4.1%, and 4.2%, respectively). In the GALAXI 3 trial, the proportion of major protocol deviations was 19.4% in the placebo group, 18.9% in the guselkumab regimen 1 group, 24.0% in the guselkumab regimen 2 group, and 27.0% in the ustekinumab group through week 48; the most common reasons for protocol deviations included not meeting eligibility criteria (9.7%, 6.3%, 12.0%, and 12.8%, respectively) and receiving the wrong treatment or incorrect dose (0%, 2.8%, 2.0%, and 1.4%, respectively). In the GRAVITI trial, the proportion of major protocol deviations was 36.8% in the placebo group, 26.1% in the guselkumab regimen 1 group, and 24.3% in the guselkumab regimen 2 group through week 48; the most common reasons for protocol deviations included not meeting eligibility criteria (26.5%, 15.7%, and 16.5%, respectively) and receiving prohibited concomitant medication (2.6%, 4.3%, and 6.1%, respectively).
Baseline Characteristics
The baseline characteristics for the GALAXI trials and the GRAVITI trial are outlined in Table 16 and Table 17, respectively.
GALAXI 2 Study
In the GALAXI 2 trial, patients were predominantly white (74.2% vs. 25.8% nonwhite) and male (55.3% versus 44.7% female). The mean age was 36.4 years (standard deviation [SD] = 12.8 years). In the PAS population, the majority of patients were from Eastern Europe (48.4%), followed by Asia (21.5%) and the rest of the world (23.4%). The mean duration of CD was 7.13 years (SD = 6.9 years), the mean CDAI score was 295.0 points (SD = 52.0 points), the mean SES-CD score was 13.1 points (SD = 7.3 points), and the endoscopic disease severity per SES-CD score for most patients (54.1%) was between 7 and 16. The proportion of patients in the BIO-Failure analysis subpopulation was 52.8%, and 50.6% of patients had not experienced improvement with at least 1 TNF antagonist. The proportion of patients in the CON-Failure analysis subpopulation was 47.2%, and 41.9% of patients were in the biologic-naive analysis subpopulation, which was a subset of the CON-Failure analysis subgroup. Baseline characteristics were generally similar across treatment groups, with a few notable differences. The guselkumab regimen 1 group had a lower proportion of male patients (48.3%) compared with the placebo group (53.9%), the guselkumab regimen 2 group (59.6%), and the ustekinumab group (58.7%). The mean duration of CD was shorter in the placebo group at 6.36 years compared with 7.91 years in the guselkumab regimen 1 group, 7.30 years in the guselkumab regimen 2 group, and 6.58 years in the ustekinumab group. Additionally, a higher proportion of patients in the guselkumab regimen 1 group had an SES-CD score of between 7 and 16 (58.0%) compared with the placebo group (50.0%), the guselkumab regimen 2 group (54.1%), and the ustekinumab group (52.4%). Similarly, more patients in the guselkumab regimen 1 group had at least 1 open or draining fistula (14.7%) compared with those in the placebo group (9.2%), the guselkumab regimen 2 group (4.8%), and the ustekinumab group (6.3%). The distribution of patients with prior treatment using anti-TNF drugs, vedolizumab, or both was generally similar across all groups.
GALAXI 3 Study
In the GALAXI 3 trial, patients were predominantly white (74.5%) and male (59.8%). The mean age was 36.6 years (SD = 12.9 years). In the PAS population, the majority of patients were from Eastern Europe (44.1%), followed by Asia (20.3%) and the rest of the world (25.7%). The mean duration of CD was 7.20 years (SD = 7.47 years), the mean CDAI score was 294.7 points (SD = 53.8 points), the mean SES-CD score was 12.8 points (SD = 7.3 points), and the endoscopic disease severity per SES-CD score for most patients (53.0%) was between 7 and 16. The proportion of patients in the BIO-Failure analysis subpopulation (whose disease had a history of inadequate response or intolerance to previous biologic medication treatment) was 51.9%, and approximately half of patients (50.3%) had not experienced improvement with at least 1 TNF antagonist. The proportion of patients in the CON-Failure analysis subpopulation was 48.1%, and 41.5% of patients were in the biologic-naive analysis subpopulation. Baseline characteristics were generally similar across treatment groups, with a few notable differences. The guselkumab regimen 1 group had a lower proportion of male patients (48.3%) compared with the placebo group (53.9%), the guselkumab regimen 2 group (59.6%), and the ustekinumab group (58.7%). The mean duration of CD was shortest in the placebo group at 6.36 years compared with 7.91 years in the guselkumab regimen 1 group, 7.30 years in the guselkumab regimen 2 group, and 6.58 years in the ustekinumab group. Additionally, a higher proportion of patients in the guselkumab regimen 1 group had an SES-CD score between 7 and 16 (58.0%) compared with the placebo group (50.0%), the guselkumab regimen 2 group (54.1%), and the ustekinumab group (52.4%). Similarly, more patients in the guselkumab regimen 1 group had at least 1 open or draining fistula (14.7%) compared with those in the placebo group (9.2%), the guselkumab regimen 2 group (4.8%), and the ustekinumab group (6.3%). The distribution of patients with prior treatment using anti-TNF drugs, vedolizumab, or both was generally similar across all groups.
GRAVITI Study
In the GRAVITI trial, patients were predominantly white (66.0% versus 44.0% nonwhite) and male (58.5% versus 41.5% female). The mean age was 37.5 years (SD = 12.9 years). In the PAS population, the majority of patients were from Eastern Europe (39.8%), followed by Asia (21.3%) and the rest of the world (30.3%). The mean duration of CD was 8.0 years (SD = 8.1 years), the mean CDAI score was 296.9 points (SD = 52.7 points), the mean SES-CD score was 12.0 points (SD = 6.9 points), and the endoscopic disease severity per SES-CD score for most patients (50.1%) was between 7 and 16. The proportion of patients in the BIO-Failure analysis subpopulation (history of inadequate response or intolerance to previous biologic medication treatment) was 46.6%. A total of 53.6% of patients had not experienced improvement with conventional therapies but had experienced improvement with biologic therapy. Additionally, 46.4% of patients had no prior exposure to biologics, which constitutes the majority of the CON-Failure analysis population. Baseline characteristics were generally similar across treatment groups, with a few notable differences. The guselkumab regimen 2 group had a higher proportion of patients from Eastern Europe (43.5%) compared with the placebo and guselkumab regimen 1 groups (35.0% and 40.9%, respectively). The mean duration of CD was 6.96 years (SD = 7.75 years) in the placebo group, 9.17 years (SD = 9.08 years) in the guselkumab regimen 1 group, and 7.89 years (SD = 7.13 years) in the guselkumab regimen 2 group. A higher proportion of patients in the guselkumab regimen 1 group had an SES-CD score of between 7 and 16 (55.7%) compared with those in the placebo group (52.1%) and the guselkumab regimen 2 group (42.6%). The distribution of patients with prior treatment using anti-TNF drugs, vedolizumab, or both was generally similar across all groups.
Table 16: Summary of Baseline Characteristics From GALAXI 2 and GALAXI 3 Studies — PAS, IV Induction and SC Maintenance
Characteristic | GALAXI 2 study | GALAXI 3 study | ||||||
|---|---|---|---|---|---|---|---|---|
Placebo N = 76 | Guselkumab regimen 1 N = 143 | Guselkumab regimen 2 N = 146 | Ustekinumab N = 143 | Placebo N = 72 | Guselkumab regimen 1 N = 143 | Guselkumab regimen 2 N = 150 | Ustekinumab N = 148 | |
Demographic characteristics | ||||||||
Age (years), mean (SD) | 34.2 (11.86) | 37.2 (12.92) | 36.1 (13.09) | 36.9 (12.70) | 35.4 (12.52) | 34.9 (11.44) | 37.6 (13.44) | 37.9 (13.69) |
Sex, n (%) | ||||||||
Male | 41 (53.9) | 69 (48.3) | 87 (59.6) | 84 (58.7) | 47 (65.3) | 85 (59.4) | 91 (60.7) | 84 (56.8) |
Female | 35 (46.1) | 74 (51.7) | 59 (40.4) | 59 (41.3) | 25 (34.7) | 58 (40.6) | 59 (39.3) | 64 (43.2) |
Race, n (%) | ||||||||
Asian | 17 (22.4) | 34 (23.8) | 28 (19.2) | 32 (22.4) | 18 (25.0) | 38 (26.6) | 28 (18.7) | 66 (22.5) |
Black or African American | 0 (0) | 3 (2.1) | 1 (0.7) | 3 (2.1) | 3 (4.2) | 0 (0) | 1 (0.7) | 1 (0.3) |
Native Hawaiian or other Pacific Islander | 2 (2.6) | 0 (0) | 0 (0) | 0 (0) | 2 (2.8) | 1 (0.7) | 0 (0) | 1 (0.3) |
White | 55 (72.4) | 103 (72.0) | 115 (78.8) | 104 (72.7) | 47 (65.3) | 103 (72.0) | 117 (78.0) | 220 (75.1) |
Not reported | 2 (2.6) | 3 (2.1) | 2 (1.4) | 4 (2.8) | 2 (2.8) | 1 (0.7) | 4 (2.7) | 5 (1.7) |
Region, n (%) | ||||||||
Asia | 17 (22.4) | 33 (23.1) | 28 (19.2) | 31 (21.7) | 18 (25.0) | 36 (25.2) | 28 (18.7) | 22 (14.9) |
Eastern Europe | 37 (48.7) | 68 (47.6) | 72 (49.3) | 69 (48.3) | 34 (47.2) | 63 (44.1) | 66 (44.0) | 63 (42.6) |
North America | 3 (3.9) | 11 (7.7) | 8 (5.5) | 12 (8.4) | 7 (9.7) | 12 (8.4) | 12 (8.0) | 20 (13.5) |
Rest of world | 19 (25.0) | 31 (21.7) | 38 (26.0) | 31 (21.7) | 13 (18.1) | 32 (22.4) | 44 (29.3) | 43 (29.1) |
Disease characteristics | ||||||||
CD duration (years), mean (SD) | 6.36 (7.484) | 7.91 (7.232) | 7.30 (6.696) | 6.58 (6.505) | 7.97 (7.545) | 6.33 (6.083) | 6.84 (7.748) | 8.02 (8.270) |
CDAI score, mean (SD) | 292.0 (51.70) | 297.3 (52.57) | 294.2 (51.69) | 295.3 (52.35) | 294.9 (54.09) | 295.3 (56.09) | 297.6 (53.85) | 291.0 (51.73) |
SF count > 3, n (%) | 56 (73.7) | 108 (75.5) | 100 (68.5) | 108 (75.5) | 55 (76.4) | 105 (73.4) | 120 (80.0) | 115 (77.7) |
AP score > 1, n (%) | 71 (93.4) | 136 (95.1) | 140 (95.9) | 133 (93.0) | 67 (93.1) | 136 (95.1) | 145 (96.7) | 141 (95.3) |
SF count > 2 and AP score > 1, n (%) | 51 (67.1) | 101 (70.6) | 94 (64.4) | 98 (68.5) | 50 (69.4) | 98 (68.5) | 115 (76.7) | 108 (73.0) |
SES-CD score, mean (SD) | 13.9 (7.80) | 13.0 (7.03) | 12.4 (7.14) | 13.3 (7.50) | 12.7 (7.27) | 13.4 (7.83) | 12.6 (7.37) | 12.4 (6.55) |
Endoscopic disease severity per SES-CD score, n (%) | ||||||||
< 7 | 14 (18.4) | 21 (14.7) | 29 (19.9) | 26 (18.2) | 14 (19.4) | 20 (14.0) | 41 (27.3) | 31 (20.9) |
7 to 16 | 38 (50.0) | 83 (58.0) | 79 (54.1) | 75 (52.4) | 39 (54.2) | 81 (56.6) | 68 (45.3) | 84 (56.8) |
> 16 | 24 (31.6) | 39 (27.3) | 38 (26.0) | 42 (29.4) | 19 (26.4) | 42 (29.4) | 41 (27.3) | 33 (22.3) |
CRP concentration (mg/L), mean (SD) | 13.4 (21.84) | 13.8 (19.94) | 14.7 (20.47) | 13.8 (17.78) | 14.5 (22.40) | 18.5 (22.71) | 16.4 (22.96) | 15.9 (23.97) |
Fecal calprotectin (mcg/g), mean (SD) | 1,802.9 (2,050.60) | 1,929.2 (3,752.84) | 1,510.1 (1,998.86) | 1,671.1 (2,144.17) | 1,965.5 (3,168.06) | 1,687.3 (1,783.88) | 2,021.6 (3,735.02) | 1,554.2 (2,083.59) |
IBDQ, mean (SD) | 126.9 (30.19) | 123.8 (33.17) | 128.0 (30.07) | 127.5 (30.54) | 129.4 (37.76) | 126.4 (31.72) | 126.0 (28.21) | 129.2 (31.43) |
Number of patients with ≥ 1 open or draining fistula, n (%) | 7 (9.2) | 21 (14.7) | 7 (4.8) | 9 (6.3) | 12 (16.7) | 23 (16.1) | 17 (11.3) | 16 (10.8) |
Involved GI areas by central reader, n (%) | ||||||||
Ileum only | 17 (22.4) | 29 (20.3) | 39 (26.7) | 25 (17.5) | 14 (19.4) | 30 (21.0) | 41 (27.3) | 30 (20.3) |
Colon only | 29 (38.2) | 62 (43.4) | 56 (38.4) | 58 (40.6) | 33 (45.8) | 51 (35.7) | 56 (37.3) | 58 (39.2) |
Ileum and colon | 30 (39.5) | 52 (36.4) | 51 (34.9) | 60 (42.0) | 25 (34.7) | 62 (43.4) | 53 (35.3) | 60 (40.5) |
Biologic medication history, n (%) | ||||||||
Patients without a history of biologic failure | 37 (48.7) | 66 (46.2) | 73 (50.0) | 64 (44.8) | 33 (45.8) | 67 (46.9) | 76 (50.7) | 71 (48.0) |
No prior exposure to biologics | 34 (44.7) | 58 (40.6) | 63 (43.2) | 58 (40.6) | 27 (37.5) | 58 (40.6) | 65 (43.3) | 63 (42.6) |
Prior exposure to biologics but no documented biologic failure, | 3 (3.9) | 8 (5.6) | 10 (6.8) | 6 (4.2) | 6 (8.3) | 9 (6.3) | 11 (7.3) | 8 (5.4) |
Patients with a history of biologic failure | 39 (51.3) | 77 (53.8) | 73 (50.0) | 79 (55.2) | 39 (54.2) | 76 (53.1) | 74 (49.3) | 77 (52.0) |
Primary nonresponse, secondary nonresponse, or intolerance to treatment, n (%) | ||||||||
> 1 anti-TNF | 39 (51.3) | 74 (51.7) | 71 (48.6) | 73 (51.0) | 37 (51.4) | 75 (52.4) | 72 (48.0) | 74 (50.0) |
≥ 2 anti-TNFs | 10 (13.2) | 16 (11.2) | 15 (10.3) | 25 (17.5) | 13 (18.1) | 15 (10.5) | 16 (10.7) | 21 (14.2) |
Anti-TNF only | 35 (46.1) | 64 (44.8) | 65 (44.5) | 66 (46.2) | 30 (41.7) | 64 (44.8) | 64 (42.7) | 59 (39.9) |
Vedolizumab | 4 (5.3) | 13 (9.1) | 8 (5.5) | 13 (9.1) | 9 (12.5) | 12 (8.4) | 10 (6.7) | 18 (12.2) |
Vedolizumab only | 0 (0) | 3 (2.1) | 2 (1.4) | 6 (4.2) | 2 (2.8) | 1 (0.7) | 2 (1.3) | 3 (2.0) |
Vedolizumab and ≥ 1 anti-TNF | 4 (5.3) | 10 (7.0) | 6 (4.1) | 7 (4.9) | 7 (9.7) | 11 (7.7) | 8 (5.3) | 15 (10.1) |
AP = abdominal pain; CD = Crohn disease; CDAI = Crohn’s Disease Activity Index; CRP = C-reactive protein; GI = gastrointestinal; IBDQ = Inflammatory Bowel Disease Questionnaire; PAS = primary analysis set; TNF = tumour necrosis factor; SC = subcutaneous; SD = standard deviation; SES-CD = Simple Endoscopic Score for Crohn’s Disease; SF = stool frequency.
Note: Guselkumab regimen 1 = 200 mg IV every 4 weeks, followed by 100 mg SC every 8 weeks. Guselkumab regimen 2 = 200 mg IV every 4 weeks, followed by 200 mg SC every 4 weeks.
Sources: Clinical Study Report for the GALAXI 2 trial,12 Clinical Study Report for the and GALAXI 3 trial.13 Details included in the table are from the sponsor’s Summary of Clinical Evidence.
Table 17: Summary of Baseline Characteristics From GRAVITI Study — FAS, SC Induction and SC Maintenance
Characteristic | Placebo (N = 117) | Guselkumab regimen 1 (N = 115) | Guselkumab regimen 2 (N = 115) |
|---|---|---|---|
Age (years), mean (SD) | 36.0 (12.71) | 37.4 (13.32) | 39.1 (12.56) |
Sex, n (%) | |||
Male | 67 (57.3) | 66 (57.4) | 70 (60.9) |
Female | 50 (42.7) | 49 (42.6) | 45 (39.1) |
Race, n (%) | |||
American Indian or Alaska Native | 0 (0) | 0 (0) | 0 (0) |
Asian | 28 (23.9) | 26 (22.6) | 22 (19.1) |
Black or African American | 5 (4.3) | 0 (0) | 4 (3.5) |
Native Hawaiian or other Pacific Islander | 0 (0) | 0 (0) | 0 (0) |
White | 71 (60.7) | 79 (68.7) | 79 (68.7) |
Not reported | 13 (11.1) | 10 (8.7) | 10 (8.7) |
Region, n (%) | |||
Asia | 28 (23.9) | 24 (20.9) | 22 (19.1) |
Eastern Europe | 41 (35.0) | 47 (40.9) | 50 (43.5) |
North America | 8 (6.8) | 5 (4.3) | 17 (14.8) |
Rest of world | 40 (34.2) | 39 (33.9) | 26 (22.6) |
CD characteristics | |||
CD duration (years), mean (SD) | 6.96 (7.75) | 9.17 (9.08) | 7.89 (7.13) |
CDAI score, mean (SD) | 293.0 (49.09) | 300.4 (54.32) | 297.3 (54.69) |
SF count ≥ 4, n (%) | 79 (67.5) | 89 (77.4) | 80 (69.6) |
AP score ≥ 2, n (%) | 96 (82.1) | 93 (80.9) | 85 (73.9) |
SF count ≥ 4 and AP score ≥ 2, n (%) | 60 (51.3) | 67 (58.3) | 53 (46.1) |
SES-CD score, mean (SD) | 12.0 (6.89) | 12.2 (6.85) | 11.8 (7.12) |
Endoscopic disease severity per SES-CD score, n (%) | |||
< 7 | 31 (26.5) | 25 (21.7) | 39 (33.9) |
7 to 16 | 61 (52.1) | 64 (55.7) | 49 (42.6) |
> 16 | 25 (21.4) | 26 (22.6) | 27 (23.5) |
CRP concentration (mg/L), mean (SD) | 13.5 (20.30) | 11.5 (15.89) | 14.9 (28.79) |
Fecal calprotectin (mcg/g), mean (SD) | 1,322.4 (1,678.86) | 1,141.3 (1,412.56) | 1,441.4 (2,280.23) |
IBDQ, mean (SD) | 125.0 (35.60) | 123.9 (31.95) | 118.6 (30.04) |
Involved GI areas by central reader, n (%) | |||
Ileum only | 22 (18.8) | 25 (21.7) | 27 (23.5) |
Colon only | 40 (34.2) | 41 (35.7) | 40 (34.8) |
Ileum and colon | 55 (47.0) | 49 (42.6) | 48 (41.7) |
Biologic medication history, n (%) | |||
Patients without a history of biologic failure | 64 (54.7) | 60 (52.2) | 62 (53.9) |
No prior exposure to biologics | 56 (47.9) | 53 (46.1) | 52 (45.2) |
Prior exposure to biologics but no documented biologic failure | 8 (6.8) | 7 (6.1) | 10 (8.7) |
Patients with a history of biologic failure | 53 (45.3) | 55 (47.8) | 53 (46.1) |
Primary or secondary nonresponse or intolerance to treatment, n (%) | |||
> 1 anti-TNF | 50 (42.7) | 51 (44.3) | 52 (45.2) |
≥ 2 anti-TNFs | 11 (9.4) | 12 (10.4) | 13 (11.3) |
Anti-TNF only | 45 (38.5) | 42 (36.5) | 47 (40.9) |
Vedolizumab | 8 (6.8) | 13 (11.3) | 6 (5.2) |
Vedolizumab only | 3 (2.6) | 4 (3.5) | 1 (0.9) |
Vedolizumab and ≥ 1 anti-TNF | 5 (4.3) | 9 (7.8) | 5 (4.3) |
Anti-TNF = anti–tumour necrosis factor; AP = abdominal pain; BIO-Failure = biologic therapy failure or intolerance; CD = Crohn disease; CDAI = Crohn’s Disease Activity Index; CRP = C-reactive protein; FAS = full analysis set; GI = gastrointestinal; IBDQ = Inflammatory Bowel Disease Questionnaire; SC = subcutaneous; SD = standard deviation; SES-CD = Simple Endoscopic Score for Crohn’s Disease; SF = stool frequency.
Note: Guselkumab regimen 1 = 400 mg SC at week 0, week 4, and week 8, followed by guselkumab 100 mg SC every 8 weeks. Guselkumab regimen 2 = 400 mg SC at week 0, week 4, and week 8, followed by guselkumab 200 mg SC every 4 weeks.
Sources: Clinical Study Report for the GRAVITI trial.14 Details included in the table are from the sponsor’s Summary of Clinical Evidence.
Exposure to Study Treatments
Details of exposure to study treatments of the GALAXI 2, GALAXI 3, and GRAVITI trials are summarized in Table 18, Table 19, and Table 20, respectively.
GALAXI 2 Study
In the PAS, all patients received at least 1 dose of study intervention during the IV induction period. During the maintenance period, missed SC treatment doses were reported in 2 (2.6%) patients in the placebo group, 2 (4.1%) patients in the placebo-to-ustekinumab crossover group, 12 (8.4%) patients in the guselkumab regimen 1 group, 4 (2.7%) patients in the guselkumab regimen 2 group, and 7 (4.9%) patients in the ustekinumab group. The main reasons for missed administrations were COVID-19–related disruptions and treatment discontinuation.
GALAXI 3 Study
In the PAS, all patients received the study intervention to which they were randomized during the IV induction period. During the maintenance phase, missed SC treatment doses were reported in 8 (11.1%) patients in the placebo group, 3 (6.1%) patients in the placebo-to-ustekinumab crossover group, 12 (8.4%) patients in the guselkumab regimen 1 group, 13 (8.7%) patients in the guselkumab regimen 2 group, and 10 (6.8%) patients in the ustekinumab group. The main reasons for missed administrations were COVID-19–related disruptions and treatment discontinuation.
GRAVITI Study
In the SAS, all patients received the study intervention to which they were randomized during the IV induction period. During the maintenance period, missed SC treatment doses were reported in 6 (5.1%) patients in the placebo group, 3 (6.8%) patients in the placebo-to-ustekinumab crossover group, and 2 (1.7%) patients in each of the guselkumab regimen 1 and regimen 2 groups. The main reasons for missed administrations were COVID-19–related disruptions and treatment discontinuation.
Table 18: Summary of Patient Exposure From GALAXI 2 Study — PAS, IV Induction and SC Maintenance
Exposure | GALAXI 2 study | ||||
|---|---|---|---|---|---|
Placeboa N = 76 | Placebo to ustekinumabb N = 49 | Guselkumab regimen 1 N = 143 | Guselkumab regimen 2 N = 146 | Ustekinumab N = 143 | |
Cumulative IV dosec | |||||
Number of administrations received, mean (SD) | — | — | 3.0 (0.1) | 3.0 (0.1) | 1.0 (0.0) |
Cumulative dose (mg), mean (SD) | — | — | 605.6 (88.6) | 604.1 (86.2) | 376.4 (79.7) |
Cumulative SC dose through week 44d | |||||
Number of patients contributing to the analysis, n | — | — | 141 | 144 | 142 |
Number of administrations received, mean (SD) | — | — | 3.8 (0.6) | 8.8 (1.0) | 4.6 (1.0) |
Cumulative dose (mg), mean (SD) | — | — | 378.0 (65.6) | 1,761.1 (199.7) | 415.1 (88.9) |
Number of patients who had missed study drug administration due to any reason, n (%)e | 2 (2.6) | 2 (4.1) | 12 (8.4) | 4 (2.7) | 7 (4.9) |
Due to COVID-19 | 0 (0) | 1 (2.0) | 0 (0) | 1 (0.7) | 0 (0) |
Due to other major disruption | 0 (0) | 0 (0) | 1 (0.7) | 0 (0) | 0 (0) |
PAS = primary analysis set; SC = subcutaneous; SD = standard deviation.
Note: Guselkumab regimen 1 (low dose) = 200 mg IV every 4 weeks, followed by 100 mg SC every 8 weeks. Guselkumab regimen 2 (high dose) = 200 mg IV every 4 weeks, followed by 200 mg SC every 4 weeks.
aMissed events in this column are attributed to those patients randomized to placebo with 1 exception: in the case where a patient is randomized to placebo and crosses over to ustekinumab, missed events occurring after receiving ustekinumab are not counted in this column.
bPatients who were not in clinical response to placebo induction dosing and crossed over to ustekinumab at week 12 and continued to receive ustekinumab SC dosing in the maintenance period. Missed events counted in this group occurred after the patient had switched to the ustekinumab treatment group.
cPatients randomized to guselkumab received IV dosing at weeks 0, 4, and 8. Patients randomized to ustekinumab received an IV dosing at week 0.
dPatients randomized to guselkumab regimen 1 received guselkumab SC at weeks 16, 24, 32, and 40. Patients randomized to guselkumab regimen 2 received guselkumab SC at weeks 12, 16, 20, 24, 28, 32, 36, 40, and 44. Patients randomized to ustekinumab received an SC dosing of ustekinumab at weeks 8, 16, 24, 32, and 40.
eMissed study intervention administration may include those due to treatment discontinuation.
Sources: Clinical Study Report for the GALAXI 2 trial.12 Details included in the table are from the sponsor’s Summary of Clinical Evidence.
Table 19: Summary of Patient Exposure From GALAXI 3 Study — PAS, IV Induction and SC Maintenance
Exposure | GALAXI 3 study | ||||
|---|---|---|---|---|---|
Placeboa N = 76 | Placebo to ustekinumabb N = 49 | Guselkumab regimen 1 N = 143 | Guselkumab regimen 2 N = 146 | Ustekinumab N = 143 | |
Cumulative IV dosec | |||||
Number of administrations received, mean (SD) | — | — | 2.9 (0.32) | 3.0 (0.26) | 1.0 (0.00) |
Cumulative dose (mg), mean (SD) | — | — | 601.4 (135.3) | 600.0 (98.3) | 386.5 (87.0) |
Cumulative SC dose through week 44d | |||||
Number of patients contributing to the analysis | — | — | 131 | 140 | 142 |
Number of administrations received, mean (SD) | — | — | 3.8 (0.60) | 8.5 (1.5) | 4.6 (1.0) |
Cumulative dose (mg), mean (SD) | — | — | 383.2 (61.0) | 1,690.7 (308.4) | 412.0 (94.9) |
Patients who had missed study drug administration due to any reason, n (%)e | 8 (11.1) | 3 (6.1) | 12 (8.4) | 13 (8.7) | 10 (6.8) |
Due to COVID-19 | 2 (2.8) | 1 (2.0) | 4 (2.8) | 2 (1.3) | 1 (0.7) |
Due to other major disruption | 0 | 2 (1.4) | 0 | 0 | 1 (0.7) |
PAS = primary analysis set; SC = subcutaneous; SD = standard deviation.
Note: Guselkumab regimen 1 equals 200 mg IV every 4 weeks, followed by 100 mg SC every 8 weeks. Guselkumab regimen 2 equals 200 mg IV every 4 weeks, followed by 200 mg SC every 4 weeks.
aMissed events in this column are attributed to those patients randomized to placebo with 1 exception: in the case where a patient is randomized to placebo and crosses over to ustekinumab, missed events occurring after receiving ustekinumab are not counted in this column.
bPatients who were not in clinical response to placebo induction dosing and crossed over to ustekinumab at week 12 and continued to receive ustekinumab SC dosing in the maintenance period. Missed events counted in this group occurred after the patient had switched to the ustekinumab treatment group.
cPatients randomized to guselkumab received IV dosing at weeks 0, 4, and 8. Patients randomized to ustekinumab received an IV dosing at week 0.
dPatients randomized to guselkumab regimen 1 received guselkumab SC at weeks 16, 24, 32, and 40. Patients randomized to guselkumab regimen 2 received guselkumab SC at weeks 12, 16, 20, 24, 28, 32, 36, 40, and 44. Patients randomized to ustekinumab received an SC dosing of ustekinumab at weeks 8, 16, 24, 32, and 40.
eMissed study drug administration may include those due to treatment discontinuation.
Sources: Clinical Study Report for the GALAXI 3 trial.13 Details included in the table are from the sponsor’s Summary of Clinical Evidence.
Table 20: Summary of Patient Exposure From GRAVITI Trial — SAS, SC Induction and SC Maintenance
Exposurea | GRAVITI study | |||
|---|---|---|---|---|
Placebob N = 117 | Placebo followed by guselkumabc N = 44 | Guselkumab regimen 1d N = 115 | Guselkumab regimen 2 N = 115 | |
Number of administrations received, mean (SD) | 7.1 (4.04) | 4.7 (0.9) | 6.8 (0.8) | 11.8 (1.3) |
Cumulative dose (mg), mean (SD) | 0 (0) | 1,338.6 (185.8) | 1,575.7 (79.0) | 2,953.0 (284.5) |
Patients who had missed study drug administration due to any reason, n (%)e | 6 (5.1) | 3 (6.8) | 2 (1.7) | 2 (1.7) |
Due to COVID-19, n (%) | 1 (0.9) | 0 (0) | 0 (0) | 0 (0) |
FAS = full analysis set; SAS = safety analysis set; SC = subcutaneous; SD = standard deviation.
Note: Guselkumab regimen 1 (low dose) = 400 mg SC at weeks 0, 4, and 8, followed by guselkumab 100 mg SC every 8 weeks. Guselkumab regimen 2 (high dose) = 400 mg SC at weeks 0, 4, and 8, followed by guselkumab 200 mg SC every 4 weeks.
aCompliance data are specific to the FAS with 13 (3.7%) patients of the 347 patients having missed study drug administration: placebo at 6 (5.1%) patients, placebo followed by guselkumab at 3 (6.8%) patients, guselkumab regimen 1 at 2 (1.7%) patients, and guselkumab regimen 2 at 2 (1.7%) patients.
bIncludes data from all placebo patients, excluding data after a patient is rescued with guselkumab.
cIncludes data from placebo patients who were rescued with guselkumab. Data in this group occurred after a patient crossed over to guselkumab.
dIf more than 1 injection was given at a study visit, it was counted as 1 study drug administration.
Sources: Clinical Study Report for the GRAVITI trial.14 Details included in the table are from the sponsor’s Summary of Clinical Evidence.
Concomitant Medications and Cointerventions
The proportion of patients using concomitant medications for CD in the GALAXI 2, GALAXI 3, and GRAVITI studies are presented in Table 21, Table 22, and Table 23, respectively.
GALAXI 2 Study
The proportion of patients who received concomitant medications for CD was lower in the placebo group (61.8%) compared with the guselkumab regimen 1 group (74.1%), the guselkumab regimen 2 group (74.0%), and the ustekinumab group (76.2%). Notably, a lower proportion of patients in the placebo group received 6-mercaptopurine or azathioprine (23.7%), oral aminosalicylates (30.3%), and oral corticosteroids (32.9%) compared with the corresponding ranges in the other treatment groups: 27.3% to 30.8% for 6-mercaptopurine or azathioprine, 41.8% to 44.8% for oral aminosalicylates, and 37.7% to 39.2% for oral corticosteroids. The mean dose of corticosteroids (excluding budesonide) in the overall population was 17.8 mg, and the mean budesonide dose was 8.0 mg; both were comparable across treatment groups.
GALAXI 3 Study
In the GALAXI 3 trial, the proportion of patients who received concomitant medications for CD was comparable across the treatment groups. A higher proportion of patients in the guselkumab regimen 2 group received immunomodulators (34.0%) compared with the other treatment groups (ranging from 26.4% to 30.8%). Conversely, a lower proportion of patients in the placebo group received oral aminosalicylates (29.2%) compared with the other treatment groups (ranging from 36.7% to 41.3%). The mean dose of corticosteroids (excluding budesonide) was 19.9 mg in the overall population, and the mean dose of budesonide was 7.8 mg; both were comparable across treatment groups.
GRAVITI Study
The proportion of patients who received concomitant medications for CD was lower in the guselkumab regimen 1 group (64.3%) compared with the placebo group (67.5%) and the guselkumab regimen 2 group (73.0%).
A higher proportion of patients in the guselkumab regimen 2 group received corticosteroids (24.3%) compared with the placebo group (15.4%) and the guselkumab regimen 1 group (13.0%). Conversely, a lower proportion of patients in the guselkumab regimen 2 group received budesonide (8.7%) compared with the placebo group (12.8%) and the guselkumab regimen 1 group (14.8%). The mean dose of corticosteroids (excluding budesonide) was 19.7 mg in the overall population, and the mean dose of budesonide was 7.8 mg; both were comparable across treatment groups.
Table 21: Summary of Concomitant Medications for Crohn Disease at Baseline in GALAXI 2 Study — PAS, IV Induction and SC Maintenance
Concomitant medication | GALAXI 2 study | |||
|---|---|---|---|---|
Placebo N = 76 | Guselkumab regimen 1 N = 143 | Guselkumab regimen 2 N = 146 | Ustekinumab N = 143 | |
Patients with ≥ 1 concomitant medication for CD, n (%) | 47 (61.8) | 106 (74.1) | 108 (74.0) | 109 (76.2) |
Immunomodulatory drugs, n (%) | 21 (27.6) | 43 (30.1) | 46 (31.5) | 42 (29.4) |
6-mercaptopurine or azathioprine | 18 (23.7) | 43 (30.1) | 45 (30.8) | 39 (27.3) |
Methotrexate | 3 (3.9) | 0 (0) | 1 (0.7) | 3 (2.1) |
Oral aminosalicylates, n (%) | 23 (30.3) | 62 (43.4) | 61 (41.8) | 64 (44.8) |
Antibiotics, n (%) | 4 (5.3) | 6 (4.2) | 12 (8.2) | 6 (4.2) |
Oral corticosteroid use, n (%) | 25 (32.9) | 54 (37.8) | 55 (37.7) | 56 (39.2) |
Corticosteroid use,a n (%) | 17 (22.4) | 39 (27.3) | 33 (22.6) | 38 (26.6) |
Dose (mg), mean (SD) | 18.2 (8.6) | 17.5 (9.6) | 18.7 (9.5) | 17.1 (8.3) |
Budesonide, n (%) | 8 (10.5) | 17 (11.9) | 22 (15.1) | 18 (12.6) |
Dose (mg), mean (SD) | 7.5 (2.3) | 8.5 (1.6) | 7.6 (2.3) | 8.3 (1.3) |
CD = Crohn disease; PAS = primary analysis set; SC = subcutaneous; SD = standard deviation.
Note: Guselkumab regimen 1 (low dose) = 200 mg IV every 4 weeks, followed by 100 mg SC every 8 weeks. Guselkumab regimen 2 (high dose) = 200 mg IV every 4 weeks, followed by 200 mg SC every 4 weeks. Ustekinumab treatment = approximately 6 mg/kg IV, followed by 90 mg SC every 8 weeks.
aExcluding budesonide.
Sources: Clinical Study Report for the GALAXI 2 trial.12 Details included in the table are from the sponsor’s Summary of Clinical Evidence.
Table 22: Summary of Concomitant Medications for Crohn Disease at Baseline in GALAXI 3 Study — PAS, IV Induction and SC Maintenance
Concomitant medication | GALAXI 3 study | |||
|---|---|---|---|---|
Placebo N = 72 | Guselkumab regimen 1 N = 143 | Guselkumab regimen 2 N = 150 | Ustekinumab N = 148 | |
Patients with ≥ 1 concomitant medication for CD, n (%) | 49 (68.1) | 101 (70.6) | 109 (72.7) | 101 (68.2) |
Immunomodulatory drugs, n (%) | 19 (26.4) | 44 (30.8) | 51 (34.0) | 41 (27.7) |
6-mercaptopurine or azathioprine | 18 (25.0) | 42 (29.4) | 44 (29.3) | 40 (27.0) |
Methotrexate | 1 (1.4) | 2 (1.4) | 6 (4.0) | 1 (0.7) |
Oral aminosalicylates, n (%) | 21 (29.2) | 59 (41.3) | 55 (36.7) | 55 (37.2) |
Antibiotics, n (%) | 3 (4.2) | 6 (4.2) | 6 (4.0) | 8 (5.4) |
Oral corticosteroid use, n (%) | 26 (36.1) | 55 (38.5) | 51 (34.0) | 53 (35.8) |
Corticosteroid use,a n (%) | 16 (22.2) | 36 (25.2) | 35 (23.3) | 35 (23.6) |
Dose (mg), mean (SD) | 22.3 (10.5) | 19.6 (9.96) | 21.0 (10.6) | 18.1 (9.3) |
Budesonide, n (%) | 10 (13.9) | 19 (13.3) | 16 (10.7) | 18 (12.2) |
Dose (mg), mean (SD) | 8.4 (1.26) | 7.9 (2.3) | 7.6 (2.3) | 7.5 (2.4) |
CD = Crohn disease; PAS = primary analysis set; SC = subcutaneous; SD = standard deviation.
Note: Guselkumab regimen 1 (low dose) = 200 mg IV every 4 weeks, followed by 100 mg SC every 8 weeks. Guselkumab regimen 2 (high dose) = 200 mg IV every 4 weeks, followed by 200 mg SC every 4 weeks.
aExcluding budesonide.
Sources: Clinical Study Report for the GALAXI 3 trial.13 Details included in the table are from the sponsor’s Summary of Clinical Evidence.
Table 23: Summary of Concomitant Medications for Crohn Disease at Baseline in GRAVITI Study — FAS, SC Induction and SC Maintenance
Concomitant medication | GRAVITI study | ||
|---|---|---|---|
Placebo N = 117 | Guselkumab regimen 1 N = 115 | Guselkumab regimen 2 N = 115 | |
Patients with ≥ 1 concomitant medication for CD, n (%) | 79 (67.5) | 74 (64.3) | 84 (73.0) |
Immunomodulatory drugs, n (%) | 33 (28.2) | 29 (25.2) | 37 (32.2) |
6-mercaptopurine or azathioprine | 32 (27.4) | 28 (24.3) | 36 (31.3) |
Methotrexate | 1 (0.9) | 1 (0.9) | 1 (0.9) |
Oral aminosalicylates, n (%) | 50 (42.7) | 47 (40.9) | 44 (38.3) |
Antibiotics, n (%) | 3 (2.6) | 3 (2.6) | 8 (7.0) |
Oral corticosteroid use, n (%) | 33 (28.2) | 32 (27.8) | 38 (33.0) |
Corticosteroid use,a n (%) | 18 (15.4) | 15 (13.0) | 28 (24.3) |
Dose (mg), mean (SD) | 20.0 (9.5) | 21.0 (13.1) | 18.8 (11.8) |
Budesonide, n (%) | 15 (12.8) | 17 (14.8) | 10 (8.7) |
Dose (mg), mean (SD) | 7.4 (2.5) | 7.9 (2.1) | 8.1 (1.4) |
CD = Crohn disease; FAS = full analysis set; SC = subcutaneous; SD = standard deviation.
Note: Guselkumab SC regimen 1 (low dose) = guselkumab 400 mg SC every 4 weeks, followed by 100 mg SC every 8 weeks. Guselkumab SC regimen 2 (high dose) = guselkumab 400 SC every 4 weeks, followed by 200 mg SC every 4 weeks.
aExcluding budesonide.
Sources: Clinical Study Report for the GRAVITI trial.14 Details included in the table are from the sponsor’s Summary of Clinical Evidence.
Efficacy
A summary of the key efficacy results for the GALAXI 2, GALAXI 3, and GRAVITI trials is presented in Table 24, Table 25, Table 26, and Table 27. For the GALAXI trials, the efficacy outcomes were analyzed in the PAS whereas for the GRAVITI trial, the analysis was conducted using the FAS.
Summary of Efficacy Outcomes (Guselkumab Versus Placebo)
Clinical Response at Week 12 and Clinical Remission at Week 48
GALAXI 2 and GALAXI 3 Studies (IV Induction and SC Maintenance)
In both GALAXI trials, the composite coprimary end point of clinical response at week 12 and clinical remission at week 48 favoured both guselkumab regimens versus placebo. In the GALAXI 2 trial, the adjusted between-group difference compared to placebo was 38.1% (CI 95%, 27.3% to 48.9%; P value < 0.001) for guselkumab regimen 1 (low dose) and 42.8% (CI 95%, 31.6% to 53.9%; P value < 0.001) for guselkumab regimen 2 (high dose). In the GALAXI 3 trial, the adjusted between-group difference compared to placebo was 34.2% (CI 95%, 23.2% to 45.3%; P value < 0.001) for guselkumab regimen 1 and 35.0% (CI 95%, 23.5% to 46.5%; P value < 0.001) for guselkumab regimen 2. Sensitivity and supportive analyses were consistent with the primary analyses in both trials. Findings from the post hoc subgroup analyses of pooled GALAXI 2 and GALAXI 3 trial data for this end point were consistent with the primary analyses across BIO-Failure and CON-Failure analysis subpopulations.39
Clinical Response at Week 12 and Endoscopic Response at Week 48
GALAXI 2 and GALAXI 3 Studies (IV Induction and SC Maintenance)
In both trials, the composite coprimary end point of clinical response at week 12 and endoscopic response at week 48 favoured both guselkumab regimens versus placebo. In the GALAXI 2 trial, the adjusted between-group difference compared to placebo was 33.7% (95% CI, 24.1% to 43.2%; P value < 0.001) for guselkumab regimen 1 and 32.9% (95% CI, 23.5% to 42.4%; P value < 0.001) for guselkumab regimen 2. In the GALAXI 3 trial, the adjusted between-group difference compared to placebo was 27.9% (95% CI, 18.7% to 37.1%; P value < 0.001) for guselkumab regimen 1 and 30.8% (95% CI, 21.3% to 40.3%; P value < 0.001) for guselkumab regimen 2. Sensitivity and supportive analyses were consistent with the primary analyses in both trials. Findings from the post hoc subgroup analyses of pooled GALAXI 2 and GALAXI 3 trial data for this end point were consistent with those of the primary analyses across BIO-Failure and CON-Failure analysis subpopulations.39
Clinical Response at Week 12 and 90-Day, Corticosteroid-Free Clinical Remission at Week 48
GALAXI 2 and GALAXI 3 Studies (IV Induction and SC Maintenance)
In both trials, the composite secondary end point of clinical response at week 12 and 90-day, corticosteroid-free clinical remission at week 48 favoured both guselkumab regimens versus placebo. In the GALAXI 2 trial, the adjusted between-group difference compared to placebo was 38.7% (95% CI, 28.4% to 48.9%; P value < 0.001) for guselkumab regimen 1 and 41.3% (95% CI, 30.6% to 52.0%; P value < 0.001) for guselkumab regimen 2. In the GALAXI 3 trial, the adjusted between-group difference compared to placebo was 32.6% (95% CI, 21.7% to 43.6%; P value < 0.001) for guselkumab regimen 1 and 31.5% (95% CI, 20.1% to 42.8%; P value < 0.001) for guselkumab regimen 2.
Clinical Response at Week 12 and Endoscopic Remission at Week 48
GALAXI 2 and GALAXI 3 Studies (IV Induction and SC Maintenance)
In both trials, the composite secondary end point of clinical response at week 12 and endoscopic remission at week 48 favoured both guselkumab regimens versus placebo. In the GALAXI 2 trial, the adjusted between-group difference compared to placebo was 24.0% (95% CI, 15.8% to 32.2%; P value < 0.001) for guselkumab regimen 1 and 30.0% (95% CI, 21.4% to 38.5%; P value < 0.001) for guselkumab regimen 2. In the GALAXI 3 trial, the adjusted between-group difference compared to placebo was 18.2% (95% CI, 9.5% to 26.9%; P value < 0.001) for guselkumab regimen 1 and 16.7% (95% CI, 8.0% to 25.4%; P value < 0.001) for guselkumab regimen 2.
Clinical Remission at Week 12
GALAXI 2 and GALAXI 3 Studies (IV Induction and SC Maintenance) and GRAVITI Study (SC Induction and SC Maintenance)
At week 12, the secondary end point of clinical remission favoured guselkumab over placebo in both the GALAXI 2 and GALAXI 3 trials. In the GALAXI 2 trial, the combined guselkumab induction dose group showed an adjusted between-group difference of 27.6% compared to placebo (95% CI, 14.1% to 36.2%; P value < 0.001). In the GALAXI 3 trial, the combined guselkumab induction dose group demonstrated an adjusted between-group difference of 31.2% (95% CI, 21.1% to 41.3%; P value < 0.001) compared to placebo.
At week 12, the coprimary end point of clinical remission favoured guselkumab over placebo in the GRAVITI trial. The combined guselkumab induction dose group demonstrated an adjusted between-group difference of 34.9% (95% CI, 25.1% to 44.6%; P value < 0.001) compared to placebo. Sensitivity and subgroup analyses were consistent with the primary analyses in the GRAVITI trial.
Clinical Remission at Week 48
GRAVITI Study (SC Induction and SC Maintenance)
At week 48, the secondary end point of clinical remission favoured both guselkumab regimens over placebo in the GRAVITI trial. The adjusted between-group difference compared to placebo was 42.8% (95% CI, 31.6% to 54.0%; P value < 0.001) for guselkumab regimen 1 and 48.9% (95% CI, 37.9% to 59.9%; P value < 0.001) for guselkumab regimen 2.
Endoscopic Response at Week 12
GALAXI 2 and GALAXI 3 Studies (IV Induction and SC Maintenance) and GRAVITI Study (SC Induction and SC Maintenance)
At week 12, the secondary end point of endoscopic response favoured both guselkumab regimens over placebo in all 3 trials. In the GALAXI 2 trial, the combined guselkumab induction dose group showed an adjusted between-group difference of 27.7% (95% CI, 19.3% to 36.1%; P value < 0.001) compared to placebo. In the GALAXI 3 trial, the combined guselkumab induction dose group demonstrated an adjusted between-group difference of 22.1% (95% CI, 12.2% to 31.9%; P value < 0.001) compared to placebo.
At week 12, the coprimary end point of endoscopic response favoured guselkumab over placebo in the GRAVITI trial. The combined guselkumab induction dose group demonstrated an adjusted between-group difference of 19.9% compared to placebo (95% CI, 10.2% to 29.6%; P value < 0.001). Sensitivity and subgroup analyses were consistent with the primary analyses in the GRAVITI trial.
Endoscopic Response at Week 48
GRAVITI Study (SC Induction and SC Maintenance)
At week 48, the end point of endoscopic response favoured both guselkumab regimens over placebo in the GRAVITI trial. The adjusted between-group difference compared to placebo was 37.5% (95% CI, 27.3% to 47.7%; P value < 0.001) for guselkumab regimen 1 and 44.6% (95% CI, 34.1% to 55.0%; P value < 0.001) for guselkumab regimen 2.
Endoscopic Remission at Week 48
GRAVITI Study (SC Induction and SC Maintenance)
At week 48, the end point of endoscopic remission favoured both guselkumab regimens over placebo in the GRAVITI trial. The adjusted between-group difference compared to placebo was 37.5% (95% CI, 27.3% to 47.7%; P value < 0.001) for guselkumab regimen 1 and 44.6% (95% CI, 34.1% to 55.0%; P value < 0.001) for guselkumab regimen 2.
Clinical Response at Week 12
GRAVITI Study (SC Induction and SC Maintenance)
At week 12, the secondary end point of clinical response favoured the guselkumab regimens over placebo in the GRAVITI trial. The combined guselkumab induction dose group demonstrated an adjusted between-group difference of 40.3% compared to placebo (95% CI, 29.9% to 50.7%; P value < 0.001).
Deep Remission at Week 48
GRAVITI Study (SC Induction and SC Maintenance)
Deep remission at week 48 was an exploratory end point in the GRAVITI trial. The adjusted between-group difference compared to placebo was 21.8% (95% CI, 13.1% to 30.6%; P value < 0.001) for guselkumab regimen 1 and 29.8% (95% CI, 20.5% to 39.2%; P value < 0.001) for guselkumab regimen 2.
Patient-Reported Outcomes
Patient-reported end points, including IBDQ remission and PRO-2 remission, were considered exploratory in the GALAXI and GRAVITI trials.
IBDQ Remission at Week 12
GALAXI 2 and GALAXI 3 Studies (IV Induction and SC Maintenance) and GRAVITI Study (SC Induction and SC Maintenance)
In the GALAXI 2 trial, the adjusted between-group difference compared to placebo was 19.1% (95% CI, 6.7% to 31.5%; P value = 0.003) for guselkumab regimen 1 and 10.5% (95% CI, –2.3% to 23.2%; P value = 0.108) for guselkumab regimen 2. In the GALAXI 3 trial, the adjusted between-group difference compared to placebo was 23.7% (95% CI, 11.1% to 36.4%; P value < 0.001) for guselkumab regimen 1 and 16.5% (95% CI, 3.0% to 30.1%; P value = 0.017) for guselkumab regimen 2.
In the GRAVITI trial, the adjusted between-group difference compared to placebo was 29.2% (95% CI, 17.4% to 41.0%; P value < 0.001) for guselkumab regimen 1 and 20.8% (95% CI; 9.2% to 32.4%; P value < 0.001) for guselkumab regimen 2.
IBDQ Remission at Week 48
GRAVITI Study (SC Induction and SC Maintenance)
The adjusted between-group difference compared to placebo was 36.6% (95% CI, 25.4% to 47.8%; P value < 0.001) for guselkumab regimen 1 and 30.7% (95% CI, 19.2% to 42.1%; P value < 0.001) for guselkumab regimen 2.
PRO-2 Remission at Week 12 and Week 48
GRAVITI Study (SC Induction and SC Maintenance)
At week 48, the adjusted between-group difference compared to placebo was 41.1% (95% CI, 30.1% to 52.1%; P value < 0.001) for guselkumab regimen 1 and 53.2% (95% CI, 42.6% to 63.7%; P value < 0.001) for guselkumab regimen 2.
Summary of Efficacy Outcomes (Guselkumab Versus Ustekinumab)
GALAXI 2 and GALAXI 3 Studies (IV Induction and SC Maintenance)
Clinical Remission at Week 48 and Endoscopic Response at Week 48
Following the pooling of data from the GALAXI 2 and GALAXI 3 trials, the adjusted between-group differences compared to ustekinumab were 7.8% (95% CI, 0.1% to 15.6%; P value = 0.049) for guselkumab regimen 1 and 13.6% (95% CI, 5.9% to 21.3%; P value < 0.001) for guselkumab regimen 2. Comparisons from the individual GALAXI 2 and GALAXI 3 trials were not formally tested due to the failure of the statistical testing hierarchy at tier 3 (i.e., pooled analysis of guselkumab versus ustekinumab for clinical remission at week 48). In the GALAXI 2 trial, the adjusted between-group difference compared to ustekinumab was 2.8% (95% CI, –0.6% to 21.0%; P value = 0.620) for guselkumab regimen 1 and 10.2% (95% CI, –0.6% to 21.0%; P value = 0.065) for guselkumab regimen 2. In the GALAXI 3 trial, the adjusted between-group difference compared to ustekinumab was 12.7% (95% CI, 1.7% to 23.7%; P value = 0.024) for guselkumab regimen 1 and 16.9% (95% CI, 5.8% to 27.9%; P value = 0.003) for guselkumab regimen 2.
Clinical Remission at Week 48
Following the pooling of data from the GALAXI 2 and GALAXI 3 trials, the adjusted between-group differences compared to ustekinumab were 2.6% (95% CI, –5.1% to 10.2%; P value = 0.512) for guselkumab regimen 1 and 7.3% (95% CI, –0.2% to 14.8%; P value = 0.058) for guselkumab regimen 2. Comparisons from the individual GALAXI 2 and GALAXI 3 trials were not formally tested due to the failure of the statistical testing hierarchy on this end point. In the GALAXI 2 trial, the adjusted between-group difference compared to ustekinumab was –0.6% (95% CI, –11.6% to 10.5%; P value = 0.920) for guselkumab regimen 1 and 9.5% (95% CI, –0.7% to 19.8%; P value = 0.069) for guselkumab regimen 2. In the GALAXI 3 trial, the adjusted between-group difference compared to ustekinumab was 5.6% (95% CI, –5.2% to 16.5%; P value = 0.308) for guselkumab regimen 1 and 5.0% (95% CI, –6.1% to 16.1%; P value = 0.378) for guselkumab regimen 2.
Endoscopic Response at Week 48
Following the pooling of data from the GALAXI 2 and GALAXI 3 trials, the adjusted between-group differences compared to ustekinumab were 10.6% (95% CI, 2.7% to 18.5%; P = 0.009) for guselkumab regimen 1 and 15.6% (95% CI, 7.9% to 23.4%; P < 0.001) for guselkumab regimen 2. Comparisons from the individual GALAXI 2 and GALAXI 3 trials were not formally tested due to the failure of the statistical testing hierarchy. In the GALAXI 2 trial, the adjusted between-group difference compared to ustekinumab was 7.0% (95% CI, –4.4% to 18.3%; P value = 0.230) for guselkumab regimen 1 and 14.5% (95% CI, 3.6% to 25.4%; P value = 0.009) for guselkumab regimen 2. In the GALAXI 3 trial, the adjusted between-group difference compared to ustekinumab was 14.1% (95% CI, 2.9% to 25.2%; P value = 0.013) for guselkumab regimen 1 and 16.8% (95% CI, 5.7% to 28.0%; P value = 0.003) for guselkumab regimen 2.
Endoscopic Remission at Week 48
Following the pooling of data from the GALAXI 2 and GALAXI 3 trials, the adjusted between-group differences compared to ustekinumab were 8.5% (95% CI, 1.1% to 15.9%; P = 0.024) for guselkumab regimen 1 and 12.3% (95% CI, 4.9% to 19.7%; P = 0.001) for guselkumab regimen 2. Comparisons from the individual GALAXI 2 and GALAXI 3 trials were not formally tested due to the failure of the statistical testing hierarchy. In the GALAXI 2 trial, the adjusted between-group treatment difference compared to ustekinumab was 6.4% (95% CI, –4.3% to 17.1%; P value = 0.239) for guselkumab regimen 1 and 17.9% (95% CI, 7.3% to 28.4%; P value < 0.001) for guselkumab regimen 2. In the GALAXI 3 trial, the adjusted between-group difference compared to ustekinumab was 10.5% (95% CI, 0.1% to 20.9%; P value = 0.048) for guselkumab regimen 1 and 6.9% (95% CI, –3.3% to 17.0%; P value = 0.183) for guselkumab regimen 2.
Deep Remission at Week 48
Following the pooling of data from the GALAXI 2 and GALAXI 3 trials, the adjusted between-group differences compared to ustekinumab were 7.4% (95% CI, 0.3% to 14.6%; P = 0.040) for guselkumab regimen 1 and 11.3% (95% CI, 4.2% to 18.5%; P = 0.002) for guselkumab regimen 2. Comparisons from the individual GALAXI 2 and GALAXI 3 trials were not formally tested due to the failure of the statistical testing hierarchy. In the GALAXI 2 trial, the adjusted between-group difference compared to ustekinumab was 4.2% (95% CI, –6.2% to 14.7%; P value = 0.426) for guselkumab regimen 1 and 13.0% (95% CI, 2.7% to 23.4%; P value = 0.014) for guselkumab regimen 2. In the GALAXI 3 trial, the adjusted between-group difference compared to ustekinumab was 10.4% (95% CI, 0.4% to 20.4%; P value = 0.041) for guselkumab regimen 1 and 9.6% (95% CI, –0.1% to 19.4%; P value = 0.052) for guselkumab regimen 2.
IBDQ Remission at Week 48
In the GALAXI 2 trial, the adjusted between-group difference compared to ustekinumab was 1.6% (95% CI, –9.9% to 13.2%; P value = 0.783) for guselkumab regimen 1 and 5.6% (95% CI, –5.5% to 16.7%; P value = 0.322) for guselkumab regimen 2. In the GALAXI 3 trial, the adjusted between-group difference compared to ustekinumab was 10.1% (95% CI, –1.2% to 21.5%; P value = 0.080) for guselkumab regimen 1 and 2.1% (95% CI, –9.4% to 13.6%; P value = 0.725) for guselkumab regimen 2.
Table 24: Key Efficacy Results From GALAXI 2 and GALAXI 3 Studies (IV Induction and SC Maintenance) — Guselkumab vs. Placebo, PAS
Characteristic | GALAXI 2 study | GALAXI 3 study | ||||||
|---|---|---|---|---|---|---|---|---|
Placebo N = 76 | Guselkumab regimen 1 IV induction and SC maintenance N = 143 | Guselkumab regimen 2 IV induction and SC maintenance N = 146 | Guselkumab combined IV induction and SC maintenance N = 289 | Placebo N = 72 | Guselkumab regimen 1 IV induction and SC maintenance N = 143 | Guselkumab regimen 2 IV induction and SC maintenance N = 150 | Guselkumab combined IV induction and SC maintenance N = 293 | |
Clinical responsea at week 12 and clinical remissionb at week 48 | ||||||||
n (%) | 9 (11.8) | 70 (49.0) | 80 (54.8) | 150 (51.9) | 9 (12.5) | 67 (46.9) | 72 (48.0) | 139 (47.4) |
Adjusted between-group difference, % (95% CI)c | Reference | 38.1 (27.3 to 48.9) | 42.8 (31.6 to 53.9) | 40.4 (31.0 to 49.7) | Reference | 34.2 (23.2 to 45.3) | 35.0 (23.5 to 46.5) | 34.4 (24.7 to 44.1) |
P valued | Reference | < 0.001 | < 0.001 | < 0.001 | Reference | < 0.001 | < 0.001 | < 0.001 |
Clinical responsea at week 12 and endoscopic responsee at week 48 | ||||||||
n (%) | 4 (5.3) | 56 (39.2) | 56 (38.4) | 112 (38.8) | 4 (5.6) | 48 (33.6) | 54 (36.0) | 102 (34.8) |
Adjusted between-group difference, % (95% CI)c | Reference | 33.7 (24.1 to 43.2) | 32.9 (23.5 to 42.4) | 33.4 (25.9 to 41.0) | Reference | 27.9 (18.7 to 37.1) | 30.8 (21.3 to 40.3) | 29.1 (21.5 to 36.7) |
P valued | Reference | < 0.001 | < 0.001 | < 0.001 | Reference | < 0.001 | < 0.001 | < 0.001 |
Clinical responsea at week 12 and 90-day, corticosteroid-free clinical remissionb at week 48 | ||||||||
n (%) | 7 (9.2) | 67 (46.9) | 74 (50.7) | 141 (48.8) | 9 (12.5) | 65 (45.5) | 67 (44.7) | 132 (45.1) |
Adjusted between-group difference, % (95% CI)c | Reference | 38.7 (28.4 to 48.9) | 41.3 (30.6 to 52.0) | 39.9 (31.2 to 48.6) | Reference | 32.6 (21.7 to 43.6) | 31.5 (20.1 to 42.8) | 31.8 (22.3 to 41.4) |
P valued | Reference | < 0.001 | < 0.001 | < 0.001 | Reference | < 0.001 | < 0.001 | < 0.001 |
Clinical responsea at week 12 and endoscopic remissionf at week 48 | ||||||||
n (%) | 2 (2.6) | 38 (26.6) | 48 (32.9) | 86 (29.8) | 4 (5.6) | 34 (23.8) | 34 (22.7) | 68 (23.2) |
Adjusted between-group difference, % (95% CI)c | Reference | 24.0 (15.8 to 32.2) | 30.0 (21.4 to 38.5) | 27.1 (20.6 to 33.6) | Reference | 18.2 (9.5 to 26.9) | 16.7 (8.0 to 25.4) | 17.3 (10.0 to 24.5) |
P valued | Reference | < 0.001 | < 0.001 | < 0.001 | Reference | < 0.001 | < 0.001 | < 0.001 |
Clinical remissionb at week 12 | ||||||||
n (%)c | 17 (22.4) | 63 (44.1) | 73 (50.0) | 136 (47.1) | 11 (15.3) | 70 (49.0) | 68 (45.3) | 138 (47.1) |
Adjusted between-group difference, % (95% CI)c | Reference | 22.4 (10.1 to 34.7) | 27.6 (14.9 to 40.2) | 25.1 (14.1 to 36.2) | Reference | 33.1 (21.3 to 45.0) | 29.6 (18.2 to 41.0) | 31.2 (21.1 to 41.3) |
P valuee | Reference | < 0.001 | < 0.001 | < 0.001 | Reference | < 0.001 | < 0.001 | < 0.001 |
Endoscopic responsee at week 12 | ||||||||
n (%)f | 8 (10.5) | 55 (38.5) | 54 (37.0) | 109 (37.7) | 10 (13.9) | 58 (40.6) | 48 (32.0) | 106 (36.2) |
Adjusted between-group difference, % (95% CI)d | Reference | 28.2 (17.8 to 38.7) | 27.5 (18.0 to 37.1) | 27.7 (19.3 to 36.1) | Reference | 26.5 (14.7 to 38.2) | 18.3 (7.3 to 29.2) | 22.1 (12.2 to 31.9) |
P valuee | Reference | < 0.001 | < 0.001 | < 0.001 | Reference | < 0.001 | < 0.001 | < 0.001 |
IBDQ remissiong at week 12 | ||||||||
n (%) | 23 (30.3) | 69 (48.3) | 60 (41.1) | 129 (44.6) | 20 (27.8) | 73 (51.0) | 67 (44.7) | 140 (47.8) |
Adjusted difference (95% CI)d | Reference | 19.1 (6.7 to 31.5) | 10.5 (–2.3 to 23.2) | 14.5 (3.1 to 25.8) | Reference | 23.7 (11.1 to 36.4) | 16.5 (3.0 to 30.1) | 19.7 (7.9 to 31.5) |
P valueh | Reference | 0.003 | 0.108 | 0.012 | Reference | < 0.001 | 0.017 | 0.001 |
AE = adverse event; AP = abdominal pain; BIO-Failure = biologic therapy failure or intolerance; CD = Crohn disease; CDAI = Crohn’s Disease Activity Index; CI = confidence interval; IBDQ = Inflammatory Bowel Disease Questionnaire; ICE = intercurrent event; PAS = primary analysis set; PRO-2 = patient-reported outcome 2; SC = subcutaneous; SES-CD = Simple Endoscopic Score for Crohn’s Disease; SF = stool frequency.
Notes: Guselkumab regimen 1 (low dose) = 200 mg IV every 4 weeks, followed by 100 mg SC every 8 weeks. Guselkumab regimen 2 (high dose) = 200 mg IV every 4 weeks, followed by 200 mg SC every 4 weeks.
ICE strategies: Patients who had a CD-related surgery (known as ICE category 1); had a prohibited change in concomitant CD medication, including patients in the placebo group in clinical response who crossed over to ustekinumab at week 12 (known as ICE category 2); discontinued the study drug due to a lack of efficacy, an AE of worsening CD, or week 20/24 nonresponse status (known as ICE category 3); or discontinued the study drug for any other reason other than COVID-19–related reasons or a regional crisis (known as ICE category 5) before the analysis time point were considered not to have met the end point criteria. Patients who had discontinued the study drug due to COVID-19–related reasons — excluding a COVID-19 infection — or a regional crisis (known as ICE category 4) had their observed data used, if available, to determine response status at week 12 and week 48.
Missing data imputation: After accounting for ICE strategies, patients who were missing a CDAI score at week 12 or a CDAI or SES-CD score at week 48 were considered not to have achieved the end point.
aClinical response was defined as ≥ 100-point reduction from baseline in the CDAI score or a CDAI score < 150.
bClinical remission was defined as a CDAI score < 150.
cThe adjusted treatment difference and the CIs were based on the common risk difference by use of Mantel-Haenszel stratum weights and the Sato variance estimator. The stratification variables used were the baseline CDAI score (≤ 300 or > 300), the baseline SES-CD score (≤ 12 or > 12), BIO-Failure status (yes or no), and baseline corticosteroid use (yes or no).
dP value was controlled for multiplicity.
eEndoscopic response was defined as ≥ 50% improvement from baseline in the SES-CD score or an SES-CD score ≤ 2.
fEndoscopic remission was defined as at least a 2-point reduction in the SES-CD score versus baseline and no subscore greater than 1 in any individual subcomponent.
gIBDQ remission was defined as an IBDQ total score ≥ 170.
hP value was not controlled for multiplicity.
Sources: Clinical Study Report for the GALAXI 2 trial,12 Clinical Study Report for the GALAXI 3 trial.13 Details included in the table are from the sponsor’s Summary of Clinical Evidence.
Table 25: Key Efficacy Results From GRAVITI Study (SC Induction and SC Maintenance) — Guselkumab vs. Placebo, FAS
Characteristic | GRAVITI study | |||
|---|---|---|---|---|
Placebo N = 117 | Guselkumab regimen 1 SC induction and SC maintenance N = 115 | Guselkumab regimen 2 SC induction and SC maintenance N = 115 | Combined guselkumab SC induction and SC maintenance N = 230 | |
Clinical remissiona at week 12 | ||||
n (%) | 25 (21.4) | NR | NR | 129 (56.1) |
Adjusted between-group difference, % (95% CI)b | Reference | NR | NR | 34.9 (25.1 to 44.6) |
P valuec | Reference | NR | NR | < 0.001 |
Clinical remissiona at week 48 | ||||
n (%) | 20 (17.1) | 69 (60.0) | 76 (66.1) | 145 (63.0) |
Adjusted between-group difference, % (95% CI)b | Reference | 42.8 (31.6 to 54.0) | 48.9 (37.9 to 59.9) | 45.9 (36.6 to 55.1) |
P valuec | Reference | < 0.001 | < 0.001 | < 0.001 |
Endoscopic responsed at week 12 | ||||
n (%) | 25 (21.4) | NR | NR | 95 (41.3) |
Adjusted between-group difference, % (95% CI)b | Reference | NR | NR | 19.9 (10.2 to 29.6) |
P valuec | Reference | NR | NR | < 0.001 |
Endoscopic responsee at week 48 | ||||
n (%) | 8 (6.8) | 51 (44.3) | 59 (51.3) | 110 (47.8) |
Adjusted between-group difference, % (95% CI)b | Reference | 37.5 (27.3 to 47.7) | 44.6 (34.1 to 55.0) | 40.9 (32.9 to 48.9) |
P valuec | Reference | < 0.001 | < 0.001 | < 0.001 |
Endoscopic remission at week 48 | ||||
n (%) | 7 (6.0) | 35 (30.4) | 44 (38.3) | 79 (34.3) |
Adjusted between-group difference, % (95% CI)b | Reference | 24.5 (15.2 to 33.9) | 32.4 (22.6 to 42.3) | 28.4 (21.0 to 35.8) |
P valuec | Reference | < 0.001 | < 0.001 | < 0.001 |
Clinical responsea at week 12 | ||||
n (%) | 39 (33.3) | NR | NR | 169 (73.5) |
Adjusted between-group difference, % (95% CI)b | Reference | NR | NR | 40.3 (29.9 to 50.7) |
P valuec | Reference | NR | NR | < 0.001 |
Deep remissionf at week 48 | ||||
n (%) | 5 (4.3) | 30 (26.1) | 39 (33.9) | 69 (30.0) |
Adjusted between-group difference, % (95% CI)b | Reference | 21.8 (13.1 to 30.6) | 29.8 (20.5 to 39.2) | 25.8 (18.9 to 32.7) |
P valuee | Reference | < 0.001 | < 0.001 | < 0.001 |
Clinical remission at week 48 and endoscopic response at week 48 | ||||
n (%) | 6 (5.1) | 44 (38.3) | 51 (44.3) | 95 (41.3) |
Adjusted between-group difference, % (95% CI)b | Reference | 33.1 (23.3 to 42.8) | 39.4 (29.4 to 49.4) | 36.2 (28.6 to 43.7) |
P valuee | Reference | < 0.001 | < 0.001 | < 0.001 |
PRO-2 remissiong at week 12 | ||||
n (%) | 20 (17.1) | 62 (53.9) | 51 (44.3) | 113 (49.1) |
Adjusted between-group difference, % (95% CI)b | Reference | 36.8 (25.5 to 48.1) | 27.4 (16.4 to 38.3) | 32.1 (22.9 to 41.2) |
P valueh | Reference | < 0.001 | < 0.001 | < 0.001 |
PRO-2 remissiong at week 48 | ||||
n (%) | 14 (12.0) | 61 (53.0) | 75 (65.2) | 136 (59.1) |
Adjusted between-group difference, % (95% CI)b | Reference | 41.1 (30.1 to 52.1) | 53.2 (42.6 to 63.7) | 47.2 (38.5 to 56.0) |
P valueh | Reference | < 0.001 | < 0.001 | < 0.001 |
IBDQ remissioni at week 12 | ||||
n (%) | 27 (23.1) | 60 (52.2) | 50 (43.5) | 110 (47.8) |
Adjusted between-group difference (95% CI)b | Reference | 29.2 (17.4 to 41.0) | 20.8 (9.2 to 32.4) | 24.9 (15.1 to 34.7) |
P valueh | Reference | < 0.001 | < 0.001 | < 0.001 |
IBDQ remissioni at week 48 | ||||
n (%) | 21 (17.9) | 63 (54.8) | 56 (48.7) | 119 (51.7) |
Adjusted between-group difference (95% CI)b | Reference | 36.6 (25.4 to 47.8) | 30.7 (19.2 to 42.1) | 33.7 (24.3 to 43.0) |
P valueh | Reference | < 0.001 | < 0.001 | < 0.001 |
AP = abdominal pain; BIO-Failure = biologic therapy failure or intolerance; CDAI = Crohn’s Disease Activity Index; CI = confidence interval; FAS = full analysis set; IBDQ = Inflammatory Bowel Disease Questionnaire; ICE = intercurrent event; NR = not reported; PRO = patient-reported outcome; SC = subcutaneous; SES-CD = Simple Endoscopic Score for Crohn’s Disease; SF = stool frequency.
Notes: Guselkumab regimen 1 (low dose) = 400 mg SC at weeks 0, 4, and 8, followed by guselkumab at a dose of 100 mg SC every 8 weeks. Guselkumab regimen 2 (high dose) = 400 mg SC at weeks 0, 4, and 8, followed by guselkumab 200 mg SC every 4 weeks.
Composite strategy: Patients who met ICE categories 1, 2, 3, or 5 before the analysis time point were considered not to have met the end point criteria. Treatment policy strategy: Patients who met ICE category 4 had their observed data used, if available.
The Placebo column includes patients who were rescued with guselkumab. Data in this group occurred after a patient crossed over to guselkumab.
aClinical remission was defined as a CDAI score of less than 150.
bThe adjusted treatment differences, CIs, and P values were based on the common risk difference by use of Mantel-Haenszel stratum weights and the Sato variance estimator. The stratification factors were the baseline CDAI score (≤ 300 or > 300), the baseline SES-CD score (≤ 12 or > 12), and BIO-Failure status at baseline (yes or no).
cP value was controlled for multiplicity.
dEndoscopic response was defined as ≥ 50% improvement from baseline in SES-CD score.
eEndoscopic remission was defined as at least a 2-point reduction in the SES-CD score versus baseline and no subscore greater than 1 in any individual subcomponent.
dIBDQ remission was defined as an IBDQ score ≥ 170.
eP value was not controlled for multiplicity.
fDeep remission was defined as achieving both clinical remission and endoscopic remission.
gPRO-2 remission was defined as an AP mean daily score of less than or equal to 1 and an SF mean daily score equal to or less than 3, and no worsening of AP or SF from baseline.
hP value was not controlled for multiplicity.
iIBDQ remission was defined as an IBDQ score of 170 or greater.
Sources: Clinical Study Report for the GRAVITI trial.14 Details included in the table are from the sponsor’s Summary of Clinical Evidence.
Table 26: Summary of Key Efficacy Results From GALAXI 2 and GALAXI 3 Trials (IV Induction and SC Maintenance) — Guselkumab vs. Ustekinumab, PAS
Characteristic | GALAXI 2 trial | GALAXI 3 trial | ||||||
|---|---|---|---|---|---|---|---|---|
Guselkumab regimen 1 IV induction and SC maintenance N = 143 | Guselkumab regimen 2 IV induction and SC maintenance N = 146 | Guselkumab combined N = 289 | Ustekinumab IV induction and SC maintenance N = 143 | Guselkumab regimen 1 IV induction and SC maintenance N = 143 | Guselkumab regimen 2 IV induction and SC maintenance N = 150 | Guselkumab combined N = 293 | Ustekinumab IV induction and SC maintenance N = 148 | |
Clinical remissiona at week 48 and endoscopic responseb at week 48 | ||||||||
n (%) | 60 (42.0) | 72 (49.3) | 132 (45.7) | 56 (39.2) | 59 (41.3) | 68 (45.3) | 127 (43.3) | 42 (28.4) |
Adjusted between-group difference, % (95% CI)c | 2.8 (–8.4 to 14.1) | 10.2 (–0.6 to 21.0) | 6.5 (–3.0 to 16.0) | Reference | 12.7 (1.7 to 23.7) | 16.9 (5.8 to 27.9) | 14.7 (5.3 to 24.1) | Reference |
P valued | 0.620 | 0.065 | 0.181 | Reference | 0.024 | 0.003 | 0.181 | Reference |
Clinical remissiona at week 48 | ||||||||
n (%) | 92 (64.3) | 109 (74.7) | 201 (69.6) | 93 (65.0) | 95 (66.4) | 99 (66.0) | 194 (66.2) | 90 (60.8) |
Adjusted between-group difference, % (95% CI)c | –0.6 (–11.6 to 10.5) | 9.5 (–0.7 to 19.8) | 4.4 (–4.9 to 13.7) | Reference | 5.6 (–5.2 to 16.5) | 5.0 (–6.1 to 16.1) | 5.3 (–4.2 to 14.8) | Reference |
P valued | 0.920 | 0.069 | 0.355 | Reference | 0.308 | 0.378 | 0.277 | Reference |
Endoscopic responseb at week 48 | ||||||||
n (%) | 70 (49.0) | 82 (56.2) | 152 (52.6) | 60 (42.0) | 67 (46.9) | 74 (49.3) | 141 (48.1) | 48 (32.4) |
Adjusted between-group difference, % (95% CI)c | 7.0 (−4.4 to 18.3) | 14.5 (3.6 to 25.4) | 10.7 (1.1 to 20.3) | Reference | 14.1 (2.9 to 25.2) | 16.8 (5.7 to 28.0) | 15.4 (5.8 to 24.9) | Reference |
P valued | 0.230 | 0.009 | 0.029 | Reference | 0.013 | 0.003 | 0.002 | Reference |
Endoscopic remissione at week 48 | ||||||||
n (%) | 47 (32.9) | 65 (44.5) | 112 (38.8) | 38 (26.6) | 48 (33.6) | 45 (30.0) | 93 (31.7) | 34 (23.0) |
Adjusted between-group difference, % (95% CI)c | 6.4 (–4.3 to 17.1) | 17.9 (7.3 to 28.4) | 12.2 (3.1 to 21.3) | Reference | 10.5 (0.1 to 20.9) | 6.9 (–3.3 to 17.0) | 8.7 (–0.1 to 17.4) | Reference |
P valued | 0.239 | < 0.001 | 0.009 | Reference | 0.048 | 0.183 | 0.052 | Reference |
Deep remissionf | ||||||||
n (%) | 43 (30.1) | 57 (39.0) | 100 (34.6) | 37 (25.9) | 42 (29.4) | 43 (28.7) | 85 (29.0) | 28 (18.9) |
Adjusted between-group difference, % (95% CI)c | 4.2 (–6.2 to 14.7) | 13.0 (2.7 to 23.4) | 8.7 (–0.2 to 17.6) | Reference | 10.4 (0.4 to 20.4) | 9.6 (–0.1 to 19.4) | 10.0 (1.7 to 18.3) | Reference |
n (%)a, b | 0.426 | 0.014 | 0.056 | Reference | 0.041 | 0.052 | 0.018 | Reference |
IBDQ remissiong at week 48 | ||||||||
n (%) | 77 (53.8) | 84 (57.5) | 161 (55.7) | 75 (52.4) | 85 (59.4) | 77 (51.3) | 162 (55.3) | 73 (49.3) |
Adjusted between-group difference, % (95% CI)c | 1.6 (–9.9 to 13.2) | 5.6 (–5.5 to 16.7) | 3.3 (–6.5 to 13.1) | Reference | 10.1 (–1.2 to 21.5) | 2.1 (–9.4 to 13.6) | 5.9 (–4.0 to 15.8) | Reference |
P valueh | 0.783 | 0.322 | 0.512 | Reference | 0.080 | 0.725 | 0.244 | Reference |
AE = adverse event; BIO-Failure = biologic therapy failure or intolerance; CD = Crohn disease; CDAI = Crohn’s Disease Activity Index; CI = confidence interval; IBDQ = Inflammatory Bowel Disease Questionnaire; ICE = intercurrent event; PAS = primary analysis set; SC = subcutaneous; SES-CD = Simple Endoscopic Score for Crohn’s Disease.
Notes: Guselkumab regimen 1 (low dose) equals 200 mg IV every 4 weeks, followed by 100 mg SC every 8 weeks. Guselkumab regimen 2 (high dose) = 200 mg IV every 4 weeks, followed by 200 mg SC every 4 weeks. Ustekinumab treatment = approximately 6 mg/kg IV, followed by 90 mg SC every 8 weeks.
ICE strategies: Patients who had a CD-related surgery (known as ICE category 1); had a prohibited change in concomitant CD medication, including patients in the placebo group in clinical response who crossed over to ustekinumab at week 12 (known as ICE category 2); discontinued the study drug due to a lack of efficacy, an AE of worsening CD, or week 20/24 nonresponse status (known as ICE category 3); or discontinued the study drug for any other reason other than COVID-19–related reasons or a regional crisis (known as ICE category 5) before the analysis time point were considered not to have met the end point criteria. Patients who had discontinued the study drug due to COVID-19–related reasons — excluding COVID-19 infection — or a regional crisis (known as ICE category 4) had their observed data used, if available, to determine responder and nonresponse status at week 12 and week 48.
Missing data imputation: After accounting for ICE strategies, patients who were missing a CDAI score at week 12 or a CDAI or SES-CD score at week 48 were considered not to have met the end point.
aClinical remission was defined as a CDAI score < 150.
bEndoscopic response was defined as ≥ 50% improvement from baseline in the SES-CD score or an SES-CD score ≤ 2.
cThe adjusted treatment difference and the CIs were based on the common risk difference by use of Mantel-Haenszel stratum weights and the Sato variance estimator. The stratification variables used were the baseline CDAI score (≤ 300 or > 300), the baseline SES-CD score (≤ 12 or > 12), BIO-Failure status (yes or no), and baseline corticosteroid use (yes or no).
dP value was controlled for multiplicity.
eEndoscopic remission was defined as at least a 2-point reduction in the SES-CD score versus baseline and no subscore greater than 1 in any individual subcomponent.
fDeep remission was defined as achieving both clinical remission and endoscopic remission.
gIBDQ remission was defined as an IBDQ total score ≥ 170.
hP value was not controlled for multiplicity.
Sources: Clinical Study Report for the GALAXI 2 trial,12 Clinical Study Report for the GALAXI 3 trial.13 Details included in the table are from the sponsor’s Summary of Clinical Evidence.
Table 27: Summary of Key Efficacy Results From Pooled Analysis of the GALAXI 2 and GALAXI 3 Trials (IV Induction and SC Maintenance) — Guselkumab vs. Ustekinumab, PAS
Characteristic | Pooled GALAXI 2 and GALAXI 3 studies | ||
|---|---|---|---|
Guselkumab regimen 1 IV induction and SC maintenance N = 286 | Guselkumab regimen 2 IV induction and SC maintenance N = 296 | Ustekinumab IV induction and SC maintenance N = 291 | |
Clinical remissiona at week 48 and endoscopic responseb at week 48 | |||
n (%) | 119 (41.6) | 140 (47.3) | 98 (33.7) |
Adjusted between-group difference, % (95% CI)c | 7.8 (0.1 to 15.6) | 13.6 (5.9 to 21.3) | Reference |
P valued | 0.049 | < 0.001 | Reference |
Clinical remissiona at week 48 | |||
n (%) | 187 (65.4) | 208 (70.3) | 183 (62.9) |
Adjusted between-group difference, % (95% CI)c | 2.6 (–5.1 to 10.2) | 7.3 (–0.2 to 14.8) | Reference |
P valued | 0.512 | 0.058 | Reference |
Endoscopic responseb at week 48 | |||
n (%) | 137 (47.9) | 156 (52.7) | 108 (37.1) |
Adjusted between-group difference, % (95% CI)c | 10.6 (2.7 to 18.5) | 15.6 (7.9 to 23.4) | Reference |
P valued | 0.009 | < 0.001 | Reference |
Endoscopic remissione at week 48 | |||
n (%) | 95 (33.2) | 110 (37.2) | 72 (24.7) |
Adjusted between-group difference, % (95% CI)c | 8.5 (1.1 to 15.9) | 12.3 (4.9 to 19.7) | Reference |
P valued | 0.024 | 0.001 | Reference |
Deep remissionf | |||
n (%) | 85 (29.7) | 100 (33.8) | 65 (22.3) |
Adjusted between-group difference, % (95% CI)c | 7.4 (0.3 to 14.6) | 11.3 (4.2 to 18.5) | Reference |
P valued | 0.040 | 0.002 | Reference |
AE = adverse event; BIO-Failure = biologic therapy failure or intolerance; CD = Crohn disease; CDAI = Crohn’s Disease Activity Index; CI = confidence interval; ICE = intercurrent event; PAS = primary analysis set; SC = subcutaneous; SES-CD = Simple Endoscopic Score for Crohn’s Disease.
Notes: Guselkumab regimen 1 (low dose) = 200 mg IV every 4 weeks, followed by 100 mg SC every 8 weeks. Guselkumab regimen 2 (high dose) = 200 mg IV every 4 weeks, followed by 200 mg SC every 4 weeks. Ustekinumab treatment = approximately 6 mg/kg IV, followed by 90 mg SC every 8 weeks.
ICE strategies: Patients who had a CD-related surgery (known as ICE category 1); had a prohibited change in concomitant CD medication, including patients in the placebo group in clinical response who crossed over to ustekinumab at week 12 (known as ICE category 2); discontinued the study drug due to a lack of efficacy, an AE of worsening CD, or week 20/24 nonresponse status (known as ICE category 3); or discontinued the study drug for any other reason other than COVID-19–related reasons or a regional crisis (known as ICE category 5) before the analysis time point were considered not to have met the end point criteria. Patients who had discontinued the study drug due to COVID-19–related reasons — excluding COVID-19 infection — or a regional crisis (known as ICE category 4) had their observed data used, if available, to determine responder and nonresponse status at week 12 and week 48.
Missing data imputation: After accounting for ICE strategies, patients who were missing a CDAI score at week 12 or a CDAI or SES-CD score at week 48 were considered not to have met the end point.
aClinical remission was defined as a CDAI score < 150.
bEndoscopic response was defined as ≥ 50% improvement from baseline in the SES-CD score or a SES-CD score ≤ 2.
cThe adjusted treatment difference and the CIs were based on the common risk difference by use of Mantel-Haenszel stratum weights and the Sato variance estimator. The stratification variables used were the baseline CDAI score (≤ 300 or > 300), the baseline SES-CD score (≤ 12 or > 12), BIO-Failure status (yes or no), and baseline corticosteroid use (yes or no).
dP value was controlled for multiplicity.
eEndoscopic remission was defined as at least a 2-point reduction in the SES-CD score versus baseline and no subscore greater than 1 in any individual subcomponent.
fDeep remission was defined as both clinical remission and endoscopic remission.
Sources: Clinical Study Report for the GALAXI 2 trial,12 Clinical Study Report for the GALAXI 3 trial.13 Details included in the table are from the sponsor’s Summary of Clinical Evidence.
Harms
The key harms results in the safety analysis sets for all trials are summarized in Table 28 (GALAXI trials — Induction period), Table 29 (GALAXI trials — Maintenance period), and Table 30 (GRAVITI trial), respectively.
GALAXI 2 and GALAXI 3 Studies: IV Induction and SC Maintenance
Induction Period
In the GALAXI 2 trial, the proportion of patients experiencing at least 1 AE was 38.5% in the guselkumab regimen 1 group, 47.3% in the guselkumab regimen 2 group, 48.3% in the ustekinumab group, and 40.8% in the placebo group. In the GALAXI 3 trial, the proportion of patients experiencing at least 1 AE was 51.7% in the guselkumab regimen 1 group, 50.7% in the guselkumab regimen 2 group, 44.6% in the ustekinumab group, and 55.6% in the placebo group. The most common AEs in both trials included headache, pyrexia, upper respiratory tract infection, CD, and abdominal pain. During the induction period, the proportions of SAEs were similar between the treatment groups in both GALAXI trials. In the GALAXI 2 trial, the proportion of patients experiencing at least 1 SAE was 3.5% in the guselkumab regimen 1 group, 1.4% in the guselkumab regimen 2 group, 5.6% in the ustekinumab group, and 2.6% in the placebo group; this was primarily attributable to CD (1.4%, 0%, 0.7%, and 1.3%, respectively). In the GALAXI 3 trial, the proportion of patients experiencing at least 1 SAE was 3.5% in the guselkumab regimen 1 group, 2.7% in the guselkumab regimen 2 group, 5.4% in the ustekinumab group, and 9.7% in the placebo group; this was primarily attributable to CD (1.4%, 1.3%, 0%, and 4.2%, respectively).
In the GALAXI 2 trial, the proportion of patients who discontinued study treatment was 2.6% in the placebo group, 0% in the guselkumab regimen 1 group, 1.4% in the guselkumab regimen 2 group, and 2.1% in the ustekinumab group. In the GALAXI 3 trial, the corresponding discontinuation rates were 6.9%, 2.8%, 3.3%, and 3.4%, respectively. No deaths occurred during the induction period in either trial.
Maintenance Period
In the GALAXI 2 trial, the proportion of patients experiencing at least 1 AE was higher in the guselkumab regimen 1 group (74.1%), the guselkumab regimen 2 group (78.8%), and the ustekinumab group (78.3%) compared with the placebo group (50.0%). The most common AEs in the guselkumab regimen 1, guselkumab regimen 2, and ustekinumab groups included COVID-19 (14.3%, 15.1%, and 15.4%, respectively, versus 2.6% in the placebo group), upper respiratory tract infection (9.8%, 8.2%, and 6.3%, respectively, versus 3.9% in the placebo group), CD (9.1%, 8.02%, and 9.8%, respectively, versus 11.8% in the placebo group), and abdominal pain (7.7%, 6.2%, and 8.4%, respectively, versus 3.9% in the placebo group). In the GALAXI 3 trial, the proportion of patients experiencing at least 1 AE was higher in the guselkumab regimen 1 group (79.0%), the guselkumab regimen 2 group (76.7%), and the ustekinumab group (79.1%) compared with the placebo group (56.9%). The most common AEs in the guselkumab regimen 1, guselkumab regimen 2, and ustekinumab groups included COVID-19 (17.5%, 20.7%, and 10.1%, respectively, versus 9.7% in the placebo group), upper respiratory tract infection (9.8%, 8.7%, and 8.8%, respectively, versus 4.2% in the placebo group), CD (8.4%, 9.3%, and 7.4%, respectively, versus 15.3% in the placebo group), and arthralgia (6.3%, 7.3%, and 5.4%, respectively, versus 1.4% in the placebo group).
During the maintenance period of the GALAXI 2 trial, the proportion of patients experiencing at least 1 SAE was higher in the guselkumab regimen 1 and ustekinumab groups (12.6% each) compared to the guselkumab regimen 2 group (4.1%) and the placebo group (7.9%); this was primarily attributable to CD (3.5%, 0%, 0%, and 3.9%, respectively) and infections such as intestinal abscess (0%, 1.4%, 0.7%, and 0%, respectively). During the induction period, the proportions of SAEs were similar between the treatment groups in the GALAXI 3 trial. The proportion of patients experiencing at least 1 SAE was 8.4% in the guselkumab regimen 1 group, 10.0% in the guselkumab regimen 2 group, 10.8% in the ustekinumab group, and 13.9% in the placebo group; this was primarily attributable to CD (2.8%, 2.0%, 0.7%, and 8.3%, respectively).
In the GALAXI 2 trial, the proportion of patients who discontinued study treatment during the maintenance period was 6.6% in the placebo group, 5.6% in the guselkumab regimen 1 group, 4.1% in the guselkumab regimen 2 group, and 6.3% in the ustekinumab group; in the GALAXI 3 trial, the corresponding discontinuation rates were 11.1%, 8.4%, 8.7%, and 8.8%, respectively. No deaths occurred during the maintenance period in either trial.
Notable Harms
In the GALAXI 2 trial, 1 (0.7%) patient in the guselkumab regimen 1 group experienced major adverse cardiovascular events and 1 (0.7%) patient in the ustekinumab group experienced a venous thromboembolism. In the GALAXI 3 trial, 1 (0.7%) patient in the guselkumab regimen 1 group experienced active tuberculosis, and 1 (0.7%) patient experienced a malignancy in the guselkumab regimen 2 group. Additionally, 4 patients experienced opportunistic infections, including 1 (1.4%) patient in the placebo group, 1 (0.7%) patient in the guselkumab regimen 1 group, and 2 (1.3%) patients in the guselkumab regimen 2 group.
GRAVITI Study: SC Induction and SC Maintenance
Induction Period
During the induction period of the GRAVITI trial, the proportions of patients who experienced at least 1 AE were 49.6% in the placebo group, 51.3% in the guselkumab regimen 1 group, and 41.7% in the guselkumab regimen 2 group. The most common treatment-emergent AE in the placebo group was CD (12.8%) compared with 0% in both guselkumab groups. In the guselkumab regimen 1 and regimen 2 groups, the most frequently reported AEs included upper respiratory tract infection (4.3% in both groups versus 5.1% in the placebo group), COVID-19 (1.7% and 2.6%, respectively, versus 5.1% in the placebo group), and abdominal pain (1.7% and 3.5%, respectively, versus 3.4% in the placebo group). The proportion of patients experiencing at least 1 SAE was 2.6% in the guselkumab regimen 1 group, 1.7% in the guselkumab regimen 2 group, and 7.7% in the placebo group; this was primarily attributable to CD. The proportion of patients who discontinued study treatment during the induction period was 2.6% in the placebo group, 0% in the guselkumab regimen 1 group, and 0.9% in the guselkumab regimen 2 group. No deaths occurred during the induction period in the GRAVITI trial.
Maintenance Period
During the maintenance period of the GRAVITI trial, the proportions of patients who experienced at least 1 AE were 65.8% in the placebo group, 82.6% in the guselkumab regimen 1 group, and 80.0% in the guselkumab regimen 2 group. The most common AEs in the guselkumab regimen 1 and regimen 2 groups were CD (7.0% and 5.2%, respectively, versus 19.7% in the placebo group), upper respiratory tract infections (13.0% and 13.0%, respectively, versus 10.3% in the placebo group), COVID-19 (9.6% and 9.6%, respectively, versus 6.8% in the placebo group), and influenza (5.2%, and 5.2%, respectively, versus 4.3% in the placebo group). The proportion of patients experiencing at least 1 SAE during the maintenance period was 13.0% in the regimen 1 guselkumab group, 7.8% in the guselkumab regimen 2 group, and 13.7% in the placebo group; this was primarily attributable to CD (0.9%, 0.9%, and 6.0%, respectively). The proportion of patients who discontinued study treatment was 8.5% in the placebo group, 3.5% in the guselkumab regimen 1 group, and 2.6% in the guselkumab regimen 2 group. During the maintenance period of the GRAVITI trial, 1 (0.9%) patient died in the guselkumab regimen 1 group.
Notable Harms
In the GRAVITI trial, 1 (0.7%) patient in the regimen 1 guselkumab group experienced a malignancy while in the placebo group, 1 (0.9%) patient experienced an opportunistic infection, and 1 (0.9%) patient experienced a venous thromboembolism.
Table 28: Summary of Harms Results From the GALAXI 2 and GALAXI 3 Trials — Induction Period, PSAS
AE | GALAXI 2 trial | GALAXI 3 trial | ||||||
|---|---|---|---|---|---|---|---|---|
Placebo N = 76 | Guselkumab regimen 1 IV N = 143 | Guselkumab regimen 2 IV N = 146 | Ustekinumaba IV N = 143 | Placebo N = 72 | Guselkumab regimen 1 IV N = 143 | Guselkumab regimen 2 IV N = 150 | Ustekinumaba IV N = 148 | |
TEAEs, n (%) | ||||||||
Patients with ≥ 1 TEAE | 31 (40.8) | 55 (38.5) | 69 (47.3) | 69 (48.3) | 40 (55.6) | 74 (51.7) | 76 (50.7) | 66 (44.6) |
TEAEs experienced by ≥ 1 patient in any group | ||||||||
Headache | 0 (0) | 2 (1.4) | 5 (3.4) | 8 (5.6) | 4 (5.6) | 5 (3.5) | 4 (2.7) | 2 (1.4) |
Pyrexia | 4 (5.3) | 5 (3.5) | 1 (0.7) | 4 (2.8) | 3 (4.2) | 5 (3.5) | 3 (2.0) | 4 (2.7) |
Upper respiratory tract infection | 3 (3.9) | 4 (2.8) | 6 (4.1) | 1 (0.7) | 3 (4.2) | 4 (2.8) | 2 (1.3) | 4 (2.7) |
COVID-19 | 1 (1.3) | 4 (2.8) | 2 (1.4) | 8 (5.6) | 5 (6.9) | 7 (4.9) | 14 (9.3) | 2 (1.4) |
CD | 3 (3.9) | 4 (2.8) | 2 (1.4) | 5 (3.5) | 7 (9.7) | 3 (2.1) | 6 (4.0) | 2 (1.4) |
Abdominal pain | 1 (1.3) | 5 (3.5) | 2 (1.4) | 7 (4.9) | 5 (6.9) | 4 (2.8) | 2 (1.3) | 4 (2.7) |
Arthralgia | 2 (2.6) | 3 (2.1) | 6 (4.1) | 3 (2.1) | 1 (1.4) | 2 (1.4) | 3 (2.0) | 3 (2.0) |
Anemia | 2 (2.6) | 3 (2.1) | 4 (2.7) | 7 (4.9) | 3 (4.2) | 2 (1.4) | 4 (2.7) | 4 (2.7) |
Nausea | 0 (0) | 2 (1.4) | 2 (1.4) | 4 (2.8) | 5 (6.9) | 3 (2.1) | 2 (1.3) | 2 (1.4) |
Back pain | 0 (0) | 2 (1.4) | 3 (2.1) | 1 (0.7) | 1 (1.4) | 1 (0.7) | 0 (0) | 0 (0) |
SAEs, n (%) | ||||||||
Patients with ≥ 1 SAE | 2 (2.6) | 5 (3.5) | 2 (1.4) | 8 (5.6) | 7 (9.7) | 5 (3.5) | 4 (2.7) | 8 (5.4) |
Serious TEAEs experienced by ≥ 1 patient in any group | ||||||||
CD | 1 (1.3) | 2 (1.4) | 0 (0) | 1 (0.7) | 3 (4.2) | 2 (1.4) | 2 (1.3) | 0 (0) |
Anal fistula | 0 (0) | 0 (0) | 0 (0) | 0 (0) | 2 (2.8) | 0 (0) | 0 (0) | 0 (0) |
Intestinal perforation | 0 (0) | 0 (0) | 0 (0) | 0 (0) | 0 (0) | 1 (0.7) | 0 (0) | 2 (1.4) |
Intestinal obstruction | 0 (0) | 0 (0) | 1 (0.7) | 0 (0) | 1 (1.4) | 1 (0.7) | 0 (0) | 1 (0.7) |
Colitis | 1 (1.3) | 0 (0) | 0 (0) | 0 (0) | 0 (0) | 0 (0) | 0 (0) | 0 (0) |
Abdominal pain | 0 (0) | 0 (0) | 0 (0) | 0 (0) | 1 (1.4) | 0 (0) | 0 (0) | 1 (0.7) |
Patients who stopped treatment due to AEs, n (%) | ||||||||
Patients who discontinued treatment | 2 (2.6) | 0 (0) | 2 (1.4) | 3 (2.1) | 5 (6.9) | 4 (2.8) | 5 (3.3) | 5 (3.4) |
Most common reasons for treatment discontinuation, n (%) | ||||||||
CD | 1 (1.3) | 0 (0) | 0 (0) | 1 (0.7) | 4 (5.6) | 0 (0) | 0 (0) | 1 (0.7) |
Colitis | 1 (1.3) | 0 (0) | 0 (0) | 0 (0) | 0 (0) | 0 (0) | 0 (0) | 0 (0) |
Intestinal obstruction | 0 (0) | 0 (0) | 1 (0.7) | 0 (0) | 0 (0) | 0 (0) | 0 (0) | 0 (0) |
Arthralgia | 0 (0) | 0 (0) | 1 (0.7) | 0 (0) | 0 (0) | 0 (0) | 0 (0) | 0 (0) |
Death, n (%) | 0 (0) | 0 (0) | 0 (0) | 0 (0) | 0 (0) | 0 (0) | 0 (0) | 0 (0) |
AE = adverse event; CD = Crohn disease; PSAS = primary safety analysis set; SAE = serious adverse event; SC = subcutaneous; TEAE = treatment-emergent adverse event.
Note: Guselkumab regimen 1 = 200 mg IV every 4 weeks. Guselkumab regimen 2 = 200 mg IV every 4 weeks. Ustekinumab treatment = approximately 6 mg/kg IV.
aPatients received a single ustekinumab IV induction dose at week 0. At week 8, patients received 1 ustekinumab SC maintenance dose.
Sources: Clinical Study Report for the GALAXI 2 trial,12 Clinical Study Report for the GALAXI 3 trial.13 Details included in the table are from the sponsor’s Summary of Clinical Evidence.
Table 29: Summary of Harms Results From GALAXI 2 and GALAXI 3 Trials — Maintenance Period, PSAS
AE | GALAXI 2 trial | GALAXI 3 trial | |||||||||
|---|---|---|---|---|---|---|---|---|---|---|---|
Placebo N = 76 | Placebo to ustekinumaba N = 49 | Guselkumab regimen 1 SC N = 143 | Guselkumab regimen 2 SC N = 146 | Ustekinumab to ustekinumabb SC N = 143 | Placebo N = 72 | Placebo to ustekinumaba SC N = 49 | Guselkumab regimen 1 SC N = 143 | Guselkumab regimen 2 SC N = 150 | Ustekinumab to ustekinumabb SC N = 148 | ||
TEAEs, n (%) | |||||||||||
Patients with ≥ 1 TEAE | 38 (50.0) | 27 (55.1) | 106 (74.1) | 115 (78.8) | 112 (78.3) | 41 (56.9) | 33 (67.3) | 113 (79.0) | 115 (76.7) | 117 (79.1) | |
TEAEs experienced by ≥ 1 patient in any group, n (%) | |||||||||||
COVID-19 | 2 (2.6) | 7 (14.3) | 18 (12.6) | 22 (15.1) | 22 (15.4) | 7 (9.7) | 5 (10.2) | 25 (17.5) | 31 (20.7) | 15 (10.1) | |
Upper respiratory tract infection | 3 (3.9) | 2 (4.1) | 14 (9.8) | 12 (8.2) | 9 (6.3) | 3 (4.2) | 4 (8.2) | 14 (9.8) | 13 (8.7) | 13 (8.8) | |
Nasopharyngitis | 2 (2.6) | 1 (2.0) | 7 (4.9) | 10 (6.8) | 12 (8.4) | 2 (2.8) | 1 (2.0) | 4 (2.8) | 11 (7.3) | 7 (4.7) | |
Crohn disease | 9 (11.8) | 3 (6.1) | 13 (9.1) | 12 (8.2) | 14 (9.8) | 11 (15.3) | 6 (12.2) | 12 (8.4) | 14 (9.3) | 11 (7.4) | |
Abdominal pain | 3 (3.9) | 1 (2.0) | 11 (7.7) | 9 (6.2) | 12 (8.4) | 5 (6.9) | 0 (0) | 8 (5.6) | 5 (3.3) | 14 (9.5) | |
Arthralgia | 3 (3.9) | 3 (6.1) | 13 (9.1) | 14 (9.6) | 12 (8.4) | 1 (1.4) | 2 (4.1) | 9 (6.3) | 11 (7.3) | 8 (5.4) | |
Pyrexia | 4 (5.3) | 1 (2.0) | 9 (6.3) | 8 (5.5) | 14 (9.8) | 3 (4.2) | 3 (6.1) | 9 (6.3) | 8 (5.3) | 12 (8.1) | |
Anemia | 3 (3.9) | 1 (2.0) | 8 (5.6) | 10 (6.8) | 10 (7.0) | 4 (5.6) | 3 (6.1) | 7 (4.9) | 5 (3.3) | 6 (4.1) | |
Headache | 2 (2.6) | 1 (2.0) | 4 (2.8) | 16 (11.0) | 13 (9.1) | 4 (5.6) | 0 (0) | 9 (6.3) | 8 (5.3) | 6 (4.1) | |
Serious TEAEs, n (%) | |||||||||||
Patients with ≥ 1 Serious TEAEs | 6 (7.9) | 3 (6.1) | 18 (12.6) | 6 (4.1) | 18 (12.6) | 10 (13.9) | 6 (12.2) | 12 (8.4) | 15 (10.0) | 16 (10.8) | |
Serious TEAEs experienced by ≥ 1 patient in any group, n (%) | |||||||||||
Crohn disease | 3 (3.9) | 1 (2.0) | 5 (3.5) | 0 (0) | 0 (0) | 6 (8.3) | 2 (4.1) | 4 (2.8) | 3 (2.0) | 1 (0.7) | |
Abscess, intestinal | 0 (0) | 0 (0) | 0 (0) | 1 (0.7) | 2 (1.4) | 0 (0) | 0 (0) | 0 (0) | 1 (0.7) | 2 (1.4) | |
COVID-19 | 0 (0) | 1 (2.0) | 0 (0) | 0 (0) | 0 (0) | 0 (0) | 1 (2.0) | 0 (0) | 0 (0) | 0 (0) | |
Patients who stopped treatment due to AEs, n (%) | |||||||||||
Patients who discontinued study treatment | 5 (6.6) | 0 (0) | 8 (5.6) | 6 (4.1) | 9 (6.3) | 8 (11.1) | 4 (8.2) | 12 (8.4) | 13 (8.7) | 13 (8.8) | |
AEs of special interest, n (%) | |||||||||||
Active tuberculosis | 0 (0) | 0 (0) | 0 (0) | 0 (0) | 0 (0) | 0 (0) | 0 (0) | 1 (0.7) | 0 (0) | 0 (0) | |
Malignancies | 0 (0) | 0 (0) | 0 (0) | 0 (0) | 0 (0) | 0 (0) | 0 (0) | 0 (0) | 1 (0.7) | 0 (0) | |
Opportunistic infections | 0 (0) | 0 (0) | 0 (0) | 0 (0) | 0 (0) | 1 (1.4) | 0 (0) | 1 (0.7) | 2 (1.3) | 0 (0) | |
Major adverse cardiovascular events | 0 (0) | 0 (0) | 1 (0.7) | 0 (0) | 0 (0) | 0 (0) | 0 (0) | 0 (0) | 0 (0) | 0 (0) | |
Venous thromboembolism | 0 (0) | 0 (0) | 0 (0) | 0 (0) | 1 (0.7) | 0 (0) | 0 (0) | 0 (0) | 0 (0) | 0 (0) | |
Death, n (%) | 0 (0) | 0 (0) | 0 (0) | 0 (0) | 0 (0) | 0 (0) | 0 (0) | 0 (0) | 0 (0) | 0 (0) | |
AE = adverse event; PSAS = primary safety analysis set; SAE = serious adverse event; SC = subcutaneous; SES-CD = Simple Endoscopic Score for Crohn’s Disease; TEAE = treatment-emergent adverse event.
Notes: Guselkumab regimen 1 (low dose) = 200 mg IV every 4 weeks, followed by 100 mg SC every 8 weeks. Guselkumab regimen 2 (high dose) = 200 mg IV every 4 weeks, followed by 200 mg SC every 4 weeks. Ustekinumab treatment = approximately 6 mg/kg IV, followed by 90 mg SC every 8 weeks.
PSAS includes all randomized patients who received at least 1 (partial or complete) dose of study intervention and satisfied the SES-CD eligibility criteria.
aPatients in the placebo nonresponse group and crossed over to ustekinumab at week 12. Events counted in this group occurred after the patient switched to the ustekinumab treatment group.
bPatients received a single ustekinumab IV induction dose at week 0. At week 8, patients received 1 ustekinumab SC maintenance dose.
Sources: Clinical Study Report for the GALAXI 2 trial,12 Clinical Study Report for the GALAXI 3 trial.13 Details included in the table are from the sponsor’s Summary of Clinical Evidence.
Table 30: Summary of Harms Results From the GRAVITI Trial — SAS
AE | GRAVITI study | |||
|---|---|---|---|---|
Placebo N = 117 | Placebo to guselkumaba N = 44 | Guselkumab regimen 1 IV induction and SC maintenance N = 115 | Guselkumab regimen 1 IV induction and SC maintenance N = 115 | |
Induction period | ||||
TEAEs, n (%) | ||||
Patients with ≥ 1 AE | 58 (49.6) | NA | 59 (51.3) | 48 (41.7) |
TEAEs experienced by ≥ 2 patients in any group, n (%) | ||||
CD | 15 (12.8) | NA | 0 (0) | 0 (0) |
Upper respiratory tract infection | 6 (5.1) | NA | 5 (4.3) | 5 (4.3) |
COVID-19 | 6 (5.1) | NA | 2 (1.7) | 3 (2.6) |
Abdominal pain | 4 (3.4) | NA | 2 (1.7) | 4 (3.5) |
Serious TEAEs, n (%) | ||||
Patients with ≥ 1 serious TEAE | 9 (7.7) | NA | 3 (2.6) | 2 (1.7) |
CD | 5 (4.3) | NA | 0 (0) | 0 (0) |
Patients who stopped treatment due to AEs, n (%) | ||||
Patients who discontinued | 3 (2.6) | NA | 0 (0) | 1 (0.9) |
CD | 2 (1.7) | NA | 0 (0) | 0 (0) |
Alanine aminotransferase, increased | 0 (0) | NA | 0 (0) | 1 (0.9) |
Pyoderma gangrenosum | 1 (0.9) | NA | 0 (0) | 0 (0) |
Deaths, n (%) | ||||
Patients who died | 0 (0) | NA | 1 (0.9) | 0 (0) |
Gun shot wound | 0 (0) | NA | 1 (0.9) | 0 (0) |
Maintenance period | ||||
TEAEs, n (%) | ||||
Patients with ≥ 1 AE | 77 (65.8) | 33 (75.0) | 95 (82.6) | 92 (80.0) |
TEAEs experienced by > 1 patient in any group, n (%) | ||||
CD | 23 (19.7) | 3 (6.8) | 8 (7.0) | 6 (5.2) |
Upper respiratory tract infection | 12 (10.3) | 8 (18.2) | 15 (13.0) | 15 (13.0) |
COVID-19 | 8 (6.8) | 1 (2.3) | 11 (9.6) | 11 (9.6) |
Influenza | 5 (4.3) | 1 (2.3) | 5 (5.2) | 6 (5.2) |
Nasopharyngitis | 6 (5.1) | 3 (6.8) | 8 (7.0) | 0 (0) |
Pyrexia | 9 (7.7) | 2 (4.5) | 3 (2.6) | 6 (5.2) |
Arthralgia | 4 (3.4) | 0 (0.0) | 6 (5.2) | 5 (4.3) |
Headache | 5 (4.3) | 1 (2.3) | 7 (6.1) | 9 (7.8) |
Anemia | 3 (2.6) | 0 (0.0) | 8 (7.0) | 2 (1.7) |
Serious TEAEs, n (%) | ||||
Patients with ≥ 1 serious TEAE | 16 (13.7) | 1 (2.3) | 15 (13.0) | 9 (7.8) |
CD | 7 (6.0) | 0 (0) | 1 (0.9) | 1 (0.9) |
Ileus | 0 (0) | 0 (0) | 2 (1.7) | 0 (0) |
Patients who stopped treatment due to AEs, n (%) | ||||
Patients who discontinued | 10 (8.5) | 1 (2.3) | 4 (3.5) | 3 (2.6) |
CD | 6 (5.1) | 0 (0) | 2 (1.7) | 1 (0.9) |
Deaths, n (%) | ||||
Patients who died | 0 (0) | 0 (0) | 1 (0.9) | 0 (0) |
Gun shot wound | 0 (0) | 0 (0) | 1 (0.9) | 0 (0) |
AEs of special interest, n (%) | ||||
Malignancies | 0 (0) | 0 (0) | 1 (0.9) | 0 (0) |
Opportunistic infections | 1 (0.9) | 0 (0) | 0 (0) | 0 (0) |
Venous thromboembolism | 1 (0.9) | 0 (0) | 0 (0) | 0 (0) |
AE = adverse event; CD = Crohn disease; NA = not applicable; SAS = safety analysis set; SC = subcutaneous; TEAE = treatment-emergent adverse event.
Notes: Guselkumab regimen 1 (low dose) = 400 mg SC at weeks 0, 4, and 8, followed by guselkumab at a dose of 100 mg SC every 8 weeks. Guselkumab regimen 2 (high dose) = 400 mg SC at weeks 0, 4, and 8, followed by guselkumab 200 mg SC every 4 weeks.
SAS includes all randomized patients who received at least 1 dose of the study intervention.
aIncludes placebo patients who were rescued with guselkumab.
Sources: Clinical Study Report for the GRAVITI trial.14 Details included in the table are from the sponsor’s Summary of Clinical Evidence.
Critical Appraisal
Internal Validity
The GALAXI 2 and GALAXI 3 trials were phase III, randomized, double-blind, placebo- and active-controlled (versus ustekinumab), parallel-group, multicentre trials. The GRAVITI trial was a phase III, randomized, double-blind, placebo-controlled, parallel-group, multicentre trial. Randomization and allocation concealment for all 3 studies were conducted using appropriate methods. A stratified, computerized randomizations scheme was employed, and allocation concealment was ensured using interactive response technology. Although there was some imbalance in baseline characteristics across the treatment groups in the GALAXI and GRAVITI trials (e.g., race, sex, several disease characteristics), the clinical experts did not consider these differences to have introduced bias to the study results. In the GALAXI 2 and GALAXI 3 trials, all efficacy and safety analyses were conducted using the primary efficacy and safety analysis sets, which included all randomized patients who received at least 1 (partial or complete) dose of the study intervention and met the SES-CD eligibility criteria (508 patients in the GALAXI 2 study and 513 patients in the GALAXI 3 study). While a total of 523 patients in the GALAXI 2 study and 525 patients in the GALAXI 3 study received at least 1 dose of the study intervention, some did not meet the SES-CD eligibility criteria and were therefore excluded from the PASs. However, supportive analyses of the coprimary end points using the all-treated analysis set produced results consistent with the primary analyses. As a result, the potential for bias due to the exclusion of patients not meeting SES-CD criteria was considered low across both GALAXI trials. Similarly, a total of 350 patients were randomized in the GRAVITI trial, of whom 347 patients were included in the efficacy and safety analyses. Given the minimal discrepancy between the number of randomized and analyzed patients, the potential for bias resulting from these exclusions is considered low in the GRAVITI trial.
Major protocol deviations occurred in 17.5% of patients in the GALAXI 2 trial and 23.3% of patients in the GALAXI 3 trial. These deviations were balanced across treatment groups and did not appear to be related to the trial context; they were primarily attributed to patients not meeting eligibility criteria. In the GRAVITI trial, major protocol deviations were reported in 36.8% of patients in the placebo group, 26.1% of patients in the guselkumab regimen 1 group, and 24.3% of patients in the guselkumab regimen 2 group through week 48; the most common reasons for protocol deviations included not meeting eligibility criteria (26.5%, 15.7%, and 16.5%, respectively) and receiving prohibited concomitant medication (2.6%, 4.3%, and 6.1%, respectively). The uneven distribution of protocol deviations across treatment groups may have introduced imbalance in the comparison of guselkumab versus placebo in terms of efficacy and safety. However, patients who received prohibited concomitant medications were addressed using a composite strategy, under which they were classified in the nonresponse group; this approach was considered reasonable by the review team. The GALAXI and GRAVITI trials used a treat-through design, whereby participants remained on their assigned treatment regimen beyond the initial induction phase without rerandomization. This approach allows for the evaluation of both induction and maintenance efficacy within the same treatment group. Additionally, all 3 trials were conducted using a double-blind design, where patients, investigators, and outcome assessors were masked to treatment allocation from the time of randomization until unblinding as specified in the study protocols. The study drugs were identical in physical appearance and packaging.
In the GALAXI 3 trial, the treatment discontinuation rate before week 48 was higher across the treatment groups (34.8% in the placebo group versus 12.2% to 18.2% in the guselkumab and ustekinumab groups, respectively) compared to the GALAXI 2 trial, where the discontinuation rates were 37.0% in the placebo group and 3.0% to 14.0% in the guselkumab and ustekinumab groups, respectively. In the placebo group, the most common reasons for discontinuation were AEs related to worsening CD, followed by a lack of efficacy and patient withdrawal. In contrast, discontinuation rates in the active treatment groups were not driven by any single predominant reason. In both GALAXI trials, 49 patients crossed over to ustekinumab at week 12 due to clinical nonresponse but were still analyzed as part of the as-randomized placebo group at week 48, despite having received ustekinumab treatment from week 12 onward. In the GRAVITI trial, the treatment discontinuation rate before week 48 was 13.7% in the placebo group and 0.9% to 2.6% in the guselkumab regimen 1 and regimen 2 groups, respectively. In the GRAVITI trial, 44 patients in the placebo group meeting predefined criteria were rescued with guselkumab treatment at week 12 or week 16. Much of this was accounted for within the ICEs, which are discussed in a subsequent paragraph. As a result, in all 3 trials, patients in the guselkumab groups who completed the study were exposed to treatment for a longer duration, potentially providing more opportunity to demonstrate efficacy or experience safety events. In the GALAXI and GRAVITI trials, patients who discontinued the study intervention due to a lack of efficacy or an AE of worsening CD were addressed using a composite strategy, under which they were classified as nonresponse group. This approach was considered reasonable by the review team.
In general, the end points reported in the trials were validated for use in patients with moderately to severely active CD. Across all 3 trials, most outcomes were subjective or partially subjective in nature — such as CDAI-based clinical remission or response, and IBDQ or PRO-2 remission — and data were collected via patient diaries. Although subjective end points or their components may have been influenced by knowledge of treatment assignment, the double-blind design of the trials likely mitigated this risk. Nonetheless, some risk of unblinding remains because higher dropout rates in the placebo groups may have enabled investigators or patients to infer treatment assignment (i.e., due to the obvious efficacy or lack of efficacy), potentially influencing the reporting of subjective end points. The presence and extent of this potential bias cannot be determined. Endoscopic response and remission were considered objective measures by the clinical experts and by regulatory guidelines,40 and they were assessed centrally by blinded reviewers. Clinical and endoscopic response and remission were considered important in managing patients with moderate to severe CD by the clinical experts consulted by CDA-AMC.
The statistical methods used to analyze the primary and secondary outcomes across all 3 trials were deemed appropriate. The use of estimands in clinical trials provides a structured framework to precisely define the treatment effect of interest by clearly specifying the study intervention, target population, end point, ICEs, and population-level summary measure. Treatment discontinuation for various reasons was reflected as ICEs within the trial estimands and typically considered as nonresponse, which was considered appropriate in most cases and are generally considered acceptable by regulatory authorities such as the US FDA40 and the European Medicines Agency.41 Some dropouts were not clearly related to a lack of efficacy and the NRI could have introduced bias, though rates of such ICEs were relatively limited in the GALAXI trials. At longer time points in the GRAVITI study, dropouts due to reasons potentially unrelated to a lack of response were increased in the placebo group compared to the guselkumab groups, which could inflate the treatment effect estimates. After consideration of the ICEs, there were few missing data. In addition, sensitivity analyses for the coprimary end points were conducted in all 3 trials using alternative imputation techniques, and the results were consistent with those of the primary analysis.
In the GALAXI 2 and GALAXI 3 trials, the coprimary and secondary end points were grouped into 5 tiers. For the coprimary and secondary end points in tier 1, tier 4, and tier 5, the study hypotheses were tested separately within each of the GALAXI 2 and GALAXI 3 trials. For the secondary end points in tier 2 and tier 3, the hypotheses were tested for data pooled across both trials. Because the GALAXI trials were identical in design, pooling of the data was deemed appropriate because it was prespecified in the protocol before unblinding. However, combining the 2 samples into a single randomized population may potentially obscure trial-specific differences. However, the individual trial results from the GALAXI 2 and GALAXI 3 studies were available, and when inconsistency in results was apparent, it was addressed within the certainty of evidence appraisal.
In both GALAXI trials, the analysis of certain end points — including endoscopic response and remission, and clinical response and remission at week 12 — was conducted using within-study comparisons between the combined guselkumab induction dose and the placebo group in each GALAXI trial. In contrast, other end points in both GALAXI trials were analyzed separately, comparing each individual guselkumab regimen against placebo. In the GRAVITI trial, the week 12 end points were based on comparisons between the combined guselkumab induction dose group and the placebo group. The end points assessed after week 12 were based on comparisons between each individual guselkumab group and the placebo group. Given that the induction doses of guselkumab were identical in the GALAXI and GRAVITI trials, combining these dose groups was deemed appropriate and was prespecified in the protocol. Although combining the 2 guselkumab dose groups may have increased statistical power, the results from the individual guselkumab regimens were consistent with those observed in the combined dose group. A hierarchical testing procedure was appropriately used in all 3 trials to account for multiplicity in coprimary and secondary end points. Post hoc subgroup analyses of the GALAXI 2 and GALAXI 3 studies that pooled data for the coprimary end points, including subpopulations with an inadequate response, or intolerance, to 1 or more biologic or conventional therapies, were prespecified and conducted using the primary analysis population in the GALAXI trials.39 However, the subgroup analyses were not adjusted for multiplicity and were likely underpowered to detect differences between subgroups; therefore, the findings should be considered supportive only.
The exploratory outcome of IBDQ remission was not adjusted for multiplicity; therefore, there is a risk of false-positive conclusions. Information on missing values derived from PROs was not reported in the GALAXI or GRAVITI trials. In all 3 trials, most patients received 1 or more concomitant medication for CD, including oral corticosteroids, and immunomodulatory drugs. Due to the failure of the statistical testing hierarchy in the GALAXI trials, formal comparisons between guselkumab and ustekinumab could not be conducted within individual trials. Although results across trials appeared relatively consistent, some inconsistencies were noted, which are considered to have only a minor impact on the interpretation of the findings. The use of concomitant therapies was generally balanced across treatment groups and, according to clinical experts, was unlikely to have confounded the study results. Overall, the proportion of patients who experienced SAEs was low across all 3 trials, with similar rates observed among all treatment groups.
External Validity
In the GALAXI 2 and GALAXI 3 trials, fewer than 10% of patients did not advance past screening, indicating a relatively inclusive enrolment process. In contrast, the GRAVITI trial did not report details on the screening period, making it unclear how many patients may have been excluded before randomization. According to the clinical experts consulted by CDA-AMC, the inclusion and exclusion criteria across all 3 trials were generally appropriate for the clinical trial setting. The clinical experts indicated that the use of endoscopic evidence of active disease, along with criteria for clinically active CD, aligned with standard definitions of moderate to severe disease. The clinical experts consulted noted that while certain exclusion criteria, such as strictures or previous colectomy, are considered typical for clinical trials, they do not always reflect real-world practice, where treatment decisions are often based on individual clinical judgment and may include patients typically excluded from trials. For example, patients with an ostomy, prior resections (regardless of timing), and prior exposure to IL-23 were excluded from the trials. However, clinical experts noted that, in clinical practice, treatment with guselkumab would still be considered for such patients. The use of an induction and maintenance phase across the 3 trials is consistent with regulatory guidelines for clinical trials in the CD population.41
In the GALAXI and GRAVITI trials, the placebo group does not represent a true placebo group because it includes patients who crossed over to active treatment. While this issue was handled as an ICE in the GRAVITI trial, it does not appear to have been similarly addressed in the GALAXI trials based on the available information. The presence of crossover may limit the interpretability of placebo comparisons, particularly at longer time points. The inclusion of worsening CD as an SAE may complicate the interpretation of safety outcomes, particularly when comparing active treatment groups to placebo.
The Health Canada indication for guselkumab is for the treatment of adult patients with moderately to severely active CD; there is no specification of the need to have not experienced inadequate response or be intolerant of other therapies. However, the GALAXI and GRAVITI trials enrolled patients with CD whose disease had demonstrated an inadequate response or intolerance to prior conventional or biologic therapies. The clinical experts consulted indicated that approximately half of the patients in these trials had no prior exposure to biologics, enabling a meaningful assessment of treatment response in both populations with no prior exposure to biologics and with previous exposure to biologics. They further noted that the patient population is generally reflective of real-world clinical practice, although the distribution of patients with no prior exposure to biologics versus patients with previous exposure to biologics may differ between community-based and tertiary care settings. In the opinion of the clinical experts consulted, guselkumab should be available to patients with moderately to severely active CD whose disease has an inadequate response, or intolerance, to prior treatment of either conventional or biologic therapies, rather than being reserved only for those who are intolerant of or have contraindications to other biologic drugs. According to the clinical experts consulted by CDA-AMC, patients enrolled in the trials were considered to have more severe disease than those typically encountered in clinical practice. This was evidenced by the high proportion of participants with a stool frequency score of greater than 2 and an abdominal pain score of greater than 1 across all 3 trials.
The clinical experts indicated that concomitant medications used in the trials are generally reflective of clinical practice. The use of stable corticosteroid dosing during induction and subsequent tapering was also considered appropriate by the clinical experts. The dosing and administration of guselkumab in all 3 trials were consistent with the product monograph. Two maintenance dosing regimens of guselkumab were evaluated in the trials: 100 mg administered by SC injection every 8 weeks, or 200 mg administered by SC injection every 4 weeks. According to the product monograph, a dose of 200 mg administered by SC injection at week 12 and every 4 weeks thereafter may be considered for patients whose disease does not show adequate therapeutic benefit from guselkumab, or based on clinical judgment.1 The clinical experts consulted indicated that this approach aligns with current clinical practice. The clinical experts considered the availability of 2 dosing options a clinical advantage because it allows for greater flexibility to individualize treatment based on patient characteristics and therapeutic response.
In the GALAXI 2 and GALAXI 3 trials, guselkumab was evaluated against both an active comparator (ustekinumab) and placebo. The active comparator used in the GALAXI trials was appropriate because ustekinumab is currently used in clinical practice. However, a gap in the evidence exists because no head-to-head comparison of the SC induction and SC maintenance regimen versus ustekinumab or any other active comparator was submitted. The trials included outcomes that were important to both patients and clinicians. Patient groups indicated that improvements in HRQoL, clinical remission (of their flares), treatment response, reduced reliance on corticosteroids, and fewer side effects are important to them. The coprimary outcomes assessed in all 3 trials included clinical response and remission, endoscopic response and remission, and 90-day, corticosteroid-free clinical remission. These end points were considered appropriate by the clinical expert, although they noted that the Harvey-Bradshaw Index is more commonly used in Canadian clinical practice than the CDAI score. Although there is a disconnect between the tools used in trials and in clinical practice, clinical experts emphasized that the use of CDAI in trials does not pose a barrier to applying the results, because clinicians are well familiar with its components. The clinical experts indicated that the use of 2 PRO measures in the trials — IBDQ remission and PRO-2 remission — was complementary because they capture different aspects of patient experience. The GRAVITI trial is ongoing, with a 24-week main treatment phase, including a 12-week induction period followed by a 12-week maintenance period, and an extension treatment phase that comprises a 72-week maintenance period. The clinical experts considered the 48-week maintenance period following the 12-week induction period to be appropriate and sufficient for evaluating the long-term efficacy and safety of guselkumab in patients with CD. They also noted that a 48-week to 52-week follow-up duration is consistent with standard practice in CD and aligns with current expectations for assessing maintenance outcomes. The clinical experts noted that endoscopy assessments are typically performed every 6 months, if necessary, due to logistic constraints and the invasiveness of the procedure.
GRADE Summary of Findings and Certainty of the Evidence
Methods for Assessing the Certainty of the Evidence
For pivotal studies and RCTs identified in the sponsor’s systematic review, GRADE was used to assess the certainty of the evidence for outcomes considered most relevant to inform expert committee deliberations, and a final certainty rating was determined as outlined by the GRADE Working Group:10,42
“High certainty: We are very confident that the true effect lies close to that of the estimate of the effect.
Moderate certainty: We are moderately confident in the effect estimate — The true effect is likely to be close to the estimate of the effect, but there is a possibility that it is substantially different. We use the word ‘likely’ for evidence of moderate certainty (e.g., ‘X intervention likely results in Y outcome’).
Low certainty: Our confidence in the effect estimate is limited — The true effect may be substantially different from the estimate of the effect. We use the word ‘may’ for evidence of low certainty (e.g., ‘X intervention may result in Y outcome’).
Very low certainty: We have very little confidence in the effect estimate — The true effect is likely to be substantially different from the estimate of effect. We describe evidence of very low certainty as ‘very uncertain.’”
Following the GRADE approach, evidence from RCTs started as high-certainty evidence and could be rated down for concerns related to study limitations (which refers to internal validity or risk of bias), inconsistency across studies, indirectness, the imprecision of effects, and publication bias.
When possible, certainty was rated in the context of the presence of an important (nontrivial) treatment effect; if this was not possible, certainty was rated in the context of the presence of any treatment effect (i.e., the clinical importance is unclear). In all cases, the target of the certainty of evidence assessment was based on the point estimate and where it was located relative to the threshold for a clinically important effect (when a threshold was available) or to the null.
For the GRADE assessments, findings from GALAXI 2 and GALAXI 3 were considered together and summarized narratively per outcome and per comparison because these studies were similar in population, interventions, design, and outcome measures.
Results of GRADE Assessments
Table 2 and Table 3 present the GRADE summary of findings for guselkumab versus placebo in the GALAXI and GRAVITI trials, respectively. Table 4 presents the GRADE summary of findings for guselkumab versus ustekinumab in the GALAXI 2 and GALAXI 3 trials.
LTE Studies
The content in this section has been informed by materials submitted by the sponsor. The following has been summarized and validated by the review team.
GALAXI 2 and GALAXI 3 LTE Studies
Description of Studies
The GALAXI 2 and GALAXI 3 studies were randomized, double-blind, placebo- and active-controlled, parallel-group, multicentre studies designed to evaluate the efficacy and safety of guselkumab in patients with moderately to severely active CD. The key objectives of the LTE were to evaluate the long-term efficacy of clinical and endoscopic outcomes, and safety, to evaluate the benefit of treatment adjustment for patients with inadequate responses reported between week 52 through week 80, and to assess the impact of guselkumab on HRQoL.
At week 48, all patients who were enrolled in the GALAXI 2 and GALAXI 3 phase III pivotal trials, according to the investigator’s judgment, to benefit from treatment (i.e., based on week 48 clinical and endoscopic evaluations) were eligible to enter the LTE and receive approximately 4 additional years of treatment. The final efficacy and safety (FES) follow-up visits of the LTE were designed to occur approximately after week 248 or week 252 (i.e., approximately 16 weeks after their last study intervention administration at week 232 [for dosing of every 8 weeks] or week 236 [for dosing of every 4 weeks]).
A treat-through design was implemented at the start of both pivotal trials, meaning that patients continued with their assigned treatments throughout the LTE phase. Patients initially treated with guselkumab or ustekinumab maintained their dosages while those treated with placebo maintenance were discontinued from the study after unblinding at week 48. Patients reported to have lost response between week 52 and week 80 were eligible for dose adjustments. Inadequate response in the LTE phase was defined as not being in clinical response and having a CDAI score of at least 220 points between week 52 and week 80 (clinical response was defined as a reduction from baseline [i.e., week 0] in the CDAI score of ≥ 100 points or being in clinical remission [a CDAI score < 150]).
Figure 3 presents a schematic overview of the GALAXI 2 and GALAXI 3 trials’ main study designs and the LTE study.
Figure 3: Schematic Overview of GALAXI 2 and GALAXI 3 Trials and the Long-Term Extension Study Design
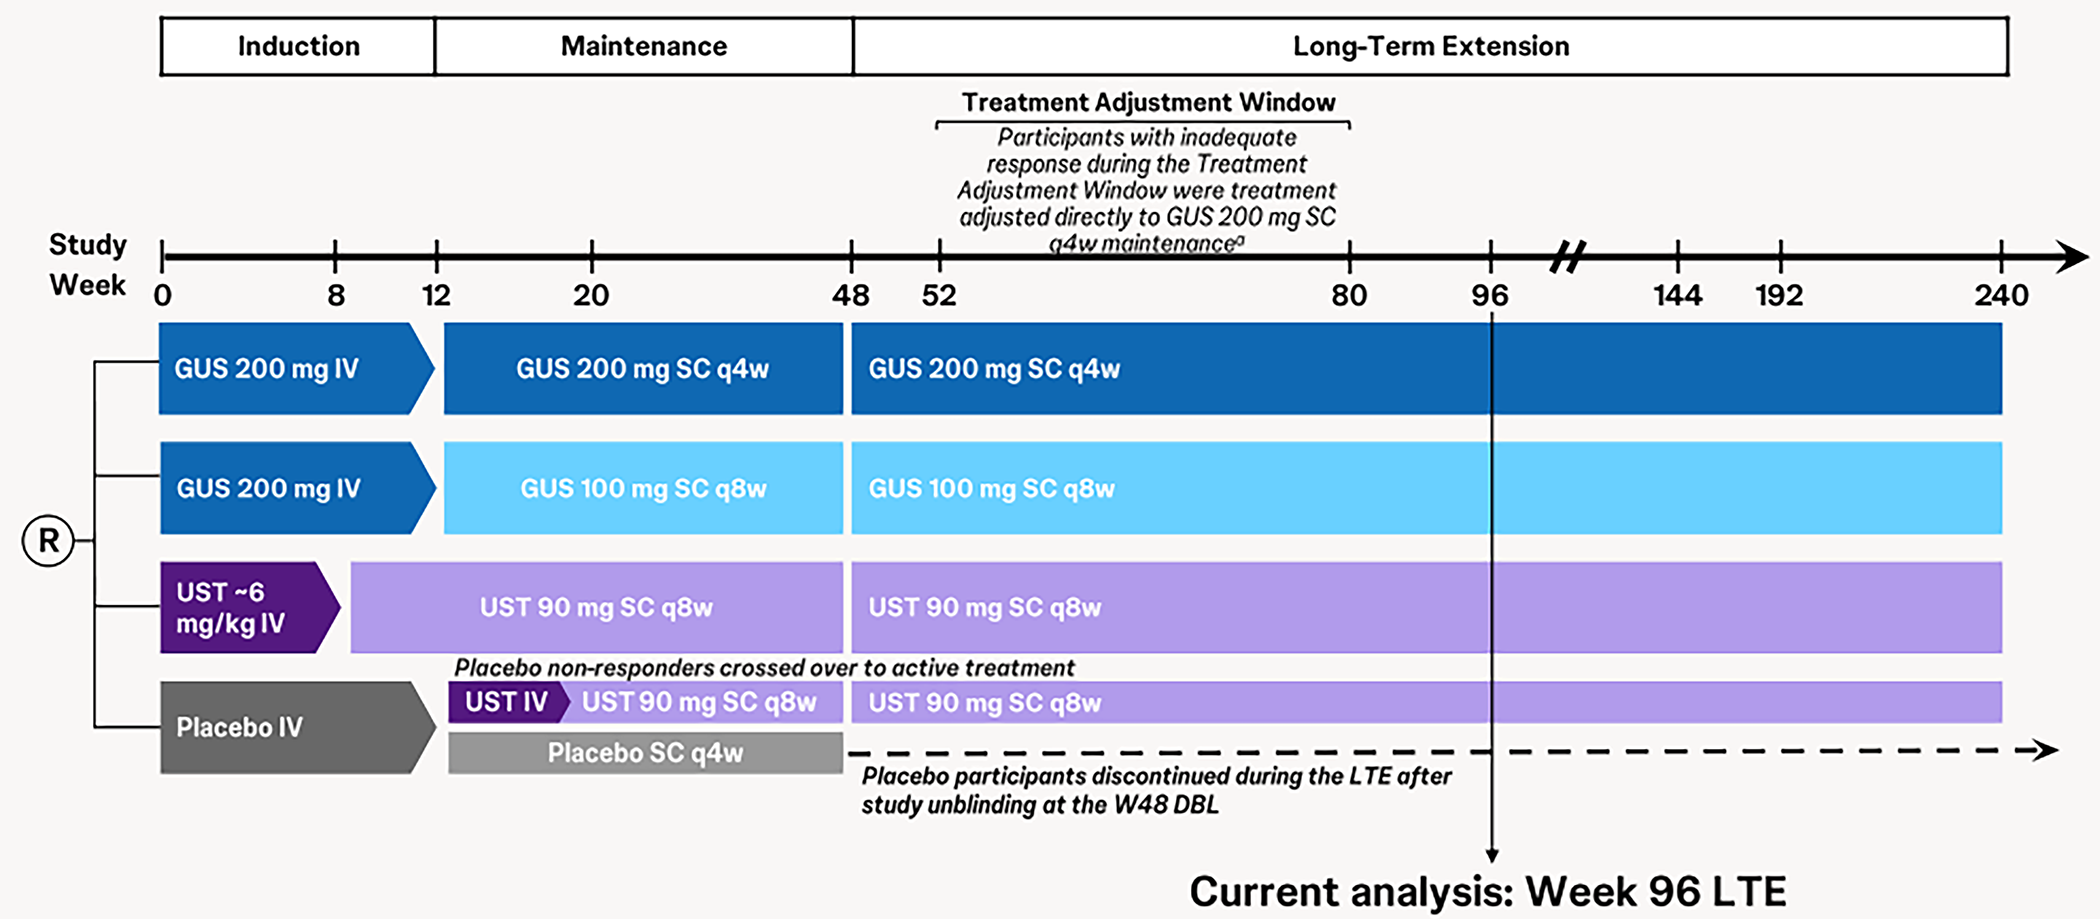
CDAI = Crohn’s Disease Activity Index; DBL = database lock; GUS = guselkumab; LTE = long-term extension; q4w = every 4 weeks; q8w = every 8 weeks; R = randomization; SC = subcutaneous; UST = ustekinumab; W48 = week 48.
aParticipants who lost response between week 52 and week 80 underwent a dose adjustment to GUS 200 mg SC every 4 weeks as a maintenance dose. Participants who were already receiving the GUS 200 mg SC every 4 weeks maintenance dose and met inadequate response criteria received a “sham” dose adjustment. Inadequate response is defined as not being in clinical response and having a CDAI score of at least 220 points between week 52 and week 80 (clinical response was defined as a reduction from baseline [i.e., week 0] in the CDAI score of ≥ 100 points or being in clinical remission [CDAI score of < 150]).
Source: Phase III GALAXI 2 and GALAXI 3 long-term extension’ Week 96 Results Deck (data on file).43
Populations
The inclusion and exclusion criteria in the LTE phase aligned with those of the GALAXI 2 and GALAXI 3 pivotal trials. Patients were eligible for inclusion in both the GALAXI 2 and GALAXI 3 studies if they were aged at least 18 years at the time of informed consent and diagnosed with moderately to severely active CD (of at least 3 months’ duration). At baseline, patients were required to have had a diagnosis of clinically active CD (a baseline CDAI score ≥ 220 but ≤ 450 and either a mean daily stool frequency count > 3 or a mean daily abdominal pain score > 1) and endoscopic evidence of ileocolonic CD (a screening endoscopy SES-CD score ≥ 6, or ≥ 4 for patients with isolated ileal disease). Patients also had a history of inadequate response or intolerance to conventional or biologic therapies.12,13 Patients were eligible to enter the LTE if they were considered by the investigator to be benefiting from treatment based on week 48 clinical and endoscopic evaluations.
Interventions
All participants continued to receive active study intervention administration in the LTE study in a blinded fashion until study unblinding to the investigative sites. Patients receiving guselkumab 200 mg SC every 4 weeks (regimen 2) or guselkumab 100 mg SC every 8 weeks (regimen 1) during the maintenance phase continued with the same dosage in the LTE phase. Similarly, patients on 90 mg SC every 8 weeks of ustekinumab during the maintenance phase maintained the same dosage in the LTE phase. Patients who were receiving placebo SC every 4 weeks during the maintenance phase were discontinued from the LTE phase after study unblinding (of the maintenance phase) at the week 48 database lock.
Treatment Adjustment for Inadequate Response
Patients receiving guselkumab or ustekinumab maintenance treatment who met inadequate response criteria between week 52 (i.e., the first visit at which treatment adjustment is permitted) and week 80 (i.e., the last visit at which treatment adjustment is permitted) were eligible for a treatment adjustment (i.e., the first-time inadequate response criteria are met). Patients had their dose adjusted to guselkumab 200 mg SC every 4 weeks (high dose). Those already on guselkumab 200 mg SC every 4 weeks and meeting inadequate response criteria received a sham dose adjustment.
Participants who were on ustekinumab, or the lower SC maintenance dose of guselkumab, were eligible to receive a blinded, treatment adjustment to the highest guselkumab SC maintenance dose as defined in the phase III studies (200 mg SC every 4 weeks). Participants who were already receiving the highest guselkumab SC maintenance dose received sham treatment adjustment. Participants who had received treatment adjustments remained on their new treatment regimen for the remainder of the LTE phase.
At week 96, the benefit of treatment adjustment was evaluated. Assessments also took place before week 96 for the treatment adjustment group. Continued participation in the remaining duration of the LTE was based on the investigator’s clinical judgment. Discontinuation of study intervention was considered for patients with persistent unsatisfactory responses or clinically significant worsening of CD where continuation of the study intervention was not in the patient’s best interest.
Outcomes
Table 31 presents the outcomes assessed in the LTE: clinical remission; 90-day, corticosteroid-free remission; endoscopic response; endoscopic remission; clinical remission and endoscopic response; and deep remission. Safety outcomes assessed included AEs, SAEs, serious infections, AEs leading to discontinuation, and AEs of clinical and special interest.
Table 31: Study Definitions for End Points
Outcome measure | Time point | Definition |
|---|---|---|
Clinical remission | Week 96 | CDAI score < 150 |
90-day, CS-free clinical remission | Week 96 | CDAI score < 150 and CS-free for ≥ 90 days |
Endoscopic response | Week 96 | ≥ 50% improvement from baseline in the SES-CD score or an SES-CD score ≤ 2 |
Endoscopic remission | Week 96 | SES-CD score ≤ 4 with at least a 2-point reduction from baseline and no subscore greater than 1 in any individual subcomponent |
Clinical remission and endoscopic response | Week 96 | CDAI score < 150 (clinical remission) and ≥ 50% improvement from baseline in the SES-CD score or an SES-CD score ≤ 2 (endoscopic response) |
Deep remission | Week 96 | Clinical remission (CDAI score < 150) and endoscopic remission (global definition; SES-CD score ≤ 4 with at least a 2-point reduction from baseline and no subscore greater than 1) |
Safety | Week 96 | AEs, SAEs, serious infections, AEs leading to discontinuation, and AEs of clinical and special interest |
AE = adverse event; CDAI = Crohn’s Disease Activity Index; CS = corticosteroid; SAE = serious adverse event; SES-CD = Simple Endoscopic Score for Crohn’s Disease.
Source: Phase III GALAXI 2 and GALAXI 3 long-term extension studies’ week 96 results deck (data on file).43
Statistical Analysis
Sample Size Calculations
There was no defined sample size for the LTE phases of both trials. At week 0 of the parent studies, a target of 980 patients was planned for randomization (the GALAXI 2 study [n = 490] or the GALAXI 3 study [n = 490]), using a permuted block randomization with the baseline CDAI score (≤ 300 or > 300), the baseline SES-CD score (≤ 12 or > 12), prior BIO-Failure status (yes or no), and baseline corticosteroid use (yes or no) as the stratification variables. Within each stratum, patients in each study were randomized in a 2:2:2:1 ratio to receive 1 of 2 dose regimens of guselkumab, ustekinumab, or placebo, respectively.
Statistical Testing
There were no hypothesis tests defined in the LTE phases of the GALAXI 2 and GALAXI 3 trials. Analyses were performed at week 96. Baseline was defined as the last observation before or on the day of the first study intervention (referred to as week 0). The LTE phase began on the date of the first administration of the week 48 study intervention. Patients in the GALAXI 2 and GALAXI 3 trials in the guselkumab high-dose and guselkumab low-dose regimens were pooled and assessed against the ustekinumab group.
LTE-Only Analyses
The primary analyses of the efficacy end points in the LTE were analyzed using the LTE efficacy analysis set consisting of all patients who had entered the LTE and had received 1 or more (partial or complete) dose of the study drug during the LTE.44 Outcomes were summarized using counts and percentages with 95% CIs. Adjusted treatment differences, 95% CIs, and nominal P values were derived using the common risk difference based on the Mantel-Haenszel stratum weights and the Sato variance estimator. Stratification variables used included the baseline CDAI score (≤ 300 or > 300), the baseline SES-CD score (≤ 12 or > 12), BIO-Failure status (yes or no), and baseline corticosteroid use (yes or no). Risk differences were obtained using the Mantel-Haenszel stratum weights test while adjusting for the stratification factors.
Supplementary Overtime Analysis
Overtime end points were assessed using the primary efficacy analysis set. This set consisted of all randomized patients with screening SES-CD scores of 6 or more (or 4 or more for patients with isolated ileal disease) who had received 1 or more (partial or complete) dose of the study drug. At time points with data up to and including the time point of the analysis, comparisons for guselkumab 100 mg versus ustekinumab (randomized), guselkumab 200 mg versus ustekinumab (randomized), and guselkumab combined (100 mg and 200 mg) versus ustekinumab (randomized) were conducted in terms of the common (overall) risk difference at a significance level of 0.05 using a 2-sided test. These comparisons were conducted for the following outcomes: clinical remission, clinical response, PRO-2 remission, corticosteroid-free (90-day) clinical remission, endoscopic response, endoscopic remission (region-specific), endoscopic remission (global), endoscopic remission (global — alternative definition), clinical remission and endoscopic response, and clinical remission and endoscopic remission (global) (i.e., deep remission [global]).
Descriptive statistics (i.e., N, mean, median, SD, interquartile range, minimum, and maximum) were conducted to explore the long-term effects of guselkumab. Counts, percentages, and 95% CIs for point estimates were used to summarize categorical variables.44 No formal comparisons were made and P values derived were not adjusted for multiplicity.
For binary end points, patients with missing data at a particular time point due to a missed visit or missed data collection, and after accounting for ICE strategies, were considered in the nonresponse group. In the scenario where efficacy analyses were performed that included the placebo treatment group, patients randomized to placebo and who did not cross over to ustekinumab at week 12 were excluded from the efficacy analyses at time points after study treatment discontinuation due to study unblinding.44
Safety Analyses
Safety data that included AEs and changes in laboratory assessments were summarized. Treatment-emergent AEs were summarized by treatment group and the Medical Dictionary for Regulatory Activities system organ class and preferred terms. For all continuous safety variables, descriptive statistics included N, mean, SD, median, minimum, and maximum. Categorical variables were summarized using frequency counts and percentages. No statistical comparisons were planned.44
Analysis Populations
A summary of all analysis sets and associated definitions is presented in Table 32.
Table 32: Analysis Sets for GALAXI 2 and GALAXI 3 LTE Studies
Population | Definition for handling of ICEs and missing data | Application |
|---|---|---|
Primary efficacy analysis set (N = 1,021) |
| Efficacy analysis |
LTE efficacy analysis set (N = 862) |
| Efficacy analysis |
LTE safety analysis set (N = 863) | Randomized patient who entered the LTE and received ≥ 1 dose of study intervention (including a partial dose) during the LTE phase | Safety analysis |
CD = Crohn disease; ICE = intercurrent event; LTE = long-term extension; NRI = nonresponse imputation; SC = subcutaneous; SES-CD = Simple Endoscopic Score for Crohn’s Disease.
Note: NRI were separate analysis cohorts within the LTE efficacy analysis set.
Source: Phase III GALAXI 2 and GALAXI 3 LTE Week 96 Results Deck (data on file).43
Results
Baseline Characteristics
A summary of relevant baseline demographics and disease characteristics are presented in Table 33. Overall, the mean age across patients enrolled in the LTE phases of both studies was 36.5 years (SD = 12.69 years). In the pooled guselkumab group, the mean age was 35.8 years (SD = 12.17 years) in regimen 1 (guselkumab 200 mg IV every 4 weeks to 100 mg SC every 8 weeks), 36.6 years (SD = 13.14 years) in regimen 2 (guselkumab 200 mg IV every 4 weeks to 200 mg SC every 4 weeks) versus ████ ██████ █ in the ustekinumab group, which was consistent with the parent studies. At week 48, the mean (SD) CDAI scores were lower than values reported at baseline in the parent studies (93.8 [SD = 77.89], 85.6 [SD = 65.27] and ███████, in the regimen 1, regimen 2, and ustekinumab groups, respectively). The mean SES-CD scores were also lower than those reported at baseline in the parent studies (5.7 [SD = 6.10], 4.7 [SD = 5.07], and ███████ in the regimen 1, regimen 2, and ustekinumab groups, respectively). The median fecal calprotectin was 214.5, 132.0, and ███████ in the regimen 1, regimen 2, and ustekinumab groups, respectively, which was lower than those reported in the parent studies at baseline.
Table 33: Summary of Demographics and Disease Characteristics in the Pooled GALAXI 2 and GALAXI 3 LTE Study (LTE Efficacy Analysis Set)
Characteristic | Regimen 1a (N = 251) | Regimen 2b (N = 256) | Randomized ustekinumab (N = 241)c |
|---|---|---|---|
Age (years), mean (SD) | 35.8 (12.17) | 36.6 (13.14) | ████ ███████ |
Sex, n (%) | |||
Male | 141 (56.2) | 158 (61.7) | ███ ██████ |
Female | 110 (43.8) | 98 (38.3) | ███ ██████ |
CDAI score at week 48, mean (SD) | 93.8 (77.89) | 85.6 (65.27) | ████ ███████ |
Daily average abdominal pain score at week 48, mean (SD) | 0.60 (0.682) | 0.50 (0.570) | ████ ███████ |
Daily average stool frequency score at week 48, mean (SD) | 1.27 (1.716) | 1.33 (1.877) | ████ ███████ |
SES-CD score at week 48, mean (SD) | 5.7 (6.10) | 4.7 (5.07) | ███ ██████ |
CRP (mg/L) at week 48, median (IQR) | 2.2 (0.8 to 7.1) | 2.2 (0.9 to 4.9) | ███ █████████ |
Endoscopic disease severity per SES-CD score at week 48 | |||
n | 238 | 243 | ███ |
0 to 2, n (%) | 73 (29.7) | 67 (26.4) | ██ ██████ |
3 to 6, n (%) | 95 (38.6) | 131 (51.6) | ██ ██████ |
7 to 16, n (%) | 62 (25.2) | 47 (18.5) | ██ ██████ |
> 16, n (%) | 16 (6.5) | 9 (3.5) | ██ █████ |
Fecal calprotectin (mcg/g) at week 48 | |||
n | 238 | 243 | ███ |
Median (IQR) | 214.5 (73.0 to 638.0) | 132.0 (50.0 to 408.0) | █████ ████████████ |
CRP concentration (mg/L) at week 48 | |||
N | 245 | 251 | ███ |
Mean (SD) | 6.1 (10.69) | 4.6 (7.88) | ███ ███████ |
Involved GI areas (assessed by central reader) at week 48 | |||
n | 246 | 254 | ███ |
Ileum only, n (%) | 59 (24.0) | 89 (35.0) | ██ ██████ |
Colon only, n (%) | 85 (34.6) | 81 (31.9) | ██ ██████ |
Ileum and colon, n (%) | 38 (15.4) | 27 (10.6) | ██ ██████ |
Concomitant medications for CD and medication history at baseline, n (%) | |||
Patients receiving concomitant therapies | 179 (71.3) | 192 (75.0) | ███ ██████ |
Oral corticosteroid use Corticosteroids | 92 (36.7) | 94 (36.7) | ██ ██████ |
Beclomethasone dipropionate) | 63 (25.1) | 62 (24.2) | ██ ██████ |
Budesonide | 31 (12.4) | 32 (12.5) | ██ ██████ |
Beclomethasone dipropionate | 0 | 0 | |█ |
Antibiotics | 10 (4.0) | 15 (5.9) | ██ █████ |
Immunomodulatory drugs | 79 (31.5) | 88 (34.4) | ██ ██████ |
6-mercaptopurine or azathioprine | 76 (30.3) | 82 (32.0) | ██ ██████ |
Methotrexate | 3 (1.2) | 5 (2.0) | | █████ |
Oral aminosalicylates biologic medication history | 108 (43.0) | 105 (41.0) | ███ ██████ |
Patients with a history of biologic failure, n (%) | 129 (51.4) | 122 (47.7) | ███ ██████ |
Primary nonresponse, secondary nonresponse, or intolerance, n (%) | |||
At least 1 anti-TNF | 125 (49.8) | 119 (46.5) | ███ ██████ |
Two or more anti-TNFs | 26 (10.4) | 25 (9.8) | ██ ██████ |
Anti-TNF only | 110 (43.8) | 108 (42.2) | ██ ██████ |
Vedolizumab | 19 (7.6) | 14 (5.5) | ██ ██████ |
Vedolizumab only | 4 (1.6) | 3 (1.2) | | █████ |
Vedolizumab and at least 1 anti-TNF | 15 (6.0) | 11 (4.3) | ██ █████ |
Participants without a biologic failure history, n (%) | 122 (48.6) | 134 (52.3) | ███ ██████ |
No prior exposure to biologics | 109 (43.4) | 115 (44.9) | ███ ██████ |
Prior exposure to biologics but no documented biologic failure | 13 (5.2) | 19 (7.4) | ██ █████ |
Immunomodulatory drugs at week 48, n (%) | 68 (27.1) | 82 (32.0) | ██ ██████ |
Oral corticosteroids at week 48, n (%) | 14 (5.6) | 10 (3.9) | ██ █████ |
Anti-TNF = anti–tumour necrosis factor; CD = Crohn disease; CDAI = Crohn’s Disease Activity Index; CRP = C-reactive protein; GI = gastrointestinal; IQR = interquartile range; LTE = long-term extension; q.4.w. = every 4 weeks; q.8.w. = every 8 weeks; SC = subcutaneous; SD = standard deviation; SES-CD = Simple Endoscopic Score for Crohn’s Disease.
aRegimen 1 = guselkumab low dose (200 mg IV every 4 weeks to 100 mg SC every 8 weeks).
bRegimen 2 = guselkumab high dose (200 mg IV every 4 weeks to 200 mg SC every 4 weeks).
cIncludes patients randomized to ustekinumab.
Source: Phase III GALAXI 2 and GALAXI 3 long-term extension studies’ week 96 results deck (data on file).43
Patient Disposition
A summary of patient disposition is presented in Table 34. Treatment discontinuation rates before week 96 were similar across pooled groups (9.6%, 6.6%, and ████ in the regimen 1 group [200 mg IV guselkumab every 4 weeks to 100 mg SC every 8 weeks], the regimen 2 group [200 mg IV guselkumab every 4 weeks to 200 mg SC every 4 weeks], and the ustekinumab group, respectively). The most common reasons for treatment discontinuation were patient withdrawal, AEs, and a lack of efficacy.
Table 34: Patient Disposition in the LTE Study (LTE Efficacy Analysis Set)
Characteristic | Regimen 1a (N = 251) | Regimen 2b (N = 256) | Randomized ustekinumabc (N = 241) |
|---|---|---|---|
Discontinued study drug before week 96, n (%) | 24 (9.6) | 17 (6.6) | ██ █████ |
Reason for discontinuation, n (%) | |||
Withdrawal by patient | 7 (2.8) | 7 (2.7) | | █████ |
AE: Worsening of CD | 4 (1.6) | 0 | | █████ |
AE: Other | 4 (1.6) | 2 (0.8) | | █████ |
Lost to follow-up | 0 | 0 | | █████ |
Discontinued after week 48 unblinding | 0 | 0 | |█ |
Lack of efficacy | 5 (2.0) | 4 (1.6) | | █████ |
Death | 0 | 0 | | █████ |
Participant refused further study treatment | 0 | 1 (0.4) | | █████ |
CD-related surgery | 0 | 3 (1.2) | |█ |
Pregnancy | 0 | 0 | |█ |
Protocol deviation | 0 | 0 | |█ |
Other | 4 (1.6) | 0 | |█ |
AE = adverse event; CD = Crohn disease; LTE = long-term extension; SC = subcutaneous.
aRegimen 1 = guselkumab low dose (200 mg IV every 4 weeks to 100 mg SC every 8 weeks).
bRegimen 2 = guselkumab high dose (200 mg IV every 4 weeks to 200 mg SC every 4 weeks).
cIncludes patients randomized to ustekinumab.
Source: Phase III GALAXI 2 and GALAXI 3 long-term extension studies’ week 96 results deck (data on file).43
Exposure to Study Treatments
Treatment exposure in the LTE phase of the GALAXI 2 and GALAXI 3 studies is presented in Table 35.
Table 35: Patient Exposure in the LTE Study (LTE Safety Analysis Set)
Characteristic | Treatment group up to dose adjustmenta | ||
|---|---|---|---|
Regimen 1b | Regimen 2c | Combined ustekinumabd | |
Overall summary of duration and exposure from week 48 through week 96 | |||
LTE safety analysis set, N | 251 | 257 | ███ |
Average duration of follow-up (weeks), mean | 42.1 | 43.4 | ████ |
Average exposure (administrations), n | 5.2 | 10.7 | ███ |
LTE = long-term extension; q.4.w. = every 4 weeks; q.8.w. = every 8 weeks; SC = subcutaneous.
aTreatment group at the start of LTE. Includes events for patients who dose-adjusted from week 48 up to the time point of dose adjustment, and all events from week 48 through week 96 for patients who never dose-adjusted.
bRegimen 1 = guselkumab low dose (200 mg IV every 4 weeks to 100 mg SC every 8 weeks).
cRegimen 2 = guselkumab high dose (200 mg IV every 4 weeks to 200 mg SC every 4 weeks).
dParticipants who were receiving placebo SC, ustekinumab SC, or the lower SC maintenance dose of guselkumab and had an inadequate response underwent a dose adjustment between week 52 and week 80 to receive guselkumab 200 mg SC every 4 weeks. Participants who were receiving the maintenance dose of guselkumab 200 mg SC every 4 weeks and met the inadequate response criteria received a “sham” dose adjustment to dosing of guselkumab 200 mg SC every 4 weeks between week 52 and week 80.
eParticipants who were randomized to receive maintenance dosing of guselkumab 200 mg SC every 4 weeks or had a dose adjustment (including sham) to dosing of guselkumab 200 mg SC every 4 weeks. For patients who had a dose adjustment only, data after their first guselkumab 200 mg dose are included.
Source: Phase III GALAXI 2 and GALAXI 3 LTE Week 96 Results Deck (data on file).43
Concomitant Medications and Cointerventions
The use of concomitant medications or cointerventions in the LTE study compared to the parent studies (the GALAXI 2 and GALAXI 3 trials) was not reported.12,13
Efficacy
At week 96, the efficacy of guselkumab was evaluated in the high-dose regimen (200 mg IV every 4 weeks to 200 mg SC every 4 weeks) and the low-dose regimen (200 mg IV every 4 weeks to 100 mg SC every 8 weeks) compared to ustekinumab in the primary efficacy analysis set and the LTE efficacy analysis set. Within the primary efficacy analysis set, 6 outcomes were reported (clinical remission, corticosteroid-free remission, endoscopic response, endoscopic remission, clinical remission and endoscopic response, and deep remission); 3 outcomes (clinical remission, endoscopic response, and endoscopic remission) were reported in the LTE efficacy analysis set. Table 36 presents the key efficacy outcomes assessed in the primary efficacy analysis set in the LTE phase of the GALAXI 2 and GALAXI 3 trials and Table 37 presents efficacy data in the LTE efficacy analysis set (NRI).
Clinical Remission at Week 96
In the primary efficacy analysis set, the rates of clinical remission were 59.4% in the pooled regimen 1 group (200 mg IV guselkumab every 4 weeks to 100 mg SC every 8 weeks), 63.2% in the pooled regimen 2 group (200 mg IV guselkumab every 4 weeks to 200 mg SC every 4 weeks), and █████ in the ustekinumab group at week 96. In the LTE efficacy analysis set, the rates of patients with clinical remission were 75.1%, 78.1%, and █████ in the pooled regimen 1, regimen 2, and ustekinumab groups, respectively, at week 96.
Corticosteroid-Free (90-Days) Clinical Remission at Week 96
In the primary efficacy analysis set, the rates of patients with corticosteroid-free clinical remission were 57% in the pooled regimen 1 group, 60.8% in the pooled regimen 2 group, and █████ in the pooled ustekinumab group at week 96.
Endoscopic Response at Week 96
In the primary efficacy analysis set, the rates of patients with endoscopic response were 44.1%, 44.6%, and █████ in the pooled regimen 1, regimen 2, and ustekinumab groups, respectively, at week 96. In the LTE efficacy analysis set, the rates of patients with endoscopic response were 53.6%, 55.4%, and █████ in the pooled regimen 1, regimen 2, and ustekinumab group at week 96.
Endoscopic Remission (Global Definition) at Week 96
In the primary efficacy analysis set, guselkumab achieved similar rates of endoscopic remission compared to ustekinumab at week 96 (28.3%, 31.4%, and █████ respectively, in the pooled regimen 1, regimen 2, and ustekinumab groups). In the LTE efficacy analysis set, the rate of patients with endoscopic remission was 34.6%, 39.3%, and █████ in the pooled regimen 1, regimen 2, and ustekinumab groups at week 96.
Clinical Remission and Endoscopic Response at Week 96
In the primary efficacy analysis set, the rates of patients with clinical remission and endoscopic response were 40.6% and 41.6% in the pooled regimen 1 and regimen 2 groups, respectively, compared to █████ in the pooled ustekinumab group at week 96.
Deep Remission
In the primary efficacy analysis set, deep remission (clinical remission and endoscopic response) occurred among 26.2%, 29.4%, and ███ in the pooled regimen 1, regimen 2, and ustekinumab groups at week 96.
Table 36: Summary of Efficacy at Week 96 — Pooled GALAXI 2 and GALAXI 3 Studies, Primary Efficacy Analysis Set (NRI)
Outcome | Guselkumab regimen 1a (N = 286) | Guselkumab regimen 2b (N = 296) | Randomized ustekinumabc (N = 291) |
|---|---|---|---|
Clinical remission at week 96 | |||
Number of patients in clinical remission, n (%)d,e,f | 170 (59.4) | 187 (63.2) | ███ ██████ |
95% CIg | 53.8 to 65.1 | 57.7 to 68.7 | ██████ █████ |
Adjusted difference vs. ustekinumab, (%) 95% CIh | ███ ██████ █████ | ████ █████ █████ | ██ |
P valuei,j | █████ | █████ | ██ |
Corticosteroid-free (90-day) clinical remission at week 96 | |||
Number of patients with corticosteroid-free clinical remission,d,e,f n (%) | 163 (57.0) | 180 (60.8) | ███ ██████ |
95% CIg | 51.3 to 62.7 | 55.2 to 66.4 | ██████ █████ |
Adjusted treatment difference vs. ustekinumab, (%) 95% CIh | ███ ██████ █████ | ████ █████ █████ | |█ |
P valuei,j | █████ | █████ | ██ |
Endoscopic response at week 96 | |||
Number of patients in endoscopic response,d,e,f n (%) | 126 (44.1) | 132 (44.6) | ███ ██████ |
95% CIg | 38.3 to 49.8 | 38.9 to 50.3 | ██████ █████ |
Adjusted treatment difference vs. ustekinumab, 95% CIh | ███ █████ █████ | ███ █████ █████ | ██ |
P valuei,j | █████ | █████ | ██ |
Endoscopic remission (global definition) at week 96 | |||
Number of patients in endoscopic remissiond,e,f n (%) | 81 (28.3) | 93 (31.4) | ██ ██████ |
95% CIg | 23.1 to 33.5 | 26.1 to 36.7 | ██████ █████ |
Adjusted treatment difference vs. ustekinumab, (%) 95% CIh | ███ ██████ █████ | ███ ██████ █████ | ██ |
P valuei, j | █████ | █████ | ██ |
Clinical remission and endoscopic response at week 96 | |||
Number of patients in clinical remission and endoscopic response,d,e,f n (%) | 116 (40.6) | 123 (41.6) | ██ ██████ |
95% CIg | 34.9 to 46.2 | 35.9 to 47.2 | ██████ █████ |
Adjusted difference vs. ustekinumab, (%) 95% CIh | ███ █████ █████ | ███ █████ █████ | ██ |
P valuei,j | █████ | █████ | ██ |
Deep remission at week 96 | |||
Number of patients in deep remission,d,e,f n (%) | 75 (26.2) | 87 (29.4) | ██ ██████ |
95% CIg | 21.1 to 31.3 | 24.2 to 34.6 | ██████ █████ |
Adjusted treatment difference vs. ustekinumab, (%) 95% CIh | ███ ██████ █████ | ███ ██████ █████ | ██ |
P valuei, j | █████ | █████ | ██ |
AE = adverse event; BIO-Failure = biologic therapy failure or intolerance; CD = Crohn disease; CDAI = Crohn’s Disease Activity Index; CI = confidence interval; ICE = intercurrent event; LTE = long-term extension; NA = not applicable; NRI = nonresponse imputation; q.4.w. = every 4 weeks; q.8.w. = every 8 weeks; SC = subcutaneous; SES-CD = Simple Endoscopic Score for Crohn’s Disease; vs. = versus.
Note: Regimen 1 = guselkumab low dose (200 mg IV every 4 weeks to 100 mg SC every 8 weeks). Regimen 2 = guselkumab high dose (200 mg IV every 4 weeks to 200 mg SC every 4 weeks). All P values were nominal.
aPatients receiving 200 mg SC every 4 weeks at the start of the LTE.
bPatients receiving 200 mg SC every 4 weeks at the start of the LTE.
cUstekinumab approximately 6 mg/kg IV, followed by 90 mg SC every 8 weeks.
dClinical remission was defined as a CDAI score < 150.
eICE strategies: Patients who had a CD-related surgery (known as ICE category 1); discontinued the study drug due to a lack of efficacy, an AE of worsening CD, or week 20/24 nonresponse status (known as ICE category 2); discontinued the study drug for any other reason other than COVID-19–related reasons, a regional crisis, a lack of efficacy, an AE of worsening CD, or week 20/24 nonresponse status as specified at treatment discontinuation (known as ICE category 3); had a dose adjustment (including “sham”) during week 52 to week 80, between week 48 and the analysis time point (known as ICE category 5); had a prohibited change in CD medications before week 48 (known as ICE category 6); or did not discontinue study treatment but did not enter the LTE period (known as ICE category 7) were considered not to have met the end point criteria. Patients who discontinued the study drug due to COVID-19–related reasons — excluding a COVID-19 infection — or a regional crisis, and placebo patients who discontinued due to study unblinding (known as ICE category 4) had their observed data used, if available, to determine response status at the analysis time point.
fMissing data imputation: After accounting for ICE strategies, patients randomized to an active treatment group, or patients randomized to placebo and who crossed over to ustekinumab at week 12 who were missing a CDAI score at the analysis time point were considered as not having clinical remission at the analysis time point.
gThe CIs for the proportion of participants meeting the end point in each treatment group were based on the normal approximation confidence limits. In cases of rare events, the exact confidence limits were provided.
hThe adjusted treatment difference and the CIs were based on the common risk difference by use of Mantel-Haenszel stratum weights and the Sato variance estimator.
iAdjusted treatment difference was based on the common risk difference by use of Mantel-Haenszel stratum weights and the Sato variance estimator. All P values were nominal and based on the common risk difference by use of Mantel-Haenszel stratum weights and the Sato variance estimator. The stratification variables used are the baseline CDAI score (≤ 300 or > 300), the baseline SES-CD score (≤ 12 or > 12), BIO-Failure status (yes or no), and baseline corticosteroid use (yes or no).
jAnalyses are unadjusted for multiplicity. There is an increased risk of false-positive conclusions.
Source: Phase III GALAXI 2 and GALAXI 3 LTE week 96 Results Deck (data on file).43
Table 37: Summary of Efficacy at Week 96 — LTE Efficacy Analysis Set (NRI)
Outcome | Regimen 1a (N = 237) | Regimen 2b (N = 242) | Randomized ustekinumabc (N = 234) |
|---|---|---|---|
Clinical remission (n, %) | 178 (75.1) | 189 (78.1) | ███ ██████ |
95% CI | 69.6 to 80.6 | 72.9 to 83.3 | ██████ █████ |
Difference vs. ustekinumab (%) | ███ | ████ | ██ |
Endoscopic response | |||
Patients in endoscopic response,d,e,f n (%) | 127 (53.6) | 134 (55.4) | ███ ██████ |
95% CIg | 47.2 to 59.9 | 49.1 to 61.6 | ██ |
Difference vs. ustekinumab (%) | ███ | ████ | ██ |
Endoscopic remission (global definition) | |||
Patients in endoscopic remission,d,e,f n (%) | 82 (34.6) | 95 (39.3) | ██ ██████ |
95% CIg | 28.5 to 40.7 | 33.1 to 45.4 | ██ |
Difference vs. ustekinumab (%) | ███ | ███ | ██ |
AE = adverse event; CD = Crohn disease; CI = confidence interval; ICE = intercurrent event; LTE = long-term extension; NA = not applicable; NRI = nonresponse imputation; q.4.w. = every 4 weeks; q.8.w. = every 8 weeks; SC = subcutaneous; SES-CD = Simple Endoscopic Score for Crohn’s Disease; vs. = versus.
Note: Regimen 1 = guselkumab low dose (200 mg IV every 4 weeks to 100 mg SC every 8 weeks). Regimen 2 = guselkumab high dose (200 mg IV every 4 weeks to 200 mg SC every 4 weeks). Dose adjustment was considered nonresponse.
aPatients receiving 200 mg SC every 4 weeks at the start of the LTE.
bPatients receiving 200 mg SC every 4 weeks at the start of the LTE.
cUstekinumab approximately 6 mg/kg IV, followed by 90 mg SC every 8 weeks.
dEndoscopic response was defined as ≥ 50% improvement from baseline in an SES-CD score or an SES-CD score ≤ 2.
eICE strategies: Patients who had a CD-related surgery at or after week 48 (known as ICE category 1); discontinued the study drug due to a lack of efficacy or an AE of worsening CD (known as ICE category 2); discontinued the study drug for any other reason other than COVID-19–related reasons, a regional crisis, a lack of efficacy, or an AE of worsening CD (known as ICE category 3); or had a dose adjustment (including “sham”) during week 52 to week 80, between week 48 and the analysis time point (known as ICE category 5), were considered not to have met the end point criteria. Patients who discontinued the study drug due to COVID-19–related reasons (excluding COVID-19 infection) or a regional crisis and placebo patients who discontinued due to study unblinding (known as ICE category 4) or patients who had a CD-related surgery before week 48 (ICE category 1) had their observed data used, if available, to determine response status at the analysis time point.
fMissing data imputation: After accounting for ICE strategies, participants who were missing an SES-CD score at the analysis time point were considered as not having endoscopic response at the analysis time point.
hEndoscopic remission (per the global definition) is defined as an SES-CD score ≤ 4 and at least a 2-point reduction from baseline and no subscore greater than 1 in any individual component.
gThe CIs for the proportion of patients meeting the end point in each treatment group were based on the normal approximation confidence limits. In cases of rare events, the exact confidence limits were provided.
Sources: Phase III GALAXI 2 and GALAXI 3 long-term extension studies’ week 96 results deck (data on file).43
Harms
Table 38 presents a summary of safety outcomes in the LTE phase. AE, SAEs, deaths, and notable harms were reported for patients enrolled in the LTE phase.
Adverse Events
In the LTE safety analysis set, 61.4%, 58.8%, and █████ of patients in the regimen 1, regimen 2, and ustekinumab groups, respectively, reported at least 1 AE.
Serious Adverse Events
In total, 5.2%, 5.8%, and ████ of patients reported at least 1 SAE in the regimen 1, regimen 2, and ustekinumab groups, respectively.
Withdrawals Due to AEs
AEs leading to discontinuation were generally similar across treatment groups in the LTE phase. In total, 2%, 1.6%, ████ in the regimen 1, regimen 2, and ustekinumab groups, respectively, discontinued treatments in the LTE phase.
Mortality
There were no deaths reported in the guselkumab treatment groups. In total, ||| patient died in the ustekinumab group.
Notable Harms
Notable harms were not reported in the guselkumab treatment groups in the LTE phase. ███ ████████ ██ ███ ███████████ ████████ █ ██ ████ █████████████ ███ █ ███████ ████████ █ █████ ███████ ██████████████ ██████
Table 38: Safety Results Week 48 Through Week 96 — LTE Safety Analysis Set
Characteristic | Treatment assignment up to dose adjustment | ||
|---|---|---|---|
Regimen 1a | Regimen 2a | Combined ustekinumaba | |
Any AEs | |||
Patients with ≥ 1 AE,b n (%) | 154 (61.4) | 151 (58.8) | ███ ██████ |
SAEs | |||
Patients with ≥ 1 SAE,b n (%) | 13 (5.2) | 15 (5.8) | ██ █████ |
AEs leading to discontinuation of study drug | |||
Patients with ≥ 1 AE leading to discontinuation,b n (%) | 5 (2.0) | 4 (1.6) | | █████ |
Infections | |||
Number of infections, n | 159 | 133 | ███ |
Patients with ≥ 1 infection,b n (%) | 93 (37.1) | 85 (33.1) | ███ ██████ |
Serious infections | |||
Patients with ≥ 1 serious infection,b n (%) | 2 (0.8) | 4 (1.6) | | █████ |
Deaths | |||
Patients with ≥ 1 AE leading to death, n (%) | 0 | 0 | | █████ |
Patients with ≥ 1 AE of special interest from week 48 through week 96 | |||
Patients with ≥ 1 active TB infection,b n (%) | 0 | 1 (0.4) | ██ |
Patients with ≥ 1 malignancy,b n (%) | 0 | 0 | | █████ |
Patients with ≥ 1 AE of clinical interest from week 48 through week 96 | |||
Patients with ≥ 1 anaphylaxis or serum sickness,b n (%) | 0 | 0 | ██ |
Patients with ≥ 1 opportunistic infection,b n (%) | 0 | 3 (1.2) | ██ |
Patients with ≥ 1 MACE,b n (%) | 0 | 0 | | █████ |
Patients with ≥ 1 VTE,b n (%) | 0 | 0 | ██ |
Patients with ≥ 1 clinically important hepatic disorder,c n (%) | 0 | 2 (0.8) | ██ |
AE = adverse event; LTE = long-term extension; MACE = major adverse cardiovascular event; MedDRA = Medical Dictionary for Regulatory Activities; NRI = nonresponse imputation; q.4.w. = every 4 weeks; q.8.w. = every 8 weeks; SAE = serious adverse event; SC = subcutaneous; TB = tuberculosis; VTE = venous thromboembolism.
Note: Regimen 1 = guselkumab low dose (200 mg IV every 4 weeks to 100 mg SC every 8 weeks). Regimen 2 = guselkumab high dose (200 mg IV every 4 weeks to 200 mg SC every 4 weeks). AEs were coded using MedDRA Version 27.0.
aTreatment group at the start of the LTE. Includes events for patients who dose-adjusted from week 48 up to the time point of dose adjustment, and all events from week 48 through week 96 for patients who never dose-adjusted.
bParticipants were counted only once for any given event, regardless of the number of times they actually experienced the event.
cClinically important hepatic disorders: Hepatic disorder AEs reported as SAEs and/or AEs leading to discontinuation of the study intervention.
Sources: Phase III GALAXI 2 and GALAXI 3 LTE Week 96 Results Deck (data on file).43
Critical Appraisal
Internal Validity
Both pivotal studies of the LTEs (the GALAXI 2 and GALAXI 3 trials) were randomized, double-blind, placebo-controlled, parallel-group trials. Appropriate methods were used to ensure randomization (Interactive Web Response System) at the start of the studies and a treat-through design was implemented in the LTE phases where participants remained in their treatment group until the study end (except for placebo nonresponse group at week 12 who crossed over to ustekinumab, and participants with inadequate response between week 52 and week 80 who required dose adjustment — these patients remained in the LTE phase but were considered in the nonresponse group). The descriptive analyses of the LTE analysis set population (and the LTE safety analysis set) were not randomized. The selection of patients in the LTE may have introduced selection bias for the main estimand (LTE patients) because only those patients with continued treatment benefit (approximately 80% of randomized patients) in the opinion of the investigator were included in the LTE. Overall, the baseline demographic and disease characteristics appeared to be reasonably balanced between treatment groups in both studies.
The LTE phase was unblinded at week 48, which may have introduced bias in patient management, the reporting of AEs, and the assessment of subjective clinical outcomes. Concomitant treatments were provided or adjusted at the discretion of the investigator; the impact on estimates of efficacy cannot be quantified.
Overall, the statistical methods in the LTE phases were appropriate. The strategy used to handle ICEs for the main estimands (LTE patients) was relevant and aligned with the guidance of regulatory bodies. However, it is not clear how many patients discontinued for reasons other than a lack of efficacy or AEs (ICE category 3) or who chose not to enter the LTE (ICE category 7). Because these ICEs are not clearly related to a lack of efficacy, imbalances in these occurrences could have introduced bias in the randomized comparisons. However, no information was reported to adequately access the proportion of patients with these ICEs. There was no defined hierarchical testing procedure for the LTE phases in either of the LTEs and statistical analyses were not controlled for multiplicity. Thus, the results were considered exploratory.
The rates of study discontinuation were generally low in both LTE studies and similar between groups, and were mostly attributed to withdrawal by patients, AEs, and a lack of efficacy. NRI was performed for missing data in the primary LTE analysis. The extent of missing data was not clear; therefore, any potential for a risk of bias arising from the imputation methods used cannot be ascertained.
External Validity
In general, the population requested for reimbursement aligns with that of the Health Canada indication. The dosing and administration of guselkumab in the LTE studies were consistent with the product monograph. According to the clinical experts, the patient eligibility criteria and baseline characteristics of both studies were generalizable to adults with moderately to severely active CD in the Canadian clinical setting. The studies included outcomes that were important to patients and clinicians, including clinical remission, clinical response, endoscopic response, and corticosteroid-free clinical remission. However, HRQoL was not reported in the LTE phase. Therefore, the impact of guselkumab on HRQoL in the long term is uncertain.
Indirect Evidence
The content in this section has been informed by materials submitted by the sponsor. The following has been summarized and validated by the review team.
Objectives for the Summary of Indirect Evidence
The sponsor-submitted ITC addresses the lack of head-to-head trial data comparing guselkumab to all relevant comparators for the treatment of moderately to severely active CD. The indirect evidence is used to inform the pharmacoeconomic model.
Description of Indirect Comparisons
The sponsor submitted an SLR and NMA to evaluate the effectiveness of guselkumab compared to other treatments for moderately to severely active CD in both the induction and maintenance phases. Treatment effects were assessed for clinical remission and clinical response at the induction and maintenance periods. Additional outcomes assessed included endoscopic response and a joint outcome of clinical remission plus endoscopic response. Separate NMAs were conducted for the induction and maintenance phases, and for the BIO-Failure and CON-Failure analysis populations. Sensitivity analyses were conducted, including analyses excluding data that account for delayed responses and analyses including the SEQUENCE trial (unblinded). A distinct NMA was also conducted to accommodate the necessary data required for the cost-utility analysis model, integrating estimated ORs with model-estimated baselines from the GALAXI trials to produce absolute outcomes.
Table 39: Study Selection Criteria and Methods for ITCs Submitted by the Sponsor
Characteristic | Indirect comparison |
|---|---|
Population | Adults and select adolescents (aged ≥ 16 years) with moderately to severely active CD (as defined by study) Subgroups of interest:
|
Intervention | The following therapies alone or in combination with conventional therapy Biologics
Sphingosine 1-phosphate receptor modulator
|
Comparator | Active comparator or placebo |
Outcome | Efficacy outcomes (as defined by study)
Safety outcomes
Quality-of-life outcomes
|
Study designs | Randomized, double-blinded or open-label, placebo- and active-controlled, parallel-group trials evaluating efficacy and safety in phase II, phase III, or phase IV |
Publication characteristics | Searches were restricted to published clinical trials (1995 to present) and conference abstracts (2022 to present). |
Exclusion criteria | Irrelevant intervention, non–phase II, non–phase III, or non–phase IV RCT |
Databases searched | Ovid Embase, Ovid MEDLINE, Ovid MEDLINE In-Process & Other Non-Indexed Citations, ePub Ahead of Print, In-Process and other Non-Indexed Citations, and Daily, Ovid Cochrane Central Register of Controlled Trials, Ovid Cochrane Database of Systematic Reviews, ClinicialTrials.gov, conference proceedings (ECCO, ACG, UEGW, DDW, AIBD, Crohn and Colitis Congress), and bibliographic searche |
Selection process | Articles identified were screened by 2 independent reviewers; discrepancies were resolved by an independent third reviewer. |
Data extraction process | Data extraction was performed by 1 reviewer and validated by a second independent reviewer to verify data accuracy. Any discrepancies were resolved by an independent third reviewer. |
Quality assessment | The risk-of-bias assessment of included trials was performed using the NICE: Single Technology Appraisal Evidence Submission checklist for assessment of risk of bias in RCTs.45 Assessments of risk of bias were performed by 1 reviewer and validated by a second independent reviewer to verify agreement; discrepancies were resolved by an independent third reviewer. |
ACG = American College of Gastroenterology; AIBD = Advances in Inflammatory Bowel Diseases; BIO-Failure = biologic therapy failure or intolerance; CD = Crohn disease; CDAI = Crohn’s Disease Activity Index; CON-Failure = conventional therapy failure or intolerance; DDW = Digestive Disease Week; ECCO = European Crohn’s and Colitis Organisation; IBDQ = Inflammatory Bowel Disease Questionnaire; IL-12 = interleukin-12; IL-23 = interleukin-23; JAK = Janus kinase; ITC = indirect treatment comparison; NICE = National Institute for Health and Care Excellence; PRO-2 = patient-reported outcome 2; PROMIS-29 = Patient-Reported Outcomes Measurement Information System - 29; RCT = randomized controlled trial; SES-CD = Simple Endoscopic Score for Crohn’s Disease; SLR = systematic literature review; TNF = tumour necrosis factor; UEGW = United European Gastroenterology Week.
aAdditional comparators included in the broad SLR that are not relevant to the Canadian market. Certolizumab pegol, natalizumab, etrolizumab, mirikizumab, tofacitinib, filgotinib, ozanimod, and etrasimod are not approved for the treatment of CD in Canada.
bClinical remission was measured as a CDAI score < 150.
cClinical response was measured as ≥ 100-point reduction from baseline in the CDAI score or a CDAI score < 150.
dEndoscopic response was measured as a ≥ 50% improvement from baseline in the SES-CD score or an SES-CD score ≤ 2.
eBibliographies of the 2 most recent and relevant SLRs were reviewed for any additional trials; data from these SLRs were not extracted.
Sources: Guselkumab systematic literature review and network meta-analysis report. Details included in the table are from the sponsor’s Summary of Clinical Evidence.46
ITC Design
Objectives
The objective of this study was to evaluate the effectiveness of guselkumab with other available treatments that are currently approved for the treatment of moderately to severely active CD in the induction and maintenance phases of treatment, where maintenance outcomes evaluate response at approximately 1 year in all enrolled patients (i.e., not the response in the population of those with induction responses). Treatment effects for guselkumab relative to other treatments were assessed for clinical remission and clinical response at the induction and maintenance phases. Additional outcomes assessed include endoscopic response, and a joint outcome of clinical remission plus endoscopic response at both the induction and maintenance phases.
Study Selection Methods
An SLR, which was informed by a predetermined protocol, was conducted to identify RCTs that investigated guselkumab or other relevant therapeutic regimens in patients with moderately to severely active CD. Relevant treatment classes included anti-TNF inhibitors, IL-12/IL-23 inhibitors, IL-23 inhibitors, integrin blockers, Janus kinase inhibitors, and sphingosine 1-phosphate receptor modulators. The methods used to conduct the systematic review, extract data, and assess study quality have been presented in Table 39. The search was up to date as of July 2023 for full-text publications and October 2023 for conference abstracts. This broad SLR included additional comparators such as certolizumab pegol, natalizumab, etrolizumab, mirikizumab, tofacitinib, filgotinib, ozanimod, and etrasimod to inform a global NMA strategy that are not relevant to the Canadian market.
The risk-of-bias assessment of included trials was performed using criteria recommended by the University of York Centre for Reviews and Dissemination.45 It was performed by 1 reviewer and validated by a second independent reviewer to verify agreement. Discrepancies were resolved by an independent third reviewer.46
ITC Analysis Methods
Studies were included in the NMA if they were included in the SLR, were blinded, and reported outcomes of interest for patients receiving doses approved in Europe, the US, Canada, and Japan. Only studies with a minimum follow-up duration of 38 weeks were included in the maintenance analysis. NMA outcomes included clinical response, clinical remission, endoscopic response, and a joint outcome of endoscopic response and clinical remission, and were assessed at the induction and maintenance phases. For induction analyses, the primary time point was used. For maintenance analyses, the time point closest to 52 weeks (and later than 22 weeks to capture those with delayed responses) was used.
Before conducting the NMA, the sponsor performed a feasibility assessment to evaluate the suitability of the included trials for indirect comparison. This assessment involved a qualitative review comparing trials based on key characteristics to evaluate clinical and methodological heterogeneity. The factors examined included trial design, patient eligibility criteria, baseline patient characteristics (potential effect modifiers), outcome definitions and reporting methods, and placebo response rates. The goal was to systematically explore whether the underlying similarity assumption required for NMA was sufficiently met.
The primary outcomes evaluated in the NMA were clinical remission, clinical response, endoscopic response, and a composite end point combining clinical remission with endoscopic response. Given the diversity in trial designs, especially during the maintenance phase (i.e., treat-through, treat-through conditional, response rerandomized, and response rerandomized with second induction), it was considered that the transitivity assumption would be violated. Therefore, the analysis incorporated an approach to normalize data from different designs to mimic a standard treat-through trial.
A summary of the indirect comparison analysis methods is presented in Table 40. Bayesian NMAs were conducted. Clinical remission and clinical response were analyzed together as an ordinal end point using an inverse logit multivariate regression model for ordered categorical data, with the final model selection driven by model fit. Estimated ORs were combined with a separately estimated baseline model including reference-treatment controlled studies to provide summaries on the relative risk scale. Ordinal variables were estimated using group-based data entry but contrast-based estimation, whereby each study had a fixed-effects study intercept. Technically, response and remission variables were transformed into intermediary data structure consisting of ordered categories of “no clinical response/remission,” “clinical response but not remission,” and “clinical remission.” Endoscopic response, endoscopic remission, and the joint outcome of combined endoscopic response and clinical remission were treated as binary outcomes and modelled on the logit scale. Summary estimates included forest plots of all comparisons versus a common comparator, league tables of effect estimates comparing all therapies, and tables of direct and network estimates. All effect estimates were accompanied by 95% credible intervals. All analyses were performed using 4 unique sets of starting values and were based on at least 20,000 iterations with a burn-in of 20,000. Prior distributions for trial baselines, category effects, and treatment effects were vague. Convergence of the posterior samples generated by the Markov chain Monte Carlo sampling process was monitored quantitatively using the Gelman-Rubin diagnostic (Rhat) to capture nonconvergence from stationary but nonoverlapping chains, overlapping nonstationary chains, chains with heavy tails, and chains with different variances.47 Samples were considered to have converged if Rhat was equal to or less than 1.05.
Random-effects models assume a shared estimate of the between-trial heterogeneity.48 For the between-trial heterogeneity parameter required in random-effects models, informative prior distributions were assigned according to Turner et al.49 in all analyses for both unadjusted and metaregression, risk-adjusted models unless there was sufficient evidence for vague priors to converge to a reasonable posterior. It was deemed infeasible to adjust for all relevant effect modifiers. Metaregressions based on differences in observed baseline risk (placebo response) were performed when a sufficient number of multistudy connections were available in the network. Metaregression on baseline risk was conducted by assuming a vague prior distribution on a common parameter beta and including a single interaction term to the linear predictor between each active treatment group connection to trial baselines.46
Absolute model fit was assessed by comparing the total residual deviance from the model to the total number of free data points (equal to the number of groups when data are entered in group-based format). The total residual deviance is the difference between the posterior mean of the deviance under the current model minus the deviance for a saturated model.45 The relative fit between 2 models (e.g., fixed-effects versus random-effects) with the same data and/or likelihood was compared with deviance information criteria where a difference of 3 points to 5 points could be considered evidence to prefer 1 model over another.46 The estimated degree of between-trial heterogeneity (tau) was used to describe the SD of the random effect on the scale of the linear predictor (e.g., OR). Assessment of the consistency assumption, which evaluates the agreement between direct and indirect evidence, involved several methods. The sponsor planned global tests based on a decomposition of heterogeneity and inconsistency (using chi-square Q statistics). Additionally, loop-specific tests were conducted using the node-splitting approach (also known as the separate indirect and direct design evidence approach); this compares estimates from direct evidence against indirect evidence derived from the rest of the network. These analyses were implemented using the netmeta package.
NMAs (induction and maintenance phases) were conducted for 2 patient populations: those with a history of BIO-Failure and CON-Failure to align with the indication. For maintenance phase NMAs, sensitivity analyses applying imputation methods that did not account for those with delayed responses (termed “without those with delayed responses”) were conducted. Additional sensitivity analyses were conducted that included the SEQUENCE trial (data were excluded from the main analysis), where applicable, based on results of the NMA feasibility assessment. The SEQUENCE trial was an open-label, randomized study comparing the efficacy and safety of risankizumab with ustekinumab in adult patients with moderately to severely active CD whose disease had not experienced inadequate response with 1 or more anti-TNF therapy.50 The SEQUENCE trial was excluded from the NMA due to key differences in patient population because the study was restricted to patients whose disease had not experienced inadequate response with prior therapy with anti-TNFs. In addition, the study design had limitations — specifically, an open-label design that could result in potential biases, including attrition bias and novelty bias, leading to incomplete data and disproportional dropout rates in the ustekinumab group.
Potential treatment effect modifiers were identified in included studies as part of the SLR through qualitative assessment of subgroup analyses provided in supplemental materials of primary journal articles, and through discussion with a clinical expert consulted by the sponsor. For this reason, and because adjusting for several covariates would be infeasible due to a lack of multistudy connections, metaregressions were conducted based on differences in observed baseline risk (placebo response) when a sufficient number of multistudy connections were available in the network. Other specifications considered included exchangeable interaction terms within classes and independent treatment-specific interactions; however, it was judged there was insufficient evidence for more complex models and published subgroup effects showed no obvious violation of the shared effect modifier assumption. Covariates were centred during estimation by subtracting the mean of the value within each network.
Evidence network diagrams were drawn to visualize the evidence base for each outcome of interest. In these figures, available evidence was summarized such that each treatment (i.e., intervention or comparator) was represented by a node and comparisons between treatments were shown by lines linking the nodes. Nodes were sized to reflect the proportionate sample sizes. One or more RCTs were present where lines connected different nodes and the thickness of each line is proportional to the number of studies informing the comparison.
Publication bias was planned to be assessed for each pairwise comparison where there were at least 10 studies, but no comparisons had sufficient studies.
Table 40: ITC Analysis Methods
Method | Description |
|---|---|
Analysis methods | Bayesian network meta-analyses (random-effects and fixed-effects) were conducted. |
Priors | Prior distributions for trial baselines, category effects, and treatment effects were vague. Informative prior distributions for between-trial heterogeneity were assigned in all analyses for both unadjusted and metaregression, baseline risk-adjusted models unless there was sufficient evidence for vague priors to converge to a reasonable posterior. |
Assessment of model fit | Absolute model fit was assessed by comparing the total residual deviance from the model to the total number of free data points (equal to the number of groups when data are entered in group-based format). The relative fit between 2 models (e.g., fixed-effects vs. random-effects) with the same data and/or likelihood was compared with DIC where a difference of 3 to 5 points could be considered evidence to prefer 1 model over another. |
Assessment of consistency | Assessment of inconsistency consisted of a global test alongside loop-specific tests. These were conducted using the node-splitting and treatment by design interaction models as implemented in the netmeta package. |
Assessment of convergence | Convergence was monitored quantitatively using the latest implementation Gelman-Rubin diagnostic (Rhat) based on 4 chains. |
Outcomes | NMA outcomes included clinical remission, clinical response, endoscopic response, and a joint outcome of clinical remission and endoscopic response. All outcomes were assessed at induction and maintenance. |
Follow-up time points | For induction analyses, the trial’s primary time point was used. For maintenance analyses, the time point closest to 52 weeks (and later than 22 weeks) was used. In the event 2 time points were equally close to 52 weeks (e.g., 48 weeks and 56 weeks), the choice of time point was made based on data availability and similarity to other included time points. |
Construction of nodes | Each treatment (i.e., intervention or comparator) was represented by a node (or circle) and comparisons between treatments were shown by lines linking the nodes. Nodes were sized to reflect the proportionate sample sizes, and the thickness of each line is proportional to the number of studies informing the comparison. |
Sensitivity analyses | Sensitivity analyses applying imputation methods that did not account for those with delayed responses were conducted for maintenance outcomes. Sensitivity analyses were also conducted that included the SEQUENCE trial, where applicable, based on results of the NMA feasibility assessment (excluded from the main analysis). |
Subgroup analysis | NMAs for induction and maintenance were conducted for the BIO-Failure and CON-Failure analysis populations to align with the indication. |
Methods for pairwise meta-analysis | Not reported |
BIO-Failure = biologic therapy failure or intolerance; CON-Failure = conventional therapy failure or intolerance; DIC = deviance information criterion; ITC = indirect treatment comparison; NMA = network meta-analysis; vs. = versus.
Sources: Guselkumab systematic literature review and network meta-analysis report.46 Details included in the table are from the sponsor’s Summary of Clinical Evidence.
Results of ITC
Summary of Included Studies
A systematic literature search conducted on July 27, 2023, identified 6,695 records from MEDLINE, Embase, and Cochrane Central Register of Controlled Trials. After removing 1,794 duplicates and 2 pre-1995 records, 4,899 records underwent title and abstract screening, excluding 4,195 of those records, and 704 full-text articles were retrieved, with 9 being unavailable. Following further exclusions, 105 records were included from the database search. Supplementary searches — comprising ClinicalTrials.gov, conference abstracts, and bibliographies — added 24 more records, and the sponsor provided 7 additional records from other sources. In total, the search identified 136 records reporting on 58 unique RCTs, of which 37 trials (from 47 records) met the eligibility criteria for the quantitative synthesis (NMA) focused on outcomes for licensed dosages. All included trials were double-blinded and randomized controlled studies. Summary-level data were available for all included trials and individual patient data were available for 3 studies. The sponsor assessed the risk of bias for 34 of the 37 trials included in the quantitative analysis using the University of York Centre for Reviews and Dissemination criteria. Overall methodological quality was deemed generally good; however, potential risks of bias were identified. While most trials reported appropriate randomization (28 of 34 trials), the method was unclear in 6 trials. Similarly, allocation concealment methods were not reported in 13 trials. Most trials had similar baseline groups, although potential imbalances or unclear reporting were noted in 5 trials. All included trials were blinded except for the SEQUENCE trial. Unexpected imbalances in dropouts were noted in 3 trials, and 5 trials used analysis populations other than the intention-to-treat population. No evidence of selective outcome reporting was found.
For the inclusion criteria, the GALAXI studies’ clinical program included patients aged 18 years or older with a baseline CDAI score of 220 to 450, and a baseline disease duration of 3 months or more. Patients in the GALAXI trials must also have not experienced improvement with either a biologic, advanced, or conventional therapy before inclusion, and have an endoscopy and/or histology assessment performed as part of study enrolment. Overall, age, disease duration, baseline CDAI score, and endoscopic confirmation were relatively similar across trials compared to the GALAXI 3 study. Baseline disease location, placebo response rates, and treatment history varied across comparator trials. Table 41 includes additional information on the heterogeneity observed across trials in the NMA feasibility assessment.
The GALAXI 1, GALAXI 2, GALAXI 3, and 7 other studies excluded patients who had been previously exposed to a biologic targeting IL-12 and/or IL-23.
The majority of trials (including the GALAXI trials) employed the same definition for clinical response (at least a 100-point reduction from baseline in the CDAI score or a CDAI score < 150). Three trials (the ENACT-1, ENACT-2, and NCT02499783 studies) used a 70-point reduction from baseline in the CDAI score to define clinical response, and 1 trial (the ACCENT 1 study) defined clinical response with a 70-point CDAI cut-off and at least a 25% reduction from baseline. All trials, with the exception of the CERTIFI study, defined clinical remission as an absolute CDAI score of less than 150. The CERTIFI study defined clinical remission as a 100-point or greater CDAI score decrease.
The GALAXI 3 and GALAXI 2 trials assessed clinical remission and clinical response at week 12 for induction and week 48 for maintenance. Most comparator trials reported induction periods ranging from 2 weeks to 12 weeks. The GAIN trial reported the shortest induction period of 1 week. For the maintenance period, the latest time points ranged from 22 weeks to 64 weeks.
Based on the initial assessment of trial characteristics, eligibility criteria, and baseline characteristics, the sponsor deemed an NMA to be feasible.46
In this section, NMA results are provided for the following outcomes:
Induction
clinical response
clinical remission
Maintenance
clinical response
clinical remission
endoscopic response
joint endoscopic response and clinical remission.
Table 41: Assessment of Homogeneity for ITC
Characteristic | Description and handling of potential effect modifiers |
|---|---|
Disease severity | Baseline CDAI scores were similar between the GALAXI 2 and GALAXI 3 studies and the comparator trials. However, there was a lack of consistent reporting of baseline BMI, CRP, and fecal calprotectin across trials that precluded the assessment of similarity. Additionally, only median values were reported in the GALAXI 3 trial for disease duration, CDAI score, CRP, and fecal calprotectin, which limited comparisons with other studies. Across most studies, there was heterogeneity in baseline disease location, with differences in part being attributed to inconsistent categories reported across studies. |
Treatment history | The GALAXI trials as well as the ADVANCE, MOTIVATE, FORTIFY, NCT02031276, UNITI-1, UNITI-2, and IM-UNITI trials all excluded patients with any previous use of IL-12 and/or IL-23 inhibitors. Additionally, the GALAXI 1, U-EXCEL, U-EXCEED, and U-ENDURE studies excluded patients with unstable doses of CD medication use. Other trials either had very specific prior medication time restraints or no reported medication limitations for specific periods before study start. Additionally, the definitions for the conventional therapy failure and biologic failure subgroups likely varied across the included trials. The sponsor's feasibility assessment noted significant variation regarding criteria for prior treatment failure, and the report does not confirm that standardized definitions were applied across studies contributing to these subgroup analyses. This lack of consistent definitions introduces uncertainty into the interpretation and validity of the subgroup-specific NMA results. |
Trial eligibility criteria | Overall, eligibility based on age, disease duration, baseline CDAI score, and endoscopic confirmation were relatively similar across trials when compared to the GALAXI 3 study. Key differences between the GALAXI trials and most comparator trials included differences in prior medication failure and disease location. Many trials lacked the requirement for histological confirmation of CD as part of the eligibility criteria, which differs from the GALAXI 3 study. |
Dosing of comparators | The NMA included trials using approved and/or licensed dosing regimens for comparator therapies as per the study selection criteria. |
Placebo response | For differences in the placebo response rates during induction, there was little heterogeneity across populations in clinical response, clinical remission, and endoscopic response. However, there was limited data available for endoscopic response due to a low number of trials reporting on this outcome. Differences in the placebo response at induction were considered for the baseline risk adjustment within the induction period. In the maintenance period, there was heterogeneity in clinical response and clinical remission in terms of placebo response rate. Differences were driven in part by heterogeneity in study design, rerandomization methodology, and outcome definitions. Differences in the placebo response at maintenance emphasizes the presence of a pharmacodynamic carry-over effect in trials using a response-based rerandomization design, which has been accounted for in the NMA imputation methods. |
Definitions of end points | Clinical response The feasibility assessment used the GALAXI trials’ clinical response definition (i.e., at least a 100-point reduction from baseline in CDAI score or a CDAI score < 150), which was commonly used across comparator trials. Additionally, the scoring criteria for clinical response was similar across most comparator trials. Clinical remission All trials, except for the CERTIFI trial, required an absolute CDAI score of < 150 to determine clinical remission. The CERTIFI trial required that patients have a 100-point CDAI score decrease for clinical remission. Endoscopic response Similar endoscopic response criteria (≥ 50% improvement from baseline in the SES-CD score or an SES-CD score ≤ 2) defined by the GALAXI 3 study was used for the SEQUENCE, SERENITY, GALAXI 1, GALAXI 2, U-EXCEL, U-EXCEED, U-ENDURE, ADVANCE, MOTIVATE, FORTIFY, and NCT02031276 studies. Most trials did not include endoscopic response outcomes. |
Timing of end point evaluation | GALAXI trials assessed clinical response and clinical remission at week 12 for induction and week 48 for maintenance. However, the time points used for outcome assessments varied across comparator trials and between outcomes. In comparator trials, clinical response, clinical remission, and endoscopic response primary time points ranged from 1 week (the GAIN trial) to 14 weeks (the ACCENT 1 trial). The latest time points for these outcomes ranged from 4 weeks (the CHARM study) to 64 weeks (the U-ENDURE and FORTIFY studies). |
Study design | Twenty-one trials were excluded from the NMA feasibility assessment due to unapproved dosing regimens. Summary-level data were available for all included trials and individual patient data were available for 4 studies. Trial designs in CD include the following categories: treat-through, treat-through conditional (conditional on the initial treatment response), response rerandomized, and response rerandomized with section induction. Each of the aforementioned trial designs estimates a different effect in a different population, which violates the transitivity assumption of an NMA. The sponsor assumed the most relevant design for clinical decision-making to be the treat-through trial because rigid timelines for response assessment are not realistic in practice owing to realities of clinical scheduling and the decision for continued treatment being a shared one between individual patients and clinicians. The sponsor considered that rerandomized trials offer a biased assessment of the treatment effect in this population for 3 primary reasons:
The inclusion of rerandomized data as observed was considered an unacceptable risk of bias and, therefore, all analyses normalized rerandomized data to mimic a treat-through target trial design. |
BMI = body mass index; CD = Crohn disease; CDAI = Crohn’s Disease Activity Index; CRP = C-reactive protein; IL = interleukin; ITC = indirect treatment comparison; NMA = network meta-analysis; SES-CD = Simple Endoscopic Score for Crohn’s Disease.
Source: Guselkumab systematic literature review and network meta-analysis report.46
Results
Evidence Networks
Induction Analysis
Clinical Response and Clinical Remission: CON-Failure Analysis Population
A network diagram for studies reporting clinical response or clinical remission during the induction analysis in a CON-Failure analysis population is presented in Figure 4.
Figure 4: Network Diagram for Clinical Response and Clinical Remission — Induction Analysis, CON-Failure Analysis Population
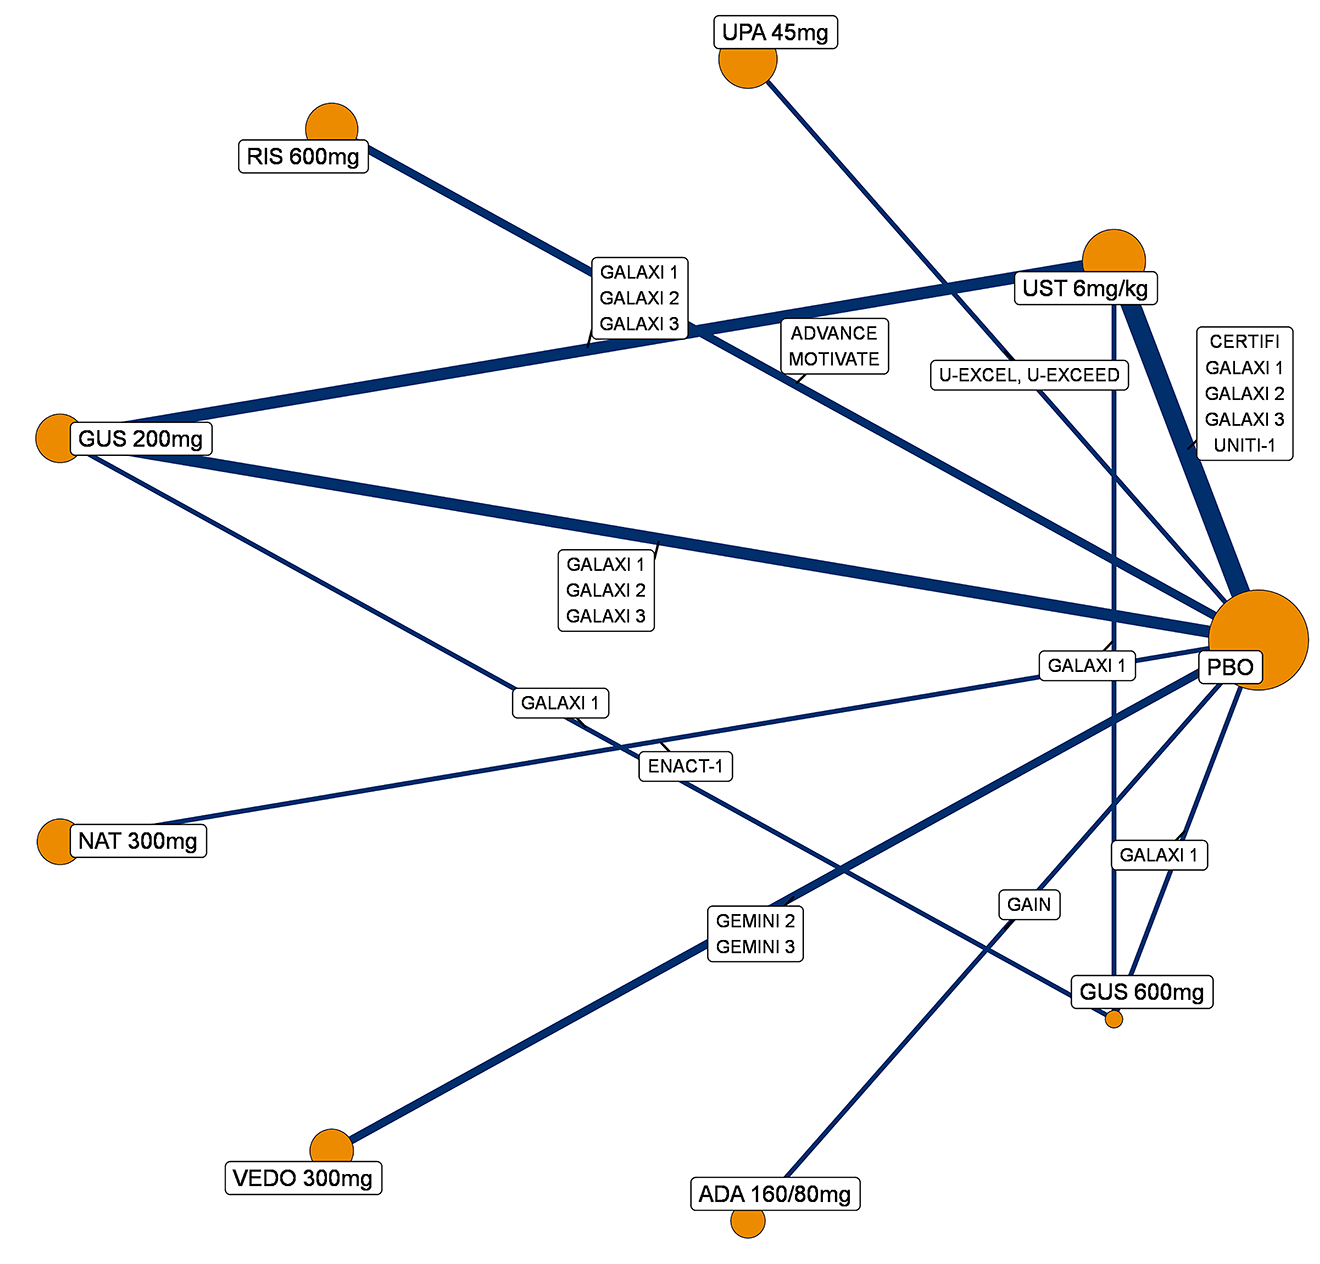
ADA = adalimumab; CON-Failure = conventional therapy failure or intolerance; GUS = guselkumab; NAT = natalizumab; PBO = placebo; RIS = risankizumab; UPA = upadacitinib; UST = ustekinumab; VEDO = vedolizumab.
Source: Guselkumab systematic literature review and network meta-analysis report.46
Clinical Response and Clinical Remission: BIO-Failure Analysis Population
A network diagram for studies reporting clinical response or clinical remission during the induction analysis in a BIO-Failure analysis population is presented in Figure 5.
Figure 5: Network Diagram for Clinical Response and Clinical Remission — Induction Analysis, BIO-Failure Analysis Population

ADA = adalimumab; BIO-Failure = biologic therapy failure or intolerance; GUS = guselkumab; NAT = natalizumab; PBO = placebo; RIS = risankizumab; UPA = upadacitinib; UST = ustekinumab; VEDO = vedolizumab.
Source: Guselkumab systematic literature review and network meta-analysis report.46
Maintenance Analysis Without Those With Delayed Responses
Clinical Response and Clinical Remission
CON-Failure Analysis Population (Without Those With Delayed Responses)
A network diagram for studies reporting clinical response, during the maintenance analysis, in a CON-Failure analysis population (without those with delayed response) is presented in Figure 6.
Figure 6: Network Diagram for Clinical Response — Maintenance Analysis, CON-Failure Analysis Population (Without Those With Delayed Responses)
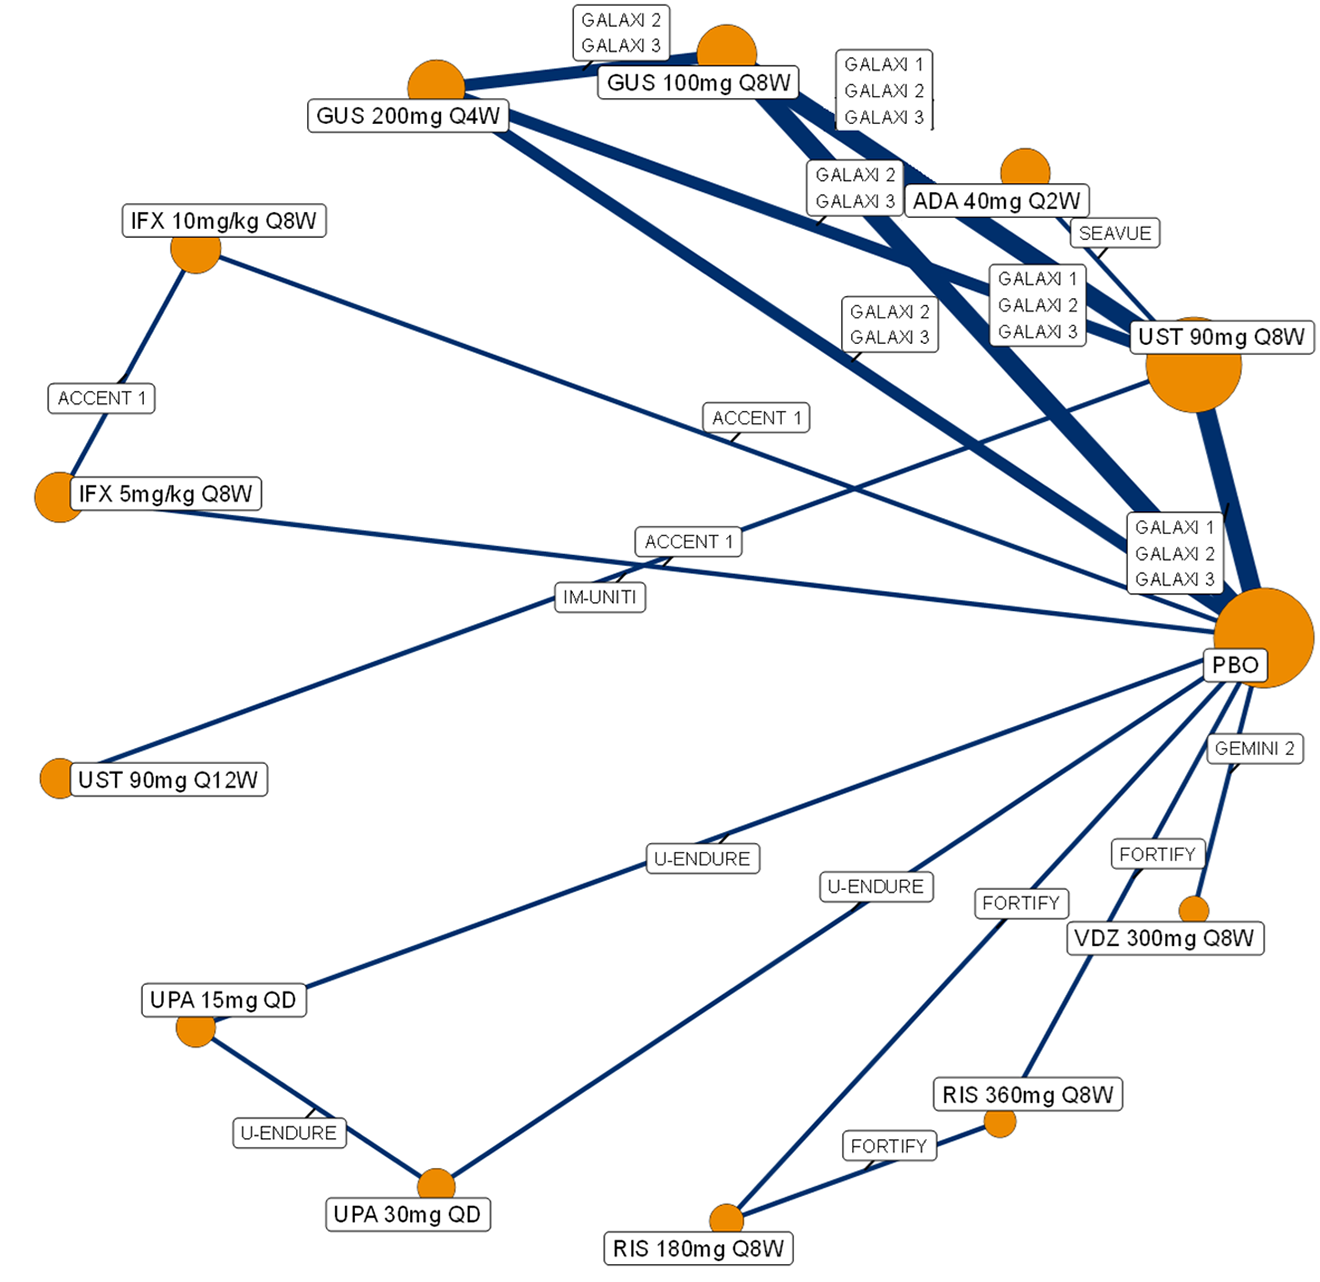
ADA = adalimumab; CON-Failure = conventional therapy failure or intolerance; GUS = guselkumab; IFX = infliximab; PBO = placebo; Q2W = every 2 weeks; Q4W = every 4 weeks; Q8W = every 8 weeks; Q12W = every 12 weeks; QD = once daily; RIS = risankizumab; UPA = upadacitinib; UST = ustekinumab; VDZ = vedolizumab.
Source: Guselkumab systematic literature review and network meta-analysis report.46
A network diagram for studies reporting clinical remission, during the maintenance analysis, in a CON-Failure analysis population (without those with delayed responses) is presented in Figure 7.
Figure 7: Network Diagram for Clinical Remission — Maintenance Analysis, CON-Failure Analysis Population (Without Those With Delayed Responses)
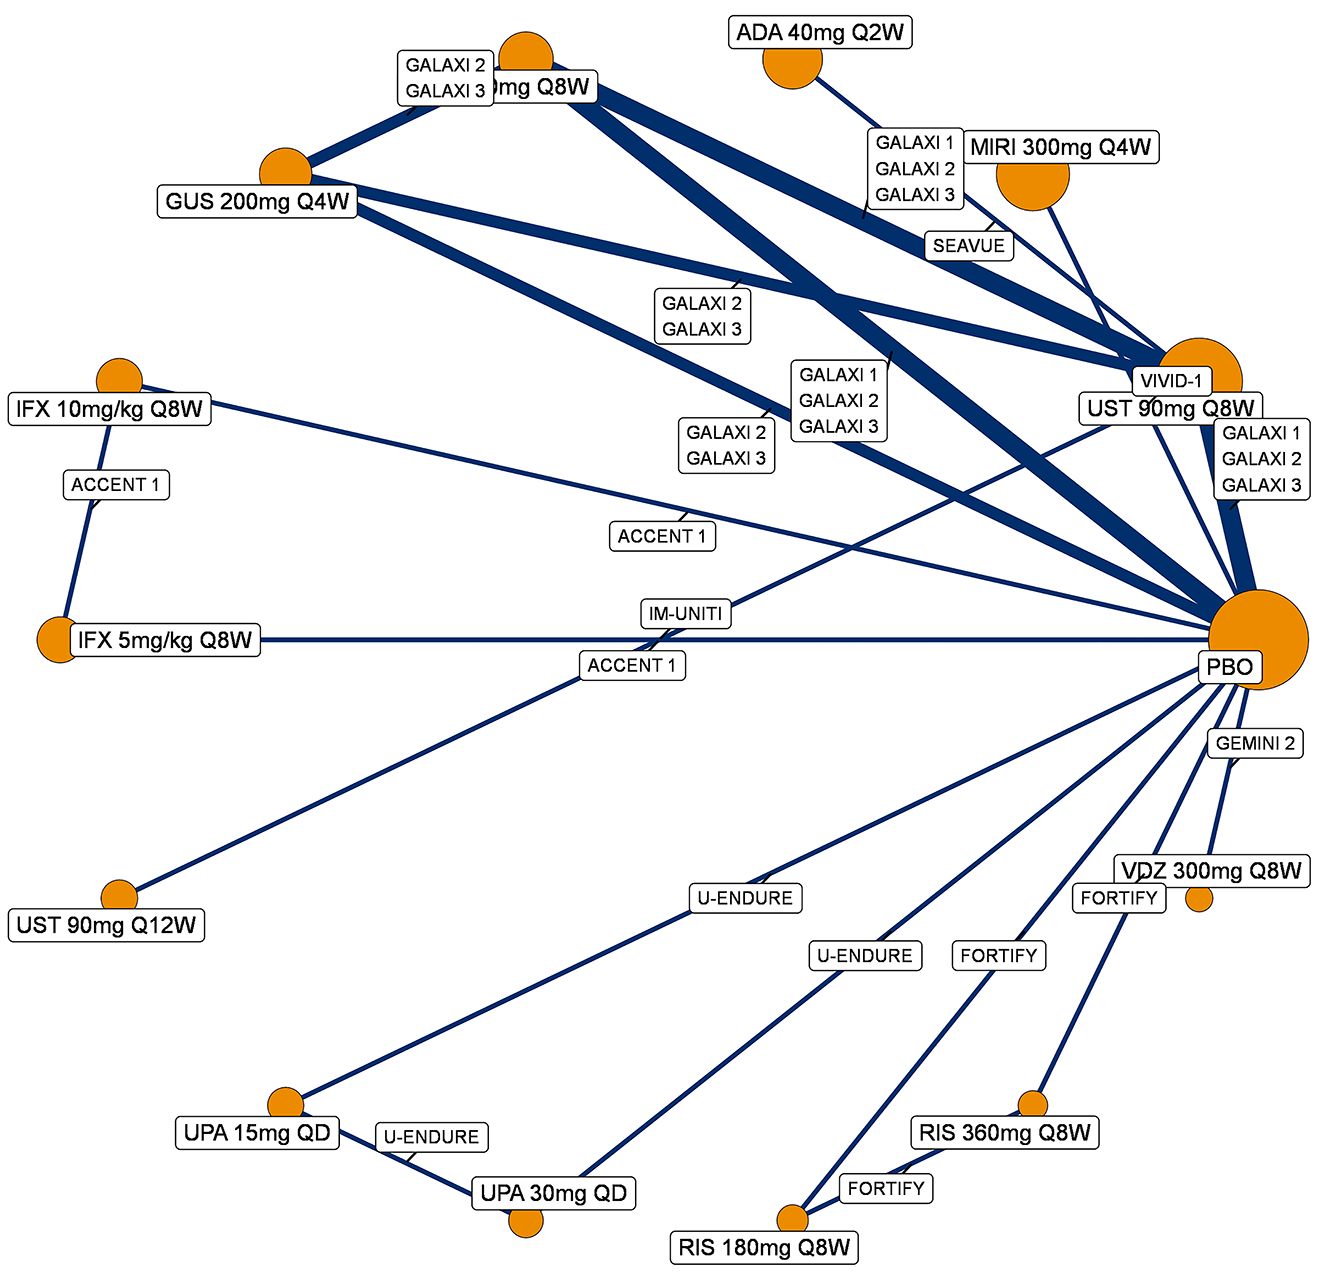
ADA = adalimumab; CON-Failure = conventional therapy failure or intolerance; GUS = guselkumab; IFX = infliximab; MIRI = mirikizumab; PBO = placebo; Q2W = every 2 weeks; Q4W = every 4 weeks; Q8W = every 8 weeks; Q12W = every 12 weeks; QD = once daily; RIS = risankizumab; UPA = upadacitinib; UST = ustekinumab; VDZ = vedolizumab.
Source: Guselkumab systematic literature review and network meta-analysis report.46
BIO-Failure Analysis Population (Without Those With Delayed Responses)
A network diagram for studies reporting clinical response, during the maintenance analysis, in a BIO-Failure analysis population (without those with delayed responders) is presented in Figure 8.
Figure 8: Network Diagram for Clinical Response — Maintenance Analysis, BIO-Failure Analysis Population (Without Those With Delayed Responses)
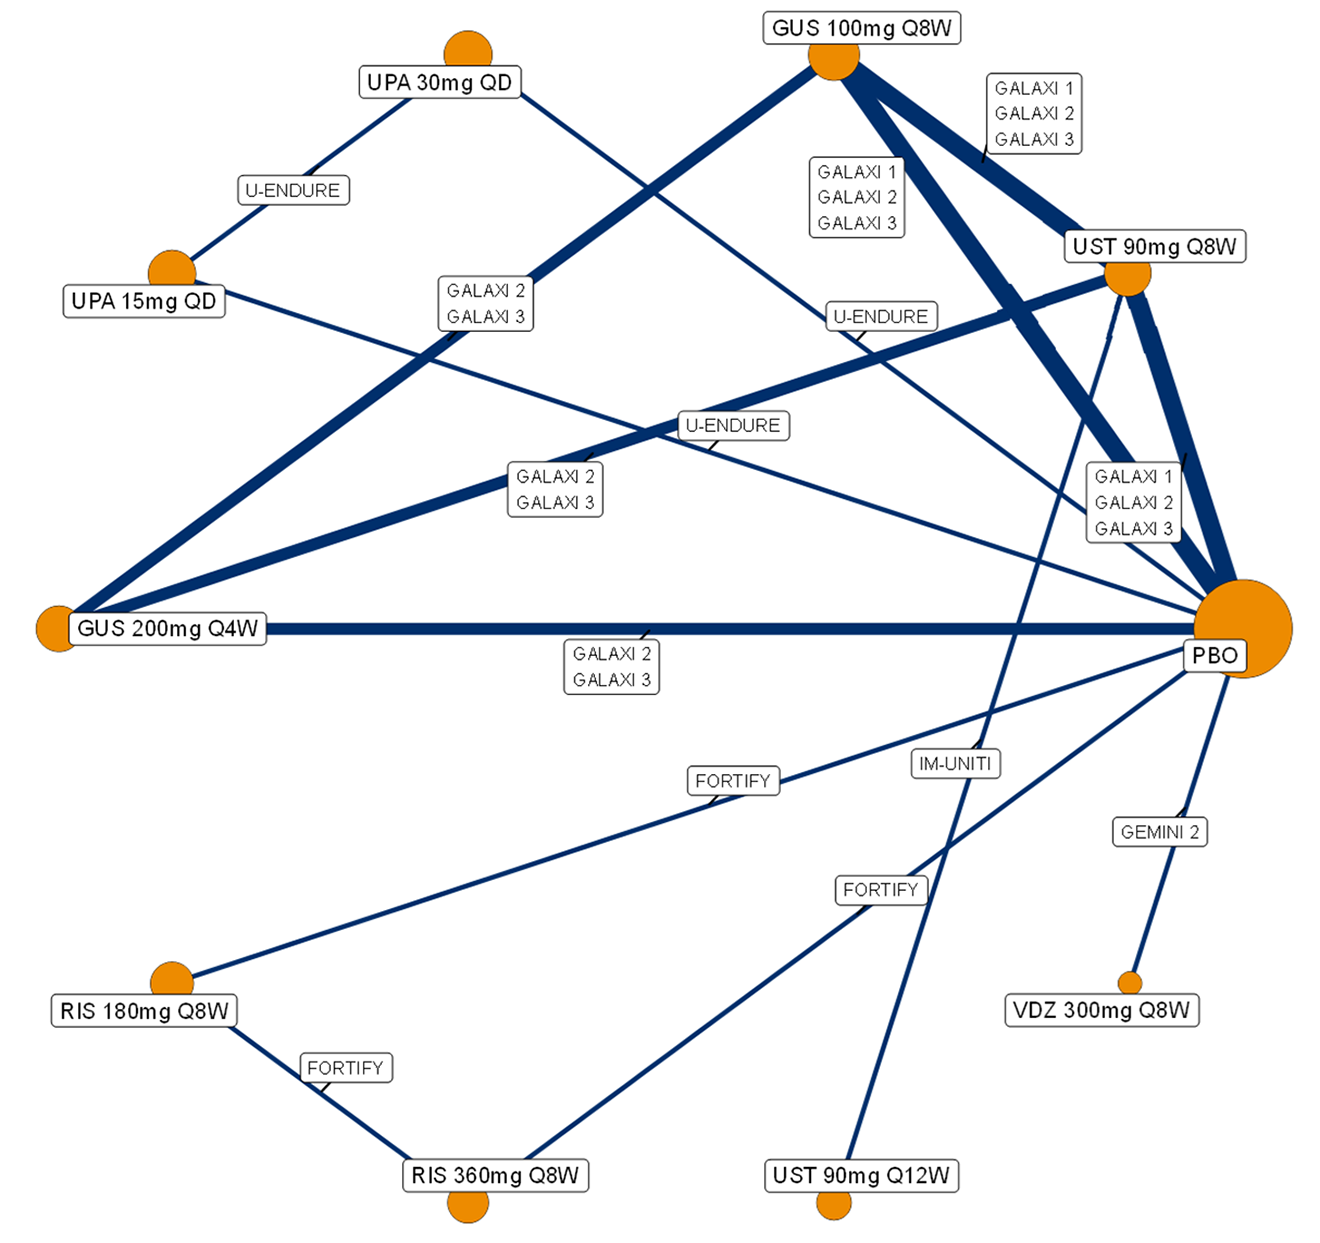
BIO-Failure = biologic therapy failure or intolerance; GUS = guselkumab; PBO = placebo; Q4W = every 4 weeks; Q8W = every 8 weeks; Q12W = every 12 weeks; QD = once daily; RIS = risankizumab; UPA = upadacitinib; UST = ustekinumab; VDZ = vedolizumab.
Source: Guselkumab systematic literature review and network meta-analysis report.46
A network diagram for studies reporting clinical remission, during the maintenance analysis, in a BIO-Failure analysis population (without those with delayed response) is presented in Figure 9.
Figure 9: Network Diagram for Clinical Remission — Maintenance Analysis, BIO-Failure Analysis Population (Without Those With Delayed Response)
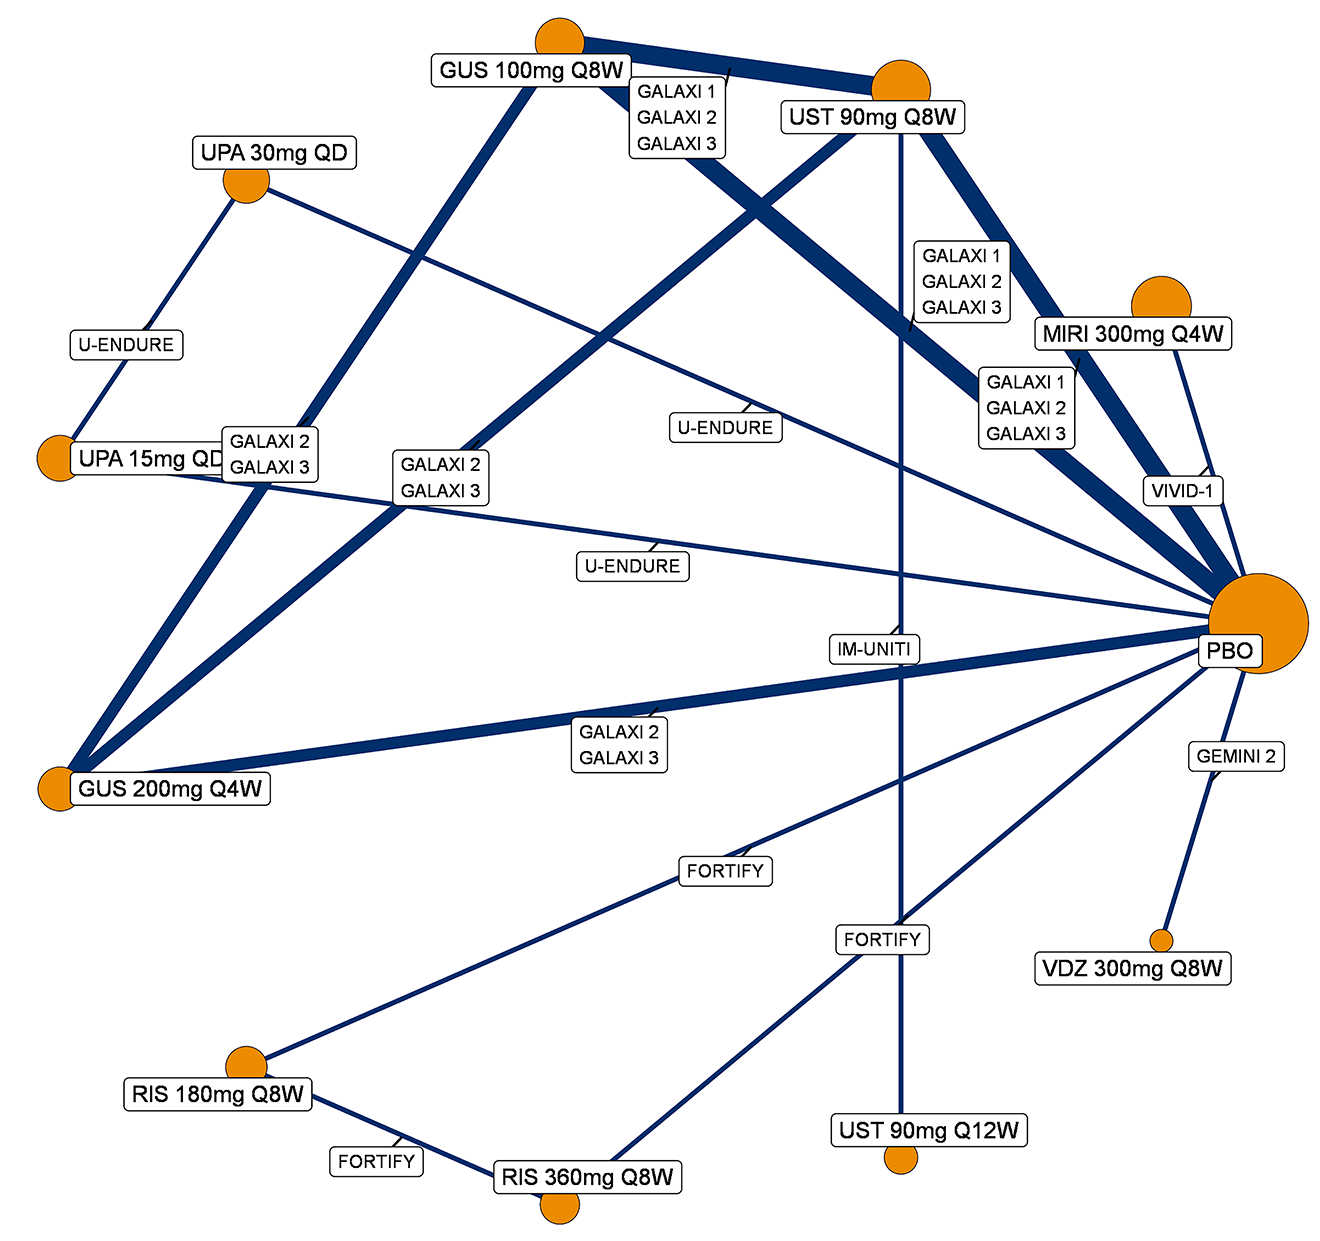
BIO-Failure = biologic therapy failure or intolerance; GUS = guselkumab; MIRI = mirikizumab; PBO = placebo; Q4W = every 4 weeks; Q8W = every 8 weeks; Q12W = every 12 weeks; QD = once daily; RIS = risankizumab; UPA = upadacitinib; UST = ustekinumab; VDZ = vedolizumab.
Source: Guselkumab systematic literature review and network meta-analysis report.46
Endoscopic Response
CON-Failure Analysis Population (Without Those With Delayed Response)
A network diagram for studies reporting endoscopic response, during the maintenance analysis, in a CON-Failure analysis population (without those with delayed response) is presented in Figure 10.
Figure 10: Network Diagram for Endoscopic Response — Maintenance Analysis, CON-Failure Analysis Population (Without Those With Delayed Response)
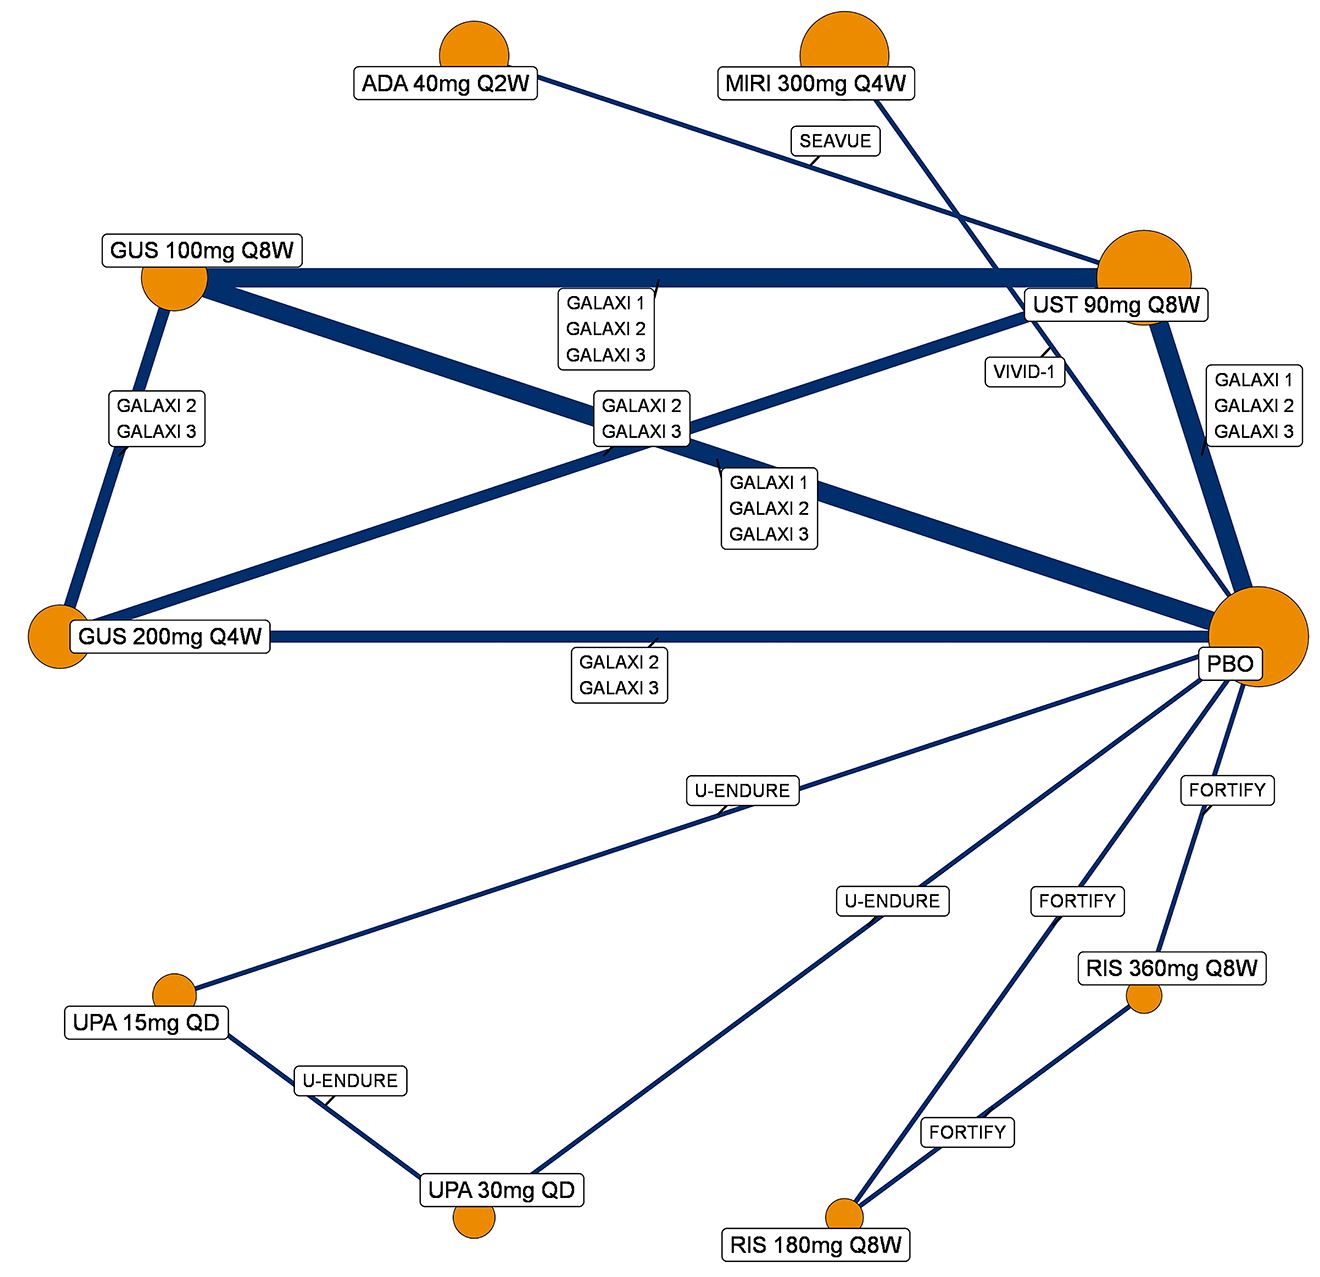
ADA = adalimumab; CON-Failure = conventional therapy failure or intolerance; GUS = guselkumab; MIRI = mirikizumab; PBO = placebo; Q2W = every 2 weeks; Q4W = every 4 weeks; Q8W = every 8 weeks; QD = once daily; RIS = risankizumab; UPA = upadacitinib; UST = ustekinumab.
Source: Guselkumab systematic literature review and network meta-analysis report.46
BIO-Failure Analysis Population (Without Those With Delayed Response)
A network diagram for studies reporting endoscopic response, during the maintenance analysis, in a BIO-Failure analysis population (without those with delayed response) is presented in Figure 11.
Figure 11: Network Diagram for Endoscopic Response — Maintenance Analysis, BIO-Failure Analysis Population (Without Those With Delayed Response)
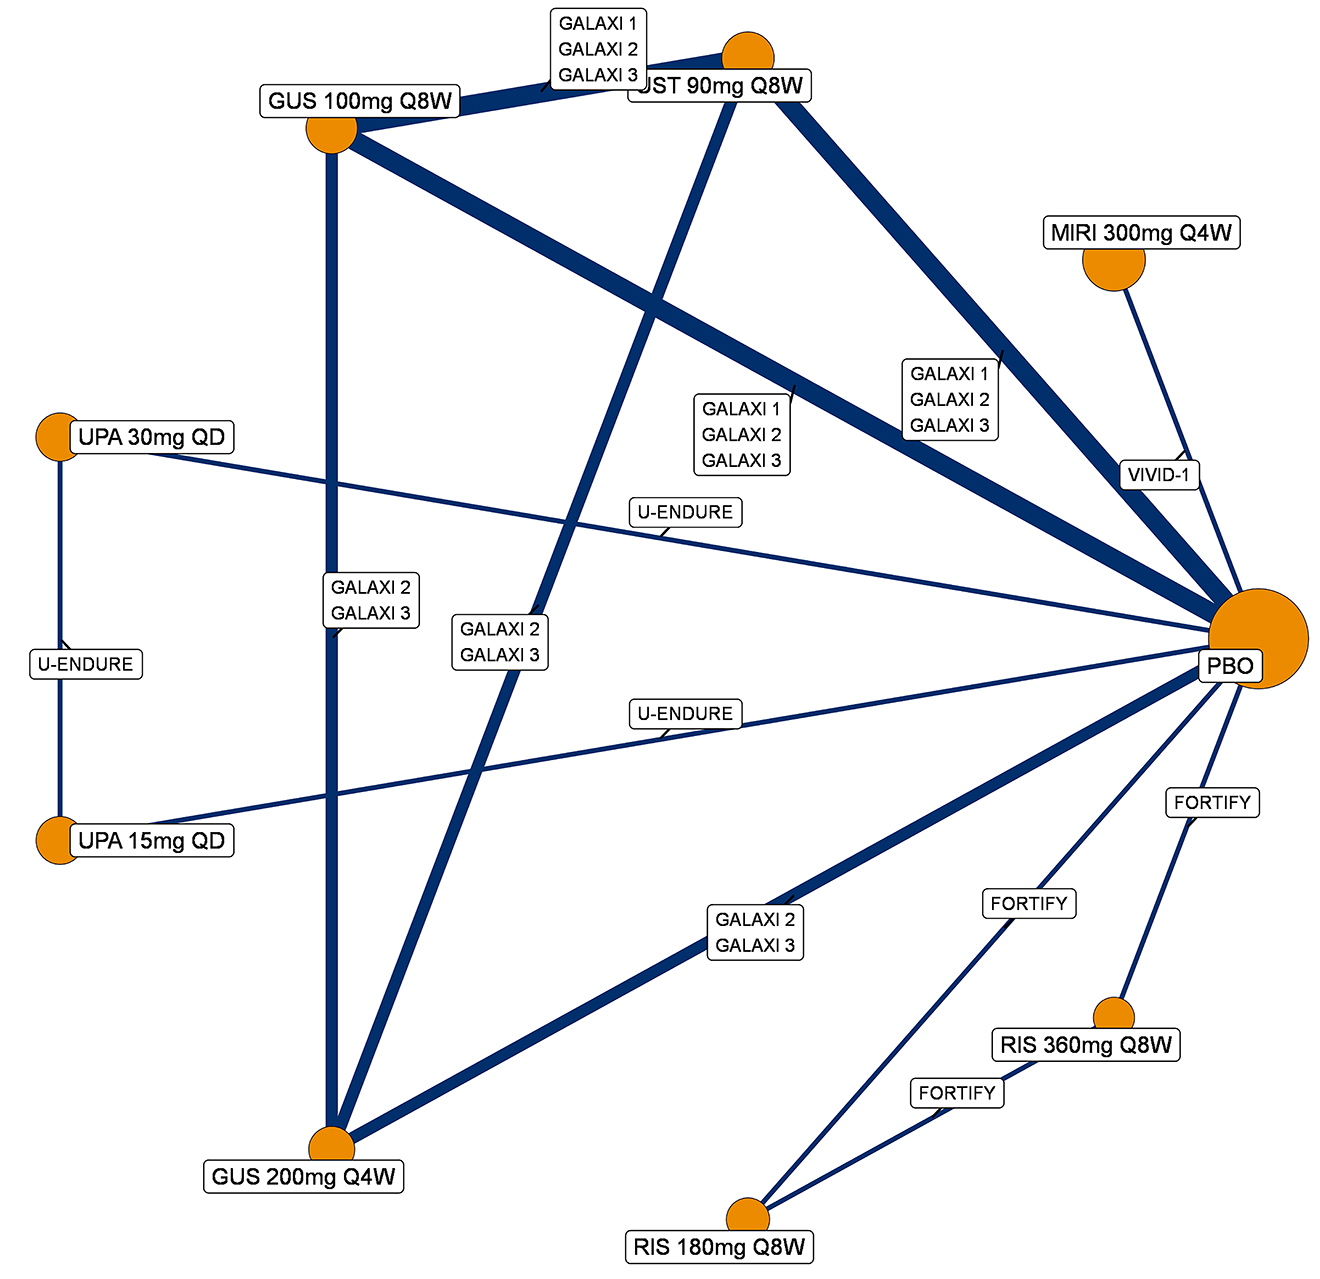
BIO-Failure = biologic therapy failure or intolerance; GUS = guselkumab; MIRI = mirikizumab; PBO = placebo; Q4W = every 4 weeks; Q8W = every 8 weeks; QD = once daily; RIS = risankizumab; UPA = upadacitinib; UST = ustekinumab.
Source: Guselkumab systematic literature review and network meta-analysis report.46
Joint Endoscopic Response and Clinical Remission
CON-Failure Analysis Population (Without Those With Delayed Response)
A network diagram for studies reporting the joint outcome endoscopic response and clinical remission, during the maintenance analysis, in a CON-Failure analysis population (without those with delayed response) is presented in Figure 12.
Figure 12: Network Diagram for Joint Endoscopic Response and Clinical Remission — Maintenance Analysis, CON-Failure Analysis Population (Without Those With Delayed Response)
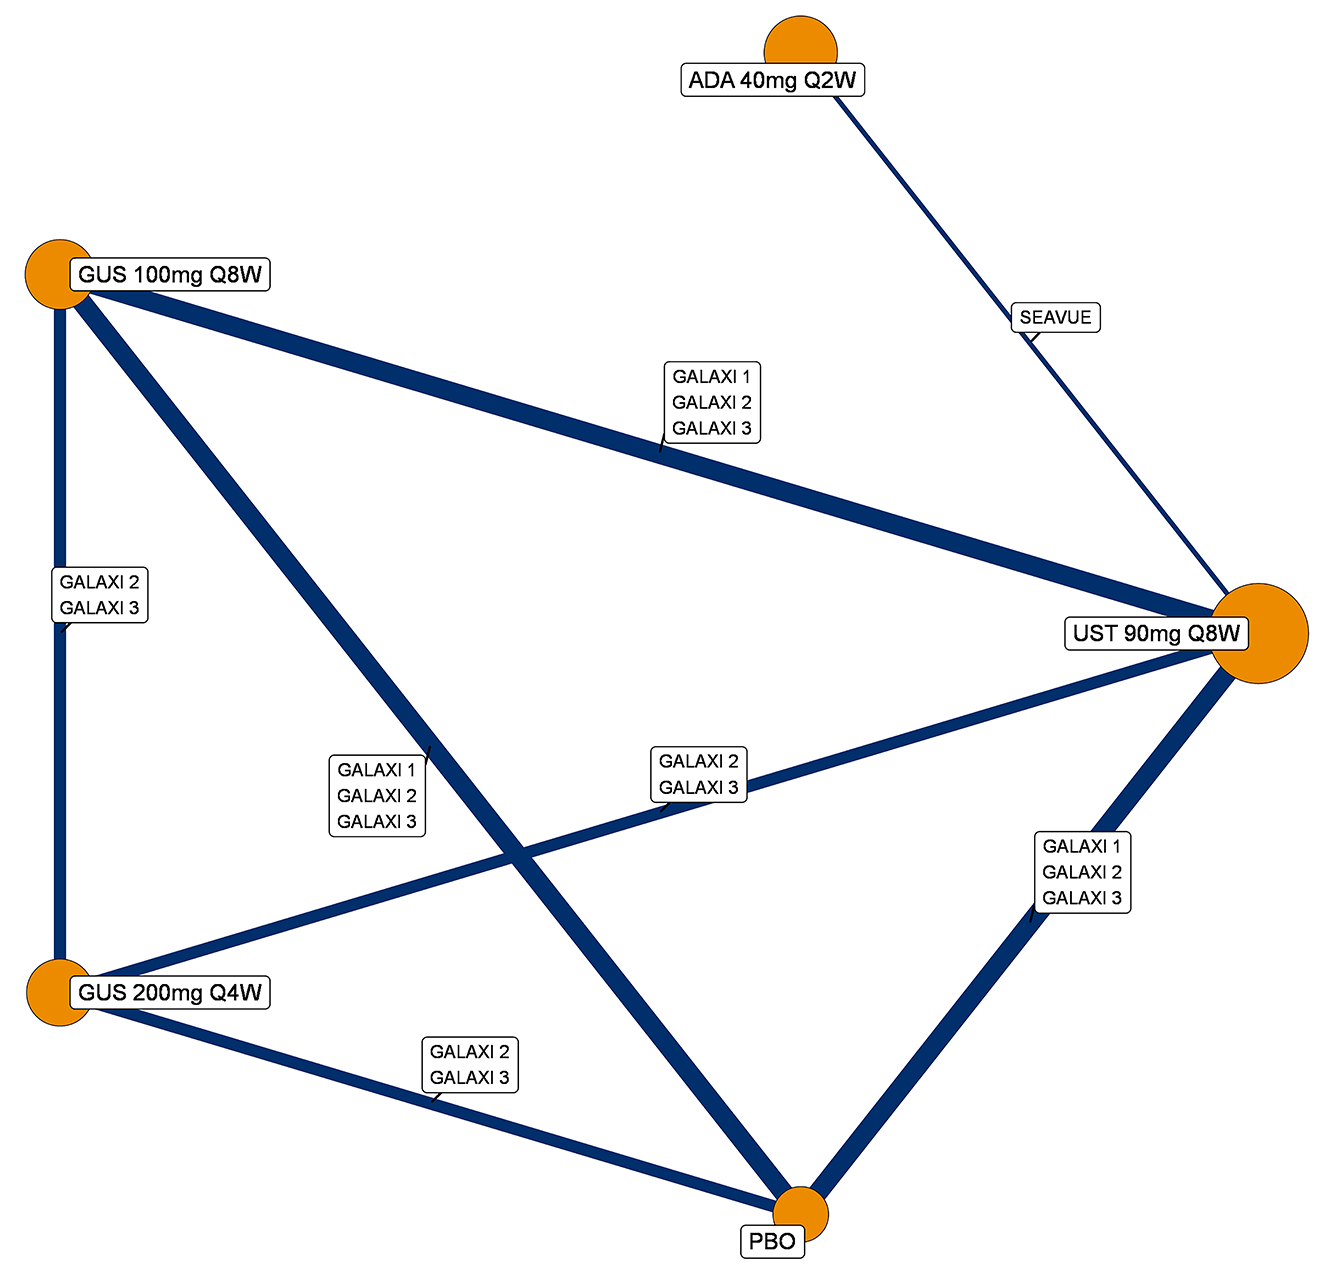
ADA = adalimumab; CON-Failure = conventional therapy failure or intolerance; GUS = guselkumab; PBO = placebo; Q2W = every 2 weeks; Q4W = every 4 weeks; Q8W = every 8 weeks; UST = ustekinumab.
Source: Guselkumab systematic literature review and network meta-analysis report.46
BIO-Failure Analysis Population (Without Those With Delayed Response)
A network diagram for studies reporting the joint outcome endoscopic response and clinical remission, during the maintenance analysis, in a BIO-Failure analysis population (without those with delayed response) is presented in Figure 13.
Figure 13: Network Diagram for Joint Endoscopic Response and Clinical Remission — Maintenance Analysis, BIO-Failure Analysis Population (Without Those With Delayed Response)
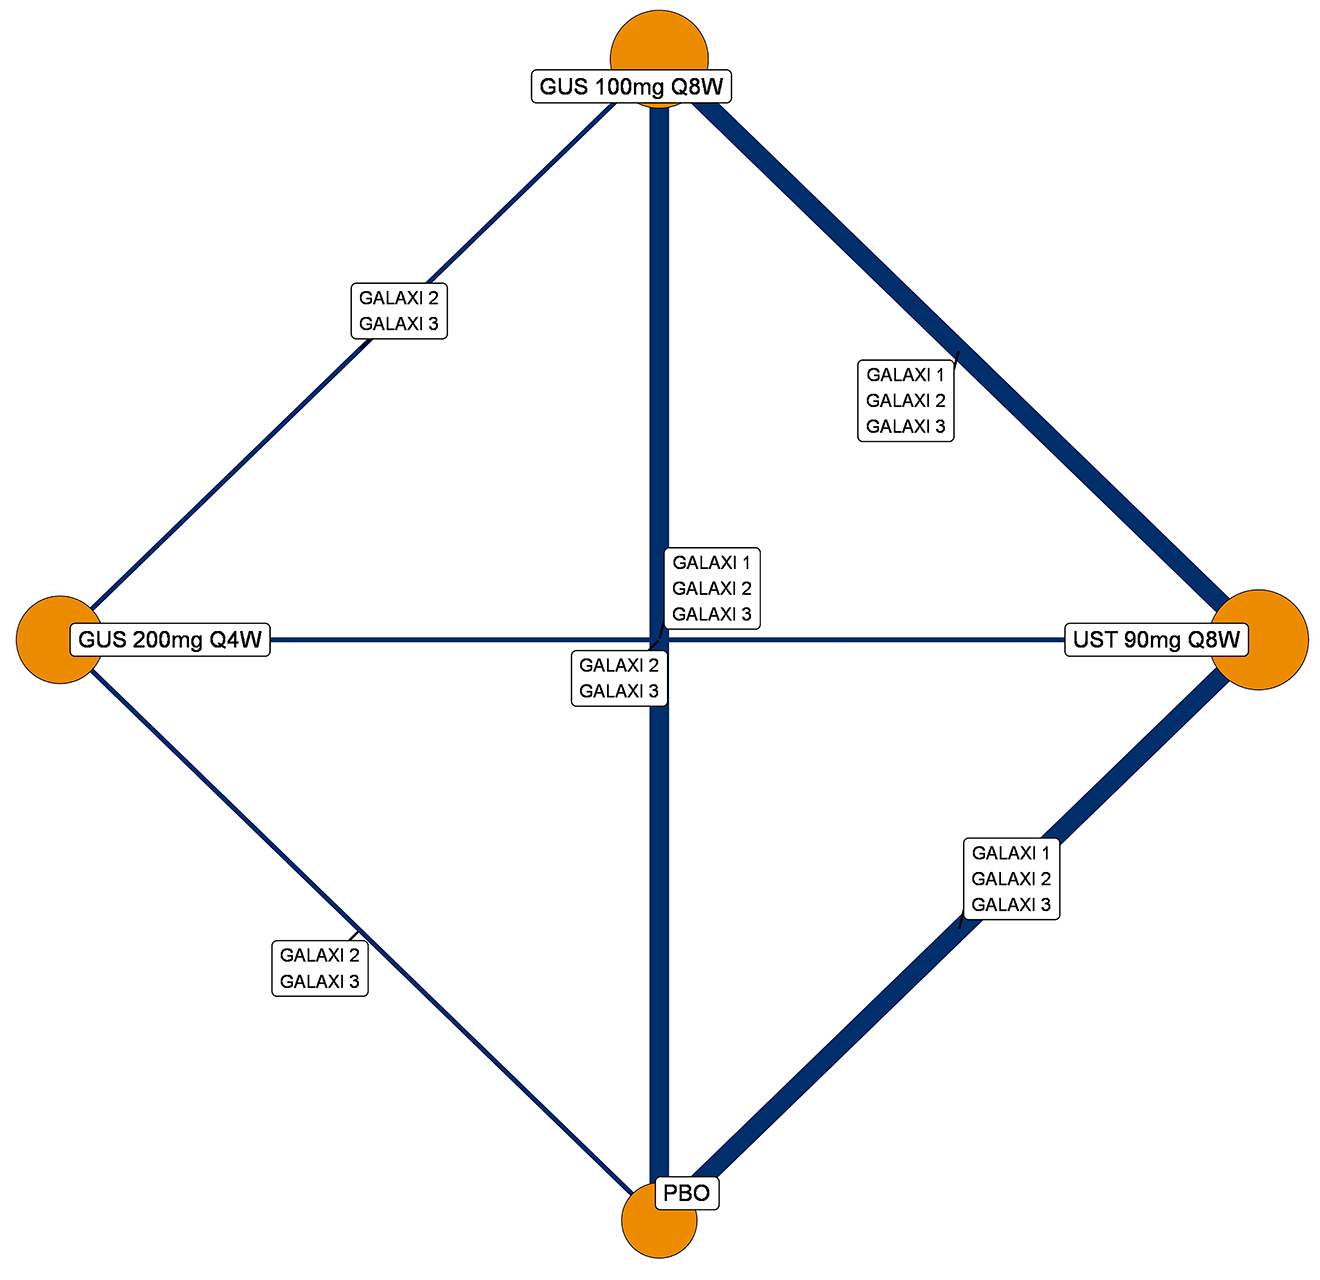
BIO-Failure = biologic therapy failure or intolerance; GUS = guselkumab; PBO = placebo; Q4W = every 4 weeks; Q8W = every 8 weeks; UST = ustekinumab.
Source: Guselkumab systematic literature review and network meta-analysis report.46
Maintenance Analysis, Including Those With Delayed Response
Clinical Response and Clinical Remission
CON-Failure Analysis Population (Including Those With Delayed Response)
A network diagram for studies reporting clinical response, during the maintenance analysis, in a CON-Failure analysis population (including those with delayed response) is presented in Figure 14.
Figure 14: Network Diagram for Clinical Response — Maintenance Analysis, CON-Failure Analysis Population (Including Those With Delayed Response)
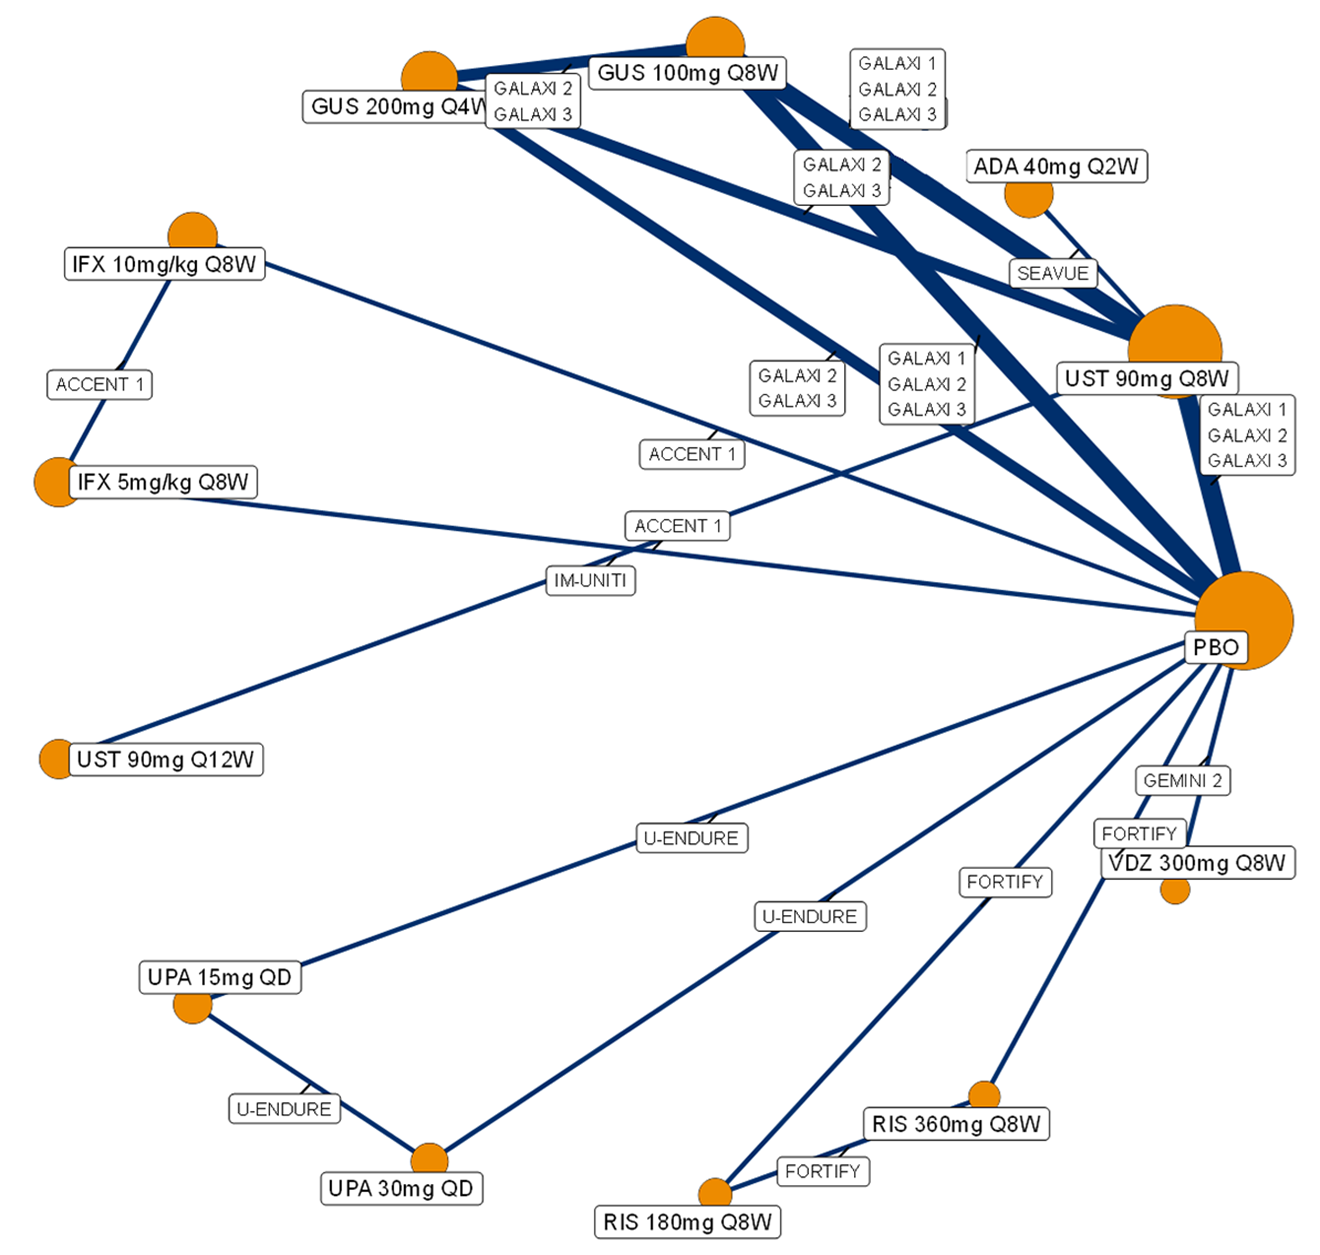
ADA = adalimumab; CON-Failure = conventional therapy failure or intolerance; GUS = guselkumab; IFX = infliximab; PBO = placebo; Q2W = every 2 weeks; Q4W = every 4 weeks; Q8W = every 8 weeks; Q12W = every 12 weeks; QD = once daily; RIS = risankizumab; UPA = upadacitinib; UST = ustekinumab; VDZ = vedolizumab.
Source: Guselkumab systematic literature review and network meta-analysis report.46
A network diagram for studies reporting clinical remission, during the maintenance analysis, in a CON-Failure analysis population (including those with delayed response) is presented in Figure 15.
Figure 15: Network Diagram for Clinical Remission — Maintenance Analysis, CON-Failure Analysis Population (Including Those With Delayed Response)
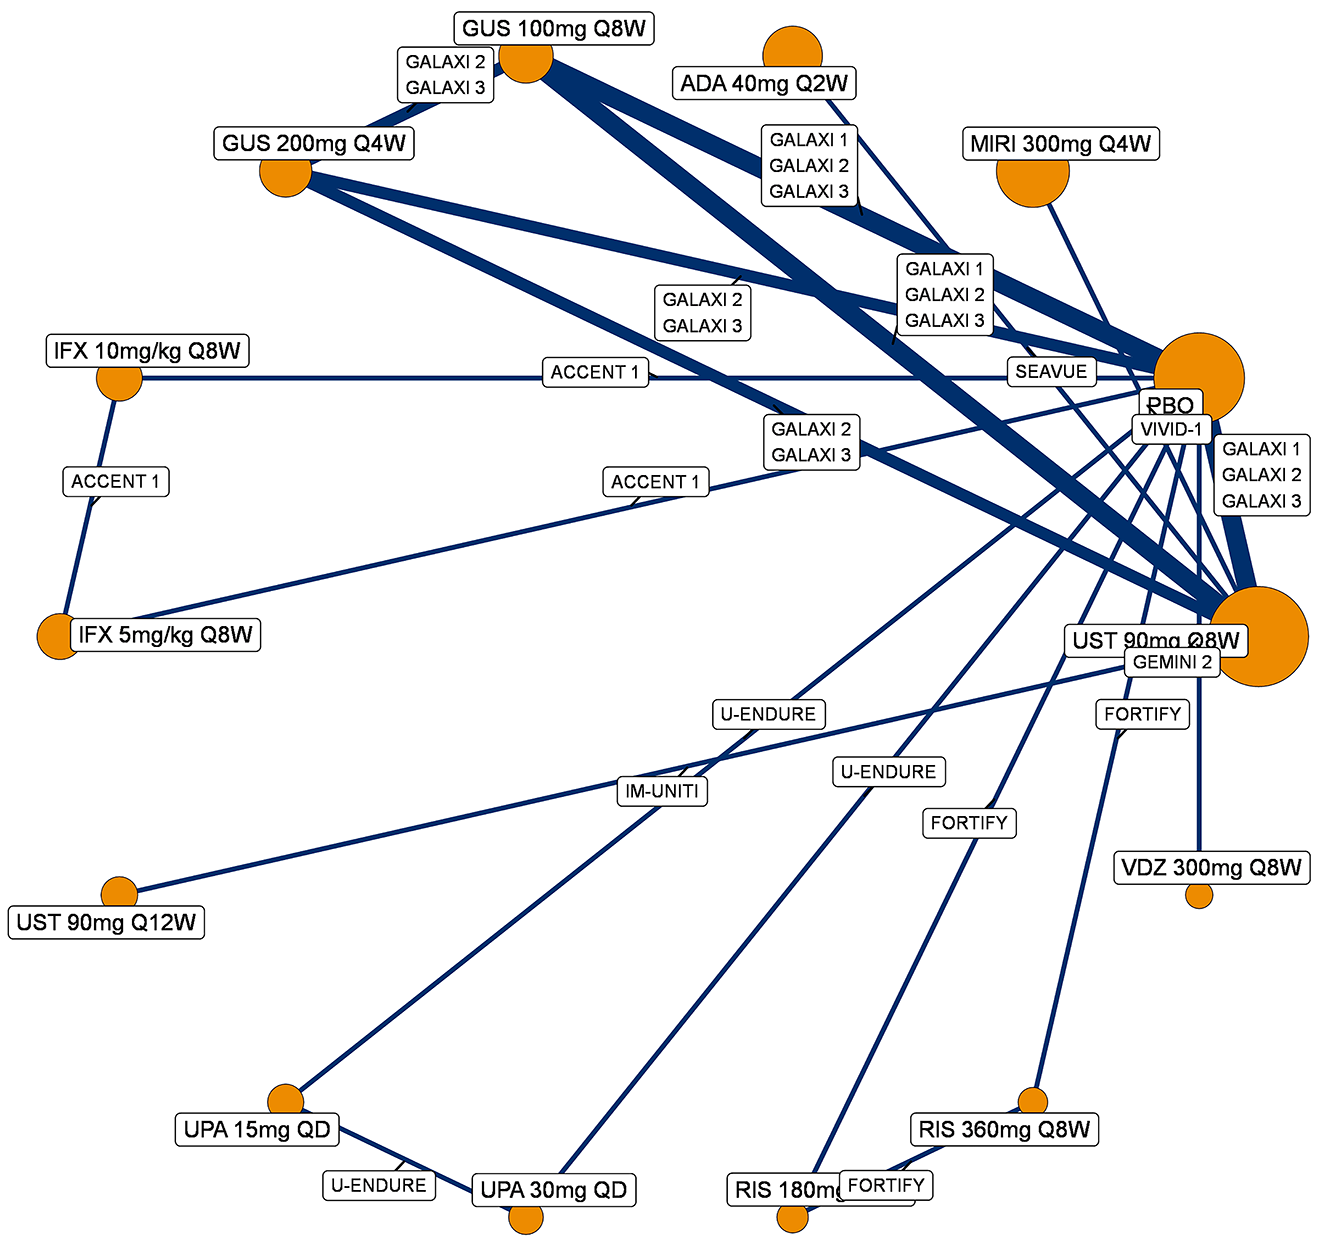
ADA = adalimumab; CON-Failure = conventional therapy failure or intolerance; GUS = guselkumab; IFX = infliximab; MIRI = mirikizumab; PBO = placebo; Q2W = every 2 weeks; Q4W = every 4 weeks; Q8W = every 8 weeks; Q12W = every 12 weeks; QD = once daily; RIS = risankizumab; UPA = upadacitinib; UST = ustekinumab; VDZ = vedolizumab.
Source: Guselkumab systematic literature review and network meta-analysis report.46
BIO-Failure Analysis Population (Including Those With Delayed Response)
A network diagram for studies reporting clinical response, during the maintenance analysis, in a BIO-Failure population (including those with delayed response) is presented in Figure 16.
Figure 16: Network Diagram for Clinical Response — Maintenance Analysis, BIO-Failure Analysis Population (Including Those With Delayed Response)
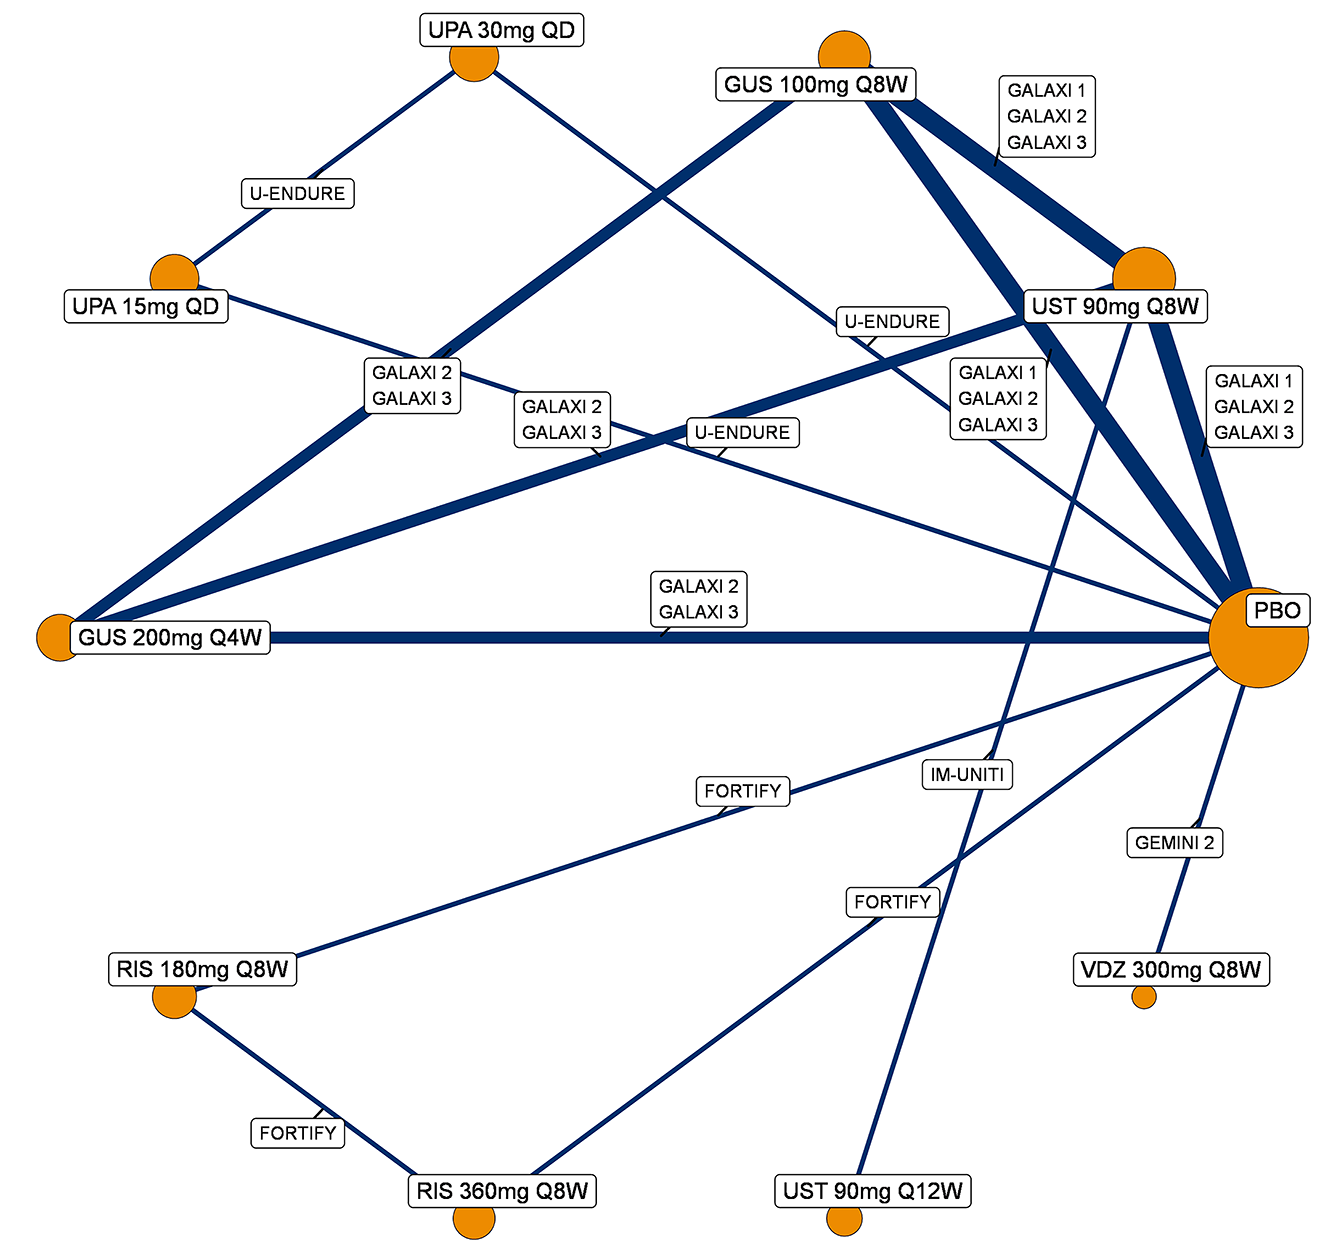
BIO-Failure = biologic therapy failure or intolerance; GUS = guselkumab; PBO = placebo; Q4W = every 4 weeks; Q8W = every 8 weeks; Q12W = every 12 weeks; QD = once daily; RIS = risankizumab; UPA = upadacitinib; UST = ustekinumab; VDZ = vedolizumab.
Source: Guselkumab systematic literature review and network meta-analysis report.46
A network diagram for studies reporting clinical remission, during the maintenance analysis, in a BIO-Failure analysis population (including those with delayed response) is presented in Figure 17.
Figure 17: Network Diagram for Clinical Remission — Maintenance Analysis, BIO-Failure Analysis Population (Including Those With Delayed Response)
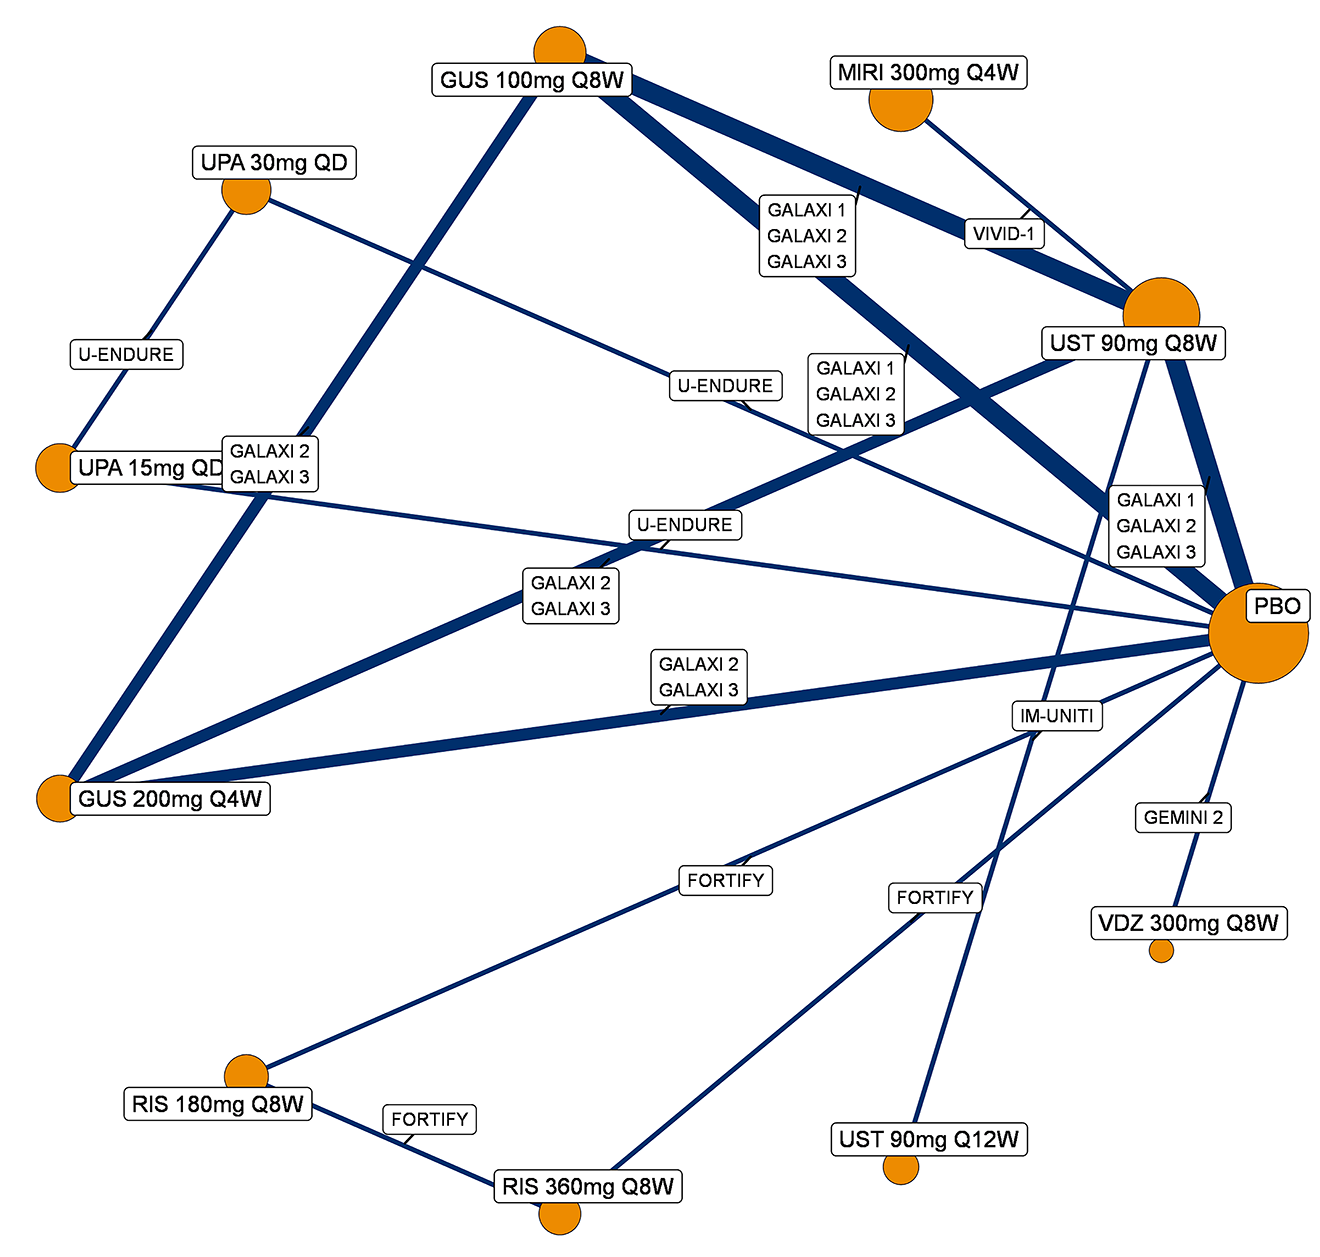
BIO-Failure = biologic therapy failure or intolerance; GUS = guselkumab; MIRI = mirikizumab; PBO = placebo; Q4W = every 4 weeks; Q8W = every 8 weeks; Q12W = every 12 weeks; QD = once daily; RIS = risankizumab; UPA = upadacitinib; UST = ustekinumab; VDZ = vedolizumab.
Source: Guselkumab systematic literature review and network meta-analysis report.46
Endoscopic Response
CON-Failure Analysis Population (Including Those With Delayed Response)
A network diagram for studies reporting endoscopic response, during the maintenance analysis, in a CON-Failure analysis population (including those with delayed response) is presented in Figure 18.
Figure 18: Network Diagram for Endoscopic Response — Maintenance Analysis, CON-Failure Analysis Population (Including Those With Delayed Response)
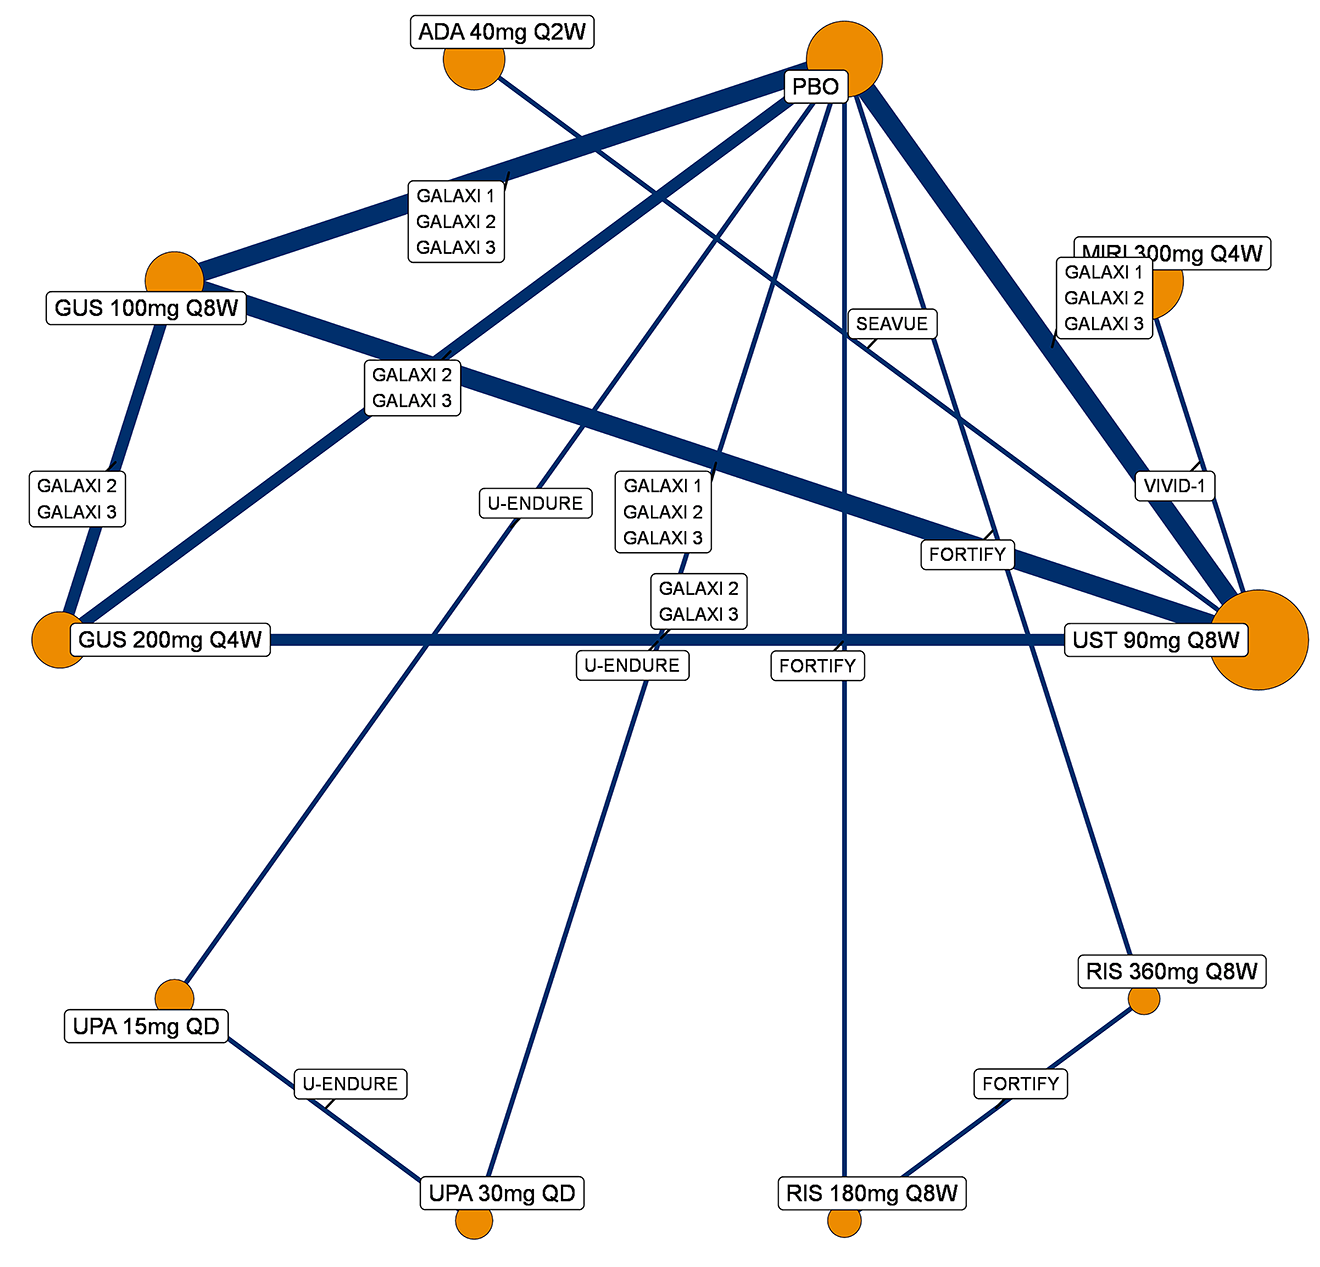
ADA = adalimumab; CON-Failure = conventional therapy failure or intolerance; GUS = guselkumab; MIRI = mirikizumab; PBO = placebo; Q2W = every 2 weeks; Q4W = every 4 weeks; Q8W = every 8 weeks; QD = once daily; RIS = risankizumab; UPA = upadacitinib; UST = ustekinumab.
Source: Guselkumab systematic literature review and network meta-analysis report.46
BIO-Failure Analysis Population (Including Those With Delayed Response)
A network diagram for studies reporting endoscopic response, during the maintenance analysis, in a BIO-Failure population (including those with delayed response) is presented in Figure 19.
Figure 19: Network Diagram for Endoscopic Response — Maintenance Analysis, BIO-Failure Analysis Population (Including Those With Delayed Response)
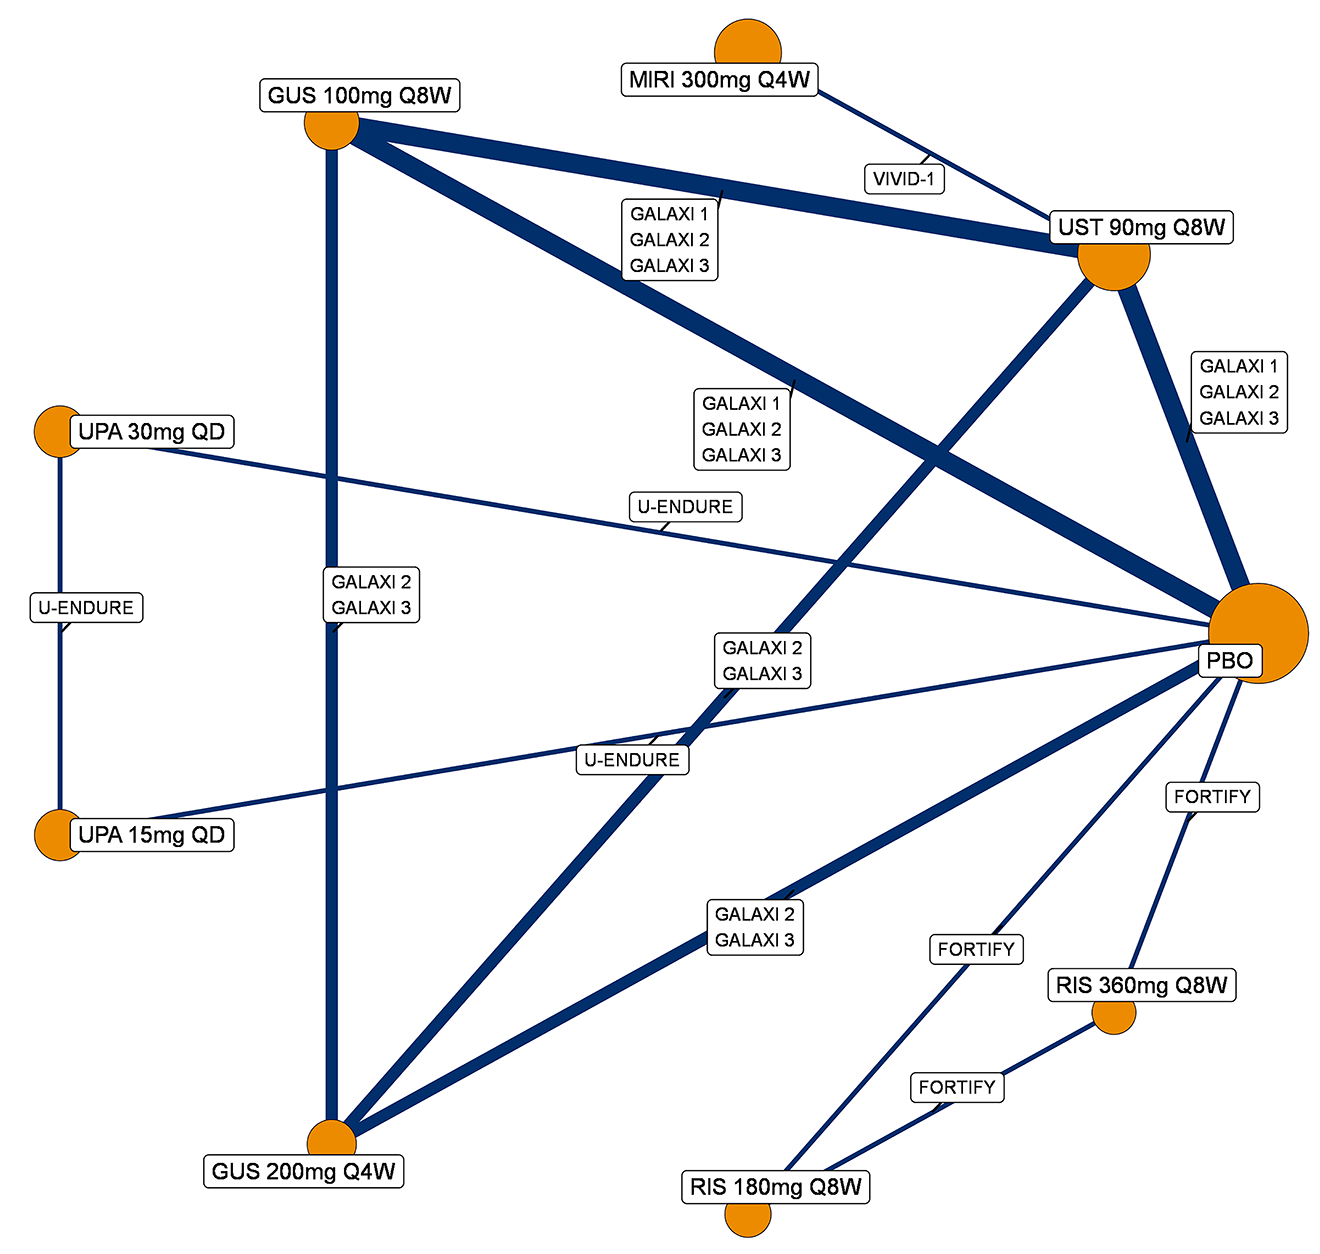
BIO-Failure = biologic therapy failure or intolerance; GUS = guselkumab; MIRI = mirikizumab; PBO = placebo; Q4W = every 4 weeks; Q8W = every 8 weeks; QD = once daily; RIS = risankizumab; UPA = upadacitinib; UST = ustekinumab.
Source: Guselkumab systematic literature review and network meta-analysis report.46
Joint Endoscopic Response and Clinical Remission
CON-Failure Analysis Population (Including Those With Delayed Response)
A network diagram for studies reporting the joint outcome endoscopic response and clinical remission, during the maintenance analysis, in a CON-Failure analysis population (including those with delayed response) is presented in Figure 20.
Figure 20: Network Diagram for Joint Endoscopic Response and Clinical Remission — Maintenance Analysis, CON-Failure Analysis Population (Including Those With Delayed Response)
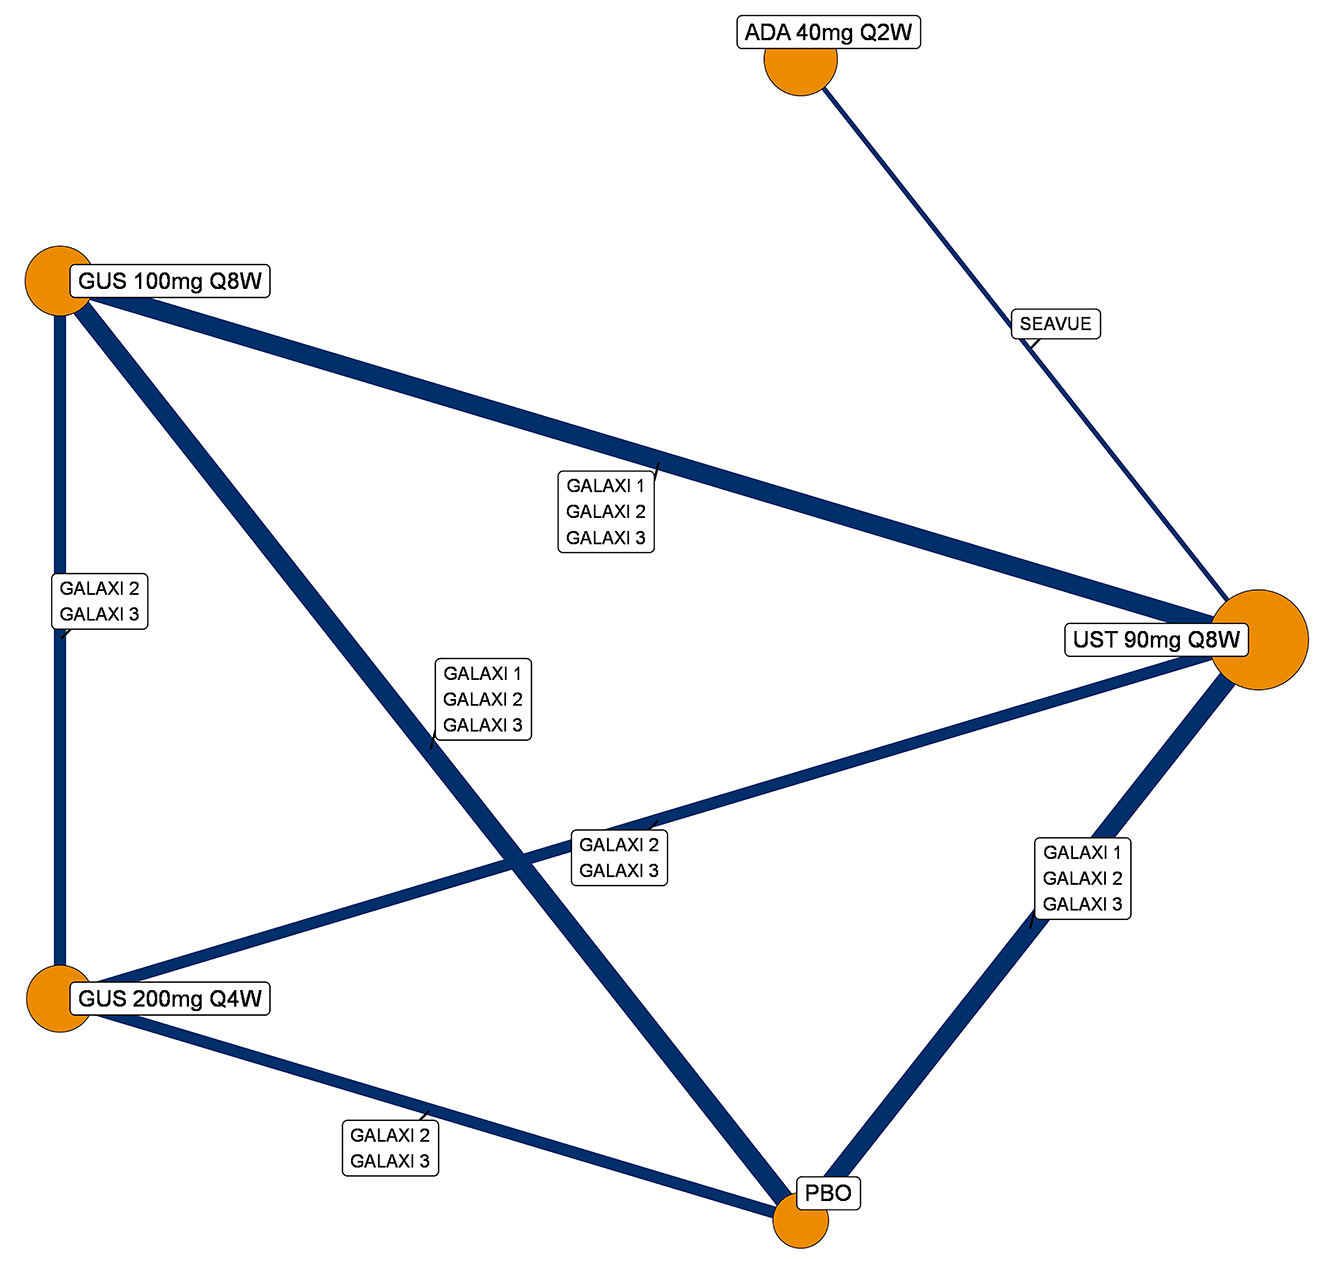
ADA = adalimumab; CON-Failure = conventional therapy failure or intolerance; GUS = guselkumab; PBO = placebo; Q2W = every 2 weeks; Q4W = every 4 weeks; Q8W = every 8 weeks; UST = ustekinumab.
Source: Guselkumab systematic literature review and network meta-analysis report.46
BIO-Failure Analysis Population (Including Those With Delayed Response)
A network diagram for studies reporting the joint outcome endoscopic response and clinical remission, during the maintenance analysis, in a BIO-Failure analysis population (including those with delayed response) is presented in Figure 21.
Figure 21: Network Diagram for Joint Endoscopic Response and Clinical Remission — Maintenance Analysis, BIO-Failure Analysis Population (Including Those With Delayed Response)
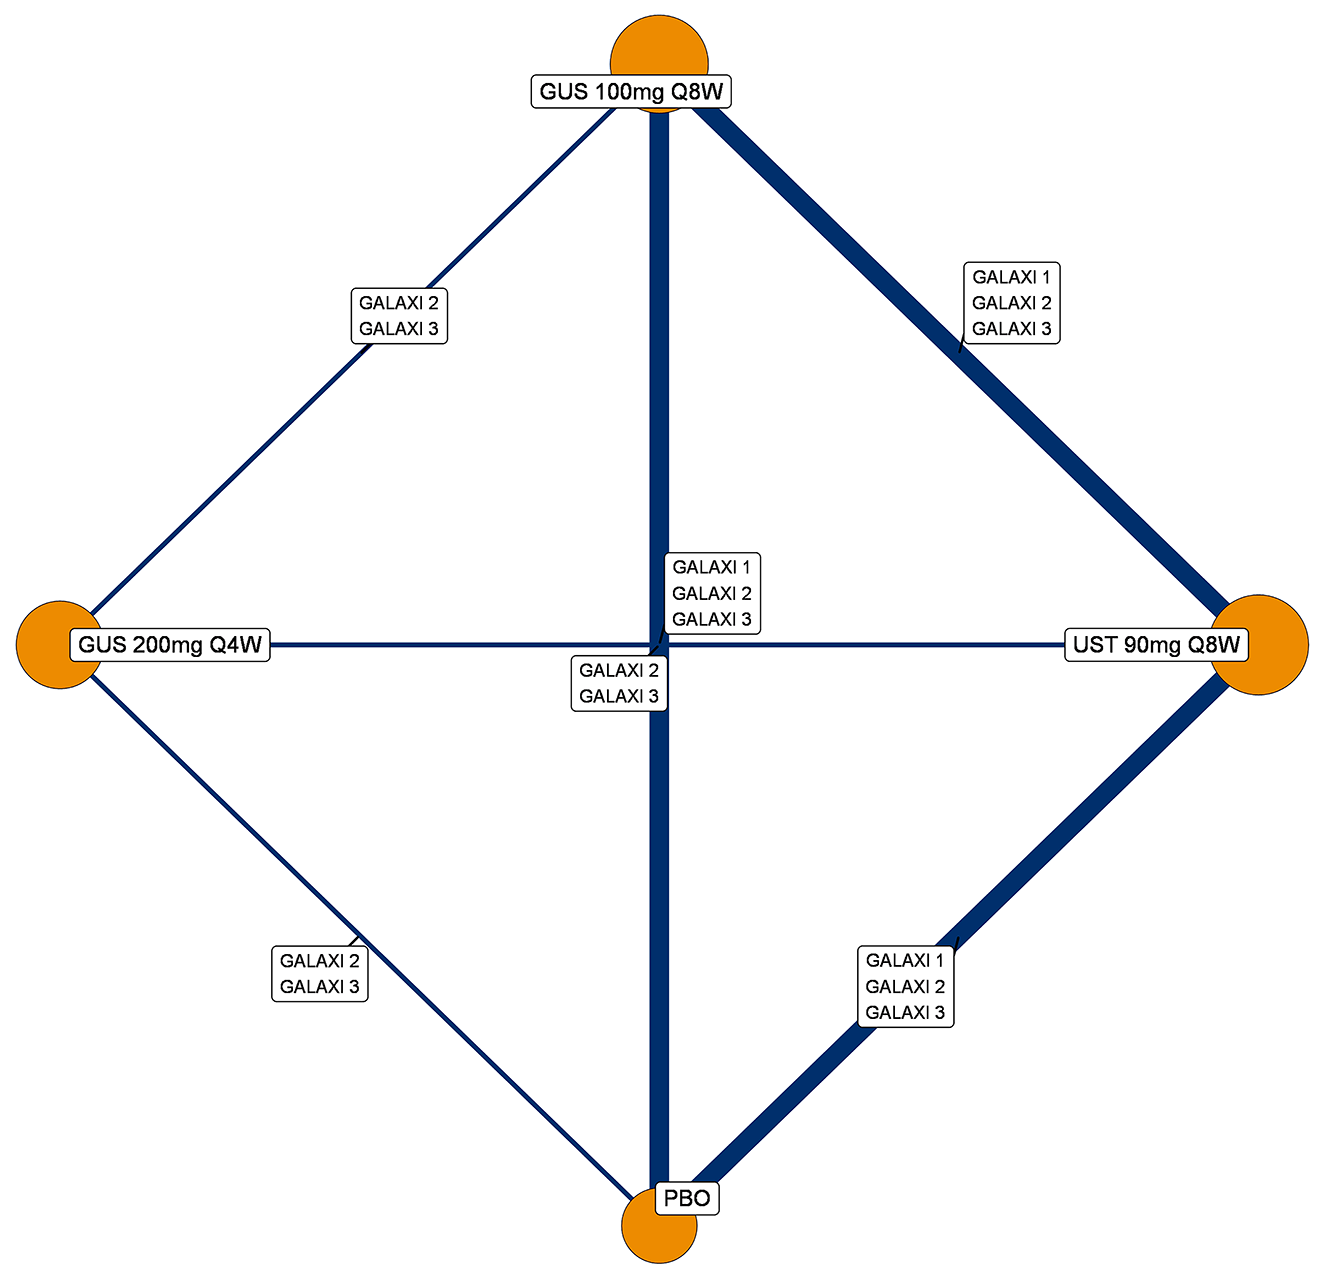
BIO-Failure = biologic therapy failure or intolerance; GUS = guselkumab; PBO = placebo; Q4W = every 4 weeks; Q8W = every 8 weeks; UST = ustekinumab.
Source: Guselkumab systematic literature review and network meta-analysis report.46
Efficacy
Induction Analysis
Clinical Response
CON-Failure Analysis Population (Baseline Risk-Adjusted)
A baseline risk-adjusted, random-effects NMA was conducted for clinical response in the induction phase, in a CON-Failure analysis population. Model fit statistics are provided in Table 42.
In comparison to 200 mg of guselkumab, no treatments were significantly more efficacious (Figure 22). Vedolizumab was significantly less efficacious than 200 mg guselkumab on clinical response. Placebo was significantly less efficacious than 200 mg guselkumab.
Table 42: Model Fit Statistics Supporting Random-Effects NMAs for Clinical Response — Induction Analysis, CON-Failure Analysis Population
Parameter | Random effect BLR |
|---|---|
SD[1] | 0.21 (0.07 to 0.48) |
SD[2] | 0.2 (0.07 to 0.45) |
Total residual deviance (64 data points) | 63.79 |
DIC | 400.6 |
Beta | −0.51 (−0.97 to −0.04) |
BLR = baseline risk; CON-Failure = conventional therapy failure or intolerance; DIC = deviance information criterion; NMA = network meta-analysis; SD = standard deviation.
Source: Guselkumab systematic literature review and network meta-analysis report.46
Figure 22: Forest Plot for Random-Effects NMA of Clinical Response — Induction Analysis, CON-Failure Analysis Population, Baseline Risk-Adjusted
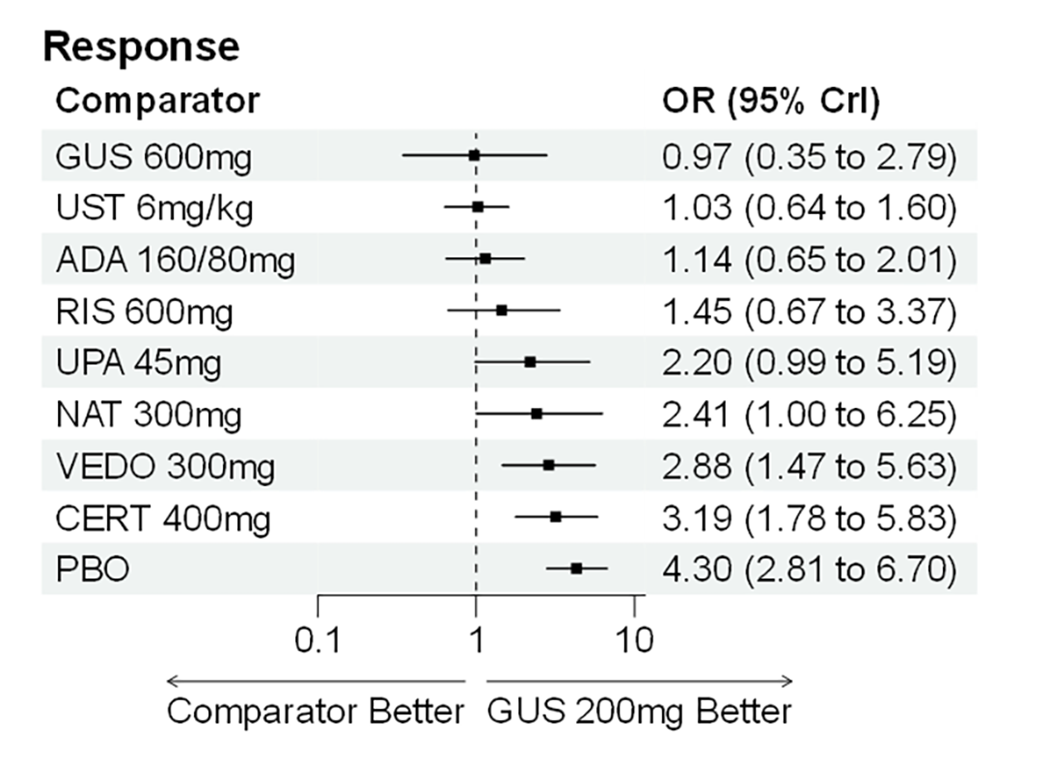
ADA = adalimumab; CERT = certolizumab pegol; CON-Failure = conventional therapy failure or intolerance; CrI = credible interval; GUS = guselkumab; NAT = natalizumab; NMA = network meta-analysis; OR = odds ratio; PBO = placebo; RIS = risankizumab; UPA = upadacitinib; UST = ustekinumab; VEDO = vedolizumab.
Source: Guselkumab systematic literature review and network meta-analysis report.46
BIO-Failure Analysis Population (Baseline Risk-Adjusted)
A baseline risk-adjusted, random-effects NMA was conducted for clinical response in the induction phase, in a BIO-Failure analysis population. Model fit statistics are provided in Table 43.
In comparison to 200 mg of guselkumab, no treatments were significantly more efficacious (Figure 23). Ustekinumab, adalimumab, and vedolizumab were significantly less efficacious than low-dose (200 mg) guselkumab on clinical response. Vedolizumab and placebo were significantly less efficacious than 200 mg guselkumab.
Table 43: Model Fit Statistics Supporting Random-Effects NMAs for Clinical Response — Induction Analysis, BIO-Failure Analysis Population
Parameter | Random effect BLR |
|---|---|
SD[1] | 0.23 (0.08 to 0.48) |
SD[2] | 0.35 (0.09 to 0.68) |
Total residual deviance (56 data points) | 58.57 |
DIC | 359.36 |
Beta | −0.89 (−1.41 to −0.05) |
BIO-Failure = biologic therapy failure or intolerance; BLR = baseline risk; DIC = deviance information criterion; NMA = network meta-analysis; SD = standard deviation.
Source: Guselkumab systematic literature review and network meta-analysis report.46
Figure 23: Forest Plot for Random-Effects NMA of Clinical Response — Induction Analysis, BIO-Failure Analysis Population, Baseline Risk-Adjusted
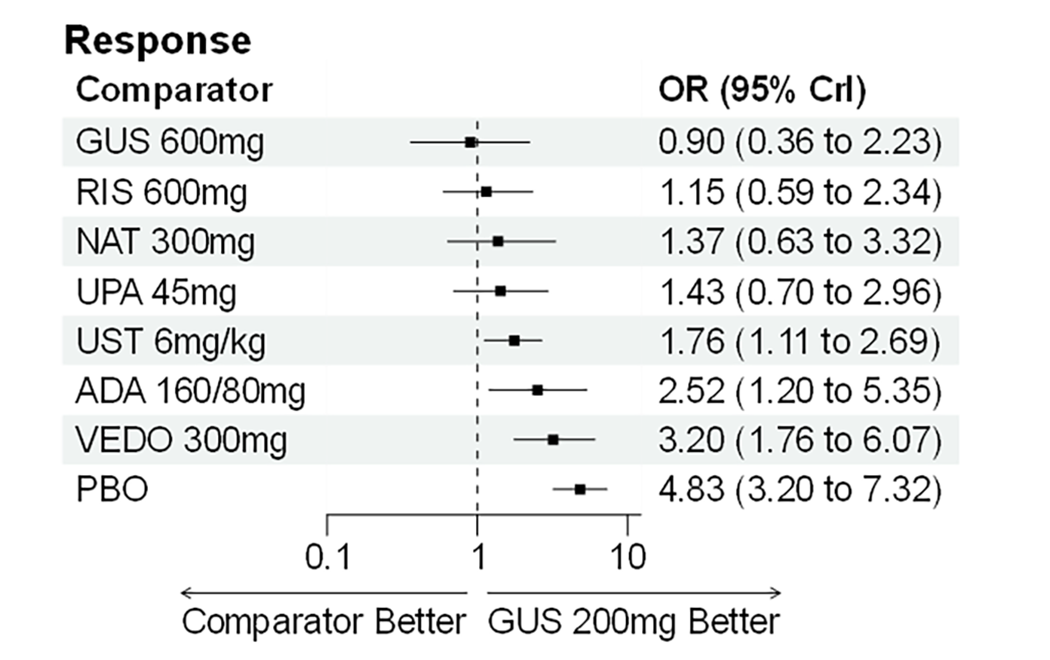
ADA = adalimumab; BIO-Failure = biologic therapy failure or intolerance; CrI = credible interval; GUS = guselkumab; NAT = natalizumab; NMA = network meta-analysis; OR = odds ratio; PBO = placebo; RIS = risankizumab; UPA = upadacitinib; UST = ustekinumab; VEDO = vedolizumab.
Source: Guselkumab systematic literature review and network meta-analysis report.46
Clinical Remission
CON-Failure Analysis Population (Baseline Risk-Adjusted)
A baseline risk-adjusted, random-effects NMA was conducted for clinical remission in the induction phase, in a CON-Failure analysis population. Model fit statistics are provided in Table 44.
In comparison to 200 mg of guselkumab, no treatments were significantly more efficacious (Figure 24). Placebo was significantly less efficacious than 200 mg guselkumab on clinical remission.
Table 44: Model Fit Statistics Supporting Random-Effects NMAs for Clinical Remission — Induction Analysis, CON-Failure Analysis Population
Parameter | Random effect BLR |
|---|---|
SD[1] | 0.21 (0.07 to 0.48) |
SD[2] | 0.2 (0.07 to 0.45) |
Total residual deviance (64 data points) | 63.79 |
DIC | 400.6 |
Beta | −0.51 (−0.97 to −0.04) |
BLR = baseline risk; CON-Failure = conventional therapy failure or intolerance; DIC = deviance information criterion; NMA = network meta-analysis; SD = standard deviation.
Source: Guselkumab systematic literature review and network meta-analysis report.46
Figure 24: Forest Plot for Random-Effects NMA of Clinical Remission — Induction Analysis, CON-Failure Analysis Population, Baseline Risk-Adjusted
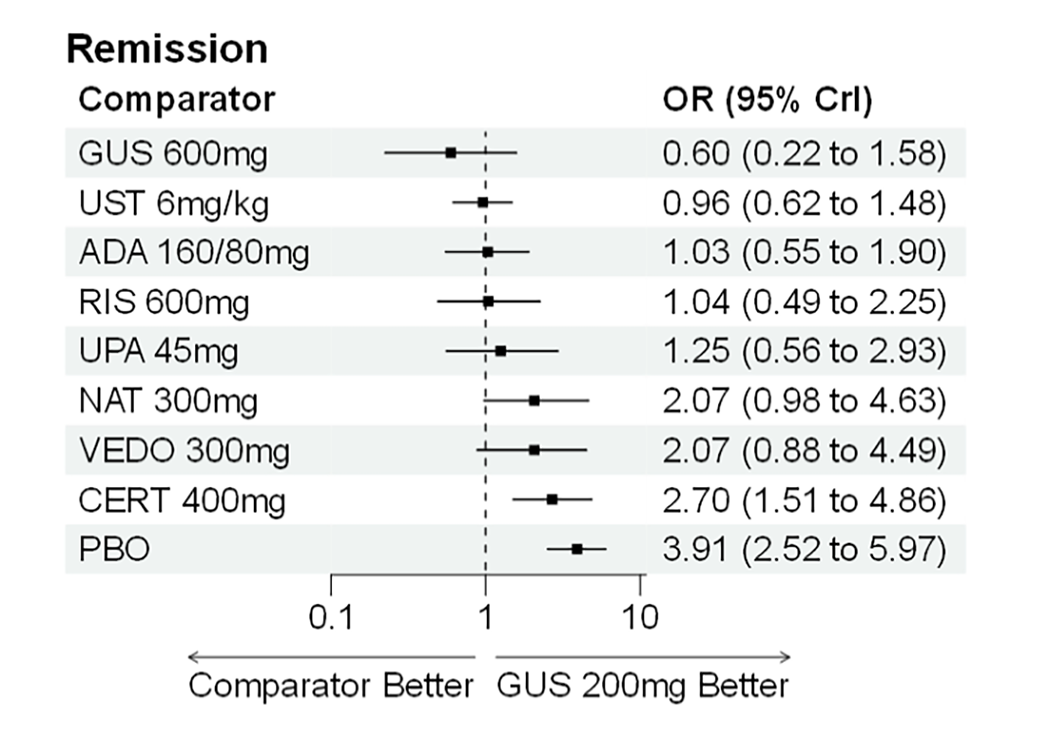
ADA = adalimumab; CERT = certolizumab pegol; CON-Failure = conventional therapy failure or intolerance; CrI = credible interval; GUS = guselkumab; NAT = natalizumab; NMA = network meta-analysis; OR = odds ratio; PBO = placebo; RIS = risankizumab; UPA = upadacitinib; UST = ustekinumab; VEDO = vedolizumab.
Source: Guselkumab systematic literature review and network meta-analysis report.46
BIO-Failure Population (Baseline Risk-Adjusted)
A baseline risk-adjusted, random-effects NMA was conducted for clinical remission in the induction phase, in a BIO-Failure population. Model fit statistics are provided in Table 45.
In comparison to 200 mg of guselkumab, no treatments were significantly more efficacious (Figure 25). Vedolizumab and ustekinumab were significantly less efficacious than low-dose (200 mg) guselkumab on clinical remission. Placebo was significantly less efficacious than 200 mg guselkumab.
Table 45: Model Fit Statistics Supporting Random-Effects NMAs for Clinical Remission — Induction Analysis, BIO-Failure Analysis Population
Parameter | Random effect BLR |
|---|---|
SD[1] | 0.23 (0.08 to 0.48) |
SD[2] | 0.35 (0.09 to 0.68) |
Total residual deviance (56 data points) | 58.57 |
DIC | 359.36 |
Beta | −0.89 (−1.41 to −0.05) |
BIO-Failure = biologic therapy failure or intolerance; BLR = baseline risk; DIC = deviance information criterion; NMA = network meta-analysis; SD = standard deviation.
Source: Guselkumab systematic literature review and network meta-analysis report.46
Figure 25: Forest Plot for Random-Effects NMA of Clinical Remission — Induction Analysis, BIO-Failure Analysis Population, Baseline Risk-Adjusted
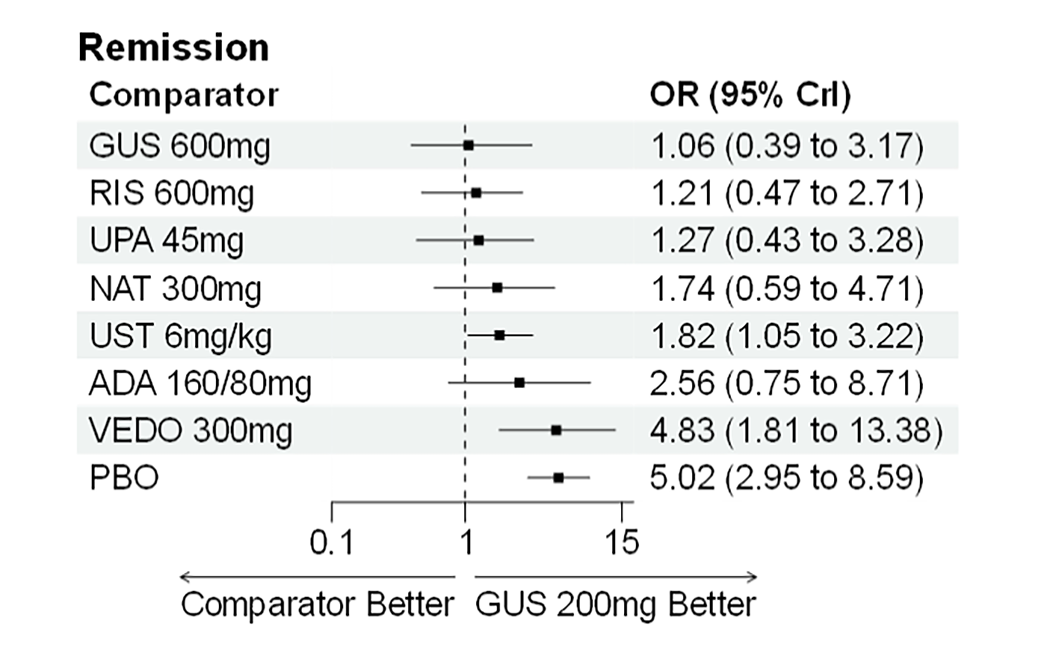
ADA = adalimumab; BIO-Failure = biologic therapy failure or intolerance; CrI = credible interval; GUS = guselkumab; NAT = natalizumab; NMA = network meta-analysis; OR = odds ratio; PBO = placebo; RIS = risankizumab; UPA = upadacitinib; UST = ustekinumab; VEDO = vedolizumab.
Source: Guselkumab systematic literature review and network meta-analysis report.46
Maintenance Analysis, Without Those With Delayed Response
Clinical Response
CON-Failure Analysis Population (Without Those With Delayed Response)
A random-effects NMA was conducted for clinical response in the maintenance phase, in a CON-Failure population (without those with delayed response). Model fit statistics are provided in Table 46.
██ ██████████ ██ ████ ███████ ██ ███████████ ██ ██████████ ████ █████████████ ████ ██████ (Figure 26). ████████████ █████ ██ ██ ██ ███ ██ ██ ███ ███ ███████████ ████ ██ ████ ████ █████████████ ████ ███████████ ████ ████ █████████
Table 46: Model Fit Statistics Supporting Random-Effects NMAs for Clinical Response — Maintenance Analysis, CON-Failure Analysis Population
Parameter | Random effect |
|---|---|
SD[1] | ████ █████ ██ █████ |
SD[2] | ████ █████ ██ █████ |
Total residual deviance (54 data points) | █████ |
DIC | ██████ |
CON-Failure = conventional therapy failure or intolerance; DIC = deviance information criterion; NMA = network meta-analysis; SD = standard deviation.
Source: Guselkumab systematic literature review and network meta-analysis report.46

BIO-Failure Analysis Population (Without Those With Delayed Response)
A random-effects NMA was conducted for clinical response in the maintenance phase, in a BIO-Failure analysis population (without those with delayed response). Model fit statistics are provided in Table 47.
██ ██████████ ██ ████ ███████ ██ ███████████ ██ ██████████ ████ █████████████ ████ ███████████ ██ ████████ ████████ (Figure 27). ██ █████ ███████████ ████ ██ ████ ███ ███████ ████ █████████████ ████ ███████████ ████ ████ ██████████ ███████.
Table 47: Model Fit Statistics Supporting Random-Effects NMAs for Clinical Response — Maintenance Analysis, BIO-Failure Analysis Population
Parameter | Random effect |
|---|---|
SD[1] | ████ █████ ██ █████ |
SD[2] | ████ █████ ██ █████ |
Total residual deviance (44 data points) | █████ |
DIC | ██████ |
BIO-Failure = biologic therapy failure or intolerance; DIC = deviance information criterion; NMA = network meta-analysis; SD = standard deviation.
Source: Guselkumab systematic literature review and network meta-analysis report.46

Clinical Remission
CON-Failure Population (Without Those With Delayed Response)
A random-effects NMA was conducted for clinical remission in the maintenance phase, in a CON-Failure analysis population (without those with delayed response). Model fit statistics are provided in Table 48.
██ ██████████ ██ ████ ███████ ██ ███████████ ██ ██████████ ████ █████████████ ████ ███████████ ██ ████████ █████████ (Figure 28). ███████████ ████ ██ ████ ███ █████████████ ████ ███████████ ████ ████ ██████████ ████████ ███████ ███ █████████████ ████ ███████████ ████ ██████ ████ ██ ██████████ ██ ████████ ██████████
Table 48: Model Fit Statistics Supporting Random-Effects NMAs for Clinical Remission — Maintenance Analysis, CON-Failure Analysis Population
Parameter | Random effect |
|---|---|
SD[1] | ████ █████ ██ █████ |
SD[2] | ████ █████ ██ █████ |
Total residual deviance (54 data points) | █████ |
DIC | ██████ |
CON-Failure = conventional therapy failure or intolerance; DIC = deviance information criterion; NMA = network meta-analysis; SD = standard deviation.
Source: Guselkumab systematic literature review and network meta-analysis report.46

BIO-Failure Population (Without Those With Delayed Response)
A random-effects NMA was conducted for clinical remission in the maintenance phase, in a BIO-Failure population (without those with delayed response). Model fit statistics are provided in Table 49.
██ ██████████ ██ ████ ███████ ██ ███████████ ██ ██████████ ████ █████████████ ████ ███████████ ██ ████████ ████████ (Figure 29). ██ █████ ███████████ ████ ██ ████ ███ ███████ ████ █████████████ ████ ███████████ ████ ████ ██████████ ████████
Table 49: Model Fit Statistics Supporting Random-Effects NMAs for Clinical Remission — Maintenance Analysis, BIO-Failure Analysis Population
Parameter | Random effect |
|---|---|
SD[1] | ████ █████ ██ █████ |
SD[2] | ████ █████ ██ █████ |
Total residual deviance (44 data points) | █████ |
DIC | ██████ |
BIO-Failure = biologic therapy failure or intolerance; DIC = deviance information criterion; NMA = network meta-analysis; SD = standard deviation.
Source: Guselkumab systematic literature review and network meta-analysis report.46

Endoscopic Response
CON-Failure Analysis Population (Without Those With Delayed Response)
A random-effects NMA was conducted for endoscopic response in the maintenance phase, in a CON-Failure population (without those with delayed response). Model fit statistics are provided in Table 50.
██ ██████████ ██ ████ ███████ ██ ███████████ ██ ███████████████████ (Figure 30). ██████ █████████ ███████████ ███ ███████████ ██████ ███ ████████████ ████ ██ ████ ████ ███████████ ████ ████████████ █████████████ ████████████ ███ ██ ███ ███ █████████████ ████ ███████████ ████████ ██ █████████ ███████████ ███████ ███ █
Table 50: Model Fit Statistics Supporting Random-Effects NMAs for Endoscopic Response — Maintenance Analysis, CON-Failure Analysis Population
Parameter | Random effect |
|---|---|
SD | ████ █████ ██ █████ |
Total residual deviance (21 data points) | █████ |
DIC | ██████ |
CON-Failure = conventional therapy failure or intolerance; DIC = deviance information criterion; NMA = network meta-analysis; RE = random effect; SD = standard deviation.
Source: Guselkumab systematic literature review and network meta-analysis report.46

BIO-Failure Analysis Population (Without Those With Delayed Response)
A random-effects NMA was conducted for endoscopic response in the maintenance phase, in a BIO-Failure population (without those with delayed response). Model fit statistics are provided in Table 51.
██ ██████████ ██ ████ ███████ ██ ███████████ ██ ██████████ ████ █████████████ ████ ███████████ (Figure 31). ███████ ███ █████████████ ████ ███████████ ████ ██████ ████ ██ ██████████ ██ ██████████ █████████ █████████████ ███████████ ███ ██ ████ ███ █████████████ ████ ███████████ ████████ ██ ███ ███ ████ ██ ███████████
Table 51: Model Fit Statistics Supporting Random-Effects NMAs for Endoscopic Response — Maintenance Analysis, BIO-Failure Analysis Population
Parameter | Random effect |
|---|---|
SD | ████ █████ ██ █████ |
Total residual deviance (19 data points) | █████ |
DIC | ██████ |
BIO-Failure = biologic therapy failure or intolerance; DIC = deviance information criterion; NMA = network meta-analysis; SD = standard deviation.
Source: Guselkumab systematic literature review and network meta-analysis report.46

Joint Endoscopic Response and Clinical Remission
CON-Failure Analysis Population (Without Those With Delayed Response)
A random-effects NMA was conducted for the joint outcome endoscopic response and clinical remission in the maintenance phase, in a CON-Failure population (without those with delayed response). Model fit statistics are provided in Table 52.
██ ██████████ ██ ████ ███████ ██ ███████████ ██ ██████████ ████ █████████████ ████ ███████████ (Figure 32). ███████ ███ █████████████ ████ ███████████ ████ ██████ ████ ██ ██████████ ██ █████ ██████████ ████████ ███ ████████ ██████████
Table 52: Model Fit Statistics Supporting Random-Effects NMAs for Joint Endoscopic Response and Clinical Remission — Maintenance Analysis, CON-Failure Analysis Population
Parameter | Random effect |
|---|---|
SD | ████ █████ ██ ████ |
Total residual deviance (13 data points) | █████ |
DIC | █████ |
CON-Failure = conventional therapy failure or intolerance; DIC = deviance information criterion; NMA = network meta-analysis; SD = standard deviation.
Source: Guselkumab systematic literature review and network meta-analysis report.46

BIO-Failure Analysis Population (Without Those With Delayed Response)
A random-effects NMA was conducted for the joint outcome endoscopic response and clinical remission in the maintenance phase, in a BIO-Failure population (without those with delayed response). Model fit statistics are provided in Table 53.
██ ██████████ ██ ████ ███████ ██ ███████████ ██ ██████████ ████ █████████████ ████ ███████████ (Figure 33). ███████████ ███ ██ ████ ███ █████████████ ████ ███████████ ████ ███ ████ ██ ███████████ ███████ ███ █████████████ ████ ███████████ ████ ██████ ████ ██ ██████████ ██ █████ ██████████ ████████ ███ ████████ ██████████
Table 53: Model Fit Statistics Supporting Random-Effects NMAs for Joint Endoscopic Response and Clinical Remission — Maintenance Analysis, BIO-Failure Analysis Population
Parameter | Random effect |
|---|---|
SD | ████ █████ ██ █████ |
Total residual deviance (11 data points) | █████ |
DIC | █████ |
BIO-Failure = biologic therapy failure or intolerance; DIC = deviance information criterion; NMA = network meta-analysis; SD = standard deviation.
Source: Guselkumab systematic literature review and network meta-analysis report.46

Maintenance Analysis, Including Those With Delayed Response
Clinical Response
CON-Failure Analysis Population (Including Those With Delayed Response)
A random-effects NMA was conducted for clinical response in the maintenance phase, in a CON-Failure population (including those with delayed response). Model fit statistics are provided in Table 54.
In comparison to both dosages of guselkumab, no treatments were significantly more efficacious on clinical response (Figure 34). Infliximab (both 10 mg/kg and 5 mg/kg), vedolizumab (300 mg every 8 weeks), and upadacitinib (both 30 mg every day and 15 mg every day) were significantly less efficacious than both guselkumab dosages. Placebo was significantly less efficacious than either dose of guselkumab on clinical response.
Table 54: Model Fit Statistics Supporting Random-Effects NMAs for Clinical Response — Maintenance Analysis, CON-Failure Analysis Population
Parameter | Random effect |
|---|---|
SD[1] | 0.3 (0.09 to 0.73) |
SD[2] | 0.21 (0.07 to 0.58) |
Total residual deviance (54 data points) | 52.59 |
DIC | 301.15 |
CON-Failure = conventional therapy failure or intolerance; DIC = deviance information criterion; NMA = network meta-analysis; SD = standard deviation.
Source: Guselkumab systematic literature review and network meta-analysis report.46
Figure 34: Forest Plots for Random-Effects NMA of Clinical Response — Maintenance Analysis, CON-Failure Analysis Population (Including Those With Delayed Response)
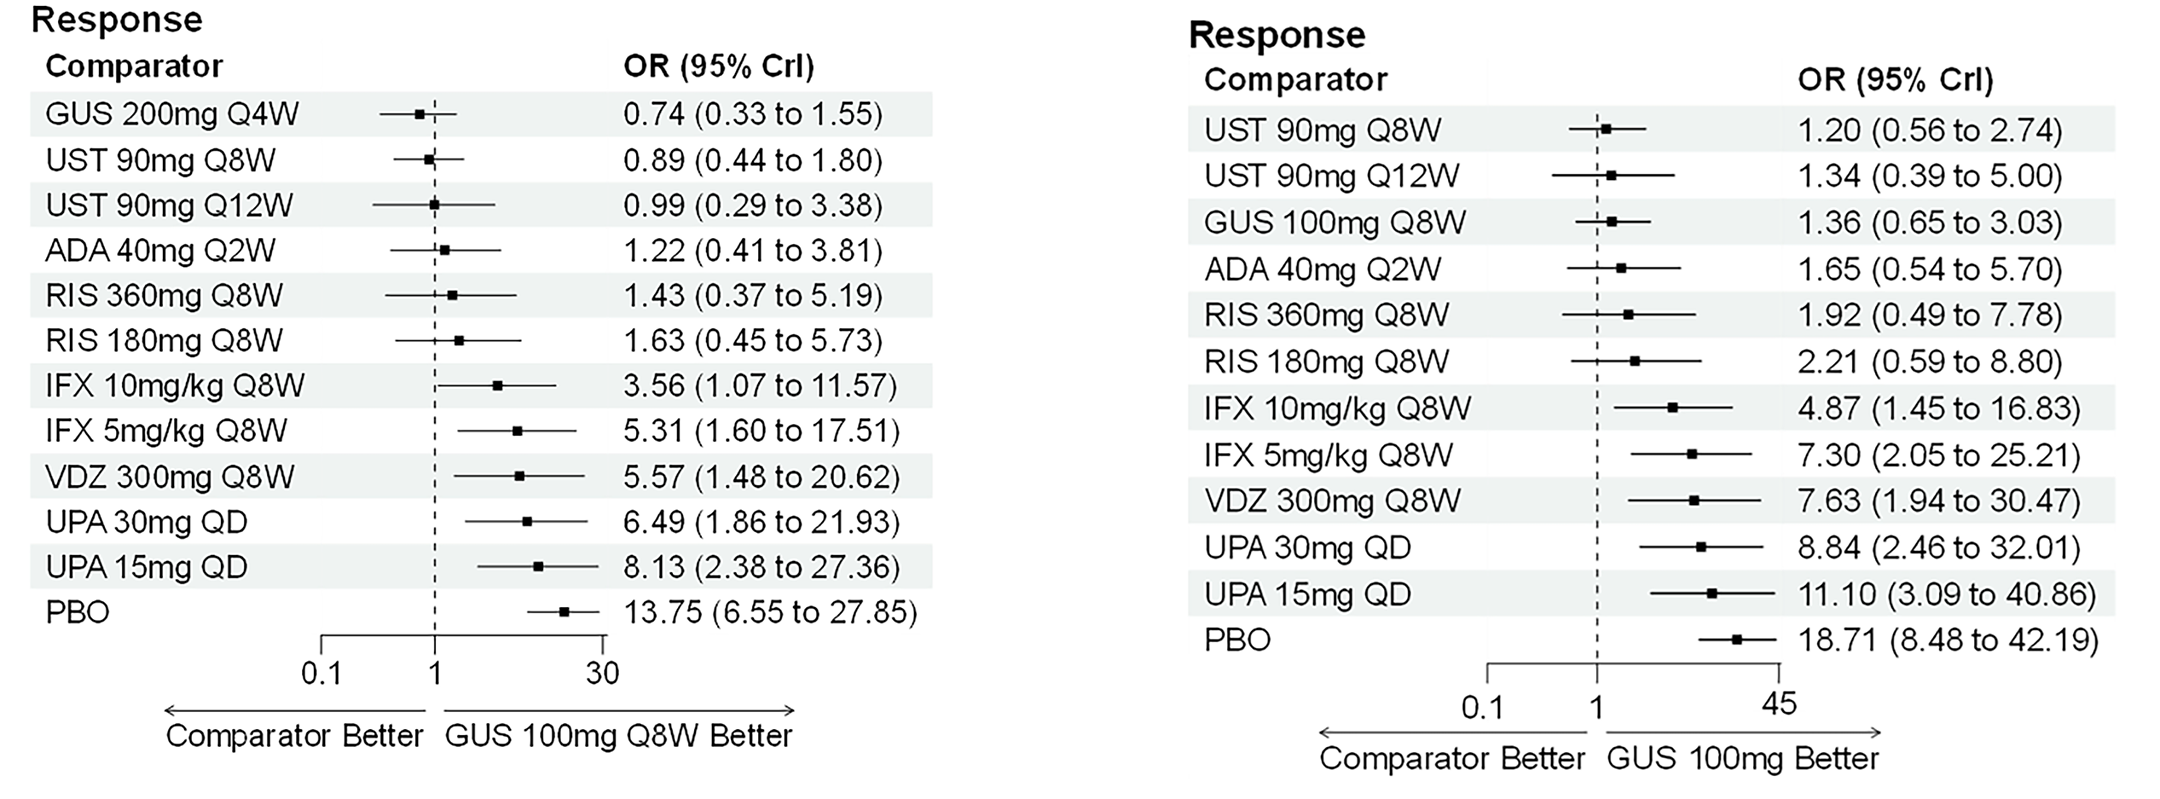
ADA = adalimumab; CON-Failure = conventional therapy failure or intolerance; Crl = credible interval; GUS = guselkumab; IFX = infliximab; NMA = network meta-analysis; PBO = placebo; Q2W = every 2 weeks; Q4W = every 4 weeks; Q8W = every 8 weeks; Q12W = every 12 weeks; QD = once daily; RIS = risankizumab; UPA = upadacitinib; UST = ustekinumab; VDZ = vedolizumab.
Source: Guselkumab systematic literature review and network meta-analysis report.46
BIO-Failure Analysis Population (Including Those With Delayed Response)
A random-effects NMA was conducted for clinical response in the maintenance phase, in a BIO-Failure population (including those with delayed response). Model fit statistics are provided in Table 55.
In comparison to both dosages of guselkumab, no treatments were significantly more efficacious on clinical response (Figure 35). Upadacitinib (both 30 mg every day and 15 mg every day) and vedolizumab (300 mg every 8 weeks) were significantly less efficacious than both guselkumab dosages. Placebo was significantly less efficacious than either dose of guselkumab on clinical response.
Table 55: Model Fit Statistics Supporting Random-Effects NMAs for Clinical Response — Maintenance Analysis, BIO-Failure Analysis Population
Parameter | Random effect |
|---|---|
SD[1] | 0.22 (0.07 to 0.6) |
SD[2] | 0.22 (0.07 to 0.55) |
Total residual deviance (44 data points) | 41.07 |
DIC | 247.08 |
BIO-Failure = biologic therapy failure or intolerance; DIC = deviance information criterion; NMA = network meta-analysis; SD = standard deviation.
Source: Guselkumab systematic literature review and network meta-analysis report.46
Figure 35: Forest Plots for Random-Effects NMA of Clinical Response — Maintenance Analysis, BIO-Failure Analysis Population (Including Those With Delayed Response)
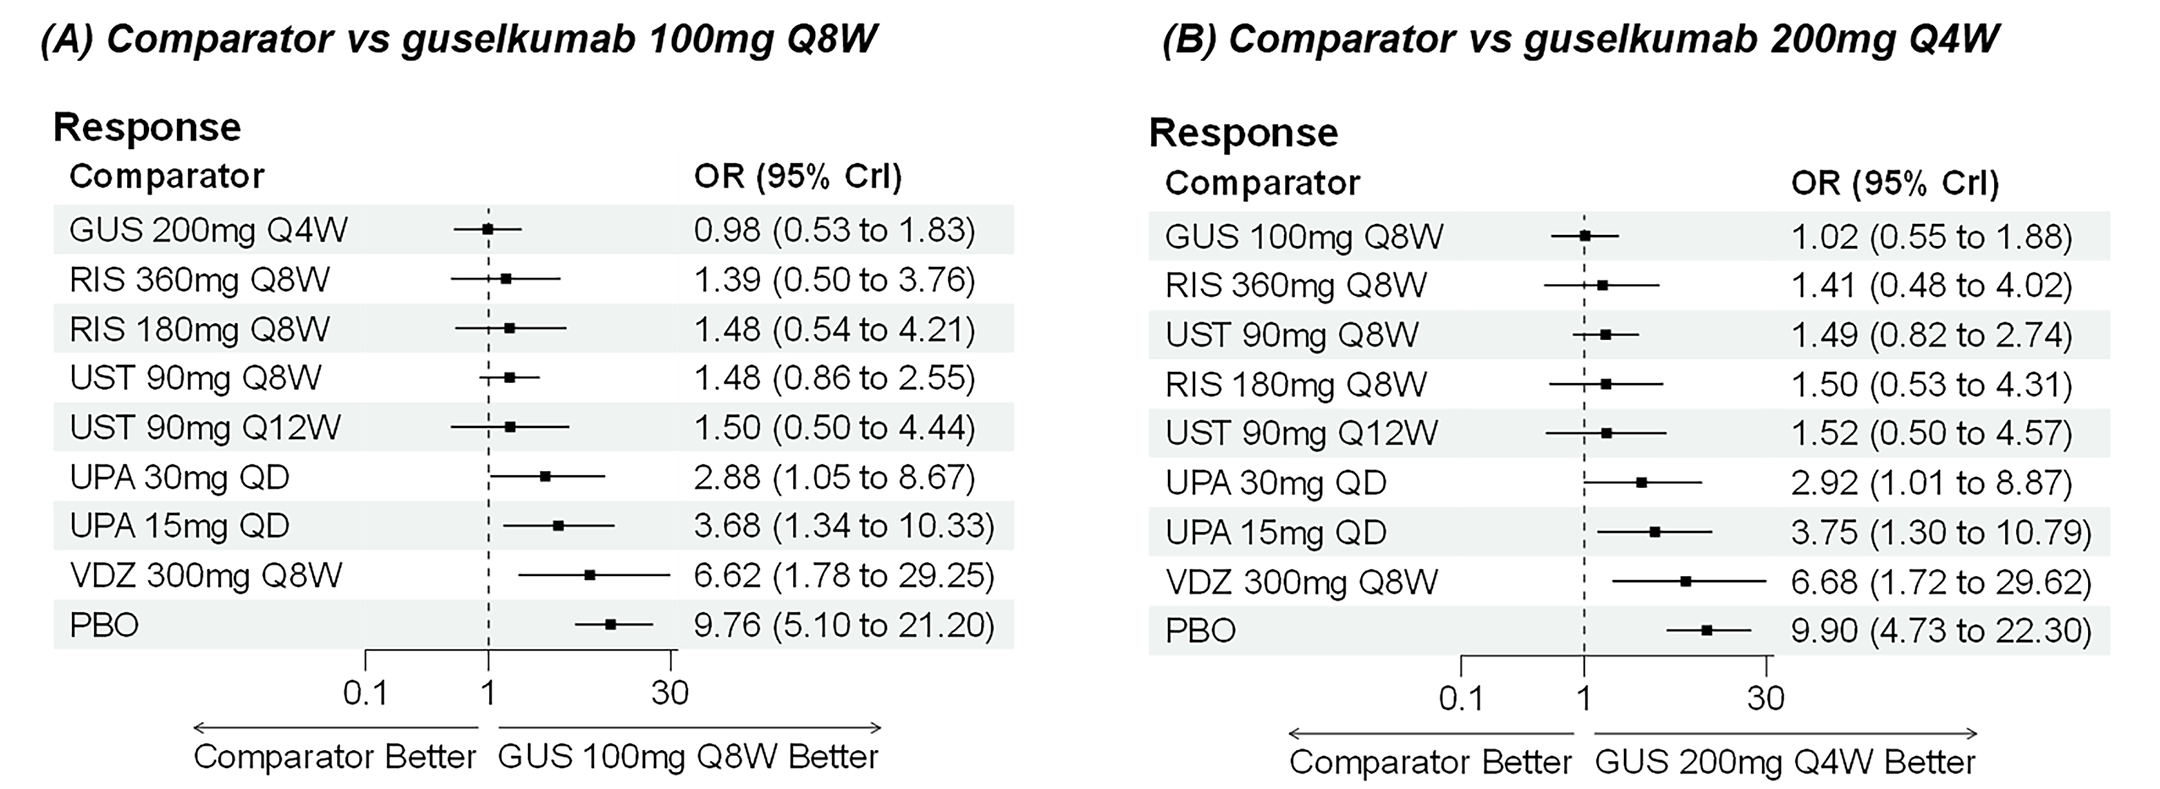
BIO-Failure = biologic therapy failure or intolerance; CrI = credible interval; GUS = guselkumab; NMA = network meta-analysis; OR = odds ratio; PBO = placebo; Q4W = every 4 weeks; Q8W = every 8 weeks; Q12W = every 12 weeks; QD = once daily; RIS = risankizumab; UPA = upadacitinib; UST = ustekinumab; VDZ = vedolizumab; vs = versus.
Source: Guselkumab systematic literature review and network meta-analysis report.46
Clinical Remission
CON-Failure Analysis Population (Including Those With Delayed Response)
A random-effects NMA was conducted for clinical remission in the maintenance phase, in a CON-Failure analysis population (including those with delayed response). Model fit statistics are provided in Table 56.
In comparison to both dosages of guselkumab, no treatments were significantly more efficacious on clinical remission (Figure 36). Infliximab (10 mg/kg and 5 mg/kg), upadacitinib (15 mg every day), and vedolizumab (300 mg every 8 weeks) were significantly less efficacious than both guselkumab dosages. Additionally, upadacitinib (30 mg every day) was significantly less efficacious than the high-dose guselkumab regimen. Placebo was significantly less efficacious than either dose of guselkumab on clinical remission.
Table 56: Model Fit Statistics Supporting Random-Effects NMAs for Clinical Remission — Maintenance Analysis, CON-Failure Analysis Population
Parameter | Random effect |
|---|---|
SD[1] | 0.3 (0.09 to 0.73) |
SD[2] | 0.21 (0.07 to 0.58) |
Total residual deviance (54 data points) | 52.59 |
DIC | 301.15 |
CON-Failure = conventional therapy failure or intolerance; DIC = deviance information criterion; NMA = network meta-analysis; SD = standard deviation.
Source: Guselkumab systematic literature review and network meta-analysis report.46
Figure 36: Forest Plots for Random-Effects NMA of Clinical Remission — Maintenance Analysis, CON-Failure Analysis Population (Including Those With Delayed Response)
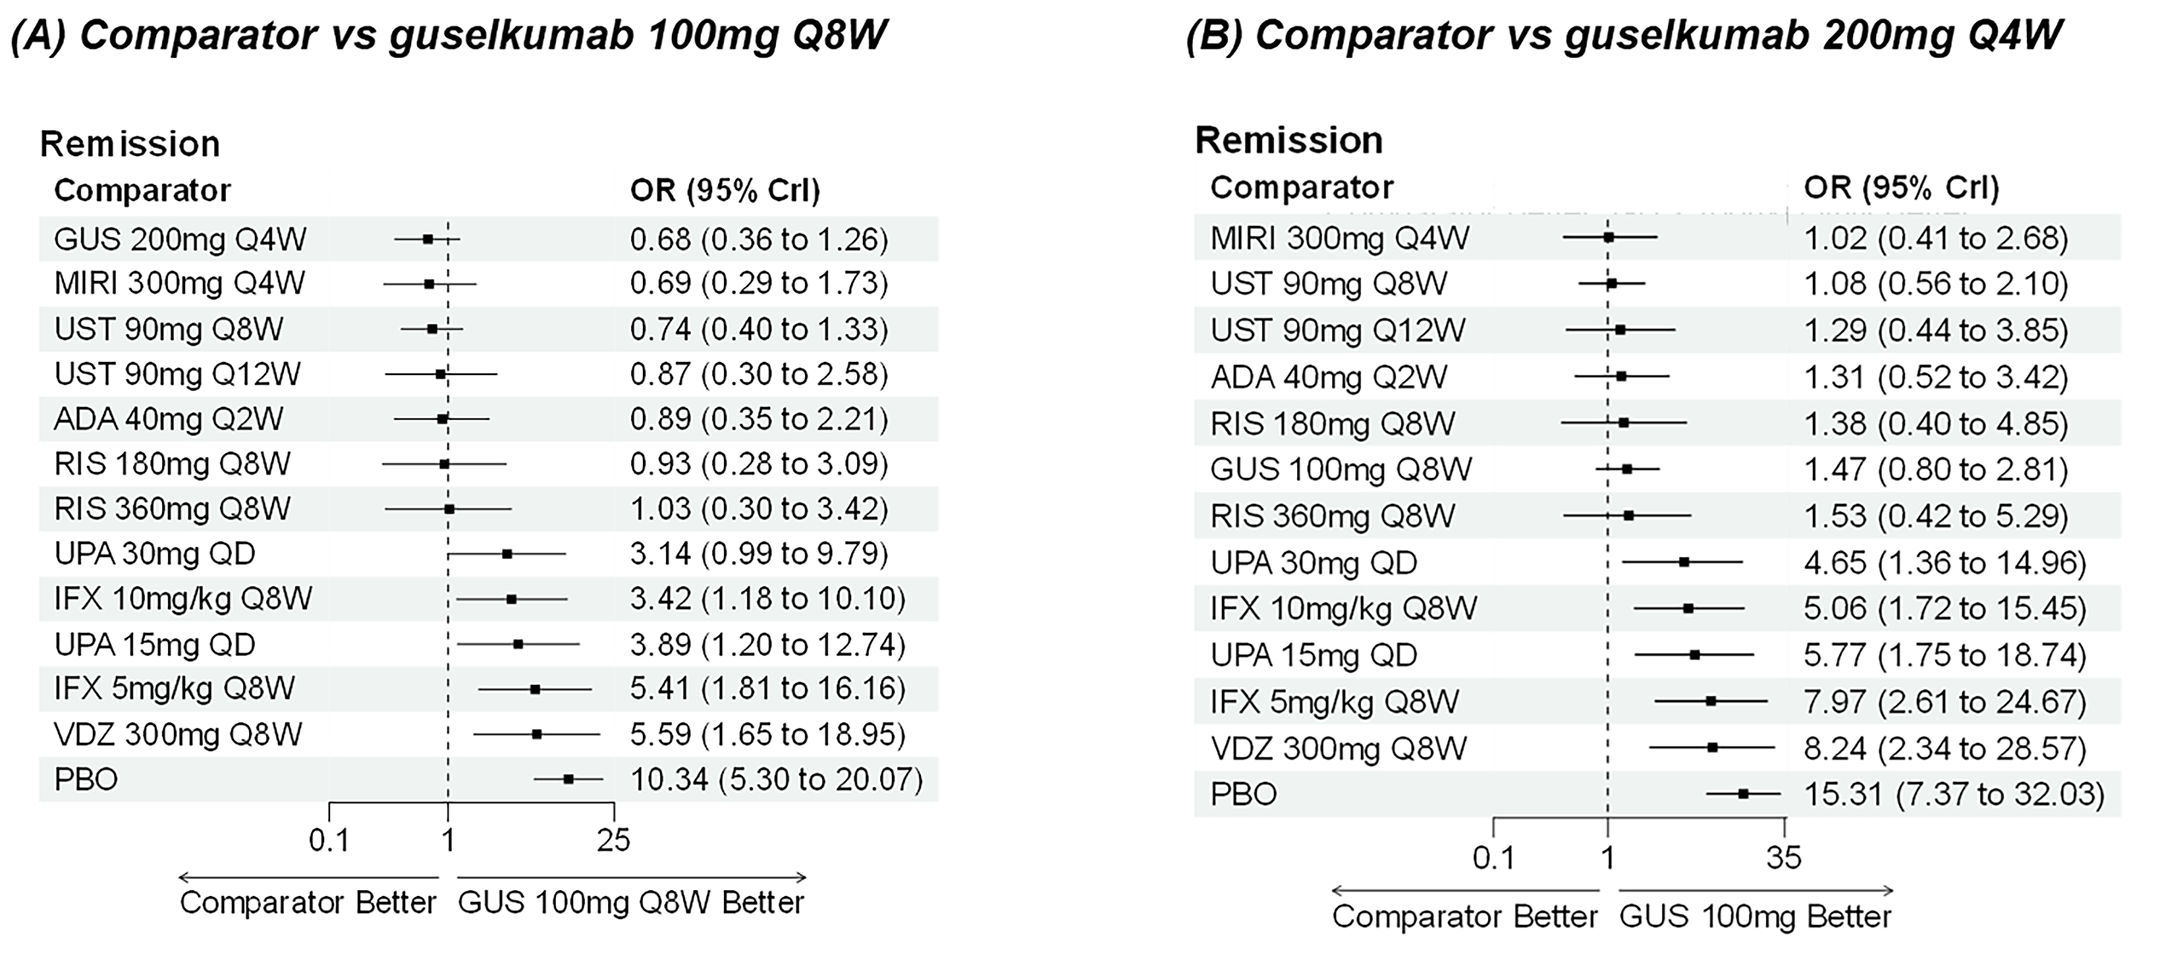
ADA = adalimumab; CON-Failure = conventional therapy failure or intolerance; Crl = credible interval; GUS = guselkumab; IFX = infliximab; MIRI = mirikizumab; NMA = network meta-analysis; OR = odds ratio; PBO = placebo; Q2W = every 2 weeks; Q4W = every 4 weeks; Q8W = every 8 weeks; Q12W = every 12 weeks; QD = once daily; RIS = risankizumab; UPA = upadacitinib; UST = ustekinumab; VDZ = vedolizumab; vs = versus.
Source: Guselkumab systematic literature review and network meta-analysis report.46
BIO-Failure Analysis Population (Including Those With Delayed Response)
A random-effects NMA was conducted for clinical remission in the maintenance phase, in a BIO-Failure analysis population (including those with delayed response). Model fit statistics are provided in Table 57.
In comparison to both dosages of guselkumab, no treatments were significantly more efficacious on clinical remission (Figure 37). Vedolizumab (300 mg every 8 weeks) was significantly less efficacious than both guselkumab dosages. Placebo was significantly less efficacious than either dosage of guselkumab on clinical remission.
Table 57: Model Fit Statistics Supporting Random-Effects NMAs for Clinical Remission — Maintenance Analysis, BIO-Failure Analysis Population
Parameter | Random effect |
|---|---|
SD[1] | 0.22 (0.07 to 0.6) |
SD[2] | 0.22 (0.07 to 0.55) |
Total residual deviance (44 data points) | 41.07 |
DIC | 247.08 |
BIO-Failure = biologic therapy failure or intolerance; DIC = deviance information criterion; NMA = network meta-analysis; RE = random effect; SD = standard deviation.
Source: Guselkumab systematic literature review and network meta-analysis report.46
Figure 37: Forest Plots for Random-Effects NMA of Clinical Remission — Maintenance Analysis, BIO-Failure Analysis Population (Including Those With Delayed Response)
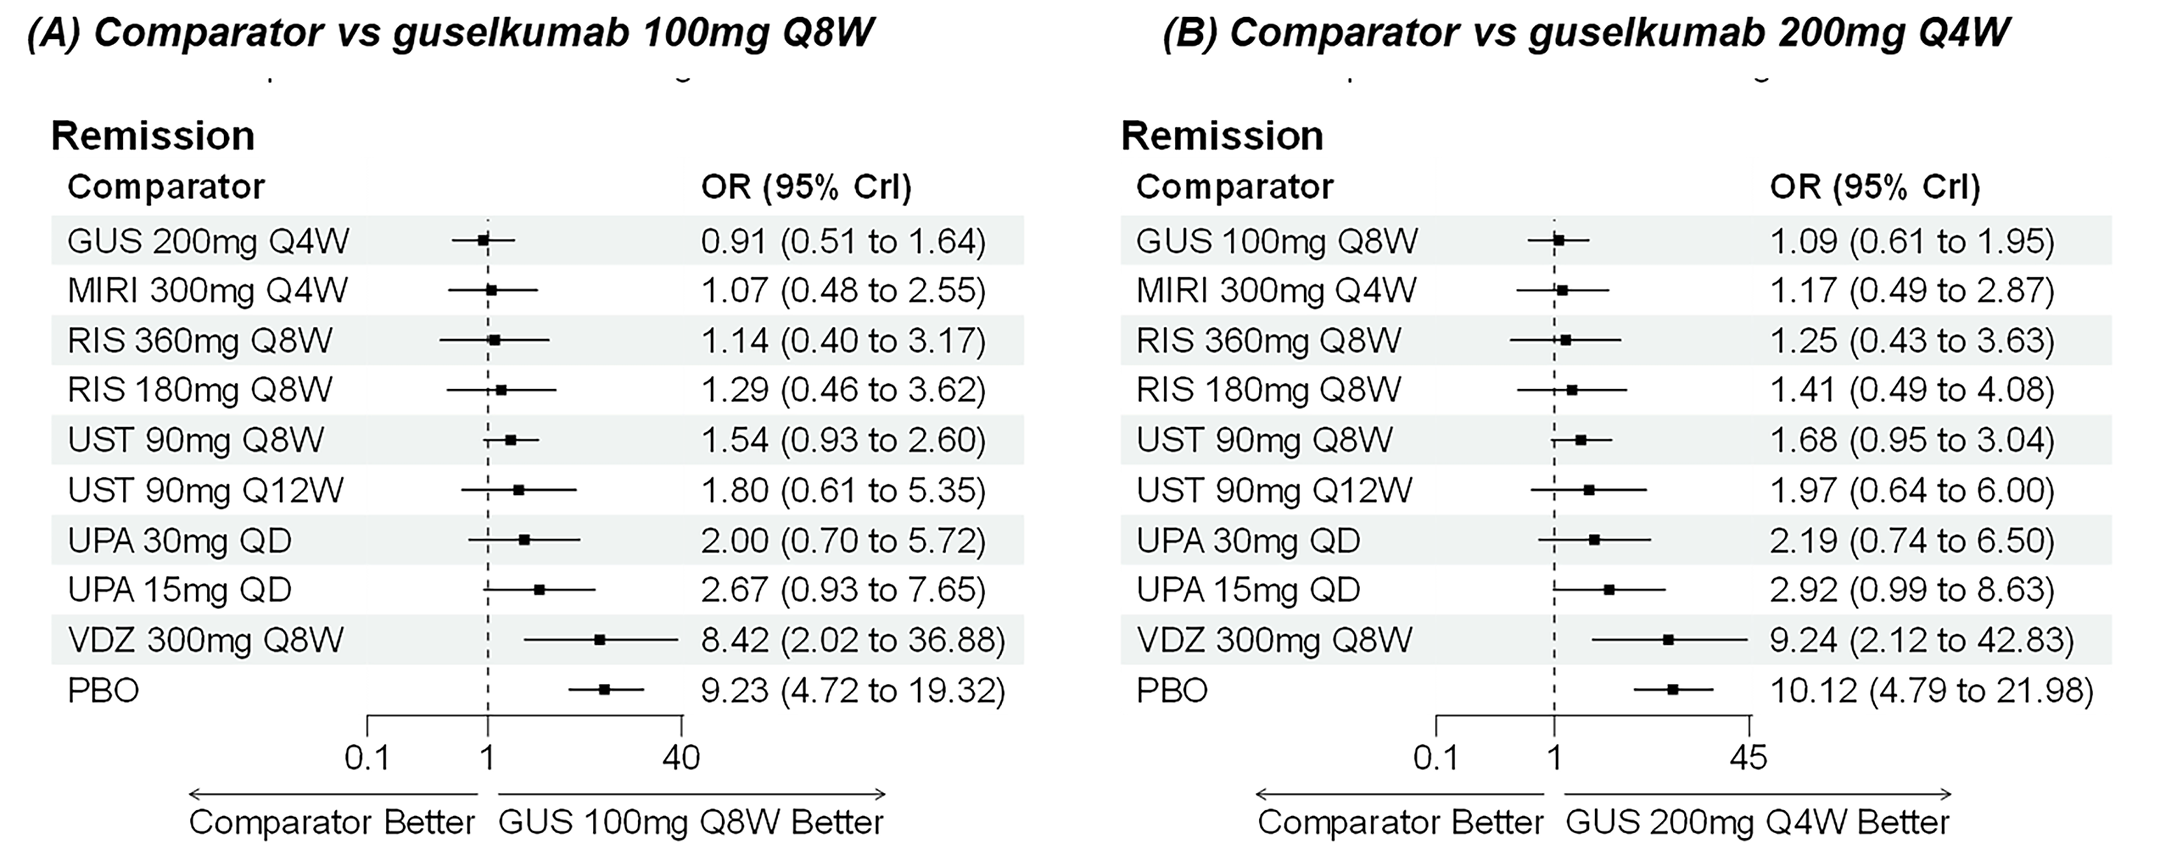
BIO-Failure = biologic therapy failure or intolerance; CrI = credible interval; GUS = guselkumab; MIRI = mirikizumab; NMA = network meta-analysis; OR = odds ratio; PBO = placebo; Q4W = every 4 weeks; Q8W = every 8 weeks; Q12W = every 12 weeks; QD = once daily; RIS = risankizumab; UPA = upadacitinib; UST = ustekinumab; VDZ = vedolizumab; vs = versus.
Sources: Guselkumab systematic literature review and network meta-analysis report.46
Endoscopy Response
CON-Failure Analysis Population (Including Those With Delayed Response)
A random-effects NMA was conducted for endoscopic response in the maintenance phase, in a CON-Failure analysis population (including those with delayed response). Model fit statistics are provided in Table 58.
In comparison to both dosages of guselkumab, no treatments were significantly more efficacious (Figure 38). Of note, upadacitinib (15 mg every day) and placebo were significantly less efficacious than both dosages of guselkumab. Versus the high-dose guselkumab regimen, upadacitinib (30 mg every day) was also significantly less efficacious.
Table 58: Model Fit Statistics Supporting Random-Effects NMAs for Endoscopic Response — Maintenance Analysis, CON-Failure Analysis Population
Parameter | Random effect |
|---|---|
SD | 0.23 (0.07 to 0.65) |
Total residual deviance (21 data points) | 18.41 |
DIC | 127.99 |
CON-Failure = conventional therapy failure or intolerance; DIC = deviance information criterion; NMA = network meta-analysis; SD = standard deviation.
Source: Guselkumab systematic literature review and network meta-analysis report.46
Figure 38: Forest Plots for Random-Effects NMA of Endoscopic Response — Maintenance Analysis, CON-Failure Analysis Population (Including Those With Delayed Response)
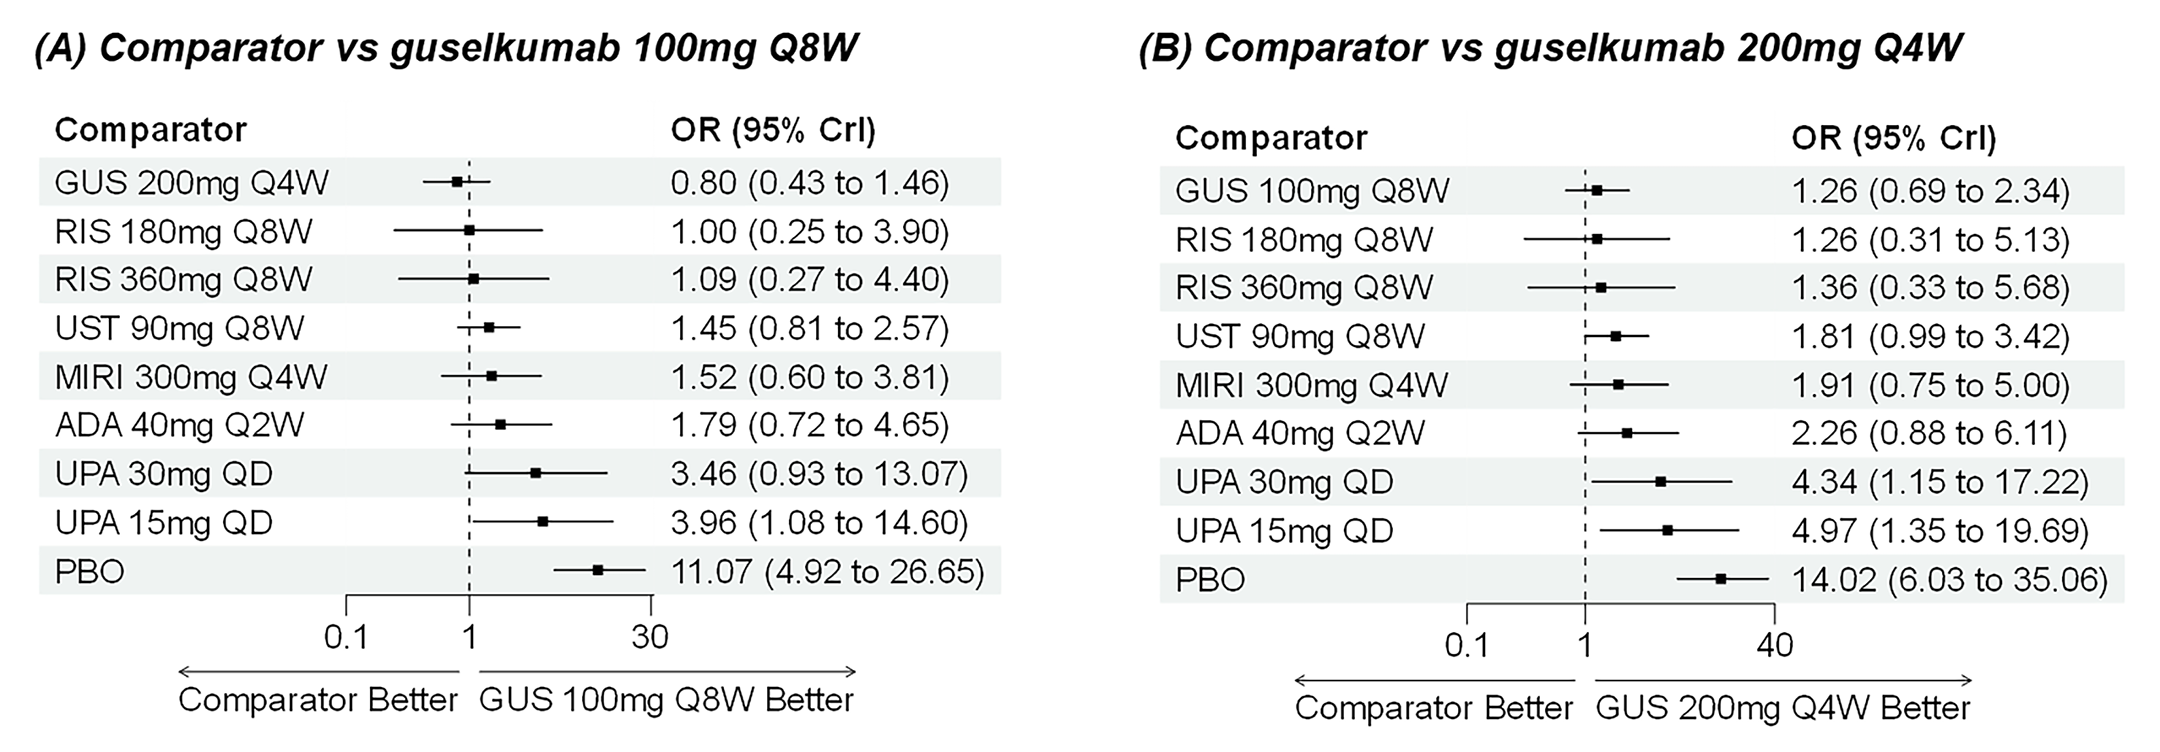
ADA = adalimumab; CrI = credible interval; CON-Failure = conventional therapy failure or intolerance; GUS = guselkumab; MIRI = mirikizumab; NMA = network meta-analysis; OR = odds ratio; PBO = placebo; Q2W = every 2 weeks; Q4W = every 4 weeks; Q8W = every 8 weeks; QD = once daily; RIS = risankizumab; UPA = upadacitinib; UST = ustekinumab; vs = versus.
Source: Guselkumab systematic literature review and network meta-analysis report.46
BIO-Failure Analysis Population (Including Those With Delayed Response)
A random-effects NMA was conducted for endoscopic response in the maintenance phase, in a BIO-Failure analysis population (including those with delayed response). Model fit statistics are provided in Table 59.
In comparison to both dosages of guselkumab, no treatments were significantly more efficacious (Figure 39). All comparators showed numerically worse efficacy compared with both guselkumab dosages. Of note, ustekinumab (90 mg every 8 weeks) and placebo were significantly less efficacious than guselkumab in both dosages.
Table 59: Model Fit Statistics Supporting Random-Effects NMAs for Endoscopic Response — Maintenance Analysis, BIO-Failure Analysis Population
Parameter | Random effect |
|---|---|
SD | 0.24 (0.07 to 0.71) |
Total residual deviance (19 data points) | 16.68 |
DIC | 116.66 |
BIO-Failure = biologic therapy failure or intolerance; DIC = deviance information criterion; NMA = network meta-analysis; SD = standard deviation.
Source: Guselkumab systematic literature review and network meta-analysis report.46
Figure 39: Forest Plots for Random-Effects NMA of Endoscopic Response — Maintenance Analysis, BIO-Failure Analysis Population (Including Those With Delayed Response)
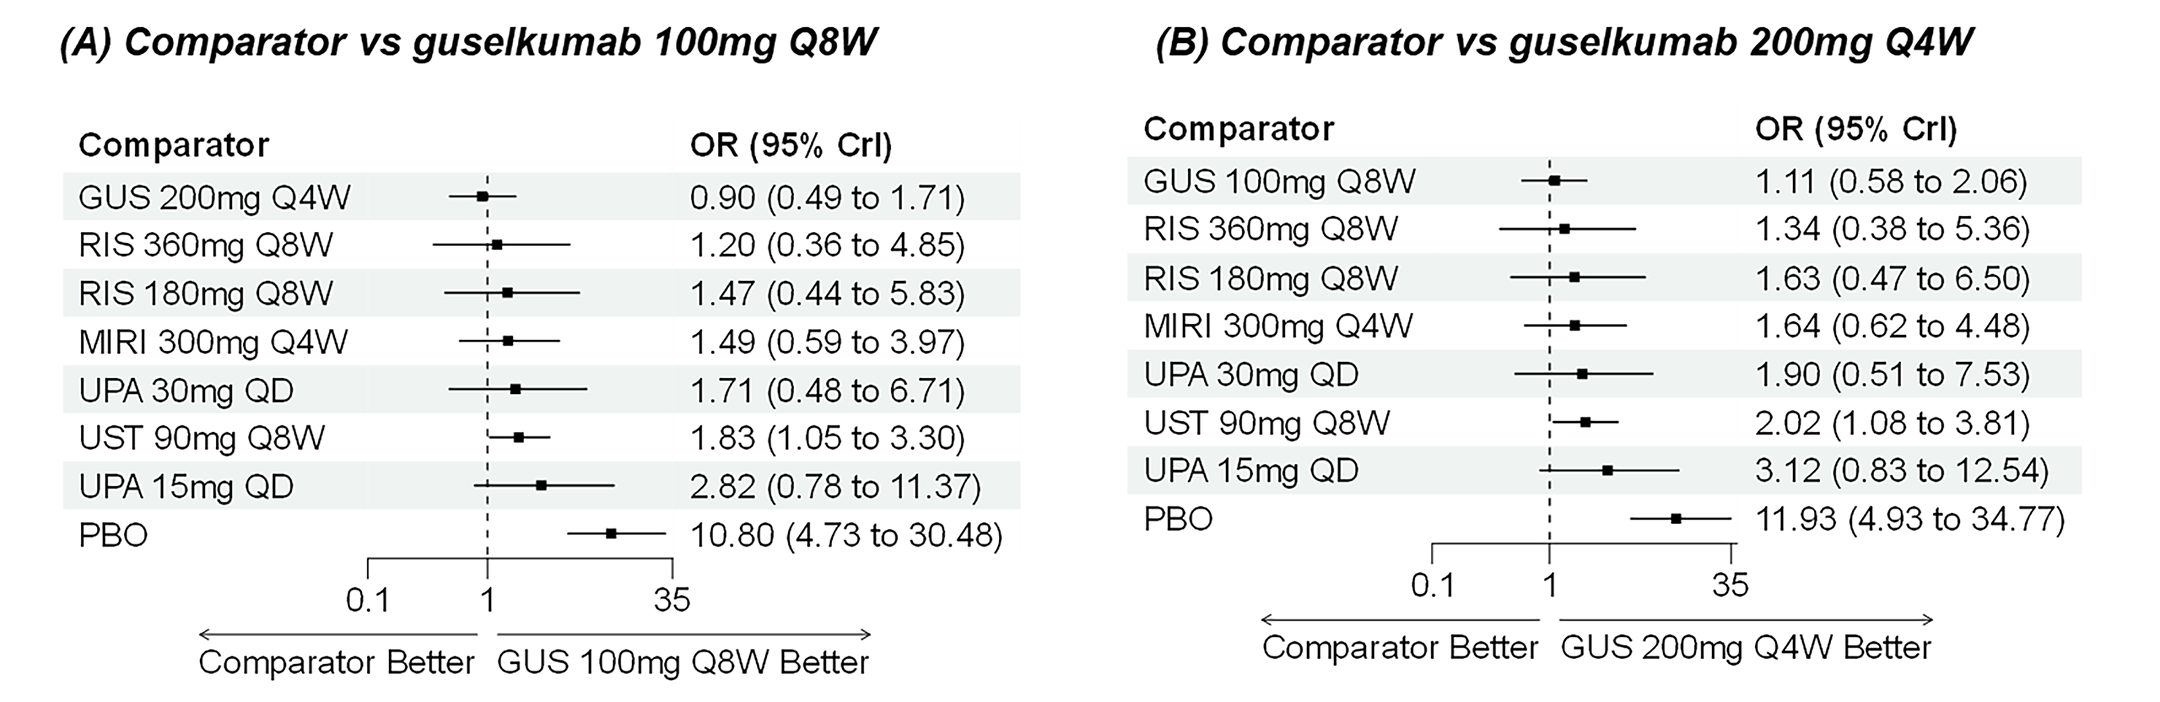
BIO-Failure = biologic therapy failure or intolerance; CrI = credible interval; GUS = guselkumab; MIRI = mirikizumab; NMA = network meta-analysis; OR = odds ratio; PBO = placebo; Q4W = every 4 weeks; Q8W = every 8 weeks; QD = once daily; RIS = risankizumab; UPA = upadacitinib; UST = ustekinumab; vs = versus.
Source: Guselkumab systematic literature review and network meta-analysis report.46
Joint Endoscopic Response and Clinical Remission
CON-Failure Analysis Population (Including Those With Delayed Response)
A random-effects NMA was conducted for the joint outcome of endoscopic response and clinical remission in the maintenance phase, in a CON-Failure analysis population (including those with delayed response). Model fit statistics are provided in Table 60.
In comparison to both dosages of guselkumab, no treatments were significantly more efficacious (Figure 40). Placebo was significantly less efficacious than either dosage of guselkumab on the joint outcome of endoscopic response and clinical remission.
BIO-Failure Analysis Population (Including Those With Delayed Response)
A random-effects NMA was conducted for the joint outcome of endoscopic response and clinical remission in the maintenance phase, in a CON-Failure analysis population (including those with delayed response). Model fit statistics are provided in Table 61.
In comparison to both dosages of guselkumab, no treatments were significantly more efficacious (Figure 41). Ustekinumab (90 mg every 8 weeks) and placebo were significantly less efficacious than either dosage of guselkumab on the joint outcome of endoscopic response and clinical remission.
Table 60: Model Fit Statistics Supporting Random-Effects NMAs for Joint Endoscopic Response and Clinical Remission — Maintenance Analysis, CON-Failure Analysis Population
Parameter | Random effect |
|---|---|
SD | 0.22 (0.06 to 0.63) |
Total residual deviance (13 data points) | 9.86 |
DIC | 73.16 |
CON-Failure = conventional therapy failure or intolerance; DIC = deviance information criterion; NMA = network meta-analysis; SD = standard deviation.
Source: Guselkumab systematic literature review and network meta-analysis report.46
Figure 40: Forest Plots for Random-Effects NMA of Joint Endoscopic Response and Clinical Remission — Maintenance Analysis, CON-Failure Analysis Population (Including Those With Delayed Response)
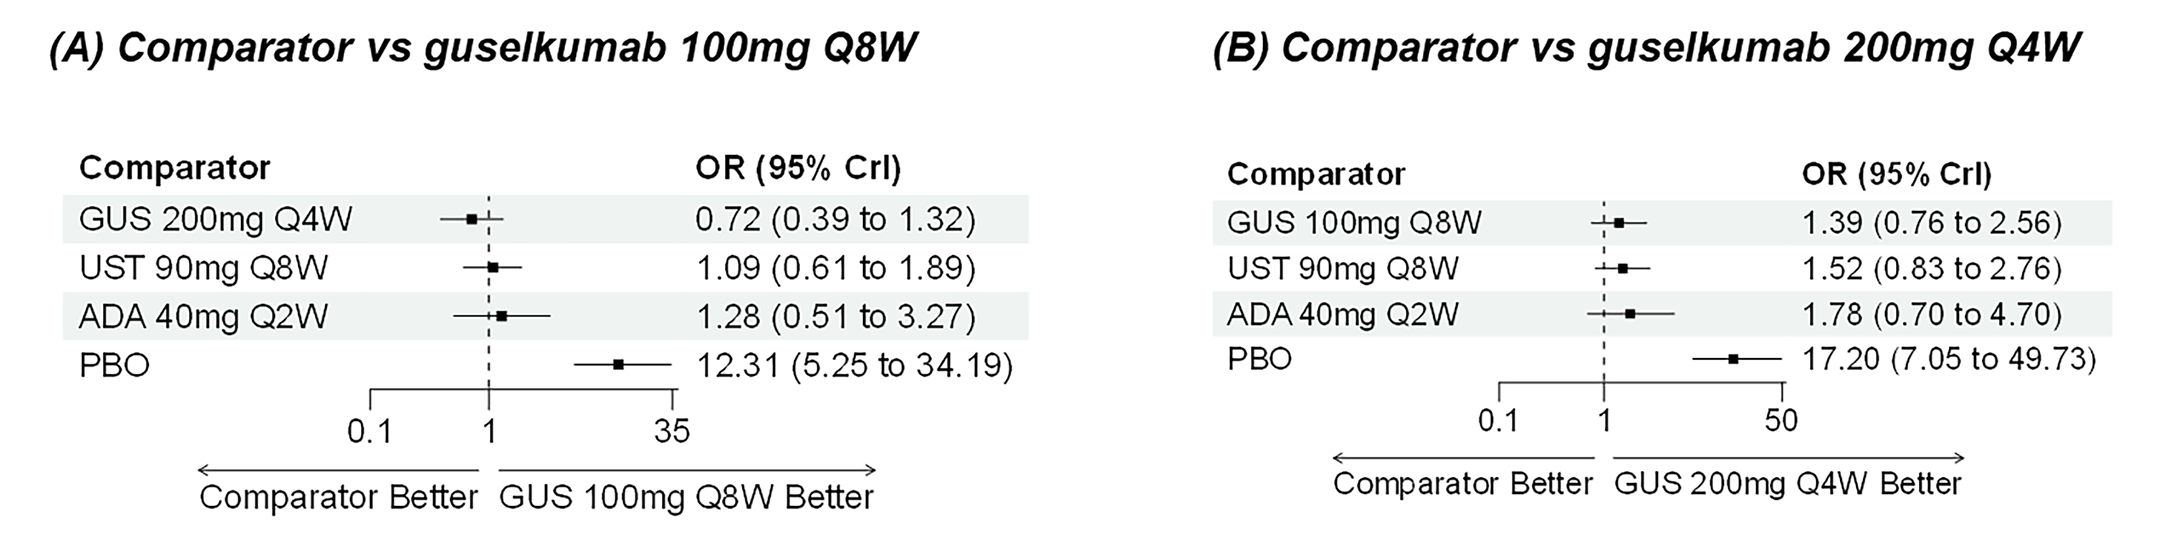
ADA = adalimumab; CON-Failure = conventional therapy failure or intolerance; Crl = credible interval; GUS = guselkumab; NMA = network meta-analysis; OR = odds ratio; PBO = placebo; Q2W = every 2 weeks; Q4W = every 4 weeks; Q8W = every 8 weeks; UST = ustekinumab; vs = versus.
Source: Guselkumab systematic literature review and network meta-analysis report.46
Table 61: Model Fit Statistics Supporting Random-Effects NMAs for Joint Endoscopic Response and Clinical Remission — Maintenance Analysis, BIO-Failure Analysis Population
Parameter | Random effect |
|---|---|
SD | 0.35 (0.09 to 0.97) |
Total residual deviance (11 data points) | 12.43 |
DIC | 60.79 |
BIO-Failure = biologic therapy failure or intolerance; DIC = deviance information criterion; NMA = network meta-analysis; SD = standard deviation.
Source: Guselkumab systematic literature review and network meta-analysis report.46
Figure 41: Forest Plots for Random-Effects NMA of Joint Endoscopic Response and Clinical Remission — Maintenance Analysis, BIO-Failure Analysis Population (Including Those With Delayed Response)
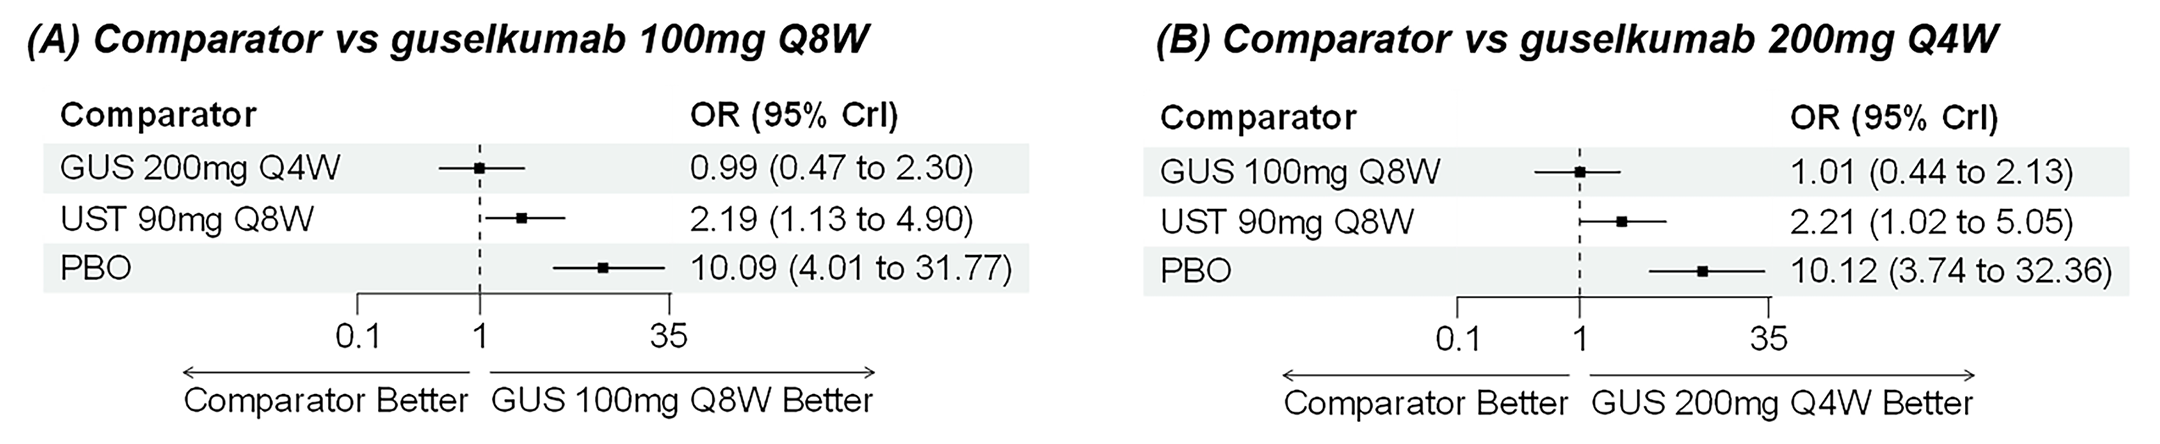
BIO-Failure = biologic therapy failure or intolerance; CrI = credible interval; GUS = guselkumab; NMA = network meta-analysis; OR = odds ratio; PBO = placebo; Q4W = every 4 weeks; Q8W = every 8 weeks; UST = ustekinumab; vs = versus.
Source: Guselkumab systematic literature review and network meta-analysis report.46
Harms
No harms were evaluated in the indirect comparison.
Critical Appraisal of ITC
The sponsor-submitted ITC employed an SLR and NMA to evaluate the comparative efficacy of guselkumab versus relevant comparators for the treatment of moderately to severely active CD.
The SLR was conducted with predefined protocols and appropriate database searches. The SLR search, performed in July 2023, may not have captured the most recent evidence. A significant limitation impacting the completeness and applicability of the NMA is the exclusion of the GRAVITI trial. This trial evaluated the SC induction regimen for guselkumab, which is part of the Health Canada–approved indication, but it was not included in the quantitative synthesis. No justification for this exclusion was provided in the report. This omission, possibly related to the SLR search cut-off date (July 2023) creates a critical evidence gap because no comparative efficacy or safety data for the SC induction route are presented in the NMA. Furthermore, the restriction to double-blind trials, while potentially enhancing internal validity, may have unnecessarily excluded relevant open-label comparative evidence. Additionally, data extraction and risk-of-bias assessment were conducted by a single reviewer and validated by a second reviewer, introducing potential for human error and extraction bias compared to independent dual review methodologies. Risk of bias was assessed at the level of the study, which ignores that risk of bias can vary by effect estimate. Nevertheless, a risk of bias was reported across several studies related to the randomization process, patient attrition, and the use of potentially inappropriate analysis populations. No sensitivity analyses were done to understand the impact of these studies on the results. An assessment of the risk of publication bias was planned but could not be undertaken because there were too few studies in the analyses.
The NMA incorporated Bayesian random-effects models with a multinomial regression approach for ordered categorical data, analyzing clinical remission and response outcomes. Although appropriate model specifications were implemented, the justification for informative priors remains inadequately explicated, raising questions about the potential bias introduced in parameter estimation. The baseline risk adjustment for heterogeneity in placebo response was appropriately applied in the induction analysis; however, the sponsor noted that this adjustment was not feasible to extend to maintenance analyses, where between-trial heterogeneity was potentially greater due to variations in study design.
Considerable heterogeneity was observed across included trials in multiple domains: substantial methodological heterogeneity existed in trial designs, particularly in maintenance phase studies, with diverse enrichment strategies and rerandomization approaches that complicate outcome comparability. Various steps were taken to mitigate the high level of heterogeneity in the evidence base, including the normalization of trial designs, baseline risk adjustment where feasible, and restriction to subgroups defined by a prior inadequate response to treatment. Despite this, some limitations remain (described herein). The sponsor’s normalization of different trial designs to mimic a treat-through target design allowed for comparative estimation as if the studies were all of a similar design. This approach is consistent with prior ITCs in this disease space that employ complex methodology, particularly through trial-specific imputations.51,52 However, this approach introduces additional methodological complexity, depends on an extensive set of assumptions that cannot be tested, and causes interpretation challenges. Variations in patient populations, particularly regarding baseline disease characteristics, prior treatment exposure, the use of concomitant treatments, and disease location were present across studies. While baseline CDAI scores showed relative consistency, other important markers of disease severity (CRP, fecal calprotectin) were inconsistently reported, limiting the assessment of population comparability. Though most trials employed consistent definitions for clinical remission (a CDAI score < 150) and response (≥ 100-point reduction from baseline in the CDAI score or a CDAI score < 150), several trials used alternative definitions that potentially51,52 affect outcome comparability. The numerous sources of heterogeneity compromise the underlying transitivity assumption that must be met to produce valid conclusions from the NMA.
Notably, the analytical approach restructured the response outcome as “response without remission,” which fundamentally alters its clinical interpretation. Although the sponsor conducted standard statistical tests for inconsistency (e.g., node-splitting, design-by-treatment interactions) and reported finding no significant issues, the ability to meaningfully assess consistency was likely limited by the structure of the evidence network. Key closed loops required for these tests (e.g., involving guselkumab, ustekinumab, and placebo) often relied heavily on comparisons derived from the same multiarm trials (primarily the GALAXI studies). When direct and indirect evidence arise largely from the same trials, standard inconsistency tests have reduced power to detect potential discrepancies that might exist if synthesizing evidence from independent sources reflecting different populations or conditions. Therefore, the absence of statistically detected inconsistency in this NMA may not fully confirm the robustness of the consistency assumption across the broader evidence base. Finally, substantial variations in assessment time points were observed, particularly in maintenance studies where end points ranged from 22 weeks to 64 weeks. This, in addition to subjective decisions about the use of multiple available time points in the maintenance phase, introduces potential bias when synthesizing outcomes measured at different treatment stages.
The stratification of analyses by populations with a history of CON-Failure and/or BIO-Failure represents a methodologically sound approach to reduce heterogeneity. However, this stratification limits the generalizability of the results of either analysis to the overall indicated population, particularly in the Canadian treatment context. Furthermore, the interpretation of the stratified NMA results for CON-Failure and BIO-Failure analysis populations faces additional limitations. First, while the sponsor noted variation in prior treatment failure criteria, the technical report lacks specifics on how these definitions varied across trials, particularly regarding the number or type of failed biologics — criteria that is likely to have evolved over the time period covered by the included studies. Second, the report does not confirm whether randomization was consistently stratified by failure status across all trials contributing to these subgroup analyses. The methods used to convert mixed population data to subgroup data suggest that stratification or prespecified subgroup reporting was not universal. This lack of confirmed stratification raises concerns about potential confounding and the validity of the subgroup comparisons because they may not represent fully randomized contrasts across all synthesized evidence.
The NMA demonstrated consistent superiority of guselkumab over placebo across outcomes, populations, and time points. Comparative efficacy versus active treatments showed more variability:
In induction analyses, guselkumab did not show differences that excluded the null when compared to most other biologics, with potential superiority versus ustekinumab and adalimumab in the BIO-Failure subpopulation, and versus vedolizumab in both the BIO-Failure and CON-Failure subpopulations in achieving clinical response and potential superiority versus ustekinumab and vedolizumab in the BIO-Failure population in achieving clinical remission. The baseline risk adjustment strengthens the credibility of these findings, though wide credible intervals suggest imprecision in effect estimates.
In maintenance analyses, treatment effect estimates demonstrated greater variability, with inconsistencies in analyses between those with delayed response and those with nondelayed response. Particularly, guselkumab showed potential superiority versus upadacitinib and vedolizumab in clinical response for CON-Failure populations, but these findings were not consistently replicated across all outcome metrics. The credibility of the findings are limited due to an inability to apply a baseline risk adjustment at this time point and substantial clinical and methodological heterogeneity. Approaches to normalize trial designs relied on extensive assumptions.
For endoscopic response and joint endoscopic response and clinical remission, networks were more limited, with fewer comparative data points, resulting in wider credible intervals and greater uncertainty in relative efficacy estimates. The absence of safety outcomes in the ITC represents a limitation, precluding comprehensive benefit-risk assessment in a comparative context. The ITC also did not include any assessment of comparative effects on additional outcomes that are important to patients: corticosteroid-free remission and HRQoL.
The interpretation of the results further faces additional limitations:
The multinomial regression model for ordered categorical data restructures the definition of response as “response without remission,” fundamentally altering its clinical interpretation. This redefines a positive clinical outcome (response) conditionally upon the absence of a superior outcome (remission), which challenges meaningful clinical interpretation.
The star-shaped network configuration, with most comparisons informed by single studies linked through placebo, limits the robustness of indirect comparisons.
The data normalization approach for maintenance studies attempts to account for differential trial designs but introduces additional methodological complexity and assumptions that are not fully validated. This approach is consistent with prior ITCs in this disease space that employ complex methodology, particularly through trial-specific imputations.51,52
The inclusion of non–Canadian-relevant comparators in the analysis network may influence treatment effect estimates through indirect pathways, affecting generalizability to the Canadian treatment context.
Multiple sources of clinical and methodological heterogeneity that could not fully be accounted for and wide credible intervals across many comparisons reflect substantial uncertainty in effect estimation, limiting definitive conclusions about comparative efficacy beyond placebo superiority.
There is an inability to comment on the comparative efficacy of SC induction because the GRAVITI trial was not included in the NMA.
Studies Addressing Gaps in the Systematic Review Evidence
Content in this section has been informed by materials submitted by the sponsor. The following has been summarized and validated by the review team.
Table 62: Summary of Gaps in the Systematic Review Evidence
Evidence gap | Study that addresses gap | |
|---|---|---|
Study description | Summary of key results | |
Long-term safety and efficacy of clinical and endoscopic outcomes in patients with moderately to severely active CD treated with guselkumab and ustekinumab through week 152 | GALAXI 1 study: A phase II, randomized, double-blind, placebo- and active-controlled, parallel-group, multicentre, dose response study to evaluate the long-term safety and efficacy of clinical and endoscopic outcomes in patients with moderately to severely active CD, treated with guselkumab, through week 152 | Guselkumab showed durable efficacy over time through week 144 in the overall long-term population and was well tolerated in patients with moderately to severely active CD through week 152 with no evidence of new concerns of harms. |
Impact of endoscopic response on long-term clinical outcomes | Neff-Baro et al. (2024):54 A post hoc analysis of pooled data from 2 randomized RCTs (GALAXI 1 study [NCT03466411] and IM-UNITI study [NCT01369355]) to evaluate the association between endoscopic outcomes and long-term clinical outcomes | — |
CD = Crohn disease; RCT = randomized controlled trial.
Source: Week 152 Clinical Study Report for GALAXI 1 study.27
GALAXI 1 Study
The GALAXI 1 study is a randomized, double-blind, placebo- and active-controlled, parallel-group, multicentre, dose response study evaluating the safety and efficacy of guselkumab in patients with moderately to severely active CD whose disease demonstrated an inadequate response or intolerance to previous conventional therapy (i.e., oral corticosteroids), immunomodulators (i.e., 6-mercaptopurine, azathioprine, methotrexate), or biologic therapy (i.e., TNF antagonists and vedolizumab). Details of the study are presented in Table 63.
Table 63: Details of GALAXI 1 Study Addressing Gaps in the Systematic Review Evidence
Detail | GALAXI 1 LTE study |
|---|---|
Designs and populations | |
Study design | Phase II, randomized, double-blind, placebo- and active-controlled, parallel-group, dose response trial with LTE |
Enrolled, N | In total, 220 (guselkumab) patients and 71 (ustekinumab) patients were randomized; 151 (guselkumab) patients and 48 (ustekinumab) patients entered the LTE. |
Key inclusion criteria | Adults (≥ 18 years) with moderately to severely active Crohn disease of ≥ 3 months’ duration; inadequate response or intolerance to conventional or biologic therapies |
Key exclusion criteria |
|
Drugs | |
Intervention | Guselkumab: 100 mg SC q.8.w. or 200 mg SC q.4.w. from week 48 to week 236 |
Comparator(s) | Ustekinumab: 90 mg SC q.8.w. |
Outcomes | |
Primary end point | CDAI clinical remission at week 144 (CDAI score < 150) |
Secondary end points | PRO-2 remission, endoscopic response, and endoscopic remission |
Exploratory end points | AE, SAE, serious infections, and discontinuation rates |
Notes | |
Publications | Week 152 CSR for GALAXI 1 study |
Anti-TNF = anti–tumour necrosis factor; AE = adverse event; CDAI = Crohn’s Disease Activity Index; CSR = Clinical Study Report; IL-12 = interleukin-12; IL-23 = interleukin-23; LTE = long-term extension; PRO-2 = patient-reported outcome 2; q.4.w. = every 4 weeks; q.8.w. = every 8 weeks; SAE = serious adverse event.
Note: All end points after week 12 are exploratory. Not powered for direct comparison between guselkumab and ustekinumab.
Source: Week 152 Clinical Study Report for GALAXI 1 study.27
Populations
Eligible patients had to be aged at least 18 years at the time of informed consent and diagnosed with moderately to severely active CD (of at least 3 months’ duration). A broad patient population eligible for systemic therapy was evaluated and included patients with a prior inadequate response or intolerance to previous conventional therapy (CON-Failure) or biologic therapy (BIO-Failure). Those in the CON-Failure population could not have prior exposure to biologic therapy (e.g., TNF antagonist, vedolizumab, ustekinumab) or could have been previously exposed to biologics but their disease could not have demonstrated inadequate response or intolerance to biologics.
At week 48, patients who in the opinion of the investigator continued to benefit from treatment (i.e., based on week 48 clinical and endoscopic evaluations) were eligible to enter the LTE to receive approximately 2 to 4 additional years of treatment, during which time the longer-term efficacy and safety of guselkumab were evaluated. The FES visit of the LTE occurred at approximately week 248 or week 252 (i.e., approximately 16 weeks after their last study intervention administration at week 232 [for dosing of every 8 weeks] or week 236 [for dosing of every 4 weeks]). Patients who were not eligible or chose not to enter the LTE at week 48 returned for a FES visit 16 weeks after their last study intervention administration.
Interventions
During the LTE phase, patients continued to receive the same treatment regimen (i.e., 200 mg SC guselkumab every 4 weeks, 100 mg SC guselkumab every 8 weeks, or 90 mg SC ustekinumab every 8 weeks) that they received at the end of the GALAXI 1 study. The first study intervention administration in the LTE phase occurred at week 48 and the last study intervention administration occurred at week 232 or week 236. Treatment adjustment for inadequate response was permitted between week 52 and week 80 of the LTE phase. Study intervention administration in the LTE was continued in a blinded fashion until study unblinding to the investigative sites, which occurred after the week 48 database lock and once the week 48 analyses were completed for the phase II study. Patients who were on placebo were discontinued from study intervention upon study unblinding and had an FES visit at that time. Patients from all treatment groups who met inadequate response criteria between week 52 (i.e., the first visit at which treatment adjustment was permitted) and week 80 (i.e., the last visit at which treatment adjustment was permitted) were eligible for treatment adjustment (i.e., the first-time inadequate response criteria were met). Inadequate response was defined as not being in clinical response and having a CDAI score of at least 220 points. Clinical response was defined as a reduction from baseline (i.e., week 0) in the CDAI score of 100 points or more or being in clinical remission (a CDAI score < 150). Patients who received placebo, ustekinumab, or the lower SC maintenance dose of guselkumab were eligible to receive a blinded treatment adjustment to the highest guselkumab SC maintenance dose as defined in the phase II study (200 mg SC every 4 weeks). Patients who were already receiving the highest guselkumab SC maintenance dose received a blinded sham treatment adjustment. Patients could only qualify for treatment adjustment once and patients who received treatment adjustments remained on their new treatment regimen for the remainder of the LTE.
Outcomes
Clinical outcomes assessed in the LTE phase included clinical remission, PRO-2 remission, endoscopic response, and endoscopic remission. These are described in more detail in Table 64.
The study was not powered to detect differences between guselkumab and ustekinumab, and all end points beyond week 12 were considered exploratory.
Table 64: Summary of Clinical End Points
End point | Definition | Time point |
|---|---|---|
Clinical remission | CDAI score < 150 | Week 144 |
PRO-2 remission | AP mean daily score ≤ 1 and SF mean daily score ≤ 3, and no worsening of AP or SF from baseline | Week 144 |
Endoscopic response | At least a 50% improvement from baseline in SES-CD score or an SES-CD score ≤ 2 | Week 144 |
Endoscopic remission | SES-CD score ≤ 4 with at least a 2-point reduction from baseline and no subscore > 1 in any component | Week 144 |
AP = abdominal pain; CDAI = Crohn’s Disease Activity Index; PRO-2 = patient-reported outcome 2; SES-CD = Simple Endoscopic Score for Crohn’s Disease; SF = stool frequency.
Source: Week 152 Clinical Study Report for the GALAXI 1 study.27
Statistical Analysis
Efficacy in the GALAXI 1 LTE study was assessed through week 144 and safety through week 152 using several predefined analysis sets.
The first set included all randomized patients (referred to as the NRI cohort), which included all patients who received at least 1 dose of study medication from week 0, regardless of whether they entered the LTE. In this analysis, patients who discontinued or did not enter the LTE were considered as nonresponse. ICEs, such as treatment discontinuation or dose adjustments, also led to classification as nonresponse, except for changes in concomitant medications after week 48, which were not considered ICEs. Binary end points used NRI for missing data while continuous outcomes with missing data were not imputed.
The second analysis set, the LTE (NRI) cohort, included only those who had received at least 1 dose during the LTE period, applying similar rules for ICEs and missing data. This cohort was evaluated for efficacy through week 144; additional ICEs such as CD-related surgeries and discontinuation due to AEs were also considered.
The third set, the LTE (observed) cohort, included patients with available data who remained on treatment, excluding those who had received dose adjustments. This analysis set reported observed rates without applying treatment failure rules or imputing missing data.
Finally, the safety analysis included all patients randomized to receive guselkumab or ustekinumab who had received at least 1 dose of the study drug; data were assessed up to dose adjustment or week 152.
No formal inferential analyses were performed for any outcome.
Results
Patient Disposition
Patient flow in the GALAXI 1 study’s LTE is described in Figure 42. Patients in the guselkumab 200 mg SC every 4 weeks and guselkumab 100 mg SC every 8 weeks treatment groups were combined and analyzed as 1 cohort (N = 151; combined guselkumab group). Patients randomized to ustekinumab during the induction phase (i.e., week 0) were also examined in the LTE as the ustekinumab reference group.
Figure 42: Study Design and Patient Flow of GALAXI 1 LTE Trial
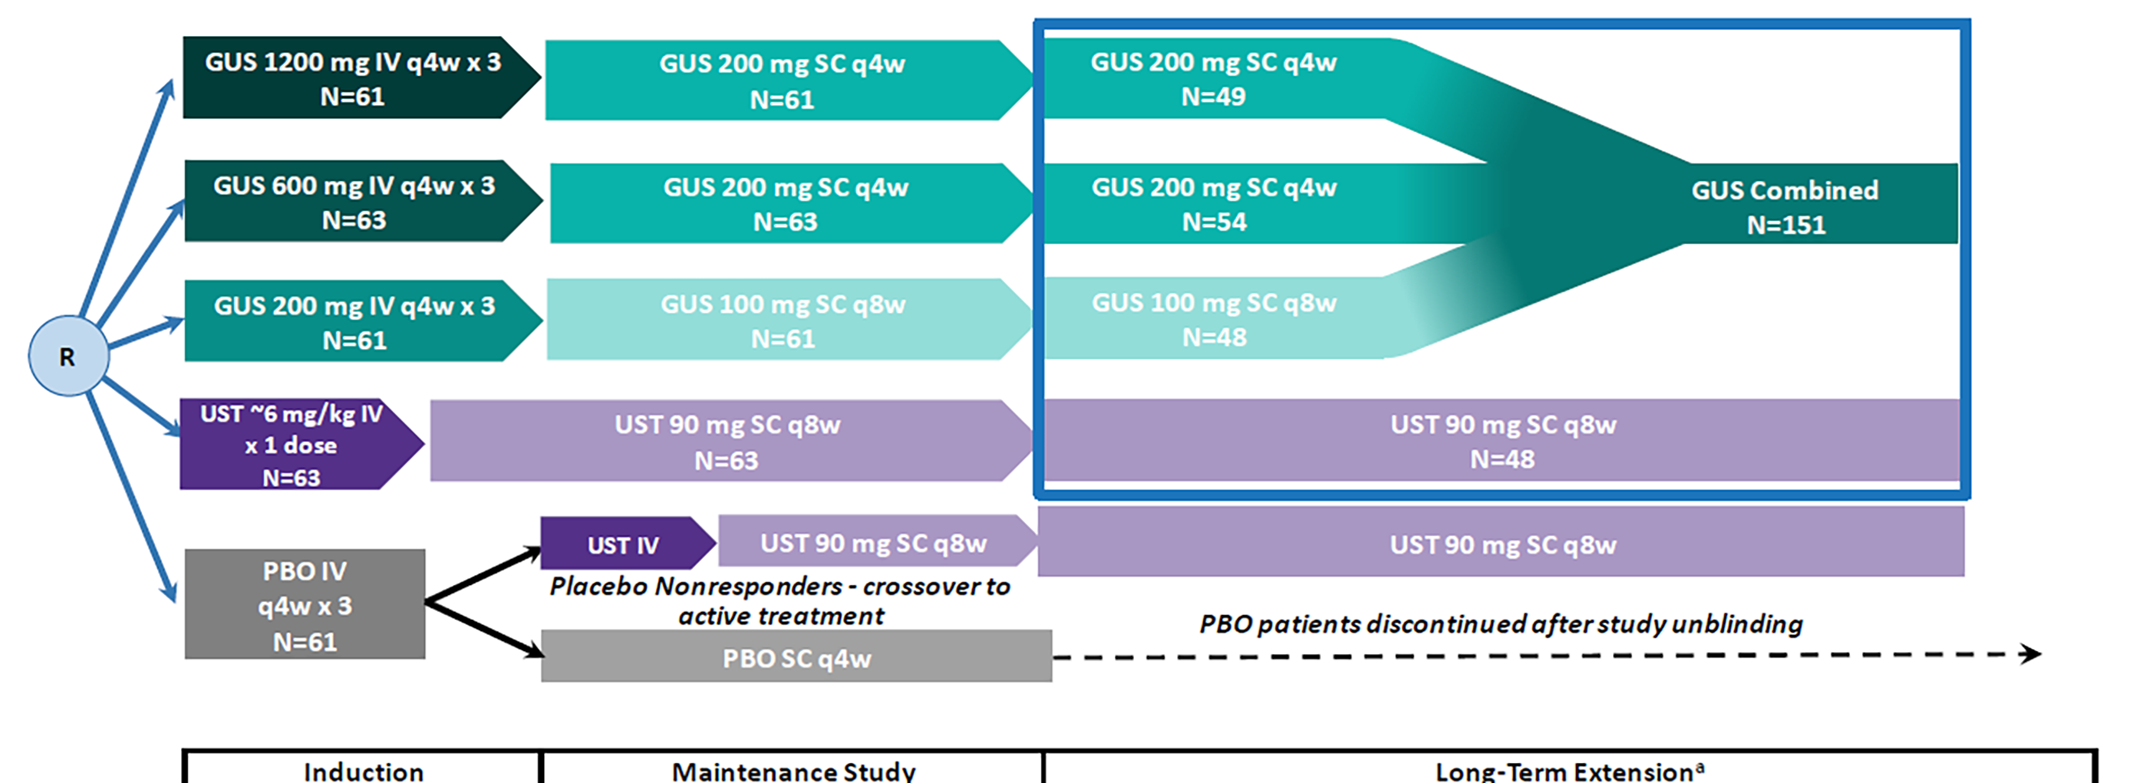
CDAI = Crohn’s Disease Activity Index; GUS = guselkumab; LTE = long-term extension; PBO = placebo; q4w = every 4 weeks; q8w = every 8 weeks; R = randomization; SC = subcutaneous; UST = ustekinumab.
a From week 52 through week 80, patients with an inadequate treatment response (not in clinical response [≥ 100-point reduction in CDAI score from baseline or CDAI score < 150 and CDAI score ≥ 220) were eligible for a 1-time treatment adjustment to SC guselkumab 200 mg q4w.
Sources: Week 152 Clinical Study Report for the GALAXI 1 study27 and Afzali et al.53
Baseline Characteristics
A summary of baseline characteristics from patients who entered the GALAXI 1 study’s LTE phase are presented in Table 65.
The number of patients who discontinued study treatment from week 48 to week 152 is described in Table 66.
Table 65: Summary of Demographics and Baseline Characteristics of Patients Who Were Treated in the GALAXI 1 Study’s LTE
Characteristic | Combined GUSa (N = 151) | USTb (N = 48) |
|---|---|---|
Age (years), mean (SD) | 39.1 (13.77) | 34.9 (12.25) |
Male, n (%) | 92 (60.9) | 32 (66.7) |
CD duration (years), mean (SD) | 9.3 (10.22) | 7.5 (6.34) |
CDAI score, mean (SD) | 301.4 (55.06) | 307.3 (60.96) |
SES-CD score, mean (SD) | 12.8 (7.53) | 14.3 (7.98) |
Endoscopic disease severity per SES-CD score, n (%) | ||
Moderate (7 to 16) | 70 (46.4) | 19 (39.6) |
Severe (> 16) | 45 (29.8) | 19 (39.6) |
Involved GI areas by central read, n (%) | ||
Ileum only | 43 (28.5) | 9 (18.8) |
Colon only | 60 (39.7) | 22 (45.8) |
Ileum and colon | 48 (31.8) | 17 (35.4) |
Biologic therapy failure, n (%) | 78 (51.7) | 25 (52.1) |
Conventional therapy failure,c n (%) | 73 (48.3) | 23 (47.9) |
Concomitant corticosteroids, n (%) | 53 (35.1) | 18 (37.5) |
Concomitant immunomodulators, n (%) | 52 (34.4) | 19 (39.6) |
CD = Crohn disease; CDAI = Crohn’s Disease Activity Index; GI = gastrointestinal; GUS = guselkumab; LTE = long-term extension; SC = subcutaneous; SD = standard deviation; SES-CD = Simple Endoscopic Score for Crohn’s Disease; q.4.w. = every 4 weeks; q.8.w. = every 8 weeks; UST = ustekinumab.
aIncluded GUS 200 mg SC q.4.w. and GUS 100 mg SC q.8.w. treatment groups.
bPatients randomized to UST at week 0.
cWithout a history of biologic failure.
Sources: Week 152 Clinical Study Report for the GALAXI 1 trial27 and Afzali et al.53
Table 66: Summary of Study Treatment Discontinuation of Patients Who Were Treated in the GALAXI 1 Study’s LTE Between Week 48 and Week 152
Characteristic | Combined GUSa (N = 151) | USTb (N = 48) |
|---|---|---|
Patients discontinuing study treatment before week 152, n (%) | 29 (19.2) | 6 (12.5) |
AE: Worsening of CD | 4 (2.6) | 1 (2.1) |
AE: Other | 6 (4.0) | 1 (2.1) |
Lack of efficacy | 2 (1.3) | 0 |
CD-related surgery | 1 (0.7) | 0 |
Lost to follow-up | 4 (2.6) | 0 |
Protocol deviation | 1 (0.7) | 0 |
Pregnancy | 1 (0.7) | 0 |
Patient refused further treatment | 1 (0.7) | 0 |
Withdrawal by patient | 9 (6.0) | 3 (6.3) |
Other | 0 | 1 (2.1) |
AE = adverse event; CD = Crohn disease; GUS = guselkumab; LTE = long-term extension; SC = subcutaneous; q.4.w. = every 4 weeks; q.8.w. = every 8 weeks; UST = ustekinumab.
aIncluded GUS 200 mg SC q.4.w. and GUS 100 mg SC q.8.w. treatment groups.
bPatients randomized to UST at week 0.
Sources: Week 152 Clinical Study Report for the GALAXI 1 trial27 and Afzali et al.53
Efficacy
In the combined guselkumab group, the proportion of patients with CDAI clinical remission was largely sustained from the EOM (week 48) through week 144. By week 144, 68.2% (103 of 151) of patients in the LTE NRI cohort treated with guselkumab were in clinical remission. In the all-randomized (NRI) cohort, 54.1% (100 of 185) of patients were in remission while in the LTE observed cohort, the remission rate was 95.4% (103 of 108) patients.
In the ustekinumab treatment group, 64.6% (31 of 48) of patients in the LTE (NRI) cohort had CDAI remission at week 144. Remission was observed in 46.0% (29 of 63) of patients in the all-randomized (NRI) cohort and in 83.8% (31 of 37) of patients in the LTE observed cohort.
PRO-2 Remission
The proportion of patients with PRO-2 remission was generally maintained over time from the EOM (week 48) to week 144 in the combined guselkumab group. At week 144, 64.2% of patients with PRO-2 remission in the LTE (NRI) cohort. In the all randomized patients (NRI) cohort, 51.4% of patients met the end point at week 144. In the randomized ustekinumab treatment group, 58.3% of patients were in CDAI remission at week 144 in the LTE (NRI) cohort.
Endoscopic Response
In the combined guselkumab group, the proportion of patients with endoscopic response was maintained over time from the EOM (week 48) to week 144. At week 144, 43.0% of patients had endoscopic response in the LTE (NRI) cohort. In all the randomized patients (NRI) cohort, 34.7% of patients had an endoscopic response at week 144. In the randomized ustekinumab treatment group, 25.5% of patients had endoscopic response at week 144 in the LTE (NRI) cohort.
Endoscopic Remission
The proportion of patients with endoscopic remission was generally maintained over time from the EOM (week 48) to week 144 in the combined guselkumab group. At week 144, 28.9% of patients in the LTE (NRI) cohort had endoscopic remission. In the all randomized patients (NRI) cohort, 23.3% of patients had endoscopic remission at week 144. In the randomized ustekinumab treatment group, 17.0% of patients had endoscopic remission at week 144 in the LTE (NRI) cohort.
Harms
The presentation of safety data through week 152 focused on the combined guselkumab and ustekinumab treatment groups and are presented in and Table 68. Overall, guselkumab was well tolerated in patients with moderately to severely active CD through 152 weeks of treatment with no new safety concerns identified during the LTE treatment period and the safety profile of guselkumab was consistent with that of previously approved indications. Most infections were not serious and did not result in discontinuation, while incidence rates of SAEs and serious infections were low through the LTE phase. The most frequent AEs observed in the guselkumab group through week 152 were COVID-19, headache, and nasopharyngitis.
Table 67: Adverse Events From Week 0 Through Week 152 or Up to the Time of Treatment Adjustment — Safety Analysis Set
AE | Combined GUS | UST |
|---|---|---|
Received randomly assigned study medication, n | 220 | 71 |
Average duration of follow-up, weeks | 100.9 | 103.5 |
Average exposure, number of administrations | 20.4 | 12.3 |
Total patient-years of follow-up | 425.3 | 140.8 |
Events per 100 patient-years of follow-up | ||
AEs | 279.8 | 222.3 |
SAEs | 10.6 | 14.9 |
Discontinuation of study drug due to AE | 7.3 | 5.7 |
Infections | 65.8 | 44.7 |
Serious infections | 3.3 | 5.0 |
Patients with 1 or more of the following, n (%) | ||
AE | 192 (87.3) | 63 (88.7) |
SAE | 25 (11.4) | 13 (11.8) |
Discontinuation of study drug due to AE | 29 (13.2) | 8 (11.3) |
Infection | 114 (51.8) | 33 (46.5) |
Serious infection | 12 (5.5) | 5 (7.0) |
AE = adverse event; GUS = guselkumab; SAE = serious adverse event; UST = ustekinumab.
Sources: Week 152 Clinical Study Report for the GALAXI 1 study27 and Afzali et al.53
Table 68: Most Frequent Adverse Events From Week 0 Through Week 152 or Up to the Time of Treatment Adjustment
AE (≥ 5% of patients) | Combined GUS | UST | ||
|---|---|---|---|---|
Frequency (%)a | Exposure-adjusted incidenceb | Frequency (%)a | Exposure-adjusted incidenceb | |
COVID-19 | 15.0 | 8.5 | 7.0 | 3.6 |
Headache | 13.6 | 10.1 | 11.3 | 5.7 |
Nasopharyngitis | 12.7 | 12.9 | 11.3 | 7.1 |
CD | 10.9 | 7.5 | 21.1 | 19.2 |
Pyrexia | 9.5 | 8.0 | 9.9 | 5.7 |
Upper respiratory tract infection | 8.6 | 5.9 | 9.9 | 7.1 |
Arthralgia | 8.2 | 4.7 | 7.0 | 3.6 |
Anemia | 7.7 | 4.2 | 11.3 | 7.1 |
Abdominal pain | 6.8 | 4.5 | 9.9 | 9.2 |
ALT, increased | 6.8 | 4.5 | 0 | 0 |
Diarrhea | 5.9 | 3.3 | 5.6 | 4.3 |
Back pain | 5.9 | 3.3 | 5.6 | 3.6 |
Injection-site erythema | 5.5 | 14.8 | 4.2 | 2.8 |
Nausea | 4.5 | 3.3 | 5.6 | 3.6 |
Fatigue | 3.6 | 1.9 | 5.6 | 2.8 |
AE = adverse event; ALT = alanine aminotransferase; CD = Crohn disease; GUS = guselkumab; UST = ustekinumab.
aFrequency based on the number of patients with an event; patients may have experienced the event more than once.
bExposure-adjusted incidence based on events per 100 patient-years of follow-up.
Sources: Week 152 Clinical Study Report for the GALAXI 1 study27 and Afzali et al.53
Critical Appraisal
Internal Validity
The GALAXI 1 trial’s LTE study was a randomized, double-blind, placebo- and active-controlled trial. A treat-through design was implemented in the LTE phase where participants remained in their treatment group until study end for analyses of the full randomized population; patients not entering the LTE phase were considered to have treatment failure. Clearly defined analysis populations (the all-randomized, LTE NRI, and LTE observed cohorts) provided transparency and methodological rigour in long-term follow-up.
However, the selection of patients in the LTE may have introduced selection bias for the main estimand (LTE patients) because only those with continued treatment benefit (approximately 80% of randomized patients) in the opinion of the investigator were included. Therefore, the population for the main estimand (LTE patients) is not considered randomized. Results for each treatment group were presented descriptively, without comparisons that would support causal conclusions about the efficacy of the treatment.
The study was unblinded at week 48, which may have introduced bias in patient management, the reporting of AEs, and the assessment of subjective clinical outcomes. Concomitant treatments were provided or adjusted at the discretion of the investigator; the impact on estimates of efficacy cannot be quantified.
The strategy used to handle ICEs for the main estimand (LTE patients) was relevant and aligns with the guidance of regulatory bodies. However, some ICEs may not clearly be related to a lack of efficacy (e.g., the decision to not continue in the extension within the randomized population); this could have introduced bias. However, a complete listing of ICEs was not available to judge the potential for such bias.
The extent of missing data was not clear; therefore, any potential for a risk of bias arising from the imputation methods used cannot be ascertained. Additional efficacy analyses of the full randomized population (patients not entering the LTE phase considered as having treatment failure) can be considered conservative within each treatment group. The complete case analysis, however, overestimates treatment effects because no imputation for dropouts due to ICEs was considered.
External Validity
The study population included patients with a range of prior treatment failures — both patients with no prior exposure to biologics and patients with previous exposure to biologics — reflecting a real-world cohort of individuals eligible for systemic therapy for moderate to severe CD. This broad inclusion enhances the generalizability of findings to clinical practice, particularly for patients with refractory or complex disease profiles.
Nonetheless, external validity was somewhat constrained by the exclusion of patients with certain comorbidities or complications, which may affect generalizability to those with more severe or multifactorial disease presentations.
Neff-Baro et al. (2024)
Additional evidence by Neff-Baro et al. (2024)54 was reviewed to assess the predictive impact of endoscopic response after maintenance treatment (approximately 48 weeks) and long-term outcomes (approximately 96 weeks) in patients with moderately to severely active CD. A pooled post hoc analysis was conducted with data from the treatment groups (placebo excluded) of 2 RCTs (the IM-UNITI study [a phase III maintenance trial of ustekinumab] and the GALAXI 1 study [a phase II treat-through trial of guselkumab, total n = 461]), which enrolled adult patients diagnosed with moderately to severely active CD of at least 3 months’ duration (confirmed through CDAI scores). The IM-UNITI trial enrolled patients who had completed induction therapy with ustekinumab and the GALAXI 1 trial provided data on patients who had used guselkumab in the induction and maintenance phases. Patients with non–switcher status from both trials with data on endoscopic response and clinical remission available at the EOM were included. Patients missing LTE phase data were excluded. The long-term impact of endoscopic response was modelled based on a multivariate analysis of the trials as a random effect, adjusted for treatment group during maintenance, clinical remission status at the EOM, and endoscopic response at the EOM. Logistic regressions were conducted for clinical remission, clinical response, IBDQ remission, and abnormal CRP. A Cox model was conducted for surgery or hospitalization.
A total of 461 patients had available endoscopy and clinical remission status at the EOM (the IM-UNITI study, N = 177; the GALAXI 1 study, N = 284). Findings from the pooled analysis at week 96 are presented in Table 69.
Table 69: Summary of Efficacy Results in Post Hoc Analysis
Long-term outcome | Patients with the outcome in LTEa phase, n (%) | ORb (95% CI) | P value | |
|---|---|---|---|---|
EOMa ER | No EOM ER | |||
Clinical remission at week 96 (N = 383) | 119 (75.3) | 109 (48.4) | 1.91 (1.11 to 3.28) | 0.0192 |
Clinical response at week 96 (N = 383) | 124 (78.5) | 128 (56.9) | 1.65 (0.97 to 2.83) | 0.0656 |
IBDQ remission at week 96 (N = 290) | 99 (75.0) | 86 (54.4) | 1.99 (1.16 to 3.41) | 0.0122 |
CRP, abnormal (CRP > 3; N = 296) | 36 (28.8) | 88 (51.5) | 0.46 (0.27 to 0.76) | 0.0028 |
Hospitalizations and/or surgeries (N = 326) | 13 (9.0) | 28 (16.0) | 0.585 (0.295 to 1.158) | 0.1237 |
CI = confidence interval; CRP = C-reactive protein; EOM = end of maintenance; ER = endoscopic response; IBDQ = Inflammatory Bowel Disease Questionnaire; LTE = long-term extension; OR = odds ratio.
aEOM for endoscopic outcomes: GALAXI study, week 48, and IM-UNITI study, week 44. LTE: GALAXI study, week 96, and IM-UNITI study, week 92.
bORs reflect the probability of achieving LTE outcome for patients with endoscopic response versus those without. Analyses were adjusted on remission status at the EOM, maintenance treatment group, and trial.
Source: Neff-Baro et al. (2024).54
Critical Appraisal of Neff-Baro et al. (2024)
The pooled post hoc analysis is at an increased risk of type I error due to multiple group testing; thus, the evidence is exploratory as the association of endoscopic response with long-term outcomes could have resulted from chance. Given that there is no clear prespecification of the analyses, there is a possibility that the results were selected from multiple analyses of the data (e.g., based on magnitude, direction, or statistical significance of observed associations). The model aimed to provide some indication of the ability of endoscopic response at week 48 to predict later outcomes among individual patients. It is not clear how variables were selected for inclusion within the regression models. It is possible that important predictors (confounders) were missed, which might have altered the observed associations had they been included. In general, the associations were estimated with imprecision, which indicates uncertainty in the estimated magnitude of association between endoscopic response at week 48 and later outcomes. There is a risk of bias in the estimated associations due to substantial missing data (approximately 15% to 35%) across the available outcomes, which does not appear to have been imputed. Finally, the study provides some information to suggest an association between endoscopic response at 48 weeks and later outcomes. However, the ideal evidence to validate a surrogate end point comes from RCTs that demonstrate the ability of the treatment effect (i.e., guselkumab versus placebo or other comparator) at 48 weeks to predict a clinically relevant treatment effect on patient-important outcomes at later time points.
Discussion
Summary of Available Evidence
This report summarizes the evidence of the efficacy and safety of guselkumab administered via IV or SC injections in the treatment of adult patients with CD.
The GALAXI 212 and GALAXI 313 trials were identically designed, phase III, randomized, double-blind, placebo- and active-controlled (versus ustekinumab), parallel-group, multicentre trials. The primary objectives of the GALAXI 2 and GALAXI 3 trials were to evaluate the efficacy and safety of guselkumab — administered as IV induction, followed by SC maintenance — in patients with moderately to severely active CD whose disease had demonstrated an inadequate response to or an inability to tolerate previous conventional therapy or biologic therapy. Each GALAXI trial consisted of a 12-week induction period followed by a 36-week maintenance period. Patients were randomized using a permuted block randomization in a 2:2:2:1 ratio to receive 1 of 2 of dose regimens of guselkumab (200 mg IV induction every 4 weeks from week 0 through week 8, followed by either 100 mg SC maintenance every 8 weeks, or 200 mg SC maintenance every 4 weeks), ustekinumab, or placebo, respectively.
The GRAVITI14 trial was a phase III, randomized, double-blind, placebo-controlled, parallel-group, multicentre trial. The primary objectives of the GRAVITI trial were to evaluate the efficacy and safety of guselkumab — administered as SC induction followed by SC maintenance — in patients with moderately to severely active CD whose disease had demonstrated an inadequate response to or an inability to tolerate previous conventional therapy or biologic therapy. The GRAVITI trial included a 24-week main treatment phase, comprising a 12-week induction period followed by a 12-week maintenance period, and was followed by a 72-week extension maintenance period. Patients were randomized using a permuted block randomization in a 1:1:1 ratio to receive 1 of 2 dose regimens of guselkumab (400 mg SC at week 0, week 4, and week 8, followed by either guselkumab at a dose of 100 mg SC every 8 weeks, or 200 mg SC every 4 weeks) or placebo, respectively. The treatment extension phase of the GRAVITI trial is currently ongoing.
An LTE study43 was designed to evaluate the long-term efficacy of guselkumab on clinical and endoscopic outcomes, assess safety, explore the benefits of treatment adjustment for patients with inadequate responses between week 52 and week 80, and examine the impact of treatment on HRQoL. Patients who completed the 48-week treatment period of the GALAXI 2 or GALAXI 3 trials were eligible to enter the LTE phase and receive approximately 4 additional years of treatment. Those receiving guselkumab or ustekinumab maintained their original dosing regimens (pooled for analysis) while patients in the placebo group were discontinued from study following unblinding at week 48. No findings on HRQoL were reported from this study.
A sponsor-conducted ITC46 was submitted to evaluate guselkumab relative to relevant comparators in adults with moderately to severely active CD. The analyses included patients with a history of CON-Failure and/or BIO-Failure, and assessed outcomes during both the induction phase (approximately 12 weeks) and the maintenance phase (approximately 1 year). Evaluated outcomes included clinical remission, clinical response, endoscopic response, and a composite end point of clinical remission combined with endoscopic response.
Two additional studies addressing gaps in the evidence from the systematic review were summarized in this report. The GALAXI 1 trial27 was a phase II, randomized, double-blind, placebo- and active-controlled, multicentre trial with an LTE component, designed to evaluate the efficacy and safety of guselkumab in adults with moderately to severely active CD. The LTE phase extended treatment to approximately 152 weeks. The study was unblinded at week 48 and patients continued on their assigned SC treatment regimens throughout the extension period. Additional evidence by Neff-Baro et al. (2024)54 provided insight into the association between endoscopic response following maintenance treatment (approximately 48 weeks) and longer-term outcomes at around 96 weeks in patients with moderately to severely active CD.
Interpretation of Results
Efficacy
Both the patient group and the clinical experts consulted by CDA-AMC highlighted that, although a variety of treatment options are available for CD, not all patients respond adequately to existing therapies. As such, there remains a need for effective treatment options that can alleviate symptoms, improve clinical and endoscopic outcomes, enhance quality of life, and be accessed in a timely manner. Patients expressed a preference for treatments that are safe, reduce reliance on corticosteroids, involve fewer medications, and can be administered at home. Evidence from 3 pivotal trials — the GALAXI 2, GALAXI 3, and GRAVITI studies — addressed treatment outcomes considered important by both patients and clinicians. Additionally, the long-term safety and efficacy of guselkumab were evaluated in the LTE phase of the GALAXI trials, with comparative assessments relative to ustekinumab.
The GALAXI 2 and GALAXI 3 trials were identical in terms of study design, patient population, interventions, comparators, and outcomes. Both trials enrolled adult patients with CD whose disease had an inadequate response or intolerance to prior conventional or biologic therapies. In the GALAXI trials, the efficacy and safety of guselkumab were evaluated relative to both placebo and the active comparator ustekinumab, with guselkumab administered as an IV induction regimen followed by SC maintenance. The GRAVITI trial similarly assessed the efficacy and safety of guselkumab versus placebo in a comparable patient population. However, unlike the GALAXI trials, GRAVITI employed SC induction followed by SC maintenance, a regimen considered more convenient for patients. According to the clinical experts, the GRAVITI trial results support the feasibility and efficacy of SC induction of guselkumab, providing additional flexibility for clinical practice and potentially improving patient adherence and comfort. The end points used in all 3 trials were considered appropriate by the clinical expert, although they noted that the Harvey-Bradshaw Index is more commonly used in Canadian clinical practice than the CDAI score. While the assessment tools used in clinical trials may differ from those typically employed in clinical practice, clinical experts noted that the inclusion of CDAI and SES-CD scores does not limit the applicability of the trial findings because clinicians are well acquainted with the components of these scoring systems. The SES-CD score was demonstrated to have construct validity28 and high interrater reliability.29 The CDAI score was demonstrated to have construct validity and predictability, but does not demonstrate any significant correlation between the overall score and objective measurements such as mucosal healing.35
Two different maintenance dosing regimens of guselkumab — 100 mg every 8 weeks and 200 mg every 4 weeks — were evaluated in the GALAXI and GRAVITI trials. According to the clinical experts consulted by CDA-AMC, though it was not formally assessed, the overall differences in efficacy between the 2 doses did not appear substantial across all 3 trials. In clinical practice, the experts indicated that clinicians would typically initiate treatment with the 100 mg maintenance dose, reserving the 200 mg dose for patients with more severe disease characteristics, such as higher endoscopic activity, perianal disease, or a history of prior intestinal surgery. The availability of 2 dosing options was viewed as a clinical advantage, offering the flexibility to tailor treatment based on individual patient needs and response to therapy.
Evidence from the GALAXI trials demonstrated with high certainty that, compared with placebo, guselkumab (IV induction followed by SC maintenance) results in a clinically meaningful increase in the proportion of patients with the following composite end points: clinical response at week 12 and clinical remission at week 48, clinical response at week 12 and endoscopic response at week 48, clinical response at week 12 and 90-day, corticosteroid-free clinical remission at week 48, and clinical response at week 12 and endoscopic remission at week 48. Findings from the post hoc subgroup analyses of pooled GALAXI 2 and GALAXI 3 trial data for the coprimary end points — clinical response at week 12 and clinical remission at week 48, and clinical response at week 12 and endoscopic response at week 48 — were consistent across the BIO-Failure and CON-Failure subpopulations.39 However, these analyses were exploratory and it is unclear if they were powered to detect differences between groups.
In addition to the composite measures, individual component outcomes — clinical remission and endoscopic response — were reported in both GALAXI trials, with both end points demonstrating a benefit of guselkumab over placebo at week 12. These findings were considered clinically meaningful by the clinical experts consulted by CDA-AMC. However, the experts emphasized that endoscopic improvement and mucosal healing at a longer follow-up time point have become the target goals in the treatment of patients with moderately to severely active CD. They also indicated that endoscopic reassessment at week 12 is not routinely performed in clinical practice. Instead, endoscopic evaluations are typically conducted between 6 months and 8 months after treatment initiation and even then, their use is often selective due to limited availability and the procedural burden on patients. The clinical experts consulted highlighted corticosteroid dependence as a common challenge in the management of CD and emphasized the importance of achieving corticosteroid-free remission as a meaningful and clinically relevant treatment goal.
The clinical experts noted that the treatment effects observed in the GRAVITI trial (SC induction followed by SC maintenance) were favourable and clinically meaningful, with response rates comparable to those seen with IV induction of guselkumab in the GALAXI trials. Evidence from the GRAVITI trial showed improvements in the end points, such as clinical remission at week 12 and week 48, clinical response at week 12, endoscopic response at week 12 and week 48, and deep remission at week 48. Compared with placebo, evidence from the GRAVITI trial demonstrated with high certainty that guselkumab results in a clinically important increase in the proportions of patients with clinical remission and endoscopic response at week 12 and week 48, and clinical response at week 12. The clinical experts consulted indicated that deep remission at week 48 — defined as both clinical remission and endoscopic remission — is an important outcome in the management of CD. They considered the results from the GRAVITI trial on this end point to be clinically meaningful.
In both GALAXI trials, the efficacy of guselkumab relative to ustekinumab was evaluated for several longer-term end points at week 48, including clinical remission, endoscopic response, endoscopic remission, and a composite end point of clinical remission and endoscopic remission. Compared with ustekinumab, evidence from both GALAXI trials demonstrated with moderate certainty that guselkumab likely results in a clinically important improvement in endoscopic remission at week 48, and little to no difference in the proportion of patients with clinical remission at week 48. The results of the prespecified, multiplicity-controlled pooled analysis of the GALAXI 2 and GALAXI 3 studies demonstrated that both dosing regimens of guselkumab were favoured over ustekinumab across secondary end points, including clinical remission and endoscopic response, endoscopic remission, and deep remission. Heterogeneity in the efficacy of guselkumab was observed between the 2 dosing regimens for both endoscopic response at week 48 and the composite outcome of clinical remission and endoscopic response at week 48. Compared with ustekinumab, evidence from both GALAXI trials demonstrated with low certainty that guselkumab regimen 1 (low dose) may result in a clinically important increase in the proportion of patients with endoscopic response at week 48. The uncertainty regarding the clinical meaningfulness of the results stems from the fact that, based on the MID of 5% identified by the clinical experts, the point estimate for guselkumab regimen 1 in the GALAXI 2 study suggested little to no difference between groups, and the 95% CI crossed the MID threshold. Additionally, inconsistency between studies — with 1 study showing a clinically important benefit based on the point estimate and the other showing little to no difference — reduces the overall certainty of the evidence. In contrast, the evidence from both GALAXI trials demonstrated with high certainty that guselkumab regimen 2 (high dose) results in a clinically important increase in the proportion of patients with endoscopic response at week 48. Similarly, compared with ustekinumab, evidence from both GALAXI trials demonstrated with low certainty that guselkumab regimen 1 (low dose) may result in a clinically important increase in the proportion of patients with clinical remission and endoscopic response at week 48. In contrast, the evidence from both GALAXI trials demonstrated with high certainty that guselkumab regimen 2 (high dose) results in a clinically important increase in endoscopic response at week 48. Of note, in the analyses of the individual GALAXI 2 and GALAXI 3 trials, these end points were not formally tested due to an earlier failure of the statistical hierarchy during the pooled analyses.
HRQoL is an important outcome to patients and clinicians and was assessed in the GALAXI and GRAVITI trials, using IBDQ and PRO-2 measures. The clinical experts consulted by CDA-AMC indicated that these tools capture distinct but complementary aspects of patient experience and reflect the broader impact of guselkumab treatment beyond symptom relief and mucosal healing. In the GALAXI and GRAVITI trials, IBDQ remission was evaluated as an exploratory outcome. IBDQ is a validated measurement comprising domains of bowel symptoms (including abdominal cramps, abdominal pain, a feeling of defecation need, and abdominal bloating, among others), systemic symptoms, social function, and emotional function. Heterogeneity in the efficacy of guselkumab was observed between the 2 dosing regimens with respect to IBDQ remission at week 12 in both GALAXI trials when compared with placebo. In the GALAXI trials, there is high-certainty evidence that guselkumab regimen 1 (low dose) results in a clinically meaningful improvement in IBDQ remission at week 12 compared with placebo. For guselkumab regimen 2 (high dose), there is moderate-certainty evidence suggesting it likely results in a clinically important increase in the proportion of patients with IBDQ remission compared with placebo. When compared with ustekinumab, low-certainty evidence indicates that guselkumab regimen 1 (low dose) may result in little to no difference in the proportion of patients with IBDQ remission at week 48. The certainty of this benefit was rated as low due to uncertainty regarding the clinical meaningfulness of the findings when applying the MID threshold of 5%, as identified by clinical experts. Additionally, inconsistency between studies — with 1 study showing a benefit based on the point estimate and the other showing little to no difference — reduces the overall certainty of the evidence. When compared with ustekinumab, moderate-certainty evidence indicates that guselkumab regimen 2 (high dose) likely results in little to no difference in the proportion of patients with IBDQ remission at week 48. Evidence from the GRAVITI trial demonstrated with moderate certainty that, compared with placebo, guselkumab likely results in a clinically important increase in the proportion of patients with IBDQ remission at week 48. PRO-2 remission was evaluated as a secondary end point in the GRAVITI trial. Evidence from the GRAVITI trial demonstrated with high certainty that, compared with placebo, guselkumab results in a clinically important increase in the proportion of patients with PRO-2 remission at week 12 and week 48.
Overall, there are no major concerns with the generalizability of the 3 pivotal trials’ results. The GALAXI and GRAVITI trials included patients with CD whose disease had demonstrated an inadequate response or an inability to tolerate previous conventional therapy or biologic therapy. The clinical experts highlighted that approximately half of the patients in the GALAXI and GRAVITI trials had no prior exposure to biologics, allowing for a meaningful assessment of treatment response in both populations of patients with no prior exposure to biologics and patients with previous exposure to biologics. They further commented that this trial design is reflective of real-world clinical practice, although the distribution of patients with no prior exposure to biologics versus patients with previous exposure to biologics may vary between community-based and tertiary care settings. According to the clinical experts consulted by CDA-AMC, patients enrolled in the trials were considered to have more severe disease than those typically encountered in clinical practice. However, the trial inclusion and exclusion criteria were more restrictive than the selection criteria that would typically be applied in clinical practice.
The GRAVITI trial was ongoing, with a 24-week main treatment phase, including a 12-week induction period followed by a 12-week maintenance period, and an extension treatment phase that includes a 72-week maintenance period. This report presents results up to week 48. The LTE studies of GALAXI 2 and GALAXI 3 demonstrated that patients with moderately to severely active CD receiving guselkumab — 200 mg IV every 4 weeks to 100 mg SC every 8 weeks or guselkumab 200 mg IV every 4 weeks to 200 mg SC every 4 weeks — and who rolled over from the parent pivotal studies continued to experience clinical benefit throughout to week 96 (informal statistics in the LTE phase were conducted on the pooled data of patients who had received guselkumab and ustekinumab in the parent studies; patients who were receiving placebo in the parent trials discontinued placebo at end of week 48). Sustained improvements were observed in key clinical end points, including clinical remission, corticosteroid-free clinical remission, endoscopic response, combined clinical and endoscopic response, and deep remission, in comparison to ustekinumab. However, these findings were considered exploratory and only supportive of the primary trial results because outcomes assessed in the LTE phase were not subject to formal hypothesis testing and no adjustments were made for multiplicity in the statistical analyses. The potential for bias due to dropouts for reasons other than a lack of efficacy or an AE, and due to missing data, was not possible to fully ascertain.
The sponsor-submitted ITC demonstrated that compared to active treatments, guselkumab frequently showed potential superiority over vedolizumab in achieving clinical remission and response. However, comparisons with other drugs — such as adalimumab, infliximab, ustekinumab, risankizumab, and upadacitinib — yielded more inconsistent results, with the relative favourability of guselkumab varying across specific analyses (e.g., the inclusion or exclusion of those with delayed response) and outcome measures. Overall, substantial uncertainty remains regarding these relative effects due to several limitations, including an important degree of clinical and methodological heterogeneity, assumptions made in the analysis that cannot be fully verified, and frequently observed wide credible intervals across many comparisons. Comparative evidence for SC induction was not presented.
Efficacy results from the GALAXI 1 study’s LTE phase indicated sustained clinical benefit with guselkumab over time. However, no formal inferential analyses were performed for any outcome to compare guselkumab with ustekinumab, which restricts the ability to draw conclusions regarding comparative efficacy. Additional evidence by Neff-Baro et al. (2024)54 was reviewed to assess the predictive impact of endoscopic response after maintenance treatment (approximately 48 weeks) and long-term outcomes (approximately 96 weeks) in patients with moderately to severely active CD. However, no definitive conclusions about the ability of the guselkumab treatment effect at 48 weeks to translate to later treatment effects can be drawn due to several limitations inherent in the pooled post hoc analyses.
Harms
Overall, the proportion of patients who experienced SAEs was low across all 3 trials, with similar rates observed across treatment groups during both the induction and maintenance periods. The clinical experts consulted by CDA-AMC indicated that guselkumab was generally well tolerated in the GALAXI and GRAVITI trials, with no major safety concerns identified. Notably, no new safety concerns were identified during the LTE phase. According to the experts, the overall safety profile of guselkumab appears to be comparable to that of other advanced therapies for CD. Common AEs — including headache, abdominal pain, and nasopharyngitis — were regarded as manageable in clinical practice and consistent with the known safety profiles of other biologics. Furthermore, the clinical experts found the low rates of AEs of special interest, such as infections, malignancies, and venous thromboembolism, to be reassuring. The sponsor-submitted ITC did not include any comparative safety data.
Conclusion
Evidence from 3 phase III, double-blind RCTs — the GALAXI 2 and GALAXI 3 studies (IV induction, then SC maintenance) as well as the GRAVITI study (SC induction, then SC maintenance) — evaluated outcomes considered important to both patients and clinicians. These studies demonstrated high-certainty evidence that treatment with guselkumab results in a clinically important improvement in clinical and endoscopic outcomes, clinical response and 90-day, corticosteroid-free clinical remission, and PRO-2 remission at week 12 and week 48 compared with placebo in adults with moderately to severely active CD. Both GALAXI studies demonstrated moderate-certainty evidence that treatment with guselkumab likely results in a clinically important improvement in endoscopic remission at week 48, and little to no difference in clinical remission at week 48, when compared with ustekinumab. However, in both GALAXI trials, heterogeneity in the efficacy of guselkumab was observed between the 2 dosing regimens with respect to IBDQ remission at week 12 when compared with both placebo and ustekinumab, as well as a composite of clinical remission and endoscopic response at week 48 when compared with ustekinumab. Both GALAXI studies demonstrated high-certainty evidence for regimen 1 and moderate-certainty evidence for regimen 2 that treatment with guselkumab likely results in a clinically meaningful improvement in IBDQ remission at week 12 when compared with placebo. When compared with ustekinumab, both GALAXI studies demonstrated low-certainty evidence for regimen 1 and moderate-certainty evidence for regimen 2 that treatment with guselkumab likely results in little to no difference in IBDQ remission at week 48. Of note, in the analyses of the individual GALAXI 2 and GALAXI 3 trials, these end points were not formally tested due to a failure of the statistical hierarchy during the pooled analyses.
Although the Health Canada indication is broader than the patient populations enrolled in the trials (i.e., trial patients whose disease had inadequate response or were unable to tolerate conventional or advanced therapy), the clinical experts consulted by CDA-AMC did not consider this discrepancy to affect the generalizability of the findings. No new safety signals were identified across the trials and the safety profile of guselkumab was considered consistent with that of other advanced therapies used in the management of CD based on expert opinion. The LTE phase of the GALAXI trials provided additional information on the longer-term benefits of guselkumab beyond 48 weeks for key efficacy and safety outcomes; however, because no formal inferential analyses were conducted, the findings are considered exploratory.
The results of the sponsor-submitted ITC demonstrated that, compared with active treatments, guselkumab often showed potential superiority over vedolizumab in achieving clinical remission and response; however, its comparative efficacy against other drugs — such as ustekinumab, risankizumab, and upadacitinib — was more variable, with results differing across specific analyses and outcome measures. Due to limitations of the ITC, primarily related to the heterogeneity across studies, unverifiable assumptions made in the analysis, and imprecision in the treatment effect estimates, no definitive conclusions can be drawn regarding the relative efficacy of guselkumab compared with other relevant comparators. The sponsor-submitted ITC did not include the GRAVITI trial, precluding conclusions about the efficacy of SC induction versus relevant comparators. Additionally, there was not any comparative safety data.
References
1.Janssen Inc. Draft Product Monograph for TREMFYA (guselkumab) [sponsor supplied reference]. 2024.
2.Lichtenstein Gr, Loftus EV, Isaacs KL, Regueiro MD, Gerson LB, et al. ACG Clinical Guideline: Management of Crohn's Disease in Adults. Am J Gastroenterol. 2018;113(4):481-517. PubMed
3.Veauthier B, Hornecker JR. Crohn's Disease: Diagnosis and Management. Am Fam Physician. 2018;98(11):661-669. PubMed
4.Crohn's Colitis Foundation of Canada. Impact of Inflammatory Bowel Disease in Canada [sponsor supplied reference]. 2018. Accessed October 1, 2024. https://crohnsandcolitis.ca/Crohns%20and%20Colitis/documents/reports/2018-Impact-Report-LR.pdf?ext=.pdf
5.Shaffer SR, Kuenzig ME, Windsor JW, et al. The 2023 Impact of Inflammatory Bowel Disease in Canada: Special Populations-IBD in Seniors. J Can Assoc Gastroenterol. 2023;6(Suppl 2):S45-S54. doi:10.1093/jcag/gwad013 PubMed
6.Gupta N, Bostrom AG, Kirschner BS, et al. Incidence of stricturing and penetrating complications of Crohn's disease diagnosed in pediatric patients. Inflamm Bowel Dis. 2010;16(4):638-44. doi:10.1002/ibd.21099 PubMed
7.Seyedian SS, Nokhostin F, Malamir MD. A review of the diagnosis, prevention, and treatment methods of inflammatory bowel disease. J Med Life. 2019;12(2):113-122. doi:10.25122/jml-2018-0075 PubMed
8.Naegeli AN, Balkaran BL, Shan M, Hunter TM, Lee LK, Jairath V. The impact of symptom severity on the humanistic and economic burden of inflammatory bowel disease: a real-world data linkage study. Curr Med Res Opin. 2022;38(4):541-551. doi:10.1080/03007995.2022.2043655 PubMed
9.Gomollon F, Dignass A, Annese V, et al. 3rd European Evidence-based Consensus on the Diagnosis and Management of Crohn's Disease 2016: Part 1: Diagnosis and Medical Management. J Crohns Colitis. 2017;11(1):3-25. doi:10.1093/ecco-jcc/jjw168 PubMed
10.Balshem H, Helfand M, Schunemann HJ, et al. GRADE guidelines: 3. Rating the quality of evidence. Journal of clinical epidemiology. 2011;64(4):401-6. doi:10.1016/j.jclinepi.2010.07.015 PubMed
11.Santesso N, Glenton C, Dahm P, et al. GRADE guidelines 26: informative statements to communicate the findings of systematic reviews of interventions. J Clin Epidemiol 2020;119:126-135. doi:10.1016/j.jclinepi.2019.10.014 PubMed
12.Janssen Research Development. GALAXI 2 Week 48 Clinical Study Report CNTO1959CRD3001 [sponsor supplied reference]. 2024;
13.Janssen Research Development. GALAXI 3 Week 48 Clinical Study Report CNTO1959CRD3001 [sponsor supplied reference]. 2024;
14.Janssen Research Development. GRAVITI Week 48 Clinical Study Report CNTO1959CRD3004 [sponsor supplied reference]. 2024;
15.Maaser C, Sturm A, Vavricka SR, et al. ECCO-ESGAR Guideline for Diagnostic Assessment in IBD Part 1: Initial diagnosis, monitoring of known IBD, detection of complications. J Crohns Colitis. 2019;13(2):144-164. doi:10.1093/ecco-jcc/jjy113 PubMed
16.Feuerstein JD, Ho EY, Shmidt E, et al. AGA Clinical Practice Guidelines on the Medical Management of Moderate to Severe Luminal and Perianal Fistulizing Crohn's Disease. Gastroenterology. 2021;160(7):2496-2508. doi:10.1053/j.gastro.2021.04.022 PubMed
17.Peppercorn Ma Ks. Clinical manifestations, diagnosis, and prognosis of Crohn disease in adults [sponsor supplied reference]. Accessed October 1, 2024, https://medilib.ir/uptodate/show/4070
18.Panaccione R, Steinhart AH, Bressler B, et al. Canadian Association of Gastroenterology Clinical Practice Guideline for the Management of Luminal Crohn's Disease. J Can Assoc Gastroenterol. 2019;2(3):e1-e34. doi:10.1093/jcag/gwz019 PubMed
19.Abreu M ARKJ, et al. Guselkumab, an IL-23p19 subunit-specific monoclonal antibody, binds CD64+ myeloid cells and potently neutralizes IL-23 produced from the same cells [sponsor supplied reference].
20.Krueger JG, Eyerich K, Kuchroo VK, et al. IL-23 past, present, and future: a roadmap to advancing IL-23 science and therapy. Front Immunol. 2024;15:1331217. doi:10.3389/fimmu.2024.1331217 PubMed
21.AbbVie Corporation. Product Monograph for SKYRIZI (Risankizumab) [sponsor supplied reference]. 2024.
22.Taleda Canada Inc. Product Monograph for ENTYVIO (Vedolizumab) [sponsor supplied reference]. 2023.
23.Janssen Inc. Product Monograph from REMICADE (Infliximab) [sponsor supplied reference]. 2022.
24.Janssen Inc. Product Monograph for STELARA (Ustekinumab) [sponsor supplied reference]. 2023.
25.AbbVie Corporation. Product Monograph for HUMIRA (Adalimumab) [sponsor supplied reference]. 2022.
26.AbbVie Corporation. Product Monograph for RINVOQ (Upadacitinib) [sponsor supplied reference]. 2023.
27.Janssen Research Development. GALAXI 1 Week 152 Clinical Study Report CNTO1959CRD3001 [sponsor supplied reference]. 2023;
28.Daperno M, D'Haens G, Van Assche G, et al. Development and validation of a new, simplified endoscopic activity score for Crohn's disease: the SES-CD. Gastrointest Endosc. 2004;60(4):505-12. doi:10.1016/s0016-5107(04)01878-4 PubMed
29.Khanna R, Nelson SA, Feagan BG, et al. Endoscopic scoring indices for evaluation of disease activity in Crohn's disease. Cochrane Database Syst Rev. 2016;2016(8):CD010642. doi:10.1002/14651858.CD010642.pub2 PubMed
30.Gregor JC, McDonald JW, Klar N, et al. An evaluation of utility measurement in Crohn's disease. Inflamm Bowel Dis. 1997;3(4):265-76. doi:10.1097/00054725-199712000-00004 PubMed
31.Guyatt G, Mitchell A, Irvine EJ, et al. A new measure of health status for clinical trials in inflammatory bowel disease. Gastroenterology. 1989;96(3):804-10. PubMed
32.Irvine EJ. Development and subsequent refinement of the inflammatory bowel disease questionnaire: a quality-of-life instrument for adult patients with inflammatory bowel disease. J Pediatr Gastroenterol Nutr. 1999;28(4):S23-7. doi:10.1097/00005176-199904001-00003 PubMed
33.Pallis AG, Mouzas IA, Vlachonikolis IG. The inflammatory bowel disease questionnaire: a review of its national validation studies. Inflamm Bowel Dis. 2004;10(3):261-9. doi:10.1097/00054725-200405000-00014 PubMed
34.Chen XL, Zhong LH, Wen Y, et al. Inflammatory bowel disease-specific health-related quality of life instruments: a systematic review of measurement properties. Health Qual Life Outcomes. 2017;15(1):177. doi:10.1186/s12955-017-0753-2 PubMed
35.Yoshida EM. The Crohn's Disease Activity Index, its derivatives and the Inflammatory Bowel Disease Questionnaire: a review of instruments to assess Crohn's disease. Can J Gastroenterol. 1999;13(1):65-73. doi:10.1155/1999/506915 PubMed
36.Sandborn WJ, Feagan BG, Hanauer SB, et al. A review of activity indices and efficacy endpoints for clinical trials of medical therapy in adults with Crohn's disease. Gastroenterology. 2002;122(2):512-30. doi:10.1053/gast.2002.31072 PubMed
37.Best WR, Becktel JM, Singleton JW, Kern F, Jr. Development of a Crohn's disease activity index. National Cooperative Crohn's Disease Study. Gastroenterology. 1976;70(3):439-44. doi:10.1016/S0016-5085(76)80163-1 PubMed
38.Feagan BG, Rochon J, Fedorak RN, et al. Methotrexate for the treatment of Crohn's disease. The North American Crohn's Study Group Investigators. N Engl J Med. 1995;332(5):292-7. doi:10.1056/NEJM199502023320503 PubMed
39.Sands BE, D’Haens G, Danese S, et al. Efficacy of Guselkumab versus Placebo in Crohn’s Disease Based On Prior Response/Exposure to Biologic Therapy: Results of the GALAXI 2 & 3 Phase 3 Studies [sponsor supplied reference]. 2024.
40.Center for Drug Evaluation and Research Center for Biologics Evaluation and Research. Crohn’s disease: Developing drugs for treatment. Food and Drug Administration; 2022. Accessed March 23, 2025. https://www.fda.gov/media/158001/download
41.Committee for Medicinal Products for Human Use. Guideline on the development of new medicinal products for the treatment of Crohn’s Disease (CPMP/EWP/2284/99 Rev. 1). European Medicines Agency; 2018. Accessed March 23, 2025. https://www.ema.europa.eu/en/documents/scientific-guideline/guideline-development-new-medicinal-products-treatment-crohns-disease-revision-2_en.pdf
42.Silvio Danese, Remo Panaccione, David T. Rubin, et al. Clinical Efficacy and Safety of Guselkumab Maintenance Therapy in Patients with Moderately to Severely Active Crohn's Disease: Week 48 Analyses from the Phase 2 GALAXI 1 Study [sponsor supplied reference]. 2022; doi:10.1002/art.42355
43.Janssen Research Development. Phase 3 GALAXI 2 & 3 LTE Week 96 Results [sponsor supplied reference]. 2024.
44.Janssen Research Development. Statistical Analysis Plan: Phase 3 (GALAXI 2 and 3), Long-term Extension [sponsor supplied reference]. 2024.
45.Centre for Reviews and Dissemination. Systematic Reviews CRD’s guidance for undertaking reviews in health care. University of York; 2008. Accessed September 28, 2022. https://www.york.ac.uk/media/crd/Systematic_Reviews.pdf
46.Janssen Inc. Efficacy of guselkumab versus available biologic therapies for the maintenance treatment of moderate to severe Crohn’s disease: A systematic review and meta-analysis [sponsor supplied reference]. 2024.
47.Vehtari A, Gelman A, Simpson D, Carpenter B, Bürkner P-C. Rank-normalization, folding, and localization: An improved R^ for assessing convergence of MCMC. Accessed April 13, 2023, https://arxiv.org/abs/1903.08008
48.Dias S, Welton NJ, Sutton AJ, Ades AE. NICE DSU Technical Support Document 2: A Generalised Linear Modelling Framework for Pairwise and Network Meta-Analysis of Randomised Controlled Trials [sponsor supplied reference]. 2014.
49.Turner RM, Jackson D, Wei Y, Thompson SG, Higgins JP. Predictive distributions for between-study heterogeneity and simple methods for their application in Bayesian meta-analysis. Stat Med. 2015;34(6):984-98. doi:10.1002/sim.6381 PubMed
50.Peyrin-Biroulet L, Chapman JC, Colombel JF, et al. Risankizumab versus Ustekinumab for Moderate-to-Severe Crohn's Disease. N Engl J Med. 2024;391(3):213-223. doi:10.1056/NEJMoa2314585 PubMed
51.Disher T, Naessens D, Sanon M, et al. One-Year Efficacy of Guselkumab Versus Advanced Therapies for the Treatment of Moderately to Severely Active Crohn's Disease: A Network Meta-Analysis. Adv Ther. 2025;42(6):2708-2727. doi:10.1007/s12325-025-03183-x PubMed
52.Varu A, Wilson FR, Dyrda P, Hazel M, Hutton B, Cameron C. Treatment sequence network meta-analysis in Crohn's disease: a methodological case study. Curr Med Res Opin. 2019;35(5):733-756. doi:10.1080/03007995.2019.1580094 PubMed
53.Anita Afzali, Silvio Danese Remo Panaccione, Brian G. Feagan, et al. Efficacy and Safety of Guselkumab for Crohn’s Disease Through 3 Years: GALAXI-1 Long-Term Extension [sponsor supplied reference]
54.Neff-Baro S, Gauthier A, Sanon M, et al. Endoscopic Response at 1-year and Association with Long-term Crohn's Disease Outcome: A pooled CLinical Trial Analysis Adjusting for 1-year Clinical Remission Status [sponsor supplied reference].
Appendix 1: Detailed Outcome Data
Please note that this appendix has not been copy-edited.
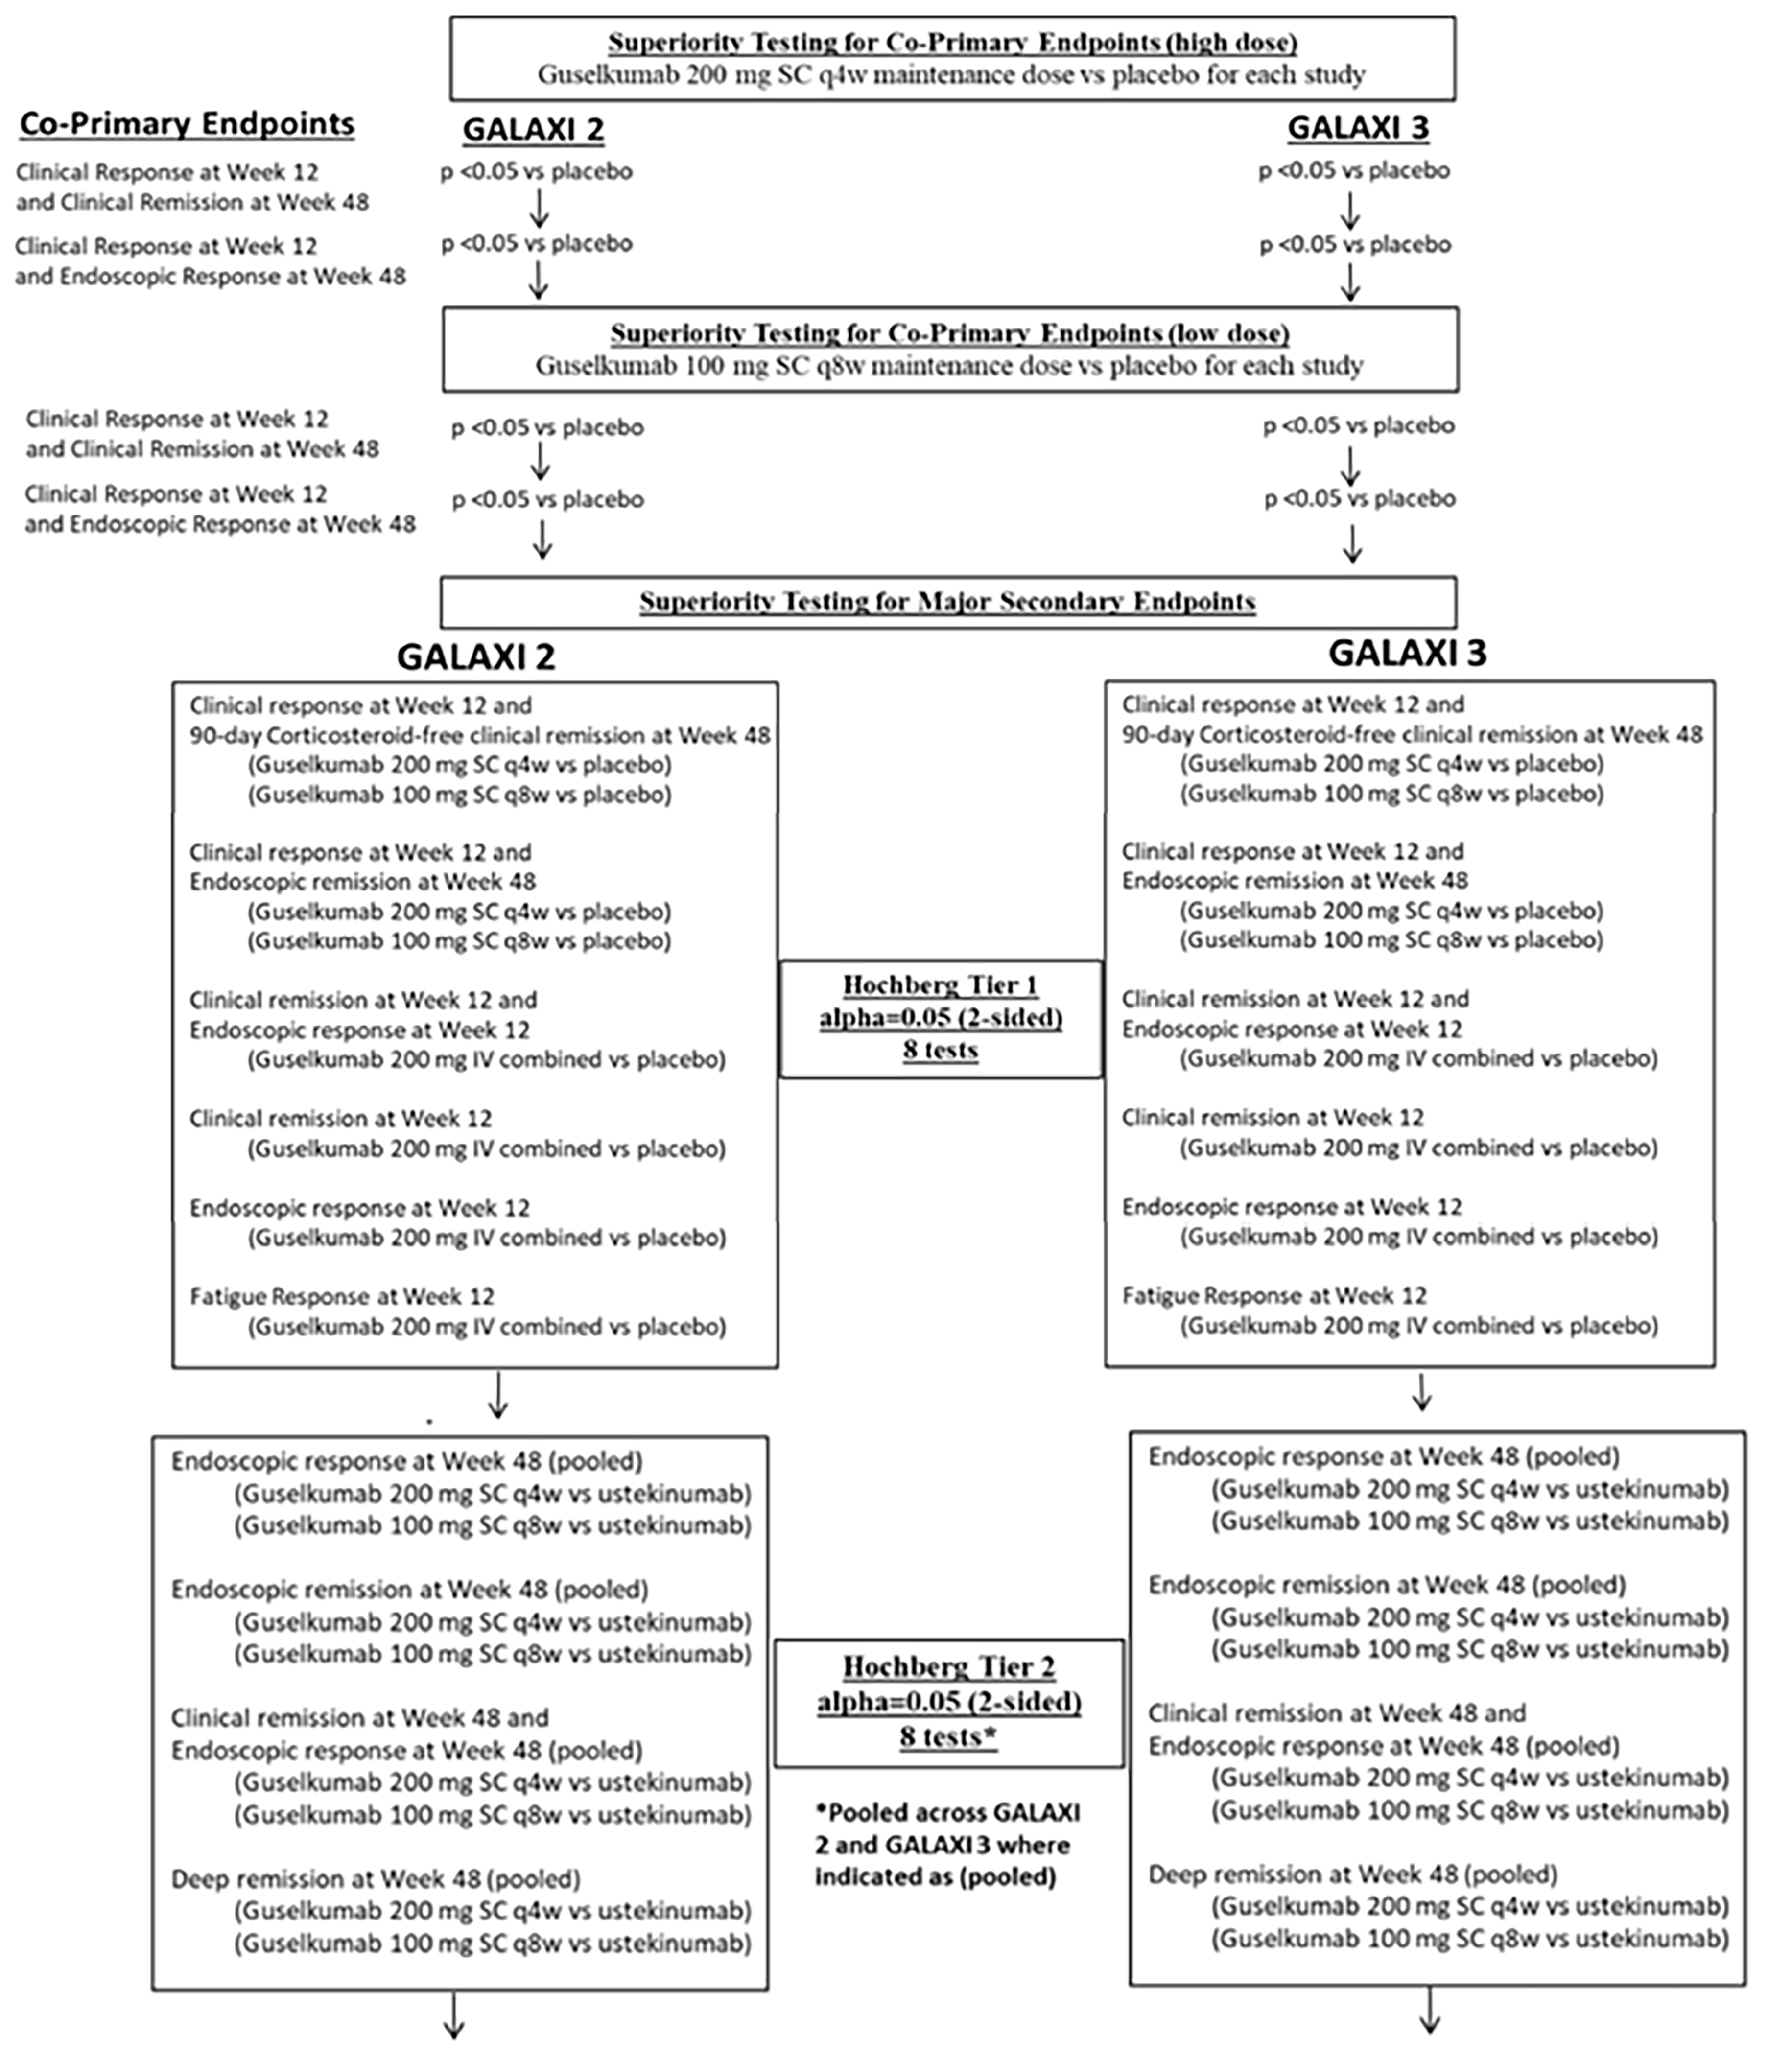
Pharmacoeconomic Review
Abbreviations
BIA
budget impact analysis
BIO-Failure
biologic therapy failure or intolerance
CD
Crohn disease
CDA-AMC
Canada’s Drug Agency
CON-Failure
conventional therapy failure or intolerance
NMA
network meta-analysis
Economic Review
The objective of the economic review is to review and critically appraise the pharmacoeconomic evidence submitted by the sponsor on the cost-effectiveness and budget impact of guselkumab compared to other biologics and conventional therapy (i.e., oral corticosteroids or immunomodulators [azathioprine, 6-mercaptopurine, and methotrexate]) for the treatment of adult patients with moderately to severely active Crohn disease (CD) whose disease has demonstrated an inadequate response or intolerance to previous conventional therapy or biologic therapy. Specifically, the population evaluated in the submitted model considered 2 distinct subgroups: patients with previous conventional therapy failure (CON-Failure) and those with previous biologic therapy failure (BIO-Failure). Together, these modelled subgroups were aligned with the population enrolled in the GALAXI 2 and GALAXI 3 trials but the modelled subgroups are narrower than the Health Canada indication, which does not restrict guselkumab to those who have experienced an inadequate response or intolerance to conventional therapy or biologic therapy.
Item | Description |
|---|---|
Drug product | Guselkumab (Tremfya), solution for injection |
Indication | For the treatment of adult patients with moderately to severely active Crohn’s disease |
Submitted price | $3,059.74 per 100 mg/mL prefilled syringe or patient-controlled injector $3,059.74 per 200 mg per 2 mL prefilled syringe or prefilled pen $3,059.74 per 200 mg per 20 mL vial for IV infusion |
Health Canada approval status | NOC |
Health Canada review pathway | Standard |
NOC date | July 7, 2025 |
Reimbursement request | Per indication |
Sponsor | Janssen Inc. |
Submission history | Previously reviewed: Yes Indication: For the treatment of adult patients with moderately to severely active ulcerative colitis. Recommendation date: NA Recommendation: NA Indication: For the treatment of adult patients with active psoriatic arthritis. Tremfya can be used alone or in combination with a cDMARD (e.g., methotrexate). Recommendation date: November 17, 2022 Recommendation: Reimburse with clinical criteria and/or conditions. Indication: For treatment of adult patients with moderate-to-severe plaque psoriasis who are candidates for systemic therapy or phototherapy. Recommendation date: February 21, 2018 Recommendation: Reimburse with clinical criteria and/or conditions. |
cDMARD = conventional disease-modifying antirheumatic drug; NA = not available; NOC = Notice of Compliance.
Key Messages
Guselkumab is available as a solution for injection (100 mg/mL or 200 mg per 2 mL). At the submitted price of $3,059.74 per vial, the annual cost of guselkumab is expected to range from $23,016 to $49,092 per patient in the first year of treatment and $19,957 to $39,913 per patient in subsequent years (depending on dose), based on the Health Canada recommended dosage.
Clinical efficacy in the economic analysis was derived from a sponsor-submitted network meta-analysis (NMA), with the efficacy of guselkumab informed by the GALAXI trials. Indirect evidence submitted by the sponsor suggests that guselkumab showed potential superiority over vedolizumab in achieving clinical remission and response, although its comparative efficacy against other drugs — such as ustekinumab, risankizumab, and upadacitinib — was more variable, with results differing across specific analyses (e.g., by treatment phase [i.e., induction or maintenance], by patient populations [i.e., CON-Failure or BIO-Failure]) and outcome measures. However, owing to the limitations of the NMA relating to the heterogeneity across studies and imprecision in the treatment effect estimates, no definitive conclusions can be drawn regarding the relative efficacy of guselkumab compared with other biologics (refer to the Clinical Review Report by Canada’s Drug Agency [CDA-AMC]).
Whether guselkumab will be associated with higher or lower drug costs to the health care system versus other biologics will depend on the proportion of patients on high versus low doses of guselkumab. Owing to the individualized approach to dosing in clinical practice, the relative total treatment costs of guselkumab compared to other biologics is uncertain.
The sponsor estimated that the budget impact of reimbursing guselkumab for the treatment of adult patients with moderately to severely active CD would be $15,264,551 over the first 3 years of reimbursement compared to the amount currently spent on comparators, with an estimated expenditure of $80,378,863 on guselkumab over this period. CDA-AMC was unable to provide a more robust estimate. The actual budget impact of reimbursing guselkumab will depend on the proportion of patients on high-dose guselkumab compared to low-dose guselkumab.
Given that the sponsor-submitted indirect evidence suggests that there may be no difference between guselkumab versus other biologics currently available for the treatment of adult patients with moderately to severely active CD, there is insufficient evidence to suggest that guselkumab should be priced higher than any other biologics for moderately to severely active CD. Thus, to ensure cost-effectiveness, guselkumab should be priced no more than the lowest-cost biologic that is funded for the treatment of adult patients with moderately to severely active CD.
Summary of the Submitted Economic Evaluation
The sponsor submitted a cost-utility analysis to estimate the cost-effectiveness of guselkumab from the perspective of a public health care payer in Canada over a lifetime horizon (60 years). The modelled population consisted of adult patients with moderately to severely active CD with prior inadequate response or intolerance to conventional therapy (CON-Failure) or biologic therapy (BIO-Failure). This population is narrower than the Health Canada population and was based on the participants in the GALAXI 2 and GALAXI 3 trials. The sponsor’s base-case analysis included costs related to drug acquisition, treatment administration, disease management, surgery and post-surgery, and adverse events. In the sponsor’s base case for the CON-Failure subgroup, guselkumab was dominated by adalimumab biosimilar and ustekinumab biosimilar (i.e., more costly and less effective). In the sponsor’s base case for the BIO-Failure analysis subgroup, guselkumab was dominated by ustekinumab biosimilar (i.e., more costly and less effective). The sponsor additionally submitted a key scenario analysis to address uncertainty in the analysis using head-to-head evidence comparing guselkumab to ustekinumab biosimilar from the GALAXI 2 and 3 trials. Results of this key scenario analysis and additional information about the sponsor’s submission are summarized in Appendix 3.
CDA-AMC identified several key issues with the sponsor’s analysis (refer to Table 2; full details are provided in Appendix 4).
Table 2: Key Issues With the Sponsor’s Economic Submission
Issue | What evidence is there to inform this issue? | How was this issue addressed by CDA-AMC? | Did CDA-AMC explore uncertainty in a scenario analysis? |
|---|---|---|---|
The comparative effectiveness of guselkumab relative to other biologics available for the treatment of moderately to severely active CD is uncertain. | There is limited head-to-head evidence comparing guselkumab to other biologics available for the treatment of moderately to severely active CD with the exception of ustekinumab. The results of the sponsor’s submitted NMA suggest that no definitive conclusions can be drawn on meaningful differences in the efficacy between guselkumab and other biologics currently available for the treatment of adult patients with moderately to severely active CD. | This issue could not be addressed. Given limitations with the sponsor’s NMA, it is uncertain whether guselkumab provides a clinical benefit greater than any of the currently available biologics for the treatment of moderately to severely active CD. The sponsor’s economic model was informed by the sponsor-submitted NMA, which suggested guselkumab is dominated by adalimumab biosimilar and ustekinumab biosimilar in the CON-Failure analysis subgroup and dominated by ustekinumab biosimilar in the BIO-Failure analysis subgroup (i.e., more costly and less effective). | No scenario analysis was conducted owing to a lack of more robust clinical data. |
There was uncertainty in the proportion of patients on a high vs. low dose of guselkumab. | The total drug acquisition cost of guselkumab is highly sensitive to the proportion of patients receiving high vs. low doses. Clinical expert input received by CDA-AMC noted an individualized approach to dosing in clinical practice but suggested that they would expect approximately 40% of patients to be on the high dose while the remainder would be on the low dose. | This issue could not be addressed. The proportion of patients on a high vs. low dose is anticipated to vary across jurisdictions with fewer patients on a high dose than has been assumed by the sponsor, and this is expected to impact total treatment costs. | No scenario analysis was conducted. |
BIO-Failure = biologic therapy failure or intolerance; CD = Crohn disease; CDA-AMC = Canada’s Drug Agency; CON-Failure = conventional therapy failure or intolerance; NMA = network meta-analysis; vs. = versus.
CDA-AMC Assessment of Cost-Effectiveness
Based on the CDA-AMC clinical review of the GALAXI trials, the available evidence suggests that treatment with guselkumab likely results in little to no difference in clinical remission at week 48 when compared with ustekinumab. Owing to the limitations of the NMA relating to the heterogeneity across studies and imprecision in the treatment effect estimates, no definitive conclusions can be drawn regarding the relative efficacy of guselkumab compared with other biologics. As such, no reanalyses were performed.
Summary of the Budget Impact Analysis
The sponsor submitted a budget impact analysis (BIA) to estimate the 3-year (2026 to 2028) budget impact of reimbursing guselkumab for the treatment of adult patients with moderately to severely active CD whose disease had demonstrated an inadequate response or intolerance to previous conventional therapy or biologic therapy. The sponsor calculated the budget impact for the CON-Failure and BIO-Failure analysis populations separately before aggregating to derive the budget impact for the reimbursement requested population. This is therefore narrower than the Health Canada population. The sponsor assumed that the payer would be public drug plans participating in the CDA-AMC reimbursement review process and derived the size of the eligible population using an epidemiologic approach. The unit price of guselkumab was aligned with the price included in the sponsor’s economic evaluation, while the prices of comparators were based on publicly available list prices. Additional information pertaining to the sponsor’s submission is provided in Appendix 5.
CDA-AMC identified a number of issues with the sponsor’s estimated budget impact that could not be addressed. The sponsor estimated that the budget impact of reimbursing guselkumab for use in the reimbursement population would be approximately $15,264,551 over the first 3 years, and that the 3-year expenditure on guselkumab (i.e., not accounting for current expenditure on comparators) is estimated to be $80.4 million. The estimated budget impact of reimbursing guselkumab for adults with moderately to severely active CD whose disease has demonstrated an inadequate response or intolerance to previous conventional therapy or biologic therapy will depend on the number of eligible patients and the proportion of patients on low-dose and high-dose guselkumab. The budget impact of reimbursement for the full Health Canada indication is unknown.
Conclusions
Based on the CDA-AMC clinical review of the GALAXI trials, treatment with guselkumab likely results in little to no difference in clinical remission at week 48 when compared with ustekinumab in adults with moderately to severely active CD. Results of the sponsor-submitted NMA did not show clear differences in the efficacy of guselkumab versus other currently available treatments. Given the uncertainty in the comparative clinical evidence, there is insufficient evidence to suggest that guselkumab should be priced higher than other biologics available for the treatment of moderately to severely active CD.
The sponsor estimated that the budget impact of reimbursing guselkumab for the treatment of moderately to severely active CD would be approximately $15,264,551 over the first 3 years. The sponsor estimated that 67,245 patients would be eligible for treatment over a 3-year period (year 1 = 21,186 patients; year 2 = 22,392 patients; and year 3 = 23,667 patients), of whom 1,117 patients are expected to receive guselkumab (year 1 = 220 patients; year 2 = 277 patients; year 3 = 621 patients). Scenarios conducted by CDA-AMC indicated that this finding is sensitive to the number of patients eligible for treatment and the proportion of patients on low versus high doses of guselkumab. Results of these scenarios ranged from $10,499,763 to $18,456,890 over the first 3 years of reimbursement.
The available evidence reviewed reflects the sponsor’s reimbursement request. The cost-effectiveness and budget impact of guselkumab for the full Health Canada indication is unknown.
References
1.Pharmacoeconomic evaluation [internal sponsor's report]. In: Drug Reimbursement Review sponsor submission: guselkumab (Tremfya), solution for injection [internal sponsor's package]. Toronto (ON): Janssen Inc.; 2025.
2.Exceptional Access Program (EAP). Ontario Ministry of Health; Ontario Ministry of Long-Term Care; 2024. Accessed March 6, 2025. http://www.health.gov.on.ca/en/pro/programs/drugs/odbf/odbf_except_access.aspx
3.Saskatchewan Drug Plan: search formulary. Accessed March 6, 2025, https://formulary.drugplan.ehealthsask.ca/SearchFormulary
4.McKesson Price List (Ontario). Accessed November 2024. 2024. Accessed by sponsor.
5.Canada's Drug Agency. Reimbursement Review: Risankizumab (SKYRIZI) in Crohn's Disease [sponsor supplied reference]. 2023. Accessed October 1, 2024. https://www.cda-amc.ca/risankizumab-0
6.Canada's Drug Agency. Reimbursement Review: Upadacitinib (RINVOQ) in Crohn's Disease [sponsor supplied reference]. 2024. Accessed October 1, 2024. https://www.cda-amc.ca/upadacitinib-4
7.Gregor JC, McDonald JW, Klar N, et al. An evaluation of utility measurement in Crohn's disease. Inflamm Bowel Dis. 1997;3(4):265-76. PubMed
8.S Danese SADLSJHPJFC. P376 Effects of IV vedolizumab on health-related quality of life and work productivity in patients with Crohn’s disease: results from the Phase 3b VERSIFY trial. Journal of Crohn's and Colitis. 2019;13(Issue Supplement_1):S293–S294.
9.Brown RE, Hutton J, Burrell A. Cost effectiveness of treatment options in advanced breast cancer in the UK. PharmacoEconomics. 2001;19(11):1091-102. doi:10.2165/00019053-200119110-00003 PubMed
10.Beusterien KM, Davies J, Leach M, et al. Population preference values for treatment outcomes in chronic lymphocytic leukaemia: a cross-sectional utility study. Health Qual Life Outcomes. 2010;8:50. doi:10.1186/1477-7525-8-50 PubMed
11.Beusterien KM, Szabo SM, Kotapati S, et al. Societal preference values for advanced melanoma health states in the United Kingdom and Australia. Br J Cancer. 2009;101(3):387-9. doi:10.1038/sj.bjc.6605187 PubMed
12.Hornberger J, Reyes C, Lubeck D, Valente N. Economic evaluation of rituximab plus cyclophosphamide, vincristine and prednisolone for advanced follicular lymphoma. Leuk Lymphoma. 2008;49(2):227-36. doi:10.1080/10428190701769665 PubMed
13.Porco TC, Lewis B, Marseille E, Grinsdale J, Flood JM, Royce SE. Cost-effectiveness of tuberculosis evaluation and treatment of newly-arrived immigrants. BMC Public Health. 2006;6:157. doi:10.1186/1471-2458-6-157 PubMed
14.CDA-AMC. Reimbursement Review: Guselkumab for ulcerative colitis. Accessed April 11, 2025, https://www.cda-amc.ca/guselkumab-1
15.CDA-AMC. Reimbursement Review: Mirikizumab for crohn’s disease. Accessed April 11, 2025, https://www.cda-amc.ca/mirikizumab-0
16.Budget Impact Analysis [internal sponsor's report]. In: Drug Reimbursement Review sponsor submission: guselkumab (Tremfya), solution for injection [internal sponsor's package]. Toronto (ON): Janssen Inc.; 2025.
17.The Conference Board of Canada. Understanding the Gap 2.0. 2022. Accessed May 8, 2025. https://www.conferenceboard.ca/wp-content/uploads/2022/10/understanding-the-gap-2.0_2022.pdf
Appendix 1: Cost Comparison Table
Please note that this appendix has not been copy-edited.
The comparators presented in the following table have been deemed to be appropriate based on feedback from clinical experts and CDA-AMC–participating public drug plans. Comparators may be recommended (appropriate) practice or actual practice. Existing Product Listing Agreements are not reflected in the table and as such, the table may not represent the actual costs to public drug plans.
Table 3: Cost Comparison for Crohn Disease
Treatment | Strength and/or concentration | Form | Price ($) | Recommended dosage | Daily cost ($) | Annual cost ($)a |
|---|---|---|---|---|---|---|
Guselkumab (Tremfya) | 100 mg/ mL 200 mg/ 2 mL | Prefilled syringe, prefilled pen or autoinjector SC injection | 3,059.7400a | Induction: 200 mg by IV infusion at weeks 0, 4, and 8 or 400 mg by SC infusion at weeks 0, 4, and 8 Maintenance: 100 mg by SC infusion at week 16 and every 8 weeks thereafter or 200 mg SC infusion at week 12 and every 4 weeks thereafter | Year 1: 63.02 to 134.41 Year 2+: 54.64 to 109.28 | Year 1: 23,016 to 49,092 Year 2+: 19,957 to 39,913 |
200 mg/ 20 mL | Vial for IV infusion | |||||
TNF-alpha inhibitors | ||||||
Adalimumab (Humira) | 40 mg/ 0.8 mL 20 mg/ 0.2 mL | Pen or prefilled syringe for SC injection | 794.1000b 397.0500b | Induction: 160 mg at week 0, followed by 80 mg at week 2 by SC infusion Maintenance: 40 mg every other week beginning at week 4 | Year 1: 65.42 Year 2+: 56.72 | Year 1: 23,894 Year 2+: 20,718 |
Adalimumab (biosimilar) | 20 mg/ 0.2 mL 40 mg/ 0.4 mL 40 mg/ 0.8 mL 80 mg/ 0.8 mL | Pen or prefilled syringe for SC injection | 235.6350 471.2700 471.2700 942.5400 | Year 1: 38.82 Year 2+: 33.66 | Year 1: 14,180 Year 2+: 12,295 | |
Infliximab (Remicade) | 100 mg | Vial for IV infusion | 987.5600b | Induction: 5 mg/kg at weeks 0, 2, and 6 Maintenance: 5 mg/kg every 8 weeks thereafter | Year 1: 84:06 Year 2+: 70.54 | Year 1: 30,703 Year 2+: 25,765 |
Infliximab biosimilar (Inflectra) | 100 mg | Vial Powder for IV infusion | 525.0000 | Year 1: 44.69 Year 2+: 37.50 | Year 1: 16,322 Year 2+: 13,697 | |
Infliximab (biosimilar [Renflexis or Avsola]) | 100 mg | Vial Powder for IV infusion | 493.0000 | Year 1: 41.96 Year 2+: 35.21 | Year 1: 15,327 Year 2+: 12,862 | |
IL-23 Inhibitors | ||||||
Risankizumab (Skyrizi) | 360 mg/2.4 mL | Vial for SC Injection | 4,593.1400b | Induction: 600 mg by IV infusion at weeks 0, 4, and 8 Maintenance: 360 mg administered by SC injection at week 12, and every 8 weeks thereafter | Year 1: 100.88 Year 2+: 82.02 | Year 1: 36,848 Year 2+: 29,958 |
600 mg/10 mL | IV injection | |||||
JAK-inhibitor | ||||||
Upadacitinib (Rinvoq) | 15 mg 30 mg 45 mg | Extended-release tablet | 51.6810 76.9600 101.8100 | Induction: 45 mg once daily for 12 weeks Maintenance: 15 mg or 30 mg once daily based on patient presentation | Year 1: 63.21 to 82.67 Year 2+: 51.68 to 76.96 | Year 1: 23,087 to 30,197 Year 2+: 18,876 to 28,110 |
IL 12/23 inhibitor | ||||||
Ustekinumab (Stelara) | 45 mg/ 0.5 mL 90 mg/ 1.0 mL | Prefilled syringe or vial for SC injection | 4,593.1400 4,593.1400 | Induction: 6 mg/kg IV at week 0 Maintenance: 90 mg SC every 8 weeks thereafter | Year 1: 92.22 Year 2+: 82.02 | Year 1: 33,685 Year 2+: 29.958 |
130 mg/ 26 mL | Vial for IV infusion | 2,080.0000c | ||||
Ustekinumab (biosimilar [Wezlana]) | 45 mg/ 0.5 mL 90 mg/ 1.0 mL | Prefilled syringe or vial for SC injection | 2,755.8840 2,755.8840 | Year 1: 55.33 Year 2+: 49.21 | Year 1: 20,211 Year 2+: 17,975 | |
130 mg/ 26 mL | Vial for IV infusion | 1,248.0000 | ||||
Alpha 4 beta 7 integrin antagonists | ||||||
Vedolizumab (Entyvio) | 300 mg | Vial for IV infusion | 3,571.9500b | Induction: 300 mg by IV infusion at weeks 0, 2, and 6 Maintenance: 300 mg by IV infusion every 8 weeks thereafter | Year 1: 76.01 Year 2+: 63.78 | Year 1: 27,762 Year 2+: 23,297 |
JAK = Janus kinase; IL = interleukin; SC = subcutaneous; TNF = tumour necrosis factor.
Note: All prices are from the Ontario Drug Benefit Formulary (accessed March 2025), unless otherwise indicated, and do not include dispensing fees. Recommended dosing as per respective product monograph. Assumes 365 days and an average patient weight of 75 kg.
aSponsor-submitted price.1
bOntario Exceptional Access Program.2
cSaskatchewan Drug Plan formulary.3
Appendix 2: Input Relevant to the Economic Review
Please note that this appendix has not been copy-edited.
This section is a summary of the input received from the patient groups, clinician groups, and drug plans that participated in the CDA-AMC review process.
Patient input was received from the Gastrointestinal Society and Crohn’s and Colitis Canada. Input was gathered from patients living in Canada with irritable bowel disease (some of whom had CD) via a series of surveys. Patient input indicated that CD has a significant impact on all elements of an individual’s life, including physical, emotional, and social well-being. While there are many treatments (both conventional and biologic) available, there remains an unmet need as many patients have difficulty obtaining remission or adequate symptom relief. Patient input further noted the need for access to more treatment options particularly those that are easy to administer, noninvasive, has minimal side effects, and can improve their ability to participate in activities of daily living. Of the respondents, none had experience with guselkumab for CD.
Clinician group input was not received for this review.
Input from CDA-AMC–participating drug plans questioned if the scores used for trial eligibly (i.e., Crohn’s Disease Activity Index or Simple Endoscopic Score for Crohn’s Disease) were reflective of clinical practice in Canada. They additionally inquired about which scoring tool should be used to measure baseline disease. Finally, the drug plans noted that the submitted economic analysis only considered public list prices of comparators.
Appendix 3: Summary of the Sponsor’s Submission
Please note that this appendix has not been copy-edited.
Summary of the Sponsor’s Economic Evaluation
For the pharmaceutical reviews program, clinical and economic information is submitted to CDA-AMC by the sponsor. The CDA-AMC health economics team reviews the submitted economic information and appraises the information in collaboration with clinical experts and the clinical review team to evaluate key assumptions, influential parameters, and the overall rigour of the economic submission. Based on what the team learns through this process, adjustments may be made to the sponsor’s model to produce the CDA-AMC base case. The CDA-AMC base case represents the team’s current understanding of the clinical condition, clinical evidence currently available, and best interpretation of the economic evidence based on the information provided.
For the review of guselkumab, the sponsor provided a cost-utility analysis and a budget impact analysis. The sponsor’s economic submission is summarized in Table 4.
Table 4: Key Components of the Sponsor’s Economic Evaluation
Component | Description |
|---|---|
Treatment information | |
Drug under review | Guselkumab (Tremfya/ Tremfya IV), IV solution (200 mg/ 20mL) and SC solution (100 mg /1mL, 200 mg/ 2mL, 200 mg/1 mL) |
Submitted price of drug under review | $3,059.7400 per syringe/ vial |
Regimen | Induction: 200 mg at week 0, 4, and 8 Maintenance: 100 mg every 8 weeks or 200 mg every 4 weeks |
Cost of drug under review | Induction: $9,179 per patient (8 weeks) Maintenance: $29,935a per patient per year |
Model information | |
Type of economic evaluation | Cost-utility analysis Decision tree + Markov model |
Treatment | Guselkumab |
Included comparators |
|
Perspective | Publicly funded health care payer perspective |
Time horizon | Lifetime (60 years) |
Cycle length | Decision tree: Not applicable Markov model: 2 weeks |
Modelled populations | Adult patients with moderately to severely active CD whose disease has demonstrated an inadequate response or intolerance to previous conventional therapy (CON-Failure analysis subgroup) or biologic therapies (BIO-Failure subgroup) |
Characteristics of modelled population | Pooled across the GALAXI 2/3 trials CON-Failure: mean age of 36 years, 56.9% male, mean weight of 68.9 kg BIO-Failure: mean age of 36.9 years, 58.2% male, mean weight of 67.53 kg |
Model health states | Decision Tree:
Markov Model:
For additional information, refer to Model Structure |
Data sources | |
Comparative efficacy |
|
Natural history and/or clinical pathway |
|
Costs included in the model |
|
Health-related utilities and disutilities |
|
Summary of the submitted results | |
Base-case results |
|
Scenario analysis results |
|
6-MP = 6-mercaptopurine; AE = adverse event; BIO-Failure = biologic therapy failure or intolerance; CD = Crohn disease; CIHI = Canadian Institute for Health Information; CON-Failure = conventional therapy failure or intolerance; ED = emergency department; ICER = incremental cost-effectiveness ratio; MXT = methotrexate; NMA = network meta-analysis; QALY = quality-adjusted life-year.
aSponsor assumed that 50% of patients would receive 100 mg every 8 weeks maintenance dose, while 50% of patients would receive 200 mg every 4 weeks maintenance dose.
Model Structure
The sponsor submitted a model that consisted of a decision tree (representing the induction phase; Figure 1) and Markov model (representing the maintenance phase and surgery; Figure 2).1 Patients entered the decision tree and were then distributed across 4 health states (i.e., remission, response without remission, active CD, or death). At the end of the decision tree (i.e., completion of the induction phase), patients entered the Markov model in the corresponding health state. Of note, patients in the active CD health state of the decision tree were modelled to switch to a subsequent line of therapy.1
The Markov model included 8 health states (remission, response without remission, active CD, surgery, postsurgery with no disease recurrence, postsurgery with disease recurrence, and death). Patients in the remission and remission without response could either stay in their health state and continued maintenance treatment or transition out if they experienced a loss of response.1 Patients who experience a loss of response to first-line or second-line treatment were modelled to re-enter the decision tree for subsequent line of therapy, otherwise patients who experienced a loss of treatment response to third-line treatment transitioned to active CD. From active CD, patients could remain or transition to surgery. Patients remained in the surgery health state for 8 weeks. After surgery, all patients in the base-case analysis transitioned to the postsurgery without disease recurrence health state but remained at risk for disease recurrence.1 Once within a postsurgery health state, patients could either remain or could transition to the other postsurgery health state. A proportion of patients in the postsurgery disease recurrence could also experience surgery again. In the base case, patients could only experience 2 possible surgeries. At any point, patients could experience death.
Figure 1: Model Structure (Decision Tree)
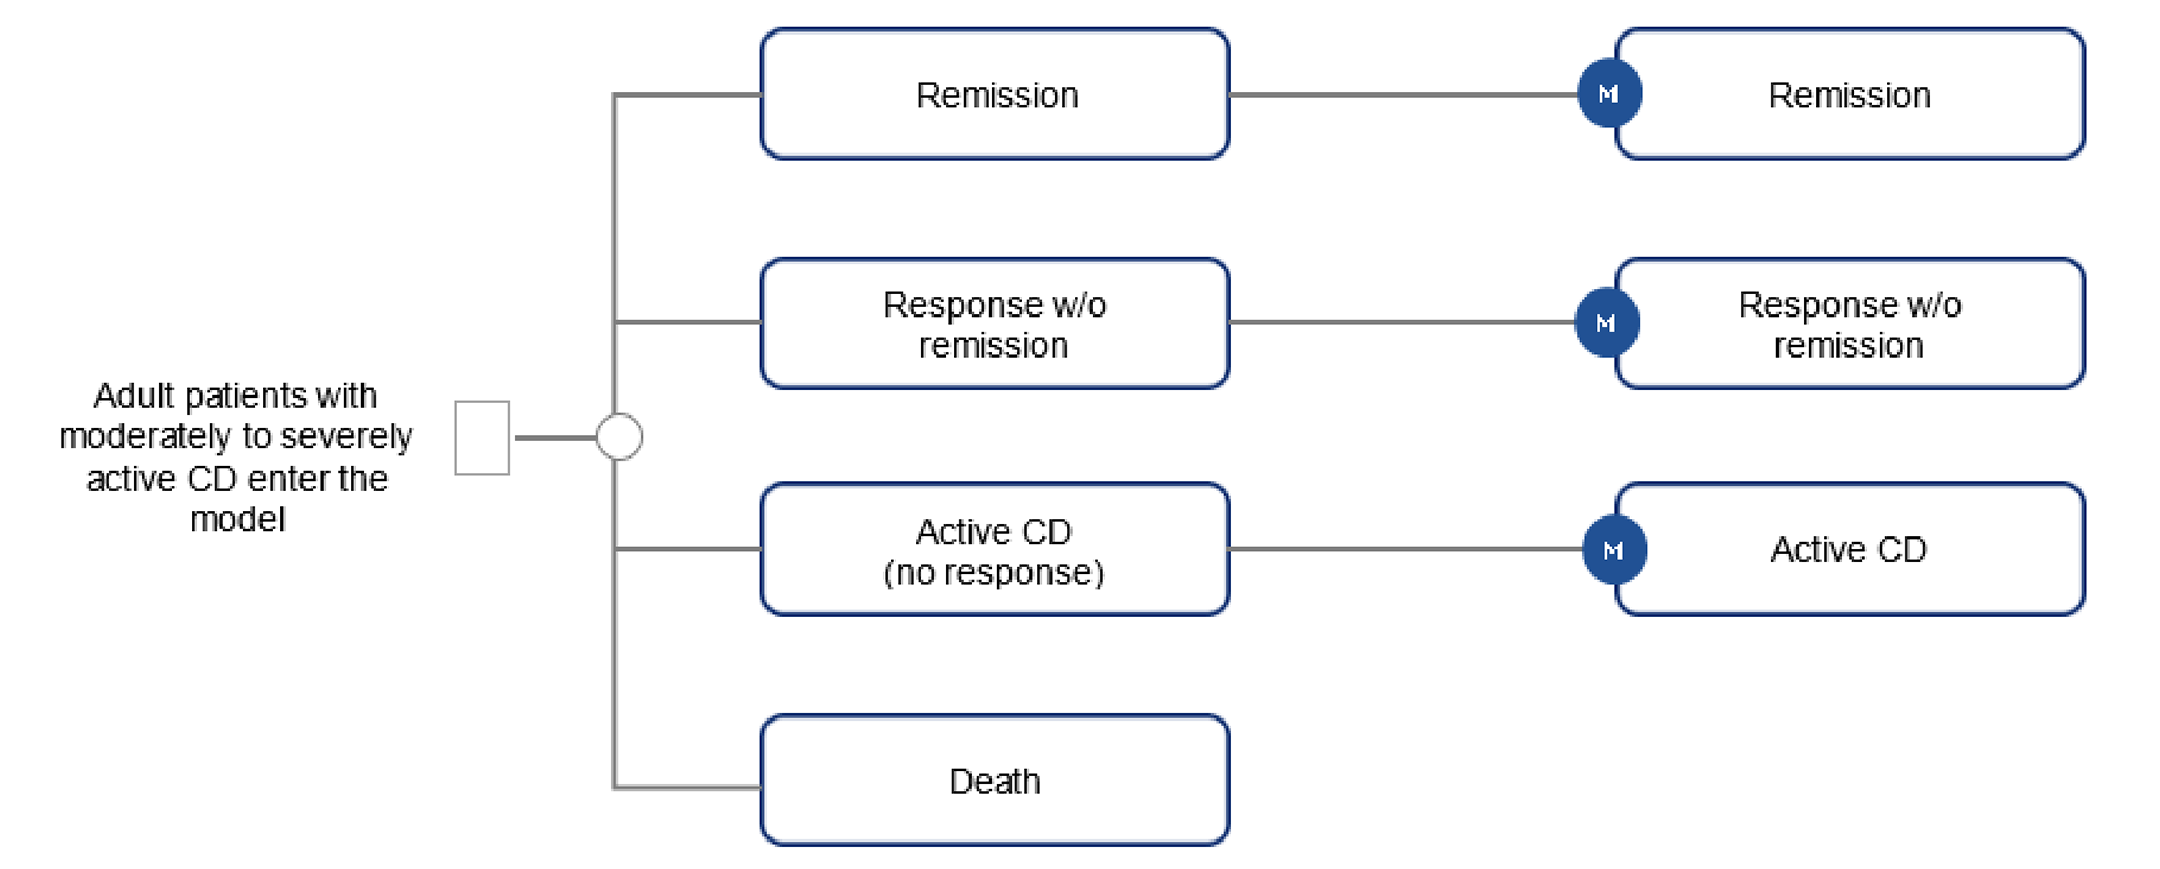
CD = Crohn disease; M = Markov model; w/o = without.
Source: Sponsor’s pharmacoeconomic submission.1
Figure 2: Model Structure (Markov Model)
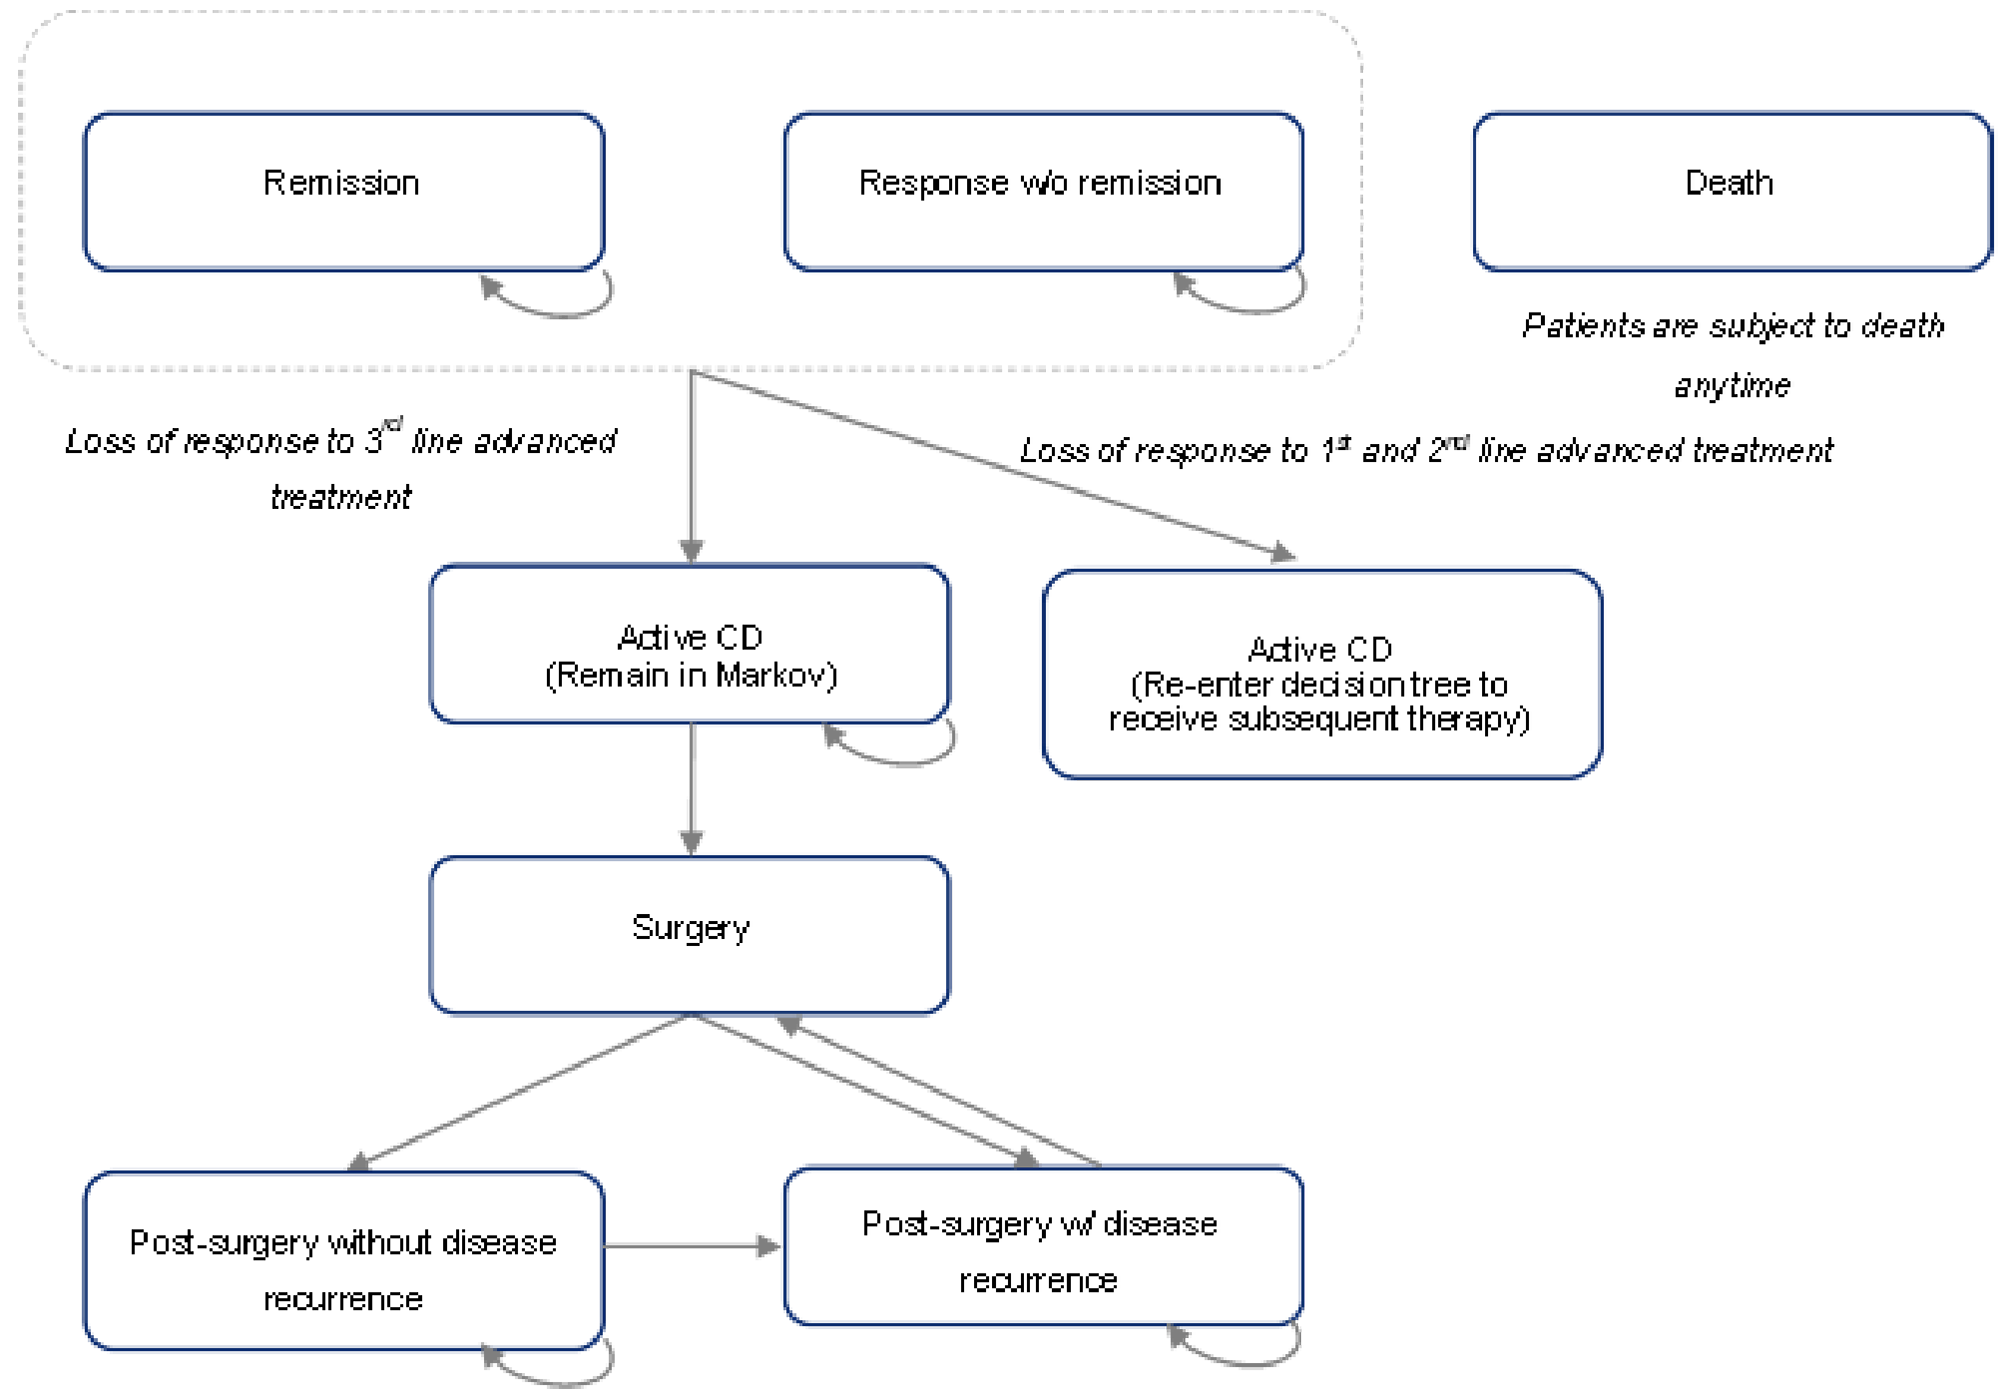
CD = Crohn disease; w/o = without.
Source: Sponsor’s pharmacoeconomic submission.1
Appendix 4: Additional Details of CDA-AMC Reanalyses
Please note that this appendix has not been copy-edited.
Clinical Data in the Economic Model
The CDA-AMC clinical review found that guselkumab likely results in little to no difference in clinical remission at week 48 when compared with ustekinumab. However, given the absence of head-to-head evidence comparing guselkumab to most comparators, the sponsor submitted an NMA to inform comparative effectiveness for various parameters in the economic model including clinical remission and clinical response. Owing to the limitations of the NMA relating to the heterogeneity across studies and imprecision in the treatment effect estimates (refer to Clinical Review Report), no definitive conclusions can be drawn on meaningful differences in the relative efficacy of guselkumab compared with other biologics.
Based on the information from this NMA, the sponsor’s economic model predicted that guselkumab is dominated by adalimumab biosimilar and ustekinumab biosimilar in the CON-Failure subgroup and dominated by ustekinumab biosimilar in the BIO-Failure subgroup (i.e., more costly and less effective). In the CON-Failure subgroup, the total expected quality-adjusted life-years associated with guselkumab was 21.26 compared to 21.37 and 22.48 for adalimumab biosimilar and ustekinumab biosimilar, respectively, over a patient’s lifetime. In the BIO-Failure subgroup, the total expected quality-adjusted life-years associated with guselkumab was 13.62 compared to ustekinumab biosimilar which was 13.71 over a patient’s lifetime.
Key Issues of the Submitted Economic Evaluation
CDA-AMC identified the following key issues with the sponsor’s analysis:
The comparative clinical efficacy and safety of guselkumab relative to other biologics available for the treatment of moderately to severely active CD is uncertain. The results of the GALAXI 2 and GALAXI 3 trial suggest with moderate certainty that guselkumab likely results in little to no difference in clinical remission at week 48 when compared with ustekinumab. There is a lack of head-to-head evidence comparing guselkumab to other advanced biologics currently available for the treatment of moderately to severely active CD. In the absence of head-to-head evidence for most comparators, the sponsor conducted an NMA to inform comparative efficacy (i.e., clinical remission and clinical response) within the economic model. Indirect evidence submitted by the sponsor suggests that guselkumab often showed potential advantages over vedolizumab in achieving clinical remission and response; although its comparative efficacy against other drugs — such as ustekinumab, risankizumab, and upadacitinib — was more variable, with results differing across specific analyses (e.g., by treatment phase [i.e., induction or maintenance], by patient populations [i.e., CON-Failure or BIO-Failure]) and outcome measures. However, considerable heterogeneity across the included studies was observed in methodology, baseline patient population, outcome definition, and time points of outcome measurement. Across many comparisons, wide credible intervals were observed reflecting the substantial uncertainty in effect estimation. Together, the heterogeneity across studies and imprecision in the treatment effect estimates limit definitive conclusions about comparative efficacy against other biologics.
While the sponsor did submit a key pairwise scenario analysis between guselkumab and ustekinumab biosimilar using direct head-to-head data from the GALAXI 2 and 3 trials, interpretation of this scenario is limited as it is unable to inform the comparative efficacy against all relevant biologics.
Due to the lack of direct comparative evidence for guselkumab and most comparators, along with limitations with the sponsor’s submitted NMA, it is uncertain if guselkumab provides a net benefit greater than any of the currently available treatments of adult patients with moderately to severely active CD.
The proportion of patients receiving high versus low doses of guselkumab is uncertain. The sponsor assumed an even split between the proportion of patients who would receive a low versus high dose of guselkumab. This approach is uncertain for several reasons. Clinical expert feedback for this review noted that dosing in clinical practice is highly individualized. Patients who have not experienced improvement with conventional therapy are more likely to be prescribed low-dose guselkumab in clinical practice while patients who have not experienced improvement with another biologic would be more likely to be prescribed high-dose guselkumab.
No scenario analysis was conducted. Clinical expert input received by CDA-AMC noted that approximately 40% of patients would be on high dose with the remainder on low dose. This introduces uncertainty around the relative total treatment costs of guselkumab compared to other biologics.
Issues for Consideration
Guselkumab is currently under review at CDA-AMC for the treatment of adult patients with moderately to severely active ulcerative colitis.14
The indication for guselkumab does not restrict use to patients whose disease has had an inadequate response or intolerance to conventional therapy or advanced therapy (i.e., target population of cost-utility analysis). Clinical expert input received by CDA-AMC indicated that patients who had not previously been treated with conventional therapy would likely not be considered for treatment with guselkumab. However, the cost-effectiveness among patients who are conventional therapy-naive is unknown owing to a lack of clinical data.
Mirikizumab is currently under review at CDA-AMC for the treatment of adult patients with moderately to severely active CD who have had an inadequate response, loss of response, or were intolerant to either conventional therapy or a biologic treatment.15 The cost-effectiveness of guselkumab compared to mirikizumab for this patient population is unknown.
The sponsor’s analysis relies on publicly accessible list prices and do not reflect existing confidential prices negotiated by public drug plans. Given many comparators have successfully undergone price negotiations for the treatment of moderately to severely active CD, it is likely that current unit costs paid by the public drugs plans are lower than the public list price.
Appendix 5: Budget Impact Analysis
Please note that this appendix has not been copy-edited.
Summary of the Sponsor’s BIA
The sponsor submitted a BIA that estimated the expected incremental budgetary impact of reimbursing guselkumab for the treatment of adult patients with moderately to severely active CD whose disease has demonstrated an inadequate response or intolerance to previous conventional therapy or biologic therapy. The BIA was conducted from the perspective of public drug plan payers over a 3-year time horizon (2026 to 2028), with 2025 as the base year. The sponsor’s estimate reflects the aggregated results from the jurisdictional provincial budgets (excluding Quebec) as well as the Non-Insured Health Benefits Program. The sponsor estimated the eligible population using an epidemiological approach. The sponsor’s base case included drug acquisition costs. The market uptake for guselkumab was estimated using market uptake estimates for other IL-23 treatments in prior submission along with Janssen Market research. The key inputs to the BIA are documented in Table 5.
The sponsor estimated the 3-year incremental budget impact associated with reimbursing guselkumab for the treatment of adult patients with moderately to severely active CD whose disease has demonstrated an inadequate response or intolerance to previous conventional therapy or biologic therapy would be $15,264,551 (year 1 = $3,387,771; year 2 = $3,965,366; year 3 = $7,911,414).
Parameter | Sponsor’s estimate (reported as year 1 / year 2 / year 3 if appropriate) |
|---|---|
Target population | |
Total pan-Canadian (excluding Quebec) population (2025) | 27,178,558 |
Annual growth rate | 3.30% |
% of the population ages 18 to 64 years | 76.7% |
% of the population ages 65+ years | 23.3% |
Prevalence of CD (18 to 64 years) | 0.535% |
Prevalence of CD (65+ years) | 0.530% |
Prevalence growth rate (18 to 64 years) | 2.15% |
Prevalence growth rate (65+ years) | 2.88% |
% of patients with moderate to severe disease | 33.96% |
% of diagnosed patients who receive an advanced therapy | 78.16% |
% CON-Failure | 42.65% |
% BIO-Failure | 57.35% |
% eligible for public coverage | 52.02% |
Number of patients eligible for drug under review | 21,186 / 22,392 / 23,667 |
Market shares (reference scenario) | |
CON-Failure | |
Guselkumab | 0% / 0% / 0% |
Ustekinumab biosimilar | 7.54% / 8.46% / 8.61% |
Adalimumab biosimilar | 17.42% / 15.49% / 13.50% |
Infliximab biosimilar | 27.01% / 25.75% / 23.78% |
Vedolizumab | 15.02% / 13.84% / 12.42% |
Risankizumab | 22.82% / 25.56% / 28.81% |
Upadacitinib | 10.19% / 10.90% / 12.88% |
Conventional therapy | 0% / 0% / 0% |
BIO-Failure | |
Guselkumab | 0% / 0% / 0% |
Ustekinumab biosimilar | 4.86% / 5.52% / 5.68% |
Adalimumab biosimilar | 16.52% / 14.86% / 13.10% |
Infliximab biosimilar | 28.22% / 27.20% / 25.41% |
Vedolizumab | 20.82% / 19.39% / 17.61% |
Risankizumab | 20.70% / 23.44% / 26.72% |
Upadacitinib | 8.88% / 9.60% / 11.48% |
Conventional therapy | 0% / 0% / 0% |
Market shares (new drug scenario) | |
BIO-Failure | |
Guselkumab | 2.43% / 2.90% / 6.15% |
Ustekinumab biosimilar | 7.35% /8.21% / 8.08% |
Adalimumab biosimilar | 16.99% / 15.04% / 12.67% |
Infliximab biosimilar | 26.35% / 25.00% / 22.32% |
Vedolizumab | 14.65% / 13.44% / 11.66% |
Risankizumab | 22.27% / 24.82% / 27.04% |
Upadacitinib | 9.95% / 10.58% / 12.09% |
Conventional therapy | 0% / 0% / 0% |
CON-Failure | |
Guselkumab | 2.43% / 2.90% / 6.15% |
Ustekinumab biosimilar | 4.74% / 5.36% / 5.33% |
Adalimumab biosimilar | 16.12% / 14.43% / 12.29% |
Infliximab biosimilar | 27.53% / 26.41% / 23.85% |
Vedolizumab | 20.31% / 18.83% / 16.53% |
Risankizumab | 20.19% / 22.76% / 25.08% |
Upadacitinib | 8.67% / 9.32% / 10.78% |
Conventional therapy | 0% / 0% / 0% |
Cost of treatment (per patient per year), year 1 / year 2+ | |
Guselkumab | $31,362 / $29,832 |
Ustekinumab biosimilar | $18,779 / $17,913 |
Adalimumab biosimilar | $14,138 / $12,253 |
Infliximab biosimilar | $19,297 / $18,311 |
Vedolizumab | $34,214 / $30,601 |
Risankizumab | $38,454 / $32,078 |
Upadacitinib | $27,421 / $24,530 |
Conventional therapy | $604 / $471 |
BIO-Failure = biologic therapy failure or intolerance; CD = Crohn disease; CON-Failure = conventional therapy failure or intolerance.
Key Issues of the Submitted BIA
CDA-AMC identified several key issues to the sponsor’s analysis that have notable implications on the results of the BIA:
The modelled population is not aligned with the Health Canada indication. The target population captured within the BIA model reflects the modelled population within the economic evaluation. However, as noted previously, this population is narrower than the Health Canada indication which does not restrict guselkumab treatment to those whose disease has had an inadequate response or intolerance to conventional therapy or biologic therapy.
CDA-AMC was unable to address this limitation. Should guselkumab be reimbursed for the full Health Canada indication the budget impact will increase.
The market share estimates does not align with clinical expectations: In the sponsor’s submitted BIA, market share estimates were informed by internal market research for the CON-Failure and BIO-Failure subgroups separately. CDA-AMC obtained clinical expert feedback suggests that the proposed market share estimates are likely to be slightly higher for upadacitinib and lower for vedolizumab for the BIO-Failure subgroups.
CDA-AMC conducted a scenario analysis using alternative market share estimates for the BIO-Failure subgroups. Specifically, the market shares were revised such that upadacitinib had 5% more market shares while vedolizumab had 5% fewer market shares within the reference scenario and across the full modelled time horizon. This correspondingly impacted the new drug scenario as market shares upadacitinib were increased to 15.43%, 13.98%, 11.83% and lowered for vedolizumab to 13.55%, 14.18%, 15.47%, in year 1, year 2, and year 3, respectively.
The portion of patients eligible for public drug coverage is uncertain. The sponsor estimated that 52.02% of patients in both the 18 to 64 years old cohort and 65 and older cohort had public drug coverage based on previous claims-based data for all treatments publicly reimbursed for CD with at least 1 claim.16 CDA-AMC notes that the sponsor may have underestimated the proportion of patients eligible for public drug coverage, specifically for adults aged 65 years and older. Published literature estimates that the proportion of patients eligible for public drug coverage aged 65 years and older in Canada to be 98.8%.17
CDA-AMC conducted a scenario analysis which assumed the proportion of patients aged 65 years and older eligible for public coverage was 98.8%.
The proportion of patients on high-dose versus low-dose guselkumab maintenance treatment is uncertain. In the sponsor’s submitted model, it was assumed that 50% of patients would receive high dose guselkumab maintenance treatment, while the remaining would receive the lower dose. As noted in Appendix 4, clinical expert feedback received by CDA-AMC noted that there are many factors that could impact which maintenance dose a patient may receive including a patient’s BIO-experience status. It was noted that clinicians would generally start patients on lower dose maintenance, especially those who are CON-Failure, and increase dosage as needed. BIO-experienced patients with nonresponse in the initiation phase would be more likely to be prescribed the high maintenance dose of guselkumab.
CDA-AMC conducted a scenario analysis using inputs of 60% on low-dose and 40% on high-dose guselkumab maintenance treatment.
The price of drugs paid by public drug plans is uncertain. The analyses of both the sponsor and CDA-AMC are based on publicly available list prices for all comparators. The actual costs paid by public drug plans are unknown.
CDA-AMC was unable to address this limitation.
CDA-AMC Reanalyses of the BIA
In the absence of more reliable estimates to inform the key parameters of the BIA, the sponsor’s submitted base case was maintained. However, CDA-AMC conducted scenario analyses to explore the impact of uncertainty of the market share estimates of comparators, the proportion of patients on high-dose versus low-dose guselkumab maintenance, and the proportion of patients eligible for public drug coverage.
The results of these scenario analyses suggest that the budget impact of reimbursing guselkumab is sensitive to the number of patients expected to receive treatment.
Table 6: Disaggregated Summary of the BIA
Stepped analysis | Scenario | Year 0 (current situation) ($) | Year 1 ($) | Year 2 ($) | Year 3 ($) | Three-year total ($) |
|---|---|---|---|---|---|---|
Submitted base case | Reference total | 504,491,973 | 498,188,677 | 531,583,882 | 574,921,660 | 1,604,694,219 |
Guselkumab | 0 | 0 | 0 | 0 | 0 | |
Ustekinumab biosimilar | 21,515,956 | 22,887,741 | 27,370,092 | 29,488,458 | 79,746,291 | |
Adalimumab biosimilar | 53,869,429 | 43,882,404 | 41,505,828 | 38,477,516 | 123,865,748 | |
Infliximab biosimilar | 118,625,192 | 107,464,683 | 109,067,527 | 107,108,028 | 323,640,237 | |
Vedolizumab | 140,200,271 | 118,937,152 | 116,657,394 | 111,497,833 | 347,092,379 | |
Risankizumab | 130,554,320 | 154,347,184 | 180,419,642 | 216,515,734 | 551,282,560 | |
Upadacitinib | 39,726,806 | 50,669,514 | 56,563,399 | 71,834,091 | 179,067,004 | |
Conventional therapy | 0 | 0 | 0 | 0 | 0 | |
New drug total | 504,491,973 | 501,576,448 | 535,549,248 | 582,833,074 | 1,619,958,771 | |
Guselkumab | 0 | 16,145,747 | 19,578,030 | 44,655,086 | 80,378,863 | |
Ustekinumab biosimilar | 21,515,956 | 22,307,458 | 26,571,183 | 27,632,246 | 76,510,887 | |
Adalimumab biosimilar | 53,869,429 | 42,816,061 | 40,302,159 | 36,111,149 | 119,229,369 | |
Infliximab biosimilar | 118,625,192 | 104,853,291 | 105,877,372 | 100,520,884 | 311,251,547 | |
Vedolizumab | 140,200,271 | 116,046,980 | 113,274,329 | 104,640,716 | 333,962,025 | |
Risankizumab | 130,554,320 | 150,070,455 | 175,050,300 | 202,070,350 | 527,191,104 | |
Upadacitinib | 39,726,806 | 49,336,457 | 54,895,875 | 67,202,644 | 171,434,976 | |
Conventional therapy | 0 | 0 | 0 | 0 | 0 | |
Budget Impact | 0 | 3,387,771 | 3,965,366 | 7,911,414 | 15,264,551 | |
CDA-AMC scenario analyses | ||||||
Scenario 1: Alternative Market Share Estimates | Reference total | 500,587,327 | 494,594,841 | 527,785,449 | 570,906,946 | 1,593,287,236 |
New drug total | 500,587,327 | 498,029,557 | 531,852,714 | 579,004,927 | 1,608,887,198 | |
Budget Impact | 0 | 3,434,716 | 4,067,265 | 8,097,981 | 15,599,962 | |
Scenario 2: Proportion eligible for public drug coverage | Reference total | 609,998,448 | 602,376,917 | 642,756,198 | 695,157,383 | 1,940,290,498 |
New drug total | 609,998,448 | 606,473,187 | 647,550,858 | 704,723,344 | 1,958,747,388 | |
Budget Impact | 0 | 4,096,269 | 4,794,660 | 9,565,961 | 18,456,890 | |
Scenario 3: Alternative proportion of patients on low and high dose maintenance therapy | Reference total | 504,491,973 | 498,188,677 | 531,583,882 | 574,921,660 | 1,604,694,219 |
New drug total | 504,491,973 | 500,710,091 | 534,298,939 | 580,184,951 | 1,615,193,982 | |
Budget Impact | 0 | 2,521,414 | 2,715,057 | 5,263,292 | 10,499,763 | |
BIA = budget impact analysis; CDA-AMC = Canada’s Drug Agency.
Note: The CDA-AMC reanalysis is based on the publicly available prices of the comparator treatments.
ISSN: 2563-6596
Canada’s Drug Agency (CDA-AMC) is a pan-Canadian health organization. Created and funded by Canada’s federal, provincial, and territorial governments, we’re responsible for driving better coordination, alignment, and public value within Canada’s drug and health technology landscape. We provide Canada’s health system leaders with independent evidence and advice so they can make informed drug, health technology, and health system decisions, and we collaborate with national and international partners to enhance our collective impact.
Disclaimer: CDA-AMC has taken care to ensure that the information in this document was accurate, complete, and up to date when it was published, but does not make any guarantee to that effect. Your use of this information is subject to this disclaimer and the Terms of Use at cda-amc.ca.
The information in this document is made available for informational and educational purposes only and should not be used as a substitute for professional medical advice, the application of clinical judgment in respect of the care of a particular patient, or other professional judgments in any decision-making process. You assume full responsibility for the use of the information and rely on it at your own risk.
CDA-AMC does not endorse any information, drugs, therapies, treatments, products, processes, or services. The views and opinions of third parties published in this document do not necessarily reflect those of CDA-AMC. The copyright and other intellectual property rights in this document are owned by the Canadian Agency for Drugs and Technologies in Health (operating as CDA-AMC) and its licensors.
Questions or requests for information about this report can be directed to Requests@CDA-AMC.ca.