CADTH Reimbursement Review
Encorafenib (Braftovi)
Sponsor: Pfizer Canada ULC
Therapeutic area: Metastatic colorectal cancer
This multi-part report includes:
Clinical Review
Pharmacoeconomic Review
Clinical Review
Abbreviations
AE
adverse event
AESI
adverse event of special interest
BICR
blinded independent central review
CCC
Colorectal Cancer Canada
CCRAN
Colorectal Cancer Resource and Action Network
CEA
carcinoembryonic antigen
CGOEN
Canadian Gastrointestinal Oncology Evidence Network)
CTCAE
Common Terminology Criteria for Adverse Events
DAC
Drug Advisory Committee
DOR
duration of response
ECOG PS
Eastern Cooperative Oncology Group Performance Status
EGFR
epidermal growth factor receptor
EORTC QLQ-C30
European Organisation for Research and Treatment of Cancer Quality of Life Questionnaire Core 30
EQ-5D-5L
EuroQol 5-Dimensions 5-Levels questionnaire
FACT-C
Functional Assessment of Cancer Therapy–Colorectal
FAS
full analysis set
FOLFIRI
folinic acid plus 5-fluorouracil and irinotecan
FOLFOX
folinic acid plus 5-fluorouracil and oxaliplatin
HR
hazard ratio
HRQoL
health-related quality of life
IHC
Immunohistochemistry
ITC
indirect treatment comparison
ITT
intention to treat
mCRC
metastatic colorectal cancer
MID
minimal important difference
MSI
microsatellite instability
NGS
next-generation sequencing
NMA
network meta-analysis
OH-CCO
Ontario Health (Cancer Care Ontario)
ORR
objective response rate
OS
overall survival
PCR
polymerase chain reaction
PFS
progression-free survival
PGIC
Patient Global Impression of Change
RCT
randomized controlled trial
RECIST
Response Evaluation Criteria in Solid Tumors
SAE
serious adverse event
TEAE
treatment-emergent adverse event
TTD
time to deterioration
TTR
time to response
VAS
Visual Analogue Scale
Executive Summary
An overview of the submission details for the drug under review is provided in Table 1.
Item | Description |
|---|---|
Drug product | Encorafenib (Braftovi), 75 mg capsules, orally |
Indication | In combination with cetuximab, for the treatment of patients with mCRC with a BRAF V600E mutation, as detected by a validated test, after prior therapy |
Reimbursement request | As per indication |
Health Canada approval status | NOC |
Health Canada review pathway | Standard |
NOC date | March 30, 2021 |
Sponsor | Pfizer Canada ULC |
mCRC = metastatic colorectal cancer; NOC = Notice of Compliance.
Introduction
Colorectal cancer is the third most commonly diagnosed cancer in Canada with an expected 26,900 new cases in 2020.1 One-fifth of colorectal cancers are expected to be considered metastatic at initial diagnosis.2 Patients with metastatic colorectal cancer (mCRC) are expected to have a low 5-year survival rate (between 10% and 13%).3,4 The presence or inheritance of mutations may not only affect a patient’s likelihood of developing colorectal cancer, but may serve as predictors of patient outcomes. BRAF mutations account for 10% to 15% of colorectal cancer cases, and the presence of this mutation is associated with poorer survival outcomes.4,5 The V600E mutation is the most common variant of the BRAF mutations. Mutation drivers may help clinicians guide patient care; therefore, standard of care for colorectal cancer patients involves genetic testing, which typically occurs at initial diagnosis. The clinical experts consulted by CADTH for this review indicated that regional centres for testing of the BRAF mutation are available in all Canadian provinces. A common method for identifying BRAF mutations is next-generation sequencing (NGS).
Currently, there are no funded treatment options in Canada that target BRAF mutations. Patients with BRAF-mutated mCRC are often treated with therapies approved for patients with wild-type mCRC. Surgery is typically considered as the initial treatment for patients and, in some patients, may be used to treat oligometastatic disease. However, for most patients, surgery may not be possible.4 The choice of treatment can be dependent on a patient’s clinical and disease characteristics. First- and second-line therapies are often combination therapies that can include regimens based on oxaliplatin, irinotecan, and/or bevacizumab.6 Depending on patient and disease characteristics, molecularly driven therapies may also be considered. However, most patients will eventually develop resistance to treatment and their disease will progress.
Encorafenib is a kinase inhibitor that targets the BRAF V600E mutation. Mutations in the BRAF gene can result in activated BRAF kinases that stimulate the growth of tumour cells.7 Encorafenib is indicated, in combination with cetuximab, for the treatment of patients with mCRC with a BRAF V600E mutation, as detected by a validated test, after prior therapy. The recommended dose of encorafenib is 300 mg daily. Encorafenib is to be administered along with cetuximab, which is recommended to be administered to patients at a dose of 400 mg/m2 followed by 250 mg/m2 every week as an IV infusion. Treatment with encorafenib plus cetuximab should continue until disease progression or unacceptable toxicity.7 Previous CADTH reviews for mCRC have included trifluridine plus tipiracil,8 cetuximab,9 and panitumumab,10,11 none of which received a positive recommendation, except for the review of panitumumab in combination with chemotherapy for the treatment of patients with wild-type RAS mCRC who are contraindicated for or intolerant of bevacizumab in the first-line treatment setting; none of the previous reviews were specific to patients with the BRAF V600E mutation.
The objective of this CADTH drug Reimbursement Review is to perform a systematic review of the beneficial and harmful effects of encorafenib in combination with cetuximab for the treatment of patients with mCRC with a BRAF V600E mutation, as detected by a validated test, after prior therapy.
Stakeholder Perspectives
The information in this section is a summary of input provided by the patient groups that responded to CADTH’s call for patient input and from the clinical experts consulted by CADTH for the purpose of this review.
Patient Input
Two patient groups, Colorectal Cancer Canada (CCC) and the Colorectal Cancer Resource and Action Network (CCRAN), submitted input for this review. Information from CCC was collected via online surveys from 2 patients and 4 caregivers from Canada, the US, the UK, and Turkey. Information from CCRAN was collected through online surveys. Respondents included 63 patients, 17 caregivers, and 5 patients who were also caregivers. There was also a focus group discussion and phone interviews with 3 patients from Canada and the Netherlands to provide direct experiences for encorafenib plus cetuximab.
The patient input indicated that fatigue, bloody stool, diarrhea, and abdominal cramping were the most commonly occurring colorectal cancer symptoms. Fatigue and pain were the symptoms of colorectal cancer that patients considered most important to control. The patients identified difficulty with being able to work and being unable to fulfill family obligations due to their disease. Side effects of therapies considered the most difficult to tolerate included vomiting, nausea, pain, rash, neuropathy, hair loss, and low platelets. Patients indicated that prolonged life, delayed progression, and improved quality of life were the most important considerations for new therapies.
In general, among patients who had experience with encorafenib plus cetuximab, the side effects were reported to be more tolerable compared with their previous therapies. However, gastrointestinal side effects, fatigue, emotional drain, and medication management were reported to be the most difficult aspects of treatment with encorafenib plus cetuximab. Overall, patients reported that, aside from not being a cure, encorafenib plus cetuximab was able to meet most patient expectations for new treatments.
Clinician Input
Input From Clinical Experts Consulted by CADTH
The clinicians consulted by CADTH identified unmet treatment needs for patients with BRAF-mutated mCRC, as patients face poor clinical prognoses and there are currently no funded treatments that target the BRAF mutation. Encorafenib in combination with cetuximab (doublet regimen) would be used as per the BEACON trial, and most likely after first-line therapy. While there is a lack of clarity as to the most optimal first-line treatment for these patients, the doublet regimen is considered to be a promising new therapy and an important new consideration for patients with BRAF-mutated mCRC. As encorafenib is provided alongside cetuximab, cancer clinics will be necessary to deliver the doublet regimen, with treatment guidance from a medical oncologist with experience in managing patients with colorectal cancer.
Clinician Group Input
Input was received from 3 joint clinician submissions on behalf of the Canadian Gastrointestinal Oncology Evidence Network (CGOEN), the Ontario Health (Cancer Care Ontario) (OH-CCO) Gastrointestinal Cancer Drug Advisory Committee (DAC), and 9 clinicians who treat mCRC. The opinions in these 3 submissions align with the opinions of the clinical experts for this CADTH review. The clinicians highlighted the poor clinical outcomes faced by patients with BRAF mutations and the lack of currently funded treatments that can target this mutation. Improved survival, delayed disease progression, and improved quality of life were considered important treatment goals for patients. The clinicians agreed that earlier treatment with a BRAF-directed therapy may help to improve patient outcomes; therefore, encorafenib plus cetuximab would most likely be used as a second-line therapy.
Drug Program Input
Input from the Provincial Advisory Group identified factors pertaining to relevant comparators, generalizability, prescribing of therapy, companion diagnostics, and discontinuation criteria. The clinical experts consulted by CADTH weighed evidence from the BEACON trial and other clinical considerations to provide responses, which can be found in the Drug Program Input section.
Clinical Evidence
Pivotal Studies and Protocol Selected Studies
Description of Studies
One multi-centre, multinational, randomized, open-label, phase III study met the criteria for the CADTH systematic review. The BEACON trial evaluated the efficacy and safety of 3 treatment groups: encorafenib plus cetuximab (doublet group), encorafenib plus cetuximab plus binimetinib (triplet group), and the control group, which was the investigator’s choice of either irinotecan in combination with cetuximab or folinic acid plus 5-fluorouracil and irinotecan (FOLFIRI) in combination with cetuximab. Eligible patients included adults with mCRC whose tumours expressed the BRAF V600E mutation and whose disease had progressed after 1 or 2 prior regimens in the metastatic setting. A safety lead-in phase assessing the safety and tolerability of encorafenib plus cetuximab plus binimetinib initiated the BEACON trial, the results of which are not discussed in this CADTH report. Local assay testing was only accepted via polymerase chain reaction (PCR) or NGS; patients enrolled based on local assays were required to have a confirmation of their BRAF mutation status by central laboratories no later than 30 days after the first dose of study treatment.12
A total of 220 patients were randomized to the doublet group and 221 patients to the control group. Within the control group, 92 patients (41.6%) received cetuximab plus irinotecan and 129 patients (58.4%) received cetuximab plus FOLFIRI.13 Randomization was stratified according to baseline Eastern Cooperative Oncology Group Performance Status (ECOG PS) (0 versus 1), prior use of irinotecan (yes versus no), and cetuximab source (US-licensed versus EU-approved).14 Patients randomized to the doublet group received encorafenib at 300 mg daily in combination with cetuximab. Patients randomized to the control group received either irinotecan (180 mg/m2 every 2 weeks) plus cetuximab, or FOLFIRI plus cetuximab; dosage for FOLFIRI is presented subsequently, and cetuximab was administered at 400 mg/m2 followed by 250 mg/m2 every week via IV infusion in all treatment combinations12:
irinotecan at 180 mg/m2 IV infusion every 2 weeks
folinic acid at 400 mg/m2 IV infusion or maximal dose tolerated in a prior regimen every 2 weeks
5-fluorouracil at 400 mg/m2 initial dose bolus, then 1,200 mg/m2 per day for 2 days continuous infusion or maximal dose tolerated in a prior regimen every 2 weeks.
The primary end points for this trial were based on comparisons between the triplet and control groups. Key secondary end points included analyses of overall survival (OS), objective response rate (ORR) and progression-free survival (PFS) between the doublet group and the control group. A statistical hierarchy ensured that key secondary end points were formally tested only if OS between the triplet group and the control group was found to be statistically significant. Health-related quality of life (HRQoL) was an exploratory end point that was analyzed using the following questionnaires: the European Organisation for Research and Treatment of Cancer Quality of Life Questionnaire Core 30 (EORTC QLQ-C30), the Functional Assessment of Cancer Therapy–Colorectal (FACT-C), the EuroQol 5-Dimensions 5-Levels questionnaire (EQ-5D-5L), and the Patient Global Impression of Change (PGIC).
Baseline characteristics were generally balanced across the doublet group and the control group. Patients had a mean age of 59 years, were mostly from Europe (61%), and were mostly White (81%). A similar proportion of patients had an ECOG PS of 0 (50%) or 1 (49%); all patients were diagnosed with stage IV disease at study entry, 42% of patients had a primary tumour location in the right colon, 34% of patients had a primary tumour location in the left colon, and 56% of patients had their tumour completely resected. Two-thirds of patients had received 1 prior regimen, with the remaining patients having received 2 prior regimens; only 1 patient had received more than 2 prior regimens and this patient was randomized to the control group. Most patients (92%) had liver metastases and had a microsatellite instability (MSI) status of normal as assessed via PCR (69%). A greater proportion of patients in the control group had missing data regarding their MSI status than in the doublet group (23% versus 12%, respectively).14
Efficacy Results
The key efficacy results for the BEACON trial are summarized in Table 2. An interim analysis was pre-specified in the protocol of the BEACON trial to occur after a minimum of 188 OS events in the triplet and control groups combined and a minimum of 169 OS events in the doublet and control groups combined. The median OS was 8.41 months (95% confidence interval [CI], 7.46 to 11.04) in the doublet group compared with 5.42 months (95% CI, 4.76 to 6.57) in the control group (P = 0.0002, log-rank test). A 40% lower risk of death was observed in the doublet group (hazard ratio [HR] = 0.60; 95% CI, 0.45 to 0.79). The median PFS was 4.21 months (95% CI, 3.71 to 5.36) in the doublet group compared with 1.51 months (95% CI, 1.45 to 1.71) in the control group (P < 0.0001, log-rank test). A 60% reduction in progression or death (HR = 0.40; 95% CI, 0.31 to 0.52) was observed in the doublet group compared with the control group.14 An additional updated analysis that was not pre-specified in the protocol of the BEACON trial was conducted that added approximately 6 months of data. The results of these post-hoc analyses were generally consistent, with the primary results in supporting efficacy favouring treatment with encorafenib plus cetuximab over therapies in the control group observed at the interim analysis.15 However, results from the post-hoc analysis are considered descriptive and should be interpreted with caution.
Quality-of-life data were assessed using a time to deterioration (TTD) analysis; TTD analysis of all HRQoL questionnaires indicated longer TTD (improvement) for patients in the doublet group over the control group. However, the analyses of HRQoL are exploratory and should be interpreted with caution.
Harms Results
A similar proportion of any-grade adverse events (AEs), treatment-emergent AEs (TEAEs), serious AEs (SAEs), and grade 3 or greater SAEs were observed in similar proportions across the doublet and control groups. Grade 3 or greater AEs and grade 3 or greater TEAEs occurred more frequently in the control group than in the doublet group. In general, most AEs observed were grade 1 or 2. AEs of any grade with a difference of 10% between the doublet and control groups, and which occurred more frequently in the doublet group, included arthralgia (19.0% versus 0.5%, respectively), headache (19.4% versus 2.6%), melanocytic nevus (14.4% versus 0%), myalgia (13.4% versus 2.1%), and musculoskeletal pain (12.5% versus 1.6%).14 The most commonly occurring any-grade AEs were diarrhea (33.3% in the doublet group versus 48.2% in the control group), dermatitis acneiform (29.2% versus 39.4%), nausea (34.3% versus 41.5%), fatigue (30.1% versus 27.5%), vomiting (21.3% versus 29.0%), decreased appetite (26.9% versus 26.9%), abdominal pain (22.7% versus 24.9%), and asthenia (21.3% versus 35.4%).14 The most frequently reported TEAEs of any grade included dermatitis acneiform (27.8%), fatigue (22.7%), and nausea (20.4%) in the doublet group, and diarrhea (44.0%), dermatitis acneiform (38.9%), nausea (36.3%), asthenia (22.3%), and stomatitis (21.2%) in the control group.14 Deaths occurring during treatment or within 30 days of the last administered dose occurred in 7 patients (3.2%) in the doublet group and 8 patients (4.1%) in the control group.14
Table 2: Summary of Key Results From Pivotal and Protocol Selected Studies
End point | Interim analysis (data cut-off: February 11, 2019) | Post-hoc analysisa (data cut-off: August 15, 2019) | ||
|---|---|---|---|---|
Doublet group (N = 220) | Control group (N = 221) | Doublet group (N = 220) | Control group (N = 221) | |
OS | ||||
Events, n (%) | 93 (42.3) | 114 (51.6) | 128 (58.2) | 157 (71.0) |
Median, months (95% CI)b | 8.41 (7.46 to 11.04) | 5.42 (4.76 to 6.57) | 9.30 (8.05 to 11.30) | 5.88 (5.09 to 7.10) |
Stratified HR (95% CI)c | 0.60 (0.45 to 0.79) | 0.61 (0.48 to 0.77) | ||
Stratified log-rank (1-sided) P value | 0.0002 | < 0.0001d | ||
PFS | ||||
Events, n (%) | 133 (60.5) | 128 (57.9) | 167 (75.9) | 147 (66.5) |
Progressive disease | 110 (50.0) | 101 (45.7) | 141 (64.1) | 116 (52.5) |
Death | 23 (10.5) | 27 (12.2) | 26 (11.8) | 31 (14.0) |
Median (months), (95% CI)b | 4.21 (3.71 to 5.36) | 1.51 (1.45 to 1.71) | 4.27 (4.07 to 5.45) | 1.54 (1.48 to 1.91) |
Stratified HR (95% CI)c | 0.40 (0.31 to 0.52) | 0.44 (0.35 to 0.55) | ||
Stratified log-rank (1-sided) P-value | < 0.0001 | < 0.0001d | ||
ORRe | ||||
N | 113 | 107 | 220 | 221 |
ORR, n (%) | 23 (20.4) | 2 (1.9) | 43 (19.5) | 4 (1.8) |
95% CI | (13.4 to 29.0) | (0.2 to 6.6) | (14.5 to 25.4) | (0.5 to 4.6) |
Cochrane-Mantel-Haenszel (1-sided) P value | < 0.001 | < 0.001d | ||
Harms, n (%) (safety set) | Doublet group (N = 216) | Control group (N = 193) | Doublet group (N = 216) | Control group (N = 193) |
AEs | 212 (98.1) | 188 (97.4) | 212 (98.1) | 190 (98.4) |
Grade ≥ 3 AEs | 108 (50.0) | 117 (60.6) | 124 (57.4) | 124 (64.2) |
TEAEs | 191 (88.4) | 176 (91.2) | NR | NR |
Grade ≥ 3 TEAEs | 42 (19.4) | 76 (39.4) | NR | NR |
SAEs | 71 (32.9) | 71 (36.8) | NR | NR |
Grade ≥ 3 SAEs | 61 (28.2) | 64 (33.2) | NR | NR |
Patients with at least 1 AE leading to discontinuation of all study treatment, n (%) | 18 (8.3) | 22 (11.4) | NR | NR |
AE = adverse event; CI = confidence interval; ECOG PS = Eastern Cooperative Oncology Group Performance Status; HR = hazard ratio; NR = not reported; ORR = objective response rate; OS = overall survival; PFS = progression-free survival; SAE = serious adverse event; TEAE = treatment-emergent adverse event.
aThe post-hoc analysis (data cut-off: August 15, 2019) was not pre-specified in the protocol of the BEACON trial. Results are considered descriptive and should be interpreted with caution.
bThe Kaplan–Meier method was used to summarize OS and PFS for each treatment group along with a stratified log-rank test for P values; stratification factors include ECOG PS, prior use of irinotecan, and source of cetuximab.
cThe HR and corresponding 2-sided CI were estimated using a stratified Cox proportional hazards model. HR < 1 favours encorafenib plus cetuximab; stratification factors include ECOG PS, prior use of irinotecan, and source of cetuximab.
dThese P values have not been controlled for multiple testing and should be interpreted as nominal.
eORR was analyzed using the Cochrane-Mantel-Haenszel test; stratification factors include ECOG PS, prior use of irinotecan, and source of cetuximab.
Source: BEACON Clinical Study Report,14 BEACON Clinical Study Report Addendum,15 and Tabernero et al., 2021.16
Critical Appraisal
The BEACON trial was an open-label phase III trial; therefore, patients and investigators were aware of treatment assignment. Appropriate measures were put in place to mitigate biases of an open-label trial, such as implementation of a blinded independent central review (BICR) for analyses of efficacy outcomes and limiting the number of study team members who were unblinded to trial results. However, the biases of an open-label trial may have affected the results for HRQoL and safety, as reporting of side effects and impacts on quality of life may have been influenced by knowledge of treatment assignment.
Post-hoc analyses for efficacy were conducted by the sponsor after the interim analysis. The updated analyses were not pre-specified; therefore, all analyses conducted at this time point are considered descriptive and should be interpreted with caution.
The use of subsequent therapies differed across treatment groups and may have influenced observed survival in the BEACON trial. As analyses for OS did not control for subsequent therapies, results for OS could have been over- or underestimated.
Patients were stratified according to baseline ECOG PS (0 versus 1), prior use of irinotecan (yes versus no), and cetuximab source (US-licensed versus EU-approved). The efficacy of cetuximab was considered to be broadly similar regardless of source of manufacturing. A previous phase III trial supported noninferiority of the 2 formulations of cetuximab. The clinical experts consulted for this review suggested the source of cetuximab should not affect the efficacy of treatment.
Cetuximab was administered as a 400mg/m2 dose followed by a 250 mg/m2 IV infusion every week. Clinicians consulted for this CADTH review noted that cetuximab is often provided to patients at an alternative dosing of 500 mg/m2 every 2 weeks. No direct evidence has been published that supports the equivalence of the alternative dosing and administration schedules for cetuximab; however, pooled analyses did support noninferiority.17 The clinical experts who consulted with CADTH for this review agreed that cetuximab may be given at either dose and the administration schedule should be equally efficacious, and that administration of cetuximab in clinical practice is typically a dosage of 500 mg/m2 every 2 weeks.
Indirect Comparisons
Description of Studies
Two studies, the BEACON trial and NCT00339183 trial, were included in the sponsor’s indirect treatment comparison (ITC). The sponsor’s ITC compared the efficacy of encorafenib plus cetuximab with FOLFIRI among patients with BRAF-mutated mCRC after prior therapy. While the BEACON trial specifically enrolled patients with the BRAF V600E mutation, the NCT00339183 trial enrolled only a small subsample of patients with the BRAF mutation.
Efficacy Results
The results of the sponsor’s ITC suggested that encorafenib plus cetuximab was |||||||||||||||||||||||||||||||| to FOLFIRI based on OS |||| OS |||||||||||||||||||||||||||||||| and PFS ||||||||||||||||||||||||||||||||||||.18
Harms Results
No comparisons for harms or safety were incorporated in the sponsor’s ITC.
Critical Appraisal
Little published, peer-reviewed literature was available for the assessment of the feasibility of the sponsor’s ITC. Only 1 trial, NCT00339183, was included in the sponsor’s ITC to provide a comparison with encorafenib plus cetuximab based on evidence from the BEACON trial. The trial was limited in the number of patients with the BRAF mutation; therefore, generalizations about baseline characteristics and clinical outcomes for all patients in NCT00339183 were made to the small BRAF-mutated subsample included in the trial. Patients in the NCT00339183 trial had received only 1 previous systemic therapy, whereas patients in the BEACON trial could have received 2. As patients with BRAF mutations face poorer prognoses, these generalizations of baseline characteristics and trial results between patients with BRAF-mutated versus wild-type colorectal cancer may not be appropriate and may have resulted in the underestimation of the benefit of encorafenib plus cetuximab. In addition, a number of assumptions regarding clinical equivalence between different treatments were made; assumptions were considered reasonable by the clinicians consulting on this CADTH review. However, without direct evidence, it is not possible to know the comparative efficacy of different treatments with certainty. While the results of the sponsor’s ITC, which favour encorafenib plus cetuximab over FOLFIRI, may be true, the magnitude of this benefit is uncertain.
Conclusions
Patients with mCRC face poor survival rates, and patients with BRAF mutations face poorer prognoses and rapid disease progression with few available treatment options. There are currently no funded treatment options that target BRAF mutations for patients with mCRC. Based on the results of 1 phase III study (the BEACON trial), encorafenib in combination with cetuximab (doublet group), compared with FOLFIRI plus cetuximab or irinotecan plus cetuximab demonstrated statistically significant improvements in OS and PFS in adult patients with mCRC with a BRAF V600E mutation, after prior therapy. ORR was also superior in the doublet group, with only a few patients achieving response in the control group. HRQoL outcomes were noted as important to patients; however, the doublet group’s effect on HRQoL was uncertain due to the study's open-label design, lack of control for multiplicity, and lack of analyses based on the estimated minimal important differences (MIDs). The CADTH reviewers did not identify direct comparative evidence for encorafenib plus cetuximab with FOLFIRI. One sponsor-submitted ITC comparing encorafenib plus cetuximab with FOLFIRI suggested that encorafenib in combination with cetuximab may be more efficacious for patients in the second line of treatment compared with FOLFIRI. However, there is uncertainty around the ITC results due to the numerous assumptions. The safety results also suggested a lower frequency of AEs and a manageable toxicity profile.
Introduction
Disease Background
Colorectal cancer is a potentially fatal disease that begins in the colon or rectum and is characterized by a group of cancerous cells (a tumour) that grow into and destroy nearby tissue. In metastatic disease, the tumour spreads to and damages other parts of the body.19 About 70% to 90% of colorectal cancers are diagnosed after symptom onset, although population-based screening is increasing the number of asymptomatic cases identified.20 Risk factors for colorectal cancer include lifestyle choices (i.e., diet, obesity, smoking, alcohol) as well as non-modifiable risk factors, such as race, ethnicity, age, and the presence of mutations.4 Colorectal cancer is 1 of the most commonly diagnosed cancers in Canada; estimates from 2020 suggested that colorectal cancer was projected to be the third most commonly diagnosed cancer among Canadians, with an expected 26,900 new cases.1 Colorectal cancer impacts both men and women; it is the second most commonly diagnosed cancer in men and the third most commonly diagnosed cancer in women. Estimates from 2020 suggested that colorectal cancer was expected to result in 11.6% of all cancer-related deaths, second only to lung cancer.1 At diagnosis, approximately 1-fifth of colorectal cancers will be classified as metastatic disease.2 The 5-year survival rate for mCRC is low, with most estimates indicating a 5-year survival rate of 10% and 13% for patients with mCRC.3,4,21
BRAF mutations may account for 10% to 15% of colorectal cancer cases.4,5 The BRAF V600E mutation is the most common variant of the BRAF mutations. The presence of the BRAF mutation is associated with poorer survival compared with BRAF wild-type colorectal cancer.2 The clinical experts consulted by CADTH for this review stated the presence of the BRAF mutation can be associated with right-sided colon cancers and MSI; such patients often respond poorly to systemic therapies and progress rapidly, despite optimum cancer care.22 Testing for the mutation is considered the standard of care and typically occurs at initial diagnosis to help guide treatment options and care for patients. The clinical experts consulted by CADTH for this review indicated that every Canadian province has a designated regional centre for the testing of BRAF V600E mutations. NGS was acknowledged as a common method for identifying tumour mutations. A summary of BRAF mutation testing in colorectal cancer is provided in Appendix 5.
Standards of Therapy
Colorectal cancers are a heterogenous group of diseases driven by different mutations and mutation-causing agents, such as radiation of chemical substances. Due to the varying nature of driving mutations, molecular therapies may not be effective for all types of colorectal cancers. Primary treatment typically involves surgery when diagnosis occurs early. However, in some cases of metastatic disease, surgery may not be effective.4 When surgical resection is not possible, the clinical experts consulted by CADTH for this review indicated that, in select patients, aggressive intervention with surgical salvage for low-burden metastatic disease may be attempted. Stereotactic body radiotherapy may also be used for patients with oligometastases or oligoprogression. For most patients with mCRC, the disease is not curable, and patients are often treated with chemotherapy. Molecularly driven therapies may also be considered for some patients, depending on their disease characteristics and prior courses of therapy.
The clinical experts consulted by CADTH for this review indicated that currently available therapies for the treatment of mCRC patients in Canada include 5-fluorouracil or capecitabine, oxaliplatin, irinotecan, bevacizumab, and panitumumab or cetuximab; up-front treatments may include a chemotherapy regimen with or without a biologic drug, such as bevacizumab. Trifluridine plus tipiracil and regorafenib were also stated to be available treatments for patients; however, these treatments are not funded and are often used only when patients progress on all other treatment options and are able to either self-fund treatment or access coverage through private insurance. Choice of treatment can be dependent on a patient’s performance status, organ function, and comorbidities, in addition to tumour characteristics, including location (right versus left), presence of primary tumour, and RAS status. Current principles for first- and second-line therapy are often combination therapies, which can include regimens based on oxaliplatin, irinotecan, and/or bevacizumab.6 Ultimately, most patients will develop resistance and eventually die from their disease. Currently, there are no approved treatments that target the BRAF mutation. Patients with the BRAF mutation are often treated with standard treatment regimens for mCRC, which can include chemotherapy combinations. However, patients with mCRC with a BRAF mutation may benefit less from these regimens than patients with BRAF wild-type mCRC.23 A growing body of evidence is suggestive of improved patient outcomes for patients with BRAF-mutated colorectal cancer when treated with BRAF and MEK inhibitors combined with anti–epidermal growth factor receptor (EGFR) therapies.2 Current goals for treatment include prolonging life, delaying disease progression, ensuring well-tolerated treatments with easy administration, and improving patient’s quality of life.
Drug
Encorafenib is indicated by Health Canada to be used in combination with cetuximab for the treatment of patients with mCRC with a BRAF V600E mutation, as detected by a validated test, after prior therapy.7
Encorafenib is a kinase inhibitor that targets the BRAF V600E mutation. Mutations in the BRAF gene can result in activated BRAF kinases that stimulate the growth of tumour cells. Encorafenib is able to suppress oncogenic pathways and lead to inhibition of tumour cell growth. Induction of EGFR-mediated and mitogen-activated protein kinase (MAPK) pathways for patients with BRAF V600E–mutated mCRC has been observed to lead to resistance to BRAF inhibitors. Treatments with a combination of a BRAF inhibitor and anti-EGFR therapies have been shown to overcome the resistance and result in greater anti-tumour activity compared with single-drug treatments.7
The Health Canada–recommended dose for encorafenib is 300 mg daily (four 75 mg capsules) taken orally once daily in combination with cetuximab until disease progression or unacceptable toxicity.7 Cetuximab is to be administered to patients as per the recommended dosing in the cetuximab product monograph, which is a dose of 400 mg/m2 followed by 250 mg/m2 every week as an IV infusion.24 If cetuximab is discontinued, encorafenib should also be discontinued.7
The sponsor has requested reimbursement of encorafenib as per the indication under review, which is in combination with cetuximab, for the treatment of patients with mCRC with a BRAF V600E mutation, after prior therapy.25 Encorafenib has not been reviewed previously by CADTH.
The key characteristics of commonly used treatments for mCRC with a BRAF V600E mutation are presented in Table 3.
Table 3: Key Characteristics of Encorafenib and Cetuximab
Heading | Encorafenib | Cetuximab | Irinotecan | Folinic acid | 5-FU |
|---|---|---|---|---|---|
Mechanism of action | BRAF inhibitor | EGFR inhibitor | Antineoplastic drug of the topoisomerase I inhibitor class | Folic acid derivative | Antineoplastic drug |
Route of administration | Oral | IV infusion | IV infusion | IV infusion | IV infusion |
Recommended dosage | 300 mg once daily | 400 mg/m2 followed by 250 mg/m2 every week | 180 mg/m2 every 2 weeks | 400 mg/m2 every 2 weeks | Initial bolus of 400 mg/m2, then 1,200 mg/m2 per day x 2 days (total of 2,400 mg/m2 over 46 to 48 hours) every 2 weeks |
Serious adverse effects or safety issues | Serious warnings and precautions:
| Serious warnings and precautions:
| Serious warnings and precautions:
| Serious warnings and precautions:
| Should be used with extreme caution among poor-risk patients who have:
|
Other | None | Although the recommended dosage is 400 mg/m2 followed by 250 mg/m2 every week, alternative dosing at 500 mg/m2 is also commonly used in clinical practice | None | Folinic acid enhances the cytotoxicity of fluoropyrimidine such as 5-FU | None |
5-FU = 5-fluorouracil; EGFR = epidermal growth factor receptor; mCRC = metastatic colorectal cancer; USP = United States Pharmacopeia.
Source: Sponsor’s submission25 and product monographs for Braftovi (encorafenib),7 Erbitux (cetuximab),24 irinotecan hydrochloride injection USP (irinotecan hydrochloride trihydrate),26 leucovorin calcium injection USP,27 and fluorouracil injection USP.28
Stakeholder Perspectives
Patient Group Input
This section was prepared by CADTH staff based on the input provided by patient groups.
About the Patient Groups and Information Gathered
CADTH received submissions from 2 patient groups for this review. CCC and the CCRAN are national, not-for-profit, patient advocacy groups.
CCC obtained information through an online survey posted on its social media platforms as well as those of other international colorectal cancer organizations between October 30 and December 23, 2020. Respondents included 2 patients and 4 caregivers from Canada (n = 1), the US (n = 3), the UK (n = 1), and Turkey (n = 1). Four of the 6 respondents were female. At diagnosis, 4 out of 6 patients were between 30 and 39 years old, 1 was between 40 and 49 years, and another was between 70 and 79 years; 4 respondents presented with stage IV disease, while 2 presented with stage I disease. At the time of the survey, 4 respondents had stage IV cancer, while the 2 remaining patients had died. All patients alive at the time of the survey were undergoing treatment.
CCRAN collected information through 3 separate processes for its submission and advertised with the help of its support group members and members of their medical advisory board:
A national online survey, available from December 6 to December 30, 2020, provided input from 63 patients, 17 caregivers, and 5 patients who were also caregivers, all of whom were living in Canada. Almost 59% of respondents were female and their ages varied from 31 to 90 years, although most were between 41 and 70 years old. Most patients had stage II (11%), III (29%), or IV (44%) disease.
A focus group discussion conducted over Zoom (a teleconference platform) took place on November 15, 2020 to gain insight on the experiences and symptoms of 7 patients who had mCRC.
Phone interviews were conducted between December 16, 2020 and January 18, 2021 to provide information about patients’ first-hand experience with encorafenib plus cetuximab. Input was obtained from 3 patients who received encorafenib plus cetuximab as first-line (n = 1) and second-line (n = 2) therapy. The patients included 1 male and 2 females who were between 30 and 50 years of age and living in Ontario (n = 2) and the Netherlands (n = 1).
Disease Experience
Patients responding to the CCC and CCRAN surveys reported fatigue, bloody stool, diarrhea, and abdominal cramping as the most commonly occurring colorectal cancer symptoms; fatigue and pain were identified as being the most important symptoms to control. Furthermore, both patients and their caregivers experienced the hardships of living with a cancer that affected their social lives, daily routines, mental health, quality of life, and their ability to work, resulting in lost income. More specifically, 51% of respondents to the CCRAN survey noted being unable to work, while 42% were unable to fulfill family obligations. The CCRAN focus group identified pain in various locations, breathing issues, debilitating fatigue, and diminished appetite as key burdens resulting from the spread of the disease to other organs. Moreover, respondents also noted that, from their experience, there were often no warning signs before the cancer had advanced and was more difficult to treat. Hardships related to the disease were illustrated in the following quotes from patients and caregivers responding to the CCC survey. “Between the constant nausea, and decreased energy I find it very difficult most days to do even a fraction of what I used to do in a day” (patient). “I lost 15 lbs, had to be on anti-anxiety drugs” (caregiver). “Everything revolves around what he needs and this varies each day depending on pain levels and energy” (caregiver).
Experiences With Currently Available Treatments
Five of 6 patients from the CCC group had accessed therapies before receiving encorafenib; all of them felt that the previous therapies (chemotherapy and/or surgery) either only partially controlled or did not control their symptoms. Based on what therapies are currently available for treating colorectal cancer, 3 of the 6 respondents felt that patient needs are still unmet and that there are limited options available, particularly for those with the BRAF V600E mutation. The side effects most difficult to tolerate varied slightly among patients and included vomiting, nausea, pain, rash, neuropathy, hair loss, and low platelets. On a scale from 1 to 10 (10 being very important), when asked how important it was to have a choice of which drug to receive based on known side effects, most responded with a score of at least 7.
Regarding treatment access, 3 of the 6 respondents expressed difficulties doing so, with 1 stating that it took more than 4 weeks for the drug to be available and another facing a lack of insurance coverage. Respondents also reported that treatment recommendations were based solely on what was funded in their region. Patients and caregivers highlighted the financial burden of having to pay co-pays out of pocket for medical visits, medications, and tests, as well as the additional costs for travel and medical supplies. Fortunately, 3 respondents had received financial assistance that covered from 20% to 100% of their treatment expenses. All 6 respondents felt it was very important to be able to access new, effective cancer treatments and nearly all were willing to pay out of pocket to access new medications. One patient stated, “I am determined to live as long as possible” and a caregiver expressed, “This disease is very severe and unfair.”
Patients from the CCRAN survey listed the variety of therapies they had received, including folinic acid plus 5-fluorouracil and oxaliplatin (FOLFOX) (72%), capecitabine (40%), folinic acid plus 5-fluorouracil and irinotecan (FOLFIRI) (34%); bevacizumab-awwb (Mvasi), (21%), panitumumab (15%), cetuximab (6%), pembrolizumab (6%), trifluridine plus tipiracil (4%), regorafenib (2%), and encorafenib (2%), among others. Most noted that diarrhea, hand and foot syndrome, and neuropathy were common with their current medication, but fatigue and nausea were the 2 side effects most difficult to tolerate. In addition to the previous list of drugs, respondents also had surgery, radiation therapy, and other forms of chemotherapy.
Improved Outcomes
Respondents from both the CCC and CCRAN surveys felt it was very important for new therapies to improve both patients’ physical condition and quality of life. Furthermore, nearly all patients and caregivers expressed interest in a treatment that was proven to provide a better quality of life, even if it did not extend OS, as this would allow them to engage in social activities and return to daily life without worrying about side effects. When asked about what severity of side effects (on a scale from 1 to 10) patients would be willing to tolerate for extended survival, the survey results indicated that all respondents were willing to tolerate some level of side effects; the lowest scores reported tolerance of medium severity of side effects (score = 4), and the highest scores reported maximum severity (score = 10). Respondents from the CCRAN survey indicated the following 3 outcomes as the most important expectations for new cancer treatments: provides a cure, if possible (94%); prolongs life by a substantial amount of time (86%); and promotes good quality of life (82%). Other key outcomes included limited side effects, treatment funding, improvement in symptoms, and simpler administration.
Regarding access to treatment, 4 of 6 respondents from CCC reported they had appropriate or fair access to therapies versus 2 respondents who reported that access was limited or restrictive. All respondents also felt it was very important to be given a choice, along with their physicians, when deciding which treatment they would receive, and to understand the expected length of benefit from a new therapy.
Experience With Drug Under Review
From the CCC survey, 1 patient had received encorafenib as a first-line therapy, 4 as a second line, and 1 as a fourth line. Patients had switched to encorafenib for the following reasons: specific biomarker testing (n = 2), failure of first-line treatment (n = 1), and disease recurrence (n = 2). All patients had tested positive for the BRAF V600E mutation before receiving encorafenib, which was administered in combination with chemotherapy, targeted therapy, or immunotherapy. At the time of the survey, individuals had reported being on the new treatment for 3 weeks to 3 months. Access was gained through pharmaceutical company assistance and insurance plans, though most respondents faced access issues, whether it was financial or was related to encorafenib not being available through their cancer centre or related to them having no provincial coverage. One caregiver emphasized the importance of having knowledgeable clinicians and being presented with all possible options: “Patients that are BRAFv600e should be informed about BRAFTOVI by their oncologist and not have to seek 2nd opinions to learn about it. They should be treated by a colorectal cancer specialist, not an oncologist that treats all cancers.” All respondents felt encorafenib should be funded in their region and 1 caregiver stated, “[Treatments] should not be restricted based on what is covered/funded…. When someone has such an aggressive form of cancer, every moment counts and time spent waiting to get coverage allow the cancer to spread.”
Respondents reported the following as common, but somewhat tolerable, side effects: fatigue, joint pain, muscle weakness, headache, rash, dry skin, itching, nausea, hair loss, and fever. They also noted that fatigue, shortness of breath, diarrhea, constipation, platelet levels, and liver function were better managed with encorafenib compared with previous therapies. Conversely, they felt that emotional drain, fatigue, and medication management were the most difficult hardships of their treatment. With encorafenib, 2 patients believed their cancer was gone, shrunk, or controlled, while 2 others reported their tumours had partially shrunk. Nearly all felt the oral therapy was easy to administer and all found it simple to integrate into their routines. Caregivers and patients alike noticed the benefits the drug had offered: “On day 2 of the new targeted treatment his liver values began to improve. His quality of life improved significantly! Ultimately these drugs bought him 8 more weeks with us before he passed away. His quality of life was greatly improved, which was such a blessing for him, myself and our 6 year old son.” And, “I don't know that I would have made it this far without the current drug combination. I was in the hospital in liver failure before my treatment was changed. After the first 2 weeks my liver functions started falling back into the normal range and at my 2 month scan my mets had shrunk considerably.”
CCRAN interviewed 3 patients who had received encorafenib plus cetuximab either as a first-line (n = 1) or second-line (n = 2) treatment. The patient treated with encorafenib as a first-line therapy gained access through a compassionate-use program, while the others were through special access programs. Prior to starting encorafenib, first-line therapies included chemotherapy (FOLFOX, FOLFIRI, or capecitabine plus oxaliplatin [CAPOX]) and/or surgery and radiation; the 2 respondents who received these first-line therapies agreed that these methods did not control the cancer and their quality of life was very poor during this time. In general, respondents believed that it was fewer than 5 months before the disease had progressed while receiving or once completing chemotherapy. One patient shared their experience with FOLFOX, “Oh, gosh, it was horrible. I had terrible neuropathy, and nausea was horrible…. I was not able to keep up with my young kids. For the first 5 days, I was in bed and unable to do anything and constantly debilitated. I found it painful to touch anything. And the smells, oh the smells they made me so ill. They made me nauseous. And I couldn’t eat or drink.”
Patients noted a variety of side effects they have experienced while receiving encorafenib and cetuximab: gastrointestinal problems, fatigue, constipation, itching and burning skin, skin spots or rash, and hair growth or loss in different locations. Two of the 3 respondents felt these side effects were more tolerable compared with those with previous chemotherapy, and rated their quality of life as at least a 9 out of 10 (10 being very good). One gave a rating of 5 due to the extreme fatigue after cetuximab infusions but was hopeful it would improve. Two patients had to pause their treatment due to gastrointestinal problems and heart issues, but were able to restart within 1 week. When asked if the current treatment was easier than their previous ones, the responses were unanimously in favour of encorafenib: the side effects were much more manageable and less severe, it was convenient and took less time than chemotherapy infusions, and their overall quality of life was much better. Additionally, all respondents felt it was worth accessing encorafenib and cetuximab, noting the improvement in length and quality of life, being able to return to daily routines, caring for their families, and 1 considering returning to work. One patient stated, “…it’s a great therapy. It’s easy to use, gives me great quality of life. One of the drugs is oral so I get to take it at home. The other one is infused at the hospital but it’s a quick infusion and the side effects are nowhere near as toxic as the other therapies I have had. I feel really lucky.”
At the time of the interviews, 2 patients had CT scans and carcinoembryonic antigen (CEA) testing showing disease regression, while the third had not had any imaging performed but still felt the medications were effective. When asked what outcomes they would like to see with new treatments, the 3 patients listed improved OS and quality of life, a better side effects profile, no toxicities, easy administration and, ideally, a cure. They mostly felt that encorafenib with cetuximab fulfilled the previous list of desired outcomes, aside from the treatment not being a cure. Finally, the group was adamant that encorafenib plus cetuximab should be an option for all who qualify without having to fail first-line treatments and for the improved outcomes it provides to both patients and caregivers. One patient stated:
You shouldn’t have to go through a useless first-line therapy to prove that it will not work to access a second-line treatment designed to target your particular cancer and your genetic mutation. I was essentially told be prepared for first line to not work and then you’ll be able to access something that will work and be easier on your body! That’s just wrong and unconscionable. I just couldn’t understand that and on top of that, to wait for the treatment to 6 weeks, to fight for it to get here in 4 weeks and was yes grateful to know people who helped get it here sooner is again unconscionable and should be that way for people who are fighting for their life, who have my mutation, an aggressive form of cancer!
Companion Diagnostic Test
Most patients from the CCC survey were unaware that biomarker testing could help specify a treatment. Furthermore, all respondents reported being tested after diagnosis and were confirmed to be positive for the BRAF V600E mutation. After receiving their results, 5 patients were treated with chemotherapy (1 with additional surgery) and the sixth received immunotherapy.
Two of 3 patients from the CCRAN interviews who had received encorafenib were not aware what type of biomarker testing was being performed. All 3 tested positive for the BRAF V600E mutation, which qualified them for the drug, though none were aware of what form of test was used. They also noted not having to travel to complete the test, nor did any of them pay out of pocket.
Clinician Input
Input From the Clinical Experts Consulted by CADTH
All CADTH review teams include at least 1 clinical specialist with expertise in the diagnosis and management of the condition for which the drug is indicated. Clinical experts are a critical part of the review team and are involved in all phases of the review process (e.g., providing guidance on the development of the review protocol, assisting in the critical appraisal of clinical evidence, interpreting the clinical relevance of the results, and providing guidance on the potential place in therapy). The following input was provided by 2 clinical specialists with expertise in the diagnosis and management of colorectal cancer.
Unmet Needs
Patients with BRAF mutations generally have a much worse prognosis compared with patients without the mutation. Patients with the BRAF mutation were stated to have an inferior response to currently available systemic treatments due to the deregulation of cell division introduced by the BRAF cellular pathway. There was consensus among the clinicians that there are currently no treatments that specifically target the BRAF mutation. Patients and their treating physicians are in need of new treatments that address the challenges posed by the disease’s limited response to currently available treatment options. Without directed treatments, patients are subjected to toxicities from treatments that offer limited benefit on disease control and that result in quicker disease trajectory and early mortality. The clinicians agreed that treatment goals include improved survival, disease control, and delayed disease progression, tolerability and ease of administration of treatment, and improved quality of life.
Place in Therapy
Encorafenib plus cetuximab was stated to be used for patients with BRAF-mutated mCRC after they have received prior therapy. Both clinicians suggested that encorafenib plus cetuximab would be used after first-line therapy for mCRC, which typically involves chemotherapy. One of the clinicians acknowledged there is a lack of clarity on what is considered standard first-line therapy. In addition, a proportion of patients enrolled within the BEACON trial were previously treated with an irinotecan regimen and then re-challenged with irinotecan when randomized to the control group; this practice was acknowledged as being generally unacceptable. Current evidence does not support the upstream migration of the encorafenib-based regimen to first-line therapy.
This encorafenib regimen was acknowledged to be the first treatment targeting the BRAF mutation. While patients with BRAF mutations may continue to face poorer outcomes, the encorafenib regimen offers a novel therapy for such patients and introduces hope for more effective treatments in the future.
Patient Population
The clinical experts believe that encorafenib in combination with cetuximab would be suitable for adult patients with mCRC with a BRAF V600E mutation who are not suitable for surgical salvage therapy, have progressed after first-line therapy, have reasonable performance status (ECOG PS 0 or 1), and have reasonable lab parameters and organ function. Suitability for treatment should be based on clinical standards, including a patient’s clinical status, and based radiographically through CT scans. Identification of patients with the BRAF V600E mutation would be requested by the medical oncologist through genomic analysis, which is the standard of care for patients with advanced colorectal cancer. The majority of patients with advanced colorectal cancer were stated to have known BRAF mutation status. Patients without the BRAF V600E mutation, or with other BRAF mutations, were stated to be the least suitable patients for treatment with encorafenib plus cetuximab after prior therapy.
The clinical experts also stated it is not possible to identify patients who would be most likely to exhibit a response to treatment with encorafenib in combination with cetuximab. Further information may be needed to assess the magnitude of a patient’s outcomes and how to better utilize initial and subsequent therapies.
Assessing Response to Treatment
Regular clinical and radiological assessments to assess for signs and symptoms and laboratory parameters attributable to disease (i.e., ECOG PS, pain, feeling of well-being, and weight loss) would be conducted to assess patients’ response to treatment. In addition, radiological assessments per Response Evaluation Criteria in Solid Tumors (RECIST), including CT scans, would be performed every 2 to 3 months. Clinically meaningful responses to treatment were stated to include improvements in OS, PFS, and quality of life. Functional improvement and better pain control were also stated to be important when assessing improvement in patients.
Treatment should be continued for as long as patients respond and tumour shrinkage or stability is confirmed, side effects remain manageable, treatment remains medically reasonable, and patients wish to continue receiving treatment. Assessment of treatment response was suggested to be tailored to the patient. Typically, patients may be assessed clinically every 2 to 4 weeks, with radiological assessments every 2 to 3 months. More prompt investigations of treatment response may be warranted if patients exhibit clinical changes.
Discontinuing Treatment
Treatment should be discontinued when patients are no longer responding to treatment and show signs of clinical and/or radiological disease progression, or when there are intolerable side effects, such as severe skin toxicities. Alternatively, the decision to continue or discontinue therapy may depend on opportunities to enrol in new clinical trials that offer potentially novel or superior treatments.
Prescribing Conditions
As encorafenib is provided in combination with cetuximab, cancer clinics with the facilities and personnel to deliver IV chemotherapy are necessary for treatment. There was agreement among the clinicians that treatments should be guided by a medical oncologist experienced in managing patients with colorectal cancer.
Additional Considerations
One of the clinicians highlighted that patients with BRAF-mutated mCRC are a distinct group with poor prognoses and limited effective treatment options. There is a lack of data to help patients and clinicians choose the optimal first-line treatment. The clinical expert indicated that first-line treatment with the triplet regimen of folinic acid plus 5-fluorouracil, oxaliplatin, and irinotecan (FOLFOXIRI) plus bevacizumab and subsequent therapy with a combination of BRAF, MEK, and EGFR inhibitors, appears to provide patients with effective treatments and improved clinical outcomes.
Clinician Group Input
This section was prepared by CADTH staff based on the input provided by clinician groups.
Three clinicians provided input on the review of the use of encorafenib (Braftovi) in combination with cetuximab or panitumumab, after prior therapy, for the treatment of patients with mCRC with a BRAF V600E mutation.
One clinician input submission came from a group of Canadian clinicians who were investigators in the BEACON CRC trial, along with a submission from the CGOEN and select members of the CCC Medical Advisory Board. The input noted that the CCC Medical Advisory Board works alongside the patient group to ensure that activities and health information are useful and relevant to patients and caregivers. They provide oversight of health-related information, identify treatment and access issues, and provide a link to the Canadian medical community. Additionally, the CGOEN was noted as a recently formed virtual network of Canadian gastrointestinal oncology clinicians who contribute knowledge on gastrointestinal cancer and treatments, participate in clinical trials, conduct observational research, and are involved in local, provincial, and national clinical guideline developments and health technology assessments. Information for the input from this group of clinicians was gathered through personal experience in treating patients with mCRC with a BRAF V600E mutation. The group also conducted a literature review and held a virtual discussion among experts.
A joint clinician input was received on behalf of 9 gastrointestinal clinicians who treat mCRC. The clinicians who provided input were located across Canada. CCRAN assisted with the coordination of the joint clinician input. CCRAN prepared a clinician survey based on input on a template received from the lead clinician on the review. The survey opened on December 14, 2020 and closed on January 10, 2021. The joint input was circulated on January 15, 2021 to clinicians for feedback and additional input.
Additionally, a third input was received on behalf of the OH-CCO DAC. That input noted the DAC’s role in supporting OH-CCO’s mandate, including provincial drug reimbursement programs and the Systemic Treatment Program. The input was collected and jointly discussed at a DAC meeting.
Unmet Needs
The CGOEN clinician input noted that BRAF V600E–mutated mCRC is an aggressive form of colon cancer and the options for standard of care have limited efficacy. The input indicated that BRAF V600E mutations are present in up to 15% of patients with mCRC and these patients have a poor prognosis. The current standard of care in first-line treatment of BRAF-mutated colorectal cancer, as noted by CGOEN, is chemotherapy plus bevacizumab. The clinician input also noted that OS for this population is approximately 11 months in clinical trials and is about 1-third of what would be expected for patients without the BRAF mutation.23 The clinicians also noted that many of these patients are too unwell to undergo cytotoxic chemotherapy, and population-based survival is expected to be around 6 months, with only 60% of patients undergoing first-line chemotherapy.29
The joint clinician input from the 9 clinicians provided through CCRAN noted that before the results of the BEACON study, the standard of care for Canadian patients with mCRC and the BRAF V600E mutation was standard chemotherapy such as FOLFOX or FOLFIRI, with or without a biologic drug. The clinicians noted that the benefit of these chemotherapies in this population is substantially inferior, with worse OS and tumour response rates. The 9 clinicians noted that encorafenib and cetuximab specifically target the BRAF V600E mutation and the feedback loop that affects tumour growth.
Input submitted on behalf of the OH-CCO’s DAC added that patients are currently treated with 5-fluorouracil backbone regimens (FOLFIRI, FOLFOX, FOLFOXIRI, folinic acid plus 5-fluorouracil, irinotecan, and oxaliplatin [FOLFIRINOX]) with or without biologics (i.e., bevacizumab) or anti-EGFR therapy, and that only panitumumab is funded in the first-line setting in Ontario for patients who are contraindicated for bevacizumab.
All 3 clinician inputs noted the V600E mutation accounts for more than 90% of BRAF mutations in colorectal cancer and, despite major improvements in survival for advanced colorectal cancer, patients with BRAF mutations continue to have a very poor prognosis. The clinicians also noted the prognosis in this group of patients with metastatic disease is significantly worse than among those who do not have this mutation, with a median survival of fewer than 12 months compared with greater than 30 months in patients without metastatic disease. The group added that patients with the BRAF V600E mutation have a particularly grim prognosis. All 3 clinician inputs noted that the most important treatment goals are to prolong life, delay disease progression, and improve quality of life or performance status (which could help promote independence while reducing the burden on caregivers). Additionally, the clinician inputs also noted that patients with this mutation have a higher incidence of peritoneal disease and fewer liver-only metastases, making long-term treatment strategies less likely to benefit. The CGOEN input noted that peritoneal metastases could lead to challenges in maintaining patients’ quality of life due to intermittent bowel obstructions and abdominal pain.
For the current needs that are not being met by available therapies, all 3 inputs noted that patients with BRAF-mutant mCRC exhibit decreased sensitivity to chemotherapy and derive little benefit from existing standard therapies. The inputs noted this is most pronounced in the second- and third-line settings. The CGOEN clinician input group also added that not only do these patients have a poor response to chemotherapy, anti–EGFR antibody drugs (a standard drug for RAS wild-type colorectal cancer) do not work in this population without the addition of a BRAF-directed drug. The input from CGOEN noted that a considerable proportion of patients might not be able to receive second-line chemotherapy due to rapid progression and declining performance status. Due to the rapid attrition of patients with this type of colorectal cancer, the input from CGOEN noted a need for more effective therapies. The group added that only 60% of all patients with the mutation receive a first-line therapy, and approximately 20% receive a third line.29 Additionally, the input from 9 clinicians note response rates to second-line chemotherapies and third-line anti-EGFR therapies were significantly inferior compared with tumours that do not have the V600E mutation.
All 3 clinician inputs noted that the greatest unmet need is for patients who have the V600E BRAF mutation, as they have a particularly grim prognosis and represent a population with 1 of the greatest unmet needs within colorectal cancer. The drug under review, encorafenib plus cetuximab, is noted by CGOEN as the first FDA-approved targeted regimen that is specifically for adults with previously treated mCRC with a BRAF V600E mutation. The clinicians indicated that the majority of goals are not met by the currently available standard-of-care therapies in Canada for patients whose tumours have the BRAF V600E mutation. The clinicians also noted that no treatments have been available that have demonstrated an improvement in survival, until now, and that the therapy under review provides these patients with the highest chance of PFS and maintaining HRQoL.
Place in Therapy
The clinicians from CGOEN noted that encorafenib plus cetuximab is the first targeted regimen specifically for adults with previously treated mCRC with a BRAF V600E mutation. The clinicians added that this treatment combination would be used following disease progression after 1 or more previous chemotherapy regimens. The clinicians from CGOEN added that following disease progression or intolerance after classical fluoropyrimidine plus irinotecan- or oxaliplatin-containing chemotherapy regimens, there are no other appropriate treatments in this setting to recommend to patients because of the rapid progression of these cancers while receiving chemotherapy. The clinicians noted that clinical trials may still be considered for certain patients. Input collected through CCRAN from 9 clinicians added that encorafenib would be used in combination with cetuximab in the second-line setting for patients with mCRC whose tumours have the BRAF V600E mutation.
For the sequencing of therapies, the clinician input from CGOEN noted that, currently, fluoropyrimidine with or without an additional drug (irinotecan or oxaliplatin) appears to be the most appropriate initial management approach for patients with BRAF-mutant mCRC. The CGOEN clinicians noted that more intensive chemotherapy regimens such as FOLFOXIRI may also be used in the first line to overcome the resistance to chemotherapy in BRAF-mutant mCRC; however, it is not often an option, as this combination of 4 medications can be very toxic to some patients. Clinician input from CGOEN also highlighted that single-drug BRAF inhibitors do not have significant activity in BRAF V600E mCRC, and that treatment following progression on prior chemotherapy with doublet treatment of encorafenib (a BRAF inhibitor) and cetuximab (an EGFR inhibitor) would represent a long-awaited improvement in the treatment algorithm for BRAF V600E mCRC. The clinician group noted that the combination would become a new standard of care that both improves patient outcomes and HRQoL. Similarly, the 9 clinicians who provided input through CCRAN noted that encorafenib in combination with cetuximab has demonstrated clinical efficacy in patients who have previously received first-line standard-of-care therapy and subsequently received the therapy in the second-line setting. The 9 clinicians added there may be a shift of existing second-line chemotherapy such as FOLFOX or FOLFIRI to the third-line setting. The clinicians also added that if encorafenib plus cetuximab fails, patients would not receive any further anti-EGFR therapy in a subsequent line of therapy. The clinician input from OH-CCO’s DAC added that, currently, patients with a contraindication to bevacizumab can receive panitumumab in the first-line setting. The OH-CCO’s DAC clinicians noted there is uncertainty whether these patients can be treated with panitumumab (or another EGFR inhibitor) again in a later line, and that the BEACON study was not able to inform on this.
Patient Population
All clinician inputs agreed that patients with BRAF V600E–mutated mCRC who have had progression after 1 or more previous lines of therapy are best suited for treatment with encorafenib and cetuximab. The input collected from 9 clinicians by CCRAN specified that patients best suited for treatment with encorafenib plus cetuximab would be patients with BRAF V600E–mutated mCRC who have previously received first-line chemotherapy, have preserved ECOG PS (0 to 2), and who have adequate organ function. The input from OH-CCO’s DAC added that patients should have good performance status and the criteria for treatment should be as per the pivotal trial’s inclusion criteria.
With respect to identifying patients best suited for treatment with the drug under review, the CGOEN clinician input noted that BRAF mutation is an important prognostic factor and detection of the BRAF V600E mutation in mCRC identifies a subgroup of patients who derive little benefit from standard therapies and who have an extremely poor prognosis. The CGOEN clinician input noted the detection of this mutation has predictive value for identifying patients suitable for BRAF V600E–targeted treatment with encorafenib and cetuximab.30 The clinician input from CCRAN collected from 9 clinicians notes that tumours would have to be tested for the presence of the BRAF V600E mutation, and that patients should have their tumours tested at the time of diagnosis of metastatic disease. The CGOEN clinician input also added that molecular profiling is essential for the treatment of mCRC when surgery cannot be considered and systemic therapy is recommended; the CGOEN input also added that the clinical application of biomarkers in colorectal cancer are needed for prognostic stratification, surveillance, and therapy selection. Available testing methods at many centres were identified to be immunohistochemistry (IHC) and NGS testing.
The patients who would be least suited for treatment with encorafenib and cetuximab were those who are unable to take oral medications or who have an ECOG PS greater than 2, as per the CGOEN clinician input. The clinician inputs from CGOEN and the OH-CCO’s DAC also noted that the drug under review is associated with a companion diagnostic that already selects the population that is most likely to benefit. The 9 clinicians who provided input through CCRAN noted that patients with a poor ECOG status (> 2) and tumours with non-V600E mutations would be least suited for treatment.
Assessing Response to Treatment
The CGOEN clinician input noted that treatment would be continued if the disease is stable or if it shows a response, has good tolerance, and no limiting side effects. The outcomes used in clinical practice were noted in the CCRAN and CGOEN clinician inputs as being in line with what was used in the clinical trials; according to the 9 clinicians, these include tumour response by imaging (CT and/or MRI), clinical symptom (including toxicity) assessment, CEA measurement, and HRQoL assessment. Input from the OH-CCO’s DAC added that CEA, biochemistry, standard imaging, and clinical improvement are outcomes used to determine whether a patient is responding to treatment in clinical practice. The 9 clinicians from CCRAN added that a clinically meaningful response to the treatment includes a reduction in tumour volume (by imaging), improvement or stabilization of disease-related symptoms (pain, dyspnea, fatigue, weight loss), improvement in performance status, improvement in survival and PFS, ability to perform activities in daily living, improvement or maintenance of HRQoL, and perhaps a reduction in CEA correlating with any of the other responses listed in this section, most notably with a reduction in tumour volume through imaging. The OH-CCO’s DAC clinicians agreed that reduction in the frequency or severity of symptoms, ability to perform activities of daily living, improvement in symptoms, and stabilization (no deterioration of symptoms) would be considered a clinically meaningful response to treatment. The CGOEN clinician input added that the patient’s wishes and decisions are also part of the decision to continue or stop treatment.
The CGOEN clinician input noted that patients will typically have a CT scan performed every 2 to 3 months to assess response to treatment. The 9 clinicians noted that clinical response assessments can be performed every 2 to 4 weeks. Tumour response assessment through radiographic imaging should be performed every 8 to 12 weeks and a CEA measurement should be considered every 4 weeks. The OH-CCO’s DAC clinicians noted that treatment response should be assessed as per the clinical review of a patient, per current standard-of-care practices.
The CGOEN clinician input noted that OS is the most important measure for a clinically meaningful outcome, though PFS and ORR are commonly used end points in clinical trials for mCRC. Delaying worsening in quality of life related to progressive cancer was also noted as an important factor and treatment goal by the CGOEN clinician input. Clinically meaningful response to treatment was noted in the CGOEN input as a reduction in the frequency or severity of symptoms specific to colorectal cancer, and a reduction in abdominal pain, rectal bleeding, anemia, and constipation.
Discontinuing Treatment
The clinician input from CGOEN noted that treatment should be discontinued when there is intolerance to treatment. All clinician inputs agreed that treatment discontinuation should be based on evidence of disease progression based on patients’ clinical status and through objective radiographic imaging, intolerable toxicities, and patient preferences.
Prescribing Conditions
The clinician input from CGOEN noted that the appropriate setting for administration should be an approved oncology infusion clinic in an outpatient setting, because of the cetuximab component, which is administered intravenously. However, the input added that encorafenib can be taken at home, as prescribed by a medical oncologist. The 9 clinicians whose input was collected by CCRAN noted that most practices, including community hospitals and large cancer centres, have physician, pharmacy, and nursing expertise in treating patients with colorectal cancer and thus should be able to care for patients receiving encorafenib plus cetuximab, given appropriate knowledge translation. Input from the OH-CCO’s DAC added that outpatient chemotherapy suites for cetuximab plus panitumumab, and the community setting for encorafenib as an oral take-home cancer drug, are the most appropriate settings.
Additional Considerations
The clinician input from CGOEN indicated there is considerable urgency to have this therapy available to Canadian patients. The CGOEN input also noted that encorafenib plus cetuximab is the first targeted regimen specifically for adults who have been previously treated for mCRC and who have the BRAF V600E mutation. The CGOEN input added there is significant unmet need for patients with the BRAF V600E mutation.
The 9 clinicians who provided input through CCRAN noted that, given the association between BRAF mutations and MSI status and the emerging data on the use of immune checkpoint inhibitors in patients with high MSI tumours, the role of drugs such as pembrolizumab in those with BRAF V600E and high MSI tumours is not yet defined.
The OH-CCO’s DAC added that anti-EGFR therapy should be funded in the second- or third-line setting, as per the BEACON trial.
Drug Program Input
The drug programs provide input on each drug being reviewed through CADTH’s Reimbursement Review processes by identifying issues that may impact their ability to implement a recommendation. The implementation questions and corresponding responses from the clinical experts consulted by CADTH are summarized in Table 4.
Table 4: Summary of Drug Plan Input and Clinical Expert Response
Drug program implementation questions | Clinical experts’ response |
|---|---|
Does encorafenib need to be used with cetuximab or can encorafenib be used with either cetuximab or panitumumab (choice of cetuximab or panitumumab left to the physician’s discretion)? | Given that panitumumab is administered once every 2 weeks, while cetuximab is administered once weekly, and given that cetuximab requires longer chair time due to support medications and longer infusion time, the clinical experts consulted by CADTH indicated they would consider using encorafenib in combination with panitumumab to save chair time. Also, if patients experience an allergic reaction due to cetuximab, then patients might switch treatment to panitumumab. |
The BEACON trial reviewed cetuximab in combination with encorafenib. Are the results from the BEACON trial generalizable to panitumumab and encorafenib combination (i.e., can panitumumab and encorafenib be recommended in the same manner as cetuximab and encorafenib)? | The clinical experts indicated there is no evidence currently available on encorafenib in combination with panitumumab. However, the clinical experts indicated that patients who receive encorafenib in combination with panitumumab would respond in the same manner as patients who receive encorafenib in combination with cetuximab, given that efficacy of panitumumab is similar to that of cetuximab. |
Are patients who were treated previously with cetuximab or panitumumab eligible for encorafenib in combination with cetuximab or panitumumab? | Given the lack of options, some patients previously treated with cetuximab or panitumumab might be treated with encorafenib in combination with cetuximab or panitumumab. |
Are patients with the BRAF V600K mutation eligible for encorafenib with cetuximab or panitumumab? Is there potential to use encorafenib in patients with other BRAF V600 mutations? | The BEACON trial enrolled patients with the BRAF V600E mutation. Use of the therapy should be as per the BEACON trial. The clinical experts confirmed that treatment with encorafenib plus cetuximab should not be generalized to patients with other BRAF V600 mutations, and treatment with encorafenib plus cetuximab should be limited to patients with a BRAF V600E mutation. |
Is there potential to use encorafenib in patients whose BRAF status cannot be determined? | Encorafenib is a BRAF inhibitor; therefore, the presence of the BRAF mutation should be confirmed for patients to be eligible. The clinical experts confirmed that treatment with encorafenib plus cetuximab should be limited to patients with a BRAF V600E mutation. |
Are results from the BEACON trial generalizable to patients with ECOG PS > 1, as only ECOG 0 and 1 were included in the BEACON trial? | The BEACON trial enrolled patients with an ECOG PS of 0 (50%) or 1 (49%). There were 4 patients (1.8%) enrolled with an ECOG PS of 2 in the doublet encorafenib plus cetuximab group of the BEACON trial.14 The clinical experts indicated that while results from the BEACON trial are not generalizable to patients with ECOG PS 2, they expect that some patients with ECOG PS 2 would receive treatment with encorafenib plus cetuximab. |
Some patients have mCRC that is positive for both the BRAF mutation and MSI-H. Pembrolizumab is currently under review for MSI-H. Is there evidence recommending a first-line treatment for MSI-H instead of the BRAF mutation, or vice versa, in such patients? | Given the evidence available from the Keynote-177 study, the clinical experts indicated that patients should be treated for MSI-H with pembrolizumab as first line, and then treat with encorafenib in combination with cetuximab or panitumumab as a second line. |
The product monograph states that encorafenib should be discontinued if cetuximab has to be discontinued. If cetuximab or panitumumab is discontinued, then should encorafenib be discontinued and vice versa? | The clinical experts indicated that if cetuximab or panitumumab is discontinued, then encorafenib should be discontinued as well. |
PAG is seeking clarity regarding the dosing, schedule or frequency, and dose intensity: Encorafenib dosage for mCRC is 300 mg daily. However, its dosage for melanoma is 450 mg per day; thus, awareness and vigilance will be needed to ensure the correct dosage for the tumour being treated. Encorafenib is available as a 75 mg capsule; a full dosage to treat mCRC would require 4 capsules (300 mg) once daily. How will encorafenib be packaged (bottle, blister packaging, quantity)? How frequently were dose interruptions and delays required in the BEACON trial? What was the dose intensity of encorafenib? | The sponsor confirmed that encorafenib will be packaged in the following formats31:
AEs resulting in dose interruptions of any treatment in the doublet group of the BEACON trial occurred among 98 patients (45.4%). The mean dose intensity of encorafenib in the BEACON trial for the doublet group was 262.78 mg/day (SD = 58.586). The relative dose intensity was 87.59% (SD = 19.53).31 |
AE = adverse event; CRP = C-reactive protein; ECOG PS = Eastern Cooperative Oncology Group Performance Status; mCRC = metastatic colorectal cancer; MSI-H = high microsatellite instability; PAG = Provincial Advisory Group; SD = standard deviation.
Clinical Evidence
The clinical evidence included in the review of encorafenib plus cetuximab is presented in 3 sections. The first section, the systematic review, includes pivotal studies provided in the sponsor’s submission to CADTH and Health Canada, as well as those studies that were selected according to an a priori protocol. The second section includes indirect evidence from the sponsor that met the selection criteria specified in the review. The third section includes sponsor-submitted long-term extension studies and additional relevant studies that were considered to address important gaps in the evidence included in the systematic review.
Systematic Review (Pivotal and Protocol Selected Studies)
Objectives
To perform a systematic review of the beneficial and harmful effects of encorafenib in combination with cetuximab and route of administration for the treatment of mCRC in adult patients with a BRAF V600E mutation, after prior therapy.
Methods
Studies selected for inclusion in the systematic review included pivotal studies provided in the sponsor’s submission to CADTH and Health Canada, as well as those meeting the selection criteria presented in Table 5. Outcomes included in the CADTH review protocol reflect outcomes considered to be important to patients, clinicians, and drug plans.
Of note, the systematic review protocol presented in the following table was established before the granting of a Notice of Compliance from Health Canada.
Table 5: Inclusion Criteria for the Systematic Review
Patient population | Adults (≥ 18 years of age) with mCRC with a BRAF V600E mutation who have received prior therapy. Subgroups:
| |
Intervention | Encorafenib (300 mg once daily) in combination with cetuximab (400 mg/m2 followed by 250 mg/m2 IV every week) | |
Comparators | Irinotecan plus cetuximab Irinotecan plus panitumumab FOLFIRI plus cetuximab FOLFIRI plus panitumumab Regorafenib Trifluridine plus tipiracil | FOLFOX CAPEOX FOLFIRI Irinotecan FOLFOX plus cetuximab FOLFOX plus panitumumab |
Outcomes | Efficacy outcomes:
Harms outcomes:
| |
Study design | Published and unpublished phase III and 4 RCTs | |
AE = adverse event; CAPEOX = capecitabine plus oxaliplatin; ECOG PS = Eastern Cooperative Oncology Group performance status; FOLFIRI = folinic acid plus 5-fluorouracil plus irinotecan; FOLFOX = folinic acid plus 5-fluorouracil and oxaliplatin; HRQoL = health-related quality of life; mCRC = metastatic colorectal cancer; MSI = microsatellite instability; RCT = randomized controlled trial; SAE = serious adverse event; TEAE = treatment-emergent adverse event; WDAE = withdrawal due to adverse event.
The literature search for clinical studies was performed by an information specialist using a peer-reviewed search strategy according to the PRESS Peer Review of Electronic Search Strategies checklist (https://www.cadth.ca/resources/finding-evidence/press).32
Published literature was identified by searching the following bibliographic databases: MEDLINE All (1946‒) through Ovid and Embase (1974‒) through Ovid. The search strategy comprised both controlled vocabulary, such as the National Library of Medicine’s MeSH (Medical Subject Headings), and keywords. The main search concept was Braftovi (encorafenib). Clinical trials registries were searched: the US National Institutes of Health’s clinicaltrials.gov, Health Canada’s Clinical Trials Database, and the European Union Clinical Trials Register.
No filters were applied to limit the retrieval by study type. Retrieval was not limited by publication date or by language. Conference abstracts were excluded from the search results. See Appendix 1 for the detailed search strategies.
The initial search was completed on January 20, 2021. Regular alerts updated the search until the meeting of the CADTH pan-Canadian Oncology Drug Review Expert Review Committee (pERC) on May 15, 2021.
Grey literature (literature that is not commercially published) was identified by searching relevant websites from the Grey Matters: A Practical Tool For Searching Health-Related Grey Literature checklist (https://www.cadth.ca/grey-matters).14 Included in this search were the websites of regulatory agencies (US FDA and European Medicines Agency). Google was used to search for additional internet-based materials. See Appendix 1 for more information on the grey literature search strategy.
Two CADTH clinical reviewers independently selected studies for inclusion in the review based on titles and abstracts, according to the predetermined protocol. Full-text articles of all citations considered potentially relevant by at least 1 reviewer were acquired. Reviewers independently made the final selection of studies to be included in the review, and differences were resolved through discussion.
A focused literature search for network meta-analyses (NMAs) dealing with colorectal cancer was run in MEDLINE All (1946–) on January 20, 2021. No limits were applied.
Findings From the Literature
One study was identified from the literature for inclusion in the systematic review (Figure 1). The included study is summarized in Table 6. A list of excluded studies is presented in Appendix 2.
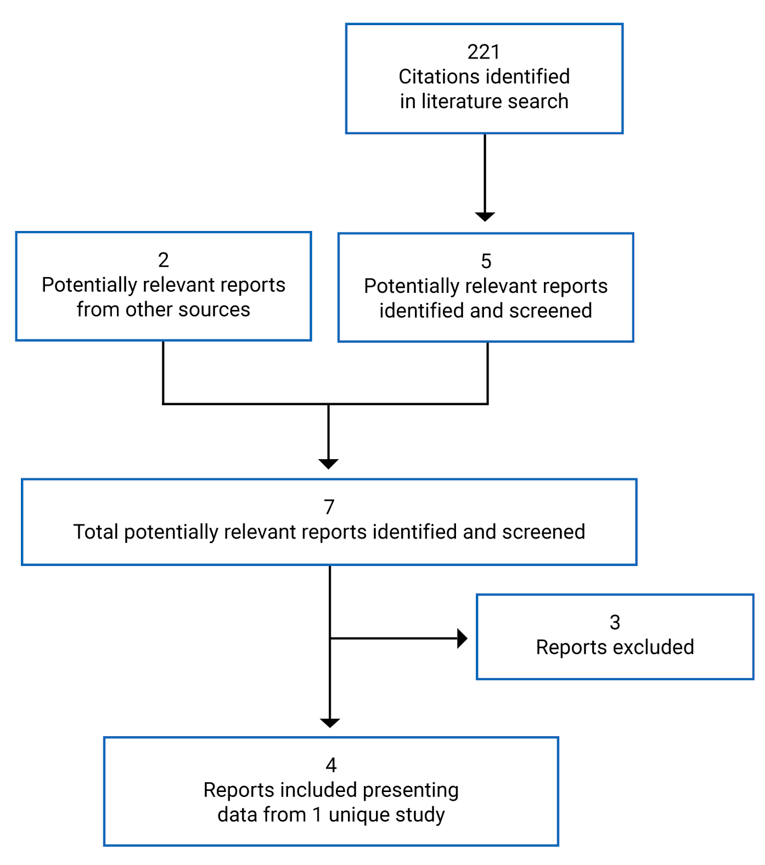
Table 6: Details of Included Studies — BEACON
Detail | BEACON |
|---|---|
Designs and populations | |
Study design | Multi-centre, open-label, active-controlled, randomized controlled trial |
Locations | 221 sites in 28 countries: Europe (111 sites), North America (36 sites), rest of the world (74 countries) |
Patient enrolment dates | May 4, 2017 to January 31, 2019 |
Randomized (N) | 665 |
Inclusion criteria |
|
Exclusion criteria |
|
| |
Drugs | |
Intervention | Encorafenib plus cetuximab (doublet regimen):
|
Comparator(s) | FOLFIRI plus cetuximab or irinotecan plus cetuximab (control regimen) Irinotecan plus cetuximab:
FOLFIRI plus cetuximab:
|
Outcomes | |
Primary end point | ORR (triplet vs. control): ORR was defined as the number of patients achieving a BOR of CR or PR divided by the total number of patients in that treatment group. The BOR (i.e., CR or PR) was assessed by BICR and investigator according to RECIST v1.1 criteria. OS (triplet vs. control): OS was defined as the time from randomization to death due to any cause. |
Key secondary end points | OS (doublet vs. control group) ORR (doublet vs. control) PFS (triplet vs. control) PFS (doublet vs. control) |
Notes | |
Publications | Kopetz et al. (2019)33 Kopetz et al. (2019)34 Kopetz et al. (2020)30 Tabernero et al. (2021)16 |
5-FU = 5-fluorouracil; ANC = absolute neutrophil count; BICR = blinded independent central review; BOR = best overall response; CK = creatine kinase; CR = complete response; CTCAE = Common Terminology Criteria for Adverse Events; DB = double blind; ECHO = echocardiogram; ECOG PS = Eastern Cooperative Oncology Group performance status; EGFR = epidermal growth factor receptor; FOLFIRI = folinic acid plus 5-fluorouracil and irinotecan; GI = gastrointestinal; HBV = hepatitis B virus; HCV = hepatitis C virus; IBD = inflammatory bowel disease; MEK = mitogen-activated protein kinase kinase; MUGA = multigated acquisition; NGS = next-generation sequencing; ORR = objective response rate; OS = overall survival; PCR = polymerase chain reaction; PFS = progression-free survival; PR = partial response; RAF = rapidly accelerated fibrosarcoma; RCT = randomized controlled trial; RECIST = Response Evaluation Criteria in Solid Tumors; RVO = retinal vein occlusion; ULN = upper limit of normal.
Description of Studies
One multi-centre, multinational, randomized, open-label, phase III study met the criteria for the CADTH systematic review protocol. The BEACON trial (N = 665) was a 3-group study evaluating the efficacy and safety of encorafenib plus cetuximab, and encorafenib plus cetuximab and binimetinib, compared with the investigator’s choice of either irinotecan or cetuximab, or FOLFIRI or cetuximab (control group). Eligible patients included adults with mCRC whose tumours expressed the BRAF V600E mutation and whose disease had progressed after 1 or 2 prior regimens in the metastatic setting. Patients were randomized to each treatment group in a 1:1:1 ratio using an interactive web response system (IWRS). Randomization was stratified according to baseline ECOG PS (0 versus 1), prior use of irinotecan (yes versus no), and cetuximab source (US-licensed versus EU-approved).14 The randomization schedule was created and managed by an independent statistician, and treatments were assigned according to a computerized central randomization list using an IWRS. As per the protocol of the trial, the number of patients who would be receiving third-line treatment was limited, to account for no more than 35% of all randomized patients (n = 215). Once the maximum number of patients who had already received 2 prior regimens was reached, only patients who had received 1 prior regimen were to be randomized; patients who had received 2 prior regimens who had entered the trial during the screening period after the limit was reached were permitted to continue into the trial if they were determined to be eligible.14
This international trial was conducted in 28 countries across 221 sites14; a total of 7 Canadian patients were enrolled in the BEACON trial.25 The BEACON trial was initiated with a safety lead-in phase that assessed the safety and tolerability of encorafenib plus cetuximab and binimetinib; the results of the safety lead-in phase are not discussed in this CADTH report, as only the triplet regimen containing encorafenib was administered to patients. An overview of the BEACON trial is illustrated in Figure 2. The BEACON trial is currently ongoing, although enrolment was completed on February 11, 2019.14 Efficacy analyses for the BEACON trial were based on 2 data cut-off dates: February 11, 2019 and August 15, 2019. The end-of-study period was defined as the point when all patients had the opportunity to be followed for a minimum of 1 year after the randomization date of the last enrolled patient, and once a minimum of 80% of patients had an OS event or were lost to follow-up. Patients still receiving the study treatment at the end of the study period were permitted to continue treatment at the discretion of the investigator and as long as the treatment discontinuation criteria were met. Access to study treatments was provided in accordance with local regulations and requirements.14 The original version of the trial protocol did not permit crossover within the trial; an amendment was made on July 11, 2019 that allowed patients in the control group to cross over to treatment with the triplet regimen.33
Figure 2: BEACON Trial Study Design
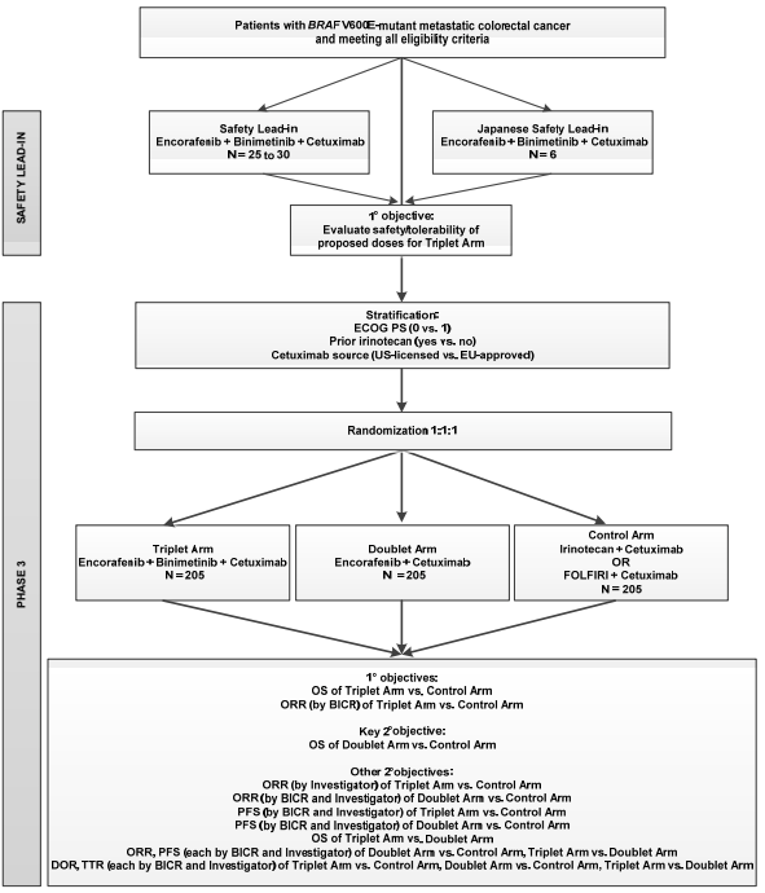
BICR = blinded independent central review; DOR = duration of response; ECOG = Eastern Cooperative Oncology Group; FOLFIRI = folinic acid plus 5-fluorouracil and irinotecan; JSLI = Japanese safety lead-in; ORR = objective response rate; OS = overall survival; PFS = progression-free survival; PS = performance status; SLI = safety lead-in; TTR = time to response; vs. = versus .
Note: The study was initiated with the SLI cohort (US and EU), in which the safety and tolerability of the triplet combination of encorafenib + binimetinib + cetuximab were assessed before initiation of the randomized phase III portion of the study. The JSLI cohort (Japan) was conducted later and before initiation of randomization in Japan.
Source: BEACON Clinical Study Report.14
BRAF Mutation Testing: Testing for the BRAF V600E mutation occurred in a central laboratory as part of the molecular pre-screening for the trial or through a local assay result obtained any time before screening. Only PCR or NGS local assay testing was accepted; patients enrolled based on local assays were required to have their BRAF mutation status confirmed by central laboratories no later than 30 days from the first dose of study treatment. Patients whose local assays were not confirmed within 30 days of initiation of study treatment via central laboratory testing, or whose tumour testing could not be conducted centrally due to an inadequate sample or poor sample condition, were permitted to continue receiving treatment if there was no indication of deterioration or disease progression and if the treating investigator determined the patient was deriving a benefit.12
Centrally tested tumour samples confirming local assays for BRAF status were not permitted to be retested if a discordant result was observed. A maximum of 37 patients (6% of the total planned enrolment) lacking BRAF V600E mutation status were permitted to be enrolled, and a maximum of 1 patient (3% of the total planned enrolment) with a discordant local and centrally assessed assay was permitted to be enrolled within the trial; subsequently enrolled patients were required to have their mutation status tested via a central laboratory.12
Molecular Pre-Screening: Patients were able to undergo BRAF mutation screening via a central laboratory before the screening such that molecular pre-screening criteria were met (Table 7).
Table 7: Inclusion and Exclusion Criteria for Molecular Pre-Screening
Inclusion criteriaa | Exclusion criteriab |
|---|---|
Provide a signed and dated pre-screening informed consent document Age ≥ 18 years at time of informed consent Histologically or cytologically confirmed colorectal cancer that is metastatic Eligible to receive cetuximab per locally approved label regarding tumour RAS status Able to provide a sufficient amount of representative tumour specimen (primary or metastatic, archival or newly obtained) for central laboratory testing of BRAF and KRAS mutation status (minimum of 6 slides; optimally, up to 15 slides) | Leptomeningeal disease History or current evidence of RVO or current risk factors for RVO (e.g., uncontrolled glaucoma or ocular hypertension, history of hyperviscosity or hypercoagulability syndromes) Known history of acute or chronic pancreatitis History of chronic inflammatory bowel disease or Crohn disease requiring medical intervention (immunomodulatory or immunosuppressive medications or surgery) ≤ 12 months before randomization Concurrent neuromuscular disorder that is associated with the potential of elevated CK (e.g., inflammatory myopathies, muscular dystrophy, amyotrophic lateral sclerosis, spinal muscular atrophy) Known history of HIV infection Known history of Gilbert syndrome or known to have any of the following genotypes: UGT1A1*6/*6, UGT1A1*28/*28, or UGT1A1*6/*28 Known contraindication to receive cetuximab or irinotecan at the planned doses; refer to the most recent cetuximab and irinotecan summary of product characteristics or local label, as applicable Prior anti-EGFR treatment More than 2 prior regimens in the metastatic settingc,d |
CK = creatine kinase; EGFR = epidermal growth factor receptor; RVO = retinal vein occlusion.
aAll of the listed criteria had to be met for patients to be eligible for molecular tumour pre-screening.
bPatients who met any of the listed exclusion criteria were not eligible for molecular tumour pre-screening.
cDisease relapse during treatment or within 6 months following adjuvant therapy will be considered metastatic disease.
dMaintenance therapy given in the metastatic setting will not be considered a separate regimen.
Source: BEACON trial protocol.12
Tumour Assessments: Tumour assessments were to be performed every 6 weeks (± 7 days) from the date of randomization for the first 24 weeks of treatment, then every 12 weeks thereafter until disease progression, withdrawal of consent, initiation of subsequent anti-cancer therapy, or the patient was lost to follow-up or died, regardless of whether treatment had been discontinued.12
Populations
Inclusion and Exclusion Criteria
Eligibility criteria for the BEACON trial are reported in Table 6. Briefly, eligible patients included adults with histologically or cytologically confirmed mCRC whose tumours expressed the BRAF V600E mutation and whose disease had progressed after 1 or 2 prior regimens in the metastatic setting. Enrolled patients had to have an ECOG PS of 0 or 1 and adequate vital functions, and had to be able to take oral medications. Exclusion criteria included previous treatment with a RAF or MEK inhibitor, or cetuximab, panitumumab, or other EGFR inhibitors. Patients unable to tolerate irinotecan and with concurrent malignancies were also not eligible for enrolment.33
Baseline Characteristics
In general, demographic characteristics were balanced across both the doublet and control groups. Patients had a mean age of 59 years, were mostly from Europe (61%) or the rest of the world (26%), and were mostly White (81%). However, slightly more patients in the doublet group were male compared with the control group (52% versus 43%, respectively). In addition, more patients in the doublet group than in the control group were from Europe (66% versus 57%, respectively), whereas more patients in the control group were from the rest of the world (30% versus 21%); approximately 13% of patients were from North America in both treatment groups. The clinical experts consulted by CADTH for this review indicated that differences in demographic characteristics were not expected to impact patient outcomes in the BEACON trial.14
Clinical characteristics were similar across both treatment groups. Similar proportions of patients had an ECOG PS of 0 (50%) or 1 (49%), and all patients were diagnosed with stage IV disease at study entry. Forty-two percent of patients had a primary tumour location in the right colon, 34% of patients had a primary tumour location in the left colon, and 56% of patients had their tumour completely resected. Two-thirds of patients had received 1 prior regimen, with the remaining patients having received 2 prior regimens; only 1 patient had received more than 2 prior regimens and this patient was randomized to the control group. Most patients (92%) had liver metastases and had an MSI status of normal, as assessed via PCR (69%); more patients in the control group had missing data regarding their MSI status (23% versus 12%).14
Within the control group, 92 patients (41.6%) received cetuximab plus irinotecan and 129 patients (58.4%) received cetuximab plus FOLFIRI. Among 92 patients in the control group who received cetuximab plus irinotecan, 50 (54.3%) received 1 prior systemic therapy, while 41 patients (44.6%) received 2 prior therapies and 1 patient received greater than 2 therapies. Among the 129 patients in the control group who received cetuximab plus FOLFIRI, 95 patients (73.6%) received 1 prior systemic therapy and 34 patients (26.4%) received 2 prior therapies (Table 9).13
Table 8: Summary of Baseline Characteristics (data cut-off: August 15, 2019)
Characteristic | BEACON | |
|---|---|---|
Encorafenib plus cetuximab (N = 220) | Control group (N = 221) | |
Sex, n (%) | ||
Male | 114 (51.8) | 94 (42.5) |
Female | 106 (48.2) | 127 (57.5) |
Age (years), mean (SD) | 60.2 (11.65) | 58.4 (12.07) |
Age category, n (%) | ||
< 65 years | 137 (62.3) | 149 (67.4) |
65 to < 75 years | 63 (28.6) | 55 (24.9) |
≥ 75 years | 20 (9.1) | 17 (7.7) |
Region, n (%) | ||
North America | 29 (13.2) | 29 (13.1) |
Europe | 144 (65.5) | 125 (56.6) |
Rest of world | 47 (21.4) | 67 (30.3) |
Race, n (%) | ||
American Indian or Alaska Native | 1 (0.5) | 0 (0.0) |
Asian | 25 (11.4) | 39 (17.6) |
Japanese | 6 (2.7) | 11 (5.0) |
Korean | 13 (5.9) | 19 (8.6) |
White | 183 (83.2) | 172 (77.8) |
Black or African American | 0 (0.0) | 0 (0.0) |
Other | 3 (1.4) | 3 (1.4) |
Not reported due to confidentiality reason | 8 (3.6) | 7 (3.2) |
ECOG PS at baseline, n (%) | ||
0 | 112 (50.9) | 108 (48.9) |
1 | 104 (47.3) | 113 (51.1) |
2 | 4 (1.8) | 0 (0.0) |
Stage at study entry, n (%) | ||
Stage IV | 220 (100.0) | 221 (100.0) |
Primary tumour location, n (%) | ||
Left colon | 83 (37.7) | 68 (30.8) |
Right colon | 110 (50.0) | 119 (53.8) |
Left and right colon | 11 (5.0) | 22 (10.0) |
Unknown | 16 (7.3) | 12 (5.4) |
Primary tumour removed, n (%) | ||
Completely resected | 123 (55.9) | 122 (55.2) |
Partially resected or unresected | 97 (44.1) | 99 (44.8) |
Number of prior systemic regimens for metastatic disease, n (%) | ||
1 | 146 (66.4) | 145 (65.6) |
2 | 74 (33.6) | 75 (33.9) |
> 2 | 0 | 1 (0.5) |
Number of organs involved, mean (SD) | 3 (1.4) | 3 (1.3) |
Liver metastases, n (%) | ||
No | 86 (39.1) | 93 (42.1) |
Yes | 134 (60.9) | 128 (57.9) |
Only liver metastases, n (%) | ||
No | 199 (90.5) | 208 (94.1) |
Yes | 21 (9.5) | 13 (5.9) |
Lung metastases, n (%) | ||
No | 137 (62.3) | 135 (61.1) |
Yes | 83 (37.7) | 86 (38.9) |
Lymph node metastases, n (%) | ||
No | 138 (62.7) | 133 (60.2) |
Yes | 82 (37.3) | 88 (39.8) |
Peritoneum or omentum metastases, n (%) | ||
No | 123 (55.9) | 128 (57.9) |
Yes | 97 (44.1) | 93 (42.1) |
MSI status (IHC), n (%) | ||
High | 0 (0.0) | 0 (0.0) |
Indeterminate | 0 (0.0) | 0 (0.0) |
Stable | 4 (1.8) | 3 (1.4) |
Missing | 216 (98.2) | 218 (98.6) |
MSI status (PCR), n (%) | ||
Abnormal high | 19 (8.6) | 12 (5.4) |
Abnormal low | 1 (0.5) | 1 (0.5) |
Normal | 157 (71.4) | 147 (66.5) |
Not evaluable | 16 (7.3) | 10 (4.5) |
Missing | 27 (12.3) | 51 (23.1) |
BRAF V600E mutation status (central), n (%) | ||
Indeterminate | 11 (5.0) | 9 (4.1) |
Mutation detected | 201 (91.4) | 201 (91.0) |
No mutation detected | 3 (1.4) | 5 (2.3) |
No neoplastic cell in tissue | 1 (0.5) | 3 (1.4) |
Missing | 4 (1.8) | 3 (1.4) |
ECOG = Eastern Cooperative Oncology Group Performance Status; IHC = immunohistochemistry; MSI = microsatellite instability; PCR = polymerase chain reaction; SD = standard deviation.
Source: BEACON Trial Clinical Study Report.14
Table 9: Number of Prior Therapies Among Patients in the BEACON Trial Control Group
Characteristic | Control group | |
|---|---|---|
Irinotecan plus cetuximab (N = 92) | FOLFIRI plus cetuximab (N = 129) | |
Number of prior systemic regimens for metastatic disease, n (%) | ||
1 | 50 (54.3) | 95 (73.6) |
2 | 41 (44.6) | 34 (26.4) |
> 2 | 1 (1.1) | 0 |
Source: Sponsor provided additional information.13
Interventions
Patients randomized in the BEACON trial were allocated to either the doublet (encorafenib plus cetuximab), triplet (encorafenib plus cetuximab and binimetinib), or control group. Treatments and doses are included in Table 10. Treatments were administered in 28-day cycles until disease progression, unacceptable toxicity, withdrawal of consent, initiation of subsequent anti-cancer therapy, or death.12,34
Table 10: Treatment Regimens in the BEACON Trial
Doublet group | Triplet group | Control group |
|---|---|---|
Encorafenib (300 mg once daily) plus Standard cetuximab (400 mg/m2 IVa followed by 250 mg/m2 IVb every week) | Encorafenib (300 mg once daily) plus Binimetinib (45 mg twice daily) plus Standard cetuximab (400 mg/m2 followed by 250 mg/m2 IV every week) | Investigator’s choice of the following:
or FOLFIRI plus, which comprises:
|
FOLFIRI = folinic acid plus 5-fluorouracil and irinotecan.
a120-minute infusion.
b60-minute infusion.
c90-minute infusion, as per institutional standards.
Premedication was permitted for routine cetuximab infusions and was allowed within the label per national and/or institutional standards; however, a combination of H1 antagonists (e.g., diphenhydramine) and dexamethasone (10 mg IV) was preferred. For patients enrolled in the control group, the choice of either irinotecan or FOLFIRI was declared before randomization; patients randomized to the control group with known contraindications to either 5-fluorouracil or folinic acid were treated with irinotecan and cetuximab.12
If AEs occurred due to cetuximab, folinic acid, 5-fluorouracil, or irinotecan, doses of any of these could be omitted. Doses that were omitted were not to be made up.12
Duration of Treatment: Treatment was administered in 28-day cycles until disease progression, unacceptable toxicity, withdrawal of consent, initiation of subsequent anti-cancer therapy, or death. Once a patient discontinued treatment they were followed for OS every 3 months, or more frequently if it was required, or until death, consent for survival follow-up was withdrawn, the patient was lost to follow-up, or the defined end of the study.12 Treatment beyond disease progression was permitted in special situations where it was believed that a patient could clinically benefit from continued treatment and if it was in the patient’s best interests, per investigator assessment. Special circumstances were defined by the sponsor by mixed responses and the appearance of new brain metastases (only), which were treatable with stereotactic radiotherapy or surgery but which did not require whole-brain radiotherapy. Treatment beyond progression was not allowed if the patient had12:
clear evidence of disease progression at multiple sites or clear evidence of new lesions outside of the central nervous system
rapid progression of disease at critical anatomic sites (e.g., cord compression) that required urgent alternative medical intervention
a clinically relevant worsening of laboratory values
a clinically significant decline in performance status at the time of disease progression.
Dose Modifications: Patients were monitored for AEs on an ongoing basis based on the National Cancer Institute Common Terminology Criteria for Adverse Events (NCI CTCAE) v4.03. Toxicities that resulted in the discontinuation of encorafenib or cetuximab required the discontinuation of treatment combinations containing these drugs due to their lack of efficacy as a monotherapy for patients with BRAF V600–mutated mCRCs.12
Outcomes
Efficacy End Points
The primary end points of the trial were OS and ORR between the triplet and control groups of the BEACON trial. A list of efficacy end points identified in the CADTH review protocol that were assessed in the BEACON trial is provided in Table 11. These end points are further summarized subsequently. Only end points pertaining to the doublet and control groups of the BEACON trial are discussed in this report. A detailed discussion and critical appraisal of the outcome measures is provided in Appendix 4.
Table 11: Summary of End Points in the BEACON Trial
End points | Outcome measure |
|---|---|
Primary end points | OS (triplet group vs. control group) |
ORR (triplet group vs. control group) | |
Key secondary end points | OS (doublet regimen vs. control group) |
Other secondary end points | ORR (triplet vs. control) |
ORR (doublet vs. control) | |
PFS (triplet vs. control) | |
PFS (doublet vs. control) | |
OS (triplet vs. doublet) | |
ORR (triplet vs. doublet) | |
PFS (triplet vs. doublet) | |
DOR (triplet vs. control, doublet vs. control, triplet vs. doublet) | |
TTR (triplet arm vs. control arm, doublet arm vs. control arm and triplet arm vs. doublet arm) | |
Safety (triplet, doublet, and safety groups) | |
HRQoL (triplet arm vs. control arm, doublet arm vs. control arm and triplet arm vs. doublet arm) |
DOR = duration of response; HRQoL = health-related quality of life; ORR = objective response rate; OS = overall survival; PFS = progression-free survival; TTR = time to response.
Source: BEACON protocol12 and BEACON Statistical Analysis Plan.35
OS: This was defined as the time from randomization to death due to any cause. Patients were censored at their last contact date if they had not died by the data cut-off.35
ORR: This was defined as the number of patients achieving a best overall response of complete response or partial response divided by the total number of patients in that treatment group. The best overall response (i.e., complete response or partial response) was assessed by BICR and the investigator according to RECIST v1.1 criteria. Tumour assessments performed before the start of any subsequent anti-cancer therapies and no later than 30 days after the last dose were considered in the assessment of best overall response. Confirmed and unconfirmed responses of best overall response were captured for each treatment group.35
PFS: This was defined as the time from randomization to the earliest documented date of progression per RECIST v1.1 criteria by BICR and investigator assessment, or until death due to any cause.35 For patients not experiencing death or progression, censoring occurred in the following manner:
For patients without any baseline assessment, censoring occurred on the date of randomization.
Patients who were alive and event-free were censored for PFS at the date of their last adequate tumour assessment (i.e., assessment of complete response, partial response, or stable disease) before either the cut-off date or the date on which a subsequent therapy was started (e.g., systemic therapy, surgery, radiotherapy).
If a PFS event or death was observed after 2 or more missing or inadequate tumour assessments, PFS was censored at the last adequate tumour assessment. If PFS was observed after a single missing or inadequate tumour assessment, the actual date of the event was used.
Analysis of PFS was also conducted at the end of the study.
Duration of response (DOR): DOR was defined as the time from first radiographic evidence of response to the earliest documented progressive disease or death and was calculated for responders only. DOR was assessed by BICR and investigator.35 Censoring for DOR was done in the following manner:
Responders who did not have a progressive disease or death date by the cut-off date were censored for DOR at their last adequate radiological assessment (i.e., at the date of last tumour assessment of complete response, partial response, or stable disease) before the cut-off date or date of subsequent anti-cancer therapy.
Time to response (TTR): TTR was defined as the time between randomization until the first documented complete response or partial response.35 Patients who did not achieve a partial response or complete response were censored in the following manner:
For patients who did not have a PFS event, censoring occurred on the date of the last adequate tumour assessment. These patients were thought to theoretically have a chance of responding, as they had not yet progressed.
For patients who had a PFS event, censoring occurred at the maximum follow-up date.
HRQoL: HRQoL was assessed in patients using the following tools: EORTC QLQ-C30, FACT-C, EQ-5D-5L, and PGIC. Changes in HRQoL were based on changes from baseline for all 4 tools using the full analysis set (FAS). Each of the HRQoL tools was scored according to its respective scoring manual. The compliance of each tool was assessed for each scheduled assessment time point. Descriptive statistics were used to summarize scored scales during each assessment time point. Change from baseline domain scores at the time of each assessment were also summarized.12 HRQoL assessments were not conducted using MIDs.
The EORTC QLQ-C30 global health status scale was considered the primary patient-reported outcome variable of interest. The physical, emotional, and social functioning subscales were considered secondary.12
The functional well-being score of the FACT-C was considered the primary variable of interest. The physical well-being, social/family well-being, emotional well-being, and additional concern scores were considered secondary.12
The EQ-5D-5L captures 5 dimensions of HRQoL: mobility, self-care, usual activities, pain or discomfort, and anxiety or depression. Patients could indicate their response to each item as having no problems, moderate problems, or extreme problems.12
TTD in the domains of the HRQoL tools was assessed for each treatment group using the FAS. TTD was defined as the time from the date of randomization to the date of the event, which was defined as at least a 10% worsening relative to baseline of the corresponding scale score, with no later improvement above this threshold observed during the course of the study or upon death due to any cause. Censoring occurred at the date of the last adequate quality-of-life evaluation for patients who did not have an event before the analysis cut-off or the start of another anti-cancer therapy.12
Safety
Assessment of safety involved the determination of the incidence and severity of AEs according to NCI CTCAE v4.03, changes in clinical laboratory parameters, vital signs, echocardiogram, or multigated acquisition scans, and ophthalmic examinations.12
Dose-limiting toxicities were defined as any AE or abnormal laboratory value assessed as unrelated to disease, disease progression, intercurrent illness, or concomitant medications or therapies occurring within the first 28 days of treatment that satisfy at least 1 of the pre-specified criteria as per the BEACON trial protocol; pre-specified dose–limiting toxicity criteria specific to cardiac, vascular, respiratory, skin, and subcutaneous tissue; gastrointestinal or eye disorders; hematologic and nonhematologic toxicities; investigations and general disorders; and administration-site conditions.12
After the end of the treatment period, patients were followed up with a safety visit 30 days after their last dose of the study drug or before the initiation of a subsequent anti-cancer therapy, whichever occurred first.12
Statistical Analysis
The trial was planned to have a sample size of approximately 646 to 651 patients, which included 31 patients in the safety lead-in phase and 36 patients in the Japanese safety lead-in phase. Approximately 615 patients (approximately 205 patients per treatment group) were expected to be randomized in the phase III portion of the trial.35
Primary and Interim Analyses
The primary analysis for the ORR of the triplet group versus the control group of the BEACON trial was to be performed when all of the following 3 criteria were met:
It had been approximately 9 months since the randomization of the 330th patient (after approximately 110 patients were enrolled in each treatment group). This was pre-specified to allow the majority of the 330 patients enrolled to have had the opportunity to have approximately 6 months of follow-up or longer after their first response.
There had been a minimum of 188 OS events in the triplet and control groups combined.
There had been a minimum of 169 OS events in the doublet and control groups combined.
An interim analysis was for OS to test for superiority or (non-binding) futility of the triplet group versus the control group.35 The interim analysis of OS was to occur during the primary analysis of ORR between the triplet and control groups. Analysis of ORR and OS at these time points was conducted by an independent statistician and reviewed and interpreted by an independent data-monitoring committee. If the analysis of OS at the interim analysis exceeded the boundaries for superiority, then patients in both the triplet and doublet groups of the trial were to be continued to be followed for a more mature comparison. If the analysis of OS at the interim analysis did not cross the boundary for superiority, the final analysis of OS was pre-specified to occur when a minimum of 268 events were observed in the triplet and control groups combined and a minimum of 338 OS events in the doublet and control groups combined. Futility and superiority boundaries for the OS at the interim and final analyses were determined using a Lan-DeMets spending function approximating O’Brien-Fleming stopping boundaries.35
A fallback procedure described by Wiens and Dmitrienko was used to control for type I error for the primary end points. A 1-sided alpha of 0.005 was assigned to the triplet versus control end point assessing ORR; the remaining alpha of 0.020 was assigned to the assessment of OS between the triplet and control groups. If the P value of the comparison for ORR between the triplet and control groups was less than 0.005 at the primary analysis, then a 1-sided alpha of 0.025 was assigned for the comparison of OS between the triplet and control groups; otherwise, the alpha remained at 0.020.35 Efficacy and futility was determined using Lan-DeMets approximation of O’Brien-Fleming alpha- and (non-binding) beta-spending boundaries, respectively.
Table 12: Expected Number of OS Events and Cumulative Power at Expected OS
Statistical significance | OS analysis | |||
|---|---|---|---|---|
Triplet vs. control OS analysis | Cumulative number of OS events | Cumulative alpha spent on OS | Cumulative power to reject H0 for OS (%) | |
Triplet vs. control ORR is statistically significant (i.e., 1-sided P < 0.005) | Interim | 188 | 0.0074 | 61.5 |
Final | 268 | 0.0250 | 88.3 | |
Triplet vs. control ORR is not statistically significant (i.e., 1-sided P > 0.005) | Interim | 188 | 0.0055 | 57.4 |
Final | 268 | 0.0200 | 86.3 | |
H0 = null hypothesis; ORR = objective response rate; OS = overall survival.
Note: All values were calculated using East v6.4, assuming 70% information at the OS interim analysis. Boundaries will be adjusted according to the actual information fraction observed at the interim analysis. Cumulative power values were estimated using simulations within East under the alternative hypothesis.
Source: BEACON Statistical Analysis Plan.35
Testing of Key Secondary End Points
Unless otherwise stated, the FAS was used for efficacy analyses. The per-protocol set was used for efficacy analyses of the primary end points as supportive analyses. End points, including PFS, ORR, DOR, and TTR, which require tumour evaluations, were based on BICR assessment for the primary analysis; investigator assessment for these end points was part of a secondary supportive analysis. During the primary analysis, the ORR between the triplet and control groups, as assessed by BICR, was pre-specified to occur. ORR was included as a primary end point to provide a more rapid assessment of potential clinical benefit.35
Overall Survival
Primary End Point (Triplet Group Versus Control Group)
Analysis of OS was performed via comparison of Kaplan–Meier curves in the FAS, reporting estimated medians in months with corresponding 95% CIs, 25th and 75th percentiles, and Kaplan–Meier estimated probabilities and corresponding 95% CIs at several time points (i.e., 2, 4, 6, 8, 10, 12, and 14 months). Overall estimates of OS were provided in addition to estimates by stratum. The null hypothesis in the comparison between the triplet regimen and the control group is that the survival distribution function for the triplet group is less than or equal to that of the control group; this was tested using a stratified log-rank test against a 1-sided alpha of 0.025. The analysis of OS was stratified by randomization factors (ECOG PS, prior use of irinotecan, and source of cetuximab). HR estimates of treatment with corresponding 95% CIs were determined using a stratified Cox proportional hazard model. The primary analysis of OS was based on the intention-to-treat principle. Violation of the proportional hazard assumption was conducted graphically by plotting Schoenfeld residuals, including a local regression (LOESS) curve.35
Key Secondary End Point (Doublet Group Versus Control Group)
This end point was tested hierarchically using a gatekeeping procedure that was dependent on the primary end point of OS between the triplet and control groups showing statistical significance.35 The analysis of OS for this comparison was conducted in a manner similar to the analysis of OS for the primary end point (see previous paragraph).
Objective Response Rate
Primary End Point (Triplet Group Versus Control Group)
ORR was assessed using a Cochran-Mantel-Haenszel test with a 1-sided alpha of 0.005. ORR was assessed by BICR using the phase III response efficacy set. Formal testing of ORR was based on confirmed responses of ORR. Analysis was stratified based on randomization factors (baseline ECOG PS [0 versus 1], prior use of irinotecan [yes versus no], cetuximab source [US-licensed versus EU-approved]). The primary analysis of ORR was presented by treatment group along with stratum, and presented with corresponding 95% and 99% CIs. Analysis of ORR will be performed using the FAS at the final analysis.35
Other Secondary End Points
Analysis of ORR performed for other secondary end points was conducted in a manner similar to the primary analysis using the phase III response efficacy set and FAS.35
Progression-Free Survival
PFS was compared via Kaplan–Meier curves and summarized by treatment group. The FAS was used for formal testing of PFS for the phase III portion of the BEACON trial. Formal testing of PFS end points part of the statistical hierarchy (described subsequently) were performed using a Lan-DeMets spending function approximating O’Brien-Fleming stopping boundaries.35 The information fraction for formally tested analyses of PFS was calculated using the spending function which assumed that an interim analysis had occurred based on the number of events observed at the data cut-off date for the interim analysis:
For the comparison of the triplet versus control groups, a total of 315 events were estimated to occur at the final analysis; this estimation was based on actual enrolment rates of the BEACON trial and assuming a median PFS of 8 months for the triplet group and 2 months for the control groups, with censorship of 15% and 25%, respectively, at the final analysis occurring approximately 30 months after randomization.
For the comparison of the doublet versus control groups, a total of 330 events were estimated to occur at the final analysis; this estimate was based on the actual enrolment rates of the BEACON trial and assumed a median PFS of 5 months for the doublet group and 2 months for the control group, with censorship of 20% and 25%, respectively, at the final analysis occurring approximately 30 months after randomization.
Duration of Response
DOR was compared using Kaplan–Meier curves and summarized for each treatment group using the phase III response efficacy set and the FAS. The proportion of patients with a DOR of 6 or more months was summarized for each treatment group.35
Time to Response
Analysis of TTR was compared using Kaplan–Meier curves that were used to estimate the median in months with corresponding 95% CIs and 25th and 75th percentiles with corresponding 95% CIs at several time points (i.e., 2, 4, 6, 8, 10, and 12 months). Analysis of TTR was performed using the phase III response efficacy set and the FAS.35 An analysis of TTR was also conducted for responders only (i.e., patients achieving at least 1 complete response or partial response). TTR at the primary analysis was based on assessment by BICR. No formal statistical testing was performed.35 The distribution was presented descriptively using Kaplan–Meier curves. Median time to definitive deterioration along with 2-sided 95% CI will be provided. A Cox model was fit with treatment arm and stratification factors as the covariates to obtain an HR estimate of the treatment effect along with the 95% CI. The stratification factors used in the test were those used for randomization and were based on the actual randomization (IWRS) information.12
A gatekeeping procedure using hierarchical testing was performed to control for the overall type I error for the key secondary end points at a 1-sided alpha level of 0.025. Hierarchically tested end points comparing the triplet group or doublet group with the control group were assessed for statistical significance based on a pre-specified criterion for comparing with 1-sided P values, as summarized in Table 13 (end points for the doublet group only). Since the tests for OS and PFS for the doublet group represent an interim analysis, the criterion for significance for these end points were adjusted based on O’Brien-Fleming stopping boundaries approximated using Lan-DeMets spending function to preserve alpha for comparing these end points at the predetermined final analysis had the trial continued.
The following tests were conducted sequentially, conditional on statistical significance being observed at the interim for OS of the triplet versus control groups35:
OS (doublet versus control groups)
ORR per BICR (doublet versus control groups)
PFS per BICR (triplet versus control groups)
PFS per BICR (doublet versus control groups)
Table 13: Hierarchical Testing Summary for Efficacy End Points
Secondary end points | End point | Criterion for significancea | |
|---|---|---|---|
Assessment | Treatment groups | ||
Key secondary | OSb | Doublet vs. control | 0.0042 |
Secondary | ORR by BICRc | Doublet vs. control | 0.025 |
PFS by BICRd | Doublet vs. control | 0.0117 | |
BICR = blinded independent central review; FAS = full analysis set; ORR = objective response rate; OS = overall survival; PFS = progression-free survival.
aThreshold to be compared with a 1-sided P value.
bAnalyses of OS and PFS were based on the FAS; critical P values with O’Brien-Fleming stopping boundaries calculated using Lan-DeMets spending functions.
cAnalysis of ORR was based on the phase III response efficacy set.
Note: Only end points for comparisons between the doublet group and the control group are summarized here; however, criteria for statistical significance of end points for comparisons of the triplet group vs. the control group were also specified.
Source: BEACON Clinical Study Report.14
The testing of the key secondary end points outlined in Table 13 was conducted at the same alpha level assigned to the assessment of OS between the triplet versus control groups and the critical P value was calculated using a Lan-DeMets spending function that approximates O’Brien-Fleming stopping boundaries. If any of the end points outlined in Table 13 were not statistically significant, subsequent comparisons were summarized descriptively with nominal P values.35 A depiction of the formal testing of end points is provided in Figure 3.
Figure 3: Statistical Testing Strategy for the BEACON Trial
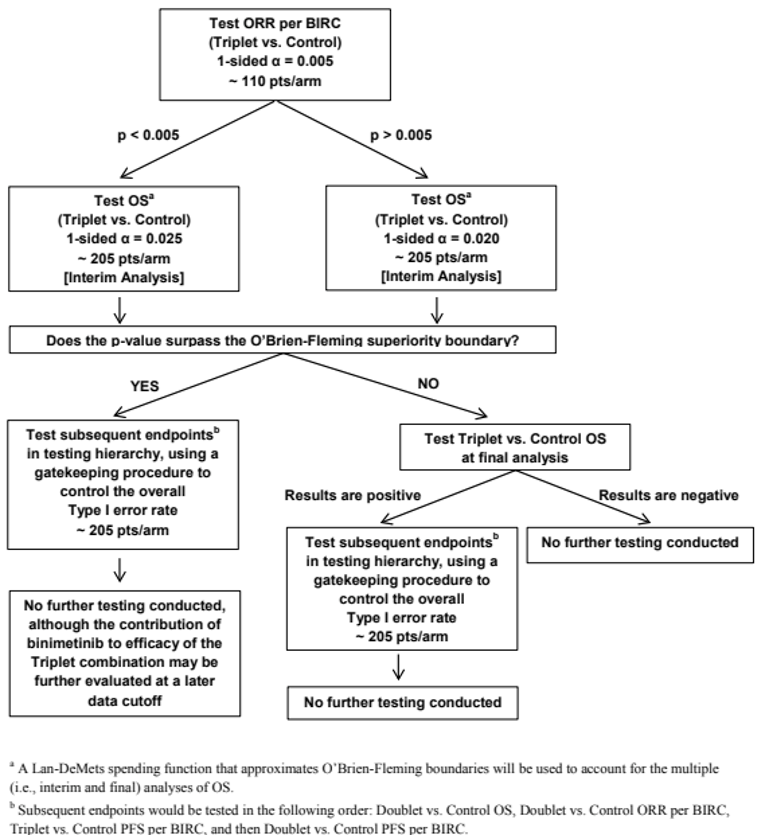
BICR = blinded independent central review; ORR = objective response rate; OS = overall survival; PFS = progression-free survival.
a A Lan-DeMets spending function that approximates O’Brien-Fleming boundaries was used to account for the multiple (i.e., interim and final) analyses of OS.
b Subsequent end points were tested in the following order: Doublet versus control OS, doublet versus control ORR per BICR, triplet versus control PFS per BICR, and then doublet versus control PFS per BICR.
Source: BEACON Statistical Analysis Plan.35
Analysis Populations
Efficacy analyses were performed using the FAS, which followed the principles of intent-to-treat analyses. HRQoL analyses were also conducted using the FAS. Analyses of safety were performed using the safety set (Table 14).12
Analysis set | N | Description |
|---|---|---|
Full analysis set | 441 | Included all patients randomized as part of the phase III trial. Patients were analyzed according to the treatment group and stratum they were assigned to at randomization. |
Safety set | 409 | Included all patient receiving at least 1 dose of the study drug. |
Phase III response efficacy set | 220 | Included all 330 patients first randomized into the phase III portion of the study. |
Per-protocol set | 377 | Included of all phase III patients in the full analysis set who were sufficiently compliant with protocol requirements. |
Source: BEACON Statistical Analysis Plan.35
Results
Patient Disposition
Randomization of the phase III portion of the BEACON trial was conducted between May 4, 2017 and January 31, 2019. Including the safety lead-in cohorts, a total of 1,677 patients were screened for enrolment into the BEACON trial, 975 of whom (58.1%) were not enrolled or randomized mainly due to lack of BRAF V600E mutation (56.9%), not meeting other inclusion or exclusion criteria (30.7%), and not providing informed consent (12.3%). In the overall phase III component of the BEACON trial, 665 patients were randomized, including 224 patients in the triplet group, 220 in the doublet group, and 221 in the control group.14 A summary of the disposition of patients randomized to the doublet and control groups of the trial as of the most recent data cut-off (August 2019) is included in Table 15.
It should be noted that encorafenib and binimetinib were approved in June 2018 in the US for the treatment of patients with BRAF-mutated melanoma; due to this, BRAF and MEK inhibitors, including encorafenib and binimetinib, were used off-label for patients with mCRC, which led to the constant withdrawal of patients randomized to the control group of the BEACON trial, and screening sites in the US were closed on July 15, 2018. Correspondingly, of patients randomized to treatment, a greater proportion of patients randomized to the control group were not treated compared with the doublet group (12.7% versus 1.8%, respectively).14
Of patients continuing in the trial, a greater proportion of patients in the doublet group discontinued treatment due to progressive disease (65.9%) compared with patients in the control group (55.7%). A large proportion of patients in both the doublet and control groups discontinued tumour assessment follow-ups, although a higher proportion of patients in the doublet group continued with tumour assessment follow-ups compared with the control group (13.2% versus 4.5%, respectively). More patients in the doublet group discontinued tumour assessment follow-ups due to progressive disease than in the control group (70.5% versus 61.5%, respectively), but fewer patients in the doublet group discontinued due to withdrawal of consent compared with the control group (2.7% versus 16.7%, respectively). Fewer patients in the doublet group discontinued from the trial (61.4%) compared with the control group (77.8%). Reasons for discontinuation were mainly due to death (58.2% in the doublet group and 68.3% in the control group), followed by withdrawal of consent (2.3% versus 9.0%), and lost to follow-up (0.9% versus 0.5%).15
Patient disposition | BEACON | |||
|---|---|---|---|---|
Data cut-off: February 2019 | Data cut-off: August 2019 | |||
Encorafenib plus cetuximab (N = 220) | Control group (N = 221) | Encorafenib plus cetuximab (N = 220) | Control group (N = 221) | |
Screened | ||||
Randomized (ITT population), N | 220 | 221 | ─ | ─ |
Randomized, treated (safety population), N | 216 | 193 | ─ | ─ |
Randomized, not treated | 4 (1.8) | 28 (12.7) | ─ | ─ |
Discontinued from study, n (%) | 138 (62.7) | 156 (70.6) | 186 (84.5) | 186 (84.2) |
Reason for discontinuation, n (%) | ||||
Progressive disease | 101 (45.9) | 103 (46.6) | 145 (65.9) | 123 (55.7) |
Changes in the patient’s condition or development of an intercurrent illness | 9 (4.1) | 13 (5.9) | 11 (5.0) | 16 (7.2) |
Unacceptable AEs or failure to tolerate study drug | 11 (5.0) | 10 (4.5) | 11 (5.0) | 10 (4.5) |
Death | 5 (2.3) | 11 (5.0) | 6 (2.7) | 11 (5.0) |
Withdrawal of consent | 3 (1.4) | 9 (4.1) | 3 (1.4) | 11 (5.0) |
Dose interruption of > 28 consecutive days (encorafenib or binimetinib) or 2 missed consecutive irinotecan, 5-FU, or FA or > 4 missed consecutive cetuximab doses | 2 (0.9) | 4 (1.8) | 2 (0.9) | 6 (2.7) |
Patient decision to discontinue study treatment | 2 (0.9) | 4 (1.8) | 3 (1.4) | 5 (2.3) |
Physician decision | 4 (1.8) | 2 (0.9) | 4 (1.8) | 2 (0.9) |
Other | 1 (0.5) | 0 | 1 (0.5) | 1 (0.5) |
Receipt of subsequent anti-cancer therapy | 0 | 1 (0.5) | ||
Tumour assessment follow-up ongoing, n (%) | 77 (35.0) | 37 (16.7) | 29 (13.2) | 10 (4.5) |
Tumour assessment follow-up discontinued, n (%) | 143 (65.0) | 184 (83.3) | 191 (86.8) | 211 (95.5) |
Progressive disease | 111 (50.5) | 113 (51.1) | 155 (70.5) | 136 (61.5) |
Death | 22 (10.0) | 27 (12.2) | 25 (11.4) | 27 (12.2) |
Withdrawal of consent | 5 (2.3) | 35 (15.8) | 6 (2.7) | 37 (16.7) |
Other | 2 (0.9) | 6 (2.7) | 2 (0.9) | 6 (2.7) |
Initiation of subsequent therapy | 2 (0.9) | 1 (0.5) | 2 (0.9) | 3 (1.4) |
Physician decision | 1 (0.5) | 2 (0.9) | 1 (0.5) | 2 (0.9) |
Survival follow-up ongoing, n (%) | 122 (55.5) | 90 (40.7) | 85 (38.6) | 49 (22.2) |
Study discontinued, n (%) | 98 (44.5) | 131 (59.3) | 135 (61.4) | 172 (77.8) |
Death | 93 (42.3) | 112 (50.7) | 128 (58.2) | 151 (68.3) |
Withdrawal of consent | 3 (1.4) | 18 (8.1) | 5 (2.3) | 20 (9.0) |
Lost to follow-up | 2 (0.9) | 1 (0.5) | 2 (0.9) | 1 (0.5) |
5-FU = 5-fluorouracil; AE = adverse event; FA = folinic acid; ITT = intention to treat.
Exposure to Study Treatments
The median duration of exposure was longer in the doublet treatment group at 19.3 weeks (range = 1.0 week to 103 weeks) versus 7.0 weeks (range = 1 week to 70.6 weeks) in the control group; this is to be expected, as more patients in the control group discontinued study treatment than patients in the doublet group earlier in the trial. Duration of exposure to each treatment within the doublet group was similar, with a median duration of exposure of 19 weeks for both encorafenib and cetuximab. Dose intensity and relative dose intensity of treatments is reported in Table 16. Relative dose intensity in the doublet group was 88% for encorafenib and 87% for cetuximab. In the control group, relative dose intensity was between 67% and 77%. More patients in the control group had less than 50% of the assigned dose compared with patients in the doublet group.15
As per protocol, patients were permitted to be treated with the study treatment beyond locally determined disease progression. A total of 104 of 141 patients (73.8%) in the doublet group whose disease had progressed received treatment beyond progression compared with 37 of 116 patients (31.9%) in the control group whose disease had progressed.31
Table 16: Dose Intensity of Doublet and Control Groups (Safety Set)
Dose intensity | Data cut-off: August 15, 2019 | |||||
|---|---|---|---|---|---|---|
Doublet group | Control group | |||||
Encorafenib (N = 216) | Cetuximab (N = 216) | Cetuximab (N = 193) | Irinotecan (N = 193) | 5-FU (N = 107) | Folinic acid (N = 107) | |
Dose intensity (mg/day) | ||||||
Mean (SD) | 262.78 (58.586) | 403.12 (90.151) | 368.87 (114.726) | 230.39 (81.726) | 3,220.61 (1,327.228) | 504.87 (195.098) |
Relative dose intensity (%) | ||||||
Mean (SD) | 87.59 (19.529) | 86.91 (15.431) | 77.32 (21.692) | 72.50 (23.352) | 67.29 (25.705) | 71.57 (25.823) |
Relative dose intensity (%), n (%) | ||||||
< 50% | 15 (6.9) | 8 (3.7) | 23 (11.9) | 31 (16.1) | 25 (23.4) | 18 (16.8) |
50% to < 80% | 32 (14.8) | 37 (17.1) | 60 (31.1) | 84 (43.5) | 47 (43.9) | 46 (43.0) |
80% to < 100% | 132 (61.1) | 152 (70.4) | 90 (46.6) | 58 (30.1) | 26 (24.3) | 26 (24.3) |
100% | 36 (16.7) | 0 (0) | 5 (2.6) | 4 (2.1) | 1 (0.9) | 3 (2.8) |
> 100% | 1 (0.5) | 19 (8.8) | 15 (7.8) | 16 (8.3) | 8 (7.5) | 14 (13.1) |
5-FU = 5-fluorouracil; SD = standard deviation.
Dose intensity = cumulative dose ÷ duration of exposure.
Relative dose intensity = (dose intensity ÷ planned dose intensity) × 100.
Source: BEACON Clinical Study Report.14
Prior Systemic Anti-Cancer Therapies (FAS): All patients in the BEACON trial received prior systemic anti-cancer therapies, as per protocol; a summary is provided in Table 17. Most patients (66%) in both treatment groups received 1 prior systemic anti-cancer treatment for mCRC. Only 1 patient in the control group received greater than 2 lines of prior systemic anti-cancer therapy. A similar proportion of patients in both treatment groups received prior irinotecan (52% in the doublet group versus 53% in the control group) or oxaliplatin (96% versus 91%). Neither irinotecan nor oxaliplatin were administered to 0.9% of patients in the doublet group compared with 3.2% in the control group.14
A similar frequency of patients had received prior surgery: 183 patients (83.2%) in the doublet group and 180 patients (81.4%) in the control group. Prior anti-cancer radiation therapy was administered to 35 patients (15.9%) in the doublet group and 21 patients (9.5%) in the control group.14
Table 17: Summary of Prior Systemic Anti-Cancer Therapies
Detail | Doublet group (N = 220) | Control group (N = 221) |
|---|---|---|
Prior systemic therapy, n (%) | 220 (100.0) | 221 (100.0) |
Number of prior systemic regimens for metastatic disease, n (%) | ||
1 | 146 (66.4) | 145 (65.6) |
2 | 74 (33.6) | 75 (33.9) |
> 2 | 0 | 1 (0.5) |
Prior irinotecan, n (%) | 114 (51.8) | 117 (52.9) |
Prior oxaliplatin, n (%) | 210 (95.5) | 201 (91.0) |
Source: BEACON Clinical Study Report.14
Concomitant Medications: Concomitant medications for rash, pain, or pre-existing conditions and gastrointestinal toxicities or pre-existing gastrointestinal conditions were generally similarly administered across treatment groups. Tetracyclines were used for 32.9% of patient in the doublet group and 49.7% of patients in the control group. Medications for pain or pre-existing conditions included anilide analgesics (53.2% in the doublet group versus 42.0% in the control group) and opium alkaloids (38.4% versus 31.6%). Medication for gastrointestinal toxicities or pre-existing gastrointestinal conditions included proton-pump inhibitors (43.5% in the doublet group versus 42.5% in the control group) and propulsive medications (29.6% versus 42.0% in the control group).14
Pre-treatment for cetuximab and chemotherapy infusions were permitted, as per protocol. Pre-treatments included the following and were provided in similar frequency across both the doublet and control groups: glucocorticoids, such as steroids (74.1% in the doublet group versus 82.4% in the control group), and substituted alkylamines, such as antihistamines (37.5% versus 39.9%), serotonin antagonist antiemetics (19.4% versus 74.6%), and belladonna alkaloids and semisynthetic and quaternary ammonium compounds, specifically atropine medication (0.0% versus 31.1%).14
Subsequent Treatments: As of the August 15, 2019 data cut-off date, subsequent anti-cancer therapies were reported in 99 patients (45.0%) in the doublet group and 10 patients (47.1%) in the control group (Table 18). The most common subsequent systemic treatments (> 10%) in the doublet group were irinotecan (26.8%), fluorouracil (25.9), folinic acid (16.4%), and bevacizumab (12.7%). The most common subsequent systemic treatments (> 10%) in the control group were fluorouracil (19.9%), irinotecan (16.3%), cetuximab (14.5%), oxaliplatin (13.1%), folinic acid (10.9), and bevacizumab (10.9).15
More patients in the doublet group than in the control group received subsequent therapy with an irinotecan combination (7.3% versus 1.8%, respectively), or irinotecan combination plus a vascular endothelial growth factor inhibitor (11.8% versus 5.4%). Fewer patients in the doublet group received a protein kinase inhibitor as a subsequent systemic therapy compared with the control group (6.8% versus 18.6%, respectively); vemurafenib was the most commonly reported subsequent treatment for patients in the control group, having been received by 21 patients (9.5%) versus 3 patients (1.4%) in the doublet group.15 A subsequent BRAF inhibitor plus a MEK inhibitor plus an EGFR inhibitor was administered to 0.5% of patients in the doublet group versus 8.1% of patients in the control group. Similar proportions of a subsequent programmed cell death protein 1 (PD-1) or programmed death ligand 1 (PD-L1) inhibitor were reported between the doublet and control groups (3.2% versus 3.6%, respectively). Subsequent therapy with encorafenib plus binimetinib was administered to 3 patients in the control group and none of the patients in the doublet group.
Based on the February 11, 2019 data cut-off date, more patients in the doublet group had a subsequent anti-cancer radiation therapy than in the control group (18.3% versus 4.3%). Subsequent anti-cancer surgery was provided to 5.6% and 3.8% of patients in the doublet and control groups, respectively.
Table 18: Commonly Reported Subsequent Anti-Cancer Therapies
Commonly reported (> 10%) subsequent therapies | Data cut-off: August 15, 2021 | |
|---|---|---|
Doublet group (N = 220) | Control group (N = 221) | |
Any subsequent therapy, n (%) | 99 (45.0) | 104 (47.1) |
Fluorouracil | 57 (25.9) | 44 (19.9) |
Irinotecan | 59 (26.8) | 36 (16.3) |
Folinic acid | 36 (16.4) | 24 (10.9) |
Bevacizumab | 28 (12.7) | 24 (10.9) |
Cetuximab | 9 (4.1) | 32 (14.5) |
Oxaliplatin | 18 (8.2) | 29 (13.1) |
Source: BEACON Clinical Study Report Addendum.15
Efficacy
The primary end points of the BEACON trial were based on the comparisons between the triplet and control groups. Comparisons of ORR, OS, and PFS between the doublet and control groups were considered key secondary end points and were part of a statistical hierarchy, whereby they were tested only upon observing statistical significance in ORR and OS between the triplet and control groups. At the time of the interim analysis, the P value for ORR and OS between the triplet and control groups both met their respective thresholds for statistical significance, each with P values of less than 0.0001; based on this, a total alpha of 0.025 was assigned to the subsequent analysis of key secondary end points for conducting 1-sided tests at the interim data cut-off of February 11, 2019. Therefore, analyses of OS, PFS, and ORR between the doublet and control groups were formally tested.14 It should be noted that PFS comparing the triplet group and control group was also a part of the sequential testing procedure and also met the pre-specified threshold for significance, with a P value of less than 0.0001. Results for comparisons involving the triplet regimen in the BEACON trial are not discussed in this CADTH report.
A post-hoc analysis was performed by the sponsor (data cut-off: August 2019), which was not pre-specified in the protocol of the BEACON trial. The results are considered descriptive and are also reported here. A summary of results for the doublet and control groups is provided in Table 19.
Table 19: Summary of Key Efficacy Results in the BEACON Trial
End point | Interim analysis (data cut-off: February 11, 2019) | Post-hoc analysis (data cut-off: August 15, 2019) | ||
|---|---|---|---|---|
Doublet group (N = 220) | Control group (N = 221) | Doublet group (N = 220) | Control group (N = 221) | |
OS | ||||
Events, n (%) | 93 (42.3) | 114 (51.6) | 128 (58.2) | 157 (71.0) |
Median, months (95% CI)a | 8.41 (7.46 to 11.04) | 5.42 (4.76 to 6.57) | 9.30 (8.05 to 11.30) | 5.88 (5.09 to 7.10) |
Stratified HR (95% CI)b | 0.60 (0.45 to 0.79) | 0.61 (0.48 to 0.77) | ||
Stratified log-rank (1-sided) P value | 0.0002 | < 0.0001c | ||
PFS | ||||
Events, n (%) | 133 (60.5) | 128 (57.9) | 167 (75.9) | 147 (66.5) |
PD | 110 (50.0) | 101 (45.7) | 141 (64.1) | 116 (52.5) |
Death | 23 (10.5) | 27 (12.2) | 26 (11.8) | 31 (14.0) |
Median (months), (95% CI)a | 4.21 (3.71 to 5.36) | 1.51 (1.45 to 1.71) | 4.27 (4.07 to 5.45) | 1.54 (1.48 to 1.91) |
Stratified HR (95% CI)b | 0.40 (0.31 to 0.52) | 0.44 (0.35 to 0.55) | ||
Stratified log-rank (1-sided) P value | < 0.0001 | < 0.0001d | ||
Phase III Response Efficacy Set for the interim analysis and Full Analysis Set for the Post-hoc analysis | Doublet group (N = 113) | Control group (N = 107) | Doublet group (N = 220) | Control group (N = 221) |
ORRc | ||||
ORR, n (%) | 23 (20.4) | 2 (1.9) | 43 (19.5) | 4 (1.8) |
95% CI | (13.4 to 29.0) | (0.2 to 6.6) | (14.5 to 25.4) | (0.5 to 4.6) |
Cochrane-Mantel-Haenszel (1-sided) P value | < 0.001 | < 0.001d | ||
BOR, n (%) | ||||
CR | 6 (5.3) | 0 | 7 (3.2) | 0 |
PR | 17 (15.0) | 2 (1.9) | 36 (16.4) | 4 (1.8) |
SD | 57 (50.4) | 26 (24.3) | 117 (53.2) | 59 (26.7) |
PD | 8 (7.1) | 36 (33.6) | 21 (9.5) | 82 (37.1) |
Non-CR or non-PD | 4 (3.5) | 5 (4.7) | 7 (3.2) | 6 (2.7) |
NE | 21 (18.6) | 38 (35.5) | 32 (14.5) | 70 (31.7) |
Evidence of disease progression or AE | 19 (16.8) | 17 (15.9) | 22 (10.0) | 30 (13.6) |
Insufficient information to assess response | 2 (1.8) | 21 (19.6) | 10 (4.5) | 40 (18.1) |
AE = adverse event; BOR = best overall response; CI = confidence interval; CR = complete response; ECOG PS = Eastern Cooperative Oncology Group Performance Status; FAS = full analysis set; HR = hazard ratio; LS = least squares; NE = not evaluable; ORR = objective response rate; OS = overall survival; PD = progressive disease; PFS = progression-free survival; PR = partial response; SD = stable disease.
aThe Kaplan–Meier method was used to summarize OS and PFS for each treatment group along with a stratified log-rank test for P values; stratification factors include ECOG PS, prior use of irinotecan, and source of cetuximab.
bThe HR and corresponding 2-sided CI were estimated using a stratified Cox proportional hazards model. HR < 1 favours encorafenib plus cetuximab; stratification factors include ECOG PS, prior use of irinotecan, and source of cetuximab.
cORR was analyzed using the Cochrane-Mantel-Haenszel test; stratification factors include ECOG PS, prior use of irinotecan, and source of cetuximab.
dThese P values have not been adjusted for multiple testing and should be interpreted as nominal.
Overall Survival
Interim Analysis (Data Cut-Off: February 11, 2019)
At the pre-specified interim analysis, the median duration of follow-up for OS was 7.56 months (95% CI, 6.44 to 9.20) in the doublet group and 7.23 months (95% CI, 6.14 to 8.11) in the control group. The median OS was longer in the doublet group at 8.41 months (95% CI, 7.46 to 11.04) compared with 5.42 months (95% CI, 4.76 to 6.57) in the control group (P = 0.0002, stratified log-rank test), resulting in a 40% lower risk of death in the doublet group (HR = 0.60; 95% CI, 0.45 to 0.79) (Figure 4).14 Based on the specified critical threshold of 0.0041 (Table 13), encorafenib plus cetuximab showed statistically significantly improved OS compared with the control group.
Figure 4: Kaplan–Meier Plot of OS, Doublet Group Versus Control Group (Data Cut-Off: February 11, 2019)
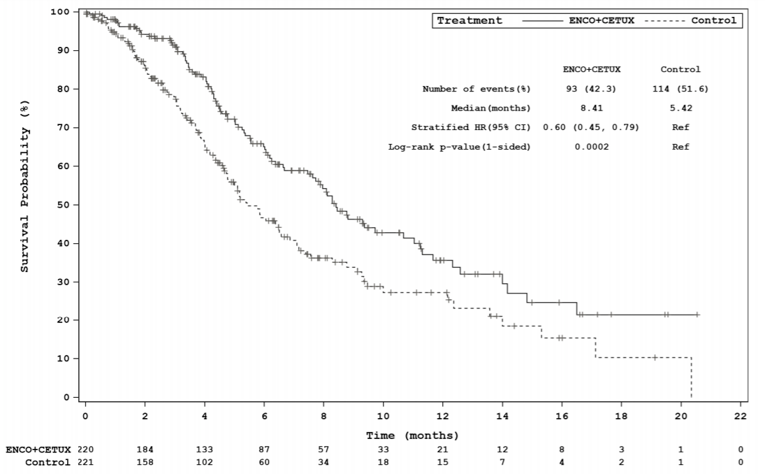
CETUX = cetuximab; CI confidence interval; ENCO = encorafenib; HR = hazard ratio; OS = overall survival; Ref = reference.
Note: The statistical model for the HR and P value was a stratified Cox proportional hazard model and stratified log-rank test.
Source: BEACON Clinical Study Report.14
Results for the subgroup analyses of OS are illustrated in Figure 13 (Appendix 3). Most subgroup analyses were consistent with the primary results of the study. Some subgroup analyses estimated HRs that numerically favoured the control group; those HRs were for patients who received US-licensed cetuximab from North America and who had unknown or abnormally high MSI status. However, it should be noted that for each of these subgroups, the reported 95% CI included the null, and each subgroup included few patients (≤ 44).
Post-Hoc Analysis (Data Cut-Off: August 15, 2019)
At the post-hoc analysis, the median follow-up for OS was 7.90 months (range, 0.03 to 25.76) in the doublet group and 5.55 months (range, 0.03 to 22.01) in the control group. The median OS was 9.30 months (95% CI, 8.05 to 11.30) in the doublet group compared with 5.88 months (95% CI, 5.09 to 7.10) in the control group (nominal P = 0.0001, log-rank test), resulting in a 39% lower risk of death in the doublet group (HR = 0.61; 95% CI, 0.48 to 0.77) (Figure 5).15 Subgroup analyses of OS are illustrated in Figure 14 and display results similar to the subgroup analyses conducted at the interim analysis.15
Figure 5: Kaplan–Meier Plot of OS, Doublet Group Versus Control Group (Data Cut-Off: August 15, 2019)
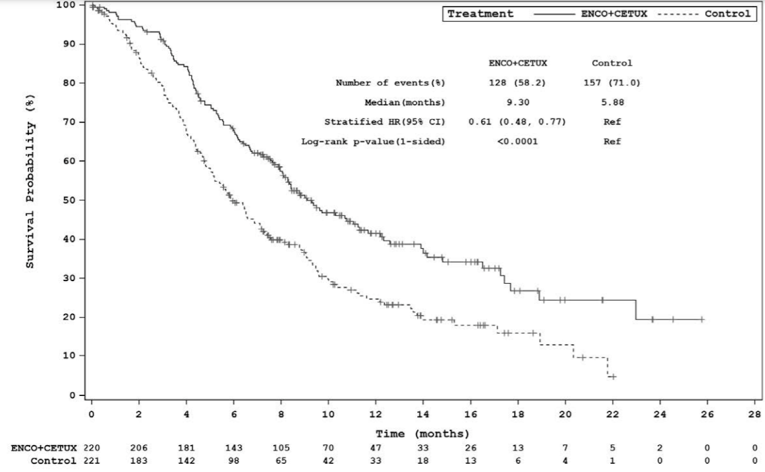
CETUX = cetuximab; CI confidence interval; ENCO = encorafenib; HR = hazard ratio; OS = overall survival; Ref = reference.
Note: The statistical model for the HR and P value was a stratified Cox proportional hazard model and stratified log-rank test.
Post-hoc analyses were not controlled for multiplicity. Reported P value is nominal.
Source: BEACON Clinical Study Report Addendum.15
Objective Response Rate
Interim Analysis (Data Cut-Off: February 11, 2019)
The analysis of ORR was conducted as per the pre-specified statistical hierarchy and was conducted among the first 331 randomized patients to ensure the patients included in the analysis had sufficient follow-up for assessment of response to treatment. Based on assessment by BICR, a greater proportion of patients in the doublet group had a confirmed response (20.4%; 95% CI, 13.4 to 29.0) versus the control group (1.9%; 95% CI, 0.2 to 6.6).14 Based on the specified critical threshold of 0.025 (Table 13), patients treated with encorafenib plus cetuximab showed statistically significantly improved ORR compared with the control group (P < 0.0001, Cochrane-Mantel-Haenszel test).
Subgroup analyses are summarized in Table 32 (Appendix 3). In general, subgroup analyses of ORR showed a greater proportion of patients with a response in the doublet group versus the control group (results not shown); however, as few patients in the control group had a confirmed response, the subgroup analyses should be interpreted with caution.14
Post-Hoc Analysis (Data Cut-Off: August 15, 2019)
Based on assessment by BICR, a greater proportion of patients in the doublet group had a confirmed response (19.5%; 95% CI, 14.5 to 25.4) versus the control group (1.8%; 95% CI, 0.5 to 4.6). Analysis of ORR showed improvement in ORR among patients treated in the doublet group compared with the control group; these analyses were not controlled for multiplicity (nominal P < 0.0001, Cochrane-Mantel-Haenszel test).15
Subgroup analyses of ORR showed a greater proportion of patients with a response in the doublet group versus the control group (results not shown); however, as only 4 patients in the control group had a confirmed response, subgroup analyses should be interpreted with caution (Table 32, Appendix 3).15
Progression-Free Survival
Interim Analysis (Data Cut-Off: February 11, 2019)
At the primary analysis (data cut-off: February 11, 2019), the median duration of follow-up for PFS by BICR was 7.92 months (95% CI, 4.24 to 19.45) for the doublet group and 4.14 months (95% CI, 2.89 to 5.39) in the control group. The median PFS was 4.21 months (95% CI, 3.71 to 5.36) in the doublet group compared with 1.51 months (95% CI, 1.45 to 1.71) in the control group (< 0.0001, stratified log-rank test), resulting in a 60% reduction in progression or death (HR = 0.40; 95% CI, 0.31 to 0.52) (Figure 6).14 Based on the specified critical threshold of 0.0117 (Table 13), encorafenib plus cetuximab showed statistically significantly improved PFS compared with the control group.
Subgroup analyses of PFS were generally consistent with the results of the primary analysis and are summarized in Table 33 (Appendix 3).
Figure 6: Kaplan–Meier Plot of PFS, Doublet Group Versus Control Group (Data Cut-Off: February 11, 2019)
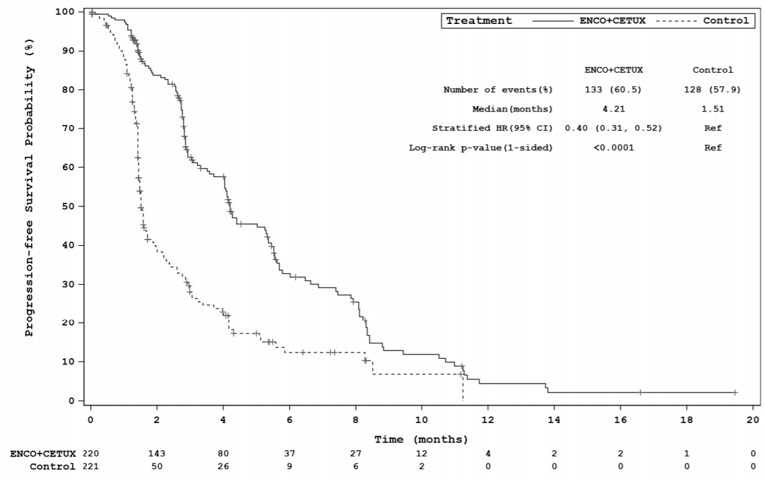
CETUX = cetuximab; CI confidence interval; ENCO = encorafenib; HR = hazard ratio; PFS = progression-free survival; Ref = reference.
Note: The statistical model for the HR and P value was a stratified Cox proportional hazard model and stratified log-rank test.
Source: BEACON Clinical Study Report.14
Post-Hoc Analysis (Data Cut-Off: August 15, 2019)
At the post-hoc analysis, median follow-up for PFS in the FAS was 4.11 months (range, 0.03 to 22.21) in the doublet group and 1.41 months (range, 0.03 to 13.86) in the control group. The median PFS in the doublet group was 4.27 months (95% CI, 4.07 to 5.45) compared with 1.56 months (95% CI, 1.48 to 1.91) in the control group (nominal P < 0.0001, log-rank test), resulting in a 56% reduction in risk of progression or death in the doublet group (HR = 0.44; 95% CI, 0.35 to 0.55) (Figure 7).15
Subgroup analyses were generally consistent with the results of the primary analysis and are summarized in Table 33 (Appendix 3).
Figure 7: Kaplan–Meier Plot of PFS, Doublet Group Versus Control Group (Data Cut-Off: August 15, 2019)
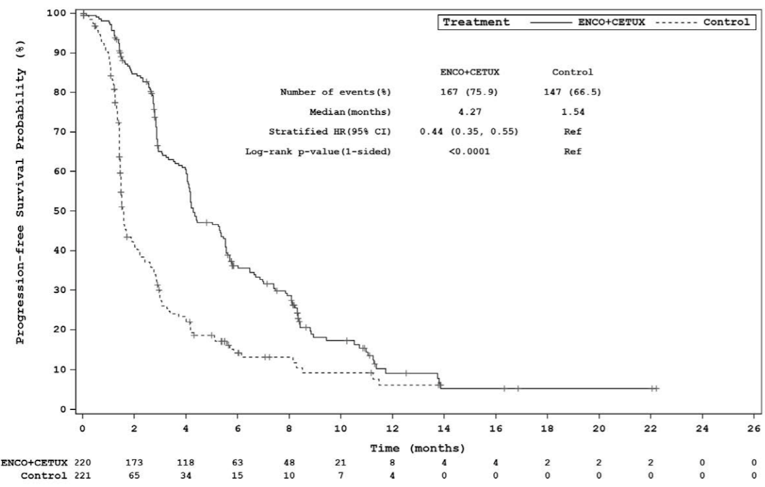
CETUX = cetuximab; CI confidence interval; ENCO = encorafenib; HR = hazard ratio; PFS = progression-free survival; Ref = reference.
Note: The statistical model for the hazard ratio and P value was a stratified Cox proportional hazard model and stratified log-rank test.
Post-hoc analyses were not controlled for multiplicity. Reported P value is nominal.
Source: BEACON Clinical Study Report Addendum.15
Duration of Response
Interim Analysis (Data Cut-Off: February 11, 2019)
The median DOR per BICR assessment for the 23 responders in the phase III response efficacy set for the doublet group was 6.06 months (96% CI, 4.07 to 8.28). Two patients in the control group had confirmed responders; the DOR for these 2 patients was 2.56 months and 6.93 months.14
Post-Hoc Analysis (Data Cut-Off: August 15, 2019)
The median DOR per BICR assessment for the 43 responders using the FAS was 5.55 months (95% CI, 4.14 to 8.28) in the doublet group. The DOR for the 4 patients with a confirmed response in the control group were 2.56 months, 3.09 months, 5.55 months, and 12.45 months.15
Time to Response
Interim Analysis (Data Cut-Off: February 11, 2019)
The median TTR per BICR assessment for confirmed responders in the phase III response efficacy set was 1.54 months (95% CI, 1.41 to 1.64). In the doublet group, the TTRs for confirmed responders were 1.31, 1.58, 1.71, 1.48, 1.48, and 4.17 months. Two patients in the control group with confirmed responses had a TTR of 1.41 and 1.45 months.14
Post-Hoc Analysis (Data Cut-Off: August 15, 2019)
The median TTR per BICR assessment for confirmed responders in the FAS was 1.48 months (95% CI, 1.41 to 1.54) in the doublet group. For the 4 responders in the control group, the TTR was 1.41 months, 1.45 months, 2.63 months, and 2.99 months.15
Patient-Reported Outcomes
A summary of patient-reported outcomes based on the interim analysis is provided subsequently. HRQoL data were not provided for the post-hoc analysis.
Interim Analysis (Data Cut-Off: February 11, 2019)
EORTC Quality of Life Questionnaire Core 30: Compliance for the EORTC QLQ-C30 was high in the doublet group, with greater than 80% of patients filling out the questionnaire until cycle 12; after cycle 12 there were fewer than 10 patients still on treatment eligible for completion of the EORTC QLQ-C30 tool. In the control group, greater than 80% of patients filled out the instrument until cycle 6; after cycle 10, there were fewer than 10 patients still on treatment who were eligible to complete the EORTC QLQ-C30 tool.14
Median global health status score and subscale scores were similar in both treatment groups at baseline. The median time to definitive 10% deterioration in the EORTC QLQ-C30 global health status was 4.60 months (95% CI, 3.81 to 6.11) in the doublet group versus 2.20 months (95% CI, 1.61 to 3.06) in the control group. An approximate 46% reduction in risk of definitive 10% deterioration in global health status was observed for the doublet treatment group over the control group (HR = 0.54; 95% CI, 0.43 to 0.69) (Figure 8).14
Figure 8: Kaplan–Meier Plot of Time to Definitive 10% Deterioration in EORTC QLQ-C30 Global Health Status, Doublet Group Versus Control Group

CETUX = cetuximab; CI = confidence interval; ENCO = encorafenib; EORTC QLQ-C30 = European Organisation for Research and Treatment of Cancer Quality of Life Questionnaire Core 30; HR = hazard ratio; Ref = reference.
Note: Definitive 10% deterioration was defined as a worsening of the corresponding scale score by at least 10% relative to baseline, with no later improvement above this threshold observed while on treatment or following death due to any cause. (Data Cut-Off: February 11, 2019)
Source: BEACON Clinical Study Report.
Functional Assessment of Cancer Therapy–Colorectal: Compliance with the FACT-C was high in the doublet group, with greater than 80% of patients filling out the instrument until cycle 14; after cycle 12, fewer than 10 patients were still on treatment and eligible to complete the instrument. In the control group, greater than 80% of patients filled out the instrument until cycle 8; after cycle 8, fewer than 10 patients were still on treatment and eligible to complete the instrument.14
Median FACT-C scores and subscale scores were similar in both treatment groups at baseline. The median time to 10% definitive deterioration in the functional well-being subscale score was 4.63 months (95% CI, 3.94 to 6.11) in the doublet group versus 2.04 months (95% CI, 1.87 to 3.22) in the control group. An approximate 43% reduction in risk of definitive 10% deterioration in the functional well-being subscale score was observed for the doublet treatment group over the control group (HR = 0.57; 95% CI, 0.45 to 0.72, Figure 9).14
Figure 9: Kaplan–Meier Plot of Time to Definitive 10% Deterioration in FACT-C Functional Well-Being Subscale, Doublet Group Versus Control Group
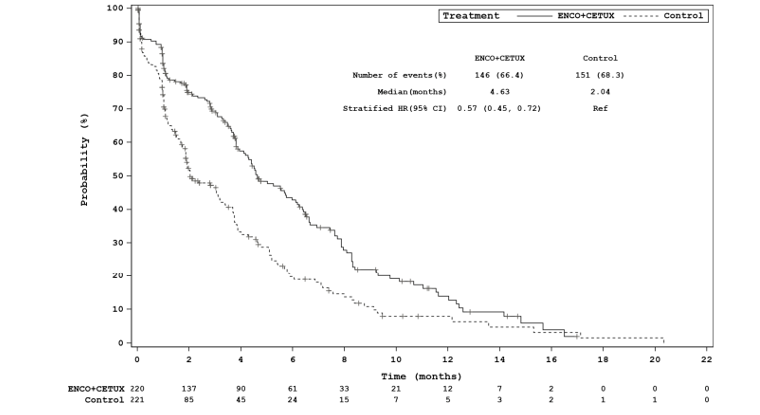
CETUX = cetuximab; CI = confidence interval; ENCO = encorafenib; FACT-C = Functional Assessment of Cancer Therapy–Colorectal; HR = hazard ratio; Ref = reference.
Note: Definitive 10% deterioration was defined as a worsening of the corresponding scale score by at least 10% relative to baseline, with no later improvement above this threshold observed while on treatment or following death due to any cause. (Data Cut-Off: February 11, 2019)
Source: BEACON Clinical Study Report.14
EQ-5D-5L Questionnaire: Compliance with the EQ-5D-5L was high in the doublet group, with greater than 80% of patients filling out the instrument until cycle 14; after cycle 12, fewer than 10 patients were still on treatment and eligible to complete the instrument. In the control group, greater than 80% of patients filled out the instrument until cycle 6; after cycle 8, the number of patients still on treatment who were eligible to complete the instrument was fewer than 10.14
Median EQ-5D-5L Visual Analogue Scale (VAS) scores were the same in both treatment groups at baseline. The median time to 10% definitive deterioration in the VAS scores was 5.36 months (95% CI, 4.50 to 6.37) in the doublet group versus 2.37 months (95% CI, 1.68 to 3.71) in the control group. An approximate 51% reduction in risk of definitive 10% deterioration in EQ-5D-5L VAS was observed for the doublet treatment group over the control group (HR = 0.49; 95% CI, 0.39 to 0.63) (Figure 10).14
Figure 10: Kaplan–Meier Plot of Time to Definitive 10% Deterioration in EQ-5D-5L VAS, Doublet Group Versus Control Group (Data Cut-Off: February 11, 2019)
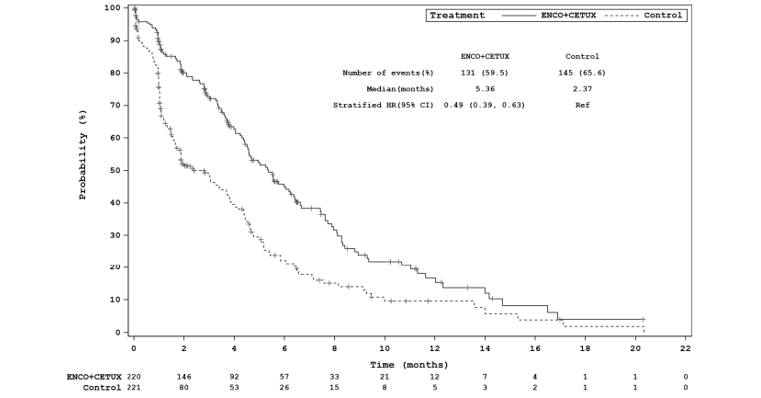
CETUX = cetuximab; CI = confidence interval; ENCO = encorafenib; EQ-5D-5L = EuroQol 5-Dimensions 5-Levels questionnaire; HR = hazard ratio; Ref = reference; VAS = Visual Analogue Scale.
Note: Definitive 10% deterioration was defined as a worsening of the corresponding scale score by at least 10% relative to baseline, with no later improvement above this threshold observed while on treatment or death due to any cause.
Source: BEACON Clinical Study Report.14
Patient Global Impression of Change: Compliance with the PGIC was high in the doublet group, with greater than 80% of patients filling out the instrument until cycle 14; after cycle 12, the number of patients still on treatment who were eligible to complete the instrument was fewer than 10. In the control group, the proportion of patients filling out greater than 80% the PGIC instrument occurred only at cycle 4. The number of patients still on treatment who were eligible to complete the instrument in the control group was fewer than 10 after cycle 8.14
Change in PGIC during cycle 2 and cycle 4 was reported to be “much improved” or “very much improved” by more patients in the doublet group versus the control group (cycle 2: doublet = 31.0%, control = 14.9%; cycle 4: doublet = 41.7%, control = 28.3%).14
Harms
Only those harms identified in the review protocol are reported subsequently.
Adverse Events
All-grade AEs due to any cause occurred in similar frequency in both the doublet and control groups (98% versus 97%, respectively) (Table 20). The categories of frequently reported AEs were gastrointestinal disorders, skin and subcutaneous disorders, general disorders, and administration-site conditions.14 The most commonly occurring any-grade AEs were diarrhea (33.3% in the doublet group versus 48.2% in the control group), dermatitis acneiform (29.2% versus 39.4%), nausea (34.3% versus 41.5%), fatigue (30.1% versus 27.5%), vomiting (21.3% versus 29.0%), decreased appetite (26.9% versus 26.9%), abdominal pain (22.7% versus 24.9%), and asthenia (21.3% versus 35.4%).14
AEs of any grade with a difference of 10% between the doublet and control groups, and which occurred more frequently in the doublet group, included arthralgia (19.0% versus 0.5%, respectively), headache (19.4% versus 2.6%), melanocytic nevus (14.4% versus 0%), myalgia (13.4% versus 2.1%), and musculoskeletal pain (12.5% versus 1.6%).14 AEs of any grade with a difference of 10% between the doublet and control groups and which occurred more frequently in the control group included dermatitis acneiform (29.2% versus 39.4%, respectively), neutrophil count decrease (0.5% versus 10.9%), diarrhea (33.3% versus 48.2%), stomatitis (5.6% versus 2.1%), and neutropenia (0.5% versus 18.7%).14
Grade 3 or greater AEs occurred less frequently in the doublet group (50.0%) compared with the control group (60.6%) (Table 20). Most individual grade 3 or greater AEs occurred in similar frequency across both treatment groups. However, the most commonly occurring grade 3 or greater AEs were diarrhea (1.9% versus 9.8% in the doublet and control groups, respectively), neutropenia (0.5% versus 9.8%), and neutrophil count decrease (0.5% versus 8.3%), all of which occurred more frequently in the control group.14
TEAEs included AEs with a suspected relationship to the study drug; TEAEs were reported in 88.4% of patients in the doublet group and 91.2% of patients in the control group (Table 21). The most frequently reported TEAEs of any grade in the doublet group included dermatitis acneiform (27.8%), fatigue (22.7%), and nausea (20.4%). The most frequently reported TEAEs of any grade in the control group included diarrhea (44.0%), dermatitis acneiform (38.9%), nausea (36.3%), asthenia (22.3%), and stomatitis (21.2%).14
Grade 3 or greater TEAEs were less frequent in the doublet group than in the control group (19.4% versus 39.4%, respectively). Grade 3 or greater TEAEs were infrequently reported in the doublet group as each TEAE occurred at a frequency of less than 3%. The most commonly reported grade 3 or greater TEAEs in the control group included diarrhea (8.3%), neutropenia (9.3%), and neutrophil count decrease (7.8%).14
Table 20: Summary of Adverse Events (Any Grade and Grade 3 or Greater)
Adverse events | Doublet group (N = 216) | Control group (N = 193) | ||
|---|---|---|---|---|
All grades | Grade ≥ 3 | All grades | Grade ≥ 3 | |
Any, n (%) | 212 (98.1) | 108 (50.0) | 188 (97.4) | 117 (60.6) |
Most common events,a n (%) | ||||
Diarrhea | 72 (33.3) | 4 (1.9) | 93 (48.2) | 19 (9.8) |
Dermatitis acneiform | 63 (29.2) | 1 (0.5) | 76 (39.4) | 5 (2.6) |
Nausea | 74 (34.3) | 1 (0.5) | 80 (41.5) | 2 (1.0) |
Vomiting | 46 (21.3) | 3 (1.4) | 56 (29.0) | 5 (2.6) |
Anemia | 35 (16.2) | 10 (4.6) | 37 (19.2) | 12 (6.2) |
Fatigue | 65 (30.1) | 9 (4.2) | 53 (27.5) | 8 (4.1) |
Abdominal pain | 49 (22.7) | 5 (2.3) | 48 (24.9) | 9 (4.7) |
Decreased appetite | 58 (26.9) | 3 (1.4) | 52 (26.9) | 6 (3.1) |
Asthenia | 46 (21.3) | 7 (3.2) | 49 (25.4) | 9 (4.7) |
Constipation | 33 (15.3) | 0 | 35 (18.1) | 2 (1.0) |
Dry skin | 24 (11.1) | 0 | 13 (6.7) | 1 (0.5) |
Pyrexia | 35 (16.2) | 2 (0.9) | 27 (14.0) | 1 (0.5) |
Rash | 25 (11.6) | 0 | 27 (14.0) | 3 (1.6) |
Stomatitis | 12 (5.6) | 0 | 44 (22.8) | 4 (2.1) |
Back pain | 22 (10.2) | 2 (0.9) | 23 (11.9) | 2 (1.0) |
Arthralgia | 41 (19.0) | 2 (0.9) | 1 (0.5) | 0 |
Hypomagnesemia | 22 (10.2) | 1 (0.5) | 17 (8.8) | 2 (1.0) |
Myalgia | 29 (13.4) | 1 (0.5) | 4 (2.1) | 0 |
Dyspnea | 23 (10.6) | 2 (0.9) | 17 (8.8) | 5 (2.6) |
Headache | 42 (19.4) | 0 | 5 (2.6) | 0 |
Hypokalemia | 13 (6.0) | 2 (0.9) | 27 (14.0) | 5 (2.6) |
Pain in extremity | 22 (10.2) | 0 | 1 (0.5) | 0 |
Insomnia | 24 (11.1) | 0 | 11 (5.7) | 0 |
Musculoskeletal pain | 27 (12.5) | 0 | 3 (1.6) | 0 |
Neutropenia | 1 (0.5) | 1 (0.5) | 36 (18.7) | 19 (9.8) |
Melanocytic nevus | 31 (14.4) | 0 | 0 | 0 |
Neutrophil count decreased | 1 (0.5) | 1 (0.5) | 21 (10.9) | 16 (8.3) |
aFrequency > 10% in any treatment group.
Source: BEACON Clinical Study Report.14
Table 21: Frequently Reported Treatment-Emergent Adverse Events
TEAEs | Doublet group (N = 216) | Control group (N = 193) | ||
|---|---|---|---|---|
All grades | Grade ≥ 3 | All grades | Grade ≥ 3 | |
Any TEAE, n (%) | 191 (88.4) | 42 (19.4) | 176 (91.2) | 76 (39.4) |
Most common events,a n (%) | ||||
Diarrhea | 40 (18.5) | 2 (0.9) | 85 (44.0) | 16 (8.3) |
Dermatitis acneiform | 60 (27.8) | 1 (0.5) | 75 (38.9) | 5 (2.6) |
Nausea | 44 (20.4) | 1 (0.5) | 70 (36.3) | 1 (0.5) |
Fatigue | 49 (22.7) | 5 (2.3) | 42 (21.8) | 5 (2.6) |
Vomiting | 27 (12.5) | 2 (0.9) | 38 (19.7) | 4 (2.1) |
Rash | 25 (11.6) | 0 (0) | 26 (13.5) | 3 (1.6) |
Anemia | 9 (4.2) | 3 (1.4) | 21 (10.9) | 4 (2.1) |
Asthenia | 22 (10.2) | 2 (0.9) | 43 (22.3) | 8 (4.1) |
Decreased appetite | 29 (13.4) | 0 (0) | 36 (18.7) | 3 (1.6) |
Stomatitis | 7 (3.2) | 0 (0) | 41 (21.2) | 4 (2.1) |
Neutropenia | 0 (0) | 0 (0) | 35 (18.1) | 18 (9.3) |
Decreased neutrophil count | 1 (0.5) | 1 (0.5) | 20 (10.4) | 15 (7.8) |
Melanocytic nevus | 29 (13.4) | 0 (0) | 0 (0) | 0 (0) |
Arthralgia | 25 (11.6) | 1 (0.5) | 1 (0.5) | 0 (0) |
Headache | 23 (10.6) | 0 (0) | 0 (0) | 0 (0) |
TEAE = treatment-emergent adverse event.
aFrequency > 10% in any treatment group.
Source: BEACON Clinical Study Report.14
Serious Adverse Events
A summary of SAEs is provided in Table 22. In general, specific SAEs occurred infrequently and SAEs of any grade and grade 3 or greater were similar across the doublet and control groups (32.9% versus 36.8%, and 28.2% versus 33.2%, respectively). The most common SAEs of any grade were diarrhea, occurring in 0 patients in the doublet group and 10 patients (5.2%) in the control group, and intestinal obstruction, occurring in 10 patients (4.6%) and 7 patients (3.6%), respectively. The most common SAEs of any grade occurring in the doublet group included intestinal obstruction (4.6%), urinary tract infection (2.3%), and cancer pain (2.3%). The most common grade 3 or greater SAEs were diarrhea, occurring in 0 patients in the doublet group and 7 patients (3.6%) in the control group, and intestinal obstruction, occurring in 9 patients (4.2%) and 5 patients (2.6%), respectively. The most common grade 3 or greater SAEs occurring in the doublet group included intestinal obstruction (4.2%) and urinary tract infection (2.3%).14
Table 22: Summary of Serious Adverse Events
SAEs | Doublet group (N = 216) | Control group (N = 193) | ||
|---|---|---|---|---|
All grades | Grade ≥ 3 | All grades | Grade ≥ 3 | |
Any SAE, n (%) | 71 (32.9) | 61 (28.2) | 71 (36.8) | 64 (33.2) |
Most common events,a n (%) | ||||
Diarrhea | 0 | 0 | 10 (5.2) | 7 (3.6) |
Pulmonary embolism | 3 (1.4) | 3 (1.4) | 4 (2.1) | 4 (2.1) |
Acute kidney injury | 4 (1.9) | 4 (1.9) | 1 (0.5) | 1 (0.5) |
Nausea | 3 (1.4) | 1 (0.5) | 1 (0.5) | 1 (0.5) |
Intestinal obstruction | 10 (4.6) | 9 (4.2) | 7 (3.6) | 5 (2.6) |
Ileus | 3 (1.4) | 3 (1.4) | 2 (1.0) | 2 (1.0) |
Abdominal pain | 3 (1.4) | 3 (1.4) | 4 (2.1) | 3 (1.6) |
Sepsis | 3 (1.4) | 3 (1.4) | 2 (1.0) | 2 (1.0) |
Small intestinal obstruction | 2 (0.9) | 2 (0.9) | 4 (2.1) | 4 (2.1) |
Vomiting | 2 (0.9) | 0 | 3 (1.6) | 3 (1.6) |
Bile duct obstruction | 3 (1.4) | 3 (1.4) | 2 (1.0) | 2 (1.0) |
Urinary tract infection | 5 (2.3) | 5 (2.3) | 1 (0.5) | 1 (0.5) |
Cancer pain | 5 (2.3) | 4 (1.9) | 1 (0.5) | 1 (0.5) |
Large intestinal obstruction | 3 (1.4) | 3 (1.4) | 0 | 0 |
Respiratory failure | 1 (0.5) | 1 (0.5) | 3 (1.6) | 2 (1.0) |
Subileus | 0 | 0 | 3 (1.6) | 3 (1.6) |
Atrial fibrillation | 3 (1.4) | 1 (0.5) | 0 | 0 |
Febrile neutropenia | 0 | 0 | 5 (2.6) | 5 (2.6) |
Infusion-related reaction | 3 (1.4) | 2 (0.9) | 2 (1.0) | 1 (0.5) |
SAE = serious adverse event.
aFrequency > n = 3 in any treatment group.
Source: BEACON Clinical Study Report.14
Withdrawals Due to Adverse Events
AEs of any grade and grade 3 or greater that resulted in discontinuation of all study treatments occurred in similar frequency between the doublet group and the control group (8.3% versus 11.4% and 7.4% versus 9.3%, respectively). Any-grade TEAEs that resulted in the discontinuation of all study treatments were reported in 6 patients (2.8%) in the doublet group and 12 patients (6.2%) in the control group; grade 3 or greater TEAEs resulting in discontinuation of all study treatments were reported in 5 patients (2.3%) in the doublet group versus 9 patients (4.7%) in the control group. TEAEs of any grade and grade 3 or greater that resulted in discontinuation of any study drug were reported less frequently in the doublet group versus the control group. Dose reductions, dose interruptions, and TEAEs that required additional therapy were reported more frequently in the control group than in the doublet group (Table 23).14 A summary of specific AEs resulting in dose interruption or reduction is reported in Table 24.
AEs of any grade most commonly leading to dose interruption due to encorafenib included vomiting (4.2%), nausea (3.7%), diarrhea, and pyrexia (2.8% each); AEs leading to dose interruption due to encorafenib occurred at a frequency of less than 5% for each type of event. AEs of any grade most commonly leading to dose interruption due to cetuximab in the doublet group were from intestinal obstruction (2.8%). AEs commonly leading to dose interruption in the control group included diarrhea (5.7%), infusion-related reaction (4.1%), and neutropenia (4.1%).14
Dose reductions for encorafenib or cetuximab in both the doublet and control groups were reported infrequently. AEs resulting in dose reduction of encorafenib occurred among 8.8% of patients in the doublet group, most commonly due to asthenia, peripheral neuropathy, and musculoskeletal pain (1.4% each). AEs resulting in dose reductions of cetuximab occurred among 2.3% of patients in the doublet group and 5.75 of patients in the control group. The frequency of dose reductions due to cetuximab in the control group were due mostly to diarrhea (1.6%) and dermatitis acneiform (1.0%).14
Table 23: Summary of Treatment Discontinuations
Treatment discontinuations, reductions, or interruptions | Doublet group | Control group | ||
|---|---|---|---|---|
All grades n (%) | Grade ≥ 3 n (%) | All grades n (%) | Grade ≥ 3 n (%) | |
Patients with at least 1 AE leading to discontinuation of all study treatment | 18 (8.3) | 16 (7.4) | 22 (11.4) | 18 (9.3) |
Patients with at least 1 TEAE leading to discontinuation of all study treatment | 6 (2.8) | 5 (2.3) | 12 (6.2) | 9 (4.7) |
Patients who discontinued any study drug due to AEs, n (%) | 25 (11.6) | 22 (10.2) | 33 (17.1) | 24 (12.4) |
Patients with at least 1 TEAE leading to discontinuation of any study drug | 9 (4.2) | 8 (3.7) | 23 (11.9) | 15 (7.8) |
Patients with at least 1 AE requiring dose reduction of any study drug | 22 (10.2) | 8 (3.7) | 58 (30.1) | 29 (15.0) |
Patients with at least 1 TEAE requiring dose reduction of any study drug | 21 (9.7) | 8 (3.7) | 56 (29.0) | 29 (15.0) |
Patients with at least 1 AE requiring dose interruption of any study drug | 98 (45.4) | 65 (30.1) | 103 (53.4) | 69 (35.8) |
Patients with at least 1 TEAE requiring dose interruption of any study drug | 57 (26.4) | 33 (15.3) | 74 (38.3) | 46 (23.8) |
Patients with at least 1 AE requiring additional therapy | 200 (92.6) | 91 (42.1) | 180 (93.3) | 94 (48.7) |
Patients with at least 1 TEAE requiring additional therapy | 155 (71.8) | 28 (13.0) | 160 (82.9) | 51 (26.4) |
AE = adverse event; TEAE = treatment-emergent adverse event.
Source: BEACON Clinical Study Report.14
Table 24: Adverse Events Leading to Dose Interruption or Reduction
AEs | Doublet group | Control group | ||||
|---|---|---|---|---|---|---|
Encorafenib | Cetuximab | Cetuximab | ||||
All grades n (%) | Grade ≥ 3 n (%) | All grades n (%) | Grade ≥ 3 n (%) | All grades n (%) | Grade ≥ 3 n (%) | |
AEs leading to dose interruption, n (%) | 72 (33.3) | 72 (33.3) | 66 (30.6) | 46 (21.3) | 79 (40.9) | 56 (29.0) |
Most common events,a n (%) | ||||||
Diarrhea | 6 (2.8) | 6 (2.8) | < 2% | < 2% | 11 (5.7) | 7 (3.6) |
Vomiting | 9 (4.2) | 2 (0.9) | < 2% | < 2% | 6 (3.1) | 0 (0) |
Pyrexia | 6 (2.8) | 1 (0.5) | NR | NR | NR | NR |
Nausea | 8 (3.7) | 0 (0) | 0 (0) | 0 (0) | 3 (1.6) | 0 (0) |
Asthenia | < 2% | < 2% | < 2% | < 2% | 5 (2.6) | 3 (1.6) |
Dermatitis acneiform | < 2% | < 2% | < 2% | < 2% | 4 (2.1) | 4 (2.1) |
Intestinal obstruction | < 2% | < 2% | 6 (2.8) | 5 (2.3) | 4 (2.1) | 4 (2.1) |
Infusion-related reaction | NA | NA | 9 (4.2) | 2 (0.9) | 8 (4.1) | 0 (0) |
Stomatitis | NR | NR | 0 (0) | 0 (0) | 6 (3.1) | 3 (1.6) |
Neutropenia | NR | NR | 0 (0) | 0 (0) | 8 (4.1) | 7 (3.6) |
Neutrophil count decreased | NR | NR | < 2% | < 2% | 4 (2.1) | 4 (2.1) |
AEs leading to dose reduction, n (%) | 19 (8.8) | 8 (3.7) | 5 (2.3) | 0 (0) | 11 (5.7) | 6 (3.1) |
Most common events,b n (%) | ||||||
Diarrhea | 1 (0.5) | 0 (0) | 0 (0) | 0 (0) | 3 (1.6) | 1 (0.5) |
Nausea | 2 (0.9) | 1 (0.5) | NR | NR | NR | NR |
Decreased appetite | 2 (0.9) | 0 (0) | NR | NR | NR | NR |
Fatigue | 2 (0.9) | 0 (0) | NR | NR | NR | NR |
Vomiting | 1 (0.5) | 1 (0.5) | NR | NR | NR | NR |
Pyrexia | 0 (0) | 0 (0) | NR | NR | NR | NR |
Asthenia | 3 (1.4) | 1 (0.5) | NR | NR | NR | NR |
Neuropathy peripheral | 3 (1.4) | 1 (0.5) | NR | NR | NR | NR |
Musculoskeletal pain | 3 (1.4) | 0 (0) | NR | NR | NR | NR |
Dermatitis acneiform | NR | NR | 0 (0) | 0 (0) | 2 (1.0) | 1 (0.5) |
AE = adverse event; NA = not applicable; NR = not reported.
aFrequency > 2% in any treatment group.
bFrequency > 0 in any treatment group.
Source: BEACON Clinical Study Report.14
Adverse Events of Special Interest
Adverse events of special interest (AESIs) were identified prospectively and defined as a result of signals observed from previous studies for encorafenib and binimetinib and based on known toxicities of BRAF and MEK inhibitors. In total, 130 patients (60.2%) in the doublet group experienced at least 1 AESI, of whom 26 (12.0%) had an AESI of grade 3 or greater. Conversely, 97 patients (50.3%) in the control group experienced at least 1 AESI, of whom 9 (4.7%) had an AESI of grade 3 or greater.14
The most frequently occurring AESIs in the doublet group included acneiform dermatitis (31.0%), rash (28.2%), hemorrhage (19.0%), myopathy 13.9%), skin infections (11.6%), and liver function test (LFT) abnormalities (11.1%). In the control group, the most commonly occurring AESIs included acneiform dermatitis (40.9%), rash (29.0%), skin infections (11.4%), and LFT abnormalities (10.9%). AESIs occurred in similar frequency in both the doublet and control groups, except for retinopathy (excluding retinal vein occlusion), hemorrhage, and myopathy, which occurred more often in the doublet group, and acneiform dermatitis, which occurred more frequently in the control group (Table 25).14
Table 25: Adverse Events of Special Interest — Summary of Harms
Adverse events | Doublet group (N = 216) | Control group (N = 193) | ||
|---|---|---|---|---|
All grades n (%) | Grade ≥ 3 n (%) | All grades n (%) | Grade ≥ 3 n (%) | |
Acneiform dermatitis | 67 (31.0) | 1 (0.5) | 79 (40.9) | 6 (3.1) |
Rash | 61 (28.2) | 1 (0.5) | 56 (29.0) | 4 (2.1) |
Retinopathy excluding RVO | 19 (8.8) | 1 (0.5) | 2 (1.0) | 0 |
Hemorrhage | 41 (19.0) | 4 (1.9) | 18 (9.3) | 0 |
Peripheral edema | 20 (9.3) | 0 | 14 (7.3) | 1 (0.5) |
Skin infections | 25 (11.6) | 2 (0.9) | 22 (11.4) | 0 |
LFT abnormalities | 24 (11.1) | 8 (3.7) | 21 (10.9) | 4 (2.1) |
Myopathy | 30 (13.9) | 1 (0.5) | 5 (2.6) | 0 |
Venous thromboembolism | 7 (3.2) | 5 (2.3) | 10 (5.2) | 8 (4.1) |
Nail disorders | 12 (5.6) | 0 | 2 (1.0) | 0 |
Hypertension | 7 (3.2) | 2 (0.9) | 6 (3.1) | 5 (2.6) |
LFT = liver function test; RVO = retinal vein occlusion.
Source: BEACON Clinical Study Report.14
Mortality
On-treatment deaths were reported among 14.8% (n = 32) of patients in the doublet group and 13.5% (n = 26) of patients in the control group. Most on-treatment deaths were due to disease progression. The safety data reported for the BEACON trial included assessment of on-treatment deaths, which were deaths occurring during treatment or within 30 days of the last administered dose of the study drug. The treatments in the BEACON trial were administered both orally and through IV; in addition, while encorafenib was administered daily, chemotherapies were administered intermittently. Due to the differences in dose administration, it is possible the results of on-treatment deaths of chemotherapy regimens are underestimated. Due to this, the sponsor also assessed on-treatment deaths, defined as events up to 30 days following the investigators’ decision to terminate study treatment. Based on the modified definition for on-treatment deaths, on-treatment deaths comprised 16.7% of patients in the doublet group and 20.7% of patients in the control group, most of which were determined to be due to progression of disease. Deaths occurring during treatment or within 30 days of the last dose were considered grade 5 AEs. Seven patients (3.2%) in the doublet group and 8 patients (4.1%) in the control group had a grade 5 AE.14
Critical Appraisal
Internal Validity
The BEACON trial was an open-label phase III trial; therefore, patients and investigators were aware of treatment assignment. Due to this open-label design, bias due to the lack of blinding can affect the performance, measurement, and reporting of clinical outcomes (i.e., efficacy and safety) by both patients and investigators, potentially favouring trial results in the direction of the doublet or triplet regimens. The key efficacy end points of the BEACON trial included ORR, OS, and PFS. OS is an objective end point unlikely to be affected by biases of open-label study designs. In addition, ORR and PFS, which are subject to potential bias, as they involve assessment of patient response, were assessed by BICR, mitigating the potential biases associated with an open-label study design. Moreover, the sponsor of the trial and their designee trial team were blinded to the treatment group assignments presented to them in aggregate data summaries. During the trial, a limited number of study team members were unblinded to individual treatment assignments for the purposes of trial conduct, including for reasons of site monitoring, data management, patient emergencies, or regulatory purposes. The names and roles of team members unblinded to data were documented and these individuals did not have access to unblinded aggregate data. Further, the choice of an open-label trial was considered appropriate by the CADTH methods team based on the differences in treatment administration (i.e., schedule, oral versus IV) and management of AEs (i.e., chemotherapy versus small molecule treatments); these differences in administration and toxicities would have resulted in unblinding of treatment allocation. The sponsor implemented measures to mitigate biases associated with an open-label design. However, biases from an open-label trial remain a concern for the subjective outcomes assessed in the BEACON trial, including HRQoL. Specifically, the EORTC QLQ-C30, FACT-C, EQ-5D-5L, and PGIC tools may have been influenced by the patient’s or investigator’s knowledge of treatment assignment, which could have influenced the assessment and reporting of these outcomes. The patient-reported outcomes captured in the BEACON trial are considered exploratory and should be interpreted with caution.
In general, protocol deviations occurred in similar proportions across the doublet and control groups of the BEACON trial. However, a greater proportion of patients in the control group had deviations, which led to more exclusions from the per-protocol set than from the doublet group (19.5% versus 9.5%, respectively); the difference between groups was mainly due to the greater proportion of patients in the control group (14.0%) versus the doublet group (1.8%) who received a study treatment different from what they were randomized to; of these patients in the control group, most were not treated (12.7%), while a few received a different treatment (1.4%). It should be noted that this discrepancy may be due to differences in treatment approvals, as the US had approved treatment with encorafenib and binimetinib for patients with BRAF V600E–mutated melanoma, which resulted in off-label use of encorafenib and binimetinib for patients with mCRC; due to this, many patients randomized to the control group in the US withdrew from the trial, and the enrolment sites in the US were closed on July 15, 2018. It is not expected that this difference in removal of patients from the per-protocol set will bias the results of the efficacy analyses for the BEACON trial in any specific direction.
The sponsor pre-established a set of criteria to allow for an interim analysis that included a fallback procedure to control for type I error for the primary end points. In addition, a statistical hierarchy was established that only allowed for formal testing of key secondary end points comparing the doublet group with the control group, if ORR and OS between the triplet group and control group was found to be statistically significant. The CADTH reviewers determined that the statistical procedures specified by the sponsor for the interim and final analyses were appropriate for controlling for multiplicity and reducing the risk of type I error. Additional analyses for efficacy were conducted (data cut-off: August 15, 2019), which were not pre-specified in the protocol of the BEACON trial. Results from the post-hoc analysis (data cut-off: August 15, 2019) should be considered descriptive.
Analyses of efficacy end points were conducted using both the phase III response efficacy set and the FAS. Analyses of patients using the phase III response efficacy set included only the first 330 patients randomized into the phase III portion of the BEACON trial, whereas the FAS included all randomized patients. At the time of the primary analysis, 445 patients were enrolled and included in the FAS; the efficacy analyses based on the phase III response efficacy set included a lower number of patients overall and per treatment group. In addition, the phase III response efficacy set included a greater proportion of North American patients than the overall population (18.7% versus 13.1%); this difference is expected due to the closed US enrolment sites related to approval of encorafenib and binimetinib. Other baseline characteristics were similar between the doublet and control groups of the BEACON trial. The analysis of ORR at the updated cut-off was conducted using the FAS, which supported the initial results of ORR at the interim analysis.
The analysis of OS in the trial did not control for the subsequent therapies that patients may have received after progression. While a similar proportion of patients had any subsequent therapy in the doublet group (45.0%) and the control group (47.1%), the types of subsequent therapies differed between the 2 groups.15 For example, more patients in the doublet group received subsequent therapy with an irinotecan combination than in the control group (7.3% versus 1.8%, respectively), or received an irinotecan combination plus a vascular endothelial growth factor inhibitor (11.8% versus 5.4%), and fewer patients in the doublet group received a protein kinase inhibitor compared with the control group (6.8% versus 18.6%, respectively).15 The differences in subsequent therapies are expected to introduce confounding in the results for OS. However, the sensitivity analyses of PFS, which censored for patients who received subsequent anti-cancer therapies, continued to support the primary results, which showed statistically significant improvement in patients treated with the doublet regimen over the control group. In addition, the analysis of OS and PFS involved large amounts of censored data at the interim analysis; a total of 127 patients (57.7%) in the doublet group and 107 patients (48.4%) in the control group were censored in the analysis for OS, and 87 patients (39.5%) and 93 patients (42.1%) were censored for PFS.14 While the analyses of OS and PFS at the update data cut-off were not pre-specified and, therefore, descriptive, there were fewer instances of censoring for both OS and PFS; a total of 92 patients (41.8%) in the doublet group and 64 patients (29.0%) in the control group were censored for OS, and 53 patients (24.1%) and 74 patients (33.5) were censored for PFS.15 The continued observed benefit observed with the doublet regimen over the treatments of the control group supports the conclusion that encorafenib plus cetuximab offer improved clinical outcomes for patients.
The median duration of treatment was longer in the doublet group (19.3 weeks) compared with the control group (7.0 weeks). The relative dose intensity of treatment was also greater for treatments in the doublet regimen (87% to 88%) compared with treatments in the control group (67% to 77%).15 The longer duration of treatment in the doublet group should be considered when interpreting safety and HRQoL data, as longer exposure to treatment may influence toxicities and quality of life for patients.
The protocol of the BEACON trial was updated to allow for patients randomized to the control group to cross over to the triplet regimen. The sponsor confirmed that no patients in the BEACON trial crossed over to the doublet group. In addition, the efficacy results of the post-hoc analyses supported the primary results of the interim analysis, which supported the treatment of the doublet regimen over the treatments of the control group. Therefore, it is not expected that crossover would have affected any of the efficacy or safety analyses. A number of protocol amendments occurred that significantly changed the study design or conduct. Specifically, the protocol amendments dated September 19, 2018 introduced the addition of ORR between the triplet and control groups as a co-primary end point. The analysis of ORR between the triplet and control groups was specified to occur after certain criteria were met. In addition, boundaries for superiority and futility were added to the planned interim analysis of OS, and the planned interim analysis of OS was specified to occur during the primary analysis for ORR.
Patients in the BEACON trial were eligible to continue receiving study treatment after progression if it was believed a patient would benefit from continued treatment. A total of 104 of 141 patients with progressed disease (73.8%) in the doublet group received treatment beyond progression, compared with 37 of 116 patients with progressed disease (31.9%) in the control group.31 It should be noted that, since the BEACON trial used an open-label study design, the investigator’s knowledge of patient treatment may have influenced treatment decisions regarding continuation of investigational therapies. The impact of this investigator bias is unknown, although treatment groups may have been impacted differentially due to it resulting in a bias in efficacy analyses.
External Validity
The baseline characteristics of the BEACON trial were balanced mostly across the doublet and control groups. Of note, there were fewer North American patients than expected who maintained enrolment. The large amount of withdrawal of North American patients was due mainly to a large number of patients withdrawing from enrolment due to the gaining off-label access to encorafenib and binimetinib; the treatment was granted FDA approval for treatment of BRAF-mutated melanoma, which resulted in off-label use for colorectal cancer patients. In addition, a total of 7 Canadian patients were enrolled in the BEACON trial. The clinical experts consulted by CADTH for this review indicated that underrepresentation of North American patients is not expected to affect the generalizability of the efficacy of encorafenib plus cetuximab to Canadian patients.
The eligibility criteria of the BEACON trial allowed for the enrolment of patients with 1 or 2 prior therapies in the metastatic treatment setting. However, enrolled patients who had received 2 prior therapies were limited to account for no more than approximately 1-third of all patients in the trial. In total, most patients (66%) had received only 1 prior therapy, while the remaining patients (34%) had received 2 prior therapies, with 1 patient in the control group receiving more than 2 prior therapies. Patients in the control group of the BEACON trial could have been randomized to receive either cetuximab plus irinotecan or cetuximab plus FOLFIRI. Cetuximab in combination with chemotherapy for first-line treatment of mCRC in patients with wild-type KRAS was previously reviewed by CADTH and received a negative funding recommendation.9 However, cetuximab plus irinotecan-based regimens is funded in some provinces across Canada for use in the third line, whereas most patients in the BEACON trial were receiving treatment in the second line. Consultation with the clinical experts confirmed that for both regimens used in the control group of the BEACON trial, cetuximab plus irinotecan or FOLFIRI are used in second- or third-line therapy for patients with mCRC in Canada. Therefore, the treatment regimens in the control group were considered generalizable to the Canadian context. The eligibility criteria of the BEACON trial also excluded patients who had received prior treatment with any RAF/MEK inhibitor, cetuximab, panitumumab, or other EGFR inhibitors; this exclusion criteria are reflective of Canadian practices, which normally rely on chemotherapies with or without a biologic drug as primary therapy.
Further, regarding treatments of the control group of the BEACON trial, the clinical equivalence of cetuximab plus irinotecan and cetuximab plus FOLFIRI was considered. Direct phase III evidence to support the equivalence of the 2 regimens was not provided. However, the sponsor provided some data to suggest the equivalence of efficacy between the 2 regimens; the assumption of equivalence was also supported by the clinical experts. However, it is acknowledged that both regimens in the control group of the BEACON trial contain irinotecan, and that approximately half of patients in both the doublet and control groups of the trial were previously exposed to treatment with irinotecan. Therefore, approximately half of patients in the control group had previously progressed on a treatment regimen containing irinotecan, and were exposed to irinotecan again in the BEACON trial; re-treatment with irinotecan for patients who had previously progressed may suggest poorer clinical outcomes for patients. Results of the BEACON trial may be biased in favour of the doublet group, as patients randomized to the doublet would be receiving a treatment regimen that did not contain irinotecan and which could result in a more favourable response. Accordingly, subgroup analysis of patients showed more favourable results for OS at the interim analysis for patients without prior irinotecan use (HR = 0.50; 95% CI, 0.33 to 0.74) compared with patients with prior irinotecan use (HR = 0.75; 95% CI, 0.52 to 1.10)14; results were similar at the time of the post-hoc analysis.
Within the BEACON trial, cetuximab was administered as a 400 mg/m2 IV followed by 250 mg/m2 IV every week. It was noted by the clinical experts for this review that cetuximab is often not provided to patients at the dose and administration schedule specified in the BEACON trial. Cetuximab may be provided to patients at an alternative dosing schedule of 500 mg/m2 every 2 weeks to address challenges with implementation (i.e., chair time, hospital resources, travel time, and inconvenience to patients). The efficacy of cetuximab provided at a dose of 250 mg/m2 every week versus 500 mg/m2 every 2 weeks was considered broadly similar based on a pooled analysis demonstrating noninferiority of the 2 doses and administration schedules for cetuximab.17 While no phase III evidence comparing the 2 regimens exists to support the conclusion of clinical equivalence, pharmacokinetic studies were acknowledged that support the use of cetuximab at a higher dose and less frequent administration schedule. In addition, consultation with the CADTH clinical experts supported the use of cetuximab at 500 mg/m2 every 2 weeks and it was acknowledged that administration of cetuximab in clinical practice typically occurs at 500 mg/m2 every 2 weeks.
Within the BEACON trial, randomization was stratified according to baseline ECOG PS (0 versus 1), prior use of irinotecan (yes versus no), and cetuximab source (US-licensed versus EU-approved). Specifically regarding cetuximab, the manufacturing of cetuximab differs between Europe and the US. The efficacy of cetuximab was considered to be no different by source of manufacturing based on a phase III, double-blind safety study comparing the 2 formulations of cetuximab in combination with platinum-based chemotherapy for patients with head and neck squamous cell carcinoma.36 Based on input from the clinical experts, it was suggested that the source of cetuximab would not affect efficacy of treatment for patients.
Regarding the clinical outcomes of the BEACON trial, efficacy outcomes captured in the trial were considered clinically relevant for patients with mCRC. Regarding patient-reported outcomes, HRQoL data were not assessed based on MIDs for any of the patient-reported outcomes in the BEACON trial. Based on a CADTH literature search, no literature was found identifying established MIDs for the EQ-5D-5L and PGIC questionnaires. However, a summary of MIDs specific to patients with colorectal cancer for the EORTC QLQ-C30 and FACT-C questionnaires is provided in Appendix 4. Colorectal cancer is a common disease with an expected increase in incidence and prevalence in Canada. HRQoL tools can be useful in identifying clinically relevant differences in quality-of-life measures for patients receiving different treatments in clinical trial. While the evidence supporting the reliability and validity of HRQoL tools in the BEACON trial were considered adequate by the CADTH reviewers, additional evidence would be beneficial to aid in the interpretation of clinically meaningful differences. In addition, a TTD analysis was conducted for the HRQoL tools in the BEACON trial. TTD analyses were conducted using a threshold of 10% deterioration among patients’ HRQoL. The sponsor did not provide any justification for the use of the 10% deterioration threshold and whether this threshold was appropriate or generalizable for each of the HRQoL tools. Therefore, while results may indicate improved quality of life for patients treated with encorafenib plus cetuximab over treatments in the control group, it is unclear whether a 10% deterioration in HRQoL provides a clinically meaningful context for analysis of patient’s quality of life.
Indirect Evidence
Objectives and Methods for the Summary of Indirect Evidence
The BEACON trial compared encorafenib plus cetuximab with the investigator’s choice of cetuximab plus irinotecan or FOLFIRI for patients with mCRC with the BRAF V600E mutation after previous therapy. Other treatments exist for patients with mCRC with the BRAF V600 mutation after first- or second-line therapy. In Canada, FOLFIRI and FOLFOX are considered the most common second-line treatments for patients. The objective of this section is to summarize and critically appraise available indirect evidence comparing encorafenib plus cetuximab with relevant treatments for mCRC patients with the BRAF V600 mutation after previous therapy (as specified in the CADTH review protocol).
The sponsor conducted a systematic literature review to identify relevant literature for its submitted ITC. The search for the systematic literature review was first performed on February 7, 2019, and updated in September 24, 2019. The updated search conducted in September 2019 aimed to identify randomized controlled trial (RCT) evidence and included first-line RCT studies. The scope of the ITC for the purpose of this CADTH review involves only patients after the first line of therapy; therefore, only studies that reported results in the second line or after were included.
Description of Indirect Comparison
The sponsor-submitted ITC is summarized and appraised. A supplemental search of the medical literature for publicly available ITCs was conducted by CADTH staff; no additional ITCs were identified that evaluated the comparative efficacy and safety of encorafenib plus cetuximab for patients with mCRC with the BRAF V600 mutation after having received previous therapy.
Table 26: Study Selection Criteria and Methods for the ITC
Criteria | Sponsor’s indirect treatment comparison |
|---|---|
Population | Adult patients (≥ 18 years) with RAS-WT or BRAF V600 mutated metastatic and/or irresectable colorectal cancer in the first, second, or third line of therapy. |
Intervention | Encorafenib plus cetuximab 5-FU (monotherapy or in various combinations and schedules, e.g., with irinotecan, oxaliplatin) Capecitabine (monotherapy or in various combinations and schedules, e.g., with irinotecan, oxaliplatin) FOLFOX CAPOX FOLFIRI FOLFOXIRI Bevacizumab combined with any cytotoxic listed previously Raltitrexed Tegafur plus uracil Cetuximab plus FOLFOX, FOLFIRI, or CAPOX Panitumumab plus FOLFOX, FOLFIRI, or CAPOX Pembrolizumab Regorafenib monotherapy Trifluridine plus tipiracil Aflibercept monotherapy or combined with FOLFIRI, FOLFOX, or CAPOX Ramucirumab monotherapy or combined with FOLFIRI, FOLFOX, or CAPOX Masitinib Napabucasin plus FOLFIRI ± bevacizumab Irinotecan monotherapy or combined with cetuximab or panitumumab Bevacizumab monotherapy or combined with FOLFIRI or FOLFOX Cetuximab monotherapy or combined with CT doublet or irinotecan Panitumumab monotherapy or combined with CT doublet or irinotecan Atezolizumab monotherapy or combined with cobimetinib |
Comparator | Any interventions listed previously. |
Outcome | OS PFS TTP DOR Response rate (CR, PR, SD) ORR DCR Duration of treatment (including beyond progression) |
All-grade AEs Grade 3 or 4 AEs SAEs Tolerability: Dose reductions and interruptions, discontinuations (any reason, due to AEs) HRQoL | |
Study design | Prospective RCTs (phase II to IV) with active, placebo, and BSC controls (no restriction on blinding). Post-hoc analysis of RCTs. |
Publication characteristics | Published in English. No limit for publication data for peer-reviewed literature. For congress proceedings, a publication data limit was placed between 2016 and 2019. |
Exclusion criteria | Population
Intervention
Study design
|
Databases searcheda | Electronic databases
Grey literature and other sources
|
Selection process | (e.g., articles screened independently by 2 researchers) |
Data-extraction process | Data extraction was conducted by 1 investigator using a standardized data-extraction form. A second, independent investigator validated all extracted data to confirm accuracy, and any disputes as to eligibility were referred to an independent reviewer. Where multiple publications of the same study were identified, data were extracted and reported as a single study. Only full paper publications were included, and the conference abstracts were excluded because conference abstracts are not peer-reviewed publications. |
Quality assessment | Quality assessment was performed by 2 independent reviewers. Study quality was assessed using a methodology checklist and 7-criteria checklist. Assessment of selection, performance, attribution, and detection bias. |
5-FU = fluorouracil; AACR = American Association for Cancer Research; AE = adverse event; ASCO = American Society of Clinical Oncology; BSC = best supportive care; CAPOX = capecitabine plus oxaliplatin; CR = complete response; CT = chemotherapy; DCR = disease control rate; DOR = duration of response; ESMO = European Society for Medical Oncology; FOLFIRI = folinic acid plus 5-fluorouracil and irinotecan; FOLFOX = folinic acid plus 5-fluorouracil and oxaliplatin; FOLFOXIRI = folinic acid plus 5-fluorouracil, oxaliplatin, and irinotecan; HRQoL = health-related quality of life; ITC = indirect treatment comparison; NCCN = National Cancer Care Network; NICE = National Institute for Health and Care Excellence; ORR = objective response rate; OS = overall survival; PFS = progression-free survival; PR = partial response; RAS-WT = RAS wild-type; RCT = randomized controlled trial; SAE = serious adverse event; SD = stable disease; TTP = time to progression; WCGC = World Congress on Gastrointestinal Cancer
aHand searching for clinical guidelines of the following organizations was also conducted: NICE, ESMO, ASCO, NCCN.
Source: Sponsor’s ITC.18
Methods of the ITC
Objectives
The aim of the submitted ITC was to compare the efficacy and safety of second-line or later lines of treatments for adults with mCRC with a BRAF V600E mutation.
Study Selection Methods
A literature search was conducted based on details in Table 26. Studies were screened by title and abstract and then full text, resulting in the inclusion of 131 studies.
Figure 11: PRISMA Flow Diagram of Systematic Literature Review for the Sponsor’s ITC
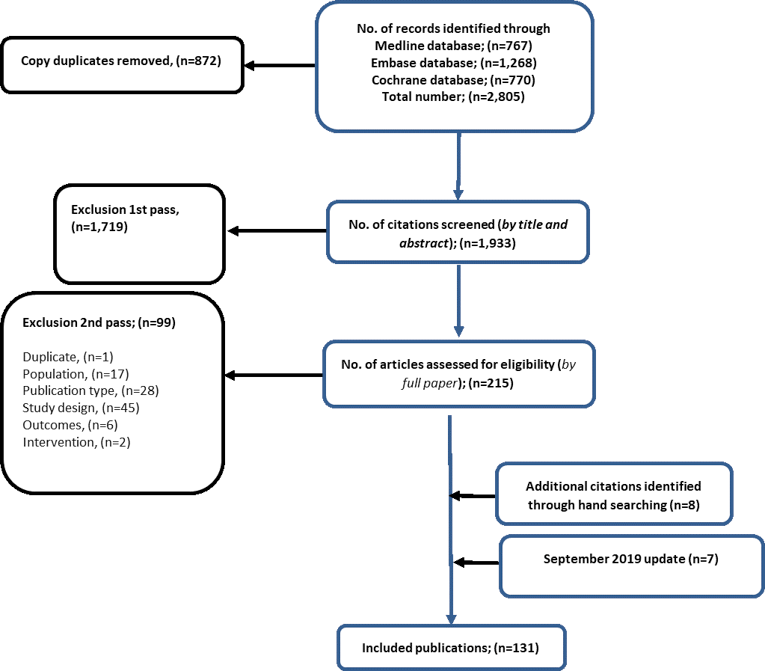
ITC = indirect treatment comparison; PRISMA = Preferred Reporting Items for Systematic Reviews and Meta-Analyses.
Source: Sponsor’s ITC.18
The sponsor’s systematic literature search identified 11 citations that were relevant based on pre-specified criteria. Three studies were reported as conference abstracts and involved patients with BRAF mutations. Eight citations, 1 of which was published as an abstract, reported efficacy data for subgroups of patients with BRAF mutations among patients with KRAS wild-type tumours or any mCRC. The sponsor excluded the 3 studies that involved patients with the BRAF mutation, as they were published only as conference abstracts, which are not peer-reviewed publications. Additionally, these studies were excluded based on alternate doses for encorafenib and including comparators, which were not relevant to the ITC. The third study was an abstract of the BEACON trial, which was the reference trial for the sponsor’s ITC. Among the 8 studies that assessed only subgroups of patients with BRAF mutations, 1 conference abstract was excluded, as it was not a peer-reviewed publication. In total, 7 peer-reviewed studies that reported efficacy data for at least 1 outcome of interest for a subgroup of patients with BRAF mutations receiving second-line or later treatment were identified in the sponsor’s systematic literature review.
ITC Analysis Methods
Feasibility Assessment
The sponsor conducted a feasibility assessment of the 7 studies retrieved from the systematic literature review for incorporation into its ITC. The credibility of estimates reported for BRAF-mutated subgroups in the 7 included trials was stated to be low due to small sample sizes, inadequate power, and a lack of stratification according to BRAF mutation status. In addition, the 7 studies did not include comparators common to the BEACON trial, which did not allow for connected networks through an NMA. Therefore, an NMA was considered infeasible. Instead, the sponsor conducted a grouped treatment node ITC that compared encorafenib plus cetuximab with FOLFIRI using data from the BEACON trial and trial NCT00339183 (Figure 12). In order for the comparison of encorafenib plus cetuximab with FOLFIRI to be feasible, the following assumptions were required to be made, in addition to the standard NMA assumptions:
FOLFIRI and irinotecan are clinically equivalent
cetuximab and panitumumab are clinically equivalent
FOLFIRI and FOLFOX are clinically equivalent
FOLFIRI plus cetuximab or irinotecan plus cetuximab were assumed to be clinically equivalent to FOLFIRI plus panitumumab
Figure 12: Network Diagram for ITC of Encorafenib Plus Cetuximab Versus FOLFIRI
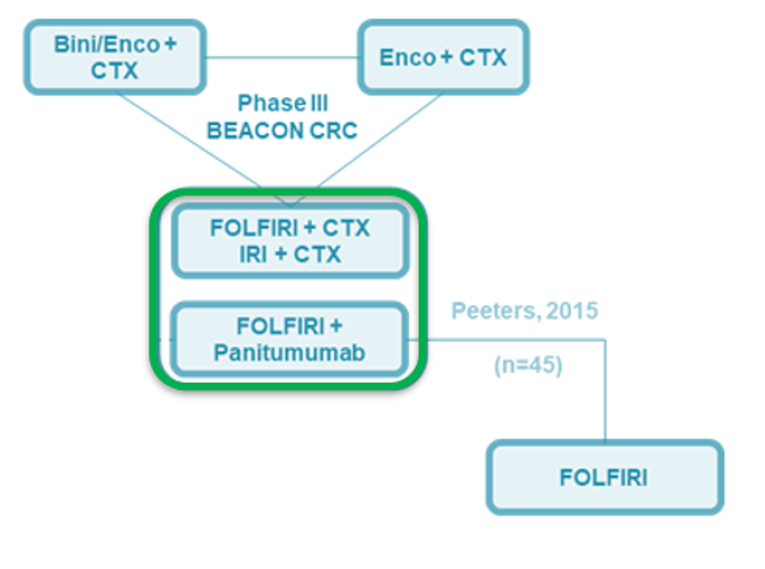
Bini = binimetinib; CTX = cetuximab; Enco = encorafenib; FOLFIRI = folinic acid plus 5-fluorouracil and irinotecan; IRI = irinotecan; ITC = indirect treatment comparison.
Source: Sponsor’s ITC.18
ITC Methods
The Bucher method was used in the grouped treatment node ITC conducted by the sponsor. HRs with corresponding 95% CIs were provided for comparisons of encorafenib plus cetuximab with FOLFIRI. The Bucher method was chosen by the sponsor due to the limited amount of available peer-reviewed literature pertaining to patients with BRAF V600E–mutated CRC after prior therapy. In addition, the BEACON trial, the only available trial that included a patient population relevant to the ITC, did not have a treatment group that connected with any other RCTs; therefore, the sponsor could not form connected networks for indirect comparisons and conducted comparisons based on the assumptions stated earlier.
Summary of Included Studies
Assessment of Heterogeneity
An assessment of heterogeneity was conducted by the CADTH reviewers based on the trial characteristics reported in Table 27. Trial characteristics were mostly similar, in that both trials were open-label phase III trials conducted across multiple countries. However, interventions in both trials differed, and the NCT00364013 trial did not exclude patients with or without specific mutation types.
Table 27: Summary of Trial Characteristics Included in the ITC
Study or author name (trial name) | N | Interventions | Population | Treatment setting | Country | Phase | Blinding | Primary end point |
|---|---|---|---|---|---|---|---|---|
BEACON | 220 | Encorafenib plus cetuximab | BRAF V600E–mutated mCRC | Second line or later | Multiple | III | Open label | OS and ORR |
221 | Cetuximab plus irinotecan OR Cetuximab plus FOLFIRI | |||||||
Peeters et al. (NCT00339183) | 541 | Panitumumab plus FOLFIRI | mCRC | Second line | Multiple | III | Open label | OS and PFS |
542 | FOLFIRI |
ITC = indirect treatment comparison; mCRC = metastatic colorectal cancer; ORR = objective response rate; OS = overall survival; PFS = progression-free survival.
Assessment of Clinical Heterogeneity
As the pairwise comparisons of the ITC consisted of only 1 trial for each treatment group, statistical assessments of heterogeneity were stated by the sponsor to not be possible.
Baseline characteristics of patients in the BEACON trial and patients with wild-type RAS in the NCT00339183 trial are reported in Table 28. Baseline characteristics were mostly comparable. Both trials reported a median age of approximately 60 years of age. patients were mostly from North America or Europe and had an ECOG PS of 0 or 1. However, the NCT00339183 trial reported slightly more males in the trial compared with the BEACON trial (66% versus 47%, respectively) and included more White patients (97% versus 80.5%). In the BEACON trial, 2-thirds of patients had received 1 prior line of therapy compared with all of the patients in the NCT00339183 trial; approximately 1-third of patients received 2 or more lines of therapy. In addition, the NCT00339183 study included more patients with liver metastases compared with the BEACON trial (86% versus 60%, respectively). Among patients with wild-type RAS, 45 were identified as having the BRAF mutation. The baseline characteristics of those patients were not available for comparison with the BEACON trial.
Subsequent therapies in the NCT00339183 study consisted mostly of oxaliplatin, irinotecan, or 5-fluorouracil (panitumumab plus FOLFIRI: 45%; FOLFIRI: 50%), EGFR monoclonal antibodies (panitumumab plus FOLFIRI: 12%; FOLFIRI: 34%),37 and bevacizumab (panitumumab plus FOLFIRI: 10%; FOLFIRI: 12%).38 The use of subsequent EGFR monoclonal antibody treatments may have confounded OS and PFS results in the NCT00339183 trial. Subsequent therapies in the BEACON trial were most commonly (> 10%) reported to be irinotecan (25.4%), 5-fluorouracil (22.5), and folinic acid (12.7%) in the encorafenib plus cetuximab group (18.5%), versus irinotecan (16.8%), cetuximab (13.6%), oxaliplatin (10.3%), and vemurafenib (10.3%) in the control group.14 The use of subsequent therapies differed both across treatment groups as well as across the 2 trials. The use of subsequent therapies may impact clinical outcomes for patients in treatment groups differentially.
Table 28: Baseline Characteristics of Trials Included in the Sponsor's ITC
Characteristic | BEACON | NCT00339183 wild-type RAS | ||
|---|---|---|---|---|
Encorafenib plus cetuximab (N = 220) | Control group (N = 221) | Panitumumab plus FOLFIRI (N = 208) | FOLFIRI (N = 213) | |
BRAF-mutated sample, n (% of total trial) | 220 (100) | 221 (100) | 45 (11)a | |
Age (years), median (range) | 61 (30 to 91) | 60 (27 to 91) | 60 (28 to 81) | 60 (33 to85) |
Sex, n (%) | ||||
Male | 114 (51.8) | 94 (42.5) | 136 (65) | 140 (66) |
Female | 106 (48.2) | 127 (57.5) | 72 (35) | 73 (34) |
Number of prior systemic regimens for metastatic disease, n (%) | ||||
1 | 146 (66.4) | 145 (65.6) | 208 (100) | 213 (100) |
2 | 74 (33.6) | 75 (33.9) | 0 | 0 |
> 2 | 0 | 1 (0.5) | 0 | 0 |
ECOG PS at baseline, n (%) | ||||
0 | 112 (50.9) | 108 (48.9) | 196 (94) | 198 (93) |
1 | 104 (47.3) | 113 (51.1) | ||
2 | 4 (1.8) | 0 (0.0) | NR | NR |
Primary disease site, n (%) | ||||
Left colon | 83 (38)b | 68 (31)b | 119 (57) | 148 (69) |
Right colon | 110 (50) | 119 (54) | ||
Rectum | NR | NR | 89 (43) | 63 (31) |
Region, n (%) | ||||
North America | 29 (13.2) | 29 (13.1) | 136 (65) | 139 (65) |
Europe | 144 (65.5) | 125 (56.6) | ||
Rest of World | 47 (21.4) | 67 (30.3) | 72 (35) | 74 (35) |
Race, n (%) | ||||
American Indian or Alaska Native | 1 (0.5) | 0 (0.0) | NR | NR |
Asian | 25 (11.4) | 39 (17.6) | NR | NR |
Japanese | 6 (2.7) | 11 (5.0) | NR | NR |
Korean | 13 (5.9) | 19 (8.6) | NR | NR |
White | 183 (83.2) | 172 (77.8) | 203 (98) | 202 (95) |
Black or African American | 0 (0.0) | 0 (0.0) | NR | NR |
Other | 3 (1.4) | 3 (1.4) | NR | NR |
Not reported due to confidentiality reason | 8 (3.6) | 7 (3.2) | NR | NR |
Liver metastases, n (%) | ||||
Yes | 134 (61) | 128 (58) | 177 (85) | 183 (86) |
ECOG PS = Eastern Cooperative Oncology Group Performance Status; FOLFIRI = folinic acid plus fluorouracil and irinotecan; ITC = indirect treatment comparison; NR = not reported.
aAcross both treatment groups.
bIncluding the rectum.
Source: Sponsor’s ITC.18
Assessment of Outcome Definitions Across Trials
The definitions of OS and PFS were similar across both the BEACON trial and NCT00364013 trial. Definitions of OS and PFS were the same across both trials, except for the use of RECIST v1.1 to document disease progression in the BEACON trial versus RECIST in the NCT00339183 trial (Table 29).
Table 29: Outcome Definitions for Trials Included in the ITC
Study or author name (trial name) | OS | PFS |
|---|---|---|
BEACON | OS was defined as the time from randomization to death due to any cause. | PFS was defined as the time from randomization to the earliest documented date of progression per RECIST v1.1 criteria by BICR and investigator assessment, or death due to any cause. |
Peeters et al. (NCT0039183) | OS was defined as the time from randomization to the date of death. | PFS was defined as the time from randomization to first disease progression per modified RECIST criteria or death, based on independent central radiological assessment. |
ITC = indirect treatment comparison; OS = overall survival; PFS = progression-free survival.
Risk of Bias Assessment
The sponsor conducted a risk-of-bias assessment of the 2 trials included in the ITC (BEACON and NCT00339183). The sponsor reported that both studies were large, well-run, open-label RCTs with more than 400 patients enrolled across treatment groups of relevance to the ITC. The BEACON trial enrolled patients with the presence of the BRAF V600E mutation (n = 441 across treatment groups of relevance), while the NCT00339183 study enrolled patients with mCRC without specification of the BRAF mutation; however, approximately 45 of the 421 patients (10%) enrolled in the NCT00339183 trial were patients with the BRAF mutation. Baseline characteristics were reported to be similar across both trials; however, baseline characteristics of patients with the BRAF mutation in the NCT00339183 trial were not available for comparison to baseline characteristics of the BEACON trial. Therefore, the sponsor assumed the baseline characteristics of the BRAF subpopulation were comparable between the 2 trials.
Results
Results of the sponsor’s ITC are reported in Table 30. Results suggest that both OS and PFS are superior with treatment with encorafenib plus cetuximab compared with FOLFIRI. The sponsor stated the comparisons of encorafenib plus cetuximab and FOLFOX would be expected to yield results similar to those reported in Table 30.
Table 30: Grouped Nodes ITC Results — Encorafenib Plus Cetuximab Versus FOLFIRI
Intervention | ITC HR (95% CI) | |
|---|---|---|
OS | PFS | |
Encorafenib plus cetuximab |
|
|
CI = confidence interval; HR = hazard ratio; FOLFIRI = folinic acid plus fluorouracil and irinotecan; ITC = indirect treatment comparison; OS = overall survival; PFS = progression-free survival.
Note: Analyses were conducted using the Bucher method.
Based on the grouped treatment node ITC conducted by the sponsor, encorafenib plus cetuximab was found to have a statistically significantly |||| hazard for death |||||||||||||||||||||||||||||||||| and progression |||||||||||||||||||||||||||||||||||||| compared with FOLFIRI.
Critical Appraisal of the ITC
The sponsor submitted an ITC comparing encorafenib plus cetuximab with FOLFIRI or FOLFOX. Numerous issues affecting the quality of the ITC should be considered. While the sponsor conducted a systematic literature search to identify relevant literature for the ITC, some available evidence was disqualified, as it was based on published abstracts only, which are not peer reviewed. Peer review provides the opportunity for scientific communities to provide scrutiny of the validity and reliability of the scientific works conducted, ensuring work of the highest quality. However, works published only in abstract form may still contain valuable information, which may have limited the number of assumptions used by the sponsor in their analyses.
Of the 2 trials included in the ITC, the analyses of baseline characteristics revealed important differences, which may impact overall comparisons made between treatments. For example, the baseline characteristics of the NCT00339183 trial included a greater proportion of male and White patients, as well as a greater proportion of patients with liver metastases. Further, patients in the BEACON trial had received 1 or 2 previous lines of therapy, while patients in the NCT00339183 trial received only 1 line of previous therapy. Patients who have received more lines of therapy may face worse prognoses; therefore, comparisons of efficacy between patients may bias results against encorafenib plus cetuximab due to the presence of patients who have failed to respond to more than 1 therapy. In addition, the line of therapy may also impact patients’ clinical outcomes, as patients receiving earlier lines of treatment may face better prognoses compared with patients receiving treatment at later lines. Outcomes for OS and PFS are expected to be impacted by subsequent treatments across the BEACON trial as well as the NCT00339183 trial.
Most importantly, the objective of the BEACON trial was to enroll patients with the BRAF V600E mutation, whereas that was not the objective of the NCT00339183 trial. Among the patients with wild-type RAS, 45 were identified as having the BRAF mutation. The baseline characteristics of these patients were not available for comparison with the BEACON trial; therefore, it is unknown how comparable the demographic and clinical characteristics of patients with the BRAF mutation in the NCT00339183 trial are with patients in the BEACON trial. Further, the small subset of patients with the BRAF mutation in the NCT00339183 trial introduces uncertainty in the comparisons of efficacy between the 2 trials, as patients with the BRAF mutation may face worse prognoses and react to treatments differently compared with patients who do not have the BRAF mutation.
The risk of bias assessment conducted by the sponsor was not reported to be based on any accepted guidelines; the rigour of the assessment is unknown. The sponsor concluded that both the BEACON trial and the NCT00339183 trial were well conducted trials. However, the risk of bias assessment was based on the assumption the baseline characteristics between the trials were comparable, even though the BEACON trial was specific to patients with the BRAF mutation. Due to the clinical differences between patients with the BRAF mutation versus those with wild-type RAS, it is unclear whether this assumption is appropriate.
Many patients in the BEACON trial were mostly in second-line therapy (66%); however, second-line therapies for patients with mCRC in Canada typically consist of either FOLFIRI or FOLFOX. Therefore, the sponsor conducted an ITC to compare the efficacy of encorafenib plus cetuximab with FOLFIRI. A number of assumptions were made by the sponsor to conduct the ITC, including the clinical equivalence of FOLFIRI and irinotecan, cetuximab and panitumumab, FOLFIRI and FOLFOX, and FOLFIRI plus cetuximab or irinotecan plus cetuximab and FOLFIRI plus panitumumab. The sponsor provided some clinical evidence39-42 and reference to a National Institute for Health and Care Excellence health technology assessment report for cetuximab plus panitumumab for mCRC43 to support the assumptions made in their ITC. However, it should be noted that the strength of evidence provided to support the assumptions of the ITC varied and may not suggest true clinical equivalence due to small sample sizes, use of treatments in different lines of therapy, and a lack of consideration of patients with the BRAF mutation. However, it is acknowledged that literature pertaining specifically to mCRC patients with the BRAF mutation is limited. In addition, the clinical experts consulted for this CADTH review confirmed that the assumptions of the ITC made by the sponsor were reasonable. While the assumptions of clinical equivalence were considered plausible by the supportive evidence and the opinions of the clinical experts, the numerous assumptions of the analysis introduce great uncertainty affecting the overall validity of the results.
Overall, the sponsor’s ITC supported treatment with encorafenib plus cetuximab in the second line compared with FOLFIRI for patients with BRAF V600E–mutated mCRC. Based on the assumption that FOLFIRI is broadly similar to FOLFOX, the sponsor concluded that similar conclusions could be drawn to comparisons of encorafenib plus cetuximab to FOLFOX.18 The clinical experts consulted for this CADTH review confirmed the face value of the results of the sponsor’s ITC. Therefore, it is likely that encorafenib plus cetuximab provides patients with greater clinical benefit compared with FOLFIRI. However, based on the numerous issues with validity behind the analysis of the ITC, the magnitude of benefit observed from encorafenib plus cetuximab cannot be confirmed with confidence, and results should be interpreted with caution.
The sponsor’s ITC compared only the clinical efficacy of encorafenib plus cetuximab and FOLFIRI (i.e., OS and PFS). Based on the results from the BEACON trial, the doublet regimen of encorafenib plus cetuximab demonstrated statistically significantly improved clinical efficacy compared with the control group consisting of either cetuximab plus irinotecan or cetuximab plus FOLFIRI. Other important outcomes, such as safety and HRQoL, were not captured in the sponsor’s ITC. Therefore, it is not possible to know how the relative toxicities of each treatment would impact patients’ outcomes and choice of therapy.
Summary
One ITC, submitted by and conducted by the sponsor, was summarized and critically appraised. The results of the ITC indicated that treatment with encorafenib plus cetuximab was superior to FOLFIRI when considering OS and PFS. No comparisons were made for safety and HRQoL, leaving relative toxicity profiles and impact of treatment on patient-reported outcomes uncertain. Numerous assumptions regarding clinical efficacy and the equivalence of treatments were made by the sponsor. Some evidence was provided to support the assumptions made by the sponsor. In addition, opinions from clinical experts confirmed the plausibility of the assumptions made. However, the numerous assumptions made introduced uncertainty into the validity of the overall analyses and indirect effect estimates between encorafenib plus cetuximab and FOLFIRI. Thus, the direction of effect was most likely accurate in favouring treatment with encorafenib plus cetuximab compared with FOLFIRI and FOLFOX; however, due to the many issues reported with the ITC, the magnitude of effect remains uncertain.
Discussion
Summary of Available Evidence
One multi-centre, multinational, randomized, open-label, phase III study met the criteria for the CADTH systematic review. A total of 220 patients were randomized to the doublet group of the BEACON trial, and 221 patients were randomized to the control group, which included treatment with the investigators’ choice of either irinotecan plus cetuximab or FOLFIRI plus cetuximab. Enrolled patients included adults with mCRC whose tumours expressed the BRAF V600E mutation and whose disease had progressed after 1 or 2 prior regimens in the metastatic setting. Treatment was continued until disease progression, unacceptable toxicity, withdrawal of consent, initiation of subsequent anti-cancer therapy, or death. The primary outcomes for this trial were OS and ORR between the triplet group and control group. However, key secondary end points included analysis of ORR, OS, and PFS between the doublet group and control group. HRQoL was included as an exploratory end point of the trial. Baseline characteristics were similar between the doublet group and control group. Patients had a mean age of 59 years, were mostly from Europe (61%), mostly White (81%), had an ECOG PS of 0 (50%) or 1 (49%), and all patients were diagnosed with stage IV disease at study entry. The primary tumour location was in the right colon for 42% of patients, in the left colon for 34% of patients, and 56% of patients had their tumour completely resected. Two-thirds of patients had received 1 prior regimen, with the remaining patients having received 2 prior regimens; only 1 patient had received more than 2 prior regimens and this patient was randomized to the control group.14
In addition to the systematic review, 1 sponsor-submitted ITC was summarized and appraised for this review.
Interpretation of Results
Efficacy
The clinical experts consulted by CADTH for this review and input received from patient groups indicated that prolonged survival and delayed disease progression are important treatment goals for adult patients with mCRC whose tumours expressed the BRAF V600E mutation. The BEACON trial showed statistically significant improvement in OS among patients treated in the doublet group over the control group.14 The results of the BEACON trial were based on an interim analysis; the results of this interim analysis were considered clinically meaningful and supported treatment with the encorafenib and cetuximab regimen over standard chemotherapy-based regimens for patients with BRAF-mutated mCRC. A post-hoc analysis was conducted providing 6 months of additional information; while the post-hoc analysis was not pre-specified and is considered descriptive, efficacy analyses supported the results of the interim analysis. In addition, prolonged survival and delayed disease progression were highlighted as important treatment goals for patients by both the patient input and clinician input provided for this review.
Baseline characteristics were considered to be generalizable to the Canadian setting by clinical experts consulting on this CADTH review. Treatments used in the comparator group were also acknowledged to be standard treatments used in Canadian clinical practice. Two-thirds of patients in the BEACON trial had received only 1 prior therapy; however, 1 of the control-group treatment regimens (cetuximab plus irinotecan) was highlighted as being funded in only the third-line treatment setting in Canada. The clinical experts for this review confirmed that both treatment regimens in the control group of the BEACON trial were used in the second- and third-line setting. However, the clinical experts highlighted that half of patients in the doublet and control groups of the BEACON trial had been previously exposed to treatment with irinotecan. As both treatment regimens in the control group contained irinotecan, it was highlighted that patients randomized to the control group would be re-exposed to irinotecan treatment after having previously progressed on first- or second-line treatment. The clinical experts stated that in Canadian clinical practice, this would be seldomly done.
It was noted that a greater proportion of patients randomized to the control group were not treated compared with the doublet group (12.7% versus 1.8%, respectively).14 FDA approval in the US in June 2018 of encorafenib and binimetinib for the treatment of patients with BRAF-mutated melanoma resulted in off-label use of the treatment for mCRC patients. Correspondingly, a larger proportion of patients in the doublet group discontinued from the BEACON trial due to withdrawal of consent (58.2% versus 68.3%, respectively).14 The greater number of patient withdrawals from the trial and the fewer number of patients who were not treated in the control group are likely to bias efficacy analyses conservatively toward the control group. Regardless, the results of the BEACON trial were able to support the improved treatment efficacy of the doublet regimen over the control group.
Both the patient input and clinician input highlighted quality of life as an important outcome and treatment goal for patients. HRQoL was an exploratory end point in the BEACON trial. The HRQoL analyses in the BEACON trial did not involve assessment using MIDs; therefore, it is not clear whether the differences observed in the HRQoL questionnaires during the trial are clinically meaningful. However, the TTD analyses for the HRQoL questionnaires favoured treatment with encorafenib plus cetuximab over the control group. Results for patient-reported outcomes in the BEACON trial are considered exploratory and should be interpreted with caution, especially as the number of patients eligible for the completion of questionnaires steadily declined and resulted in small sample sizes over time. While TTD analyses seemed promising and suggested maintenance of patient’s quality of life, the open-label design of the trial may introduce bias, as patients were aware of their treatment assignment, potentially favouring outcomes for the intervention group.
The sponsor provided an ITC comparing the efficacy of encorafenib plus cetuximab to FOLFIRI in the second line of treatment for patients with mCRC. The results of the ITC were consistent with results of the BEACON trial, supporting treatment with the doublet over standard chemotherapy regimens for patients with the BRAF mutation. However, the sponsor’s ITC was limited in being able to inform on the clinical benefits of encorafenib plus cetuximab compared with other second-line regimens for patients with the BRAF mutation, mainly due to the lack of available published literature. To conduct their ITC, a number of assumptions regarding clinical equivalence were made. While the clinical assumptions of the ITC were considered reasonable by the clinical experts consulting for this CADTH review, their remains a lack of direct evidence comparing relevant regimens with encorafenib plus cetuximab for patients with the BRAF mutation. In addition, only 1 other trial was identified as being relevant to the sponsor’s ITC; however, this trial included only a subgroup of patients with BRAF mutation status, and the baseline characteristics of the trial sample were assumed to be the same as the characteristics of the subsample of patients with BRAF mutation status. The results of the ITC suggested that encorafenib plus cetuximab may be more efficacious for patients in the second line compared with FOLFIRI. While the analyses of the ITC are limited by the lack of published evidence and numerous assumptions, the results of the ITC were considered to be sufficient in supporting the conclusion of a superior treatment effect from encorafenib plus cetuximab over FOLFORI or FOLFOX, although the magnitude of benefit is not clear.
Harms
Almost all patients in the doublet and control groups of the BEACON trial experienced at least 1 AE (98% and 97%, respectively). The AEs frequently reported were gastrointestinal disorders, skin and subcutaneous disorders, and general disorders and administration-site conditions.14 There were differences in the frequency of some AEs between the doublet and control groups; this is expected, as encorafenib and cetuximab have different mechanisms of action compared with chemotherapies used in the control group. Specifically, the following AEs occurred more frequently in the doublet group: arthralgia, headache, melanocyte nevus, myalgia, and musculoskeletal pain. Conversely, the AEs that occurred at a greater frequency in the control group included dermatitis acneiform, neutrophil count decrease, diarrhea, stomatitis, and neutropenia.14
The patient input identified fatigue and pain as being the most important disease-related symptoms to control. The AEs related to treatment that were difficult to tolerate were varied in the patient input, but included vomiting, nausea, pain, rash, neuropathy, hair loss, and low platelets. AEs of any grade and fatigue and rash were similarly reported across the doublet and control groups. However, vomiting, nausea, diarrhea, stomatitis, neutropenia, and decreased neutrophil count occurred less frequently among patients treated with encorafenib plus cetuximab. The safety profiles for each of the treatments in the regimens of the BEACON trial were found to be consistent with the known effects of BRAF and EGFR inhibitors. More patients in the control group discontinued treatment or required dose interruptions of therapy compared with the doublet group. In addition, there was a longer duration of treatment in the doublet group compared with the control group, suggesting improved tolerability to treatment in the doublet group. Overall, most AEs observed in the BEACON were grade 1 or 2, and the toxicities of encorafenib plus cetuximab were considered manageable.
It should be noted that patients and investigators were aware of the patient’s treatment assignment due to the open-label nature of the BEACON trial. It is not clear whether the open-label design influenced the assessment or reporting of AEs in the trial. However, the clinical experts consulted by CADTH for this review confirmed the toxicities observed in the BEACON trial were expected for chemotherapy treatments, and the toxicities attributable to encorafenib were manageable.
As the sponsor’s ITC did not conduct comparisons of safety or quality of life, it is not possible to draw conclusions on the toxicity profile of encorafenib plus cetuximab compared with FOLFIRI.
Other Considerations
This current submission is for encorafenib, at a recommended dose of 300 mg orally every day in combination with cetuximab, at a recommended dose of 400 mg/m2 followed by 250 mg/m2 via IV infusion every week. Through consultation with clinical experts, it was acknowledged that clinical practice of administration of cetuximab may differ than what is recommended for cetuximab. Administration of cetuximab in Canadian clinical settings may involve a higher dose, at 500 mg/m2, and a less frequent schedule, at every 2 weeks. A pooled analysis comparing the 2 administration schedules for cetuximab among patients with wild-type RAS supported that cetuximab provided at 500 mg/m2 every 2 weeks is noninferior to cetuximab provided at 400mg/m2 followed by 250 mg/m2.17 The less frequent administration schedule for cetuximab may be favourable for patients and clinics, as it reduces burden on clinic resources and patients (i.e., travel time, cost, chair time). The clinical experts for this review also supported the use of cetuximab at a dose of 500 mg/m2 provided every 2 weeks.
Conclusions
Patients with mCRC face poor survival rates, and patients with BRAF mutations face poorer prognoses and rapid disease progression with few available treatment options. There are currently no funded treatment options that target BRAF mutations for patients with mCRC. Based on the results of 1 phase III study (BEACON trial), encorafenib in combination with cetuximab (doublet group), compared with FOLFIRI plus cetuximab or irinotecan plus cetuximab demonstrated statistically significant improvements in OS and PFS in adult patients with mCRC with a BRAF V600E mutation, after prior therapy. ORR was also superior in the doublet group, with only a few patients achieving response in the control group. HRQoL outcomes were noted as important to patients; however, the doublet group's effect on HRQoL was uncertain due to the study's open-label design, lack of control for multiplicity, and lack of analyses based on the estimated MIDs. The CADTH reviewers did not identify direct comparative evidence for encorafenib plus cetuximab with FOLFIRI. One sponsor-submitted ITC comparing encorafenib plus cetuximab with FOLFIRI suggested that encorafenib in combination with cetuximab may be more efficacious for patients in the second line compared with FOLFIRI. However, there is uncertainty around the ITC results due to the numerous assumptions. Safety results also suggested a lower frequency of AEs and a manageable toxicity profile.
References
1.Brenner DR, Weir HK, Demers AA, et al. Projected estimates of cancer in Canada in 2020. CMAJ. 2020;192(9):E199-E205. PubMed
2.Yu IS, Cheung WY. Metastatic Colorectal Cancer in the Era of Personalized Medicine: A More Tailored Approach to Systemic Therapy. Can J Gastroenterol Hepatol. 2018;2018:9450754. PubMed
3.Wang J, Li S, Liu Y, Zhang C, Li H, Lai B. Metastatic patterns and survival outcomes in patients with stage IV colon cancer: A population-based analysis. Cancer Med. 2020;9(1):361-373. PubMed
4.Rawla P, Sunkara T, Barsouk A. Epidemiology of colorectal cancer: incidence, mortality, survival, and risk factors. Prz Gastroenterol. 2019;14(2):89-103. PubMed
5.Barras D. BRAF Mutation in Colorectal Cancer: An Update. Biomark Cancer. 2015;7(Suppl 1):9-12. PubMed
6.NCCN Guidelines. Rectal Cancer. Version 1.2021. Plymouth Meeting (PA): National Comprehensive Cancer Network (NCCN); 2020: https://www.nccn.org/guidelines/category_1. Accessed 2021 Jan 12.
7.Braftovi (encorafenib): 75 mg oral capsules [product monograph]. Kirkland (QC): Pfizer Canada ULC; 2020 Mar 30.
8.Trifluridine-tipiracil (Lonsurf) for metastatic colorectal cancer resubmission. (CADTH pan-Canadian Oncology Drug Review: final clinical guidance report). Ottawa (ON): CADTH; 2019: https://cadth.ca/sites/default/files/pcodr/Reviews2019/10173Trifluridine-TipiracilmCRC_fnCGR_NOREDACT_Post_29Aug2019_final.pdf. Accessed 2021 Apr 14.
9.Cetuximab (Erbitux) for metastatic colorectal cancer. (CADTH pan-Canadian Oncology Drug Review: final clinical guidance report). Ottawa (ON): CADTH; 2014 https://cadth.ca/sites/default/files/pcodr/pcodr-erbitux-mcrc-fn-cgr.pdf. Accessed 2021 Apr 14.
10.Panitumumab (Vectibix) for metastatic colorectal cancer. (CADTH pan-Canadian Oncology Drug Review: final clinical guidance report). Ottawa (ON): CADTH; 2015 https://cadth.ca/sites/default/files/pcodr/pcodr_panitumumab_vectibix_mcrc_fn_cgr.pdf. Accessed 2021 Apr 14.
11.Panitumumab (Vectibix) for left-sided metastatic colorectal cancer. (CADTH pan-Canadian Oncology Drug Review: final clinical guidance report). Ottawa (ON): CADTH; 2018 https://cadth.ca/sites/default/files/pcodr/pcodr_panitumumab_vectibix_ls_mcrc_fn_cgr.pdf. Accessed 2021 Apr 14.
12.Clinical Study Report: ARRAY-818-302. Protocol Version 1.0: The BEACON CRC Study (Binimetinib, Encorafenib, And Cetuximab COmbiNed to Treat BRAF-mutant ColoRectal Cancer): a multicenter, randomized, open-label, 3-arm phase 3 study of encorafenib + cetuximab plus or minus binimetinib vs. irinotecan/cetuximab or infusional 5-fluorouracil (5-FU)/folinic acid (FA)/irinotecan (FOLFIRI)/cetuximab with a safety lead-in of encorafenib + binimetinib + cetuximab in patients with BRAF V600E-mutant metastatic colorectal cancer [internal sponsor's report]. Boulder (CO): Array BioPharma Inc. ; 2016 Apr 26.
13.Pfizer Canada ULC response to February 26, 2021 request for additional information regarding Braftovi review [internal additional sponsor's information]. Kirkland (QC): Pfizer Canada ULC; 2021 Mar 02.
14.Clinical Study Report: ARRAY-818-302. The BEACON CRC Study (Binimetinib, Encorafenib, And Cetuximab COmbiNed to Treat BRAF-mutant ColoRectal Cancer): a multicenter, randomized, open-label, 3-arm phase 3 study of encorafenib + cetuximab plus or minus binimetinib vs. irinotecan/cetuximab or infusional 5-fluorouracil (5-FU)/folinic acid (FA)/irinotecan (FOLFIRI)/cetuximab with a safety lead-in of encorafenib + binimetinib + cetuximab in patients with BRAF V600E-mutant metastatic colorectal cancer [internal sponsor's report]. Boulder (CO): Array BioPharma Inc.; 2019 Sep 12.
15.Clinical Study Report: ARRAY-818-302. Addendum: The BEACON CRC Study (Binimetinib, Encorafenib, And Cetuximab COmbiNed to Treat BRAF-mutant ColoRectal Cancer): a multicenter, randomized, open-label, 3-arm phase 3 study of encorafenib + cetuximab plus or minus binimetinib vs. irinotecan/cetuximab or infusional 5-fluorouracil (5-FU)/folinic acid (FA)/irinotecan (FOLFIRI)/cetuximab with a safety lead-in of encorafenib + binimetinib + cetuximab in patients with BRAF V600E-mutant metastatic colorectal cancer [internal sponsor's report]. Boulder (CO): Array BioPharma Inc.; 2019 Dec 19.
16.Tabernero J, Grothey A, Van Cutsem E, et al. Encorafenib Plus Cetuximab as a New Standard of Care for Previously Treated BRAF V600E-Mutant Metastatic Colorectal Cancer: Updated Survival Results and Subgroup Analyses from the BEACON Study. J Clin Oncol. 2021;39(4):273-284. PubMed
17.Kasper S, Foch C, Messinger D, et al. Noninferiority of cetuximab every-2-weeks versus standard once-weekly administration schedule for the first-line treatment of RAS wild-type metastatic colorectal cancer. Eur J Cancer. 2021;144:291-301. PubMed
18.Indirect treatment comparaison of Encorafenib in combination with cetuximab or panitumumab, for the treatment of patients with metastatic colorectal cancer (mCRC) with a BRAFV600E mutation, after prior therapy, version 1.0 [internal sponsor's report]. In: Drug Reimbursement Review sponsor submission: Braftovi (encorafenib), 75 mg oral capsules. Kirkland (QC): Pfizer Canada ULC; 2020 Dec 15.
19.Canadian Cancer Society. Colorectal cancer: what is colorectal cancer? 2021 https://www.cancer.ca/en/cancer-information/cancer-type/colorectal/colorectal-cancer/?region=on. Accessed 2021 Apr 15.
20.Macrae FA, Bendell J. Clinical presentation, diagnosis, and staging of colorectal cancer. In: Post TW, ed. UpToDate. Waltham (MA): UpToDate; 2020: www.uptodate.com. Accessed 2021 Jan 11.
21.Canadian Cancer Society. Colorectal cancer: survival statistics for colorectal cancer. 2021; https://www.cancer.ca/en/cancer-information/cancer-type/colorectal/prognosis-and-survival/survival-statistics/?region=on#:~:text=In%20Canada%2C%20the%205%2Dyear,5%20years%20after%20their%20diagnosis. Accessed 2021 Apr 15.
22.Roberto M, Marchetti P, Arrivi G, et al. The treatment paradigm of right-sided metastatic colon cancer: harboring BRAF mutation makes the difference. Int J Colorectal Dis. 2020;35(8):1513-1527. PubMed
23.Cremolini C, Loupakis F, Antoniotti C, et al. FOLFOXIRI plus bevacizumab versus FOLFIRI plus bevacizumab as first-line treatment of patients with metastatic colorectal cancer: updated overall survival and molecular subgroup analyses of the open-label, phase 3 TRIBE study. Lancet Oncol. 2015;16(13):1306-1315. PubMed
24.Erbitux (cetuximab): 2 mg/mL, 50 mL and 100 mL vials for intravenous injection [product monograph]. Toronto (ON): Eli Lilly Canada Inc; 2018 Jan 20 https://pdf.hres.ca/dpd_pm/00043071.PDF. Accessed 2021 Apr 14.
25.Drug Reimbursement Review sponsor submission: Braftovi (encorafenib), 75 mg oral capsules [internal sponsor's package]. Kirkland (QC): Pfizer Canada ULC; 2021 Jan 08.
26.Irinotecan hydrochloride (rinotecan hydrochloride trihdrate): 20 mg/mL sertile solution for intravenous administration [product monograph]. Kirkland (QC): Pfizer Canada ULC 2019 Mar 8 https://www.pfizer.ca/sites/default/files/201903/Irinotecan_HCL_USP_PM_E_224931_08Mar2019.pdf. Accessed 2021 Apr 14.
27.Leucovorin calcium (folic acid derivative): 10 mg/mL sterile solution for intravenous administration [product monograph]. Kirkland (QC): Pfizer Canada Inc; 2018 Jun 21: https://www.pfizer.ca/sites/default/files/201807/2018.06.21_Leucovorin_PM_E_215416.pdf. Accessed 2021 Apr 14.
28.Fluorouracil: 50 mg/mL for intravenous administration [product monograph]. Kirkland (QC): Pfizer Canada ULC; 2019 Aug 07: https://www.pfizer.ca/sites/default/files/201908/FLUOROURACIL_PM_E_227813_07Aug2019.pdf. Accessed 2021 Apr 14.
29.Chu JE, Johnson B, Kugathasan L, et al. Population-based Screening for BRAF (V600E) in Metastatic Colorectal Cancer Reveals Increased Prevalence and Poor Prognosis. Clin Cancer Res. 2020;26(17):4599-4605. PubMed
30.Kopetz S, Grothey A, Van Cutsem E, et al. Encorafenib plus cetuximab with or without binimetinib for BRAF V600E-mutant metastatic colorectal cancer: Quality-of-life results from a randomized, three-arm, phase III study versus the choice of either irinotecan or FOLFIRI plus cetuximab (BEACON CRC). J Clin Oncol. 2020;38(4_suppl):8-8.
31.Pfizer Canada ULC response to February 12, 2021 request for additional information regarding Braftovi review [internal additional sponsor's information]. Kirkland (QC): Pfizer Canada ULC; 2021 Feb 22.
32.McGowan J, Sampson M, Salzwedel DM, Cogo E, Foerster V, Lefebvre C. PRESS Peer Review of Electronic Search Strategies: 2015 guideline statement. J Clin Epidemiol. 2016;75:40-46. PubMed
33.Kopetz S, Grothey A, Van Cutsem E, et al. BEACON CRC: a randomized, 3-Arm, phase 3 study of encorafenib and cetuximab with or without binimetinib vs. choice of either irinotecan or FOLFIRI plus cetuximab in BRAF V600E–mutant metastatic colorectal cancer. Ann Oncol. 2019;30(suppl 4):iv154.
34.Kopetz S, Grothey A, Yaeger R, et al. Encorafenib, Binimetinib, and Cetuximab in BRAF V600E-Mutated Colorectal Cancer. N Engl J Med. 2019;381(17):1632-1643. PubMed
35.Clinical Study Report: ARRAY-818-302. Statistical Analysis Plan Version 6.0: The BEACON CRC Study (Binimetinib, Encorafenib, And Cetuximab COmbiNed to Treat BRAF-mutant ColoRectal Cancer): a multicenter, randomized, open-label, 3-arm phase 3 study of encorafenib + cetuximab plus or minus binimetinib vs. irinotecan/cetuximab or infusional 5-fluorouracil (5-FU)/folinic acid (FA)/irinotecan (FOLFIRI)/cetuximab with a safety lead-in of encorafenib + binimetinib + cetuximab in patients with BRAF V600E-mutant metastatic colorectal cancer [internal sponsor's report]. Boulder (CO): Array BioPharma Inc.; 2019 Apr 23: URL.
36.Soulières D, Aguilar JL, Chen E, et al. Cetuximab plus platinum-based chemotherapy in head and neck squamous cell carcinoma: a randomized, double-blind safety study comparing cetuximab produced from two manufacturing processes using the EXTREME study regimen. BMC Cancer. 2016;16:19. PubMed
37.Peeters M, Price TJ, Cervantes A, et al. Final results from a randomized phase 3 study of FOLFIRI {+/−} panitumumab for second-line treatment of metastatic colorectal cancer. Ann Oncol. 2014;25(1):107-116. PubMed
38.Peeters M, Oliner KS, Price TJ, et al. Analysis of KRAS/NRAS Mutations in a Phase III Study of Panitumumab with FOLFIRI Compared with FOLFIRI Alone as Second-line Treatment for Metastatic Colorectal Cancer. Clin Cancer Res. 2015;21(24):5469-5479. PubMed
39.Tournigand C, André T, Achille E, et al. FOLFIRI followed by FOLFOX6 or the reverse sequence in advanced colorectal cancer: a randomized GERCOR study. J Clin Oncol. 2004;22(2):229-237. PubMed
40.Colucci G, Gebbia V, Paoletti G, et al. Phase III randomized trial of FOLFIRI versus FOLFOX4 in the treatment of advanced colorectal cancer: a multicenter study of the Gruppo Oncologico Dell'Italia Meridionale. J Clin Oncol. 2005;23(22):4866-4875. PubMed
41.Graeven U, Arnold D, Reinacher-Schick A, et al. A randomised phase II study of irinotecan in combination with 5-FU/FA compared with irinotecan alone as second-line treatment of patients with metastatic colorectal carcinoma. Onkologie. 2007;30(4):169-174. PubMed
42.Price TJ, Peeters M, Kim TW, et al. Panitumumab versus cetuximab in patients with chemotherapy-refractory wild-type KRAS exon 2 metastatic colorectal cancer (ASPECCT): a randomised, multicentre, open-label, non-inferiority phase 3 study. Lancet Oncol. 2014;15(6):569-579. PubMed
43.National Institute for Health and Care Excellence. Cetuximab and panitumumab for previously untreated metastatic colorectal cancer. (Technology appraisal guidance TA439) 2017; https://www.nice.org.uk/guidance/ta439. Accessed 2021 Apr 14.
44.Giesinger JM, Kieffer JM, Fayers PM, et al. Replication and validation of higher order models demonstrated that a summary score for the EORTC QLQ-C30 is robust. J Clin Epidemiol. 2016;69:79-88. PubMed
45.Eortc Quality of Life. FAQs. https://qol.eortc.org/faq/. Accessed 2021 Apr 14.
46.Aaronson NK, Ahmedzai S, Bergman B, et al. The European Organization for Research and Treatment of Cancer QLQ-C30: a quality-of-life instrument for use in international clinical trials in oncology. J Natl Cancer Inst. 1993;85(5):365-376. PubMed
47.EORTC QLC-C30 scoring manual. Brussels (BE): European Organisation for Research and Treatment of Cancer (EORTC); 2001: https://www.eortc.org/app/uploads/sites/2/2018/02/SCmanual.pdf. Accessed 2021 Apr 16.
48.Davda J, Kibet H, Achieng E, Atundo L, Komen T. Assessing the acceptability, reliability, and validity of the EORTC Quality of Life Questionnaire (QLQ-C30) in Kenyan cancer patients: a cross-sectional study. J Patient Rep Outcomes. 2021;5(1):4. PubMed
49.Luo N, Fones CS, Lim SE, Xie F, Thumboo J, Li SC. The European Organization for Research and Treatment of Cancer Quality of Life Questionnaire (EORTC QLQ-c30): validation of English version in Singapore. Qual Life Res. 2005;14(4):1181-1186. PubMed
50.Osoba D, Rodrigues G, Myles J, Zee B, Pater J. Interpreting the significance of changes in health-related quality-of-life scores. J Clin Oncol. 1998;16(1):139-144. PubMed
51.Snyder CF, Blackford AL, Sussman J, et al. Identifying changes in scores on the EORTC-QLQ-C30 representing a change in patients' supportive care needs. Qual Life Res. 2015;24(5):1207-1216. PubMed
52.Bedard G, Zeng L, Zhang L, et al. Minimal important differences in the EORTC QLQ-C30 in patients with advanced cancer. Asia Pac J Clin Oncol. 2014;10(2):109-117. PubMed
53.Wong CK, Chen J, Yu CL, Sham M, Lam CL. Systematic review recommends the European Organization for Research and Treatment of Cancer colorectal cancer-specific module for measuring quality of life in colorectal cancer patients. J Clin Epidemiol. 2015;68(3):266-278. PubMed
54.Musoro JZ, Sodergren SC, Coens C, et al. Minimally important differences for interpreting the EORTC QLQ-C30 in patients with advanced colorectal cancer treated with chemotherapy. Colorectal Dis. 2020;07:07.
55.Brooks R. EuroQol: the current state of play. Health Policy. 1996;37(1):53-72. PubMed
56.EuroQol Group. EuroQol--a new facility for the measurement of health-related quality of life. Health Policy. 1990;16(3):199-208. PubMed
57.Ameri H, Yousefi M, Yaseri M, Nahvijou A, Arab M, Akbari Sari A. Mapping the cancer-specific QLQ-C30 onto the generic EQ-5D-5L and SF-6D in colorectal cancer patients. Expert Rev Pharmacoecon Outcomes Res. 2019;19(1):89-96. PubMed
58.Sinnott PL, Joyce VR, Barnett PG. Guidebook: preference measurement in economic analysis. Menlo Park (CA): Health Economics Research Center; 2007: https://www.herc.research.va.gov/files/BOOK_419.pdf. Accessed 2020 Oct 13.
59.McClure NS, Sayah FA, Xie F, Luo N, Johnson JA. Instrument-Defined Estimates of the Minimally Important Difference for EQ-5D-5L Index Scores. Value Health. 2017;20(4):644-650. PubMed
60.Ward WL, Hahn EA, Mo F, Hernandez L, Tulsky DS, Cella D. Reliability and validity of the Functional Assessment of Cancer Therapy-Colorectal (FACT-C) quality of life instrument. Qual Life Res. 1999;8(3):181-195. PubMed
61.Yoo HJ, Kim JC, Eremenco S, Han OS. Quality of life in colorectal cancer patients with colectomy and the validation of the Functional Assessment of Cancer Therapy-Colorectal (FACT-C), Version 4. J Pain Symptom Manage. 2005;30(1):24-32. PubMed
62.Yost KJ, Cella D, Chawla A, et al. Minimally important differences were estimated for the Functional Assessment of Cancer Therapy-Colorectal (FACT-C) instrument using a combination of distribution- and anchor-based approaches. J Clin Epidemiol. 2005;58(12):1241-1251. PubMed
63.ePROVIDE. Patient Global Impressions scale - Change, Improvement, Severity (PGI-C, PGI-I, PGI-S). National Institute of Mental Health (NIMH). 2021; https://eprovide.mapi-trust.org/instruments/patient-global-impressions-scale-change-improvement-severity. Accessed 2021 Apr 14.
64.Kamper SJ, Maher CG, Mackay G. Global rating of change scales: a review of strengths and weaknesses and considerations for design. J Man Manip Ther. 2009;17(3):163-170. PubMed
65.Mercadante S, Adile C, Lanzetta G, et al. Personalized Symptom Goals and Patient Global Impression on Clinical Changes in Advanced Cancer Patients. Oncologist. 2019;24(2):239-246. PubMed
66.Ritterhouse LL, Barletta JA. BRAF V600E mutation-specific antibody: A review. Semin Diagn Pathol. 2015;32(5):400-408. PubMed
67.Roma C, Rachiglio AM, Pasquale R, et al. BRAF V600E mutation in metastatic colorectal cancer: Methods of detection and correlation with clinical and pathologic features. Cancer Biol Ther. 2016;17(8):840-848. PubMed
68.Pyo JS, Sohn JH, Kang G. Diagnostic Accuracy of BRAF Immunohistochemistry in Colorectal Cancer: a Meta-Analysis and Diagnostic Test Accuracy Review. Pathol Oncol Res. 2016;22(4):831-837. PubMed
69.Li W, Qiu T, Guo L, Ying J. Major challenges related to tumor biological characteristics in accurate mutation detection of colorectal cancer by next-generation sequencing. Cancer Lett. 2017;410:92-99. PubMed
70.Gilson P, Franczak C, Dubouis L, et al. Evaluation of KRAS, NRAS and BRAF hotspot mutations detection for patients with metastatic colorectal cancer using direct DNA pipetting in a fully-automated platform and Next-Generation Sequencing for laboratory workflow optimisation. PLoS One. 2019;14(7):e0219204. PubMed
71.Loree JM, Kopetz S, Raghav KP. Current companion diagnostics in advanced colorectal cancer; getting a bigger and better piece of the pie. J Gastrointest Oncol. 2017;8(1):199-212. PubMed
72.Loes IM, Immervoll H, Angelsen JH, et al. Performance comparison of three BRAF V600E detection methods in malignant melanoma and colorectal cancer specimens. Tumour Biol. 2015;36(2):1003-1013. PubMed
73.Gonzalez-Colunga KJ, Lino-Silva LS, Salcedo-Hernandez RA, Ruiz-Garcia EB, Zepeda-Najar C. BRAF V600E Expression by Immunohistochemistry in Colon Cancer and Clinico-pathologic Features Associated with BRAF-Mutated Colonic Cancers in Mexican Patients. J Gastrointest Cancer. 2020;51(1):35-40. PubMed
Appendix 1: Literature Search Strategy
Note that this appendix has been formatted but not copy-edited.
Clinical Literature Search
Overview
Interface: Ovid
Databases:
MEDLINE All (1946–present)
Embase (1974–present)
Note: Subject headings and search fields have been customized for each database. Duplicates between databases were removed in Ovid.
Date of Search: January 20, 2021
Alerts: Biweekly search updates until project completion
Study types: No filters were applied to limit retrieval by study type
Limits:
Publication date limit: none
Language limit: none
Conference abstracts: excluded
Syntax | Description |
|---|---|
/ | At the end of a phrase, searches the phrase as a subject heading |
MeSH | Medical Subject Heading |
* | Before a word, indicates that the marked subject heading is a primary topic; or, after a word, a truncation symbol (wildcard) to retrieve plurals or varying endings |
.ti | Title |
.ot | Original title |
.ab | Abstract |
.hw | Heading word; usually includes subject headings and controlled vocabulary |
.kf | Author keyword heading word (MEDLINE) |
.kw | Author keyword (Embase); keyword (CDSR) |
.dq | Candidate term word (Embase) |
.pt | Publication type |
.rn | Registry number |
.nm | Name of substance word (MEDLINE) |
freq = # | Requires terms to occur # number of times in the specified fields |
medall | Ovid database code: MEDLINE All, 1946 to present, updated daily |
oemezd | Ovid database code; Embase, 1974 to present, updated daily |
Multi-Database Strategy
Search Strategy:
(encorafenib* or braftovi* or LGX818 or LGX 818 or NVP LGX 818* or NVPLGX 818* or NVP LGX818* or NVPLGX818* or 8L7891MRB6).ti,ab,kf,ot,hw,rn,nm.
1 use medall
*encorafenib/
(encorafenib* or braftovi* or LGX818 or LGX 818 or NVP LGX 818* or NVPLGX 818* or NVP LGX818* or NVPLGX818*).ti,ab,kw,dq.
or/3 to 4
5 use oemezd
6 not conference abstract.pt.
2 or 7
remove duplicates from 8
Clinical Trials Registries
ClinicalTrials.gov
Produced by the US National Library of Medicine. Targeted search used to capture registered clinical trials.
Search terms – Braftovi/encorafenib
Health Canada’s Clinical Trials Database
Produced by Health Canada. Targeted search used to capture registered clinical trials.
Search terms – Braftovi/encorafenib
EU Clinical Trials
Register European Union Clinical Trials Register, produced by the European Union. Targeted search used to capture registered clinical trials.
Search terms – Braftovi/encorafenib
Grey Literature
Search dates: January 11, 2021 – January 20, 2021
Keywords: Braftovi/encorafenib and colorectal cancer
Limits: No limits
Updated: Search updated before meeting of the CADTH pan-Canadian Oncology Drug Review Expert Committee (pERC)
Relevant websites from the following sections of the CADTH grey literature checklist Grey Matters: A Practical Tool For Searching Health-Related Grey Literature (https://www.cadth.ca/grey-matters) were searched:
Health Technology Assessment Agencies
Health Economics
Clinical Practice Guidelines
Drug and Device Regulatory Approvals
Advisories and Warnings
Drug Class Reviews
Clinical Trials Registries
Databases (free)
Internet Search
Appendix 2: Excluded Studies
Note that this appendix has been formatted but not copy-edited.
Reference | Reason for exclusion |
|---|---|
Shahjehan F, Kamatham S, Chandrasekharan C, Kasi PM. Binimetinib, encorafenib and cetuximab (BEACON Trial) combination therapy for patients with BRAF V600E-mutant metastatic colorectal cancer. Drugs Today (Barc). 2019;55(11):683-693. | Review article |
Van Cutsem E, Huijberts S, Grothey A, et al. Binimetinib, Encorafenib, and Cetuximab Triplet Therapy for Patients With BRAF V600E-Mutant Metastatic Colorectal Cancer: Safety Lead-In Results From the phase III BEACON Colorectal Cancer Study. J Clin Oncol. 2019;37(17):1460-1469. Van Cutsem E, Cuyle P, Huijberts S, et al. BEACON CRC study safety lead-in: Assessment of the BRAF inhibitor encorafenib + MEK inhibitor binimetinib + anti-epidermal growth factor receptor antibody cetuximab for BRAFV600E metastatic colorectal cancer. Ann Oncol. 2018;29(Supplement 5):v109. | Intervention |
Appendix 3: Detailed Outcome Data
Figure 13: Subgroup Analysis for OS, Doublet Group Versus Control Group (Data Cut-Off: February 11, 2019)
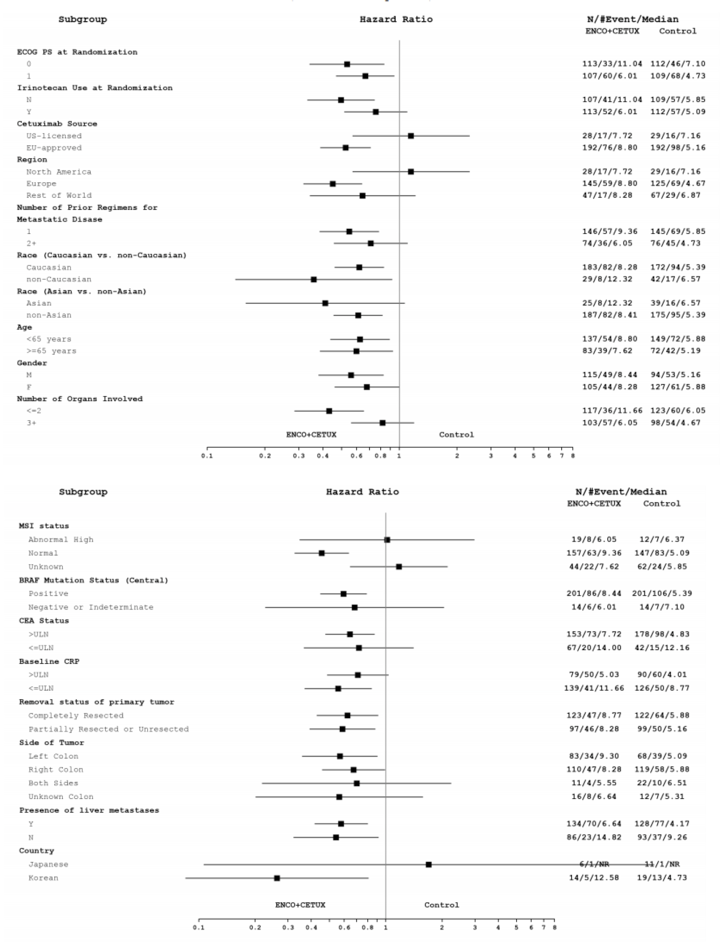
CEA = carcinoembryonic antigen; CETUX = cetuximab; Cl = confidence interval; CRP = C-reactive protein; ECOG PS = Eastern Cooperative Oncology Group Performance Status; ENCO = encorafenib; EU = European Union; F = female; HR = hazard ratio; M = male; MSI = microsatellite instability; N = no; NR = not reached; OS = overall survival; ULN = upper limit of normal; vs. = versus ; Y = yes.
Note: Statistical model used: Cox model.
Note that this appendix has been formatted but not copy-edited.
Source: BEACON Clinical Study Report.
Figure 14: Subgroup Analysis for OS, Doublet Group Versus Control Group (Data Cut-Off: August 15, 2019)
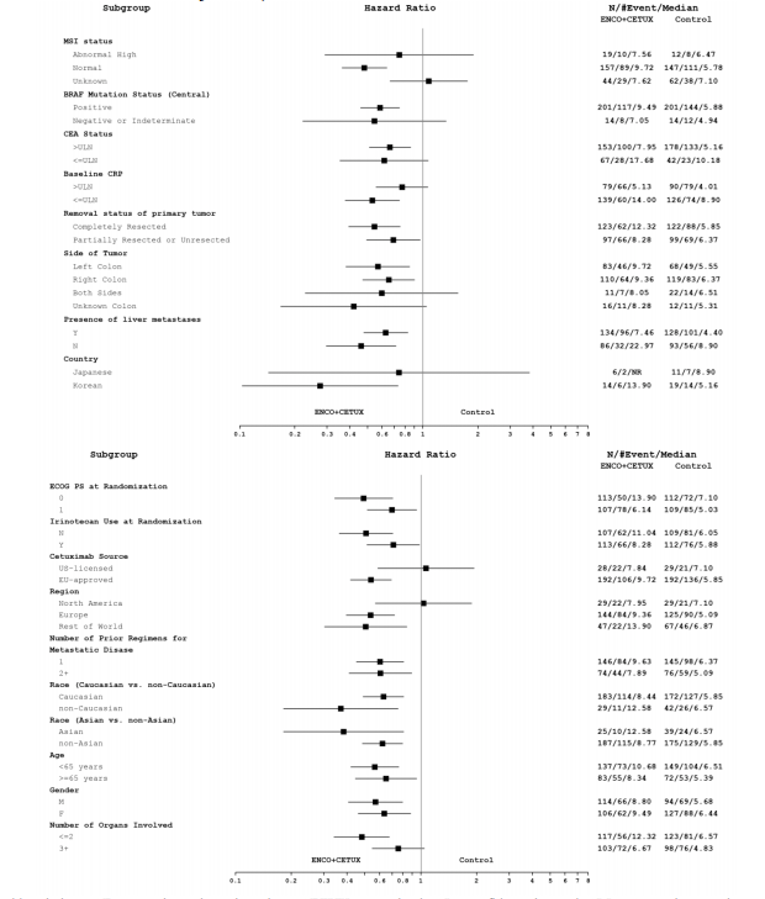
CEA = carcinoembryonic antigen; CETUX = cetuximab; Cl = confidence interval; CRP = C-reactive protein; ECOG PS = Eastern Cooperative Oncology Group Performance Status; ENCO = encorafenib; EU = European Union; F = female; HR = hazard ratio; M = male; MSI = microsatellite instability; N = no; NR = not reached; OS = overall survival; ULN = upper limit of normal; vs. = versus ; Y = yes.
Note: The HR is obtained from an unstratified Cox model. The error bars represent 95% Cl.
Source: BEACON Clinical Study Report Addendum.15
Table 32: Subgroup Analyses for Objective Response Rate in the BEACON Trial
Subgroup analyses | Interim analysisa (data cut-off: February 11, 2019) | Post-hoc analysisb (data cut-off: August 15, 2019) | ||
|---|---|---|---|---|
Doublet group (N = 113) | Control group (N = 107) | Doublet group (N = 220) | Control group (N = 221) | |
ECOG PS at randomization | ||||
ECOG PS at randomization = 0 | ||||
N (%) | 54 (47.8) | 50 (46.7) | 113 (51.4) | 112 (50.7) |
Confirmed objective response rate (ORR: CR + PR), n (%) | 13 (24.1) | 0 (0.0) | 27 (23.9) | 0 (0.0) |
95% CIc | (13.5 to 37.6) | (0.0 to 7.1) | (16.4 to 32.8) | (0.0 to 3.2) |
ECOG PS at randomization = 1 | ||||
N (%) | 59 (52.2) | 57 (53.3) | 107 (48.6) | 109 (49.3) |
Confirmed objective response rate (ORR: CR + PR), n (%) | 10 (16.9) | 2 (3.5) | 16 (15.0) | 4 (3.7) |
95% CIc | (8.4 to 29.0) | (0.4 to 12.1) | (8.8 to 23.1) | (1.0 to 9.1) |
Irinotecan use at randomization | ||||
Irinotecan use at randomization | ||||
N (%) | 57 (50.4) | 55 (51.4) | 113 (51.4) | 112 (50.7) |
Confirmed objective response rate (ORR: CR + PR), n (%) | 57 (50.4) | 1 (1.8) | 16 (14.2) | 1 (0.9) |
95% CIc | (8.7 to 29.9) | (0.0 to 9.7) | (8.3 to 22.0) | (0.0 to 4.9) |
No irinotecan use at randomization | ||||
N (%) | 56 (49.6) | 52 (48.6) | 107 (48.6) | 109 (49.3) |
Confirmed objective response rate (ORR: CR + PR), n (%) | 13 (23.2) | 1 (1.9) | 27 (25.2) | 3 (2.8) |
95% CIc | (13.0 to 36.4) | (0.0 to 10.3) | (17.3 to 34.6) | (0.6 to 7.8) |
Cetuximab source | ||||
US-licensed cetuximab source | ||||
N (%) | 23 (20.4) | 19 (17.8) | 28 (12.7) | 29 (13.1) |
Confirmed objective response rate (ORR: CR + PR), n (%) | 2 (8.7) | 0 (0.0) | 2 (7.1) | 0 (0.0) |
95% CIc | (1.1 to 28.0) | (0.0 to 17.6) | (0.9 to 23.5) | (0.0 to 11.9) |
EU-approved cetuximab source | ||||
N (%) | 90 (79.6) | 88 (82.2) | 192 (87.3) | 192 (86.9) |
Confirmed objective response rate (ORR: CR + PR), n (%) | 21 (23.3) | 2 (2.3) | 41 (21.4) | 4 (2.1) |
95% CIc | (15.1 to 33.4) | (0.3 to 8.0) | (15.8 to 27.8) | (0.6 to 5.2) |
Region | ||||
North America | ||||
N (%) | 23 (20.4) | 19 (17.8) | 29 (13.2) | 29 (13.1) |
Confirmed objective response rate (ORR: CR + PR), n (%) | 2 (8.7) | 0 (0.0) | 2 (6.9) | 0 (0.0) |
95% CIc | (1.1 to 28.0) | (0.0 to 17.6) | (0.8 to 22.8) | (0.0 to 11.9) |
Europe | ||||
N (%) | 70 (61.9) | 57 (53.3) | 144 (65.5) | 125 (56.6) |
Confirmed objective response rate (ORR: CR + PR), n (%) | 16 (22.9) | 0 (0.0) | 31 (21.5) | 0 (0.0) |
95% CIc | (13.7 to 34.4) | (0.0 to 6.3) | (15.1 to 29.1) | (0.0 to 2.9) |
Rest of world | ||||
N (%) | 20 (17.7) | 31 (29.0) | 47 (21.4) | 67 (30.3) |
Confirmed objective response rate (ORR: CR + PR), n (%) | 5 (25.0) | 2 (6.5) | 10 (21.3) | 4 (6.0) |
95% CIc | 5 (25.0) | (0.8 to 21.4) | (10.7 to 35.7) | (1.7 to 14.6) |
Number of prior regimens for metastatic disease | ||||
1 | ||||
N (%) | 76 (67.3) | 63 (58.9) | 146 (66.4) | 145 (65.6) |
Confirmed objective response rate (ORR: CR + PR), n (%) | 17 (22.4) | 1 (1.6) | 29 (19.9) | 3 (2.1) |
95% CIc | (13.6 to 33.4) | (0.0 to 8.5) | (13.7 to 27.3) | (0.4 to 5.9) |
≥ 2 | ||||
N (%) | 37 (32.7) | 44 (41.1) | 74 (33.6) | 76 (34.4) |
Confirmed objective response rate (ORR: CR + PR), n (%) | 6 (16.2) | 1 (2.3) | 14 (18.9) | 1 (1.3) |
95% CIc | (6.2 to 32.0) | (0.1 to 12.0) | (10.7 to 29.7) | (0.0 to 7.1) |
Race Asian vs. non-Asian | ||||
Asian | ||||
N (%) | 10 (8.8) | 17 (15.9) | 25 (11.4) | 39 (17.6) |
Confirmed objective response rate (ORR: CR + PR), n (%) | 3 (30.0) | 17 (15.9) | 5 (20.0) | 2 (5.1) |
95% CIc | (6.7 to 65.2) | (0.0 to 36.3) | (6.8 to 40.7) | (0.6 to 17.3) |
Non-Asian | ||||
N (%) | 103 (91.2) | 89 (83.2) | 187 (85.0) | 175 (79.2) |
Confirmed objective response rate (ORR: CR + PR), n (%) | 20 (19.4) | 1 (1.1) | 37 (19.8) | 2 (1.1) |
95% CIc | (12.3 to 28.4) | (0.0 to 6.1) | (14.3 to 26.2) | (0.1 to 4.1) |
Race: White vs. non-White | ||||
White | ||||
N (%) | 102 (90.3) | 88 (82.2) | 183 (83.2) | 172 (77.8) |
Confirmed objective response rate (ORR: CR + PR), n (%) | 20 (19.6) | 1 (1.1) | 37 (20.2) | 2 (1.2) |
95% CIc | (12.4 to 28.6) | (0.0 to 6.2) | (14.7 to 26.8) | (0.1 to 4.1) |
Non-White | ||||
N (%) | 11 (9.7) | 18 (16.8) | 29 (13.2) | 42 (19.0) |
Confirmed objective response rate (ORR: CR + PR), n (%) | 3 (27.3) | 1 (5.6) | 5 (17.2) | 2 (4.8) |
95% CIc | (6.0 to 61.0) | (0.1 to 27.3) | (5.8 to 35.8) | (0.6 to 16.2) |
Age | ||||
< 65 years | ||||
N (%) | 68 (60.2) | 73 (68.2) | 137 (62.3) | 149 (67.4) |
Confirmed objective response rate (ORR: CR + PR), n (%) | 18 (26.5) | 2 (2.7) | 26 (19.0) | 3 (2.0) |
95% CIc | (16.5 to 38.6) | (0.3 to 9.5) | (12.8 to 26.6) | (0.4 to 5.8) |
≥ 65 years | ||||
N (%) | 45 (39.8) | 34 (31.8) | 83 (37.7) | 72 (32.6) |
Confirmed objective response rate (ORR: CR + PR), n (%) | 5 (11.1) | 0 (0.0) | 17 (20.5) | 1 (1.4) |
95% CIc | (3.7 to 24.1) | (0.0 to 10.3) | (12.4 to 30.8) | (0.0 to 7.5) |
Sex | ||||
Male | ||||
N (%) | 62 (54.9) | 50 (46.7) | 114 (51.8) | 94 (42.5) |
Confirmed objective response rate (ORR: CR + PR), n (%) | 14 (22.6) | 1 (2.0) | 23 (20.2) | 2 (2.1) |
95% CIc | (12.9 to 35.0) | (0.1 to 10.6) | (13.2 to 28.7) | (0.3 to 7.5) |
Female | ||||
N (%) | 51 (45.1) | 57 (53.3) | 106 (48.2) | 127 (57.5) |
Confirmed objective response rate (ORR: CR + PR), n (%) | 9 (17.6) | 1 (1.8) | 20 (18.9) | 2 (1.6) |
95% CIc | (8.4 to 30.9) | (0.0 to 12.3) | (11.9 to 27.6) | (0.2 to 5.6) |
Number of organs involved | ||||
≤ 2 | ||||
N (%) | 58 (51.3) | 60 (56.1) | 117 (53.2) | 123 (55.7) |
Confirmed objective response rate (ORR: CR + PR), n (%) | 17 (29.3) | 1 (1.7) | 28 (23.9) | 3 (2.4) |
95% CIc | (18.1 to 42.7) | (0.0 to 8.9) | (16.5 to 32.7) | (0.5 to 7.0) |
> 2 | ||||
N (%) | 55 (48.7) | 47 (43.9) | 103 (46.8) | 98 (44.3) |
Confirmed objective response rate (ORR: CR + PR), n (%) | 6 (10.9) | 1 (2.1) | 15 (14.6) | 1 (1.0) |
95% CIc | (4.1 to 22.2) | (0.0 to 14.8) | (8.4 to 22.9) | (0.0 to 5.6) |
MSI status | ||||
Abnormal high MSI status | ||||
N (%) | 8 (7.1) | 7 (6.5) | 19 (8.6) | 12 (5.4) |
Confirmed objective response rate (ORR: CR + PR), n (%) | 1 (12.5) | 0 (0.0) | 4 (21.1) | 0 (0.0) |
95% CIc | (0.3 to 52.7) | (0.0 to 53.1) | (6.1 to 45.6) | (0.0 to 26.5) |
Normal MSI status | ||||
N (%) | 79 (69.9) | 68 (63.6) | 157 (71.4) | 147 (66.5) |
Confirmed objective response rate (ORR: CR + PR), n (%) | 18 (22.8) | 2 (2.9) | 34 (21.7) | 4 (2.7) |
95% CIc | (14.1 to 33.6) | (0.2 to 12.9) | (15.5 to 28.9) | (0.7 to 6.8) |
Unknown MSI status | ||||
N (%) | 26 (23.0) | 32 (29.9) | 44 (20.0) | 62 (28.1) |
Confirmed objective response rate (ORR: CR + PR), n (%) | 4 (15.4) | 0 (0.0) | 5 (11.4) | 0 (0.0) |
95% CIc | (4.4 to 34.9) | (0.0 to 10.9) | (3.8 to 24.6) | (0.0 to 5.8) |
BRAF mutation status | ||||
Positive | ||||
N (%) | 104 (92.0) | 99 (92.5) | 201 (91.4) | 201 (91.0) |
Confirmed objective response rate (ORR: CR + PR), n (%) | 21 (20.2) | 1 (1.0) | 40 (19.9) | 3 (1.5) |
95% CIc | (13.0 to 29.2) | (0.0 to 5.5) | (14.6 to 26.1) | (0.3 to 4.3) |
Negative or indeterminate | ||||
N (%) | 8 (7.1) | 5 (4.7) | 14 (6.4) | 14 (6.3) |
Confirmed objective response rate (ORR: CR + PR), n (%) | 1 (12.5) | 1 (20.0) | 1 (7.1) | 1 (7.1) |
95% CIc | (0.3 to 52.7) | (0.5 to 71.6) | (0.2 to 33.9) | (0.2 to 33.9) |
CEA status | ||||
> ULN | ||||
N (%) | 79 (69.9) | 87 (81.3) | 153 (69.5) | 178 (80.5) |
Confirmed objective response rate (ORR: CR + PR), n (%) | 14 (17.7) | 2 (2.3) | 30 (19.6) | 2 (1.1) |
95% CIc | (10.0 to 27.9) | (0.3 to 8.1) | (13.6 to 26.8) | (0.1 to 4.0) |
≤ ULN | ||||
N (%) | 34 (30.1) | 20 (18.7) | 67 (30.5) | 42 (19.0) |
Confirmed objective response rate (ORR: CR + PR), n (%) | 9 (26.5) | 0 (0.0) | 13 (19.4) | 2 (4.8) |
95% CIc | (12.9 to 44.4) | (0.0 to 16.8) | (10.8 to 30.9) | (0.6 to 16.2) |
CRP status | ||||
> ULN | ||||
N (%) | 46 (40.7) | 47 (43.9) | 79 (35.9) | 90 (40.7) |
Confirmed objective response rate (ORR: CR + PR), n (%) | 5 (10.9) | 1 (2.1) | 6 (7.6) | 3 (3.3) |
95% CIc | (3.6 to 23.6) | (0.1 to 11.3) | (2.8 to 15.8) | (0.7 to 9.4) |
≤ ULN | ||||
N (%) | 65 (57.5) | 57 (53.3) | 139 (63.2) | 126 (57.0) |
Confirmed objective response rate (ORR: CR + PR), n (%) | 18 (27.7) | 1 (1.8) | 37 (26.6) | 1 (0.8) |
95% CIc | (17.3 to 40.2) | (0.0 to 9.4) | (19.5 to 34.8) | (0.0 to 4.3) |
Tumour removed status | ||||
Completely resected | ||||
N (%) | 59 (52.2) | 62 (57.9) | 123 (55.9) | 122 (55.2) |
Confirmed objective response rate (ORR: CR + PR), n (%) | 14 (23.7) | 62 (57.9) | 30 (24.4) | 3 (2.5) |
95% CIc | (13.6 to 36.6) | (0.0 to 8.7) | (17.1 to 33.0) | (0.5 to 7.0) |
Partially resected or unresected | ||||
N (%) | 54 (47.8) | 45 (42.1) | 97 (44.1) | 99 (44.8) |
Confirmed objective response rate (ORR: CR + PR), n (%) | 9 (16.7) | 1 (2.2) | 13 (13.4) | 1 (1.0) |
95% CIc | (7.9 to 29.3) | (0.1 to 11.8) | (7.3 to 21.8) | (0.0 to 5.5) |
Side of tumour | ||||
Left colon | ||||
N (%) | 46 (40.7) | 40 (37.4) | 83 (37.7) | 68 (30.8) |
Confirmed objective response rate (ORR: CR + PR), n (%) | 11 (23.9) | 2 (5.0) | 15 (18.1) | 3 (4.4) |
95% CIc | (12.6 to 38.8) | (0.6 to 16.9) | (10.5 to 28.0) | (0.9 to 12.4) |
Right colon | ||||
N (%) | 54 (47.8) | 56 (52.3) | 110 (50.0) | 119 (53.8) |
Confirmed objective response rate (ORR: CR + PR), n (%) | 10 (18.5) | 0 (0.0) | 22 (20.0) | 1 (0.8) |
95% CIc | (9.3 to 31.4) | (0.0 to 6.4) | (13.0 to 28.7) | (0.0 to 4.6) |
Both sides | ||||
N (%) | 5 (4.4) | 7 (6.5) | 11 (5.0) | 22 (10.0) |
Confirmed objective response rate (ORR: CR + PR), n (%) | 1 (20.0) | 0 (0.0) | 5 (45.5) | 0 (0.0) |
95% CIc | (0.5 to 71.6) | (0.0 to 41.0) | (16.7 to 76.6) | (0.0 to 15.4) |
Unknown colon | ||||
N (%) | 8 (7.1) | 4 (3.7) | 16 (7.3) | 12 (5.4) |
Confirmed objective response rate (ORR: CR + PR), n (%) | 1 (12.5) | 4 (3.7) | 1 (6.3) | 0 (0.0) |
95% CIc | (0.3 to 52.7) | (0.0 to 60.2) | (0.2 to 30.2) | (0.0 to 26.5) |
Liver metastases at baseline | ||||
Liver metastases at baseline | ||||
N (%) | 73 (64.6) | 60 (56.1) | 134 (60.9) | 128 (57.9) |
Confirmed objective response rate (ORR: CR + PR), n (%) | 15 (20.5) | 0 (0.0) | 26 (19.4) | 1 (0.8) |
95% CIc | (12.0 to 31.6) | (0.0 to 6.0) | (13.1 to 27.1) | (0.0 to 4.3) |
No liver metastases at baseline | ||||
N (%) | 40 (35.4) | 47 (43.9) | 86 (39.1) | 93 (42.1) |
Confirmed objective response rate (ORR: CR + PR), n (%) | 8 (20.0) | 2 (4.3) | 17 (19.8) | 3 (3.2) |
95% CIc | (9.1 to 35.6) | (0.5 to 14.5) | (12.0 to 29.8) | (0.7 to 9.1) |
CEA = carcinoembryonic antigen; CI = confidence interval; CR = complete response; ECOG PS = Eastern Cooperative Oncology Group Performance Status; MSI = microsatellite instability; ORR = objective response rate; PR = partial response.
aAnalyses for ORR at the interim analysis were conducted using the phase III response efficacy set.
bAnalyses for ORR at the post-hoc analysis were conducted using the full analysis set.
cConfidence intervals were calculated using the Clopper-Pearson method.
Source: BEACON Clinical Study Report,14 BEACON Clinical Study Report Addendum.15
Table 33: Subgroup Analyses for Progression-Free Survival in the BEACON Trial
Subgroup analyses (PFS) | Interim analysisa (data cut-off: February 11, 2019) | Post-hoc analysisa (data cut-off: August 15, 2019) | ||
|---|---|---|---|---|
Doublet group (N = 113) | Control group (N = 107) | Doublet group (N = 220) | Control group (N = 221) | |
ECOG PS at randomization | ||||
ECOG PS at randomization = 0 | ||||
Patients with events/patients included in analysis, (%) | 57/113 (50.4) | 61/112 (54.5) | 76/113 (67.3) | 72/112 (64.3) |
Median, months (95% CI) | 5.45 (4.27 to 8.08) | 1.61 (1.51 to 1.97) | 5.68 (4.40 to 8.11) | 1.61 (1.51 to 2.60) |
Unstratified hazard ratio (95% CI) | 0.32 (0.22 to 0.48) | 0.36 (0.26 to 0.50) | ||
ECOG PS at randomization = 1 | ||||
Patients with events/patients included in analysis, (%) | 76/107 (71.0) | 67/109 (61.5) | 91/107 (85.0) | 75/109 (68.8) |
Median, months (95% CI) | 3.22 (2.83 to 4.11) | 1.45 (1.41 to 1.64) | 3.98 (2.86 to 4.17) | 1.48 (1.41 to 2.00) |
Unstratified hazard ratio (95% CI) | 0.51 (0.37 to 0.72) | 0.57 (0.42 to 0.78) | ||
Irinotecan use at randomization | ||||
Irinotecan use at randomization | ||||
Patients with events/patients included in analysis, (%) | 66/113 (58.4) | 68/112 (60.7) | 83/113 (73.5) | 76/112 (67.9) |
Median, months (95% CI) | 4.07 (2.83 to 5.36) | 1.48 (1.41 to 1.61) | 4.14 (2.86 to 5.29) | 1.48 (1.41 to 1.64) |
Unstratified hazard ratio (95% CI) | 0.38 (0.26 to 0.54) | 0.44 (0.32 to 0.61) | ||
No irinotecan use at randomization | ||||
Patients with events/patients included in analysis, (%) | 67/107 (62.6) | 60/109 (55.0) | 84/107 (78.5) | 71/109 (65.1) |
Median, months (95% CI) | 5.03 (4.04 to 5.78) | 1.68 (1.45 to 2.86) | 5.29 (4.14 to 6.64) | 1.71 (1.48 to 2.83) |
Unstratified hazard ratio (95% CI) | 0.47 (0.33 to 0.67) | 0.47 (0.34 to 0.65) | ||
Cetuximab source | ||||
US-licensed cetuximab source | ||||
Patients with events/patients included in analysis, (%) | 22/28 (78.6) | 12/29 (41.4) | 25/28 (89.3) | 12/29 (41.4) |
Median, months (95% CI) | 3.71 (2.73 to 5.55) | 1.58 (1.18 to 2.60) | 3.98 (2.73 to 5.26) | 1.58 (1.18 to 3.25) |
Unstratified hazard ratio (95% CI) | 0.37 (0.17 to 0.78) | 0.39 (0.18 to 0.81) | ||
EU-approved cetuximab source | ||||
Patients with events/patients included in analysis, (%) | 111/192 (57.8) | 116/192 (60.4) | 142/192 (74.0) | 135/192 (70.3) |
Median, months (95% CI) | 4.27 (4.04 to 5.52) | 116/192 (60.4) | 4.40 (4.14 to 5.55) | 1.54 (1.48 to 1.97) |
Unstratified hazard ratio (95% CI) | 0.41 (0.31 to 0.54) | 0.46 (0.36 to 0.58) | ||
Region | ||||
North America | ||||
Patients with events/patients included in analysis, (%) | 22/28 (78.6) | 12/29 (41.4) | 25/29 (86.2) | 12/29 (41.4) |
Median, months (95% CI) | 3.71 (2.73 to 5.55) | 1.58 (1.18 to 2.60) | 3.98 (2.73 to 5.26) | 1.58 (1.18 to 3.25) |
Unstratified hazard ratio (95% CI) | 0.37 (0.17 to 0.78) | 0.38 (0.18 to 0.79) | ||
Europe | ||||
Patients with events/patients included in analysis, (%) | 85/145 (58.6) | 81/125 (64.8) | 109/144 (75.7) | 93/125 (74.4) |
Median, months (95% CI) | 4.21 (3.22 to 5.62) | 1.54 (1.45 to 1.91) | 4.27 (4.04 to 5.68) | 1.58 (1.48 to 2.17) |
Unstratified hazard ratio (95% CI) | 0.38 (0.27 to 0.52) | 0.45 (0.34 to 0.60) | ||
Rest of world | ||||
Patients with events/patients included in analysis, (%) | 26/47 (55.3) | 35/67 (52.2) | 33/47 (70.2) | 42/67 (62.7) |
Median, months (95% CI) | 4.40 (2.83 to 5.36) | 35/67 (52.2) | 4.44 (4.04 to 8.38) | 1.51 (1.41 to 2.83) |
Unstratified hazard ratio (95% CI) | 0.51 (0.30 to 0.85) | 0.45 (0.28 to 0.72) | ||
Number of prior regimens for metastatic disease | ||||
1 | ||||
Patients with events/patients included in analysis, (%) | 89/146 (61.0) | 83/145 (57.2) | 112/146 (76.7) | 97/145 (66.9) |
Median, months (95% CI) | 4.21 (3.52 to 5.45) | 1.58 (1.45 to 2.37) | 4.34 (4.04 to 5.52) | 1.68 (1.51 to 2.60) |
Unstratified hazard ratio (95% CI) | 0.43 (0.31 to 0.58) | 0.48 (0.36 to 0.63) | ||
≥ 2 | ||||
Patients with events/patients included in analysis, (%) | 44/74 (59.5) | 45/76 (59.2) | 55/74 (74.3) | 50/76 (65.8) |
Median, months (95% CI) | 4.14 (2.79 to 5.62) | 1.48 (1.41 to 1.61) | 4.17 (2.86 to 5.68) | 1.48 (1.41 to 1.58) |
Unstratified hazard ratio (95% CI) | 0.39 (0.26 to 0.61) | 0.41 (0.28 to 0.61) | ||
Race Asian vs. non-Asian | ||||
Asian | ||||
Patients with events/patients included in analysis, (%) | 14/25 (56.0) | 24/39 (61.5) | 15/25 (60.0) | 29/39 (74.4) |
Median, months (95% CI) | 5.32 (2.63 to 8.21) | 1.51 (1.35 to 2.86) | 5.36 (2.89 to 10.97) | 1.51 (1.35 to 2.27) |
Unstratified hazard ratio (95% CI) | 0.44 (0.22 to 0.85) | 0.30 (0.15 to 0.57) | ||
Non-Asian | ||||
Patients with events/patients included in analysis, (%) | 116/187 (62.0) | 101/175 (57.7) | 148/187 (79.1) | 114/175 (65.1) |
Median, months (95% CI) | 4.21 (3.58 to 5.45) | 1.58 (1.45 to 1.87) | 4.17 (4.01 to 5.29) | 1.58 (1.48 to 2.10) |
Unstratified hazard ratio (95% CI) | 0.41 (0.31 to 0.55) | 0.50 (0.39 to 0.64) | ||
Race Caucasian vs. non-Caucasian | ||||
Caucasian | ||||
Patients with events/patients included in analysis, (%) | 115/183 (62.8) | 99/172 (57.6) | 147/183 (80.3) | 112/172 (65.1) |
Median, months (95% CI) | 4.17 (3.52 to 5.45) | 99/172 (57.6) | 4.17 (4.01 to 5.29) | 1.58 (1.48 to 2.10) |
Unstratified hazard ratio (95% CI) | 0.41 (0.31 to 0.54) | 0.48 (0.37 to 0.62) | ||
Non-Caucasian | ||||
Patients with events/patients included in analysis, (%) | 15/29 (51.7) | 26/42 (61.9) | 16/29 (55.2) | 31/42 (73.8) |
Median, months (95% CI) | 5.36 (2.73 to 8.21) | 1.51 (1.35 to 2.27) | 5.62 (2.89 to 10.97) | 1.48 (1.35 to 2.27) |
Unstratified hazard ratio (95% CI) | 0.45 (0.24 to 0.85) | 0.32 (0.17 to 0.59) | ||
Age | ||||
< 65 years | ||||
Patients with events/patients included in analysis, (%) | 79/137 (57.7) | 92/149 (61.7) | 99/137 (72.3) | 103/149 (69.1) |
Median, months (95% CI) | 79/137 (57.7) | 1.48 (1.45 to 1.64) | 4.40 (4.07 to 5.55) | 1.51 (1.45 to 1.71) |
Unstratified hazard ratio (95% CI) | 0.40 (0.29 to 0.54) | 0.43 (0.32 to 0.57) | ||
≥ 65 years | ||||
Patients with events/patients included in analysis, (%) | 1.48 (1.45 to 1.64) | 36/72 (50.0) | 68/83 (81.9) | 44/72 (61.1) |
Median, months (95% CI) | 4.11 (2.92 to 5.68) | 1.68 (1.48 to 3.02) | 4.17 (3.22 to 5.52) | 1.68 (1.48 to 2.83) |
Unstratified hazard ratio (95% CI) | 0.47 (0.30 to 0.73) | 0.55 (0.37 to 0.80) | ||
Sex | ||||
Male | ||||
Patients with events/patients included in analysis, (%) | 70/115 (60.9) | 58/94 (61.7) | 87/114 (76.3) | 71/94 (75.5) |
Median, months (95% CI) | 4.14 (2.86 to 5.55) | 1.51 (1.41 to 1.64) | 4.17 (2.89 to 5.55) | 1.51 (1.45 to 1.91) |
Unstratified hazard ratio (95% CI) | 0.38 (0.26 to 0.54) | 0.42 (0.30 to 0.58) | ||
Female | ||||
Patients with events/patients included in analysis, (%) | 63/105 (60.0) | 70/127 (55.1) | 80/106 (75.5) | 76/127 (59.8) |
Median, months (95% CI) | 4.27 (4.04 to 5.52) | 1.58 (1.45 to 2.17) | 4.40 (4.11 to 5.55) | 1.68 (1.45 to 2.27) |
Unstratified hazard ratio (95% CI) | 0.45 (0.32 to 0.64) | 0.50 (0.36 to 0.68) | ||
Number of organs involved | ||||
≤ 2 | ||||
Patients with events/patients included in analysis, (%) | 66/117 (56.4) | 67/123 (54.5) | 87/117 (74.4) | 73/123 (59.3) |
Median, months (95% CI) | 5.36 (4.17 to 6.47) | 1.51 (1.41 to 1.91) | 5.36 (4.21 to 5.78) | 1.54 (1.48 to 2.37) |
Unstratified hazard ratio (95% CI) | 0.39 (0.27 to 0.55) | 0.43 (0.31 to 0.59) | ||
> 2 | ||||
Patients with events/patients included in analysis, (%) | 67/103 (65.0) | 61/98 (62.2) | 80/103 (77.7) | 74/98 (75.5) |
Median, months (95% CI) | 3.71 (2.86 to 4.21) | 1.58 (1.45 to 2.00) | 4.04 (2.92 to 4.40) | 1.58 (1.45 to 2.10) |
Unstratified hazard ratio (95% CI) | 0.44 (0.31 to 0.64) | 0.51 (0.37 to 0.71) | ||
MSI status | ||||
Abnormal high MSI status | ||||
Patients with events/patients included in analysis, (%) | 9/19 (47.4) | 8/12 (66.7) | 12/19 (63.2) | 9/12 (75.0) |
Median, months (95% CI) | 2.79 (1.45-NR) | 1.51 (1.35 to 5.13) | 2.86 (1.48 to 7.00) | 1.58 (1.35 to 3.38) |
Unstratified hazard ratio (95% CI) | 0.77 (0.28 to 2.13) | 0.57 (0.24 to 1.35) | ||
Normal MSI status | ||||
Patients with events/patients included in analysis, (%) | 96/157 (61.1) | 96/147 (65.3) | 120/157 (76.4) | 111/147 (75.5) |
Median, months (95% CI) | 5.03 (4.04 to 5.55) | 1.51 (1.41 to 1.87) | 5.29 (4.14 to 5.68) | 1.51 (1.41 to 2.00) |
Unstratified hazard ratio (95% CI) | 0.40 (0.30 to 0.53) | 0.44 (0.34 to 0.58) | ||
Unknown MSI status | ||||
Patients with events/patients included in analysis, (%) | 28/44 (63.6) | 24/62 (38.7) | 35/44 (79.5) | 27/62 (43.5) |
Median, months (95% CI) | 4.07 (2.86 to 5.26) | 24/62 (38.7) | 4.11 (2.92 to 5.26) | 1.58 (1.48 to 2.99) |
Unstratified hazard ratio (95% CI) | 0.41 (0.23 to 0.74) | 0.50 (0.30 to 0.85) | ||
BRAF Mutation status | ||||
Positive | ||||
Patients with events/patients included in analysis, (%) | 124/201 (61.7) | 118/201 (58.7) | 153/201 (76.1) | 137/201 (68.2) |
Median, months (95% CI) | 4.17 (3.58 to 5.32) | 1.54 (1.45 to 1.71) | 4.21 (4.04 to 5.36) | 1.58 (1.48 to 2.00) |
Unstratified hazard ratio (95% CI) | 0.43 (0.33 to 0.56) | 0.47 (0.37 to 0.59) | ||
Negative or indeterminate | ||||
Patients with events/patients included in analysis, (%) | 8/14 (57.1) | 9/14 (64.3) | 11/14 (78.6) | 9/14 (64.3) |
Median, months (95% CI) | 4.27 (1.74 to 8.08) | 1.45 (1.08 to 3.98) | 6.01 (1.41 to 8.08) | 1.45 (1.08 to 3.98) |
Unstratified hazard ratio (95% CI) | 0.25 (0.08 to 0.85) | 0.37 (0.14 to 0.99) | ||
CEA status | ||||
> ULN | ||||
Patients with events/patients included in analysis, (%) | 98/153 (64.1) | 108/178 (60.7) | 123/153 (80.4) | 122/178 (68.5) |
Median, months (95% CI) | 4.04 (3.06 to 4.40) | 1.51 (1.45 to 1.71) | 4.14 (3.52 to 4.44) | 1.51 (1.45 to 1.87) |
Unstratified hazard ratio (95% CI) | 0.43 (0.33 to 0.58) | 0.47 (0.36 to 0.61) | ||
≤ ULN | ||||
Patients with events/patients included in analysis, (%) | 35/67 (52.2) | 20/42 (47.6) | 44/67 (65.7) | 25/42 (59.5) |
Median, months (95% CI) | 5.55 (4.17 to 8.84) | 1.64 (1.45 to 4.17) | 5.62 (4.34 to 9.43) | 1.64 (1.48 to 4.17) |
Unstratified hazard ratio (95% CI) | 0.48 (0.27 to 0.85) | 0.51 (0.31 to 0.84) | ||
CRP status | ||||
> ULN | ||||
Patients with events/patients included in analysis, (%) | 56/79 (70.9) | 59/90 (65.6) | 66/79 (83.5) | 66/90 (73.3) |
Median, months (95% CI) | 2.86 (2.66 to 3.58) | 1.48 (1.41 to 2.00) | 2.89 (2.79 to 3.98) | 1.48 (1.41 to 2.10) |
Unstratified hazard ratio (95% CI) | 0.48 (0.33 to 0.70) | 0.52 (0.37 to 0.74) | ||
≤ ULN | ||||
Patients with events/patients included in analysis, (%) | 75/139 (54.0) | 65/126 (51.6) | 99/139 (71.2) | 77/126 (61.1) |
Median, months (95% CI) | 5.55 (4.40 to 7.46) | 1.58 (1.48 to 2.27) | 5.62 (4.44 to 7.46) | 1.58 (1.48 to 2.60) |
Unstratified hazard ratio (95% CI) | 0.40 (0.28 to 0.57) | 0.47 (0.35 to 0.64) | ||
Tumour removed status | ||||
Completely resected | ||||
Patients with events/patients included in analysis, (%) | 75/123 (61.0) | 68/122 (55.7) | 94/123 (76.4) | 80/122 (65.6) |
Median, months (95% CI) | 4.40 (3.58 to 5.62) | 1.61 (1.41 to 2.00) | 4.40 (4.04 to 5.68) | 1.54 (1.41 to 2.00) |
Unstratified hazard ratio (95% CI) | 0.46 (0.33 to 0.64) | 0.47 (0.34 to 0.63) | ||
Partially resected or unresected | ||||
Patients with events/patients included in analysis, (%) | 58/97 (59.8) | 60/99 (60.6) | 73/97 (75.3) | 67/99 (67.7) |
Median, months (95% CI) | 4.04 (2.92 to 5.26) | 1.51 (1.45 to 1.91) | 4.17 (3.52 to 5.52) | 1.58 (1.48 to 2.27) |
Unstratified hazard ratio (95% CI) | 0.38 (0.26 to 0.55) | 0.46 (0.33 to 0.65) | ||
Side of tumour | ||||
Left colon | ||||
Patients with events/patients included in analysis, (%) | 56/83 (67.5) | 42/68 (61.8) | 66/83 (79.5) | 47/68 (69.1) |
Median, months (95% CI) | 4.21 (2.89 to 5.36) | 1.58 (1.51 to 2.40) | 4.40 (3.06 to 5.62) | 1.58 (1.51 to 2.60) |
Unstratified hazard ratio (95% CI) | 0.47 (0.31 to 0.71) | 0.57 (0.39 to 0.83) | ||
Right colon | ||||
Patients with events/patients included in analysis, (%) | 64/110 (58.2) | 68/119 (57.1) | 81/110 (73.6) | 79/119 (66.4) |
Median, months (95% CI) | 4.11 (3.09 to 5.52) | 1.48 (1.41 to 1.71) | 4.17 (3.84 to 5.52) | 1.48 (1.41 to 1.71) |
Unstratified hazard ratio (95% CI) | 0.40 (0.28 to 0.56) | 0.41 (0.30 to 0.56) | ||
Both sides | ||||
Patients with events/patients included in analysis, (%) | 5/11 (45.5) | 11/22 (50.0) | 8/11 (72.7) | 13/22 (59.1) |
Median, months (95% CI) | 5.55 (0.62 to 8.41) | 2.17 (1.02 to 4.01) | 5.55 (1.38 to 8.41) | 2.17 (1.08 to 4.17) |
Unstratified hazard ratio (95% CI) | 0.27 (0.07 to 1.01) | 0.43 (0.17 to 1.13) | ||
Unknown colon | ||||
Patients with events/patients included in analysis, (%) | 8/16 (50.0) | 7/12 (58.3) | 12/16 (75.0) | 8/12 (66.7) |
Median, months (95% CI) | 6.01 (2.73 to 11.37) | 1.45 (0.26 to 4.17) | 6.01 (4.04 to 8.08) | 2.23 (0.26 to 4.17) |
Unstratified hazard ratio (95% CI) | 0.19 (0.05 to 0.74) | 0.31 (0.11 to 0.86) | ||
Liver metastases at baseline | ||||
Liver metastases at baseline | ||||
Patients with events/patients included in analysis, (%) | 91/134 (67.9) | 90/128 (70.3) | 112/134 (83.6) | 98/128 (76.6) |
Median, months (95% CI) | 3.71 (2.89 to 4.21) | 1.45 (1.35 to 1.48) | 4.07 (3.09 to 4.27) | 1.45 (1.41 to 1.48) |
Unstratified hazard ratio (95% CI) | 0.28 (0.20 to 0.38) | 0.28 (0.21 to 0.38) | ||
No liver metastases at baseline | ||||
Patients with events/patients included in analysis, (%) | 42/86 (48.8) | 38/93 (40.9) | 55/86 (64.0) | 49/93 (52.7) |
Median, months (95% CI) | 5.68 (4.40 to 8.34) | 3.06 (1.97 to 5.09) | 6.70 (4.44 to 8.34) | 2.99 (2.20 to 4.17) |
Unstratified hazard ratio (95% CI) | 0.54 (0.34 to 0.86) | 0.62 (0.42 to 0.92) | ||
CI = confidence interval; ECOG PS = Eastern Cooperative Oncology Group Performance Status; PFS = progression-free survival; ULN = upper limit of normal; vs. = versus .
aAnalyses for PFS at the interim and post-hoc analyses were conducted using the full analysis set.
Source: BEACON Clinical Study Report14; BEACON Clinical Study Report Addendum.15
Appendix 4: Description and Appraisal of Outcome Measures
Aim
To describe the following outcome measures and review their measurement properties (validity, reliability, responsiveness to change, and MID):
EORTC QLQ-C30
EQ-5D-5L
FACT-C
PGIC
Findings
Table 34: Summary of Outcome Measures and Their Measurement Properties
Outcome measure | Type | Conclusions about measurement properties | MID |
|---|---|---|---|
EORTC QLQ-C30 | A 30-item, patient-reported, cancer-specific, quality of life questionnaire using 4-point and 7-point Likert scales. | Validity, reliability, and responsiveness:
| Patients with cancer:
Patients with CRC: Within-group changes:a
Between-group changes:a
|
EQ-5D-5L | Patient-reported, generic quality of life instrument using a 5-point ordinal scale to assess health in 5 dimensions. | Validity, reliability, and responsiveness: Validity demonstrated in the general population. No literature was identified that assessed validity, reliability, or responsiveness in patients with CRC. | No MID identified in populations with CRC. |
FACT-C | A 36-item questionnaire aimed at assessing the HRQoL of patients with CRC consisting of the 4-domain FACT-G and 9-item CCS. | Validity, reliability, and responsiveness: Adequate validity, reliability, and responsiveness have been demonstrated in patients with CRC. | Patients with CRC:
|
PGIC | A patient-reported, single-item question to assess if the patient’s overall status has improved or worsened using a 7-point Likert scale. | Validity, reliability, and responsiveness: No literature was identified that assessed validity, reliability, or responsiveness in patients with CRC. | No MID identified in populations with CRC. |
CCS = colorectal cancer subscale; CRC = colorectal cancer; ECOG PS = Eastern Cooperative Oncology Group Performance Status; EORTC QLQ-C30 = European Organisation for Research and Treatment of Cancer Quality of Life Questionnaire Core 30; EQ-5D-5L = EuroQol 5-Dimensions 5-Levels questionnaire; FACT-C = Functional Assessment of Cancer Therapy–Colorectal; FACT-G = Functional Assessment of Cancer Therapy–General; HRQoL = health-related quality of life; MID = minimal important difference; PGIC = Patient Global Impression of Change.
aFor select scales, see Table 37 for details.
EORTC QLQ-C30
Description
The EORTC QLQ-C30 is 1 of the most commonly used patient-reported outcome measures in oncology clinical trials.44 It is a multi-dimensional, cancer-specific, evaluative measure of HRQoL. It was designed specifically for the purpose of assessing changes in participants’ HRQoL in clinical trials in response to treatment.45 The core questionnaire of the EORTC QLQ-C30 consists of 30 questions that are scored to create 5 multi-item functional scales, 3 multi-item symptom scales, 6 single-item symptom scales, and a 2-item quality of life scale, as outlined in Table 35. The first 2 versions of the questionnaire have been previously validated in patients with cancer.46 Version 3.0 of the questionnaire is the most current version and has been in use since December of 1997.47 It is available in 90 languages and is intended for use in adult populations only. The global quality of life scale is also known as the global health status (GHS).48
Table 35: EORTC QLQ-C30 Scales
Functional scales (15 questions) | Symptom scales (7 questions) | Single-item symptom scales (6 questions) | Global quality of life (2 questions) |
|---|---|---|---|
Physical function (5) | Fatigue (3) | Dyspnea (1) | Global quality of life (2) |
Role function (2) | Pain (2) | Insomnia (1) | |
Cognitive function (2) | Nausea and vomiting (2) | Appetite loss (1) | |
Emotional function (4) | Constipation (1) | ||
Social function (2) | Diarrhea (1) | ||
Financial impact (1) |
EORTC QLQ-C30 = European Organisation for Research and Treatment of Cancer Quality of Life Questionnaire Core 30.
Scoring
The EORTC QLQ-C30 uses a 1-week recall period to assess function and symptoms.47 Most questions have 4 response options (“not at all,” “a little,” “quite a bit,” “very much”) with scores on these items ranging from 1 to 4. For the 2 items that form the global quality of life scale, the response format is a 7-point Likert-type scale with anchors at 1 = “very poor” and 7 = “excellent.”
Raw scores for each scale are computed as the average of the items that contribute to a particular scale.47 This scaling approach is based on the assumption that it is appropriate to provide equal weighting to each item that comprises a scale. There is also an assumption that, for each item, the interval between response options is equal (for example, the difference in score between “not at all” and “a little” is the same as “a little” and “quite a bit,” at a value of 1 unit). Each raw scale score is converted to a standardized score that ranges from 0 to 100 using a linear transformation, with a higher score reflecting better function on the function scales, higher symptoms on the symptom scales, and better quality of life (i.e., higher scores simply reflect higher levels of response on that scale). Thus, a decline in score on the symptom scale would reflect an improvement, whereas an increase in score on the function and quality of life scales would reflect an improvement. According to the EORTC QLQ-C30 scoring algorithm, if there are missing items for a scale (i.e., the participant did not provide a response), the score for the scale can still be computed if there are responses for at least 1-half of the items. In calculating the scale score, the missing items are simply ignored — an approach that assumes that the missing items have values equal to the average of those items for what the respondent completed.
Psychometric Properties
Validity
One cross-sectional study aimed to validate the EORTC QLQ-C30 in a convenience sample of cancer patients in Singapore.49 Most patients had breast and colorectal cancers, but leukemia, lung cancer, lymphoma, germ cell tumour, and other cancers were also reported. Construct validity was assessed by cross-sectional correlational evidence and discriminative evidence. First, convergent validity was assessed using Spearman’s correlations (r) between QLQ-C30 and Short Form (36) Health Survey (SF-36) scales, hypothesizing moderate to strong correlation (defined as correlation coefficient of 0.35 to 0.5, and > 0.5, respectively) between scales of these 2 instruments measuring similar dimensions of HRQoL. Results showed moderate to strong correlations between QLQ-C30 and SF-36 scales, ranging from 0.35 to 0.67 across the assessed scales. Next, known-groups approach was used to compare 6 QLQ-C30 scale scores between patients reporting mild and severe symptoms, as well as by stage of disease and presence of comorbid conditions. With the exception of emotional functioning, the remaining 5 scales showed better scores in patients with mild symptoms than those with severe symptoms (P < 0.05 for all other comparisons). Patients in early stages of cancer (or with no comorbid conditions) generally had better QLQ-C30 scores than those in advanced disease stages (or with comorbid conditions); however, none of these differences were statistically significant.
A recent cross-sectional study in Kenya was conducted to evaluate the psychometric properties of the EORTC QLQ-C30, using the English or Kiswahili version in 100 patients with cancer.48 Most patients had breast cancer, followed by prostate, Kaposi sarcoma, lung, and other cancers. Construct validity was assessed by examining the inter-scale correlations among the subscales of EORTC QLQ-C30. The inter-scale correlations were weak to strong with an absolute magnitude ranging from 0.07 to 0.73. Notably, with the exception of cognitive functioning, emotional functioning, nausea and vomiting, dyspnea, appetite loss, constipation, and diarrhea, the GHS correlated moderately with the remaining subscales (r ≥ 0.30). Cross-cultural validity was evaluated but not reported here.
Reliability
The Singaporean cross-sectional study mentioned previously also assessed internal consistency reliability by calculating Cronbach’s alpha for all QLQ-C30 scales.49 Cronbach’s alpha was 0.70 or greater for 6 of the 9 assessed QLQ-C30 scales; cognitive functioning, physical functioning, and nausea and vomiting had a Cronbach’s alpha ranging from 0.19 to 0.68.
The Kenyan study described earlier assessed the internal consistency of each scale of the questionnaire using Cronbach’s alpha-coefficients.48 With the exception of the cognitive function scale, all of the scales had a Cronbach’s alpha of 0.70 or greater.
No studies evaluating the responsiveness of the instrument were found.
Minimal Important Difference
For use in clinical trials, scores on the EORTC QLQ-C30 can be compared between different groups of patients or within a group of patients over time. One study from 1998 conducted in patients with breast cancer and small-cell lung cancer estimated a clinically relevant change in score on any scale of the EORTC QLQ-C30 to be 10 points.50 The estimate was based on a study that used an anchor-based approach to estimate the MIDs in which patients who reported “a little” change (for better or worse) on the subjective significance questionnaire had corresponding changes on a function or symptom scale of the EORTC QLQ-C30 of approximately 5 to 10 points. Participants who reported a “moderate” change had corresponding changes in the EORTC QLQ-C30 of about 10 to 20 points, and those who reported being “very much” changed had corresponding changes of more than 20 points.
More recently in 2015, a Canadian study estimated the MIDs of EORTC QLQ-C30 scales using data from 193 patients newly diagnosed with breast and colorectal cancers.51 The Supportive Care Needs Survey-Short Form-34 (SCNS-SF34) was used as an anchor; mean changes in EORTC QLQ-C30 scales associated with improvement, worsening, and no change in supportive care based on the SCNS-SF34 were then calculated. MIDs were assessed for the following scales: physical function, role function, emotional function, global health/Quality of life (i.e., GHS), pain, and fatigue. For improvement, MIDs associated with a statistically significant improvement in supportive care needs ranged from 10 to 32 points. For worsening, MIDs associated with a statistically significant worsening of supportive care needs ranged from 9 to 21 points. The range for unchanged supportive care needs was from 1-point worsening to 16-point improvement in EORTC QLQ-C30 score. Based on this, the authors suggested a 10-point change in EORTC QLQ-C30 score represented changes in supportive care needs, and therefore, should be considered for clinical use.
In 2014, another Canadian study estimated the MID for EORTC QLQ-C30 in 369 patients with advanced cancer who completed the questionnaire at baseline and 1 month post radiation.52 The most common cancer type was breast cancer, followed by lung, prostate, gastrointestinal, renal cell, and other cancers. MID was estimated using both anchor- and distribution-based methods for improvement and deterioration. Two anchors of overall health and overall quality of life were used, both taken directly from the EORTC QLQ-C30 (questions 29 and 30) where patients rated their overall health and quality of life themselves. Improvement and deterioration were categorized as an increase or decrease by 2 units to account for the natural fluctuation of patient scoring. With these 2 anchors, the estimated MIDs across all EORTC QLQ-C30 scales ranged from 9.1 units to 23.5 units for improvement, and from 7.2 units to 13.5 units for deterioration. Distribution-based estimates were closest to 0.5 SD.
EORTC QLQ-C30 for patients with colorectal cancer
Wong et al. conducted a systematic review of HRQoL instruments used to assess patients with colorectal cancer which examined the psychometric properties of the instruments.53 The level of evidence supporting the measurements was ranked on a 4-point Likert scale of “poor,” “fair,” “good,” or “excellent” and each instrument was given an overall rating of “unknown,” “limited,” “moderate,” or “strong.” Table 36 summarizes the findings. In general, very few instruments demonstrated moderate or excellent evidence supporting the psychometric properties that were investigated though there was evidence identified for internal consistency, reliability, structural validity, a priori hypothesis testing, and responsiveness for the EORTC QLQ-C30.
Table 36: Summary of Methodological Quality and Level of Evidence for Select HRQoL Instruments in Patients with CRC
Instrument | Internal consistency | Reliability | Content validity | Structural validity | Hypothesis testing | Cross-cultural validity | Criterion validity | Responsiveness |
|---|---|---|---|---|---|---|---|---|
EORTC QLQ-C30 (version 1) | ||||||||
Methodological quality | Poor | — | — | Poor | Good/ excellent | — | — | — |
Overall strength of evidence | Uncertain | — | — | Uncertain | Excellent | — | — | — |
EORTC QLQ-C30 (version 3) | ||||||||
Methodological quality | Poor/good/ excellent | Fair | — | Poor/good/excellent | Poor/good/ excellent | Poor | Poor | Poor/fair/good |
Overall strength of evidence | Excellent | Limited | — | Uncertain | Excellent | Uncertain | Uncertain | Unknown |
EQ-5D | ||||||||
Methodological quality | — | Fair | — | — | Excellent | — | — | — |
Overall strength of evidence | — | Limited | — | — | Excellent | — | — | — |
FACT-C | ||||||||
Methodological quality | Poor | Fair | Excellent | Poor/ excellent | Good/poor/ excellent | Poor/fair | — | Fair/good |
Overall strength of evidence | Uncertain | Limited | Excellent | Uncertain | Excellent | Uncertain | — | Moderate |
CRC = colorectal cancer; EORTC QLQ-C30 = European Organisation for Research and Treatment of Cancer Quality of Life Questionnaire Core 30; EQ-5D = EuroQol 5-Dimensions 3-Levels questionnaire; FACT-C = Functional Assessment of Cancer Therapy–Colorectal; HRQoL = health-related quality of life.
Source: Wong (2014).53
Musoro et al. compared EORTC QLQ-C30 data from 3 clinical trials (N = 1,491) to estimate MIDs of patients with advanced colorectal cancer treated with chemotherapy.54 For their analyses, the financial impact scale was omitted. Clinical anchors were used and those with a correlation of |0.3| or greater were given priority in their analyses. To estimate the MID for within-group changes, an effect size was calculated from the mean score divided by the standard deviation of the change scores for all time points. For between-group changes, linear regression was used. An effect size between 0.2 and 0.8 was deemed acceptable since a value of less than 0.2 was considered not clinically important, while a value greater than 0.8 was more than minimally important. Table 37 summarizes MID estimates for within- and between-group changes of some scales. In general, the MIDs ranged from around 7 to 18 points and 4 to 10 points for improvement and deterioration within-group changes, respectively. MIDs for between-group changes were estimated to be from 5 to 14 points and 4 to 9 points for improvement and deterioration, respectively. Scales that are missing from the table (pain, cognitive function, social function, dyspnea, and insomnia) either did not have an anchor or had an effect size outside of the 0.2 to 0.8 range.
Table 37: EORTC QLQ-C30 With Anchor-Based MIDs for Within- and Between-Group Changes in Patients With CRC
Scale | Within-group change | Between-group change | ||
|---|---|---|---|---|
Improvement | Deterioration | Improvement | Deterioration | |
Physical functioning | 7.31 to 8.52 | –8.43 to –6.09 | 6.05 to 10.04 | –7.23 to –4.16 |
Role functioning | 10.43 to 18.06 | –10.66 | 7.95 to 14.17 | –9.96 |
Social functioning | 8.11 to 10.26 | –6.18 | 6.73 to 7.79 | –6.03 |
Global quality of life | 7.14 to 10.34 | –7.97 to –4.83 | 5.53 to 6.36 | –9.12 to –6.81 |
Fatiguea | 7.65 to 13.82 | –7.73 to –7.05 | 5.43 to 12.01 | –6. 98 to –6.76 |
Nausea and/or vomitinga | 7.75 | –7.95 to 5.30 | 7.34 | –7.33 to –5.17 |
Appetite lossa | 12.28 | –9.78 | 10.0 | –7.11 |
Diarrheaa | 6.35 | –7.96 | 8.25 | –5.46 |
Constipationa | 12.75 | No MIDb | 14.56 | No MIDb |
CRC = colorectal cancer; EORTC QLQ-C30 = European Organisation for Research and Treatment of Cancer Quality of Life Questionnaire Core 30; MID = minimal important difference.
aSymptom score directions were reversed to align with functioning scores (0 represents the worst possible scores and 100 represents the best)
bNo MID indicated either no suitable anchor was available or the effect size was outside of the 0.2 to 0.8 range.
Source: Musoro (2020).54
EuroQol 5-Dimensions 3-Levels Questionnaire
The EuroQol 5-Dimensions questionnaire (EQ-5D) is a generic HRQoL instrument that may be applied to a wide range of health conditions and treatments.55,56 The first of 2 parts of the EQ-5D is a descriptive system that classifies respondents (aged ≥ 12 years) based on the following 5 dimensions: mobility, self-care, usual activities, pain/discomfort, and anxiety/depression. The EQ-5D-5L has 5 possible levels for each domain and respondents are asked to choose the level that reflects their health state for each of the 5 domains resulting in 3,125 possible health states.57 A scoring function can be used to assign a value to self-reported health states from a set of population-based preference weights.55,56 The second part is a 20 cm visual analogue scale (the EuroQol VAS) that has end points labelled 0 and 100, with respective anchors of “worst imaginable health state” and “best imaginable health state.” Respondents are asked to rate their health by drawing a line from an anchor box to the point on the EQ VAS which best represents their health on that day. Hence, the EQ-5D produces 3 types of data for each respondent:
A profile indicating the extent of problems on each of the 5 dimensions represented by a 5-digit descriptor, such as 15121 or 33211
A population preference-weighted health index score based on the descriptive system
A self-reported assessment of health status based on the EQ VAS.
The EQ-5D index score is generated by applying a multi-attribute utility function to the descriptive system.58 Different utility functions are available that reflect the preferences of specific populations (e.g., US or UK). Scores less than 0 represent health states that are valued by society as being worse than dead, while scores of 0 and 1.00 are assigned to the health states “dead” and “perfect health,” respectively.
The EQ-5D-5L is validated in the general population and has an estimated MID between 0.037 and 0.069 based on scoring algorithms for 6 countries (Canada, China, Spain, Japan, England, and Uruguay).59
No literature was identified that assessed validity, reliability, or responsiveness in patients with colorectal cancer. No MID information was identified in populations with colorectal cancer.
Functional Assessment of Cancer Therapy–Colorectal
The FACT-C is a 36-item questionnaire aimed at assessing the HRQoL of patients with colorectal cancer. One of the 2 parts is the validated FACT–General (FACT-G) questionnaire which contains 4 general domains for physical, social/family, emotional, and functional well-being.60 The second of the parts is the disease-specific colorectal cancer subscale (CCS) which was developed in conjunction with the FACT-G. During development, 126 items specific to colorectal cancer were identified based on review of the literature, structured interviews with patients with stage III or IV colorectal cancer (N = 15), and health care professionals who had experience treating patients with stage III or IV colorectal cancer (N = 5). An additional 30 patients with any stage of colorectal cancer were asked to rank the relative importance of the 126 items using a 4-point Likert scale which resulted in 9 items that made up the final CCS: stomach swelling/cramping, bowel control, digestion, diarrhea, appetite, weight loss, body image, and 2 ostomy-related questions. Each item of the FACT-C is scored from 0 = “not at all” to 4 = “very much” and the scores are summed where a higher overall score is indicative of higher quality of life. The recall period is 1 week.
Ward et al. aimed to assess the FACT-C in 3 samples of English- and Spanish-speaking patients with colorectal cancer.60 Sample A (n = 60) was used to examine convergent and divergent validity as well as reliability of the questionnaire by comparing the FACT-C to the Brief Profile Of Moods Scale (BPOMS) and Functional Living Index–Cancer (FLIC). Sample B (n = 156) was made up of English- (n = 63) and Spanish-speaking (n = 93) patients and was used to assess convergent and divergent validity relative to the Profile of Mood States–Short Form (POMS-SF) and Marlowe-Crowne Social Desirability Scale (M-CSDS). A subset of patients in sample B who had ostomy appliances were included as a separate sample (sample B-OA). Known-groups validity was also assessed for the 5 FACT-C subscales against patient-rated performance status using multivariate analysis of variance (ANOVA) and univariate ANOVA methods and Tukey-Kramer adjustment for multiple pairwise comparisons. Responsiveness of the FACT-C subscales over 2 months was also evaluated against patient-rated PS using multivariate ANOVA and univariate ANOVA methods. Hypotheses were made a priori.
A Cronbach’s alpha greater than 0.6 was chosen as the threshold for adequate internal consistency for all subscales due to the small number and heterogeneity of the items in the CCS.60 Furthermore, due to the majority of patients not having ostomy appliances, only 7 items of the CCS were assessed. Adequate internal consistency was demonstrated for all samples and subscales aside from 4 instances: social well-being for sample B Spanish-speaking patients, and CCS and social and emotional well-being subscales for sample B-OA. In a separate analysis of sample B-OA and the CCS, the alpha increased from 0.47 (7 items) to 0.61 (9 items which included ostomy-related items). The FACT-C total score showed high internal consistency for all samples (alpha > 0.85). When compared with the threshold of alpha greater than 0.7, Cronbach’s alpha for social and emotional well-being and CCS were consistently less than 0.7 for both sample B subgroups and sample B-OA.
As hypothesized, all subscales and the FACT-C total score were significantly, negatively correlated with the BPOMS scores (−0.70 ≤ r ≤ − 0.35), but significantly, positively correlated with the FLIC (0.45 ≤ r ≤ 0.74) suggesting acceptable divergent and convergent validity for sample A.60 For either of the sample B subgroups, nearly all subscales and the FACT-C total score were significantly, negatively correlated with the POMS-SF (−0.68 ≤ r ≤ − 0.36), with only the emotional well-being subscale showing a non-significant, weak correlation (r = − 0.12) with the POMS-SF in the English-speaking subgroup. Comparison to the M-CSDS was used to demonstrate divergent validity in sample B subgroups. All correlations were weak (−0.14 ≤ r ≤ − 0.29), though a few were still statistically significant. In general, mean differences between known-groups based on patient-rated PS (ambulatory [PS = 0], ambulatory with symptoms [PS = 1], and bedridden or requiring bedrest [PS = 2, 3, 4]) were statistically significant for physical and functional well-being and CCS subscales as well as FACT-C total score. Patients with PS = 0 could consistently be differentiated from those with PS = 2, 3, 4 and occasionally from those with PS = 1.
There was some evidence of responsiveness when observing patients (n = 35) for 2 months.60 For patients whose PS increased (deteriorating health), mean change in both FACT-C subscales and total scores decreased while the opposite was true for patients whose health stayed the same or improved and had increases in mean change in FACT-C subscales and total scores. All results were statistically significant except for CCS.
In a Korean study of patients with colorectal cancer who underwent colectomies, the FACT-C was assessed for validity and responsiveness at 3 time points: pre-operation (n = 98),1 month and 6 months post operation (n = 52).61 Yoo et al. made a priori hypotheses. Internal consistency was adequate (alpha > 0.7) for almost all subscales and the FACT-C total score at the 3 time points. Only the CCS consistently had an alpha of less than 0.7: the alpha was 0.62 pre-operation and 0.67 for both 1 and 6 months. Convergent and divergent validity was assessed against the FLIC, BPOMS, and Korean Eysenck Personality Questionnaire (KEPQ) neuroticism scale demonstrating the expected positive, negative, and negative correlations, respectively. When evaluating change over time, scores significantly decreased from pre-operation to 1 month post operation and significantly increased from 1 to 6 months post operation (nearly to baseline levels) for the physical and functional well-being subscales, FACT-G, and FACT-C scores. These findings by Yoo et al. support those observed by Ward et al.60
Yost et al. used 3 sources of data to estimate MID ranges for the CCS and FACT-C.62 The previously mentioned Ward et al. study60 was used to generate preliminary MID estimates while a phase II clinical trial of bevacizumab at 2 doses and an observational study of HRQoL in patients with colorectal cancer were used to confirm the estimates. Methods included using 1/3 SD, 1/2 SD, standard error of measurement, cross-sectional anchor-based (between-group differences), and longitudinal anchor-based (within-group change).62 Effect sizes between 0.2 and 0.5 were considered for MID estimates. Preliminary MIDs ranged from 2 to 3 points for the CCS and 6 to 9 points for the FACT-C total scores. Confirmatory MIDs from the phase II clinical trial ranged from 2 to 3 points and from 5 to 8 points for the CCS and FACT-C scores, respectively. From the observational study, confirmatory MIDs ranged from 1 to 2 points for the CCS and from 5 to 8 points for the FACT-C. Overall, Yost et al. estimated MIDs to be between 2 and 3 points for the CCS and between 5 and 8 points for the FACT-C total score.
Patient Global Impression of Change
The PGIC is a patient-reported, single-item question used to assess whether the patient’s overall status has improved or worsened using a 7-point Likert scale where 1 = very much improved, 2 = much improved, 3 = minimally improved, 4 = no change, 5 = minimally worse, 6 = much worse, and 7 = very much worse.63 It is 1 of a variety of global rating of change scales which have been previously assessed for validity, reliability, and responsiveness in various patient populations.64
A study by Mercadante evaluated the PGIC in relation to symptom management for 876 patients with advanced cancer who had begun receiving palliative care.65 The investigators estimated an improved MID (defined as “minimally improved”) to range from 1.71 to 2.16 points while a worsening MID (or “minimally worse”) ranged from −0.34 to −2.5 points.
No literature was identified that assessed validity, reliability, or responsiveness in patients with colorectal cancer. No MID information was identified in populations with colorectal cancer.
Appendix 5: Summary of BRAF V600E Mutation Testing in Colorectal Cancer
Material considered in this section is provided as supporting information. The information has not been systematically reviewed.
Aim
To summarize the use of BRAF V600E mutation testing in patients with mCRC.
Findings
Background
In the BEACON trial, diagnosis of a BRAF V600E mutation was confirmed during molecular pre-screening by central laboratory or locally by PCR or NGS-based assays.14
The clinical experts consulted by CADTH for this review verified that NGS testing is the standard-of-care method for confirming RAF mutations and it is expected that jurisdictions have regional centres able to test for the BRAF V600E mutation. The clinical experts also indicated that in some jurisdictions in Canada, patients with stage III or IV colorectal cancer have their mutation status confirmed via panel testing using the Agena Bioscience MassArray iPLEX HS Colon Panel that includes the BRAF mutation. Testing would be performed at the request of the oncologist.
Overview of BRAF V600E Mutation
Expression of RAF genes leads to production of cytoplasmic serine-threonine kinases that act on the KRAS signalling pathway which is key to regulation of cellular processes.66,67 Mutations in the BRAF gene are estimated to occur in 5% to 25% of colorectal cancers with BRAF V600E being the most common.68 This mutation has been associated with worse prognosis in patients.67
Targeted therapies such as anti-EGFR monoclonal antibodies have been developed to treat various cancers including colorectal cancer.69 Studies have shown that particular genetic mutations (e.g., BRAF, KRAS, NRAS, PIK3CA) have been associated with resistance to such targeted therapies limiting their effectiveness.67,69 Therefore, early and accurate detection of these mutations can aid in choosing an effective therapy and prevent delays in treatment, while possibly leading to better patient outcomes.
BRAF V600E Mutation Testing Methods
A number of testing methods have been reported in the literature including, but not limited to, DNA-based assays (e.g., NGS, Sanger sequencing, various forms of PCR, pyrosequencing, microarray), IHC, spectroscopy, and indirect methods. This summary will focus on the most commonly reported methods with studies validating their sensitivity and specificity (i.e., NGS, PCR, and IHC).
A retrospective study by Li et al. used NGS for 747 colorectal cancer samples to identify 13 cancer-related genes.69 BRAF mutations occurred in 3.5% of samples. Overall, RAS/BRAF/PIK3CA mutations were detected more frequently in pooled biopsy and resection samples that had an estimated tumour cellularity greater than 30% versus less than 10% (P = 0.005). For biopsy-only specimens, a significant difference was found between those with less than 20% tumour cellularity versus greater than 20% (P < 0.05) while no difference was found for resection-only specimens. Additionally, a significant difference was found between samples without chemotherapy compared with after chemotherapy (P = 0.042). There was no significant difference in detection between paired primary and metastatic tumours in this study (n = 11). These may be limitations to consider for NGS testing and also that the estimation of tumour cellularity can be subjective. Sensitivity and specificity were not reported in this study.
Gilson et al. conducted a study using the Idylla real-time PCR platform to detect BRAF, NRAS, and KRAS mutations in 38 samples from patients with colorectal cancer.70 All sample mutation statuses were previously confirmed using NGS as a reference. Eight specimens were selected to evaluate the sensitivity and 12 for the specificity for the identification of BRAF mutations using real-time PCR. All BRAF testing results were concordant between the 2 methods demonstrating sensitivity and specificity of 1.0. The Idylla platform also had the benefits of requiring very small amounts of DNA (as little as 5 nanograms) and results could be obtained in a few hours if using isolated DNA rather than unprocessed specimens. Roma et al. evaluated Sanger sequencing and real-time PCR assays for their sensitivities in detecting BRAF V600E mutations in 510 mCRC samples.67 The investigators found real-time PCR had a lower limit of detection (i.e., able to detect DNA with the mutation at lower concentrations) and was the more sensitive assay. Using Sanger sequencing, 97.6% of cases were successfully analyzed and 17 (3.4%) cases were positive for the BRAF V600E mutation. For real-time PCR, 100% of cases were successful and 21 (4.1%) cases were positive for the mutation. Six discordant cases were evaluated using NGS which confirmed the results found by real-time PCR. Sensitivity and specificity were not reported in this study. Loree et al. conducted a review of different testing platforms for RAS and BRAF mutations common in colorectal cancer.71 Analytical sensitivity was described as the lowest frequency threshold of the mutant allele needed for detection. NGS was noted as having the greatest sensitivity (able to detect the mutation at a lower threshold) at 1% followed by allele-specific PCR (1% to 5%), pyrosequencing (2.5% to 5%), high-resolution melting (a form of PCR; 2.5% to 10%), and Sanger sequencing (10% to 20%). Allele-specific PCR was the fastest method while the others were reported to take at least a few days to weeks for results.
Compared with DNA-based assays, IHC is reported to be routinely used in diagnostic and pathology labs and it has been suggested as a rapid, preliminary testing method that can be confirmed with DNA-based assays.72,73 Additionally, poor quality DNA (i.e., fragmentation during tissue processing) can result in indeterminable results by genetic analysis.66 Løes et al. compared IHC with the VE1 monoclonal antibody, Sanger sequencing, and high-resolution melting assay (real-time PCR).72 Between the DNA-based assays, the limit of detection was lower for real-time PCR (i.e., more sensitive) compared with Sanger sequencing. For direct comparison, 99 samples were analyzed by the 3 methods of which 12 were BRAF V600E positive by all 3. Discordant results were found for 22 of the 99 samples. Nine of the 22 were positive by both Sanger and real-time PCR compared with 12 that were positive by only IHC and 1 that was positive by both real-time PCR and IHC. While both DNA-based methods require DNA isolation beforehand, real-time PCR is reported as being quite rapid taking only a few hours compared with Sanger sequencing which can take a day or longer. IHC has other advantages in that it is possible to prepare multiple samples on a single slide using tissue microarrays and the processing time is similar to that of real-time PCR. Ritterhouse et al. conducted a review of IHC versus other molecular methods for detecting BRAF V600E mutations in colorectal cancer.66 Of the 14 included studies, the sensitivity of IHC varied from 0.71 to 1.0 while the specificity ranged from 0.68 to 1.00. Pyo et al. also conducted a review of the literature for the accuracy of colorectal cancer BRAF V600E testing using VE1 for IHC.68 Eight studies were included that had a pooled sensitivity of 0.94 (95% CI 0.91, 0.96; range 0.71, 1.0) and specificity of 0.96 (95% CI 0.95, 0.98; range 0.65, 1.0). It has been suggested that the differences in sensitivity and specificity may be due to varying methodologies when preparing specimens.66 As a result, it is advised that careful antibody optimization and in-house validation are necessary when using IHC and that uncertain results be verified by molecular methods.
Conclusion
There are various methods for detecting the BRAF V600E mutation in patients with colorectal cancer, each with its benefits and limitations. NGS methods are able to detect multiple genetic mutations in 1 sample, have high sensitivity, and require small amounts of DNA.69 Real-time PCR was reported to be faster and more sensitive compared with Sanger sequencing.67,72 IHC has varying levels of sensitivity and specificity which may be a result of differing specimen preparation methodologies, possible nonspecific staining, and the subjectivity of microscopic interpretation.66,68,72 This section briefly summarized important considerations when choosing a test that is both accurate and rapid to support patient needs and prevent treatment delays.
Pharmacoeconomic Review
Abbreviations
BIA
budget impact analysis
CET + FOLFIRI/IRIN
cetuximab plus FOLFIRI or irinotecan
ENCO + CET
encorafenib plus cetuximab
EQ-5D
EuroQol 5-Dimensions questionnaire
FOLFIRI
folinic acid plus 5-fluorouracil and irinotecan
FOLFOX
folinic acid plus 5-fluorouracil and oxaliplatin
ICER
incremental cost-effectiveness ratio
ITC
indirect treatment comparison
LY
life-year
mCRC
metastatic colorectal cancer
NOC
Notice of Compliance
QALY
quality-adjusted life-year
RDI
relative dose intensity
WTP
willingness to pay
Executive Summary
The executive summary comprises 2 tables (Table 1 and Table 2) and a conclusion.
Item | Description |
|---|---|
Drug product | Encorafenib (Braftovi), oral capsule |
Submitted price | Encorafenib, 75 mg: $50.25 per capsule |
Indication | In combination with cetuximab, for the treatment of patients with metastatic colorectal cancer with a BRAF V600E mutation, as detected by a validated test, after prior therapy |
Health Canada approval status | NOC |
Health Canada review pathway | Standard |
NOC date | March 30, 2021 |
Reimbursement request | As per indication |
Sponsor | Pfizer Canada |
Submission history | Previously reviewed: No |
NOC = Notice of Compliance.
Table 2: Summary of Economic Evaluation
Component | Description |
|---|---|
Type of economic evaluation | Cost-utility analysis Partitioned survival model |
Target population | Adults with BRAF V600E–mutated mCRC who have received 1 prior systemic treatment |
Treatments | Encorafenib + cetuximab (ENCO + CET) |
Comparators | Cetuximab + FOLFIRI or irinotecan (CET + FOLFIRI/IRIN) Folinic acid + 5-fluorouracil + irinotecan (FOLFIRI) Folinic acid + 5-fluorouracil + oxaliplatin (FOLFOX) |
Perspective | Canadian publicly funded health care payer |
Outcomes | QALYs, LYs |
Time horizon | 10 years |
Key data source | ENCO + CET and CET + FOLFIRI/IRIN informed by a randomized controlled trial (BEACON); FOLFIRI informed by indirect comparison based on BEACON and Peeters et al. (2015). FOLFOX was assumed equivalent to FOLFIRI. |
Submitted results | ICER for ENCO + CET vs. FOLFOX: $150,682 per QALY (incremental costs = $88,872; incremental QALYs = 0.59) FOLFIRI and CET + FOLFIRI/IRIN were dominated or extendedly dominated |
Key limitations | There is no direct head-to-head evidence comparing ENCO + CET with the regimens considered most relevant (FOLFIRI and FOLFOX). There is uncertainty associated with the results of the sponsor’s indirect treatment comparison owing to the strength of the evidence. The sponsor compared ENCO + CET with CET + FOLFIRI/IRIN based on evidence from the BEACON trial. In this trial, 42% of patients received cetuximab plus irinotecan; however, drug plan feedback suggested that in jurisdictions where regimens containing cetuximab and irinotecan are funded, this regimen is funded only for the third-line treatment of mCRC in patients who have not responded to an oxaliplatin- or irinotecan-based regimen. The clinical experts consulted by CADTH for this review indicated that treatment is highly individualized and other relevant comparators were not considered. The predicted overall survival and progression-free survival curves for ENCO + CET and CET + FOLFIRI/IRIN in the sponsor’s model lacked face validity and were overestimated, according to the clinical experts consulted on this review. The sponsor incorporated 1-time costs related to adverse events and assumed that quality-of-life effects of adverse events would be captured as part of health state utility values, which is unlikely. The sponsor further assumed that all adverse events would be managed in hospital, which is not reflective of clinical practice. Treatment-specific utilities were included in the sponsor’s model, which does not reflect best practices. The sponsor incorporated different assumptions regarding time on treatment after disease progression. The clinical experts consulted by CADTH indicated that it would be rare for patients to remain on their current treatment past disease progression and that assumptions regarding discontinuation should be the same across treatments. |
CADTH reanalysis results |
|
CET + FOLFIRI/IRIN = cetuximab plus FOLFIRI or irinotecan; ENCO + CET = encorafenib plus cetuximab; FOLFIRI = folinic acid plus 5-fluorouracil plus irinotecan; FOLFOX = folinic acid plus 5-fluorouracil plus oxaliplatin; ICER = incremental cost-effectiveness ratio; mCRC = metastatic colorectal cancer; LY = life-year; QALY = quality-adjusted life-year.
Conclusions
Encorafenib plus cetuximab (ENCO + CET) improves progression-free survival and overall survival relative to investigator’s choice of either irinotecan in combination with cetuximab or folinic acid plus 5-fluorouracil and irinotecan (FOLFIRI) in combination with cetuximab (CET + FOLFIRI/IRIN). However, the long-term effects and comparative effects for ENCO + CET relative to other second- and later-line treatments for metastatic colorectal cancer (mCRC) are uncertain.
CADTH undertook reanalyses to address limitations in the sponsor’s submission, including adopting an alternative parametric distribution for the extrapolation of overall survival and revising the health state utility values. CADTH was unable to address the lack of head-to-head comparative clinical data for ENCO + CET versus folinic acid plus 5-fluorouracil plus oxaliplatin (FOLFOX) and FOLFIRI, the relevance of the blended CET + FOLFIRI/IRIN comparator, and the uncertainty regarding the impact of adverse events.
In CADTH reanalyses, ENCO + CET was more costly and more effective than FOLFIRI, FOLFOX, and CET + FOLFIRI/IRIN, which is aligned with the sponsor’s findings. In sequential analyses, ENCO + CET was associated with an incremental cost-effectiveness ratio (ICER) of $198,779 per quality-adjusted life-year (QALY) relative to FOLFOX, while FOLFIRI and CET + FOLFIRI/IRIN were dominated or extendedly dominated by the other treatments (i.e., would not be considered optimal treatment strategies). The key driver of the ICER is the acquisition costs of encorafenib and cetuximab. Price-reduction analyses suggest that, even with a 99% price reduction for encorafenib, the ICER for ENCO + CET exceeds $50,000 per QALY, owing to the cost of cetuximab. The CADTH base case is associated with some uncertainty, as there were limitations associated with the sponsor’s indirect treatment comparison (ITC) for the overall survival benefit of ENCO + CET relative to FOLFOX and FOLFIRI, and the ICER is sensitive to the hazard ratio for this comparison.
Stakeholder Input Relevant to the Economic Review
This section is a summary of the feedback received from the patient groups, registered clinicians, and drug plans that participated in the CADTH review process.
Patient input from caregivers and patients with colorectal cancer was received from Colorectal Cancer Canada (CCC) and the Colorectal Cancer Resource and Action Network (CCRAN), collected via online surveys, focus groups, and phone interviews. Patients and caregivers described how living with colorectal cancer affects their quality of life, mental health, ability to work, social lives, and daily routines. Symptoms that affect quality of life include pain, fatigue, bloody stool, diarrhea, abdominal cramping, and reduced appetite. Patients reported experience with surgery, radiation therapy, and chemotherapy, and noted that these either only partially controlled or did not control their symptoms. Patients described their experience with treatments including, but not limited to, FOLFOX, FOLFIRI, cetuximab, panitumumab, capecitabine, bevacizumab, pembrolizumab, trifluridine plus tipiracil, and regorafenib. Side effects of treatment were noted to include fatigue, nausea, diarrhea, hand and foot syndrome, and neuropathy. Patients noted that there are limited treatment options available, particularly for those with a BRAF V600E mutation, and expressed a desire for new therapies that would provide a cure, improve their physical condition, improve their quality of life, and extend overall survival. Some noted that a treatment that improved their quality of life would be desirable even if it did not extend overall survival. Participants who had experience with encorafenib reported that oral administration was favourable, and that quality of life was improved with encorafenib, although fatigue, joint pain, muscle weakness, headache, rash, dry skin, itching and burning skin, nausea and gastrointestinal problems, constipation, hair growth or loss, and fever were reported. Some participants noted that side effects with encorafenib were more tolerable compared with those experienced with chemotherapy.
Clinician input was received from the Ontario Health (Cancer Care Ontario) Gastrointestinal Cancer Drug Advisory Committee; a group of Canadian investigators in the BEACON CRC trial, the Canadian Gastrointestinal Oncology Evidence Network (CGOEN) and members of the CCC Medical Advisory Board; and from a survey organized by CCRAN of clinicians who treat patients with mCRC. The prognosis of mCRC patients with a BRAF V600E mutation was described as being significantly worse than for patients without this mutation, with a median survival of fewer than 12 months. The goals of treatment were described as improved survival, reduced disease-related symptoms, improved quality of life or performance status, and delayed disease progression. The standard of care for Canadian patients with BRAF V600E mCRC is chemotherapy (e.g., FOLFOX, FOLFIRI) with or without a biologic drug. Currently available treatments were described as having limited effectiveness in this population. Disease progression is typically assessed by CT every 2 to 3 months to assess response to the treatment, with treatment continued if the disease is stable or shows a response, provided the drug is tolerated and the patient’s clinical status has not deteriorated. Clinicians indicated that encorafenib, in combination with cetuximab, would be considered as second-line treatment after first-line treatment with FOLFOX, FOLFIRI, or with a combination of FOLFIRI and a biologic drug.
CADTH-participating drug plans noted that cetuximab in combination with irinotecan-based regimens are funded in some provinces as third-line treatment after the failure of oxaliplatin- and irinotecan-containing regimens, and that the relevant comparator for encorafenib as second-line treatment may be either FOLFOX or FOLFIRI. Because oral and IV treatments are funded through different programs in some jurisdictions, funding for encorafenib (oral treatment) may differ from cetuximab (IV). Plans also noted that testing for BRAF mutations may not be publicly funded across all jurisdictions.
Several of these concerns were addressed in the sponsor’s model:
Progression-free survival, overall survival, and quality of life were incorporated into the model.
Costs related to the treatment of grade 3 and 4 adverse events that occurred in at least 5% of trial participants were included.
CADTH was unable to address the following concerns raised from stakeholder input:
The model did not include all adverse events noted as being important to patients. The impact of adverse events on health-related quality of life was not explicitly considered.
Economic Review
The current review is for encorafenib (Braftovi) in combination with cetuximab (ENCO + CET) for the treatment of mCRC with a BRAF V600E mutation, after prior therapy.
Economic Evaluation
Summary of Sponsor’s Economic Evaluation
Overview
Encorafenib is indicated in combination with cetuximab for the treatment of patients with BRAF V600E mutation–positive mCRC, after prior therapy.1 The sponsor submitted a cost-utility analysis to assess the cost-effectiveness of ENCO + CET compared with CET + FOLFIRI/IRIN, FOLFOX, and FOLFIRI.2 The modelled population is consistent with the reimbursement request and is aligned with the BEACON trial population, an ongoing phase III randomized controlled trial involving adults with BRAF V600E mutation–positive mCRC.
Encorafenib is available as a 75 mg capsule at a submitted price of $50.25 per capsule. The proposed dosing regimen for encorafenib is 300 mg once daily with cetuximab (induction dose of 400 mg/m2 IV followed by 250 mg/m2 IV every week) until disease progression or unacceptable toxicity.1 The sponsor’s calculated cost (which includes administration costs, relative dose intensity [RDI], and wastage) of ENCO + CET is $11,816 for the first 28-day cycle and $10,936 for subsequent cycles.2 Using similar assumptions, the sponsor estimated the cost per 28-day cycle to be $4,275 for FOLFIRI, $1,600 for FOLFOX, and $8,310 for CET + FOLFIRI/IRIN (initial cycle: $9,036).
The clinical outcomes of interest were QALYs and life-years. The economic analysis was undertaken over a 10-year horizon from the perspective of a publicly funded health care payer. Costs and outcomes were discounted at a rate of 1.5% annually.
Model Structure
The sponsor submitted a partitioned survival model that included 3 health states: progression-free, post-progression, and death (Appendix 3).2 The modelled time cycle was 1 month. The proportion of patients who were progression-free, experienced disease progression, or dead at any time over the model’s time horizon was derived from non-mutually exclusive survival curves. Specifically, all patients entered the model in the progression-free state. The proportion of patients with progressed disease (i.e., in the post-progression state) was derived as the difference between the overall survival and progression-free survival curves. Progression-free survival in the BEACON trial was defined as the time from randomization to the earliest documented date of progression per the Response Evaluation Criteria in Solid Tumors v1.1 criteria or death due to any cause.3
Model Inputs
The modelled cohort’s characteristics were based on the BEACON trial (mean age, 59 years; body surface area, 1.81 m2; mean weight, 70.72 kg). In the BEACON trial, patients in the control group could receive either cetuximab plus irinotecan or CET + FOLFIRI, based on physician’s decision. The proportion of patients who received cetuximab plus irinotecan as part of the CET + FOLFIRI/IRIN comparator was assumed to be 42%, based on data from the BEACON control arm. Data used to inform progression-free survival, overall survival, time to treatment discontinuation, and adverse events for ENCO + CET and CET + FOLFIRI/IRIN were based on the BEACON trial. Overall survival and progression-free survival beyond the BEACON trial follow-up period were extrapolated by fitting parametric survival models to the observed trial data for ENCO + CET and for CET + FOLFIRI/IRIN, with model selection based on statistical fit (Akaike information criterion, Bayesian information criterion, and visual assessment). A log-logistic distribution was adopted for overall survival (Figure 2, Figure 3) and progression-free survival for ENCO + CET and for CET + FOLFIRI/IRIN. The sponsor conducted an ITC4 to derive comparative effectiveness data for overall survival and progression-free survival for ENCO + CET versus FOLFIRI. Due to the lack of available evidence, the sponsor assumed that the hazard ratios for FOLFOX relative to ENCO + CET would be equivalent to that for FOLFIRI versus ENCO + CET.2 For ENCO + CET and for CET + FOLFIRI/IRIN, time to treatment discontinuation was based on all-cause discontinuation (e.g., due to adverse events, disease progression, investigator or patient preference) from the BEACON trial using a gamma distribution and, as such, did not necessarily align with disease progression, while the sponsor assumed that patients would discontinue FOLFOX and FOLFIRI at the time of disease progression (i.e., treatment discontinuation was modelled by progression-free survival). Following treatment discontinuation, patients were assumed to progress to a subsequent antineoplastic treatment (Table 10) or to receive best supportive care comprising non-pharmacologic management. The proportion of patients receiving subsequent treatment following FOLFIRI or FOLFOX was assumed to be equal to that for CET + FOLFIRI/IRIN.
Health state utility values for the progression-free and post-progression health states were based on EuroQol 5-Dimensions (EQ-5D) 5-Levels values (with Canadian tariffs) from the BEACON trial for ENCO + CET and CET + FOLFIRI/IRIN.2 Utilities for FOLFIRI and FOLFOX were assumed to be equivalent to those for CET + FOLFIRI/IRIN. The utility value for the progression-free state was higher for ENCO + CET (0.81) than for CET + FOLFIRI/IRIN, FOLFIRI, and FOLFOX (0.79). For the post-progression health state, the same utility weight (0.76) was used for all comparators. Disutilities related to adverse events were assumed to be captured by treatment-specific health state utility values.
The model included costs related to drug acquisition and administration, adverse events, health care resource use, subsequent treatment, best supportive care, and terminal care preceding death. Drug acquisition costs for the comparator treatments were sourced from Delta PA. RDI was based on the BEACON study for ENCO + CET and CET + FOLFIRI/IRIN, and from the RAISE study5 for FOLFIRI. RDI for FOLFOX was assumed to be equivalent to FOLFIRI. Drug wastage was assumed for IV drugs, and administration costs (i.e., dispensing fee for oral drugs, nurse, and pharmacist costs for IV drugs) were included. Acquisition costs for subsequent treatments were estimated using the monthly costs for that treatment and its distribution (derived from the BEACON study for ENCO + CET and CET + FOLFIRI/IRIN); the costs for FOLFIRI and FOLFOX were assumed equal to CET + FOLFIRI/IRIN. The costs related to any grade 3 and 4 adverse events that occurred in at least 5% of patients were included in the model; all adverse events were assumed to be treated in hospital.6 The incidence of adverse events was obtained from the BEACON trial for ENCO + CET and for CET + FOLFIRI/IRIN, and from the RAISE study7 and the panitumumab monograph8 for FOLFIRI and FOLFOX, respectively. Health care resource use included costs related to medical visits (i.e., medical oncologist,9 oncology nurse10), hospital visits (i.e., inpatient stay, emergency department visit, day visit),6 and examinations and procedures (BRAF testing,11 whole-body CT,6 blood tests12).
Summary of Sponsor’s Economic Evaluation Results
All analyses were run probabilistically (5,000 iterations for the base-case and scenario analyses). The deterministic and probabilistic results were similar. The probabilistic findings are presented subsequently.
Base-Case Results
In the sponsor’s base-case analysis, ENCO + CET was associated with estimated costs of $141,225 and 1.05 QALYs over a 10-year time horizon. Treatment with ENCO + CET was both more costly and produced more QALYs than treatment with FOLFIRI, FOLFOX, and CET + FOLFIRI/IRIN. Based on a sequential analysis, FOLFOX is the preferred treatment option if a decision-maker’s willingness-to-pay (WTP) threshold is below $150,682 per QALY, while ENCO + CET would be the preferred option above this threshold. FOLFIRI was dominated by FOLFOX (more costly and less effective), while CET + FOLFIRI/IRIN was extendedly dominated through FOLFOX and ENCO + CET, indicating this treatment has a higher ICER compared with FOLFOX and the next more effective treatment (i.e., ENCO + CET). At a WTP of $50,000 per QALY, the probability of ENCO + CET being considered the most likely cost-effective intervention was 1%.
The drug costs associated with ENCO + CET were key drivers of the ICER (Appendix 3, Table 11). The majority of QALYs were accrued in the post-progression health state for all treatments (Appendix 3), with an overall incremental QALY gain of 0.59 relative to FOLFOX. At the end of the 10-year time horizon, the percentage of patients estimated to remain alive was 1% for ENCO + CET and CET + FOLFIRI/IRIN and 0% for FOLFIRI and FOLFOX. Additional results from the sponsor’s submitted economic evaluation base case are presented in Appendix 3.
Table 3: Summary of the Sponsor’s Economic Evaluation Results
Drug | Total costs ($) | Total QALYs | ICER ($/QALY) |
|---|---|---|---|
FOLFOX | 52,353 | 0.46 | Reference |
ENCO + CET | 141,225 | 1.05 | 150,682 |
ENCO + CET = encorafenib plus cetuximab; ICER = incremental cost-effectiveness ratio; QALY = quality-adjusted life-year.
Note: Only treatments on the efficiency frontier are reported here. Full results are reported in Appendix 3.
Source: Sponsor’s pharmacoeconomic submission.2
Sensitivity and Scenario Analysis Results
The sponsor provided several scenario and sensitivity analyses, including assuming no drug wastage, excluding RDI, adopting alternative comparator drug prices, varying the dosing regimen for cetuximab, assuming the same utility within health states, adopting an alternative definition of treatment duration, assuming that encorafenib would be used in combination with panitumumab, and adopting a societal perspective (i.e., including productivity costs for patients and caregivers). None had an important effect on the ICER.
CADTH Appraisal of the Sponsor’s Economic Evaluation
CADTH identified several key limitations of the sponsor’s analysis that have notable implications on the economic analysis:
Comparative effectiveness is uncertain. The sponsor’s economic analysis compared the cost-effectiveness of ENCO + CET relative to CET + FOLFIRI/IRIN, FOLFOX, and FOLFIRI. No head-to-head trials of ENCO + CET versus FOLFOX or FOLFIRI were identified. The sponsor conducted an ITC to provide comparative clinical effectiveness data (i.e., overall survival, progression-free survival) to inform the economic model for FOLFIRI compared with ENCO + CET, and the sponsor assumed that the relative effects of FOLFOX and FOLFIRI would be equivalent. The clinical experts consulted by CADTH for this review indicated that the results of the sponsor’s ITCs for FOLFIRI versus ENCO + CET had face validity in that the direction of the effect estimate was consistent with their clinical expectations (i.e., higher overall survival and progression-free survival with ENCO + CET compared with FOLFIRI). However, the CADTH Clinical Report raised several concerns regarding the methodology of the sponsor’s ITCs, concluding that the magnitude of the benefit with ENCO + CET cannot be confirmed with confidence and that the results should be interpreted with caution.
CADTH could not address the lack of direct comparative evidence for ENCO + CET relative to FOLFOX or FOLFIRI. CADTH explored the impact of uncertainty around the estimated overall survival benefit of ENCOR + CET compared with FOLFOX and FOLFIRI in scenario analyses.
Limited generalizability of model comparators. CADTH identified multiple issues that limited the generalizability of modelled comparators to the indicated population. First, the sponsor submitted a comparison of ENCO + CET versus CET + FOLFIRI/IRIN, and versus FOLFOX and FOLFIRI. The sponsor assumed that 42% of patients within the CET + FOLFIRI/IRIN basket would receive cetuximab plus irinotecan, based on the BEACON trial. The clinical experts consulted by CADTH for this review indicated that, while both cetuximab plus irinotecan and CET + FOLFIRI may be used in this setting, second- and later-line treatment is highly individualized and depends in part on the treatment received in the first line. Where multiple comparators are relevant to the funding decision, treatments should be considered on their own, and all comparators should be assessed in a sequential analysis; however, the sponsor did not provide subgroup analyses within the economic evaluation that compared ENCO + CET with cetuximab plus irinotecan and CET + FOLFIRI individually. Second, drug plan feedback suggested that in jurisdictions where regimens containing cetuximab and irinotecan are funded, this regimen is funded only for the third-line treatment of mCRC in patients who have failed an oxaliplatin- or irinotecan-based regimen, limiting the comparability of the modelled CET + FOLFIRI/IRIN strategy to existing Canadian practice for the second-line treatment of mCRC. Third, clinical experts consulted by CADTH indicated that there are additional treatments that would be considered for patients with BRAF V600E mutation–positive mCRC after first-line treatment (Table 8).
CADTH was unable to address this limitation owing to a lack of data. The cost-effectiveness of ENCO + CET relative to other treatments used as second- and later-line therapy for patients with BRAF V600E mutation–positive mCRC is unknown.
Uncertainty regarding long-term extrapolation of overall survival and progression-free survival. The submitted economic model projects survival to 10 years based on short-term data from the BEACON trial for ENCO + CET and CET + FOLFIRI/IRIN, with overall survival and progression-free survival beyond the trial follow-up period extrapolated by fitting parametric survival models to the observed data. The sponsor chose the log-logistic model for ENCO + CET and CET + FOLFIRI/IRIN based on Akaike information criterion and Bayesian information criterion values. The clinical experts consulted by CADTH indicated that the overall survival predicted by the log-logistic distribution lacked face validity for both ENCO + CET and CET + FOLFIRI/IRIN. The clinical experts did not consider it reasonable that 2% and 0.8% of patients on CET + FOLFIRI/IRIN would remain alive at 5 years and 10 years, respectively, from treatment initiation. Similarly, the clinical experts did not consider it reasonable that 4% and 1% of patients on ENCO + CET would remain alive at 5 years and 10 years, respectively.
Clinical experts consulted by CADTH further indicated that the parametric curves chosen for the extrapolation of progression-free survival (log logistic) were optimistic for both ENCO + CET and CET + FOLFIRI/IRIN. The clinical experts indicated that, among patients receiving CET + FOLFIRI/IRIN, few would be expected to remain progression-free at 2 years and none at 5 years. For ENCO + CET, the clinical experts similarly did not consider it reasonable that 0.5% and 0.1% would remain progression-free at 5 and 10 years, respectively. The clinical experts noted that the life-years gained in the post-progression state lack face validity and are likely overestimated for both treatments.
Given the lack of overall survival data beyond the trial period and uncertainty associated with the extrapolated data, the external validity of the sponsor’s predicted survival benefit with ENCO + CET is uncertain. In the CADTH base case, an alternative parametric distribution for overall survival was adopted for ENCO + CET and CET + FOLFIRI/IRIN (Weibull), which was considered by clinical experts to be better aligned with the survival expected for this patient population. No changes were made to the parametric distribution of progression-free survival in the CADTH base case because of a lack of impact on the modelled results.
Inappropriate application of treatment-dependent utilities. The sponsor incorporated treatment-specific utility values for ENCO + CET and CET + FOLFIRI/IRIN for the pre-progression health state based on EQ-5D data from the BEACON trial, with a higher utility applied for ENCO + CET ( + 0.02). As per CADTH guidelines for the conduct of economic evaluations,13 utilities should reflect the health states within the model and should not be specific to treatment. No justification was provided to support the use of the treatment-specific utility values within the progression-free health state. The sponsor further assumed that health state utility values for FOLFIRI and FOLFOX would be the same as for CET + FOLFIRI/IRIN. This was not explored as part of the sponsor-submitted ITC, and the relative magnitude of changes in utility between treatments is unknown. The use of treatment-specific utilities within the model overestimated the incremental QALYs associated with ENCO + CET relative to the comparators.
In CADTH’s reanalysis, equal utility values were applied for each intervention and comparator.
Differential assumptions were made about treatment duration across treatments. The sponsor made different assumptions about the duration of treatment for ENCO + CET and CET + FOLFIRI versus FOLFOX and FOLFIRI. The duration of treatment for ENCO + CET and CET + FOLFIRI/IRIN was based on data from the BEACON trial, in which patients could discontinue treatment owing to disease progression, adverse events, and investigator or patient preference; additionally, patients could continue to receive treatment past disease progression based on investigator opinion. In contrast, patients who received FOLFIRI or FOLFOX were assumed to discontinue treatment at disease progression, and the sponsor assumed that time to treatment discontinuation would be equal to time to disease progression. The sponsor did not justify the use of different assumptions across treatments, and the clinical experts consulted by CADTH for this review indicated it would be rare for patients to remain on their current treatment past disease progression. The clinical experts consulted by CADTH for this review indicated that assumptions about treatment discontinuation should be consistent across treatments.
CADTH could not address this limitation owing to the structure of the sponsor’s model. As such, the time on treatment may be overestimated for ENCO + CET and CET + FOLFIRI/IRIN relative to FOLFOX and FOLFIRI. As the price of ENCO + CET is greater than that of the other treatments, this may overestimate the total costs associated with ENCO + CET.
Uncertainty about the impact of adverse events. The sponsor incorporated costs related to adverse events as a 1-time cost within the first model cycle based on the incidence in the BEACON trial (for ENCO + CET and for CET + FOLFIRI/IRIN), the RAISE study7 (FOLFIRI), and the product monograph for panitumumab8 (FOLFOX). No adjustment or accounting for differences in patient characteristics or treatment durations was considered. The clinical experts consulted by CADTH indicated that adverse events may become more frequent with a longer treatment duration, as the toxicity accumulates; thus, the sponsor underestimated costs due to adverse events. Second, the sponsor assumed that all adverse events would be managed in hospital. The clinical experts consulted by CADTH indicated that most adverse events would be treated in an outpatient setting. The cost of managing adverse events may thus be overestimated. Third, it is unlikely that the impact of adverse events on quality of life would be adequately captured by the EQ-5D values collected as part of the BEACON trial. The EQ-5D lacks specific domains that might be impacted by adverse events, and the EQ-5D was administered at set times during the trial and has a 1-day recall period, which is problematic in assessing the impact of adverse events in clinical trials.14 Additionally, quality-of-life measurements in clinical trials are often missing not at random. Finally, the adverse events included in the model do not capture the range of adverse events deemed to be of special interest to clinicians or noted in the patient input received by CADTH for this review.
CADTH was unable to address this limitation owing to a lack of data and the structure of the sponsor’s model. The impact of adverse events on the ICER is therefore highly uncertain.
Additionally, the following key assumptions were made by the sponsor and have been appraised by CADTH (Table 4).
Table 4: Key Assumptions of the Submitted Economic Evaluation
Sponsor’s key assumption | CADTH comment |
|---|---|
The patients enrolled in the BEACON trial were assumed to be representative of patients in Canada who would be eligible for encorafenib. | Reasonable. The clinical experts consulted by CADTH indicated that the BEACON trial participant characteristics were generally representative of patients with BRAF V600E mutation–positive mCRC. The BEACON trial enrolled patients with an ECOG Performance Status of 0 or 1; however, clinical experts consulted by CADTH indicated that encorafenib may be considered for patients with a performance status > 1 on a case-by-case basis. |
Overall survival, progression-free survival, and time to treatment discontinuation were assumed to be equivalent for FOLFOX and FOLFIRI. | Reasonable. The clinical experts consulted by CADTH indicated the clinical outcomes would be similar between patients who received FOLFOX and FOLFIRI as second- or later-line treatment. |
The proportion of patients who receive subsequent treatment after discontinuation of ENCO + CET or CET + FOLFIRI/IRIN was based on BEACON trial data, while the proportion receiving subsequent treatment after FOLFOX or FOLFIRI was assumed to be equivalent to CET + FOLFIRI/IRIN. | Reasonable. The assumption of equivalence in the proportion of patients receiving subsequent treatment after FOLFOX, FOLFIRI, and CET + FOLFIRI/IRIN was not justified by the sponsor; however, the clinical experts consulted by CADTH indicated that this assumption was reasonable. |
The composition and distribution of the basket of subsequent therapy was based on the BEACON trial. | Uncertain. The clinical experts consulted by CADTH indicated that several treatments included in this basket are not indicated or used in the treatment of mCRC in Canada. Subsequent treatment is highly individualized and depends on the previous treatments received. CADTH was unable to model treatment-specific sequences owing to the structure of the sponsor’s model. Alternative compositions would be expected to impact costs only, as the clinical experts indicated there would be no expected differences in effectiveness among subsequent treatments in this setting. |
Best supportive care was assumed to include medical oncologist and nurse visits, hospital visits, and examinations (CT, blood tests). | Uncertain. The clinical experts consulted by CADTH indicated that best supportive care would be individualized to each patient, with the aim of controlling symptoms, and may be delivered in a hospice or community setting. This may additionally include radiation therapy as part of palliative care. |
Health care resource use was based on the opinion of clinical experts consulted by the sponsor. | Uncertain. The clinical experts consulted by CADTH indicated that the estimated frequency of use of some resources may be overestimated, including emergency department visits and hospital admissions. |
Drug wastage was assumed. | Uncertain. The clinical experts consulted by CADTH indicated that a combination of wastage and vial sharing would likely occur; however, the extent of sharing would likely depend on the practice centre (e.g., greater sharing may occur at larger centres). |
RDI was based on BEACON trial data for ENCO + CET and CET + FOLFIRI/IRIN. The RDI for FOLFIRI was based on the RAISE trial, while the RDI for FOLFOX was assumed to be equivalent to FOLFIRI. | Uncertain. The clinical experts consulted by CADTH noted that the RDI was lower than expected for some drugs and that they would expect RDI to be similar for drugs included in multiple regimens. A reduced RDI may underestimate the cost of treatment. CADTH explored the impact of RDI in scenario analyses assuming equivalent RDI across comparators. |
Cetuximab was assumed to be administered as 250 mg/m2 weekly. | Reasonable. The dosing schedule adopted by the sponsor is aligned with the cetuximab product monograph.15 The clinical experts consulted by CADTH noted that in some centres, cetuximab may be administered as 500 mg/m2 every 2 weeks, which may reduce health care resource use (e.g., administration costs); however, the clinical experts indicated there is no expected difference in adverse events or treatment effectiveness between dosing schedules. The impact of this alternative dosing schedule was explored in scenario analyses. |
CET + FOLFIRI/IRIN = cetuximab plus FOLFIRI or irinotecan; ECOG = Eastern Cooperative Oncology Group; ENCO + CET = encorafenib plus cetuximab; EQ-5D = EuroQol 5-Dimensions questionnaire; FOLFIRI = folinic acid plus 5-fluorouracil plus irinotecan; FOLFOX = folinic acid plus 5-fluorouracil plus oxaliplatin; mCRC = metastatic colorectal cancer; RDI = relative dose intensity.
CADTH Reanalyses of the Economic Evaluation
Several limitations with the sponsor’s submission could not be adequately addressed (i.e., lack of head-to-head comparative clinical data, limited generalizability of model comparators, impact of adverse events). CADTH could not address the lack of comparative clinical data for ENCO + CET versus FOLFOX and FOLFIRI, and, as such, the CADTH base case included only pairwise comparisons of ENCO + CET versus CET + FOLFIRI/IRIN, informed by the BEACON trial.
Base-Case Results
CADTH undertook reanalyses that addressed limitations within the model, as summarized in Table 5. The CADTH base case was derived by making changes in model parameter values and assumptions, in consultation with clinical experts.
Table 5: CADTH Revisions to the Submitted Economic Evaluation
Stepped analysis | Sponsor’s value or assumption | CADTH value or assumption |
|---|---|---|
Corrections to sponsor’s base case | ||
None | ||
Changes to derive the CADTH base case | ||
1. Parametric extrapolation of overall survival | Log-logistic (ENCO + CET; CET + FOLFIRI/IRIN) | Weibull (ENCO + CET; CET + FOLFIRI/IRIN) |
2. Health state utility values | Treatment-specific utility values (pre-progression: ENCO + CET = 0.81, CET + FOLFIRI/IRIN = 0.79; post-progression: [all treatments] = 0.76) | No difference in utilities across treatments (pre-progression: 0.81; post-progression: 0.76) |
CADTH base case | Reanalysis 1 + 2 | |
CET + FOLFIRI/IRIN = cetuximab plus FOLFIRI or irinotecan; ENCO + CET = encorafenib plus cetuximab; FOLFIRI = folinic acid plus 5-fluorouracil plus irinotecan.
CADTH undertook a stepped analysis, incorporating each change proposed in Table 5 into the sponsor’s base case to highlight the impact of each change (Table 6; disaggregated results are presented in Appendix 4, Table 13).
In CADTH’s base case, ENCO + CET was associated with an ICER of $198,779 compared with FOLFOX. FOLFIRI and CET + FOLFIRI/IRIN were dominated or extendedly dominated compared with FOLFOX and ENCO + CET. There is a 0.0% probability that ENCO + CET is optimal compared with FOLFOX at a WTP threshold of $50,000 per QALY. Drug acquisition costs associated with ENCO + CET are key drivers of the ICER. The majority of incremental life-years gained with ENCO + CET are accumulated in the progression-free state (88%); however, it is likely that the model overestimates the life-years gained in the post-progression state for all treatments (Table 13).
CADTH noted that the sponsor’s calculation of QALYs accrued during the trial period was based on the maximum duration of follow-up (randomization until cut-off) in the BEACON trial. When revised to the median treatment duration in BEACON (7.9 months, as indicated in the CADTH Clinical Report) as a proxy for the median duration of follow-up, CADTH determined that 21% of the incremental QALYs gained with ENCO + CET compared with FOLFOX were accrued during the trial period (based on deterministic analyses).
Table 6: Summary of the CADTH Reanalysis Results
Drug | Total costs ($) | Total QALYs | ICER vs. FOLFOX ($/QALY) | Sequential ICER ($/QALY) |
|---|---|---|---|---|
FOLFOX | 50,704 | 0.44 | Reference | Reference |
FOLFIRI | 58,641 | 0.44 | Dominated | Dominated |
CET + FOLFIRI/IRIN | 79,660 | 0.55 | 264,971 | Extended dominance |
ENCO + CET | 129,065 | 0.83 | 198,779 | 198,779 |
CET + FOLFIRI/IRIN = cetuximab plus FOLFIRI or irinotecan; ENCO + CET = encorafenib plus cetuximab; FOLFIRI = folinic acid plus 5-fluorouracil plus irinotecan; FOLFOX = folinic acid plus 5-fluorouracil plus oxaliplatin; ICER = incremental cost-effectiveness ratio; QALY = quality-adjusted life-year.
Note: Reanalyses are based on publicly available prices of the comparator treatments.
Scenario Analysis Results
A price-reduction analysis was performed based on the sponsor’s base case and CADTH’s reanalysis (Table 7).
For all of the price reductions explored for encorafenib (as the drug under review), including if encorafenib is offered at no cost, ENCO + CET would not be considered cost-effective compared with FOLFOX at a WTP threshold of $50,000 per QALY, owing to the cost of cetuximab (Table 7). FOLFIRI and CET + FOLFIRI/IRIN were dominated or subject to extended dominance in all price-reduction scenarios.
Table 7: CADTH Price-Reduction Analyses
Analysis | ICERs for ENCO + CET vs. FOLFOXa | |
|---|---|---|
Price reduction | Sponsor base caseb ($) | CADTH reanalysisb ($) |
No price reduction | 150,682 | 198,779 |
10% | 144,896 | 192,246 |
20% | 139,083 | 185,804 |
30% | 133,172 | 175,185 |
40% | 128,763 | 166,069 |
50% | 122,297 | 159,413 |
60% | 117,300 | 150,113 |
70% | 110,715 | 141,720 |
80% | 104,764 | 131,806 |
90% | 99,907 | 124,668 |
99.9% | 93,695 | 115,998 |
CET + FOLFIRI/IRIN = cetuximab plus FOLFIRI or irinotecan; ENCO + CET = encorafenib plus cetuximab; FOLFIRI = folinic acid plus 5-fluorouracil plus irinotecan; FOLFOX = folinic acid plus 5-fluorouracil plus oxaliplatin; ICER = incremental cost-effectiveness ratio.
Note: Based on the publicly available prices of the comparator treatments.
aFOLFIRI and CET + FOLFIRI/IRIN were dominated or extendedly dominated in all price-reduction analyses.
bIncludes treatments on the efficiency frontier. Results reflect the comparison of ENCO + CET vs. FOLFOX.
Several scenario and sensitivity analyses were conducted on the CADTH base case (Table 14).
A key scenario explored the cost-effectiveness of ENCO + CET compared with CET + FOLFIRI/IRIN on the basis of data from the BEACON trial. In this scenario, ENCO + CET was associated with an ICER of $173,393 per QALY gained relative to CET + FOLFIRI. An additional price-reduction scenario, reflecting a pairwise comparison of ENCO + CET and CET + FOLFIRI/IRIN, is presented in Appendix 4 (Table 16). Similar to the CADTH base case, for all price reductions explored for encorafenib (as the drug under review), including if encorafenib is offered at no cost, ENCO + CET would not be considered a cost-effective treatment strategy at a WTP threshold of $50,000 per QALY, owing to the cost of cetuximab.
Additional scenario analyses explored the impact of the following model parameters and assumptions: the proportion of patients who receive FOLFIRI or irinotecan as part of CET + FOLFIRI/IRIN; the cetuximab dosing regimen; health state utility values; RDI; and the distribution of treatments included as part of subsequent treatment. In most scenarios, the ICER for ENCO + CET versus FOLFOX increased relative to the CADTH base case (Table 15). There was no important difference in the ICER when all patients in the CET + FOLFIRI/IRIN comparator arm were assumed to receive FOLFIRI (or irinotecan).
Issues for Consideration
The BEACON trial involved a group that received binimetinib in addition to encorafenib and cetuximab. Binimetinib is currently under review by Health Canada for the treatment of unresectable or metastatic melanoma in patients with a BRAF V600E mutation. CADTH-participating drug plans noted there may be indication creep of binimetinib use in mCRC patients with a BRAF V600E mutation.
CADTH-participating drug plans noted the potential for indication creep of encorafenib use in mCRC patients with other BRAF mutations (e.g., V600K). The clinical experts consulted by CADTH for this review indicated that encorafenib is not likely to be used in patients with mutations other than V600E at this time. The V600E mutation accounts for about 90% of mutations to the BRAF gene in colorectal cancer. Patients with other BRAF mutations were outside the scope of the current review and the cost-effectiveness of encorafenib in patients with other BRAF mutations is unknown.
Encorafenib is administered orally but must be used in combination with cetuximab infusion, while all comparator regimens are infusion-based. Encorafenib is not expected to increase additional health care resources to manage infusion-related reaction; however, oral and IV oncology regimens may be reimbursed through different programs in some jurisdictions, which could pose additional accessibility and financial barriers to accessing this treatment.
Clinical experts consulted by CADTH indicated that encorafenib may be considered for use in combination with panitumumab, under the assumption of the clinical equivalence of cetuximab and panitumumab. The use of panitumumab instead of cetuximab in combination with encorafenib may be less resource-intensive, as it is administered less frequently than cetuximab.
Overall Conclusions
ENCO + CET improves progression-free survival and overall survival relative to treatment with CET + FOLFIRI/IRIN. However, its long-term effects and its comparative effects relative to other second- and later-line treatments for mCRC are uncertain.
CADTH undertook reanalyses to address limitations in the sponsor’s submission, including adopting an alternative parametric distribution for the extrapolation of overall survival for ENCO + CET and CET + FOLFIRI/IRIN, and revising the health state utility values. CADTH was unable to address: the lack of head-to-head comparative clinical data for ENCO + CET versus FOLFOX and FOLFIRI, the limited generalizability of the model comparator for CET + FOLFIRI/IRIN, and the uncertainty regarding the impact of adverse events.
Based on these revisions, ENCO + CET is not cost-effective at a WTP threshold of $50,000 per QALY, which is aligned with the sponsor’s submitted results. Specifically, in the CADTH reanalysis, ENCO + CET was associated with an ICER of $198,779 per QALY gained compared with FOLFOX, with 21% of the QALYs gained with ENCO + CET accrued during the trial treatment period. These findings were driven by the acquisition costs of encorafenib and cetuximab. In the CADTH base case, ENCO + CET was the optimal treatment strategy at a WTP threshold of $50,000 per QALY in 0% of simulations. Price-reduction analyses suggest that, even with a 99% price reduction for encorafenib, the ICER for ENCO + CET exceeds $50,000 per QALY, owing to the cost of cetuximab.
In light of uncertainty about the magnitude of the overall survival benefit of ENCOR + CET relative to FOLFIRI and FOLFOX, CADTH conducted additional scenario analyses to explore the pairwise cost-effectiveness of ENCO + CET compared with CET + FOLFIRI/IRIN on the basis of data from the BEACON trial, and conducted an exploratory analysis to explore the effect of the uncertainty associated with the comparative overall survival. In the scenario analyses, when compared only with CET + FOLFIRI/IRIN, the ICER for ENCO + CET was $173,393, and ENCO + CET was the optimal treatment in 0.2% of replications. CADTH conducted additional exploratory analyses across a range of hazard ratios for overall survival for ENCO + CET compared with FOLFIRI, finding that the ICER was highly sensitive to the hazard ratio for the overall survival benefit for ENCO + CET compared with FOLFIRI. As such, the CADTH base-case results should be interpreted with caution.
Overall, it is highly unlikely that encorafenib would be considered a cost-effective use of Canadian health care resources, at a $50,000 per QALY threshold, even if a substantial price reduction were obtained.
References
1.Braftovi (encorafenib): 75 mg oral capsules [product monograph]. Kirkland (QC): Pfizer Canada ULC; 2020 Mar 30.
2.Pharmacoeconomic evaluation [internal sponsor's report]. In: Drug Reimbursement Review sponsor submission: Braftovi (encorafenib), 75 mg oral capsules. Kirkland (QC): Pfizer Canada ULC; 2021 Jan 08.
3.Clinical Study Report: ARRAY-818-302. The BEACON CRC Study: a multicenter, randomized, open-label, 3-arm phase 3 study of encorafenib + cetuximab plus or minus binimetinib vs. irinotecan/cetuximab or infusional 5-fluorouracil (5-FU)/folinic acid (FA)/irinotecan (FOLFIRI)/cetuximab with a safety lead-in of encorafenib + binimetinib + cetuximab in patients with BRAF V600E-mutant metastatic colorectal cancer [internal sponsor's report]. Boulder (CO): Array BioPharma Inc.; 2019 Sep 12.
4.Indirect treatment comparaison of Encorafenib in combination with cetuximab or panitumumab, for the treatment of patients with metastatic colorectal cancer (mCRC) with a BRAFV600E mutation, after prior therapy, version 1.0 [internal sponsor's report]. In: Drug Reimbursement Review sponsor submission: Braftovi (encorafenib), 75 mg oral capsules. Kirkland (QC): Pfizer Canada ULC; 2020 Dec 15.
5.Tabernero J, Yoshino T, Cohn AL, et al. Ramucirumab versus placebo in combination with second-line FOLFIRI in patients with metastatic colorectal carcinoma that progressed during or after first-line therapy with bevacizumab, oxaliplatin, and a fluoropyrimidine (RAISE): a randomised, double-blind, multicentre, phase 3 study. Lancet Oncol. 2015;16(5):499-508. PubMed
6.Ontario Case Costing Initiative (OCCI). Toronto (ON): Ontario Health and Long-Term Care; 2017: https://data.ontario.ca/dataset/ontario-case-costing-initiative-occi. Accessed 2021 Apr 13.
7.Obermannova R, Van Cutsem E, Yoshino T, et al. Subgroup analysis in RAISE: a randomized, double-blind phase III study of irinotecan, folinic acid, and 5-fluorouracil (FOLFIRI) plus ramucirumab or placebo in patients with metastatic colorectal carcinoma progression. Ann Oncol. 2016;27(11):2082-2090. PubMed
8.Vectibix (panitumumab): 100, 400 mg (20 mg/mL) sterile solution for infusion [product monograph]. Mississauga (ON): Amgen Canada Inc; 2017 Apr 05.
9.Schedule of benefits for physician services under the Health Insurance Act: effective April 1, 2020. Toronto (ON): Ontario Ministry of Health; 2020: https://www.health.gov.on.ca/en/pro/programs/ohip/sob/physserv/sob_master20200306.pdf. Accessed 2021 Apr 13.
10.Collective Agreement. Ontario Nurses Association. Toronto (ON): Ontario Nurses Association; 2020 Mar 31: https://www.ona.org/your-contracts-rights/find-your-contract/. Accessed 2021 Mar 01.
11.Institut national d’excellence en santé et en services sociaux. Analyse combinée des gènes KRAS-NRAS-BRAF par séquençage de nouvelle génération pour le traitement du cancer colorectal métastatique. Montreal (QC): INESSS; 2018: https://www.inesss.qc.ca/fileadmin/doc/INESSS/Analyse_biomedicale/Mars_2018/INESSS_Avis_Analyse-combinee-genes-KRAS-NRAS-BRAF.pdf. Accessed 2021 Mar 23.
12.Schedule of benefits for laboratory services: effective July 1, 2020. Toronto (ON): Ontario Ministry of Health; 2020: https://www.health.gov.on.ca/en/pro/programs/ohip/sob/lab/lab_mn2020.pdf. Accessed 2021 Apr 13.
13.Guidelines for the economic evaluation of health technologies: Canada. 4th ed. Ottawa (ON): CADTH; 2017: https://www.cadth.ca/dv/guidelines-economic-evaluation-health-technologies-canada-4th-edition. Accessed 2021 Apr 13.
14.Bansback N, Sun H, Guh DP, et al. Impact of the recall period on measuring health utilities for acute events. Health Econ. 2008;17(12):1413-1419. PubMed
15.Erbitux (cetuximab): 2 mg/mL, 50 mL and 100 mL vials for intravenous injection [product monograph]. Toronto (ON): Eli Lilly Canada Inc; 2018 Jan 10: https://pdf.hres.ca/dpd_pm/00043071.PDF. Accessed 2021 Apr 14.
16.Drug Reimbursement Review sponsor submission: Braftovi (encorafenib), 75 mg oral capsules [internal sponsor's package]. Kirkland (QC): Pfizer Canada ULC; 2021 Jan 08.
17.Alberta Health Care Insurance Plan: medical price list as of 31 March 2020. Edmonton (AB): Government of Alberta; 2020: https://open.alberta.ca/dataset/30add047-29c2-4fc7-83b5-a8ab78605cdd/resource/48d0dd0b-bb33-478d-a85c-85a86d4555ad/download/health-somb-medical-price-list-2020-03.pdf. Accessed 2021 Apr 13.
18.Ontario Ministry of Health, Ontario Ministry of Long-Term Care. Ontario drug benefit formulary/comparative drug index. 2020; https://www.formulary.health.gov.on.ca/formulary/. Accessed 2021 Apr 13.
19.Exceptional Access Program (EAP). Toronto (ON): Ontario Ministry of Health; Ontario Ministry of Long-Term Care; 2020: https://www.health.gov.on.ca/en/pro/programs/drugs/odbf/odbf_except_access.aspx. Accessed 2021 Apr 13.
20.Shi Y, Wan X, Tan C, Li J, Peng L. Model-Based Cost-Effectiveness Analysis of Panitumumab Plus FOLFIRI for the Second-Line Treatment of Patients with Wild-Type Ras Metastatic Colorectal Cancer. Adv Ther. 2020;37(2):847-859. PubMed
21.Budget Impact Analysis [internal sponsor's report]. In: Drug Reimbursement Review sponsor submission: Braftovi (encorafenib), 75 mg oral capsules. Kirkland (QC): Pfizer Canada ULC; 2021 Jan 08.
22.Table 13-10-0111-01 Number and rates of new cases of primary cancer, by cancer type, age group and sex. Ottawa (ON): Statistics Canada; 2017: https://www150.statcan.gc.ca/t1/tbl1/en/cv.action?pid=1310011101. Accessed 2020 Mar 01.
23.Panitumumab (Vectibix) for left-sided metastatic colorectal cancer. (CADTH pan-Canadian Oncology Drug Review: final clinical guidance report). Ottawa (ON): CADTH; 2018: https://www.cadth.ca/sites/default/files/pcodr/pcodr_panitumumab_vectibix_ls_mcrc_fn_cgr.pdf. Accessed 2021 Mar 23.
24.Kopetz S, Desai J, Chan E, et al. Phase II Pilot Study of Vemurafenib in Patients With Metastatic BRAF-Mutated Colorectal Cancer. J Clin Oncol. 2015;33(34):4032-4038. PubMed
25.Canadian Cancer Society. Colorectal cancer statistics. 2020; https://www.cancer.ca/en/cancer-information/cancer-type/colorectal/statistics/?region=on. Accessed 2021 Mar 01.
Appendix 1: Cost Comparison Table
The comparators presented in the following table have been deemed to be appropriate based on feedback from the clinical expert(s). Comparators may be recommended (appropriate) practice or actual practice. Existing Product Listing Agreements are not reflected in the table and as such, the table may not represent the actual costs to public drug plans.
Table 8: CADTH Cost Comparison Table for the Second or Later-Line of Treatment Metastatic Colorectal Cancer
Treatment | Strength/ concentration | Form | Pricea ($) | Recommended dosage | Daily cost ($)a | Average |
|---|---|---|---|---|---|---|
Encorafenib (ENCO) | 75 mg | Tablet | 50.2500b | 300 mg daily | 201 | 5,628 |
Cetuximab (CET) | 2 mg/mL | 50 mL vial | 378.7500 | Initial: 400 mg/m2; maintenance: 250 mg/m2 weekly | 271 | 7,575 |
ENCO + CET | 472 | 13,203 | ||||
FOLFIRI | ||||||
Irinotecan | 20 mg/mL | 2 mL vial 5 mL vial 25 mL vial | 208.3400 520.8500 2,604.2500 | 180 mg/m2 every 2 weeks | 126 | 3,542 |
Folic acid (Leucovorin) | 10 mg/mL | 5 mL vial 50 mL vial | 68.9430c 350.1900 | 400 mg/m2 every 2 weeks | 36 | 1,014 |
5-fluorouracil bolus | 50 mg/mL | 100 mL vial | 160.9000 | 400 mg/m2 every 2 weeks | 2 | 47 |
5-fluorouracil infusion | 50 mg/mL | 100 mL vial | 160.9000 | 2,400 mg/m2 every 2 weeks | 10 | 280 |
FOLFIRI | 174 | 4,882 | ||||
FOLFOX | ||||||
Oxaliplatin | 5 mg/ mL | 10 mL vial 20 mL vial 40 mL vial | 36.2700 72.5400 145.0800 | 85 mg/m2 every 2 weeks | 8 | 218 |
Folic acid (Leucovorin) | 10 mg/mL | 5 mL vial 50 mL vial | 68.9430c 350.1900 | 400 mg/m2 every 2 weeks | 36 | 1,014 |
5-fluorouracil bolus | 50 mg/mL | 100 mL vial | 160.9000 | 400 mg/m2 every 2 weeks | 2 | 47 |
5-fluorouracil infusion | 50 mg/mL | 100 mL vial | 160.9000 | 2,400 mg/m2 every 2 weeks | 10 | 280 |
FOLFOX | 56 | 1,558 | ||||
CAPOX | ||||||
Capecitabine | 150 mg 500 mg | Tablet Tablet | 0.4575d 1.5250d | 2000 mg/m2 on days 1 to 14 per 3-week cycle | 8 | 228 |
Oxaliplatin | 5 mg/ mL | 10 mL vial 20 mL vial 40 mL vial | 36.2700 72.5400 145.0800 | 130 mg/m2 once per 3-week cycle | 9 | 242 |
CAPOX | 17 | 470 | ||||
FOLFIRI plus cetuximab | ||||||
Irinotecan | 20 mg/mL | 2 mL vial 5 mL vial 25 mL vial | 208.3400 520.8500 2,604.2500 | 180 mg/m2 every 2 weeks | 126 | 3,542 |
Folic acid (Leucovorin) | 10 mg/mL | 5 mL vial 50 mL vial | 68.9430c 350.1900 | 400 mg/m2 every 2 weeks | 36 | 1,014 |
5-fluorouracil bolus | 50 mg/mL | 100 mL vial | 160.9000 | 400 mg/m2 every 2 weeks | 2 | 47 |
5-fluorouracil infusion | 50 mg/mL | 100 mL vial | 160.9000 | 2,400 mg/m2 every 2 weeks | 10 | 280 |
Cetuximab | 2 mg/mL | 50 mL vial | 378.7500 | Initial: 400 mg/m2; maintenance: 250 mg/m2 weekly | 271 | 7,575 |
FOLFIRI plus cetuximab | 445 | 12,457 | ||||
FOLFIRI plus panitumumab | ||||||
Irinotecan | 20 mg/mL | 2 mL vial 5 mL vial 25 mL vial | 208.3400 520.8500 2,604.2500 | 180 mg/m2 every 2 weeks | 126 | 3,542 |
Folic acid (Leucovorin) | 10 mg/mL | 5 mL vial 50 mL vial | 68.9430c 350.1900 | 400 mg/m2 every 2 weeks | 36 | 1,014 |
5-fluorouracil bolus | 50 mg/mL | 100 mL vial | 160.9000 | 400 mg/m2 every 2 weeks | 2 | 47 |
5-fluorouracil infusion | 50 mg/mL | 100 mL vial | 160.9000 | 2,400 mg/m2 every 2 weeks | 10 | 280 |
Panitumumab (Vectibix) | 20 mg/mL | 5 mL vial 20 mL vial | 641.8200 2,567.2800 | 6 mg/kg every 2 weeks | 183 | 5,135 |
FOLFIRI plus panitumumab | 358 | 10,017 | ||||
FOLFOX plus cetuximab | ||||||
Oxaliplatin | 5 mg/ mL | 10 mL vial 20 mL vial 40 mL vial | 36.2700 72.5400 145.0800 | 85 mg/m2 every 2 weeks | 8 | 218 |
Folic acid (Leucovorin) | 10 mg/mL | 5 mL vial 50 mL vial | 68.9430c 350.1900 | 400 mg/m2 every 2 weeks | 36 | 1,014 |
5-fluorouracil bolus | 50 mg/mL | 100 mL vial | 160.9000 | 400 mg/m2 every 2 weeks | 2 | 47 |
5-fluorouracil infusion | 50 mg/mL | 100 mL vial | 160.9000 | 2,400 mg/m2 every 2 weeks | 10 | 280 |
Cetuximab | 2 mg/mL | 50 mL vial | 378.7500 | Initial: 400 mg/m2; maintenance: 250 mg/m2 weekly | 271 | 7,575 |
FOLFOX plus cetuximab | 326 | 9,133 | ||||
FOLFOX plus panitumumab | ||||||
Oxaliplatin | 5 mg/mL | 10 mL vial 20 mL vial 40 mL vial | 36.2700 72.5400 145.0800 | 85 mg/m2 every 2 weeks | 8 | 218 |
Folic acid (Leucovorin) | 10 mg/mL | 50 mL vial | 689.4300c | 400 mg/m2 every 2 weeks | 36 | 1,014 |
5-fluorouracil bolus | 50 mg/mL | 100 mL vial | 160.9000 | 400 mg/m2 every 2 weeks | 2 | 47 |
5-fluorouracil infusion | 50 mg/mL | 100 mL vial | 160.9000 | 2,400 mg/m2 every 2 weeks | 10 | 280 |
Panitumumab (Vectibix) | 20 mg/mL | 5 mL vial 20 mL vial | 641.8200 2,567.2800 | 6 mg/kg every 2 weeks | 183 | 5,135 |
FOLFOX plus panitumumab | 239 | 6,693 | ||||
Cetuximab plus irinotecan | ||||||
Cetuximab | 2 mg/mL | 50 mL vial | 378.7500 | Initial: 400 mg/m2; maintenance: 250 mg/m2 weekly | 271 | 7,575 |
Irinotecan | 20 mg/mL | 2 mL vial 5 mL vial 25 mL vial | 208.3400 520.8500 2604.2500 | 180 mg/m2 every 2 weeks | 126 | 3,542 |
Cetuximab plus irinotecan | 397 | 11,117 | ||||
Panitumumab plus irinotecan | ||||||
Panitumumab (Vectibix) | 20 mg/mL | 5 mL vial 20 mL vial | 641.8200 2,567.2800 | 6 mg/kg every 2 weeks | 183 | 5,135 |
Irinotecan | 20 mg/mL | 2 mL vial 5 mL vial 25 mL vial | 208.3400 520.8500 2,604.2500 | 180 mg/m2 every 2 weeks | 126 | 3,542 |
Panitumumab plus irinotecan | 310 | 8,676 | ||||
Single-drug regimens | ||||||
Irinotecan | 20 mg/mL | 2 mL vial 5 mL vial 25 mL vial | 208.3400 520.8500 2,604.2500 | 125 mg/m2 per week for 4 weeks, followed by 2-week break | 30 | 883 |
Trifluridine/tipiracil (Lonsurf) | 15 mg/6.14 mg 20 mg/8.19 mg | Tablet | 76.2500 | 35 mg/m2 twice daily on days 1 to 5 and days 8 to 12 of each 28-day cycle | 109 | 2,288 |
Regorafenib (Stivarga) | 40 mg | Tablet | 72.6200e | 160 mg once daily for 3 weeks per 28-day cycle | 290 | 6,100 |
CAPOX = capecitabine plus oxaliplatin; ENCO + CET = encorafenib plus cetuximab; FOLFIRI = folinic acid plus 5-fluorouracil plus irinotecan; FOLFOX = folinic acid plus 5-fluorouracil plus oxaliplatin.
Note: All prices are from the Delta IQVIA database (accessed February 2021), unless otherwise indicated, and do not include dispensing fees. Recommended dosage is based on Cancer Care Ontario monographs, unless otherwise indicated. For dosing that depends on weight or body surface area, CADTH assumed 70.72 kg or 1.81 m2 on the basis of the BEACON trial. Total cost estimates per regimen are based on the cheapest combination of the component drugs, with wastage considered for single-use vials.
aIf initial and maintenance dosage differs, cost is based on the maintenance dose, unless otherwise stated. Costs for 21-day treatment regimen have been pro-rated to a 28-day period.
bSponsor submitted price.16
cAlberta Health Care Insurance Plan.17
dOntario Drug Benefit Formulary.18
eOntario Exceptional Access Program.19
Appendix 2: Submission Quality
Description | Yes/No | Comments |
|---|---|---|
Population is relevant, with no critical intervention missing, and no relevant outcome missing. | No | Despite the inclusion of some relevant comparators, the CET + FOLFIRI/IRIN comparator was a pooled strategy of 2 chemotherapy regimens, several other treatments used in the second- and later-line treatment setting were missing from the model. |
The model has been adequately programmed and has sufficient face validity . | No | The model was adequately programmed, but had limited face validity with respect to the method used for estimating the duration on treatment, as different assumptions were incorporated for ENCO + CET and CET + FOLFIRI/IRIN compared with FOLFIRI and FOLFOX. |
Model structure is adequate for decision problem. | Yes | No comment. |
Data incorporation into the model has been done adequately (e.g., parameters for probabilistic analysis). | Yes | No comment. |
Parameter and structural uncertainty were adequately assessed; analyses were adequate to inform the decision problem. | Yes | No comment. |
The submission was well organized and complete; the information was easy to locate (clear and transparent reporting; technical documentation available in enough details). | Yes | The report was generally well organized and succinct; however, there was a lack of detail in some sections. For example, in scenario 4, utility values were assumed to be the same within health states, however the sponsor did not state which were incorporated. |
Appendix 3: Additional Information on the Submitted Economic Evaluation
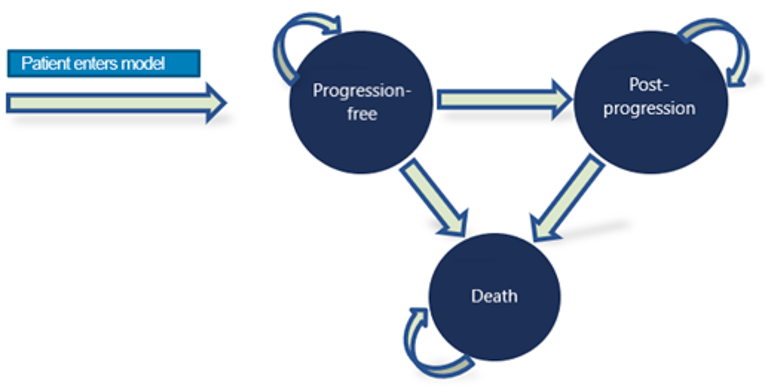
Figure 2: Kaplan–Meier Plot From the BEACON Trial and Extrapolations for Overall Survival — ENCO + CET
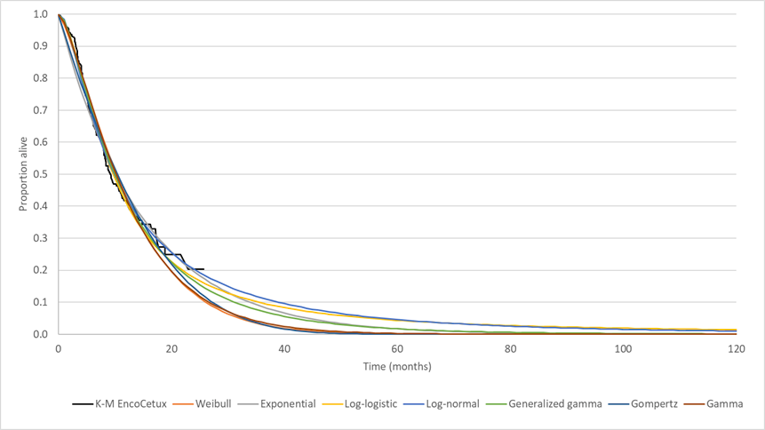
ENCO + CET = encorafenib plus cetuximab; EncoCetux = encorafenib plus cetuximab; K-M = Kaplan–Meier.
Source: Sponsor’s pharmacoeconomic submission.2
Figure 3: Kaplan–Meier Plot From the BEACON Trial and Extrapolations for Overall Survival — CET + FOLFIRI/IRIN
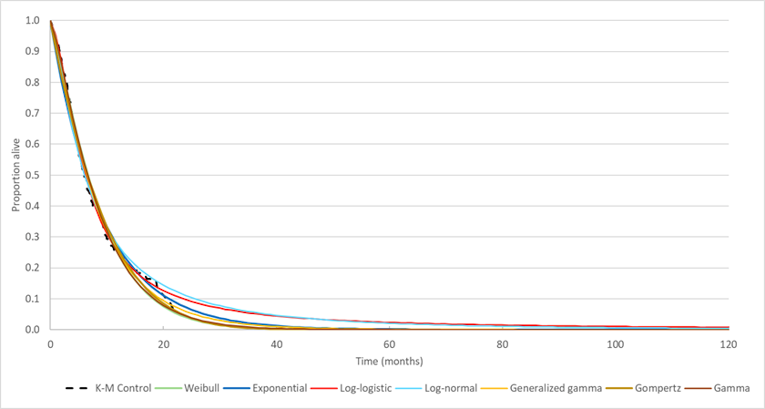
CET + FOLFIRI/IRIN = cetuximab plus FOLFIRI or irinotecan; FOLFIRI = folinic acid plus 5-fluorouracil plus irinotecan; K-M = Kaplan–Meier.
Source: Sponsor’s pharmacoeconomic submission.2
Table 10: Subsequent Treatments Received After Discontinuation of Primary Model Comparator Treatment
Subsequent treatment | |||
|---|---|---|---|
Atezolizumab | Dabrafenib | Irinotecan | Ramucirumab |
Bevacizumab | Durvalumab | Mitomycin | Regorafenib |
Capecitabine | Eribulin | Nivolumab | TAS 102 |
Carboplatin | Fluorouracil | Olaparib | Trametinib |
Cetuximab | Folic acid | Oxaliplatin | Vemurafenib |
Cisplatin | Folinic acid | Panitumumab | Vinorelbine |
Cobimetinib | Ipilimumab | Pembrolizumab | |
CET + FOLFIRI/IRIN = cetuximab plus FOLFIRI or irinotecan; ENCO + CET = encorafenib plus cetuximab; FOLFIRI = folinic acid plus 5-fluorouracil plus irinotecan; FOLFOX = folinic acid plus 5-fluorouracil plus oxaliplatin.
aAmong those who progress to subsequent treatment (vs. best supportive care). Subsequent treatment was assumed to be received by 45.0% of patients who received ENCO + CET, and by 47.1% of patients who received FOLFOX, FOLFIRI, or CET + FOLFIRI/IRIN. The distribution of treatments following discontinuation of primary treatment was based on the BEACON trial for ENCO + CET and CET + FOLFOX/IRIN based on number of patient-days for each molecule divided by total number of patient-days for patients on subsequent treatment. Distributions for FOLFOX and FOLFIRI were assumed to be equal to that for CET + FOLFOX/IRIN.2
Detailed Results of the Sponsor’s Base Case
Table 11: Disaggregated Summary of the Sponsor’s Economic Evaluation Results
Treatment | Component | Value | Incremental (vs. FOLFOX) | Incremental (sequential) |
|---|---|---|---|---|
Discounted LYs | ||||
FOLFOX | Progression-free | 0.24 | NA | NA |
Post-progression | 0.35 | NA | NA | |
Total | 0.59 | NA | NA | |
FOLFIRI | Progression-free | 0.24 | 0 | NA |
Post-progression | 0.35 | 0 | NA | |
Total | 0.59 | 0 | NA | |
CET + FOLFIRI/IRIN | Progression-free | 0.25 | 0.01 | 0.01 |
Post-progression | 0.66 | 0.31 | 0.31 | |
Total | 0.91 | 0.32 | 0.32 | |
ENCO + CET | Progression-free | 0.57 | 0.33 | 0.32 |
Post-progression | 0.77 | 0.42 | 0.11 | |
Total | 1.34 | 0.75 | 0.43 | |
Discounted QALYs | ||||
FOLFOX | Progression-free | 0.19 | NA | NA |
Post-progression | 0.27 | NA | NA | |
Total | 0.46 | NA | NA | |
FOLFIRI | Progression-free | 0.19 | 0 | NA |
Post-progression | 0.27 | 0 | NA | |
Total | 0.46 | 0 | NA | |
CET + FOLFIRI/IRIN | Progression-free | 0.20 | 0.01 | 0.01 |
Post-progression | 0.50 | 0.23 | 0.23 | |
Total | 0.70 | 0.24 | 0.24 | |
ENCO + CET | Progression-free | 0.47 | 0.28 | 0.27 |
Post-progression | 0.58 | 0.31 | 0.08 | |
Total | 1.05 | 0.59 | 0.35 | |
Discounted costs ($) | ||||
FOLFOX | Primary treatment | 9,918 | NA | NA |
Subsequent treatment | 15,509 | NA | NA | |
Best supportive care | 5,240 | NA | NA | |
AEs | 4,607 | NA | NA | |
Terminal care | 17,078 | NA | NA | |
Total | 52,353 | NA | NA | |
FOLFIRI | Primary treatment | 18,207 | 8,289 | NA |
Subsequent treatment | 15,546 | 37 | NA | |
Best supportive care | 5,231 | −9 | NA | |
AEs | 4,280 | −327 | NA | |
Terminal care | 17,078 | 0 | NA | |
Total | 60,341 | 7,988 | NA | |
CET + FOLFIRI/IRIN | Primary treatment | 30,522 | 20,604 | 12,315 |
Subsequent treatment | 30,000 | 14,491 | 14,454 | |
Best supportive care | 10,093 | 4,853 | 4,862 | |
AEs | 3,859 | −748 | −421 | |
Terminal care | 16,896 | −182 | −182 | |
Total | 91,369 | 39,016 | 31,028 | |
ENCO + CET | Primary treatment | 88,808 | 78,890 | 58,286 |
Subsequent treatment | 22,317 | 6,808 | −7683 | |
Best supportive care | 12,118 | 6,878 | 2,025 | |
AEs | 1,282 | −3325 | −2577 | |
Terminal care | 16,699 | −379 | −197 | |
Total | 141,225 | 88,872 | 49,856 | |
ICER vs. reference ($/QALY) | Sequential ICER ($/QALY) | |||
FOLFOX | — | — | ||
FOLFIRI | Dominated by reference | Dominated by reference | ||
CET + FOLFIRI/IRIN | $160,178 | Extendedly dominated by FOLFOX and ENCO + CET | ||
ENCO + CET | $150,682 | $150,682 vs. FOLFOX | ||
AE = adverse event; CET + FOLFIRI/IRIN = cetuximab plus FOLFIRI or irinotecan; ENCO + CET = encorafenib plus cetuximab; FOLFIRI = folinic acid plus 5-fluorouracil plus irinotecan; FOLFOX = folinic acid plus 5-fluorouracil plus oxaliplatin; ICER = incremental cost-effectiveness ratio; NA = not applicable; LY = life-year; QALY = quality-adjusted life-year; vs. = versus.
Appendix 4: Additional Details on the CADTH Reanalyses and Sensitivity Analyses of the Economic Evaluation
Detailed Results of CADTH Base Case
Table 12: Summary of the Stepped Analysis of the CADTH Reanalysis Results
Stepped analysis | Drug | Total costs ($) | Total QALYs | Sequential ICER ($/QALYs) |
|---|---|---|---|---|
Sponsor’s base case | FOLFOX | 52,353 | 0.46 | Ref. |
FOLFIRI | 60,341 | 0.46 | Dominated | |
CET + FOLFIRI/IRIN | 91,369 | 0.70 | Extended dominance | |
ENCO + CET | 141,225 | 1.05 | 150,682 | |
CADTH reanalysis 1 | FOLFOX | 50,829 | 0.44 | Ref. |
FOLFIRI | 58,724 | 0.44 | Dominated | |
CET + FOLFIRI/IRIN | 79,683 | 0.55 | Extended dominance | |
ENCO + CET | 129,158 | 0.83 | 201,792 | |
CADTH reanalysis 2 | FOLFOX | 52,425 | 0.46 | Ref. |
FOLFIRI | 60,312 | 0.46 | Dominated | |
CET + FOLFIRI/IRIN | 91,476 | 0.71 | Extended dominance | |
ENCO + CET | 140,964 | 1.05 | 151,735 | |
CADTH base case (1 + 2) | FOLFOX | 50,704 | 0.44 | Ref. |
FOLFIRI | 58,641 | 0.44 | Dominated | |
CET + FOLFIRI/IRIN | 79,660 | 0.55 | Extended dominance | |
ENCO + CET | 129,065 | 0.83 | 198,779 |
CET + FOLFIRI/IRIN = cetuximab plus FOLFIRI or irinotecan; ENCO + CET = encorafenib plus cetuximab; FOLFIRI = folinic acid plus 5-fluorouracil plus irinotecan; FOLFOX = folinic acid plus 5-fluorouracil plus oxaliplatin; ICER = incremental cost-effectiveness ratio; QALY = quality-adjusted life-year; Ref. = reference.
Note: Reanalyses are based on publicly available prices of the comparator treatments.
Table 13: Disaggregated Summary of CADTH’s Economic Evaluation Results
Treatment | Component | Value | Incremental (vs. FOLFOX) | Incremental (sequential) |
|---|---|---|---|---|
Discounted LYs | ||||
FOLFOX | Progression-free | 0.24 | NA | NA |
Post-progression | 0.33 | NA | NA | |
Total | 0.55 | NA | NA | |
FOLFIRI | Progression-free | 0.24 | 0.00 | NA |
Post-progression | 0.33 | 0.00 | NA | |
Total | 0.55 | 0.00 | NA | |
CET + FOLFIRI/IRIN | Progression-free | 0.25 | 0.01 | 0.01 |
Post-progression | 0.46 | 0.13 | 0.13 | |
Total | 0.71 | 0.16 | 0.16 | |
ENCO + CET | Progression-free | 0.55 | 0.31 | 0.30 |
Post-progression | 0.50 | 0.17 | 0.04 | |
Total | 1.06 | 0.51 | 0.35 | |
Discounted QALYsa | ||||
FOLFOX | Progression-free | 0.19 | NA | NA |
Post-progression | 0.25 | NA | NA | |
Within trial period | 0.30 | NA | NA | |
After trial period | 0.10 | NA | NA | |
Total | 0.44 | NA | NA | |
FOLFIRI | Progression-free | 0.19 | 0.00 | NA |
Post-progression | 0.25 | 0.00 | NA | |
Within trial period | 0.30 | 0.00 | NA | |
After trial period | 0.10 | 0.00 | NA | |
Total | 0.44 | 0.00 | NA | |
CET + | Progression-free | 0.20 | 0.01 | 0.01 |
Post-progression | 0.35 | 0.10 | 0.10 | |
Within trial period | 0.34 | 0.04 | 0.04 | |
After trial period | 0.21 | 0.11 | 0.11 | |
Total | 0.55 | 0.11 | 0.11 | |
ENCO + CET | Progression-free | 0.45 | 0.26 | 0.25 |
Post-progression | 0.38 | 0.13 | 0.03 | |
Within trial period | 0.39 | 0.09 | 0.05 | |
After trial period | 0.43 | 0.33 | 0.22 | |
Total | 0.83 | 0.39 | 0.28 | |
Discounted costs ($) | ||||
FOLFOX | Primary treatment | 9,899 | NA | NA |
Subsequent treatment | 14,281 | NA | NA | |
Best supportive care | 4,818 | NA | NA | |
AEs | 4,607 | NA | NA | |
Terminal care | 17,098 | NA | NA | |
Total | 50,704 | NA | NA | |
FOLFIRI | Primary treatment | 18,144 | 8,245 | NA |
Subsequent treatment | 14,320 | 39 | NA | |
Best supportive care | 4,807 | −11 | NA | |
AEs | 4,273 | −334 | NA | |
Terminal care | 17,098 | 0 | NA | |
Total | 58,641 | 7,937 | NA | |
CET + FOLFIRI/IRIN | Primary treatment | 30,549 | 20,650 | 12,405 |
Subsequent treatment | 21,069 | 6,788 | 6,749 | |
Best supportive care | 7,110 | 2,292 | 2,303 | |
AEs | 3,865 | −742 | −408 | |
Terminal care | 17,067 | −31 | −31 | |
Total | 79,660 | 28,956 | 21,019 | |
ENCO + CET | Primary treatment | 88,577 | 78,678 | 58,028 |
Subsequent treatment | 14,391 | 110 | −6,678 | |
Best supportive care | 7,824 | 3,006 | 714 | |
AEs | 1,285 | −3,322 | −2,580 | |
Terminal care | 16,988 | −110 | −79 | |
Total | 129,065 | 78,361 | 49,405 | |
ICER vs. reference ($/QALY) | Sequential ICER ($/QALY) | |||
FOLFOX | Reference | Reference | ||
FOLFIRI | Dominated by reference | Dominated by reference | ||
CET + FOLFIRI/IRIN | $264,971 | Extendedly dominated by FOLFOX and ENCO + CET | ||
ENCO + CET | $198,779 | $198,779 vs. FOLFOX | ||
AE = adverse event; CET + FOLFIRI/IRIN = cetuximab plus FOLFIRI or irinotecan; ENCO + CET = encorafenib plus cetuximab; FOLFIRI = folinic acid plus 5-fluorouracil plus irinotecan; FOLFOX = folinic acid plus 5-fluorouracil plus oxaliplatin; ICER = incremental cost-effectiveness ratio; LY = life-year; QALY = quality-adjusted life-year; vs. = versus.
Note: Reanalyses are based on publicly available prices of the comparator treatments.
aQALYs within the trial period are based on a treatment duration of 6 months and reflect deterministic values.
Scenario Analyses
Table 14: CADTH Scenario Analyses
Parameter | CADTH base case | CADTH scenario |
|---|---|---|
1. Comparators | CET + FOLFIRI/IRIN, FOLFOX, FOLFIRI | CET + FOLFIRI/IRIN |
2. Comparators | In the CET + FOLFIRI/IRIN comparison group, 58% of patients are assumed to receive cetuximab plus FOLFIRI | 100% of patients assumed to receive cetuximab + FOLFIRI |
3. Comparators | As above | 100% of patients assumed to receive cetuximab + irinotecan |
4. Cetuximab regimen | 250 mg/m2 weekly | 500 mg/m2 every 2 weeks |
5. Health state utility values | Pre-progression: 0.81 Post-progression: 0.76 | Pre-progression: 0.76a Post-progression:0.64a |
6. Relative dose intensity | Based on the BEACON trial for ENCO + CET and for CET + FOLRIRI/IRIN; FOLFIRI and FOLFOX assumed equal to CET + FOLFIRI/IRIN | Relative dose intensity assumed to be 100% for all drugs |
7. Distribution of treatments included in the subsequent treatment basket | Based on the BEACON trial for ENCO + CET and for CET + FOLRIRI/IRIN; FOLFIRI and FOLFOX assumed equal to CET + FOLFIRI/IRIN | Assumed to be equal across all comparators |
aShi 2020.20
Table 15: Probabilistic Results of CADTH’s Scenario Analyses
Drug | Total costs ($) | Total QALYs | Sequential ICER ($/QALY) |
|---|---|---|---|
Scenario 1: Pairwise comparison of ENCO + CET vs. CET + FOLFIRI/IRIN comparators | |||
CET + FOLFIRI/IRIN | 79,660 | 0.55 | Ref. |
ENCO + CET | 129,065 | 0.83 | 173,393 |
Scenario 2: All patients within the CET + FOLFIRI/IRIN comparator assumed to receive cetuximab plus FOLFIRI | |||
FOLFOX | 50,791 | 0.45 | Ref. |
FOLFIRI | 58,718 | 0.45 | Dominated |
CET + FOLFIRI/IRIN | 80,936 | 0.56 | Extendedly dominated |
ENCO + CET | 129,053 | 0.83 | 204,629 |
Scenario 3: All patients within the CET + FOLFIRI/IRIN comparator assumed to receive cetuximab plus IRIN | |||
FOLFOX | 50,500 | 0.44 | Ref. |
FOLFIRI | 58,358 | 0.44 | Dominated |
CET + FOLFIRI/IRIN | 77,976 | 0.55 | Extendedly dominated |
ENCO + CET | 129,069 | 0.83 | 201,984 |
Scenario 4: Alternative cetuximab dosing regimen (500 mg/m2 every 2 weeks) | |||
FOLFOX | 50,489 | 0.44 | Ref. |
FOLFIRI | 58,485 | 0.44 | Dominated |
CET + FOLFIRI/IRIN | 79,763 | 0.55 | Extendedly dominated |
ENCO + CET | 127,157 | 0.82 | 198,635 |
Scenario 5: Alternative health state utility values | |||
FOLFOX | 50,856 | 0.39 | Ref. |
FOLFIRI | 58,714 | 0.39 | Dominated |
CET + FOLFIRI/IRIN | 79,660 | 0.49 | Extendedly dominated |
ENCO + CET | 129,142 | 0.74 | 222,958 |
Scenario 6: Relative dose intensity assumed to be 100% for all drugs | |||
FOLFOX | 51,715 | 0.44 | Ref. |
FOLFIRI | 61,749 | 0.44 | Dominated |
CET + FOLFIRI/IRIN | 90,133 | 0.55 | Extendedly dominated |
ENCO + CET | 142,270 | 0.83 | 236,187 |
Scenario 7: Equivalent distribution of subsequent treatments across model comparators | |||
FOLFOX | 50,759 | 0.44 | Ref. |
FOLFIRI | 58,707 | 0.44 | Dominated |
CET + FOLFIRI/IRIN | 79,609 | 0.55 | Extendedly dominated |
ENCO + CET | 136,270 | 0.83 | 219,640 |
CET + FOLFIRI/IRIN = cetuximab plus FOLFIRI or irinotecan; ENCO + CET = encorafenib plus cetuximab; FOLFIRI = folinic acid plus 5-fluorouracil plus irinotecan; FOLFOX = folinic acid plus 5-fluorouracil plus oxaliplatin; ICER = incremental cost-effectiveness ratio; IRIN = irinotecan; QALY = quality-adjusted life-year; Ref. = reference; vs. = versus.
Note: Reanalyses are based on publicly available prices of the comparator treatments.
Table 16: CADTH Price-Reduction Analyses
Scenario | ICERs for ENCO + CET vs. CET + FOLFIRI/IRIN | |
|---|---|---|
Price reduction | Sponsor base casea | CADTH reanalysis |
No price reduction | $142,446 | $173,393 |
10% | $133,514 | $165,145 |
20% | $124,253 | $154,667 |
30% | $113,502 | $140,011 |
40% | $105,920 | $128,575 |
50% | $95,428 | $118,784 |
60% | $86,359 | $104,652 |
70% | $74,835 | $94,171 |
80% | $65,752 | $80,278 |
90% | $57,028 | $70,319 |
99.9% | $47,023 | $57,381 |
CET + FOLFIRI/IRIN = cetuximab plus FOLFIRI or irinotecan; ENCO + CET = encorafenib plus cetuximab; FOLFIRI = folinic acid plus 5-fluorouracil plus irinotecan; ICER = incremental cost-effectiveness ratio; vs. = versus.
Note: Based on the publicly available prices of the comparator treatments.
aFor the sponsor’s base case, only the pairwise comparison against CET + FOLFIRI/IRIN is reported for comparability to the CADTH scenario reanalysis.
Table 17: CADTH Price-Reduction Analyses — Two-Way Reduction of Encorafenib and Cetuximab (Option 1)
Scenario | ICERs for ENCO + CET vs. FOLFOXa | |
|---|---|---|
Price reductionb | Sponsor base case ($) | CADTH reanalysis ($) |
No price reductionc | 150,682 vs. FOLFOX | 198,779 vs. FOLFOX |
10% | 86,603 vs. FOLFOX | 104,874 vs. FOLFOX |
20% | 79,532 vs. FOLFOX | 93,501 vs. FOLFOX |
30% | 72,380 vs. FOLFOX | 82,264 vs. FOLFOX |
40% | 65,064 vs. FOLFOX | 71,413 vs. FOLFOX |
50% | 57,189 vs. FOLFOX | 59,491 vs. FOLFOX |
60% | 49,936 vs. FOLFOX | 49,529 vs. FOLFOX |
ENCO + CET = encorafenib plus cetuximab; FOLFIRI = folinic acid plus 5-fluorouracil plus irinotecan; FOLFOX = folinic acid plus 5-fluorouracil plus oxaliplatin; ICER = incremental cost-effectiveness ratio.
aFOLFIRI and CET + FOLFIRI/IRIN were dominated or extendedly dominated in all price-reduction analyses.
bPrice reduction applied to cetuximab, assuming that encorafenib was offered for free (i.e., $0).
cResults assuming the full price of encorafenib and cetuximab.
Table 18: CADTH Price-Reduction Analyses — Two-Way Reduction of Encorafenib and Cetuximab (Option 2)
Scenario | ICERs for ENCO + CET vs. FOLFOXa | |
|---|---|---|
Price reductionb | Sponsor base case ($) | CADTH reanalysis (50% reduction in cetuximab price held constant) ($) |
No price reductionc | 143,461 vs. FOLFOX | 189,253 vs. FOLFOX |
0% | 110,502 vs. FOLFOX | 139,443 vs. FOLFOX |
10% | 105,309 vs. FOLFOX | 131,594 vs. FOLFOX |
20% | 100,116 vs. FOLFOX | 123,746 vs. FOLFOX |
30% | 94,922 vs. FOLFOX | 115,898 vs. FOLFOX |
40% | 89,729 vs. FOLFOX | 108,050 vs. FOLFOX |
50% | 84,536 vs. FOLFOX | 100,201 vs. FOLFOX |
60% | 79,343 vs. FOLFOX | 92,353 vs. FOLFOX |
70% | 74,150 vs. FOLFOX | 84,505 vs. FOLFOX |
80% | 68,956 vs. FOLFOX | 76,657 vs. FOLFOX |
90% | 63,763 vs. FOLFOX | 68,808 vs. FOLFOX |
99.9% | 58,622 vs. FOLFOX | 61,038 vs. FOLFOX |
CET + FOLFIRI/IRIN = cetuximab plus FOLFIRI or irinotecan; ENCO + CET = encorafenib plus cetuximab; FOLFIRI = folinic acid plus 5-fluorouracil plus irinotecan; FOLFOX = folinic acid plus 5-fluorouracil plus oxaliplatin; ICER = incremental cost-effectiveness ratio; vs. = versus.
Note: Results are presented are based on the deterministic ICER, which was similar to (though slightly lower than) the probabilistic ICER.
aFOLFIRI and CET + FOLFIRI/IRIN were dominated or extendedly dominated in all price-reduction analyses.
bPrice reduction applied to encorafenib, assuming that the price of cetuximab was reduced by 50%.
cResults assuming the full price of encorafenib and cetuximab.
Exploratory Scenario Analyses
Exploratory analyses were undertaken to further explore the cost-effectiveness of ENCO + CET relative to FOLFOX and FOLFIRI. In the CADTH base case, the relative effectiveness of FOLFIRI compared with ENCO + CET was based on sponsor-provided ITCs (the sponsor assumed that the effectiveness of FOLFOX was equivalent to that of FOLFIRI). While CADTH reviewers concluded that the direction of effect was most likely accurate (i.e., favouring treatment with ENCO + CET), the magnitude of effect of ENCO + CET on overall survival is uncertain given the identified limitations with the sponsor’s ITCs (see Clinical Review). As such, CADTH explored the cost-effectiveness of ENCO + CET relative to FOLFOX, FOLFIRI, and CET + FOLFIRI/IRIN across a range of hazard ratios for ENCO + CET versus FOLFIRI (Table 19). CADTH maintained the sponsor’s assumption that the effectiveness of FOLFIRI and FOLFOX would be equal, as clinical experts consulted by CADTH indicated that this was reasonable.
Table 19: Exploratory Scenario Analyses
Overall survival, HR for ENCO + CET vs. FOLFIRI | ||||
|---|---|---|---|---|
HRa,b | Treatment | Total cost ($) | Total QALYs | Sequential ICER ($/QALY) |
0.9 | FOLFOX | 74,204 | 0.75 | Reference |
CET + FOLFIRI/IRIN | 79,648 | 0.55 | Dominated | |
FOLFIRI | 82,262 | 0.75 | Dominated | |
ENCO + CET | 129,063 | 0.83 | 698,289 | |
0.8 | FOLFOX | 69,393 | 0.69 | Reference |
FOLFIRI | 77,302 | 0.69 | Dominated | |
CET + FOLFIRI/IRIN | 79,696 | 0.55 | Dominated | |
ENCO + CET | 129,013 | 0.83 | 422,264 | |
0.7 | FOLFOX | 64,462 | 0.62 | Reference |
FOLFIRI | 72,405 | 0.62 | Dominated | |
CET + FOLFIRI/IRIN | 79,676 | 0.55 | Dominated | |
ENCO + CET | 129,221 | 0.83 | 311,763 | |
0.6 | FOLFOX | 59,121 | 0.55 | Reference |
FOLFIRI | 67,084 | 0.55 | Dominated | |
CET + FOLFIRI/IRIN | 79,780 | 0.55 | Extendedly dominated | |
ENCO + CET | 128,923 | 0.83 | 254,016 | |
0.5 | FOLFOX | 53,820 | 0.48 | Reference |
FOLFIRI | 61,853 | 0.48 | Dominated | |
FOLFIRI or IRIN + CET | 79,590 | 0.55 | Extendedly dominated | |
ENCO + CET | 129,081 | 0.83 | 217,234 | |
0.4 | FOLFOX | 48,200 | 0.41 | Reference |
FOLFIRI | 56,104 | 0.41 | Dominated | |
CET + FOLFIRI/IRIN | 79,744 | 0.55 | Extendedly dominated | |
ENCO + CET | 129,117 | 0.83 | 191,518 | |
| FOLFOX | 47,574 | 0.40 | Reference |
FOLFIRI | 55,528 | 0.40 | Dominated | |
CET + FOLFIRI/IRIN | 79,615 | 0.55 | Extendedly dominated | |
ENCO + CET | 129,184 | 0.83 | 191,024 | |
0.2 | FOLFOX | 5,846 | 0.24 | Reference |
FOLFIRI | 43,294 | 0.24 | Dominated | |
CET + FOLFIRI/IRIN | 79,626 | 0.55 | 142,494 | |
ENCO + CET | 129,156 | 0.83 | 179,474 | |
CET + FOLFIRI/IRIN = cetuximab plus FOLFIRI or irinotecan; ENCO + CET = encorafenib plus cetuximab; FOLFIRI = folinic acid plus 5-fluorouracil plus irinotecan; FOLFOX = folinic acid plus 5-fluorouracil plus oxaliplatin; HR = hazard ratio; ICER = incremental cost-effectiveness ratio; IRIN = irinotecan; QALY = quality-adjusted life-year.
Note: Reanalyses are based on publicly available prices of the comparator treatments.
aThe HR for FOLFOX was assumed to be equivalent to that for FOLFIRI.
bAssumed to be fixed.
Appendix 5: Submitted Budget Impact Analysis and CADTH Appraisal
Table 20: CADTH Summary Findings From the Sponsor’s Budget Impact Analysis
Key Takeaways of the BIA |
|---|
CADTH identified the following key limitations with the sponsor’s analysis. Notably, the number of patients eligible for encorafenib is uncertain, not all relevant comparators were included, the uptake of ENCO + CET is uncertain, and the costs related to subsequent antineoplastic treatment are uncertain. CADTH reanalysis included: updating the incidence of colorectal cancer, changing the proportion of patients who undergo BRAF mutation testing, revising the uptake of ENCO + CET, and excluding the cost of subsequent antineoplastic drugs. Based on the CADTH reanalyses, the budget impact from the introduction of ENCO + CET is estimated to be $36,667,223 in year 1, $37,146,754 in year 2, and $39,847,772 in year 3, with a 3-year total budget impact of $113,661,749 when considering drug costs only. The estimated budge impact is sensitive to the proportion of colorectal cancer cases that are metastatic (mCRC), and the proportion of mCRC cases that carry the BRAF V600E mutation. |
Summary of Sponsor’s BIA
The sponsor submitted a budget impact analysis21 (BIA) estimating the incremental budget impact of reimbursing encorafenib for use in combination with cetuximab (ENCO + CET) for the treatment of mCRC with a BRAF V600E mutation after at least 1 line of prior systemic therapy. The BIA was undertaken from the perspective of the Canadian public drug plans over a 3-year time horizon, and the sponsor’s pan-Canadian estimates reflect the aggregated results from provincial budgets (excluding Quebec), as well as the Non-Insured Health Benefits Program. Key inputs to the BIA are documented in Table 21.
The sponsor estimated the current population using an epidemiologic approach, with an estimated incidence of colorectal cancer of 0.0725%22 used to determine the total number of eligible patients. The sponsor assumed that 55% of CRC cases are metastatic, and that 74.3% of patients would undergo BRAF mutation testing in the reference scenario, with 10% of those tested carrying the V600E mutation. The sponsor assumed that, if encorafenib becomes reimbursed publicly, 95% of patients with metastatic CRC would undergo BRAF mutation testing, thus increasing the number of eligible patients. The sponsor assumed that 100% of patients would be eligible for public drug coverage for all jurisdictions, with the exception of Ontario, Nova Scotia, New Brunswick, Newfoundland, PEI, and Yukon where the sponsor assumed 70%. The sponsor assumed population growth of approximately 1.01% per year.
The sponsor’s submission considered a reference scenario in which patients received FOLFOX or FOLFIRI and a new-drug scenario in which encorafenib was reimbursed and patients received ENCO + CET. In the sponsor’s base case, costs related to drug acquisition for ENCO + CET, FOLFIRI, and FOLFOX were captured, as well as dispensing fees, administration, markup, and subsequent drug costs, and drug costs were adjusted for RDI on the basis of the BEACON trial. The cost of ENCO was based on the sponsors submitted price ($50.25 per tablet; 28-day cost of ENCO + CET including administration, markup, and dispensing fees: $12,760 per patient for the first cycle, $11,880 for subsequent 28-day cycles). Drug costs for cetuximab and for the components of FOLFOX and FOLFIRI were obtained from Delta PA. The uptake of ENCO + CET was assumed to be || in year 1, || in year 2, and || in year 3. A scenario analysis was conducted from a health care payer perspective, which additionally included costs related to grade3 3 adverse events and the cost of BRAF mutation testing.
Table 21: Summary of Key Model Parameters
Parameter | Sponsor’s estimate |
|---|---|
Target population | |
Incidence of colorectal cancer Proportion metastatic Proportion who undergo BRAF mutation testing Proportion with a BRAF V600E mutation Proportion who receive second-line treatment | 0.0725%22 55%23 Reference scenario: 74.3%; new-drug scenario: 95%a 10%24 80%a |
Number of patients eligible for drug under review Reference scenario, year 1 / year 2 / year 3 New-drug scenario, year 1 / year 2 / year 3 | . 489 / 495 / 502 625 / 633 / 641 |
Market uptake (3 years) | |
Uptake (reference scenario) FOLFIRI, year 1 / year 2 / year 3 FOLFOX, year 1 / year 2 / year 3 | . 42% / 42% / 42% 58% / 58% / 58% |
Uptake (new-drug scenario) ENCO + CET FOLFIRI FOLFOX | .
|
Cost of treatment (per patient, per 28-day cycleb) | |
ENCO + CET FOLFIRI FOLFOX | Initial cycle: $12,760; subsequent cycles: $11,880 $4,644 $1,739 |
ENCO + CET = encorafenib plus cetuximab: FOLFIRI = folinic acid plus 5-fluorouracil plus irinotecan; FOLFOX = folinic acid plus 5-fluorouracil plus oxaliplatin.
aSponsor assumption.
bIncludes drug acquisition, administration, markup, and dispensing costs, adjusted for relative dose intensity.
Summary of the Sponsor’s BIA Results
The sponsor estimated the net 3-year budget impact of reimbursing ENCO + CET for the treatment of mCRC with a BRAF V600E mutation to be $97,946,588 (year 1: $28,593,438; year 2: $32,615,152; year 3: $36,737,998). Under a broader health care payer perspective (i.e., the inclusion of adverse event costs and BRAF testing), the estimated 3-year budget impact of reimbursing ENCO + CET was $96,968,277 (year 1: $28,472,321; year 2: $32,290,820; year 3: $36,205,137).
CADTH Appraisal of the Sponsor’s BIA
CADTH identified several key limitations to the sponsor’s analysis that have notable implications on the results of the BIA:
Uncertainty regarding the number of patients eligible to receive encorafenib. In deriving the target population, the sponsor assumed an incidence of colorectal cancer of 0.0725%, based data from 2017.22 The Canadian Cancer Society estimates 26,900 newly diagnosed cases of colorectal cancer in 2020,25 reflecting an incidence of 0.0875% among Canadian adults.
The sponsor assumed that 74.3% of patients with metastatic CRC would undergo BRAF mutation testing and that 10% of these patients would carry a BRAF V600E mutation. The clinical experts consulted by CADTH for this review indicated that, in clinical practice, about 85% to 90% of patients currently undergo BRAF mutation testing and that this would not be expected to increase if encorafenib were reimbursed. Clinician input received for this review indicated that up to 15% of patients with CRC may have a BRAF V600E mutation.
o In reanalyses, CADTH revised the incidence of colorectal cancer as 0.0875% to reflect 2020 data and assumed that 90% of patients with mCRC would undergo BRAF mutation testing in both the reference and new-drug scenario. In scenario analyses, CADTH explored the impact of the frequency of BRAF V600E mutations.
Not all relevant comparators are included. The sponsor’s BIA assumed that, in the reference scenario, all eligible patients with mCRC with a BRAF V600E mutation would receive FOLFOX and FOLFIRI. As noted in Appendix 1, there are multiple additional treatments that may be used as second- and later-line treatment in this population. Further, the sponsor’s assumptions about relevant treatment comparators differed between the submitted economic evaluation and the BIA. While CET + FOLFIRI/IRIN was included as a comparator in the sponsor’s economic evaluation, in the BIA the sponsor assumed that no patients would receive cetuximab in combination with either FOLFOX or irinotecan. The clinical experts consulted by CADTH for this review indicated that second-line treatment would be patient-specific and depends in part on what treatments were received in the first line; and that a proportion of patients may receive cetuximab in combination with FOLFOX or irinotecan in this setting. The clinical experts consulted by CADTH indicated this treatment is relevant in the second- and later-line treatment of mCRC in Canada; however, it should be noted that cetuximab plus irinotecan is currently funded only for third-line treatment.
CADTH was unable to address this limitation owing to a lack of data about the market share of cetuximab plus FOLFOX or cetuximab plus irinotecan.
Uncertainty regarding the uptake of encorafenib. The sponsor assumed that the market uptake of encorafenib would be
||in year 1, | in year 2, and | in year 3. The clinical expert consulted by CADTH indicated that up to 85%–90% of eligible patients may receive encorafenib each year owing to a lack of other targeted therapies.In CADTH reanalysis, the uptake of encorafenib was assumed to be 85% in year 1 and year 2, and 90% in year 3.
Uncertainty regarding subsequent treatments after discontinuation of primary treatment. The sponsor assumed that, for FOLFOX and FOLFIRI, 47% of patients would receive subsequent antineoplastic drug treatment after discontinuation of primary treatment. For ENCO + CET, the sponsor assumed that 45% of patients would go on to receive subsequent antineoplastic drug treatment. The sponsor assumed these distributions on the basis of the BEACON trial (for ENCO + CET) and assumed that the distribution for FOLFOX and FOLFIRI would be equivalent to that observed in the BEACON trial for the CET + FOLFIRI/IRIN control arm. This assumption of equivalence was not justified. Further, clinical experts consulted by CADTH indicated that several treatments included by the sponsor in the basket of subsequent treatments are not indicated or used in the treatment of mCRC in Canada.
The cost of subsequent treatment was removed from CADTH reanalysis. The impact of this change was explored in scenario analyses.
CADTH Reanalyses of the BIA
CADTH revised the sponsor’s base case by changing the incidence of colorectal cancer, changing the proportion of patients who undergo BRAF mutation testing, revising the uptake of ENCO + CET, and excluding the cost of subsequent antineoplastic drugs (Table 22).
Table 22: CADTH Revisions to the Submitted Budget Impact Analysis
Stepped analysis | Sponsor’s value or assumption | CADTH value or assumption |
|---|---|---|
Corrections to sponsor’s base case | ||
None | ||
Changes to derive the CADTH base case | ||
1. Incidence of colorectal cancer | The incidence of colorectal cancer was assumed to be 0.0725%22 | Revised to reflect the estimated incidence of colorectal cancer among adults in Canada in 202025 (0.0875%) |
2. Proportion of mCRC patients who undergo BRAF mutation testing | 74.3% of patients were assumed to undergo BRAF mutation testing in the reference scenario; 95% of patients were assumed to undergo testing in the new-drug scenario | 90% of patients were assumed to undergo BRAF mutation testing in both the reference and new-drug scenario |
3. Uptake of ENCO + CET | Assumed to be | Assumed to be 85% in year 1 and 2, and 90% in year 3 |
4. Subsequent antineoplastic drug costs | Costs related to subsequent antineoplastic treatments included | Costs related to subsequent antineoplastic treatments excluded |
CADTH base case | 1 + 2 + 3 + 4 | |
ENCO + CET = encorafenib plus cetuximab; mCRC = metastatic colorectal cancer.
The results of the CADTH stepwise reanalysis are presented in summary format in Table 23 (a more detailed breakdown is presented in Table 24).
In the CADTH reanalysis, the 3-year budget impact of reimbursing ENCO + CET is estimated to be $113,661,749 ($121,248,543 including dispensing fees and markup).
Table 23: Summary of the CADTH Reanalyses of the BIA
Scenario | Three-year total | |
|---|---|---|
Drug costs only ($) | Total costsa ($) | |
Submitted base case | 94,690,088 | 97,946,588 |
CADTH reanalysis 1 | 114,325,822 | 118,257,618 |
CADTH reanalysis 2 | 86,970,933 | 83,068,710 |
CADTH reanalysis 3 | 102,257,510 | 105,174,849 |
CADTH reanalysis 4 | 94,690,088 | 101,378,888 |
CADTH base case | 113,661,749 | 121,248,543 |
BIA = budget impact analysis.
Note: Reanalyses are based on publicly available prices of the comparator treatments.
aIncludes administration, dispensing, and markup costs, and costs related to subsequent antineoplastic drug treatment (except in CADTH reanalysis 3 and the CADTH base case).
CADTH also conducted additional scenario analyses to address remaining uncertainty, using the CADTH base case. Results are provided in Table 24.
Assuming a 20% higher proportion of CRC cases that are metastatic (66%).
Assuming that 15% of mCRC patients who undergo BRAF mutation testing carry the BRAF V600E mutation.
Assuming that 74.3% of patients undergo BRAF testing in the reference scenario (90% in new-drug scenario).
Adopting an alternative cetuximab dosing regimen (500 mg/m2 every 2 weeks).
RDI assumed to be 100% for all drugs.
Including the cost of subsequent antineoplastic drug treatments after discontinuation of the primary treatment.
Adopting a health care payer perspective (i.e., inclusion of costs related to BRAF mutation testing and the treatment of adverse events [3 grade 3]).
Table 24: Detailed Breakdown of the CADTH Reanalyses of the BIA
Stepped analysis | Scenario | Annual (drug costs only) | Three-year total | |||
|---|---|---|---|---|---|---|
Year 1 | Year 2 | Year 3 | Drug costs only | Administration, dispensing fees, and markup included | ||
Sponsor’s base case | Reference | 3,409,860 | 3,454,454 | 3,499,766 | 13,729,023 | 36,837,544 |
New drug | 30,759,513 | 34,982,487 | 39,312,169 | 108,419,111 | 134,784,132 | |
Budget impact | 27,349,653 | 31,528,032 | 35,812,403 | 94,690,088 | 97,946,588 | |
CADTH base case | Reference | 4,986,894 | 5,052,112 | 5,118,380 | 20,078,588 | 18,104,537 |
New drug | 41,654,116 | 42,198,866 | 44,966,152 | 133,740,336 | 139,353,080 | |
Budget impact | 36,667,223 | 37,146,754 | 39,847,772 | 113,661,749 | 121,248,543 | |
CADTH scenario analysis 1: Proportion of CRC that is metastatic | Reference | 5,984,273 | 6,062,534 | 6,142,057 | 24,094,305 | 21,725,444 |
New drug | 49,984,940 | 50,638,639 | 53,959,383 | 160,488,404 | 167,223,696 | |
Budget impact | 44,000,667 | 44,576,105 | 47,817,326 | 136,394,098 | 145,498,251 | |
CADTH scenario analysis 2: Proportion of BRAF V600E positive patients | Reference | 7,480,341 | 7,578,168 | 7,677,571 | 30,117,881 | 27,156,806 |
New drug | 62,481,174 | 63,298,299 | 67,449,229 | 200,610,504 | 209,029,619 | |
Budget impact | 55,000,834 | 55,720,131 | 59,771,658 | 170,492,623 | 181,872,814 | |
CADTH scenario analysis 3: proportion of mCRC patients undergoing BRAF testing | Reference | 4,116,958 | 4,170,799 | 4,225,507 | 16,575,990 | 14,946,301 |
New drug | 41,654,116 | 42,198,866 | 44,966,152 | 132,881,860 | 139,353,080 | |
Budget impact | 37,537,158 | 38,028,067 | 40,740,645 | 116,305,871 | 124,406,779 | |
CADTH scenario analysis 4: Alternative cetuximab regimen | Reference | 4,986,894 | 5,052,112 | 5,118,380 | 20,078,588 | 18,104,537 |
New drug | 41,070,429 | 41,607,546 | 44,331,836 | 131,931,012 | 135,879,605 | |
Budget impact | 36,083,535 | 36,555,434 | 39,213,455 | 111,852,424 | 117,775,068 | |
CADTH scenario analysis 5: Alternative RDI | Reference | 6,221,516 | 6,302,881 | 6,385,556 | 25,049,513 | 22,618,270 |
New drug | 48,870,548 | 49,509,674 | 52,734,005 | 157,253,787 | 163,443,298 | |
Budget impact | 42,649,032 | 43,206,793 | 46,348,449 | 132,204,275 | 140,825,028 | |
CADTH scenario analysis 6: Subsequent drug costs included | Reference | 4,986,894 | 5,052,112 | 5,118,380 | 20,078,588 | 53,874,615 |
New drug | 41,654,116 | 42,198,866 | 44,966,152 | 133,740,336 | 162,437,003 | |
Budget impact | 36,667,223 | 37,146,754 | 39,847,772 | 113,661,749 | 108,562,387 | |
CADTH scenario analysis 7: Health care payer perspective | Reference | 4,986,894 | 5,052,112 | 5,118,380 | 20,078,588 | 38,400,954 |
New drug | 41,654,116 | 42,198,866 | 44,966,152 | 133,740,336 | 153,651,207 | |
Budget impact | 36,667,223 | 37,146,754 | 39,847,772 | 113,661,749 | 115,250,253 | |
BIA = budget impact analysis; mCRC = metastatic colorectal cancer; RDI = relative dose intensity.
Note: Reanalyses are based on publicly available prices of the comparator treatments.
ISSN: 2563-6596
Disclaimer: The information in this document is intended to help Canadian health care decision-makers, health care professionals, health systems leaders, and policy-makers make well-informed decisions and thereby improve the quality of health care services. While patients and others may access this document, the document is made available for informational purposes only and no representations or warranties are made with respect to its fitness for any particular purpose. The information in this document should not be used as a substitute for professional medical advice or as a substitute for the application of clinical judgment in respect of the care of a particular patient or other professional judgment in any decision-making process. The Canadian Agency for Drugs and Technologies in Health (CADTH) does not endorse any information, drugs, therapies, treatments, products, processes, or services.
While care has been taken to ensure that the information prepared by CADTH in this document is accurate, complete, and up-to-date as at the applicable date the material was first published by CADTH, CADTH does not make any guarantees to that effect. CADTH does not guarantee and is not responsible for the quality, currency, propriety, accuracy, or reasonableness of any statements, information, or conclusions contained in any third-party materials used in preparing this document. The views and opinions of third parties published in this document do not necessarily state or reflect those of CADTH.
CADTH is not responsible for any errors, omissions, injury, loss, or damage arising from or relating to the use (or misuse) of any information, statements, or conclusions contained in or implied by the contents of this document or any of the source materials.
This document may contain links to third-party websites. CADTH does not have control over the content of such sites. Use of third-party sites is governed by the third-party website owners’ own terms and conditions set out for such sites. CADTH does not make any guarantee with respect to any information contained on such third-party sites and CADTH is not responsible for any injury, loss, or damage suffered as a result of using such third-party sites. CADTH has no responsibility for the collection, use, and disclosure of personal information by third-party sites.
Subject to the aforementioned limitations, the views expressed herein are those of CADTH and do not necessarily represent the views of Canada’s federal, provincial, or territorial governments or any third party supplier of information.
This document is prepared and intended for use in the context of the Canadian health care system. The use of this document outside of Canada is done so at the user’s own risk.
This disclaimer and any questions or matters of any nature arising from or relating to the content or use (or misuse) of this document will be governed by and interpreted in accordance with the laws of the Province of Ontario and the laws of Canada applicable therein, and all proceedings shall be subject to the exclusive jurisdiction of the courts of the Province of Ontario, Canada.
The copyright and other intellectual property rights in this document are owned by CADTH and its licensors. These rights are protected by the Canadian Copyright Act and other national and international laws and agreements. Users are permitted to make copies of this document for non-commercial purposes only, provided it is not modified when reproduced and appropriate credit is given to CADTH and its licensors.
About CADTH: CADTH is an independent, not-for-profit organization responsible for providing Canada’s health care decision-makers with objective evidence to help make informed decisions about the optimal use of drugs, medical devices, diagnostics, and procedures in our health care system.
Funding: CADTH receives funding from Canada’s federal, provincial, and territorial governments, with the exception of Quebec.