CADTH Health Technology Review
Total Parenteral Nutrition for Neonates
Rapid Review
Authors: Kwakye Peprah, Melissa Walter
Abbreviations
aMD
adjusted mean difference
CI
confidence interval
DCF
dextrose-containing fluids
NICU
neonatal intensive care unit
PN
parenteral nutrition
P-PN
peripherally administer parenteral nutrition
RCT
randomized controlled trial
SD
standard deviation
TPN
total parenteral nutrition
Key Messages
The 2 included studies reported conflicting findings regarding weight gain, length, and time to regained birth weight in moderate-to-late preterm neonates weighing 1,500 g or more at birth treated with peripherally administered parenteral nutrition (P-PN) versus 10% dextrose or dextrose-containing fluids. However, both studies reported no statistically significant difference in safety and other measures such as head circumference, time to full enteral feeds, and length of hospital stay between the treatment groups.
The strength of the evidence was limited because analyses of the outcomes did not include measures that could minimize false-positive results, and a definitive conclusion could not be drawn regarding the clinical effectiveness of total parenteral nutrition (TPN) for a term or moderate-to-late preterm neonates weighing 1,500 g or more at birth.
No relevant evidence-based guidelines regarding using TPN in term or moderate-to-late preterm neonates weighing 1,500 g or more at birth was identified.
Context and Policy Issues
Risk factors for infant malnutrition include preterm birth, low birth weight, illness or congenital anomaly, and establishing feeding after necrotizing enterocolitis or gastrointestinal (GI) perforation.1 Malnutrition or undernutrition in the early neonatal period may have long-lasting effects on growth and development.2 Hospitalized neonates may receive nutritional support to foster improvements in growth rate and associated mental development using enteral feeding (i.e., oral or tube feeding) or PN by the IV route.1,2 Enteral nutrition presents several physiologic advantages with generally fewer complications than PN.3 Parenteral nutrition provides optimal energy without forcing high volumes of enteral nutrition,4 and may be used in preterm neonates to reduce the risk of postnatal growth failure, long-term malnutrition, and poor neurodevelopmental outcomes where immaturity of gastrointestinal motor function precluded enteral feeding.5,6
Compared to the volume of literature on PN for infants born at fewer than 32 weeks gestation, the literature (including guidelines) is scarce concerning the use of PN for those with gestational age between 32- and 34-weeks. This situation may lead to the extrapolation of recommendations for PN use from 1 neonatal population to another without supporting evidence.4 However, there is concern around the use of PN due to the associated challenges such as central venous catheter-related sepsis, thrombosis, peripheral-line extravasations, liver disease, bone disease, and metabolic disturbance.4,5 The objective of this report is to identify and summarize evidence of clinical effectiveness and evidence-based recommendations concerning TPN use in term or moderate-to-late preterm neonates weighing 1,500 g or more at birth.
Research Questions
What is the clinical effectiveness of total parenteral nutrition for a term or moderate-to-late preterm neonates weighing 1,500 g or more at birth?
What are the evidence-based guidelines regarding administering total parenteral nutrition in term or moderate-to-late preterm neonates weighing 1,500 g or more at birth?
Methods
Literature Search Methods
A limited literature search was conducted by an information specialist on key resources including MEDLINE, the Cochrane Database of Systematic Reviews, the international HTA database, the websites of Canadian and major international health technology agencies, as well as a focused internet search. The search strategy comprised controlled vocabulary, such as the National Library of Medicine’s MeSH (Medical Subject Headings), and keywords. The main search concepts were PN and infants. CADTH-developed search filters were applied to limit retrieval to health technology assessments, systematic reviews, meta-analyses, network meta-analyses, any types of clinical trials or observational studies, or guidelines. Where possible, retrieval was limited to the human population. The search was also limited to English language documents published between January 1, 2016, and August 3, 2021.
Selection Criteria and Methods
A 2-step approach was used to screen citations and select relevant studies for the report. Two reviewers screened titles and abstracts in the first level of screening to identify potentially relevant articles, which were retrieved and assessed for inclusion. One reviewer performed the final selection of full-text articles based on the inclusion criteria presented in Table 1.
Criteria | Description |
|---|---|
Population | Neonates who were born at a gestational age of 32 weeks or more and weighing 1,500 g or more at birth |
Intervention | Q1, Q2: Starter TPN, Full TPN |
Comparator | Q1: Dextrose (10%, 12.5%), dextrose with sodium and potassium Q2: Not applicable |
Outcomes | Q1: Weight gain, glucose stabilization, laboratory results (e.g., electrolytes including sodium, potassium, magnesium, chloride, phosphate, glucose, and triglycerides), length of stay in a neonatal intensive care unit Q2: Recommendations regarding administering TPN for neonates |
Study designs | Health Technology Assessments, Systematic Reviews, Randomized Controlled Trials, Non-Randomized Studies, Evidence-based Guidelines |
TPN = total parenteral nutrition.
Exclusion Criteria
Articles were excluded if they did not meet the selection criteria outlined in Table 1; they were duplicate publications or were published before 2016. Guidelines with unclear methodology were also excluded.
Critical Appraisal of Individual Studies
The included publications were critically appraised by 1 reviewer using the following tools as a guide: the Downs and Black checklist7 for randomized and non-randomized studies. Summary scores were not calculated for the included studies; instead, the strengths and limitations of each included publication were described narratively.
Summary of Evidence
Quantity of Research Available
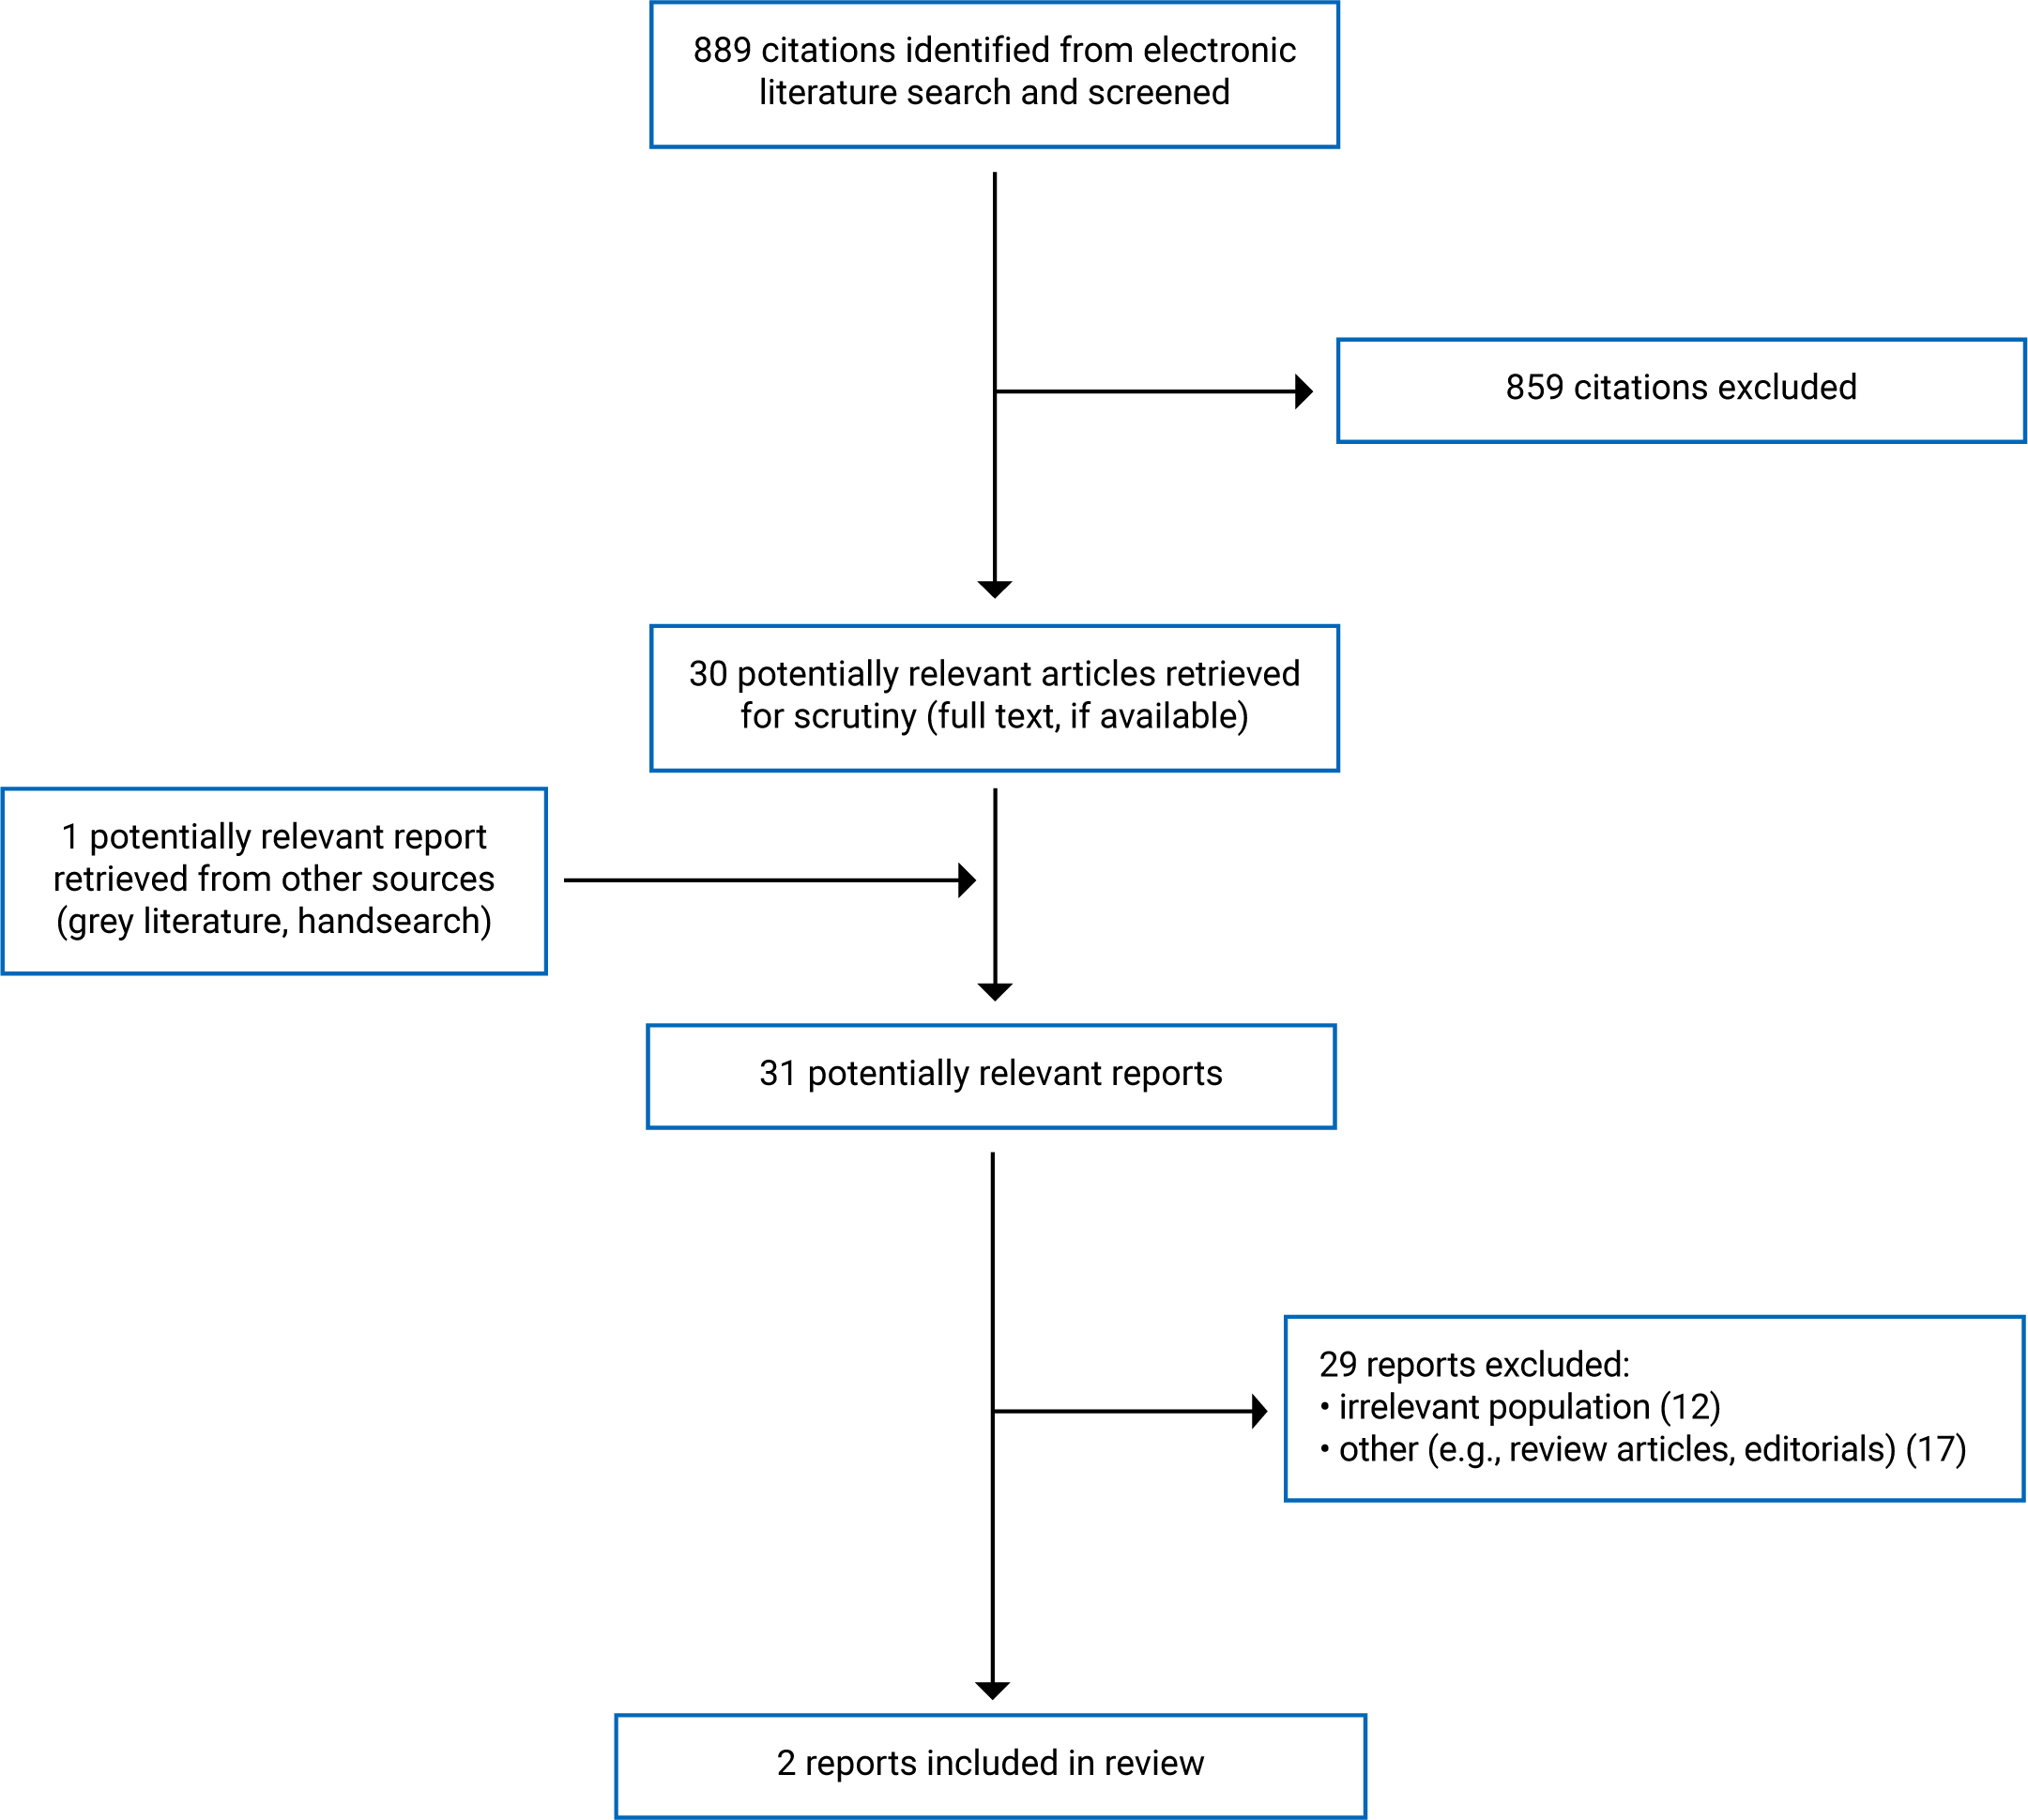
A total of 889 citations were identified in the literature search. After screening titles and abstracts, 859 citations were excluded, and 30 potentially relevant reports from the electronic search were retrieved for full-text review. One potentially relevant publication was retrieved from the grey literature search for full-text review. Of these 31 articles, 29 publications were excluded for various reasons. Two papers – 1 randomized controlled trial (RCT)2 and 1 retrospective cohort study4 – met the inclusion criteria and were included in this report. Appendix 1 presents the PRISMA8 flow chart of the study selection.
Summary of Study Characteristics
Additional details regarding the characteristics of included publications are provided in Appendix 2.
Study Design
One of the included primary studies was a parallel-group, single-centre, superiority, non-blinded RCT.2 It was conducted between September 2016 and June 2018 at a university teaching hospital. The second included study was a retrospective cohort study4 that analyzed data of neonates admitted in 1 of 7 neonatal intensive care unit (NICU) facilities of a teaching hospital during the 2014 and 2016 calendar years. Data of patients born during 2015 were excluded because the NICU was in the educational and transitional phase of new nutrition guidelines. The investigators performed a propensity matching of patients to control for non-random assignment and reported separate results before and after the propensity matching.4 Both studies2,4 were published in 2020.
Country of Origin
The RCT2 was conducted in Australia, and the retrospective cohort study4 was conducted in the US.
Patient Population
The RCT2 enrolled a total of 92 preterm infants who were less than 24 hours of age with a median gestational age of 32 weeks, and who required IV fluids. Infants were excluded from the study if they received centrally administered fluids or presented with significant congenital or chromosomal abnormalities. At birth, the infants in the 2 groups had an identical mean length (42 cm) and head circumference (30 cm). The mean birth weight was 1,717 g and 1,749 g in the intervention and control groups, respectively. Overall, baseline demographic and clinical characteristics were similar across the treatment groups.
The retrospective cohort study4 analyzed data from a total of 124 preterm infants without significant comorbidities. Patients were excluded if they were diagnosed with intrauterine growth restriction, discharged within the first week of life, transferred from the NICU during their care, received PN for < 2 days, or had any missing information related to PN duration or weight. Before the propensity matching, neonates in the control group showed higher values than those in the intervention group regarding median gestational age (33.6 weeks versus 32.9 weeks; P < 0.01) and mean birth weight (2,130 g versus 1,855 g; P < 0.01). However, other measurements such as birth weight percentile, birth length percentile, and head circumference percentile did not show statistically significant differences between the treatment groups. The propensity matching improved equality between the groups but substantially decreased the sample size (n = 52, with 26 patients matched patients in each group).
Interventions and Comparators
In the RCT,2 the eligible infants were randomly assigned to receive peripheral IV (IV) parenteral nutrition (P-PN; n = 42) or peripheral IV 10% glucose (control; n = 50). Premixed electrolytes solution was added when clinically indicated. The peripheral venous cannulas were routinely changed every 72 hours. Enteral feeds in the form of expressed breast milk (or less commonly preterm formula when breast milk was not available) were started when the patients were clinically stable. The IV feed infusion for a neonate was stopped for each treatment group when an enteral intake of 120 mL/kg/day was reached and maintained for 3 days.
The retrospective cohort study4 analyzed data from 89 infants treated with P-PN in 2014 and 35 infants who received dextrose-containing fluids (DCF) in 2016. For most patients (83%) treated with DCF, the fluid was composed of 10% dextrose and 0.2% sodium chloride, whereas 14% of patients received plain IV dextrose 10% without any other additives. In each treatment group, the infusion was started within 2 hours of birth for all patients. For this study,4 the lipid portion of the IV nutrition was discontinued when enteral intake reached 100 mL/kg/day, and the non-lipid PN was stopped on attaining 120 mL/kg/day enteral intake.
Further details, including the composition and concentrations of the various infusions, are provided in Appendix 2.
Outcomes
The primary outcome in both the RCT2 and the retrospective cohort study4 was weight gain per day from birth. However, the approach to measurement was different for the 2 studies. For the RCT,2 the body weight was measured at approximately the same time daily from birth to 21 days (± 2 days) after birth by clinical staff using electronically balanced scales. In the retrospective cohort study,4 the daily weight gain was calculated by dividing the difference between the discharge weight and birth weight by the birth weight and the length of hospital stay. The secondary outcomes were similar for the 2 studies2,4 and included length of hospital stay, the change from birth to discharge in weight, length, and head circumference, and safety.
Summary of Critical Appraisal
One of the included studies was an RCT2 and therefore had reduced potential for selection bias due to the randomization of patients. However, it was a non-blinded study, so the risk for bias due to an uneven approach to care and other maneuvers based on knowledge of the interventions could not be ruled out. The investigators in that study performed a sample size calculation beforehand to determine the number of patients required to ensure the study was adequately powered for the primary outcome, and they recruited enough patients to meet the target. The baseline demographic and clinical characteristics were similar across the treatment groups overall. The intervention for each study group and associated outcomes were well-described. The analysis of the study results used appropriate statistical methods and was based on the intention-to-treat population, widely accepted as good practice.
The other study included in this report was a retrospective cohort study,4 which has a high risk of selection bias due to its non-randomized design. However, the investigators performed a propensity matching of patients to control for non-random assignment. It is unclear if a statistical power calculation was performed. Also, patients in the 2 treatment groups of the study received treatment in 2 different historical periods (DCF group in 2014 and P-PN group in 2016). Thus, it was unclear if changes occurred in health care delivery over time could influence the reported results. The outcomes of the study4 were analyzed using appropriate statistical methods, and findings were well reported. The results from analyses before and after the propensity matching were consistent, suggesting rigour. However, the sample size reduced considerably after the propensity matching.
Although the included studies2,4 conducted multiple statistical tests, there was no adjustment for multiplicity in any of the analyses. Therefore, the results must be interpreted with caution for potentially high risk of type I error. A type I error (also called false-positive error) occurs if an investigator rejects a null hypothesis that is actually true in the population.9 Both included studies2,4 restricted enrolment to healthy infants and excluded those with significant illness or abnormalities. Furthermore, the P-PN in each of the studies2,4 had lower osmolality than standard PN used via central venous lines to allow a safe administration by the peripheral IV route. Therefore, the generalizability of the findings in infants with illness or abnormalities, or when using a PN of standard osmolality via a central venous line, is unknown.
Additional details regarding the strengths and limitations of included publications are provided in Appendix 3.
Summary of Findings
Appendix 4 presents the main study findings.
Clinical Effectiveness of TPN for Term or Moderate-to-Late Preterm Neonates Weighing 1,500 g More at Birth
Although both included studies2,4 of this report conducted multiple statistical tests, none adjusted for multiplicity. Therefore, the following findings should be interpreted with cautions for potentially inflated type I error.
Weight gain
One RCT2 found that during a mean follow-up of 21 days in the hospital, the daily weight gain in moderately preterm infants was statistically significantly higher among those treated with P-PN than those who received peripheral IV 10% glucose (adjusted mean difference [aMD] of 3.9 g/day). The aMD met the clinically minimal important difference (MID) of 3 g per day, which the investigators had prespecified in consultation with the neonatal medical team. However, it was unclear if that MID is accepted widely in clinical practice. The difference in weight gain was also statistically significant in favour of P-PN at the time of discharge (aMD = 4.9 g). In contrast, the retrospective cohort study4 found no statistically significant difference in daily weight gain or the difference in change in weight percentile from birth to discharge home between moderately preterm infants treated with P-PN and those treated with peripheral DCF. The retrospective study4 did not specify the duration of follow-up.
Length gained
One RCT2 found that at day 21 from birth, moderately preterm infants treated with P-PN had gained statistically significantly greater length than those treated with peripheral IV 10% glucose (aMD of 1.3 cm). The difference remained statistically significant in favour of P-PN at the time of discharge, although the difference between groups was reduced (aMD of 0.3 cm). However, the clinical significance of the differences in length gained between the treatment groups was unclear. Conversely, 1 retrospective cohort study4 found no statistically significant difference in change in length percentile from birth to discharge between moderately preterm infants treated with P-PN compared with those treated with DCF.
Head circumference gain
One RCT2 and 1 retrospective cohort study4 reported no statistically significant difference in head circumference at day 21 from birth or discharge home between moderately preterm infants treated with P-PN and treated with peripheral IV 10% glucose or DCF.
Time to regain birth weight
One RCT2 found that moderately preterm infants treated with P-PN regained birth weight statistically significantly faster than those treated with peripheral IV 10% glucose. In contrast, 1 retrospective cohort study4 found no statistically significant difference in the time to regain birth weight between moderately preterm infants treated with P-PN and those treated with DCF.
Time to full enteral feeds
One RCT2 found no statistically significant difference in the time it took to reach full enteral feeds (i.e.,120 mL/kg/day) between moderately preterm infants treated with P-PN and those treated with peripheral IV 10% glucose. In contrast, in 1 retrospective cohort study,4 the analysis before propensity matching suggested a statistically significantly longer time to reach full enteral feeds (i.e., 100 mL/kg/day) with P-PN than with DCF. However, a similar analysis after propensity matching did not find a statistically significant difference between the groups regarding this outcome.
Length of hospital stay
One RCT and 1 retrospective cohort study4 found no statistically significant difference in the length of hospital stay between moderately preterm infants treated with P-PN and those treated with peripheral IV 10% glucose or DCF.
Safety
One RCT2 and 1 retrospective cohort study4 found no statistically significant differences in safety outcomes between moderately preterm infants treated with P-PN and those treated with peripheral IV 10% glucose or DCF.
Guidelines
No relevant evidence-based guideline regarding TPN administration in term or moderate-to-late preterm neonates weighing 1,500 g or more at birth was identified; therefore, no summary can be provided.
Limitations
A fundamental limitation is that none of the included studies adjusted for multiplicity in their analyses, and only the RCT reported performing a sample size calculation. Even so, the calculation was to ensure that the study was adequately powered for the primary outcome (weight gain per day) and not the secondary outcomes. Therefore, there is uncertainty about the findings of the studies on account of potentially high type-1 error and unknown adequacy in power to detect statistically meaningful differences in all outcomes between the treatment groups. Besides the methodological limitations of the individual studies previously discussed, both included studies were based on data collected over a short period when the preterm infants remained in the hospital after birth. Thus, the intermediate and long-term effects of the interventions on growth and development were unknown.
Moreover, the studies were conducted in single-centre facilities outside Canada (one in Australia2 and the other in the US4). Therefore, the generalizability of the reported finding in the Canadian context is unknown. Also, the number of included studies was small (i.e., 2),2,4 and their findings may not apply to term neonates because term neonates were not enrolled in either study. No evidence-based guideline was identified regarding the administration of TPN in term or moderate-to-late preterm neonates weighing 1,500 g or more at birth was identified; therefore, a summary of recommendations could not be provided.
Conclusions and Implications for Decision- or Policy-Making
One RCT2 and 1 retrospective cohort study4 provided evidence for the clinical effectiveness of TPN for term or moderate-to-late preterm neonates weighing 1,500 g or more at birth. Outcomes reported included changes in weight, length, head circumference, time to regain birth weight or reach complete enteral nutrition, and length of hospital stay. While the RCT found statistically significantly more gain in weight and length and a faster regaining of birth weight with P-PN than with peripheral IV 10% glucose, the retrospective cohort study4 found no statistically significant inter-group differences for these outcomes. The RCT2 and the retrospective cohort study4 reported no statistically significant difference in head circumference, time to full enteral feeds, and length of hospital stay between moderately preterm infants treated with P-PN and those treated with peripheral IV 10% glucose or DCF. None of the studies2,4 found a statistically significant difference in any safety outcomes between moderately preterm infants treated with P-PN and those treated with peripheral IV 10% glucose or DCF. There were no term neonates in any included studies2,4; thus, the reported findings may not apply to term neonates.
A major source of uncertainty in the evidence is that although both included studies2,4 conducted multiple statistical tests, none adjusted for multiplicity. Therefore, given the potential high risk of type I error associated with the findings, a definitive conclusion could not be drawn regarding the clinical effectiveness of TPN for the term or moderate-to-late preterm neonates weighing 1,500 g or more at birth. No relevant evidence-based guideline regarding TPN administration in term or moderate-to-late preterm neonates weighing 1,500 g or more at birth was identified; therefore, no summary can be provided. Thus, there is a need for studies with a rigorous methodology that assess the comparative clinical effectiveness of TPN and evidence-based guidelines with specific recommendations for TPN use in this population of neonate patients.
References
1.Indications for inpatient nutritional support for neonates and infants (age <2 years). Plymouth Meeting (PA): ECRI Institute; 2017: www.ecri.org. Accessed 2021 Aug 3.
2.Suganuma H, Bonney D, Andersen CC, et al. The efficacy and safety of peripheral intravenous parenteral nutrition vs 10% glucose in preterm infants born 30 to 33 weeks' gestation: a randomised controlled trial. BMC Pediatr. 2020;20(1):384. PubMed
3.Baker RD, Baker SS, Briggs J, Bocjzuk G. Parenteral nutrition in infants and children. In: Post TW, ed. Waltham (MA): UpToDate; 2021: http://www.uptodate.com. Accessed 2021 Jul 28.
4.Prusakov P, Speaks S, Magers JS. Parenteral nutrition in moderately preterm, otherwise healthy neonates is not associated with improved short-term growth outcomes. JPEN J Parenter Enteral Nutr. 2020;44(8):1519-1524. PubMed
5.Cernat E, Puntis J. Paediatric parenteral nutrition: current issues. Frontline Gastroenterol. 2020;11(2):148-154. PubMed
6.Prathik BH, Aradhya AS, Sahoo T, Saini SS. Neonatal total parenteral nutrition: clinical implications from recent NICE guidelines. Indian Pediatr. 2021;58(1):67-70. PubMed
7.Downs SH, Black N. The feasibility of creating a checklist for the assessment of the methodological quality both of randomised and non-randomised studies of health care interventions. J Epidemiol Community Health. 1998;52(6):377-384. PubMed
8.Liberati A, Altman DG, Tetzlaff J, et al. The PRISMA statement for reporting systematic reviews and meta-analyses of studies that evaluate health care interventions: explanation and elaboration. J Clin Epidemiol. 2009;62(10):e1-e34. PubMed
9.Banerjee A, Chitnis UB, Jadhav SL, Bhawalkar JS, Chaudhury S. Hypothesis testing, type I and type II errors. Ind Psychiatry J. 2009;18(2):127-131. PubMed
Appendix 1: Selection of Included Studies
Appendix 2: Characteristics of Included Publications
Table 2: Characteristics of Included Primary Clinical Studies
Study citation, country, funding source | Study design | Population characteristics | Intervention and comparator(s) | Clinical outcomes, length of follow-up |
|---|---|---|---|---|
Suganuma et al., (2020)2 Australia Funding: Women’s and Children’s Hospital Foundation | A single-centre, non-blinded, randomized controlled trial conducted between September 2016 and June 2018 | A total of 92 preterm infants born 30 to 33 weeks gestation were less than 24 hours of age and required IV fluids (N = 42 for P-PN and 50 for control). Median (IQR) gestational age: 32 (31 to 32) weeks for P-PN and 32 (31 to 33) weeks for control Mean (SD) birth weight: 1,717 (289) g for P-PN and 1,749 (329) g for control Mean (SD) length at birth: 42 (2) cm for P-PN and 42 (2) cm for control Mean (SD) head circumference at birth: 30 (2) cm for P-PN and 30 (2) cm for control Infants were excluded if they received centrally administered fluids or presented with significant congenital or chromosomal abnormalities. | Peripheral IV P-PN vs. Peripheral IV 10% glucose (osmolarity 556 mOsm/L), with added premixed electrolytes solution (i.e., glucose 100 g/L, potassium chloride 1.5 g/L, and sodium chloride 2.25 g/L; osmolarity 672 mOsm/L) when clinically indicated The P-PN was composed of 8% glucose, 30 g/L amino acids, 500 IU/L heparin (estimated osmolality 678 mOsm/L), and a 17% lipid emulsion with added vitamins (estimated osmolality 340 mOsm/L) The non-lipid portion of the P-PN was administered at a maximum of 100 mL/kg/day, so the infant received a maximum IV protein intake of 3 g/kg/day. | Primary:
Secondary:
Follow-up: 21 days ± 2 days |
The lipid emulsion with vitamins portion of the P-PN was administered using a separate line via the same peripheral IV site at 2 g/kg/day. All infants received IV 10% glucose via a peripheral venous catheter during the period before randomization. In the course of receiving the P-PN therapy, patients were given IV 10% glucose, as needed, to meet targeted total fluid volume or for physiologic homeostasis requirements. | ||||
Prusakov et al. (2020)4 US Funding: None declared | A retrospective cohort study based on 2014 and 2016 data from a single NICU belonging to a group of pediatric hospitals and research institutes. The outcomes were reported for before and after propensity matching. | A total of 124 preterm infants without significant comorbidities, who were born at ≥ 32 but < 34 weeks gestational age (N = 89 for P-PN and 35 for DCF). Median (IQR) gestational age: 32.9 (32.4 to 33.1) weeks for P-PN and 33.6 (33.1 to 33.7) weeks for DCF groups (P < 0.01). Mean (SD) birth weight: 1,855 (346) g for P-PN and 2,130 (337) g for DCF groups (P < 0.01). Birth weight percentile, % (IQR): 50 (28 to 64) for P-PN and 57 (44 to 72) for DCF groups. | Peripheral IV P-PN (in 2014) vs. Standard DCF (in 2016) The fluid consisted mainly of 10% dextrose with or without additives (84% had 10% dextrose and 0.2% of sodium chloride 14% had dextrose 10% without any other additives). The infusion was started within 2 hours of birth in each group. Osmolality values were not reported for either group. | Primary:
Secondary:
Follow-up duration not reported |
Birth length percentile, % (IQR): 60 (24 to 82) for P-PN and 71 (47 to 85) for DCF groups. Birth HC percentile, % (IQR): 64 (38 to 84) for P-PN and 68 (45 to 87) for DCF groups. Patients were excluded if they were diagnosed with IUGR, discharged within the first week of life, transferred from the NICU during their care, received PN for < 2 days, or had any missing information related to PN duration or weight | The non-lipid portion of the P-PN, infused at 80 mL/kg/day, provided 3 g/kg/day of the amino acid (TrophAmine) and 8 g/kg/day of dextrose for an initial energy intake of 39.2 kcal/kg/day The lipid portion (20% Intralipid) of the P-PN was administered at 1 g/kg/day on day 1, with daily increments by 1 g/kg to reach a goal of 3 g/kg/day. |
DCF = dextrose-containing fluids; IQR = interquartile range; HC = head circumference; IU = international unit; IUGR = diagnosis of intrauterine growth restriction; mOsm/L = milliosmoles/litre; NICU = neonatal intensive care unit; PN = parenteral nutrition; P-PN = peripherally administered parenteral nutrition; SD = standard deviation.
Note that this appendix has not been copy-edited.
Appendix 3: Critical Appraisal of Included Publications
Note that this appendix has not been copy-edited.
Table 3: Strengths and Limitations of Clinical Studies Using the Downs and Black Checklist7
Strengths | Limitations |
|---|---|
Suganuma et al., (2020)2 | |
A randomized controlled trial that minimizes selection bias The objective of the study and its inclusion and exclusion criteria were stated clearly. Calculations were performed beforehand to determine a sample size that ensured the study was adequately powered for the primary outcome. Overall, baseline demographic and clinical characteristics were similar across the treatment groups without a statistically significant difference. The intervention and comparator were described well, and the primary and secondary outcomes were defined clearly. There were no significant differences in the number of days requiring IV therapy and enteral protein, lipid, or energy intake between groups over the 3-week study period. Outcomes were reported clearly with P values. The analysis was based ITT population, with a per-protocol analysis performed for the primary outcome only. The analysis of results used appropriate statistical methods, and results were reported with estimates of variability (e.g., IQR, SD, and CI, where applicable). The study was supported by a grant from the local hospital foundation, and the authors did not appear to have any competing interests. | The study was a non-blinded, randomized controlled trial. Therefore, a risk for bias due to an uneven approach to care and other maneuvers based on knowledge of the interventions could be ruled out. The investigators used PN of lower osmolarity than standard PN to safely administer the infusion by the peripheral IV route instead of the usual central venous line. Also, the study enrolled only healthy neonates and excluded those with congenital or chromosomal abnormalities. Therefore, it is unknown if the findings would be generalizable when PN is infused via a central venous line or in infants with illness or abnormalities. Reported outcomes were based on data from a short period when the infants were still in the hospital after birth (follow-up 21 days ± 2 days). Thus, the intermediate and long-term effects of the intervention on growth and development are unknown. Analyses for secondary outcomes were done without adjustment for multiple comparisons. Therefore, the results should be interpreted with caution, given a potentially high rate of type I error. The study was a single-centre RCT conducted in Australia. Therefore, the generalizability of the reported finding in the Canadian context is unknown. |
Prusakov et al. (2020)4 | |
The objective of the study was stated clearly. Patients’ characteristics and the interventions of interest were well-described. The outcomes measures and findings were reported clearly, along with estimates of the random variability and P values Analyses conducted on the unmatched original data were confirmed with results from the propensity-score-matched population, suggesting rigour of the results. Outcomes were analyzed with appropriate statistical methods, and findings were well-reported. There was no funding, and the authors declare no conflicts of interest. | The study was a retrospective study lacking randomization that reduces the risk of selection bias. Enrolment to participate in the study was restricted to healthy neonates. Therefore, it is unknown if the findings are generalizable in infants with illness or abnormalities. A sample size calculation was not reported, and it was unclear if the study was adequately powered for all outcomes The analyses of outcomes did not adjust for multiplicity, although multiple statistical tests were conducted. As a result, the reported findings may have a high type I error. Only inpatient data were used in the study, with no information about outcomes after the infants were discharged from the hospital. Thus, results about the intermediate and long-term effects were lacking. Patients in the 2 treatment groups received treatment in 2 different historical periods (DCF group in 2014 and P-PN group in 2016). Thus, it was unclear if changes in health care delivery over the years could influence the reported results. The study was based on a single NICU facility in the US. Thus, the generalizability of the findings in Canadian settings is unknown. |
Appendix 4: Main Study Findings by outcome
Note that this appendix has not been copy-edited.
Table 4: Summary of Findings — Weight Gain
Study citation and study design | Detailed findings |
|---|---|
P-PN vs. 10% glucose or DCF | |
Suganuma et al., (2020)2 RCT | Weight gain:
|
Prusakov et al. (2020)4 Retrospective cohort study | Weight gain from birth to discharge, g/kg/day:
Weight change percentile (%) from birth to discharge:
|
aMD = adjusted mean difference; CI = confidence intervals; g = gram; DCF = dextrose-containing fluids; IQR = interquartile range; kg = kilogram; P-PN = peripherally administered parenteral nutrition; RCT = randomized controlled trial; SD = standard deviation.
aAdjusted for sex and gestational age 30 + 0 to 31 + 6 and 32 + 0 to 33 + 6 weeks.
Table 5: Summary of Findings – Change in Length
Study citation and study design | Detailed findings |
|---|---|
P-PN vs. 10% glucose or DCF | |
Suganuma et al., (2020)2 RCT | Length gained:
|
Prusakov et al. (2020)4 Retrospective cohort study | Length change percentile (%) from birth to discharge:
|
aMD = adjusted mean difference; CI = confidence intervals; DCF = dextrose-containing fluids; IQR = interquartile range; P-PN = peripherally administered parenteral nutrition; RCT = randomized controlled trial; SD = standard deviation.
aAdjusted for sex and gestational age 30 + 0 to 31 + 6 and 32 + 0 to 33 + 6 weeks.
Table 6: Summary of Findings — Change in Head Circumference
Study citation and study design | Detailed findings |
|---|---|
P-PN vs. 10% glucose or DCF | |
Suganuma et al., (2020)2 RCT | Head circumference:
|
Prusakov et al. (2020)4 Retrospective cohort study | Head Circumference change percentile (%) from birth to discharge:
|
aMD = adjusted mean difference; CI = confidence intervals; DCF = dextrose-containing fluids; IQR = interquartile range; P-PN = peripherally administered parenteral nutrition; RCT = randomized controlled trial; SD = standard deviation.
aAdjusted for sex and gestational age 30 + 0 to 31 + 6 and 32 + 0 to 33 + 6 weeks.
Table 7: Summary of Findings — Time to Regain Birth Weight
Study citation and study design | Detailed findings |
|---|---|
P-PN vs. 10% glucose or DCF | |
Suganuma et al., (2020)2 RCT | Infants in the P-PN group regained birth weight significantly faster than those in the control group (adjusted ratio of means 0.8 days; 95% CI, 0.7 to 0.9; P < 0.0001). |
Prusakov et al. (2020)4 Retrospective cohort study | Before Propensity Matching, median (IQR): 8 (5 to 10) days for P-PN vs. 8 (7 to 11) for DCF. The difference was not statistically significant (P = 0.22). After Propensity Matching, median (IQR): 9 (6 to 11) days for P-PN vs. 9 (7 to 11) for DCF. The difference was not statistically significant (P = 0.51). |
CI = confidence intervals; DCF = dextrose-containing fluids; IQR = interquartile range; P-PN = peripherally administered parenteral nutrition; RCT = randomized controlled trial; SD = standard deviation.
Table 8: Summary of Findings — Time to Full Enteral Feeds
Study citation and study design | Detailed findings |
|---|---|
P-PN vs. 10% glucose or DCF | |
Suganuma et al., (2020)2 RCT | Time to 120 mL/kg/day of enteral nutrition:
|
Prusakov et al. (2020)4 Retrospective cohort study | Time to 100 mL/kg/day of enteral nutrition:
|
aMD = adjusted mean difference; CI = confidence intervals; DCF = dextrose-containing fluids; kg = kilogram; mL = millilitre; P-PN = peripherally administered parenteral nutrition; RCT = randomized controlled trial; SD = standard deviation.
aAdjusted for sex and gestational age 30 + 0 to 31 + 6 and 32 + 0 to 33 + 6 weeks.
Table 9: Summary of Findings — Length of Hospital Stay
Study citation and study design | Detailed findings |
|---|---|
P-PN vs. 10% glucose or DCF | |
Suganuma et al., (2020)2 RCT | The mean (SD) length of hospital stay was 35.5 (10.5) days for P-PN and 35.6 (3.8) days for the control group. The difference was not statistically significant (aMD = 1.0 days (95% CI, 0.9 to 1.1; P = 0.8) |
Prusakov et al. (2020)4 Retrospective cohort study | Before Propensity Matching, median (IQR): 21 (17 to 31) days for P-PN vs. 23 (17 to 26.5) days for DCF. The difference was not statistically significant (P = 0.88) After Propensity Matching, median (IQR): 20 (15 to 29) days for P-PN vs. 23 (17 to 26) days for DCF. The difference was not statistically significant (P = 0.40). |
aMD = adjusted mean difference; CI = confidence intervals; DCF = dextrose-containing fluids; IQR = interquartile range; P-PN = peripherally administered parenteral nutrition; RCT = randomized controlled trial; SD = standard deviation.
aAdjusted for sex and gestational age 30 + 0 to 31 + 6 and 32 + 0 to 33 + 6 weeks.
Table 10: Summary of Findings — Incidence of Adverse Events
Study citation and study design | Detailed findings |
|---|---|
P-PN vs. 10% glucose or DCF | |
Suganuma et al., (2020)2 RCT | The proportions of infants with hypoglycemia, hyperglycemia, metabolic acidosis, low serum albumin, or feeding intolerance were not significant significantly different between the treatment groups The need for respiratory support and the incidence of sepsis were similar across the groups with no statistically significant difference. The mean levels of serum albumin, pH, base excess, and blood sugar were not significant differences between the groups. One stage 3 extravasation occurred in the P-PN group compared with no stage 3 extravasations in the control group. |
Prusakov et al. (2020)4 Retrospective cohort study | Time on any supplemental oxygen (days):
Total number of antibiotic courses (all for necrotizing enterocolitis):
|
DCF = dextrose-containing fluids; IQR = interquartile range; P-PN = peripherally administered parenteral nutrition, RCT = randomized controlled trial.
ISSN: 2563-6596
Disclaimer: The information in this document is intended to help Canadian health care decision-makers, health care professionals, health systems leaders, and policy-makers make well-informed decisions and thereby improve the quality of health care services. While patients and others may access this document, the document is made available for informational purposes only and no representations or warranties are made with respect to its fitness for any particular purpose. The information in this document should not be used as a substitute for professional medical advice or as a substitute for the application of clinical judgment in respect of the care of a particular patient or other professional judgment in any decision-making process. The Canadian Agency for Drugs and Technologies in Health (CADTH) does not endorse any information, drugs, therapies, treatments, products, processes, or services.
While care has been taken to ensure that the information prepared by CADTH in this document is accurate, complete, and up to date as at the applicable date the material was first published by CADTH, CADTH does not make any guarantees to that effect. CADTH does not guarantee and is not responsible for the quality, currency, propriety, accuracy, or reasonableness of any statements, information, or conclusions contained in any third-party materials used in preparing this document. The views and opinions of third parties published in this document do not necessarily state or reflect those of CADTH.
CADTH is not responsible for any errors, omissions, injury, loss, or damage arising from or relating to the use (or misuse) of any information, statements, or conclusions contained in or implied by the contents of this document or any of the source materials.
This document may contain links to third-party websites. CADTH does not have control over the content of such sites. Use of third-party sites is governed by the third-party website owners’ own terms and conditions set out for such sites. CADTH does not make any guarantee with respect to any information contained on such third-party sites and CADTH is not responsible for any injury, loss, or damage suffered as a result of using such third-party sites. CADTH has no responsibility for the collection, use, and disclosure of personal information by third-party sites.
Subject to the aforementioned limitations, the views expressed herein are those of CADTH and do not necessarily represent the views of Canada’s federal, provincial, or territorial governments or any third-party supplier of information.
This document is prepared and intended for use in the context of the Canadian health care system. The use of this document outside of Canada is done so at the user’s own risk.
This disclaimer and any questions or matters of any nature arising from or relating to the content or use (or misuse) of this document will be governed by and interpreted in accordance with the laws of the Province of Ontario and the laws of Canada applicable therein, and all proceedings shall be subject to the exclusive jurisdiction of the courts of the Province of Ontario, Canada.
The copyright and other intellectual property rights in this document are owned by CADTH and its licensors. These rights are protected by the Canadian Copyright Act and other national and international laws and agreements. Users are permitted to make copies of this document for non-commercial purposes only, provided it is not modified when reproduced and appropriate credit is given to CADTH and its licensors.
About CADTH: CADTH is an independent, not-for-profit organization responsible for providing Canada’s health care decision-makers with objective evidence to help make informed decisions about the optimal use of drugs, medical devices, diagnostics, and procedures in our health care system.
Funding: CADTH receives funding from Canada’s federal, provincial, and territorial governments, with the exception of Quebec.
Questions or requests for information about this report can be directed to Requests@CADTH.ca