CADTH Reimbursement Review
Semaglutide (Rybelsus)
Sponsor: Novo Nordisk Canada Inc.
Therapeutic area: Diabetes mellitus, type 2
This multi-part report includes:
Clinical Review
Pharmacoeconomic Review
Clinical Review
Abbreviations
A1C
glycated hemoglobin
AE
adverse event
CI
confidence interval
CV
cardiovascular
CVOT
cardiovascular outcomes trial
DB
double blind
DPP-4
dipeptidyl peptidase-4
DULA
dulaglutide
eGFR
estimated glomerular filtration rate
EMA
European Medicines Agency
EMPA
empagliflozin
FDA
Food and Drug Administration
FPG
fasting plasma glucose
GLP-1 RA
glucagon-like peptide-1 receptor agonist
HRQoL
health-related quality of life
ITT
intention-to-treat population
LIRA
liraglutide
MET
metformin
NYHA
New York Heart Association
OAD
oral antidiabetic
PP
per-protocol
RCT
randomized controlled trial
SAE
serious adverse event
SC
subcutaneous
SD
standard deviation
SE
standard error
SEM
semaglutide
SGLT2
sodium-glucose cotransporter-2
SU
sulfonylurea
T2DM
type 2 diabetes mellitus
TEAE
treatment-emergent adverse events
TZD
thiazolidinedione
WDAE
withdrawal due to adverse event
Executive Summary
An overview of the submission details for the drug under review is provided in Table 1.
Item | Description |
|---|---|
Drug product | semaglutide (Rybelsus), 3 mg, 7 mg, and 14 mg tablets, for oral administration |
Indication | Semaglutide is indicated as an adjunct to diet and exercise to improve glycemic control in adults with T2DM:
|
Reimbursement request | For the treatment of adult patients with type 2 diabetes mellitus
|
Health Canada Approval Status | NOC |
Health Canada Review Pathway | Standard |
NOC date | March 30, 2020 |
Sponsor | Novo Nordisk Canada Inc. |
NOC = Notice of Compliance; T2DM = type 2 diabetes mellitus.
Introduction
Diabetes mellitus is a metabolic disease that is characterized by persistent elevations in blood glucose, or hyperglycemia. Type 2 diabetes mellitus (T2DM) accounts for approximately 90% of cases of diabetes mellitus.1 Onset of T2DM typically occurs around 40 years of age or older,2 though this is changing with the increase in obesity and sedentary behaviours leading to more frequent diagnosis of T2DM in children and younger people.3 Diabetes is a significant problem in Canada, and is 1 of the most common chronic diseases in the country. Diabetes Canada estimated that 3.8 million people in Canada (10% of the population) were living with diabetes in 2020, and that this number will increase to 4.9 million people (12%) by 2030.4
Treatment regimens and therapeutic targets should be individualized in patients with T2DM due to the heterogeneous nature of the disease. Initial treatment often consists of lifestyle modifications through diet and exercise, and pharmacological treatment becomes necessary when blood glucose levels are not adequately controlled by these means.5 There are many classes of antihyperglycemic agents used to treat T2DM, which include both insulin and noninsulin therapies.5 Metformin (MET) is considered first-line therapy and is indicated for most patients. If treatment through lifestyle modifications and MET monotherapy fail to achieve adequate glycemic control, a second or third agent may be added in addition to MET. There are certain disadvantages to consider with some of the options, such as weight gain and/or hypoglycemia associated with the use of thiazolidinediones (TZDs), sulfonylureas (SUs), and insulin.5,6 In contrast, some agents, such as SGLT2 inhibitors and GLP-1 receptor agonists, may be advantageous with respect to improved renal outcomes with SGLT2 inhibitors as well as improved cardiovascular (CV) outcomes with both of these classes of medications, which is a particular concern as CV effects are common and a leading cause of death among those with diabetes.7-9 Additional considerations include patient’s renal function, other comorbidities, planning pregnancy, cost and coverage, ease of administration, and patient preference.5
The drug under review is semaglutide (Rybelsus), available as an oral tablet at 3 dosage strengths: 3 mg, 7 mg, and 14 mg.10 Semaglutide is a selective GLP-1 receptor agonist that acts on the same receptor as native GLP-1, an endogenous incretin hormone.10 Semaglutide tablets received Health Canada Notice of Compliance (NOC) on March 30, 2020. Semaglutide tablets are indicated as an adjunct to diet and exercise to improve glycemic control in adults with T2DM: as monotherapy when metformin is considered inappropriate due to intolerance or contraindications; and in combination with other medicinal products for the treatment of diabetes.10 The recommended dose and dosage adjustment for semaglutide tablets is to begin with a starting dose of 3 mg once daily. After 30 days, the dose should be increased to a maintenance dose of 7 mg once daily. If additional glycemic control is needed after at least 30 days on the 7 mg dose, the dose can be increased to a maintenance dose of 14 mg once daily.10
The sponsor has requested that semaglutide tablets be reimbursed for the treatment of adult patients with T2DM in combination with MET, and in combination with MET and SU.
The objective of this review was to perform a systematic review of the beneficial and harmful effects of semaglutide oral tablets (3 mg, 7 mg, and 14 mg) as an adjunct to diet and exercise to improve glycemic control in adult patients with T2DM:
as monotherapy when metformin is considered inappropriate due to intolerance or contraindications; or
in combination with other medicinal products for the treatment of diabetes
Stakeholder Perspectives
The information in this section is a summary of input provided by the patient groups who responded to CADTH’s call for patient input and from 1 clinical expert consulted by CADTH for the purpose of this review.
Patient Input
Two patient group input submissions from Diabetes Canada and 1 from the type 2 Diabetes Experience Exchange (T2DXX), were provided for this review. Diabetes Canada used a series of online surveys with 1770 Canadian patients and caregivers that responded. T2DXX obtained data for their input from personal interviews and facilitated group discussions in their Experience Exchange forums, and through social media conversation threads. It is unclear how many patients contributed to the submission from T2DXX.
Patients reported that common symptoms of T2DM included extreme fatigue, unusual thirst, frequent urination and weight change (gain or loss). Hyperglycemia and hypoglycemia are often experienced by people with diabetes; high blood pressure and high cholesterol are common comorbid conditions. Patient groups reported that many healthy behaviours are required to manage diabetes including diet, physical activity, maintenance of a healthy body weight, taking medications (oral and/or injectable) as prescribed, monitoring blood glucose levels, and managing stress. Other health complications or comorbidities and financial barriers can make management of T2DM challenging. The management of blood glucose levels and the frequent visits to health care providers were highlighted as being constant and burdensome. One of the patient groups also described feelings of shame, guilt, and stigma in people with diabetes. Further, the stress of the disease and its potential complications was stated to be emotionally taxing for respondents, negatively influencing social interactions, mental health, and, ultimately, overall quality of life of patients.
The majority of respondents reported that keeping blood glucose at satisfactory levels during the day or after meals, avoiding weight change and avoiding gastrointestinal side effects (i.e., nausea, vomiting, diarrhea, abdominal pain), avoiding low blood sugar and reducing risk of heart problems were the most important considerations for medications for diabetes management. Other considerations reported by approximately 75% of respondents were avoiding urinary tract and/or yeast infections, avoiding fluid retention and reducing high blood pressure. A total of 6 patients reported having experience with semaglutide tablets, but their feedback indicated mixed results in terms added benefit for glycemic control and reduction of side effects when compared to other treatments.
Patients hoped new treatments would be safe, minimize side effects and damage to organs, and improve overall health outcomes. Respondents reported a strong desire to reduce the pill burden associated with treatment, or to be off medication entirely, for treatments to help resume ‘normal living’, such as the ability to eat without restrictions, for treatments with fewer unpleasant side effects (i.e., weight gain, hypoglycemia, gastrointestinal side effects) and which are less physically invasive (i.e., do not require an injection) and for treatments which can normalize/stabilize blood glucose levels, and improve A1C.
Clinician input
Input from clinical experts consulted by CADTH
The clinical expert indicated factors of current treatment that need to be improved upon include: better glycemic control, modification and ideally slowing down the progression of disease, prevention of complications (both microvascular and macrovascular), better side effect and safety profiles, and treatments that are more user-friendly to patients. The clinical expert stated that expected use of semaglutide tablets is aligned with the indication and that semaglutide tablets would be used as an add-on treatment in patients with T2DM when metformin is no longer effective as monotherapy (second-line treatment), as a first-line treatment when metformin is not tolerated, and as a third-line treatment on occasion.
Outcomes identified by the clinical expert that are important when assessing whether a patient is responding to treatment in clinical practice include: improvement in glycemic parameters, improvement in body weight with the attendant improvement in blood pressure and lipids, long-range improvement in microvascular and macrovascular events, and HRQoL. Patients that are most likely to exhibit a response to treatment with semaglutide are those individuals with T2DM who are not controlled with MET alone, who are overweight, who can tolerate minor GI discomforts and who are compliant with taking medication. Treatment should be discontinued if the glycemic response is inadequate, side-effects are intolerable, other treatments in development prove more effective, and according to patient preference. Lastly, the clinical expert felt that this semaglutide tablets can be prescribed by specialty and community-based clinics.
Clinician group input
CADTH did not receive any input from clinician groups for this review.
Drug program input
Representatives from the drug plans acknowledged that there was a lack of evidence comparing semaglutide tablets to semaglutide injections. They were also interested in the clinical expert’s opinion regarding whether there was sufficient evidence to support whether semaglutide tablets offered CV benefits. The clinical expert consulted by CADTH anticipated that, based on the evidence available at this time, physicians would continue to use semaglutide injections in patients when CV benefit was a priority.
Clinical Evidence
Pivotal Studies and Protocol Selected Studies
Description of studies
A total of 10 RCTs met the inclusion criteria for the systematic review. PIONEER 1 to 6 and 8 to 10 have been summarized in detail for this report (details for PIONEER 7 are provided in Appendix 3 as the intervention, semaglutide with flexible dosing, is not aligned with the criteria specified in the CADTH review protocol or the dosing recommended by Health Canada). All of the included studies were randomized, parallel-group, multi-centre, double-blind trials, except PIONEER 2 and 10, which were open-label. PIONEER 9 was a double-blind study with an and open-label treatment arm for liraglutide. A total of 9039 adult patients with T2DM were randomized in PIONEER 1 to 6 and 8 to 10. The trials evaluated the efficacy and safety of semaglutide tablets (3 mg, 7 mg, and 14 mg once daily) over 26 to 78 weeks of therapy. The trials were designed to assess semaglutide in comparison to a SGLT2 inhibitor (empagliflozin, PIONEER 2), a DPP-4 inhibitor (sitagliptin, PIONEER 3), and subcutaneous GLP-1 RAs (liraglutide, PIONEER 4 and 9, and dulaglutide, PIONEER 10), as well as placebo (PIONEER 1, 4 to 6, 8, and 9). Of note, PIONEER 4 and 9 were both active- and placebo-controlled trials. Semaglutide was evaluated as monotherapy (PIONEER 1, 6 and 9), as an add-on to metformin (PIONEER 2), as an add-on to 1 to 2 oral antidiabetics (OADs) (PIONEER 3, 4, 10) or insulin with or without metformin (PIONEER 8). The primary and key secondary outcomes in PIONEER 1 to 5, 8 and 9 was change from baseline to week 26 in A1C (%) and change from baseline to week 26 in body weight (kg), respectively. PIONEER 6 was an event-driven cardiovascular outcome trial (CVOT) that used time from randomization to first occurrence of a major cardiovascular event (MACE) as the primary outcome. Additionally, PIONEER 6 was the only trial to report diabetes-related morbidity and mortality outcomes. The number of treatment-emergent adverse events (TEAEs) during exposure to treatment was the primary outcome in the Japanese safety study, PIONEER 10. Other outcomes reported include HRQoL outcomes, blood pressure, and lipid profiles.
At baseline, patients had lived with T2DM for 3 to 16 years, had A1C levels that ranged from 7.9% to 8.4%, and were receiving treatment that ranged from diet and exercise alone to stable treatment with at least 1 antidiabetic medication. Patients included in PIONEER 5 and PIONEER 6 were living with moderate renal impairment (eGFR 30 to 59 mL/min/1.73 m2), and cardiovascular disease, respectively. In general, the baseline characteristics were similar between treatment groups within each of the included studies; however, there are a few differences to note. There were also differences across trials. The mean age of patients ranged from 54 to 61 years of age across all studies except PIONEER 5 and 6, where the mean age was 70 to 71 years and 66 years, respectively. The proportion of male patients per treatment group ranged from 47% to 57% in PIONEER 1 to 5 and 8, but was greater in PIONEER 6, representing 68% to 69% of enrolled patients, as well as in PIONEER 9 and 10, where 68% to 83% of patients were male. The trials also differed in terms of the race/ethnicity of participating patients. PIONEER 9 and 10 were conducted in Japanese patients only, and 94% to 97% of patients included in PIONEER 5 were White. The proportion of patients who were White ranged from 48% to 86%, Black ranged from 3% to 8%, Asian ranged from 7% to 36%, and Hispanic or Latino ranged from 4% to 30% in the rest of the PIONEER trials. The background medications used differed between the patient populations of included studies; however, this was due to the trial designs. The duration of diabetes ranged from 3 to 4 years in PIONEER 1, 14 to 16 years in PIONEER 5, 6, and 8, and ranged from 7 to 10 years in PIONEER 2 to 4, 9 and 10. Body weight was notably lower in PIONEER 9 and 10, which ranged from 68.0 kg to 74.7 kg, compared to the other PIONEER trials where the mean body weight was between 84.6 kg and 95.5 kg. Lastly, the mean eGFR was notably lower in PIONEER 5 and 6, which specifically included patients with impaired renal function.
Efficacy Results
Detailed results for the primary outcome in PIONEER 1 to 5, 8 and 9, change from baseline in A1C at week 26, are presented in Table 2. In active-controlled trials where semaglutide was evaluated as an add-on to 1 to 2 OADs:
SEM 14 mg was superior to empagliflozin with a between-group difference in A1C reduction of –0.4% (95 CI, –0.6 to –0.3, P < 0.0001) (PIONEER 2)
SEM 14 mg and 7 mg were superior to sitagliptin with a between-group difference in A1C reduction of –0.3% (95% CI, –0.4 to –0.1, P < 0.0001) and –0.5% (95% CI, –0.6 to –0.4, P < 0.0001), respectively (PIONEER 3)
SEM 3 mg failed to demonstrate non-inferiority to sitagliptin with a difference of 0.2% (95% CI, 0.1 to 0.3, P = 0.0856) in favour of sitagliptin (PIONEER 3)
SEM 14 mg was non-inferior to liraglutide 1.8 mg, the between-group difference in A1C reduction was –0.1% (95% CI, –0.3 to 0.0, P < 0.0001) (PIONEER 4)
When compared to placebo, semaglutide 3 mg, 7 mg, and 14 mg (unless otherwise noted) demonstrated superiority based on:
A between-group difference in A1C reduction of –0.6% (95% CI, –0.8 to –0.4, P < 0.0001) to –1.1% (95% CI, –1.3 to –0.9, P < 0.0001) when used as monotherapy in treatment-naïve patients (PIONEER 1)
A between-group difference in A1C reduction of –0.8% (95% CI, –1.0 to –0.6, P < 0.0001) (SEM 14 mg only) as an add-on to MET alone, SU with or without MET, and basal insulin with or without MET, in patients with moderate renal impairment (PIONEER 5)
A between-group difference in A1C reduction of–0.5% (95% CI, –0.7 to –0.3, P < 0.0001) to –1.2% (95% CI, –1.4 to –1.0, P < 0.0001) as an add-on to insulin with or without MET (PIONEER 8)
A between-group difference in A1C reduction of –1.1% (95% CI, –1.2 to –0.9, P < 0.0001) (SEM 14 mg only) as an add-on to MET with or without a SGLT2 inhibitor (PIONEER 4)
Additionally, a between-groups difference of –0.8% to –1.4% was reported for semaglutide 3 mg, 7 mg, and 14 mg compared to placebo, and 0.2% to –0.4% compared to liraglutide 0.9 mg in PIONEER 9. In PIONEER 10, a between-groups difference of 0.4% to –0.4% was reported for semaglutide 3 mg, 7 mg, and 14 mg compared to dulaglutide. The clinical expert indicated a reduction of 0.5% in A1C or achievement of A1C between 8 and 8.5% or lower was clinically meaningful, 1 of which was achieved by all treatment groups in the PIONEER studies.
In terms of a reduction in body weight from baseline to week 26, semaglutide as an add-on to 1 to 2 OADs in active-controlled trials (Table 3):
demonstrated superiority to sitagliptin with a between-groups difference of –1.6 kg (95% CI, –2.0 to –1.1, P < 0.0001) and –2.5 kg (95% CI, –3.0 to –2.0, P < 0.0001) for SEM 14 mg and 7 mg, respectively (PIONEER 3)
demonstrated superiority to liraglutide with a between-groups difference of –1.2 kg (95% CI, –1.9 to –0.6, P = 0.0003) for SEM 14 mg (PIONEER 4)
reported a between-groups difference of –0.6 kg (95% CI, –1.1 to –0.1, P = 0.0185) for SEM 3 mg compared to sitagliptin (PIONEER 3); however, the analysis was conducted following a failure in the statistical testing hierarchy and therefore must be interpreted nominally
reported a between-groups difference of –0.1 kg (95% CI, –0.7 to 0.5, P = 0.7593) for SEM 14 mg compared to empagliflozin, which corresponded to no difference in treatment effect (PIONEER 2)
In placebo-controlled trials, the change in body weight at week 26 was evaluated compared to placebo, where:
SEM 14 mg demonstrated superiority as monotherapy in treatment-naïve patients with a between-groups difference of –2.3 kg (95% CI, –3.1 to –1.5, P < 0.0001) compared to placebo; however, (PIONEER 1)
SEM 14 mg demonstrated superiority in patients with renal impairment with a between-groups difference of –2.5 kg (95% CI, –3.2 to –1.8, P < 0.0001) compared to placebo (PIONEER 5)
SEM 3 mg, 7 mg, and 14 mg demonstrated superiority as an add-on to insulin with or without MET in patients with a between-groups difference of –0.9 kg (95% CI, –1.8 to –0.0, P = 0.0392), –2.0 kg (95% CI, –3.0 to –1.0, P < 0.0001), and –3.3 kg (95% CI, –4.2 to –2.3, P < 0.0001) (PIONEER 8)
A between-groups difference of –0.1 kg (95% CI, –0.9 to 0.8, P = 0.8692) for SEM 3 mg and 7 mg –0.9 (95% CI, –1.9 to 0.1, P = 0.0866) did not demonstrate a difference in treatment effect
The clinical expert consulted for this review suggested a change in weight of at least 2 kg over 26 weeks would be a meaningful change in clinical practice. This was achieved by patients treated with semaglutide 7 mg and 14 mg in PIONEER 1 to 8, and patients treated with semaglutide 14 mg in PIONEER10. Of note, patients in PIONEER 9 and 10 weighed less at baseline compared to patients in PIONEER 1 to 6 and 8.
Mortality (as an efficacy outcome) and diabetes-related morbidity were only reported in PIONEER 6, and time from randomization to first event adjudication committee (EAC)-confirmed MACE was the primary outcome in the trial. Non-inferiority based on a margin of 1.8 for the hazard ratio (HR) required confirmation before assessing for superiority. The HR for semaglutide 14 mg compared to placebo was 0.79 (95% CI, 0.57 to 1.11), therefore demonstrating non-inferiority by the pre-specified non-inferiority margin; however, the analysis for superiority was not confirmed (P = 0.1749). EAC-confirmed all-cause deaths were reported for 23 patients (1.4%) in the semaglutide 14 mg treatment group and 45 patients (2.8%) in the placebo treatment group of the CVOT. Ten of the 23 deaths in the semaglutide 14 mg treatment group, and 23 of the 45 deaths in the placebo treatment group were caused by CV events.
Health-related quality of life was evaluated in PIONEER 1 to 5, and 8 to 10 using the Short-Form Survey version 2 (SF-36v2), Diabetes Treatment Satisfaction Questionnaire (DTSQ), Diabetes Treatment-Related Quality of Life Questionnaire (DTR-QOL), Control of Eating Questionnaire (CoEQ) and the Impact of Weight on Quality of Life Questionnaire-Lite version (IWQOL). These outcomes were exploratory and measured as a change from baseline. Overall, semaglutide did not show benefit in terms of HRQoL when evaluated against active and placebo comparators.
Change in blood pressure and lipid profile were also evaluated as exploratory outcomes in the included PIONEER studies, the results for which were not notable. Health care resource utilization was included as an outcome in the systematic review protocol, but was not assessed in any of the included studies.
Pre-specified subgroup analyses on the primary analysis in PIONEER 6 were conducted by: sex, age (less than 65 years, 65 years or greater), region, race, BMI, A1C (8.5% or less, greater than 8.5%), renal function (less than 60 mL/min/1.73m2, 60 mL/min/1.73m2 or greater), and evidence of CV disease at screening. The treatment effect may be greater for patients that weight less (BMI of 30 or less), without a history of myocardial infarction (MI) or stroke before randomization, and for patients exhibiting CV risk factors; however, the latter is limited by a wide confidence interval. Subgroup analyses by A1C, renal function or for patients with a BMI greater than 30, prior MI or stroke, and presence of CV disease do not appear to have a differential treatment effect. Subgroup analyses by background therapy on the change in A1C and body weight in PIONEER 3 and PIONEER 4 were also reported, and were consistent with the primary analysis.
Harms Results
A summary of key harms results is provided in Table 4. The overall frequency of AEs was similar between treatment groups. In the active-controlled trials, AEs were reported by 71% to 80% of patients treated with semaglutide, 70% to 83% of patients treated with active comparators (all: empagliflozin, sitagliptin, liraglutide, and dulaglutide), and 67% of patients in the placebo group of PIONEER 4. In placebo-controlled trials, between 53 and 58% of patients in the semaglutide groups and 56% of patients in the placebo group of PIONEER 1 reported AEs. In PIONEER 5 and 8, between 74% and 83% of patients in semaglutide treatment groups and 65% to 76% of patients in the placebo treatment groups reported AEs. In PIONEER 9 and 10, between 71% and 85% of patients in semaglutide treatment groups, 67% to 82% of patients in the active comparator groups (liraglutide and dulaglutide), and 80% of patients in the placebo treatment group reported AEs. Overall AEs were not reported in PIONEER 6.
In PIONEER 1 to 5, and 8 to 10, SAEs were reported by 0% to 14% of patients across all treatment groups and the frequency of SAEs was similar between treatment groups in all trials. Serious AEs were a key focus of PIONEER 6; 18.9% and 22.5% of patients in the semaglutide 14 mg and placebo treatment groups, respectively, reported a SAE. Individual SAEs were infrequently reported. In PIONEER 1 to 5, and 8 to 10, WDAEs ranged from 2% to 15% in semaglutide treatment groups, 0% to 9% of active comparator groups (empagliflozin, sitagliptin, and liraglutide), and 0% to 5% of placebo groups. Gastrointestinal disorders were the most commonly reported reasons for WDAEs in all studies. In PIONEER 6, 27% of patients in the semaglutide 14 mg treatment group and 17% of patients in the placebo treatment group WDAE, with the most common reasons for WDAE attributed to gastrointestinal disorders. Few deaths were reported in the PIONEER trials. A total of 16 deaths were reported in semaglutide treatment groups across PIONEER 1 to 5 and 8 to 10, 8 deaths were reported in active treatment groups (all), and 3 deaths were reported in placebo groups. No deaths were reported in PIONEER 1, 9, or 10. Deaths for PIONEER 6 were reported in the efficacy section under mortality outcomes.
In all studies, AEs were largely driven by GI disorders; nausea, vomiting, and diarrhea in particular. In general, GI-related AEs were higher in patients treated with semaglutide compared to placebo, as well as active comparators with the exception of other GLP-1 RAs. Health Canada’s review of the safety data concluded that the safety profile of semaglutide tablets, including the frequency of GI AEs, was comparable to the other previously authorized GLP-1 RAs, including Ozempic (semaglutide injection).11
Table 2: Summary of key efficacy outcomes: change from baseline to week 26 in A1C % (FAS)
Study | Treatment | N | Baseline A1C, % Mean (SD) | Change from Baseline A1C, % Mean (SE) | Between-Group Difference, Mean (95% CI) | P value |
|---|---|---|---|---|---|---|
Active-controlled trials, add-on to 1-2 OADsa | ||||||
PIONEER 2b | SEM 14 mg | 411 | 8.1 (0.9) | –1.3 | –0.4 (–0.6 to –0.3) | < 0.0001 |
EMPA 25 mg | 410 | 8.1 (0.9) | –0.9 | – | – | |
PIONEER 3b | SEM 3 mg | 466 | 8.3 (1.0) | –0.6 | NI: 0.2 (0.1 to 0.3) 0.2 (0.0 to 0.3) | NI: 0.0856 0.0080e |
SEM 7 mg | 465 | 8.4 (1.0) | –1.0 | –0.3 (–0.4 to –0.1) | < 0.0001 | |
SEM 14 mg | 465 | 8.3 (0.9) | –1.3 | –0.5 (–0.6 to –0.4) | < 0.0001 | |
SITA 100 mg | 467 | 8.3 (0.9) | –0.8 | – | – | |
PIONEER 4b | SEM 14 mg | 285 | 8.0 (0.7) | –1.2 | –0.1 (–0.3 to 0.0) [vs LIRA] –1.1 (–1.2 to –0.9) [vs. PBO] | 0.0645 [vs. LIRA] < 0.0001 [vs. PBO] |
LIRA 1.8 mg | 284 | 8.0 (0.7) | –1.1 | – | – | |
PBO | 142 | 7.9 (0.7) | –0.2 | – | – | |
Placebo-controlled trials | ||||||
PIONEER 1b | SEM 3 mg | 175 | 7.9 (0.7) | –0.9 | –0.6 (–0.8 to –0.4) | < 0.0001 |
SEM 7 mg | 175 | 8.0 (0.6) | –1.2 | –0.9 (–1.1 to –0.6) | < 0.0001 | |
SEM 14 mg | 175 | 8.0 (0.7) | –1.4 | –1.1 (–1.3 to –0.9) | < 0.0001 | |
PBO | 178 | 7.9 (0.7) | –0.3 | – | – | |
PIONEER 5b | SEM 14 mg | 163 | 8.0 (0.7) | –1.0 | –0.8 (–1.0 to –0.6) | < 0.0001 |
PBO | 161 | 7.9 (0.7) | –0.2 | – | – | |
PIONEER 8b | SEM 3 mg | 184 | 8.2 (0.7) | –0.6 | –0.5 (–0.7 to –0.3) | < 0.0001 |
SEM 7 mg | 182 | 8.2 (0.7) | –0.9 | –0.9 (–1.1 to –0.7) | < 0.0001 | |
SEM 14 mg | 181 | 8.2 (0.7) | –1.3 | –1.2 (–1.4 to –1.0) | < 0.0001 | |
PBO | 184 | 8.2 (0.7) | –0.1 | – | – | |
Population-specific supportive studies | ||||||
PIONEER 9c | SEM 3 mg | 49 | 8.1 (0.8) | –1.1 | –0.8 (–1.1 to –0.5) [vs. PBO] 0.2 (–0.1 to 0.5) [vs. LIRA] | < 0.0001d [vs. PBO] 0.1958d [vs. LIRA] |
SEM 7 mg | 49 | 8.3 (1.0) | –1.6 | –1.2 (–1.5 to –0.9) [vs. PBO] –0.2 (–0.5 to 0.2) [vs. LIRA] | < 0.0001d [vs. PBO] 0.1868d [vs. LIRA] | |
SEM 14 mg | 48 | 8.0 (0.9) | –1.8 | –1.4 (–1.7 to –1.1) [vs. PBO] –0.4 (–0.7 to –0.1) [vs. LIRA] | < 0.0001d [vs. PBO] 0.0077d [vs. LIRA] | |
PBO | 49 | 8.3 (0.8) | –0.4 | – | – | |
LIRA 0.9 mg | 48 | 8.3 (1.1) | –1.4 | – | – | |
PIONEER 10b | SEM 3 mg | 131 | 8.2 (0.9) | –1.1 | 0.4 (0.1 to 0.7) | 0.0026d |
SEM 7 mg | 132 | 8.3 (0.9) | –1.7 | –0.1 (–0.4 to 0.1) | 0.2710d | |
SEM 14 mg | 130 | 8.4 (1.0) | –2.0 | –0.4 (–0.7 to –0.2) | 0.0006d | |
DULA 0.75 mg | 65 | 8.4 (0.9) | –1.5 | – | – | |
A1C = glycated hemoglibin; DULA = dulaglutide; EMPA = empagliflozin; CI = confidence interval; FAS = full analysis set; LIRA = liraglutide; NI = non-inferiority; PBO = placebo; SD = standard deviation; SE = standard error; SEM = semaglutide; SITA = sitagliptin.
aFor PIONEER 2, 3, and 4, the results for the test of superiority have been presented following demonstration of non-inferiority. For analyses that were unsuccessful in demonstration non-inferiority in these studies, the results of the non-inferiority analysis have been presented as well.
bData from the in-trial observation period. Missing post-baseline values were imputed by a pattern mixture model using multiple imputation. Pattern was defined by treatment arm and treatment status (premature treatment discontinuation and/or initiation of rescue medication), and imputations were based on an ANCOVA model. Imputation was from own treatment arm and same treatment status. Change from baseline was analyzed using an ANCOVA model with treatment, strata, and region as categorical fixed effects and baseline value as covariate for each of the 1000 imputed complete datasets, and pooled by Rubin's rule to draw inference.
cPIONEER 9: Data from the in-trial observation period. Missing post-baseline values were imputed by a pattern mixture model using multiple imputation. Pattern was defined by treatment arm and treatment status, and imputations were based on an ANCOVA model. Imputation was done within 6 (6) groups of subjects; 1 (1) group of subjects regardless of randomized treatment arm who at week 26 (or week 52) had discontinued treatment or initiated rescue medication, and 5 (5) groups of subjects defined by randomized treatment arm for subjects that were still on treatment and had not initiated rescue medication. Change from baseline was analyzed using an ANCOVA model with treatment and strata as categorical fixed effects and baseline value as covariate for each of the 1000 imputed complete datasets, and pooled by Rubin's rule to draw inference.
dP-value has not been adjusted for multiple testing.
eP-value cannot be used for inference due to a previously failed test in the statistical testing hierarchy. The P-value should be interpreted as nominal.
Table 3: Summary of key efficacy outcomes: change from baseline to week 26 in body weight (kg) (FAS)
Study | Treatment | N | Baseline body weight, kg Mean (SD) | Change from Baseline body weight, kg Mean (SE)a | Between-Group Difference, Mean (95% CI) | P value |
|---|---|---|---|---|---|---|
Active-controlled trials, add-on to 1-2 OADs | ||||||
PIONEER 2b | SEM 14 mg | 411 | 91.9 (20.5) | –3.8 | –0.1 (–0.7 to 0.5) | 0.7593 |
EMPA 25 mg | 410 | 91.3 (20.1) | –3.7 | – | – | |
PIONEER 3b | SEM 3 mg | 466 | 91.6 (22.0) | –1.2 | –0.6 (–1.1 to –0.1) | 0.0185c |
SEM 7 mg | 465 | 91.3 (20.8) | –2.2 | –1.6 (–2.0 to –1.1) | < 0.0001 | |
SEM 14 mg | 465 | 91.2 (21.7) | –3.1 | –2.5 (–3.0 to –2.0) | < 0.0001 | |
SITA 100 mg | 467 | 90.9 (21.0) | –0.6 | – | – | |
PIONEER 4b | SEM 14 mg | 285 | 92.9 (20.6) | –4.4 | –1.2 (–1.9 to –0.6) [vs. LIRA] –3.8 (–4.7 to –3.0) [vs. PBO] | 0.0003d [vs. LIRA] < 0.0001 [vs. PBO] |
LIRA 1.8 mg | 284 | 95.5 (21.9) | –3.1 | – | – | |
PBO | 142 | 93.2 (20.0) | –0.5 | – | – | |
Placebo-controlled trials | ||||||
PIONEER 1b | SEM 3 mg | 175 | 86.9 (21.0) | –1.5 | –0.1 (–0.9 to 0.8) | 0.8692 |
SEM 7 mg | 175 | 89.0 (21.8) | –2.3 | –0.9 (–1.9 to 0.1) | 0.0866 | |
SEM 14 mg | 175 | 88.1 (22.1) | –3.7 | –2.3 (–3.1 to –1.5) | < 0.0001 | |
PBO | 178 | 88.6 (23.4) | –1.4 | – | – | |
PIONEER 5b | SEM 14 mg | 162 | 91.3 (17.8) | –3.4 | –2.5 (–3.2 to –1.8) | < 0.0001 |
PBO | 161 | 90.4 (17.5) | –0.9 | – | – | |
PIONEER 8b | SEM 3 mg | 184 | 85.9 (21.5) | –1.4 | –0.9 (–1.8 to –0.0) | 0.0392 |
SEM 7 mg | 182 | 87.1 (23.6) | –2.4 | –2.0 (–3.0 to –1.0) | 0.0001 | |
SEM 14 mg | 181 | 84.6 (21.0) | –3.7 | –3.3 (–4.2 to –2.3) | < 0.0001 | |
PBO | 184 | 86.0 (21.4) | –0.4 | – | – | |
Population-specific supportive studies | ||||||
PIONEER 9e | SEM 3 mg | 49 | 71.4 (14.3) | –0.6 | 0.6 (–0.3 to 1.5) [vs. PBO] –0.5 (–1.5 to 0.4) [vs. LIRA] | 0.2291d [vs. PBO] 0.2434d [vs. LIRA] |
SEM 7 mg | 49 | 71.3 (10.8) | –1.1 | 0.0 (–0.8 to 0.9) [vs. PBO] –1.1 (–2.0 to –0.2) [vs. LIRA] | 0.9481d [vs. PBO] 0.0190d [vs. LIRA] | |
SEM 14 mg | 48 | 68.0 (13.0) | –2.4 | –1.2 (–2.1 to –0.4) [vs. PBO] –2.3 (–3.2 to –1.4) [vs. LIRA] | 0.0060d [vs. PBO] < 0.0001d [vs. LIRA] | |
PBO | 49 | 74.7 (15.4) | –1.1 | – | – | |
LIRA 0.9 mg | 48 | 70.3 (12.4) | –0.0 | – | – | |
PIONEER 10b | SEM 3 mg | 131 | 71.5 (16.0) | –0.2 | –0.5 (–1.3 to 0.4) | 0.2632d |
SEM 7 mg | 132 | 72.7 (16.4) | –1.0 | –1.3 (–2.2 to –0.5) | 0.0023d | |
SEM 14 mg | 130 | 72.6 (15.2) | –2.2 | –2.5 (–3.3 to –1.7) | < 0.0001d | |
DULA 0.75 mg | 65 | 71.2 (14.3) | 0.3 | – | – | |
aStandard error was not reported.
bData corresponds to the treatment policy estimand, using the in-trial observation period. Missing post-baseline values were imputed by a pattern mixture model using multiple imputation. Pattern was defined by treatment arm and treatment status (premature treatment discontinuation and/or initiation of rescue medication), and multiple imputations were based on an ANCOVA model. Multiple imputation was from own treatment arm and same treatment status. Change from baseline was analyzed using an ANCOVA model with treatment, strata, and region as categorical fixed effects and baseline value as covariate for each of the 1000 imputed complete datasets, and pooled by Rubin's rule to draw inference.
cP-value cannot be used for inference due to a previously failed test in the statistical testing hierarchy. The P-value should be interpreted as nominal.
dP-value has not been adjusted for multiple testing.
eData presented corresponds to the treatment policy estimand, using the in-trial observation period. Missing post-baseline values were imputed by a pattern mixture model using multiple imputation. Pattern was defined by treatment arm and treatment status, and multiple imputations were based on an ANCOVA model. Multiple imputation was done within 6 groups of subjects; 1 group regardless of randomized treatment arm who at week 26 (or week 52) had discontinued treatment or initiated rescue medication, and 5 groups defined by randomized treatment arm for subjects that were still on treatment and had not initiated rescue medication. Change from baseline was analyzed using an ANCOVA model with treatment and strata as categorical fixed effects and baseline value as covariate for each of the 1000 imputed complete datasets, and pooled by Rubin's rule to draw inference.
Table 4: Summary of Key Safety Results from Pivotal and Protocol Selected Studies (SAS)
Study | Treatment | N | Patients with ≥ 1 AE, n (%) | Patients with ≥ 1 SAE, n (%) | AEs leading to premature treatment discontinuation, n (%) | Death, n (%) | GI disorders, n (%) |
|---|---|---|---|---|---|---|---|
Active-controlled trials, add-on to 1-2 OADs | |||||||
PIONEER 2 | SEM 14 mg | 410 | 289 (70.5) | 27 (6.6) | 44 (10.7) | 0 | 165 (40.2) |
EMPA 25 mg | 409 | 283 (69.2) | 37 (9.0) | 18 (4.4) | 1 (0.2) | 56 (13.7) | |
PIONEER 3 | SEM 3 mg | 466 | 370 (79.4) | 64 (13.7) | 26 (5.6) | 5 (1.1) | 150 (32.2) |
SEM 7 mg | 464 | 363 (78.2) | 47 (10.1) | 27 (5.8) | 3 (0.6) | 164 (35.3) | |
SEM 14 mg | 465 | 370 (79.6) | 44 (9.5) | 54 (11.6) | 1 (0.2) | 196 (42.2) | |
SITA 100 mg | 467 | 388 (83.3) | 58 (12.4) | 24 (5.2) | 3 (0.6) | 150 (32.2) | |
PIONEER 4 | SEM 14 mg | 285 | 229 (80) | 31 (11) | 31 (11) | 3 (1.1) | 125 (43.9) |
LIRA 1.8 mg | 284 | 211 (74) | 22 (8) | 26 (9) | 4 (1.4) | 97 (34.2) | |
PBO | 142 | 95 (67) | 15 (11) | 5 (4) | 1 (0.7) | 34 (23.9) | |
Placebo-controlled trials | |||||||
PIONEER 1 | SEM 3 mg | 175 | 101 (57.7) | 5 (2.9) | 4 (2.3) | 0 | 44 (25.1) |
SEM 7 mg | 175 | 93 (53.1) | 3 (1.7) | 7 (4.0) | 0 | 32 (18.3) | |
SEM 14 mg | 175 | 99 (56.6) | 2 (1.1) | 13 (7.4) | 0 | 55 (31.4) | |
PBO | 178 | 99 (55.6) | 8 (4.5) | 4 (2.2) | 0 | 30 (16.9) | |
PIONEER 5 | SEM 14 mg | 163 | 120 (73.6) | 17 (10) | 24 (14.7) | 1 (0.6) | 73 (44.8) |
PBO | 161 | 105 (65.2) | 17 (11) | 8 (5.0) | 2 (1.2) | 27 (16.8) | |
PIONEER 8 | SEM 3 mg | 184 | 137 (74.5) | 25 (13.6) | 13 (7.1) | 0 | 72 (39.1) |
SEM 7 mg | 182 | 142 (78.5) | 19 (10.5) | 16 (8.8) | 0 | 81 (44.8) | |
SEM 14 mg | 181 | 151 (83.4) | 12 (6.6) | 24 (13.3) | 3 (1.7) | 91 (50.3) | |
PBO | 184 | 139 (75.5) | 17 (9.2) | 5 (2.7) | 0 | 47 (25.5) | |
PIONEER 6 | SEM 14 mg | 1591 | NR | 301 (18.9) | 426 (26.8) | 23 (1.4) | 24 (1.5)a |
PBO | 1592 | NR | 358 (22.5) | 268 (16.8) | 45 (2.8) | 22 (1.4)a | |
Population-specific supportive studies | |||||||
PIONEER 9 | SEM 3 mg | 410 | 37 (76) | 2 (4) | 1 (2) | 0 | 17 (34.7) |
SEM 7 mg | 49 | 37 (76) | 3 (6) | 1 (2) | 0 | 18 (36.7) | |
SEM 14 mg | 48 | 34 (71) | 0 | 2 (4) | 0 | 16 (33.3) | |
PBO | 48 | 32 (67) | 0 | 0 | 0 | 18 (37.5) | |
LIRA 0.9 mg | 49 | 39 (80) | 3 (6) | 0 | 0 | 10 (20.4) | |
PIONEER 10 | SEM 3 mg | 131 | 101 (77) | 9 (7) | 4 (3) | 0 | 40 (30.5) |
SEM 7 mg | 132 | 106 (80) | 4 (3) | 8 (6) | 0 | 51 (38.6) | |
SEM 14 mg | 130 | 111 (85) | 7 (5) | 8 (6) | 0 | 70 (53.8) | |
DULA 0.75 mg | 65 | 53 (82) | 1 (2) | 2 (3) | 0 | 26 (40.0) | |
AE = adverse event; DULA = dulaglutide; EMPA = empagliflozin; GI = gastrointestinal; LIRA = liraglutide; PBO = placebo; SAE = serious adverse event; SD = standard deviation; SE = standard error; SEM = semaglutide; SITA = sitagliptin.
aSerious AEs only
Data from the “on-treatment” observation period.
Critical Appraisal
PIONEER 2 to 4 were required to demonstrate non-inferiority for comparisons to active treatments before testing for superiority. Pre-defined non-inferiority margins of 0.4% were used in PIONEER 2 and PIONEER 4 and 0.3% was used in PIONEER 3; however, justification for the use of a 0.4% non-inferiority margin was weak. Further, the primary analysis of semaglutide 14 mg compared to placebo in PIONEER 6 used a non-inferiority margin corresponding to a HR of 1.8, which was considered inappropriate by Health Canada11 as 1.3 is recommended.21 Another limitation of the trials was that the statistical testing procedures were only used to account for multiple comparisons among the primary and key secondary end points in PIONEER 1 to 5, and 8 and was thus limited to change from baseline to week 26 in A1C and body weight in these studies. Consequently, many of the outcomes (HRQoL, lipid profile outcomes, BMI) reported in the included studies were subject to type I error. Also of note, the open-label study design of PIONEER 2 and 10, as well as discontinuation from treatment due to adverse events and inferred treatment received may have introduced bias to patient reported outcomes and safety analyses, creating uncertainty for these results.
Included studies provided evidence for a heterogenous population of patients with T2DM in terms of disease background, treatment experience, background therapies, and comorbid conditions (renal impairment and CV disease). The comparators used in the trials (empagliflozin, sitagliptin, liraglutide, and dulaglutide) were representative of treatment options for T2DM that are currently used in Canadian clinical practice. The clinical expert consulted for this review supported that the trials overall were fairly generalizable to Canadian patients living with T2DM; however, there are some issues to note with regards to the demographic characteristics of patients, which do not reflect the racial and ethnic diversity of Canadian patients (for example, the majority of patients were white, and Asian patients were typically underrepresented). None of the trials included patients that were specifically contraindicated or intolerant of metformin. In PIONEER 1 and 9 where semaglutide was used as monotherapy, patients were previously treated with diet and exercise, or an OAD (in PIONEER 9) that required a wash-out period. The clinical expert suggested that there is uncertainty regarding whether the from PIONEER 1 are applicable to patients who are intolerant to metformin. Most of the outcomes assessed in the included studies were relevant to clinical practice and based on clinical outcome such as change in A1C, body weight, lipid profile, blood pressure, mortality, and diabetes-related morbidity.
Indirect Comparisons
Description of studies
The ITC consisted of 2 components analyzing change in A1C and change in body weight. The first explored semaglutide as a second-line treatment added to metformin and the second investigated semaglutide as third-line treatment added to metformin and a SU. The methods and analysis used in both were similar and drew from the same systematic review. Forty-three studies were included in NMA for second-line therapies, with 10 of the trials compared to placebo. All trials included a total of 22,721 patients with an average of 220 patients per treatment group, ranging from 14 to 780 patients. The baseline A1C between the different studies ranged from 7.2% to 8.8%. All studies reported age and gender. The baseline weight was an average of 89.2 kg ranging from 79.7 kg to 101.9 kg. The studies were drawn from 2 decades with all studies from 2004 to 2018.
The NMA for third-line therapies included 9 studies in the network with 1 of the trials compared to placebo. All trials included a total of 3,867 patients with an average of 184 patients per treatment group, ranging from 40 to 378. The baseline A1C between the different studies ranged from 8% to 9%. All studies reported age and gender. The baseline weight was an average of 85 kg ranging from 76 kg to 91 kg; but half the studies did not report a baseline weight. The studies were published from 2014 to 2018.
Efficacy Results
Second-line ITC: Overall, semaglutide tablets was found to be more efficacious for reducing A1C versus the majority of other second-line treatments. It was found to be more efficacious than placebo [–1.25 (–1.41, –1.09] and as efficacious to other drugs within the class. The network was found to be largely consistent with only 3 comparisons (1 loop) found to be inconsistent (saxagliptan- > placebo- > dapagliflozin), additional analysis did not change the results. The treatment difference in weight analysis was limited to 35 studies and overall, results suggested that semaglutide tablets were more efficacious for treatment differences in weight versus the majority of other second-line treatments. It was found to be more efficacious than placebo [–3.09 (–3.72, –2.54)] and as efficacious to other drugs within the class. The network was found to be consistent throughout.
Third-line ITC: Overall, semaglutide tablets were found to be the most efficacious for reducing A1C versus all other third-line treatments. It was found to be more efficacious than placebo [–1.33(–1.55, –1.12)]. The network was found to be consistent throughout. The treatment differences in weight analysis was limited to 8 studies and overall, results suggested that semaglutide tablets were to be more efficacious for weight loss versus all other third-line treatments. It was not found to be more efficacious than placebo [–2.20 (–6.88, 2.50] and with only other drugs within the class being as efficacious. The network was found to be consistent throughout.
Harms Results
An analysis of safety was not conducted in the ITC reviewed.
Critical Appraisal
The applicability of the sponsor’s ITC is impacted of the limited scope of the analysis and minimalistic analysis conducted. As described above, the sponsor-submitted ITC did include an extensive systematic review but was limited by the research question, especially limiting to only 2 outcomes. This restriction significantly limited the utility and the robustness of the results. Importantly, no exploration of baseline differences between studies was included. Overall, the results of the submitted ITC indicate semaglutide is likely better than placebo both as second- and third-line therapy. Further, the results may suggest superiority to other treatment classes, specifically SGLT-2 inhibitors, DPP-4 inhibitors, TZD, and SUs; however, all of the results should be interpreted with consideration for the previously described limitations. No conclusions can be made for efficacy or safety outcomes beyond glycemic reduction and weight loss since these outcomes were not evaluated.
Conclusions
The safety and efficacy of semaglutide tablets was evaluated in a total of 9 studies in patients on a variety of background therapies. In terms of glycemic control, once daily treatment with semaglutide tablets demonstrated superiority compared to placebo as monotherapy and as add-on therapy, and as add-on therapy in patients with moderate renal impairment (semaglutide 14 mg). When compared to active treatments as an add-on therapy, semaglutide 14 mg demonstrated superiority to empagliflozin and sitagliptin, and was non-inferior to liraglutide. Semaglutide 7 mg was superior to sitagliptin as well; semaglutide 3 mg failed to demonstrate non-inferiority. In terms of a reduction in body weight, semaglutide demonstrated mixed results. In general, superiority was demonstrated with semaglutide 14 mg with all comparators, but semaglutide 7 mg and 3 mg did not consistently show benefit. Of note, semaglutide 7 mg and 3 mg as monotherapy did not demonstrate superiority in terms of a reduction in body weight when compared to placebo. Regarding CV safety, semaglutide 14 mg was non-inferior to placebo based on time from randomization to first EAC-confirmed MACE indicating no increase in risk in the occurrence of MACE with semaglutide compared to placebo. Based on currently available evidence, CV benefit with semaglutide tablets cannot be claimed. Other outcomes such as HRQoL, blood pressure, and lipid profile were also included in the PIONEER studies as supportive outcomes; however, none of these outcomes were controlled for multiplicity.
The safety profile of semaglutide tablets is comparable to other GLP-1 RAs, with GI disorders such as nausea frequently reported. A clear benefit in HRQoL was not demonstrated based on the included studies, and with a lack of additional evidence regarding outcomes such as diabetes-related morbidity beyond the CVOT, or a direct comparison to semaglutide injection.
Introduction
Disease Background
Diabetes mellitus is a metabolic disease that is characterized by persistent elevations in blood glucose, or hyperglycemia. There are 2 main subtypes of diabetes mellitus: type 1 diabetes mellitus, which is caused by inadequate secretion of insulin from pancreatic beta cells, and type 2 diabetes mellitus (T2DM), which results from target cells for insulin that are unresponsive to the insulin that is produced as well as inadequate production of insulin from the beta cells of the pancreas. Type 2 diabetes mellitus is more common than type 1, accounting for approximately 90% of cases of diabetes mellitus.1
The etiology of diabetes mellitus is associated with genetic factors and environmental triggers are believed to play a role in the development of disease.22 Onset of T2DM typically occurs around 40 years of age or older,2 though this is changing with the increase in obesity and sedentary behaviours leading to more frequent diagnosis of T2DM in children and younger people.3 Poor diet and minimal exercise, and associated weight gain, are considered major risk factors for T2DM.23 In the earlier stages of disease, patients with T2DM are able to secrete insulin and may even be hyperinsulinemic; however, the disease may progress to a stage where insulin secretion is reduced, similar to type 1 diabetes mellitus. As described by the patient input received for this review, common symptoms of diabetes include extreme fatigue, unusual thirst, frequent urination, and weight change. More serious complications may present for patients with poor glucose control. For example, low glucose may cause confusion, coma, or seizures. High glucose levels may lead to more long-term issues such as damage to the nerves and blood vessels, which increases the risk of blindness, heart disease, stroke, peripheral vascular disease, kidney disease, neuropathy, and damage to the extremities. Patients also reported that diabetes has a great impact on the patients’ emotional, social, and economic status.
The prevalence of diabetes is increasing at a dramatic rate around the world. In a report produced by the WHO, there was an estimated 422 million adults living with diabetes globally in 2014, up from 108 million in 1980.3 Further, this number is projected to increase to 693 million by 2045 if the current trends continue.22 Diabetes is a significant problem in Canada, and is 1 of the most common chronic diseases in the country. Diabetes Canada estimated that 3.8 million people in Canada (10% of the population) were living with diabetes in 2020, and that this number will increase to 4.9 million people (12%) by 2030.4 People with diabetes are more likely to be hospitalized and to experience complications requiring care by a specialist. It is estimated that by 2030, the direct costs of diabetes for the Canadian health care system will increase to C$4.9 billion per year.4
Standards of Therapy
Treatment regimens and therapeutic targets should be individualized in patients with T2DM due to the heterogeneous nature of the disease. Initial treatment often consists of lifestyle modifications through diet and exercise, in addition to nutrition counselling, smoking cessation and avoidance of excess intake of alcohol as noted by the clinical expert. When blood glucose levels are not adequately controlled by lifestyle modifications (such as diet and exercise) alone, pharmacological treatment becomes necessary.5 There are many classes of antihyperglycemic agents used to treat T2DM, which include both insulin and noninsulin therapies.5 Metformin (MET) is considered first-line therapy and is indicated for most patients. If treatment through lifestyle modifications and MET monotherapy fail to achieve adequate glycemic control, a second or third agent may be added in addition to MET.
There are several oral antidiabetic (OAD) agents that may be used with MET, such as sulfonylureas (SU), meglitinides, thiazolidinediones (TZD), alpha-glucosidase inhibitors, dipeptidyl peptidase-4 (DPP-4) inhibitors, and sodium-glucose cotransporter-2 (SGLT2) inhibitors. Injectable agents, such as glucagon-like peptide-1 receptor agonists (GLP-1 RAs), and insulin and insulin analogues (rapid-acting, intermediate, or long-acting forms), may also be considered as an add-on to MET, or patients can be switched to insulin.9 However, according to the 2018 Clinical Practice Guidelines from Diabetes Canada, it is recommended that DPP-4 inhibitors, GLP-1 receptor agonists, or SGLT2 inhibitors be considered first as hypoglycemia and weight gain are less of an issue with these agents, provided contraindications, accessibility, and affordability are considered.5 As noted by the clinical expert consulted with on this review, the most important goals of an ideal treatment would be to improve acute symptoms related to elevated glucose levels, to prevent macrovascular and microvascular disease, to improve quality of life, to minimize drug side effects, and societal goals of ensuring ongoing employment and cost-effectiveness of the treatment.
Although there are currently numerous therapeutic options and combination therapy strategies available, none of the available therapies are curative and many patients still have difficulty achieving adequate glycemic control.24 Further, there are certain disadvantages to consider with some of the options, such as weight gain and/or hypoglycemia associated with the use of TZDs, SUs, and insulin.5,6 In contrast, some agents, such as SGLT2 inhibitors and GLP-1 RAs, may be advantageous in terms of cardiovascular (CV) effects, which is a particular concern as CV effects are common and a leading cause of death among those with diabetes.7-9 In addition, SGLT2 inhibitors may also have some benefits on renal outcomes, as noted by the clinical expert.
It is recommended that the selection of a second agent is patient specific, and based on the efficacy and safety profile of available agents.5 This includes various factors, such as the effectiveness of an agent at lowering blood glucose and glycated hemoglobin (A1C), concerns regarding hypoglycemia, effects on body weight, and the ability to reduce the risk of diabetic microvascular and/or CV complications.5 Additional considerations include patient’s renal function, other comorbidities, planning pregnancy, cost and coverage, ease of administration, and patient preference.5
Drug
Semaglutide is a selective GLP-1 RA that acts on the same receptor as native GLP-1, an endogenous incretin hormone.10 In doing so, semaglutide simultaneously increases insulin secretion and decreases glucagon secretion, both in a glucose-dependent manner. The mechanism of blood glucose lowering also involves a delay in gastric emptying.10,25
The drug under review is semaglutide (Rybelsus), available as an oral tablet at 3 dosage strengths: 3 mg, 7 mg, and 14 mg.10 Semaglutide tablets received Health Canada Notice of Compliance (NOC) on March 30, 2020. Semaglutide is indicated as an adjunct to diet and exercise to improve glycemic control in adults with T2DM: as monotherapy when metformin is considered inappropriate due to intolerance or contraindications; and in combination with other medicinal products for the treatment of diabetes.10 The sponsor has requested that semaglutide is reimbursed for the treatment of adult patients with T2DM in combination with metformin, and in combination with metformin and sulfonylurea.
The Health Canada-recommended starting dose of semaglutide tablets is 3 mg once daily.10 After 30 days, it is recommended that the dose is increased to 7 mg once daily as a maintenance dose. Following 30 days on the 7 mg dose, the maintenance dose may be increased to 14 mg once daily if additional glycemic control is needed. Semaglutide tablets should be taken on an empty stomach with no more than 120mL of water (a half of a glass) at least 30 minutes before food, beverage, or other oral medications to avoid a decrease in absorption.10
Other GLP-1 RAs currently approved in Canada are semaglutide injection (Ozempic), dulaglutide, exenatide, liraglutide, and lixisenatide. Semaglutide injection was previously reviewed by CADTH and a recommendation to reimburse with conditions was issued in May 2019.26
Key characteristics of currently available antihyperglycemia treatments are presented in Table 5.
Table 5: Key characteristics of Available Antihyperglycemic Agents
Characteristic | GLP-1 Analogues | DPP-4 Inhibitors | Insulin/Insulin Analogues | TZD | SGLT2 Inhibitors | MET | SUs |
|---|---|---|---|---|---|---|---|
Mechanism of Action | Mimic GLP-1, which:
| Increase GLP-1 by inhibiting the DPP-4 enzyme, which inactivates GLP-1 and:
| Substitute for endogenously secreted insulin. | PPAR-γ agonists:
| Inhibits the SGLT2 transporter in the kidney, leading to increased glucose excretion. | Reduces gluconeogenesis, increases conversion of glucose to glycogen, and increases degradation of glucose. | Promotes insulin secretion by binding to the SU receptor. |
Indicationa | T2DM that cannot be adequately controlled by diet and exercise alone. Monotherapy (not EXE and LIX), or in combination with MET, or SU (EXE and LIX only), or PIO (LIX only), or MET + SU, or MET + PIO (LIX only), or insulin ± MET Add-on in patients with established CV disease (LIR only) | T2DM that cannot be adequately controlled by diet and exercise alone. Monotherapy (not SAX), or in combination with MET, or SU (not SIT), or PIO (ALO and SIT only), or MET + SU (not ALO), or MET + PIO (ALO and SIT only), or insulin ± MET (not LIN) | Patients with DM who require insulin for control of hyperglycemia. | T2DM that cannot be adequately controlled by diet /exercise alone, or when all other OADs (in monotherapy or in combination) fail to adequately control blood glucose, or are inappropriate due to contraindications or intolerance. | T2DM that cannot be adequately controlled by diet and exercise alone. Monotherapy, or in combination with MET, or SU (CAN and DAP only), or SITA (DAP only), or PIO (EMPA only), or MET + SU (not ERT), or MET + SITA (not EMPA), or MET | T2DM that cannot be controlled by proper dietary management, exercise, and weight reduction, or when insulin therapy is not appropriate. Treatment of obese patients with diabetes. | T2DM in adults, alone or in combination with other anti-hyperglycemic agents, as an adjunct to exercise and diet. |
+ PIO (CAN and EMP only), or insulin ± MET (not ERT) Add-on in patients with established CV disease (CAN and EMPA only) | |||||||
Route of Administration | SC | Oral | SC | Oral | Oral | Oral | Oral |
Recommended Dose | Varies by drug | Varies by drug | Titrated, depending on regimen, can be given from 1 to 4 or more times per day. | 4 mg to 8 mg per day, taken once daily | Varies by drug, taken once daily | 850 mg to 1000 mg twice daily, maximum of 2550 mg daily | Varies by drug, taken once or twice daily |
Serious Adverse Effects or Safety Issues | Warnings/precautions:
Contraindications:
| Warnings/precautions:
| Warnings/precautions:
| Serious warning:
| Serious warning:
Warnings/Precautions:
| Serious warning:
Contraindications:
| Precautions:
Contraindications:
|
ESRD or severe renal impairment (creatinine clearance < 30 mL/min), including patients receiving dialysis |
Contraindications: diabetic ketoacidosis | Warnings/Precautions:
Contraindications:
Pregnancy |
Contraindications: Patients who experience renal impairment with eGFR < 30 to 60 mL/min/1.73 m2 (drug dependent), ESRD, or patients on dialysis |
severe dehydration or shock |
ALO = alogliptin; CAN = canagliflozin; CV = cardiovascular; DAP = dapagliflozin; DPP-4 = dipeptidyl peptidase 4; DUL = dulaglutide; eGFR = estimated glomerular filtration rate; EMPA = empagliflozin; ERT = ertugliflozin; ESRD = end-stage renal disease; EXE = exenatide; GI = gastrointestinal; GLP-1 = glucagon-like peptide 1; HF = heart failure; IG = insulin glargine; LDL-C = low density lipoprotein cholesterol; LIN = linagliptin; LIR = liraglutide; LIX = lixisenatide; MET = metformin; MEN 2 = multiple endocrine neoplasia type 2; mg = milligram; mL = millilitre; min = minute; MTC = medullary thyroid carcinoma; OAD = oral antidiabetic drug; PIO = pioglitazone; PPAR = peroxisome proliferator-activated receptor; SAX = saxagliptin; SC = subcutaneous; SEM = semaglutide; SGLT-2 = sodium-glucose cotransporter-2; SITA = sitagliptin; SU = sulfonylurea; T2DM = type 2 diabetes mellitus; TZD = thiazolidinediones
aHealth Canada–approved indication
Source: Product Monographs10,27-35 and 2018 Canadian Practice Guidelines.5
Stakeholder Perspectives
Patient Group Input
This section was prepared by CADTH staff based on the input provided by patient groups.
About the patient groups and information gathered
Two patient group input submissions from Diabetes Canada and 1 from the type 2 Diabetes Experience Exchange (T2DXX), were provided for this review. Diabetes Canada is a national health charity with a focus on research and policy initiatives to help deliver impact (i.e., prevention and treatment strategies) at a population level. T2DXX provides an open, safe, and non-judgmental space for sharing of personal experiences with T2DM to improve the outcomes and quality of life for patients with T2DM. Due to the timing of this submission, Diabetes Canada provided 2 patient group submissions for the review of semaglutide tablets, which were received on December 11, 2019 and December 17, 2020. The input received from T2DXX was provided in December 11, 2019.
Diabetes Canada used online surveys conducted in July/August 2020, November/December 2020, November 2019, November 2018 and October 2016. Data about the number of patients for each survey are included in Table 6. Respondents were between 25 and ≥ 70 years and reported living with diabetes between 1 and ≥ 20 years.
T2DXX obtained data for their input from personal interviews and facilitated group discussions in their Experience Exchange forums, and through social media conversation threads. It is unclear how many patients contributed to the submission from T2DXX.
Table 6: Summary of Surveys Conducted by Diabetes Canada
Survey | Number of Respondents | Provinces represented | ||
|---|---|---|---|---|
Total | Patients | Caregivers | ||
November/December 2020 | 15 | 13 | 2 | Newfoundland and Labrador, Nova Scotia, Ontario, Manitoba, Saskatchewan, Alberta, and British Columbia |
July/August 2020 | 873 | 36 | 4 | Quebec, Ontario, Manitoba, Saskatchewan, Alberta, and British Columbia |
November 2019 | 20 | 19 | 1 | NR |
November 2018 | 15 | 13 | 2 | NR |
October 2016 | 847 | 790 | 57 | NR |
NR = not reported
Source: Diabetes Canada Patient Input Submission36
Disease experience
T2DM was stated to be a chronic and progressive disease. Common symptoms of T2DM included extreme fatigue, unusual thirst, frequent urination and weight change (gain or loss). Hyperglycemia and hypoglycemia are often experienced by people with diabetes; high blood pressure and high cholesterol are common comorbid conditions. Other problems reported included skin infections, gastrointestinal disturbances (nausea, diarrhea), metabolic changes, lymphedema and other autoimmune disorders. Respondents of the November/December survey from Diabetes Canada also reported comorbidities alongside their diabetes, including weight management issues (79%), high blood pressure (64%), mental health concerns (43%), abnormal cholesterol levels (29%) and eye problems (29%). Other problems included fibromyalgia, chronic fatigue, epilepsy, and celiac disease.
Diabetes Canada reported that many healthy behaviours are required to manage diabetes including diet, physical activity, maintenance of a healthy body weight, taking medications (oral and/or injectable) as prescribed, and monitoring of blood glucose and managing stress. Respondents from T2DXX and Diabetes Canada highlighted the difficulty some respondents face with exercise to help manage variations in blood sugar, especially when faced with other health complications or comorbidities and financial barriers. The goal of managing diabetes through healthy behaviour interventions is meant to keep glucose levels within a target range to minimize side effects of the disease and prevent or delay potentially irreversible complications (i.e., blindness, heart disease, kidney problems and lower limb amputations). The management of blood glucose levels and the frequent visits to health care providers were highlighted as being constant and burdensome.
T2DXX highlighted feelings of shame, guilt, and stigma in people with diabetes, illustrating perceptions of T2DM being considered as the ‘bad’ diabetes as it may seem to be a condition brought on by patients, versus type 1 diabetes which is considered the ‘good’ diabetes. The stigma surrounding diabetes was stated by T2DXX to impact patients socially; 1 respondent described missing their insulin injections when at social functions to avoid misconceptions around their condition from their peers, risking further health complications. The stress of the disease and its potential complications was stated to be emotionally taxing for respondents, negatively influencing social interactions, mental health, and, ultimately, overall quality of life of patients.
Experiences with currently available treatments
T2DXX highlighted the complexity and frustration related to diabetes treatments as patients offered conflicting information. Depending on the awareness and access of optimal treatments for diabetes, the choice of interventions can vary at different stages of treatment for patients. Treatment choice may also be influenced by geography (urban versus rural), institutional protocols, and access to diabetes teams (i.e., nutritionists, social workers, ophthalmologists, vascular specialists). The lack of access to certain treatments and resources for some diabetes patients was indicated as a source of inequity within the health care system and may result in patients feeling powerless.
Most respondents (75%) of the November/December 2020 survey form Diabetes Canada reported that they did not have difficulty in accessing their medications. Although, other comments from respondents expressed concern about running out of or losing benefits to pay for medications, and the affordability of medications. Concerns over treatment cost were also highlighted by T2DXX, as choice of treatment may be made based on affordability for the patient in addition to what is most effective. Patients reported having to make trade-offs of therapy versus basic needs, resulting in suboptimal dosing of insulin and setting sensors on pumps to double or triple times the length recommended by manufacturers. Some patients reported there were able to self-manage their disease with the support of a health care team, including nurse educators and dietitians. However, management of diabetes was stated to eventually require insulin therapy. One patient reported that management of diabetes with medications could be addressed more appropriately, as “doctors tell patients ‘if you don’t follow my orders I’ll put you straight onto insulin’. Need to stop using insulin as a threat.”
In the November/December 2020 survey from Diabetes Canada, 13 respondents reported having experience with antihyperglycemic agents; most commonly, patients reported taking metformin (91%) and insulin glargine or an insulin glargine biosimilar (50%). In the November 2019 survey from Diabetes Canada, 11 respondents reported having experience with antihyperglycemic agents; further, 7 respondents reported taking insulin. In the October 2016 survey, 667 patients reporting receiving antihyperglycemic agents; most commonly respondents reported taking metformin (56%). Between 40% and 60% of survey respondents reported being “much better” or “better” able to meet target blood sugars upon fasting, waking or after eating; in addition, between 50% and 60% of respondents reported being “much better” or “better” able to meet target hemoglobin A1c levels, and between 46% and 50% reported being “much better” or “better” able to avoid hypoglycemia. Current treatments were reported to better help maintain or lose weight by 39% of respondents. Some of the respondents of these surveys also indicated having experience with, but were no longer taking, the following medications: sulfonylureas, GLP-1 receptor agonists, DPP-4 inhibitor, DPP-4 plus metformin, meglitinides, SGLT2 inhibitors, short-acting insulin, premixed insulin, U300/other long-acting insulin, orlistat and metformin.
The November/December 2020 survey indicated that patients liked that their current treatments helped with weight management and that “it isn’t insulin injections”. Comments from the survey indicated that respondents disliked the following about their current treatments: medications cause gastrointestinal upset, are difficult for someone with a disability to adjust independently, are expensive and not covered by the provincial drug plan, and are not effective at regulating post-prandial blood sugar levels. The following side effects of treatments were reported: gastrointestinal issues (including stomach pain, indigestion, nausea, vomiting, diarrhea, painful gas and flatulence), polyuria, weight gain, hypoglycemia, genital infections, mood swings, muscle aches and fatigue. Respondents of Diabetes Canada’s November/December 2020 survey were asked to indicate considerations when choosing medications to manage diabetes. Almost all (≥ 80%) respondents reported that keeping blood glucose at satisfactory levels during the day or after meals, avoiding weight change and avoiding gastrointestinal side effects (i.e., nausea, vomiting, diarrhea, abdominal pain), avoiding low blood sugar and reducing risk of heart problems were the most important considerations for medications for diabetes management. Other considerations reported by approximately 75% of respondents were avoiding urinary tract and/or yeast infections, avoiding fluid retention and reducing high blood pressure.
Improved outcomes
Respondents from the surveys conducted by Diabetes Canada were asked to report their expectations for new treatments. Patients hoped new treatments would be safe, minimize side effects and damage to organs, and improve overall health outcomes. Respondents reported a strong desire to reduce the pill burden associated with treatment, or to be off medication entirely, for treatments to help resume ‘normal living’, such as the ability to eat without restrictions, for treatments with fewer unpleasant side effects (i.e., weight gain, hypoglycemia, gastrointestinal side effects) and which are less physically invasive (i.e., do not require an injection) and for treatments which can normalize/stabilize blood glucose levels, and improve hemoglobin A1c. T2DXX also indicated a preference by patients to receive oral medications compared to injections; “once a day oral would be preferable – taking one pill a day would be attractive vs a once a week injectable.”
Respondents from Diabetes Canada also reported expectations for more affordable treatment options, with a desire to have both medications and devices covered by both public and private plans. One respondent stated, “I wish it was more affordable for the masses and covered by FNIHB [First Nations and Inuit Health Branch, Health Canada] for First Nation patients.” Survey respondents from Diabetes Canada also indicated a desire for methods of self-monitoring blood sugar which eliminate the need for finger pricks, and for investments into non-pharmacological interventions (e.g., affordable exercise programs and nutritional education). T2DXX also reported an expectation for improved perceptions about needles and the administration of insulin. Respondents reported that “there really is a stigma about injecting”; 1 patient reported that she had been injecting insulin “for over 30 years and people still make me feel dirty.”
Diabetes Canada and T2DXX also highlighted a hope for improved relationships with health care professionals. Respondents reported disjointed communication and coordination between specialists (i.e., endocrinologists) and general practitioners leading to distrust between patients and their health care providers. Varying levels of knowledge in managing issues related to diabetes among health care practitioners was stated to be a barrier to access, decrease clinical outcomes and lower quality of life indicators for patients.
Experience with drug under review
A total of 3 patients from the November/December 2020 survey and 3 patients from the November 2019 survey from Diabetes Canada reported having experience with semaglutide tablets. Each respondent of the November 2019 survey reported switching to semaglutide tablets from another medication, and that their treatment was covered through private insurance. There were no respondents from T2DXX with experience with semaglutide.
Respondents of the November/December 2020 survey were also asked to report the effectiveness of semaglutide compared to other medications; of the 3 respondents, semaglutide was reported to have “about the same” effectiveness as previously received medications in terms of meeting target blood sugar levels or hemoglobin A1c levels, managing gastrointestinal side effects (i.e., diarrhea, nausea, vomiting, abdominal pain), and incidence/severity of yeast or urinary tract infections. Two out of 3 patients reported semaglutide was “better” or “much better” at reducing the incidence of extreme thirst and/or dehydration. Respondents currently receiving semaglutide reported that treatment was helping them lose weight, or that it had the potential to help them lose weight, and indicated that its oral administration was preferable to an injection; 1 respondent stated oral medications are “easier to take” while another stated “injections don’t bother me.” However, 1 respondent reported that semaglutide resulted in loss of appetite and fear of eating brought on by side effects; this respondent stated, “if I had known the pill was going to make me this sick (vomiting and diarrhea for two months) I never would have started it…I don’t leave the house. I don’t eat. I don’t enjoy food anymore. I am angry and irritable. My [spouse] is worried and tired…I have four other disabilities besides diabetes. Diabetes has now taken over my life and made me unable to leave the house....” Another respondent who just began treatment with semaglutide reported that they were trying to get used to it while also dealing with some gastrointestinal side effects.
One respondent of the November 2019 survey reported that semaglutide was better able than their previous treatments at achieving target hemoglobin A1C levels; 1 respondent was unsure of whether semaglutide was helping them achieve target hemoglobin A1c levels. Two respondents reported semaglutide was much better at helping them meet target fasting blood glucose levels. One respondent reported semaglutide was better at helping them avoid hypoglycemia and gastrointestinal side effects, while another indicated it was worse. Two of the 3 respondents reported they were very satisfied with semaglutide.
Additional information
According to Diabetes Canada and the 2018 Clinical Practice Guidelines for the Prevention and Management of Diabetes in Canada, to achieve optimal blood glucose levels, individualization of diabetes therapy is essential. This includes careful consideration of medication selection, route of administration (oral, injection, infusion), frequency with which someone monitors blood glucose and adjusts dosage, benefits and risks that the patient experiences and/or tolerates, and lifestyle changes the patient is willing or able to make. One of the respondents from the T2DXX input described the future of management of diabetes that they hope will be the gold standard, which included teamwork, cross-training and seeking partnerships (i.e., working with emergency departments to move patients with T2DM out of the emergency room and into the Diabetes Management Centre).
T2DXX highlighted that current health care systems, at the individual and government level, are in need of improvement to address the needs of diabetes patients and improve overall health. Relationships between patients and health care providers was stated to be complex with some patients struggling to navigate through the inconsistencies in health care. Further, T2DXX stated that governments may be unaware of costs for patients with diabetes, especially for those without insurance coverage, and that health outcomes for Canadian patients with diabetes are poor when ranked against countries across the globe. Overall, T2DM was stated to be a heterogenous disease with a lack of coherence in treatment and social and emotional barriers.
Clinician Input
Input from clinical experts consulted by CADTH
All CADTH review teams include at least 1 clinical specialist with expertise regarding the diagnosis and management of the condition for which the drug is indicated. Clinical experts are a critical part of the review team and are involved in all phases of the review process (e.g., providing guidance on the development of the review protocol; assisting in the critical appraisal of clinical evidence; interpreting the clinical relevance of the results; and providing guidance on the potential place in therapy). The following input was provided by 1 clinical specialist with expertise in the diagnosis and management of T2DM.
Unmet Needs
The clinical expert consulted for this review stated that the most important goals of an ideal treatment would be to improve acute symptoms related to elevated glucose levels, to prevent macrovascular and microvascular disease, to improve quality of life, to minimize drug side effects, and societal goals of ensuring ongoing employment and cost-effectiveness of the treatment. The clinical expert indicated that the following elements of current treatment that need to be improved upon: better glycemic control, modification and ideally slowing down the progression of disease, prevention of long-term complications, both microvascular and macrovascular, improved cost-effectiveness, better side effect and safety profiles, and treatments that are more user-friendly to patients.
Place in therapy
The clinical expert stated semaglutide tablets would be used as an add-on treatment in patients withT2DM when metformin is no longer effective as monotherapy (second-line treatment), as a first-line treatment when metformin is not tolerated, and as a third-line treatment on occasion. Further, they felt it is still premature to speculate on the ability for semaglutide tablets to modify the disease process in T2DM as well as whether semaglutide tablets would shift the current treatment paradigm or not. The clinical expert also indicated that semaglutide tablets would likely be used where a GLP-1 RA is needed, but an injectable treatment is rejected by the patient.
With regards to whether or not the clinical expert thought it would be appropriate to recommend that patients try other treatments before initiating semaglutide tablets, the clinical expert stated that when a GLP-1 RA is considered appropriate, they would certainly recommend an injectable form of this class such as semaglutide for injection because, in addition to glycemic control and weight loss, this treatment has been shown to have cardiovascular benefits.
Patient population
According to the clinical expert, patients who are most likely to do well with semaglutide tablets are those whose glucose levels are not well controlled by metformin, who are overweight, who can tolerate the GI side-effects of semaglutide tablets, and who reject an injectable GLP-1 RA. They noted that this would include both patients with new onset T2DM and patients with established T2DM.
The clinical expert felt that patients best suited for treatment with semaglutide tablets would be individuals with T2DM not controlled with metformin or intolerant of metformin who are overweight. The clinical expert relayed that the diagnosis of T2DM is straightforward. They also stated that given that patients with T2DM have great variability in their symptoms, pre-symptomatic patients should not be precluded from treatment with semaglutide tablets if the treatment is indicated as noted above.
Patients least suited to treatment with semaglutide tablets would be individuals well controlled with Metformin, individuals not well controlled with Metformin who are overweight but who are willing to take an injectable GLP-1 RA, and patients who are intolerant of the GI side-effects of semaglutide tablets, according to the clinical expert.
Lastly, the clinical expert felt that patients most likely to exhibit a response to treatment are those individuals with T2DM who are not controlled with Metformin alone, who are overweight, who can tolerate minor GI discomforts and who are compliant with taking medication.
Assessing response to treatment
The clinical expert highlighted the following outcomes that are important when assessing whether a patient is responding to treatment in clinical practice: improvement in glycemic parameters, improvement in body weight with the attendant improvement in blood pressure and lipids, and long-range improvement in microvascular and macrovascular events, in addition to improvement in quality of life.
The clinical expert stated that they believe most physicians would consider a meaningful response to treatment to be a significant improvement in glycemic parameters with improvement in acute symptoms, significant weight loss, a decrease in microvascular and macrovascular disease, and improved quality of life with its attendant improvement of performance of activities of daily life.
Initially, treatment response should be assessed every 3 months according to the clinical expert although this is dependent on patient factors such as drug tolerance.
Discontinuing treatment
Treatment should be discontinued if the glycemic response is inadequate, side-effects are intolerable, other treatments in development prove more effective, and according to patient preference, as indicated by the clinical expert.
Prescribing conditions
The clinical expert felt that this semaglutide tablets can be prescribed by specialty and community-based clinics. In their opinion, this is not a medication that should be restricted to specialists and is 1 that can be prescribed by endocrinologists, internists, diabetes nurse practitioners and family doctors.
Clinician group input
CADTH did not receive any input from clinician groups for this review.
Drug Program Input
The drug programs provide input on each drug being reviewed through CADTH’s reimbursement review processes by identifying issues that may impact their ability to implement a recommendation. The implementation questions and corresponding responses from the clinical experts consulted by CADTH are summarized in Table 7.
Table 7: Summary of Drug Plan Input and Clinical Expert Response
Drug Program Implementation Questions | Clinical Expert Response |
|---|---|
Do the clinical experts agree that semaglutide tablets cannot claim that it reduces CV outcomes unless new data are provided? Therefore, would the clinical experts agree that it is inferior to semaglutide for injection? | The clinical expert consulted by CADTH anticipated that, based on the evidence available at this time, physicians would continue to use semaglutide injections in patients when CV benefit was a priority. They noted that the SOUL trial (NCT03914326), which is scheduled to conclude in 2024, is expected to provide additional evidence regarding potential CV benefit from semaglutide tablets. |
Do the clinical experts consider semaglutide tablets a second line therapy or a third line therapy? | The clinical expert consulted by CADTH stated that expected use of semaglutide tablets is aligned with the indication and that semaglutide tablets would be used as an add-on treatment in patients with T2DM when metformin is no longer effective as monotherapy (second-line treatment), as a first-line treatment when metformin is not tolerated, and as a third-line treatment on occasion. |
CDEC = Canadian Drug Expert Committee; CV = cardiovascular; CVOT = cardiovascular outcome trial; SGLT2 = sodium-glucose co-transporter 2; T2DM = type 2 diabetes mellitus.
Source: Drug Plan Input
Clinical Evidence
The clinical evidence included in the review of semaglutide is presented in 3 sections. The first section, the Systematic Review, includes pivotal studies provided in the sponsor’s submission to CADTH and Health Canada, as well as those studies that were selected according to an a priori protocol. The second section includes indirect evidence from the sponsor and indirect evidence selected from the literature that met the selection criteria specified in the review.
Systematic Review (Pivotal and Protocol Selected Studies)
Objectives
To perform a systematic review of the beneficial and harmful effects of semaglutide oral tablets (3 mg, 7 mg, and 14 mg) as an adjunct to diet and exercise to improve glycemic control in adult patients with T2DM:
as monotherapy when metformin is considered inappropriate due to intolerance or contraindications; or
in combination with other medicinal products for the treatment of diabetes
Methods
Studies selected for inclusion in the systematic review will include pivotal studies provided in the sponsor’s submission to CADTH and Health Canada, as well as those meeting the selection criteria presented in Table 8. Outcomes included in the CADTH review protocol reflect outcomes considered to be important to patients, clinicians, and drug plans.
Table 8: Inclusion criteria for the systematic review
Criteria | Description |
|---|---|
Population | Adult patients with T2DM Subgroups:
|
Intervention | Semaglutide oral tablets (3 mg, 7 mg, and 14 mg) once daily (as monotherapy or combination therapy) Semaglutide administration: 3 mg once daily as a starting dose. After 30 days, increase to a maintenance dose of 7 mg once daily. If additional glycemic control is needed after at least 30 days on the 7 mg dose, the dose can be increased to a maintenance dose of 14 mg once daily. |
Comparator | One or more of the following:
|
Outcomes | Efficacy outcomes:
|
Harms outcomes:
| |
Study Designs | Published and unpublished phase III and IV RCTs |
A1C = glycated hemoglobin; AE = adverse event; BMI = body mass index; CV = cardiovascular; DPP-4 = dipeptidyl peptidase-4; GLP-1 = glucagon-like peptide-1; MI = myocardial infarction; MTC = medullary thyroid carcinoma; RCT = randomized controlled trial; SAE = serious adverse event; SC = subcutaneous; SGLT2 = sodium-glucose cotransporter-2; T2DM = type 2 diabetes mellitus; WDAE = withdrawal due to adverse event.
The literature search will be performed by an information specialist using a peer-reviewed search strategy.
The literature search for clinical studies was performed by an information specialist using a peer-reviewed search strategy according to the PRESS Peer Review of Electronic Search Strategies checklist (https://www.cadth.ca/resources/finding-evidence/press).37
Published literature was identified by searching the following bibliographic databases: MEDLINE All (1946‒) via Ovid and Embase (1974‒) via Ovid. The search strategy comprised both controlled vocabulary, such as the National Library of Medicine’s MeSH (Medical Subject Headings), and keywords. The main search concepts was semaglutide (Rybelsus). Clinical trials registries were searched: the US National Institutes of Health’s clinicaltrials.gov, WHO’s International Clinical Trials Registry Platform (ICTRP) search portal, Health Canada’s Clinical Trials Database, and the European Union Clinical Trials Register.
No filters were applied to limit the retrieval by study type. Retrieval was not limited by publication date or by language. Where possible, retrieval was limited to the human population. Conference abstracts were excluded from the search results. See Appendix 1 for the detailed search strategies.
The initial search was completed on December 23, 2020. Regular alerts updated the search until the meeting of the CADTH Canadian Drug Expert Committee (CDEC) on April 21, 2021.
Grey literature (literature that is not commercially published) was identified by searching relevant websites from the Grey Matters: A Practical Tool For Searching Health-Related Grey Literature checklist (https://www.cadth.ca/grey-matters).38 Included in this search were the websites of regulatory agencies (US FDA and European Medicines Agency). Google was used to search for additional internet-based materials. See Appendix 1 for more information on the grey literature search strategy.
In addition, the sponsor of the drug was contacted for information regarding unpublished studies.
Two CADTH clinical reviewers will independently select studies for inclusion in the review based on titles and abstracts, according to the predetermined protocol. Full-text articles of all citations considered potentially relevant by at least 1 reviewer will be acquired. Reviewers will independently make the final selection of studies to be included in the review, and differences will be resolved through discussion.
Findings from the Literature
A total of 10 studies were identified from the literature for inclusion in the systematic review (Figure 1). The included studies are summarized in Table 9, Table 10, Table 11, Table 12, and Appendix 3. A list of excluded studies is presented in Appendix 2.
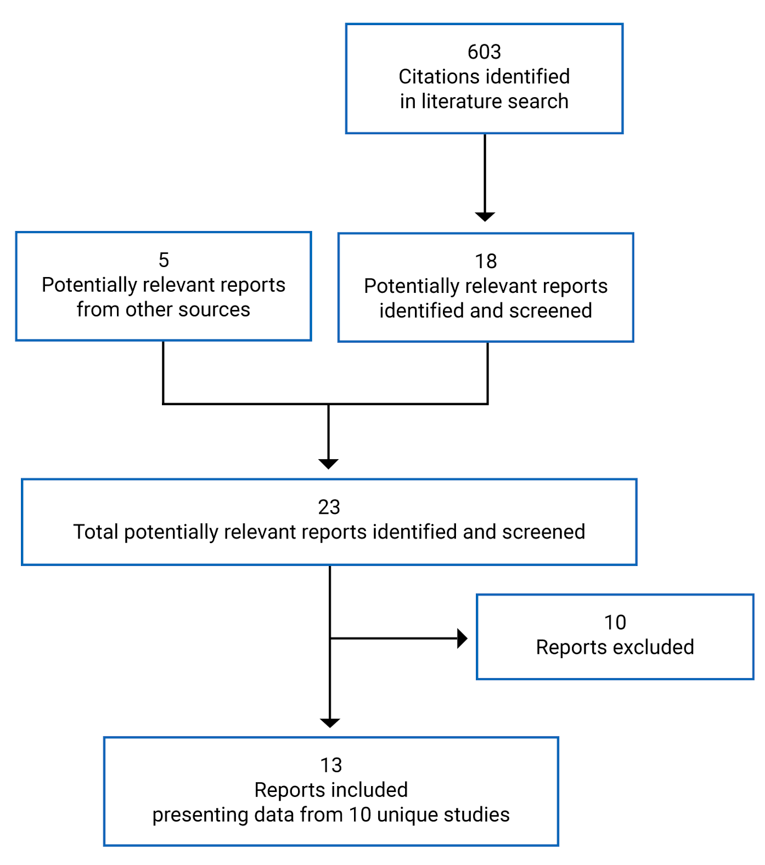
Table 9: Details of Included Studies (Active-Controlled RCTs, add-on to 1 to 2 OADs)
Detail | PIONEER 2 | PIONEER 3 | PIONEER 4 |
|---|---|---|---|
Designs and Populations | |||
Study Design | Phase IIIa, OL, active-controlled RCT | Phase IIIa, DB, double-dummy, active-controlled RCT | Phase IIIa, DB, active- and placebo-controlled RCT |
Locations | 108 sites in 12 countries (US, South America, Europe, Thailand) | 206 sites in 14 countries (US, UK, Japan, Mexico, South America, Europe, South Africa) | 101 sites in 12 countries (US, Japan, South Africa, UAE, Europe) |
Patient Enrolment Dates | 2016 to 2017 | 2017 to 2018 | 2016 to 2017 |
Randomized (N) | 822 | 1864 | 711 |
Inclusion Criteria | Adult patients with T2DM, A1C of 7.0 to 10.5% (53 to 91 mmol/mol) inclusive, and on a stable daily dose of metformin (≥ 1500 mg or max. tolerated) for ≥ 90 days before screening | Adulta patients with T2DM, A1C of 7.0 to 10.5% (53 to 91 mmol/mol) inclusive, and on a stable daily dose of metformin (≥ 1500 mg or max. tolerated) ± SU (≥ half of the max. approved dose according to local label or max. tolerated dose) for ≥ 90 days before screening | Adulta patients with T2DM, A1C of 7.0 to 9.5% (53 to 80.3 mmol/mol) inclusive, and on a stable daily dose of metformin (≥ 1500 mg or max. tolerated) ± SGLT2 inhibitor for ≥ 90 days before screening |
Exclusion Criteria |
| ||
| |||
Drugs | |||
Intervention | semaglutide 14 mg once daily, oral | semaglutide 3, 7, or 14 mg once daily, oral | semaglutide 14 mg once daily, oral |
Comparator(s) | empagliflozin 25 mg once daily, oral | sitagliptin 100 mg once daily, oral | liraglutide 1.8 mg once daily, SC injection placebo, oral and SC injection |
Duration | |||
Phase | |||
Run-in (screening) | 2 weeks | 2 weeks | 2 weeks |
Double-blind/treatment period | 52 weeks (incl. 8 week dose escalation) | 78 weeks (incl. 8 week dose escalation) | 52 weeks (incl. 8 week dose escalation) |
Follow-up | 5 weeks | 5 weeks | 5 weeks |
Outcomes | |||
Primary End Point | change from baseline to week 26 in A1C (%-points) | ||
Secondary End Points | Secondary: change from baseline to week 26 in body weight (kg) | ||
Supportive secondary/ Exploratory End Points | Supportive secondary: Change from baseline to week 52 in:
Change from baseline to week 26 and week 52 in:
| Supportive secondary: Change from baseline to week 52 in:
Change from baseline to week 26, 52, and 78 in:
Binary end points (achieved at week 26, 52, and 78):
| Supportive secondary: Change from baseline to week 52 in:
Change from baseline to week 26 and 52 in:
Binary end points (achieved at week 26 and 52):
|
Binary end points (achieved at week 26 and week 52):
Time to event:
PROs:
• CoEQ |
Time to event:
PROs:
• CoEQ |
Time to event:
PROs: • Change from baseline to week 26 and 52 in DTSQs | |
Notes | |||
Publications | Rodbard 201939 | Rosenstock 201940 | Pratley 201941 |
A1C = glycated hemoglobin; AACE = American Association of Clinical Endocrinology; ADA = American Diabetes Association; ALT = alanine aminotransferase; BG = blood glucose; BMI = body mass index; CoEQ = Control of Eating Questionnaire; DB = double-blind; DPP-4 = dipeptidyl peptidase-4; DTSQ = Diabetes Treatment Satisfaction Questionnaire; eGFR = estimated glomerular filtration rate; FPG = fasting plasma glucose; HDL = high-density lipoprotein; HOMA = homeostatic model assessment; IWQOL = Impact of Weight on Quality of Life; LDL = low-density lipoprotein; MEN 2 = multiple endocrine neoplasia type 2; MTC = medullary thyroid carcinoma; NYHA = New York Heart Association; OAD = oral antidiabetic drug; OL = open-label; RCT = randomized controlled trial; SC = subcutaneous; SF-36 v2 = Short-Form Health Survey version 2; SGLT2 = sodium-glucose co-transporter 2; SMPG = self-measured plasma glucose; SU = sulfonylurea; T2DM = type 2 diabetes mellitus; TZD = thiazolidinedione; UNL = upper limit of normal; VLDL = very-low-density lipoprotein.
aAdult patients defined by age ≥ 18 years at the time of signing informed consent; for Japan only: age ≥ 20 years at the time of signing informed consent; for Korea only, ≥ 19 years at the time of signing informed consent.
cAccording to the Chronic Kidney Disease Epidemiology Collaboration formula.42,43
Table 10: Details of Included Studies (Placebo-Controlled RCTs)
Detail | PIONEER 1 | PIONEER 5 | PIONEER 8 |
|---|---|---|---|
Designs and Populations | |||
Study Design | Phase IIIa, DB, placebo-controlled, RCT | Phase IIIa, DB, placebo-controlled, RCT | Phase IIIa, DB, placebo-controlled, RCT |
Locations | 93 sites in 9 countries: US, Mexico, Japan, Russia, Algeria, Bulgaria, Czech Republic, Serbia, Turkey | 107 sites in 8 countries: US, UK, Denmark, Finland, Israel, Poland Russia, Sweden | 111 sites in 9 countries: Canada, US, France, Greece, India, Japan, Mexico, Poland, Russia |
Patient Enrolment Dates | 2016 to 2017 | 2016 to 2018 | 2017 to 2018 |
Randomized (N) | 703 | 324 | 731 |
Inclusion Criteria | Adulta patients with T2DM diagnosed ≥ 30 days before screening, A1C of 7.0 to 9.5% (53 to 80 mmol/mol) inclusive, and treatment with diet and exercise for ≥ 30 days before screening | Adult patients with T2DM diagnosed ≥ 90 days before screening, A1C of 7.0 to 9.5% (53 to 80 mmol/mol) inclusive, moderate renal impairment (eGFR 30 to 59 mL/min/1.73m2)b, and stable treatment with 1 of the following treatment regimens within 90 days before screening:
| Adulta patients with T2DM diagnosed ≥ 90 days before screening, A1C of 7.0 to 9.5% (53 to 80 mmol/mol) inclusive, and stable treatment with 1 of the following insulin regimens (minimum 10 IU/day) ≥ 90 days before screening; maximum 20% change in total daily dose is acceptable:
|
Exclusion Criteria | Known hypersensitivity to treatment(s) or related products Previous participation in this trial Female who is pregnant, breast-feeding or intends to become pregnant Receipt of any investigational product within 90 days before screening Any disorder that might jeopardize subject safety or protocol compliance Family or personal history with MEN 2 or MTC History of pancreatitis (acute or chronic) History of major surgical procedures involving the stomach affecting absorption of treatment NYHA Class IV Planned revascularization on day of screening Proliferative retinopathy or maculopathy requiring acute treatment, verified within 90 days of randomization History or presence of malignant neoplasms within the past 5 years MI, stroke or hospitalization for unstable angina or transient ischemic attack within past 180 days prior of screening ALT > 2.5 x UNL Treatment with any medication for diabetes or obesity within 90 days of screening other than those in the inclusion criteria except insulin for acute treatment (for ≤ 14 days) | ||
Additional exclusion criteria | Renal impairment (eGFR < 60 mL/min/1.73 m2)b | Rapidly progressing renal disease (e.g., acute glomerulonephritis) as judged by the investigator or known nephrotic albuminuria (> 2200 mg/24 hours or > 2200 mg/g) Use of immunosuppressive treatment within 90 days of screening Known hypoglycemic unawareness and/or recurrent severe hypoglycemic episodes as judged by the investigator | Renal impairment (eGFR < 60 mL/min/1.73 m2)b Known hypoglycemic unawareness according to Clarke’s questionnaire |
Drugs | |||
Intervention | semaglutide 3 mg, 7 mg, or 14 mg once daily, oral | semaglutide 14 mg once daily, oral | semaglutide 3 mg, 7 mg, or 14 mg once daily, oral |
Comparator(s) | Placebo | Placebo | Placebo |
Duration | |||
Phase | |||
Run-in | 2 weeks | 2 weeks | 2 weeks |
Double-blind | 26 weeks (incl. 8 week dose escalation) | 26 weeks (incl. 8 week dose escalation | 52 weeks (incl. 8 week dose escalation) Note: 26 weeks of fixed insulin treatment period followed by 26 weeks adjustable insulin treatment period |
Follow-up | 5 weeks | 5 weeks | 5 weeks |
Outcomes | |||
Primary End Point | Change from baseline in week 26 A1C (%-points) | Change from baseline in week 26 A1C (%-points) | Change from baseline in week 26 A1C (%-points) |
Secondary and Exploratory End Points | Secondary: change from baseline to week 26 in body weight (kg) Supportive secondary Change from baseline to week 26:
| Secondary: change from baseline to week 26 in body weight (kg) Supportive secondary Change from baseline to week 26:
| Secondary: change from baseline to week 26 in body weight (kg) Supportive secondary Change from baseline to week 52:
Change from baseline to week 26 and 52:
|
Binary end points achieved at week 26:
| Binary end points achieved at week 26:
Time to event:
PROs:
• DTSQs |
Binary end points achieved at week 26:
Time to event:
| |
Time to event:
PROs:
| PROs (as change from baseline to week 26 and 52):
| ||
Notes | |||
Publications | Aroda 201945 | Mosenzon 201946 | Zinman 201947 |
A1C = glycated hemoglobin; AACE = American Association of Clinical Endocrinology; ADA = American Diabetes Association; ALT = alanine aminotransferase; BG = blood glucose; BMI = body mass index; CRP = C-reactive protein; DB = double-blind; DTSQ = Diabetes Treatment Satisfaction Questionnaire; eGFR = estimated glomerular filtration rate; FPG = fasting plasma glucose; HDL = high-density lipoprotein; HOMA = homeostatic model assessment; IU = international unit; IWQOL = Impact of Weight on Quality of Life; LDL = low-density lipoprotein; MEN 2 = multiple endocrine neoplasia type 2; MTC = medullary thyroid carcinoma; NPH = neutral protamine Hagedorn; NYHA = New York Heart Association; PGI-S = Patient Global Impression scale of severity; PGI-C = Patient Global Impression scale of change; RCT = randomized controlled trial; SF-36 v2 = Short-Form Health Survey version 2; SMPG = self-measured plasma glucose; SU = sulfonylurea; T2DM = type 2 diabetes mellitus; UNL = upper limit of normal; VLDL = very-low-density lipoprotein.
aAdult patients defined by age ≥ 18 years at the time of signing informed consent; for Japan only: age ≥ 20 years at the time of signing informed consent; for Algeria only, ≥ 19 years at the time of signing informed consent.
bAccording to the Chronic Kidney Disease Epidemiology Collaboration formula.42,43
Table 11: Details of Included Studies (CVOT)
Detail | PIONEER 6 |
|---|---|
Designs and Populations | |
Study Design | Phase IIIa, DB, placebo-controlled, RCT |
Locations | 214 sites in 21 countries (Canada, US, UK, Mexico, Europe, S. America, Africa, Asia) |
Patient Enrolment Dates | 2017 to 2018 |
Randomized (N) | 3183 |
Inclusion Criteria | Age ≥ 50 years at screening and at least 1 of the below conditions: a. prior myocardial infarction b. prior stroke or transient ischemic attack c. prior coronary, carotid or peripheral arterial revascularisation d. > 50% stenosis on angiography or imaging of coronary, carotid or lower extremity arteries e. history of symptomatic coronary heart disease documented by e.g., positive exercise stress test or any cardiac imaging or unstable angina pectoris with ECG changes f. asymptomatic cardiac ischemia documented by positive nuclear imaging test or exercise test or stress echo or any cardiac imaging g. chronic heart failure NYHA class II-III h. moderate renal impairment (corresponding to an estimated glomerular filtration rate (eGFR) between 30 and 59 mL/min/1.73 m2) Age ≥ 60 years at screening and at least 1 of the below risk factors: i. microalbuminuria or proteinuria j. hypertension and left ventricular hypertrophy by ECG or imaging k. left ventricular systolic or diastolic dysfunction by imaging l. ankle/brachial index < 0.9 |
Exclusion Criteria | Known hypersensitivity to treatment(s) or related products Previous participation in this trial Female who is pregnant, breast-feeding or intends to become pregnant Receipt of any investigational product within 90 days before screening Any disorder that might jeopardize subject safety or protocol compliance Family or personal history with MEN 2 or MTC History of pancreatitis (acute or chronic) History of major surgical procedures involving the stomach affecting absorption of treatment NYHA Class IV Planned revascularization on day of screening Proliferative retinopathy or maculopathy requiring acute treatment, verified within 90 days of randomization History or presence of malignant neoplasms within the past 5 years |
Additional exclusion criteria | Participation in another clinical trial of an investigational product; exception: trial evaluating stent(s) Current or previous (within 90 days before screening) with any GLP-1 RA, DPP-4 inhibitor or pramlintide MI, stroke or hospitalization for unstable angina or transient ischemic attack within past 60 days prior of screening Chronic or intermittent hemodialysis or peritoneal dialysis or severe renal impairment (eGFR < 30 mL/min/1.73 m2) History of diabetic ketoacidosis |
Drugs | |
Intervention | semaglutide 14 mg once daily, oral |
Comparator(s) | Placebo |
Duration | |
Phase | |
Run-in | 3 weeks |
Double-blind | Event driven, up to 74 weeks (incl. 8 week dose escalation) |
Follow-up | 5 weeks |
Outcomes | |
Primary End Point | Time to first occurrence of a MACE (CV death, non-fatal MI, or non-fatal stroke) |
Secondary and Exploratory End Points | Time from randomization to first occurrence of:
|
Notes | |
Publications | |
A1C = glycated hemoglobin; DB = double-blind; DPP-4 = dipeptidyl peptidase-4; ECG = electrocardiogram; eGFR = estimated glomerular filtration rate; GLP-1 RA = glucagon-like peptide-1 receptor agonist; MEN 2 = multiple endocrine neoplasia type 2; MI = myocardial infarction; MTC = medullary thyroid carcinoma; NYHA = New York Heart Association; OAD = oral antidiabetic drug; RCT = randomized controlled trial.
aAdult patients defined by age ≥ 18 years at the time of signing informed consent; for Japan only: age ≥ 20 years at the time of signing informed consent; for Korea only, ≥ 19 years at the time of signing informed consent.
bPIONEER 7 semaglutide dosage adjustment criteria was based on A1C or tolerability. For A1C, if A1C < 7.0% (53 mmol/mol) the current dose was continued; if A1C ≥ 7.0% (53 mmol/mol), the dose of semaglutide was escalated to the next dose level. For tolerability, if a patient reported moderate to severe nausea or vomiting for ≥ 3 days in the week before a scheduled visit, the dose of semaglutide was maintained or reduced at the discretion of the investigator, irrespective of the level of A1C.
cPermitted OADs included: metformin, SU, glinide, alpha-glucosidase inhibitor, DPP-4 inhibitor, and SGLT2 inhibitor at a half-maximum approved dose or below according to Japanese labelling in addition to diet and exercise.
dAccording to the Chronic Kidney Disease Epidemiology Collaboration formula.42,43
Note: 4 additional reports were included.11,44,48,49
Source: Clinical Study Report.20
Table 12: Details of Included Studies (Population-specific supportive studies)
Detail | PIONEER 9 | PIONEER 10 |
|---|---|---|
Designs and Populations | ||
Study Design | Phase II/IIIa, DB, placebo- and OL active- controlled, RCT | Phase IIIa, OL, active-controlled, RCT |
Locations | 16 sites in Japan | 36 sites in Japan |
Patient Enrolment Dates | 2017 to 2018 | 2017 to 2018 |
Randomized (N) | 243 | 458 |
Inclusion Criteria | Adulta patients with T2DM, A1C 6.5 to 9.5% (48 to 80 mmol/mol) inclusive for patients treated with OAD as monotherapy and A1C 7.0 to 10.0% (53 to 86 mmol/mol) inclusive for subjects treated with diet and exercise therapy alone Treatment for ≥ 30 days before screening with:
| Adulta patients with T2DM, A1C 7.0 to 10.5% (53 to 91 mmol/mol) inclusive, treated with a stable daily dose OAD monotherapy (SU, glinide, TZD, alpha-glucosidase inhibitors, or SGLT2 inhibitor according to Japanese labelling) for ≥ 60 days before screening |
Exclusion Criteria | Known hypersensitivity to treatment(s) or related products Previous participation in this trial Female who is pregnant, breast-feeding or intends to become pregnant Receipt of any investigational product within 90 days before screening Any disorder that might jeopardize subject safety or protocol compliance Family or personal history with MEN 2 or MTC History of pancreatitis (acute or chronic) History of major surgical procedures involving the stomach affecting absorption of treatment MI, stroke or hospitalization for unstable angina or transient ischemic attack within past 180 days prior of screening NYHA Class IV Planned revascularization on day of screening ALT > 2.5 x UNL Proliferative retinopathy or maculopathy requiring acute treatment, verified within 90 days of randomization History or presence of malignant neoplasms within the past 5 years Renal impairment (eGFR < 30 mL/min/1.73 m2)d Treatment with once-weekly GLP-1 receptor agonist, or once-weekly DPP-4 inhibitor or TZD in a period of 90 days before screening Treatment with any medication for the indication of diabetes or obesity in addition to background OAD medication within 60 days of screening except insulin for acute illness (≤ 14 days) | |
Additional exclusion criteria | Initiation of anti-diabetic medication between screening and randomization | History of diabetic ketoacidosis |
Drugs | ||
Intervention | semaglutide 3, 7, or 14 mg once daily, oral | semaglutide 3, 7, or 14 mg once daily, oral |
Comparator(s) | liraglutide 0.9 mg once daily, SC injection placebo once daily, oral | dulaglutide 0.75 mg once daily, SC injection |
Duration | ||
Phase | ||
Run-in (screening) | 8 weeks (screening/wash-out) 2 weeks (screening only) | 2 weeks |
Double-blind/treatment period | 52 weeks (incl. 8 week dose escalation) | 52 weeks (incl. 8 week dose escalation) |
Follow-up | 5 weeks | 5 weeks |
Outcomes | ||
Primary End Point | change from baseline to week 26 in A1C (%-points) | number of TEAEs during exposure to treatment assessed up to 57 weeks |
Secondary End Points | None | None |
Supportive secondary/ Exploratory End Points | Supportive secondary: Change from baseline to week 26 and 52 in:
| Supportive secondary: Change from baseline to week 26 and 52 in:
|
Binary end points (achieved at week 26 and week 52):
Time to event:
PROs: Change from baseline to week 26 and 52 in:
| Binary end points (achieved at week 26 and week 52):
Time to event:
PROs:
| |
Notes | ||
Publications | Yamada 202050 | Yabe 202051 |
A1C = glycated hemoglobin; AE = adverse event; CV = cardiovascular; DB = double-blind; DPP-4 = dipeptidyl peptidase-4; ECG = electrocardiogram; eGFR = estimated glomerular filtration rate; GLP-1 RA = glucagon-like peptide receptor agonist; MACE = major cardiovascular event; MEN 2 = multiple endocrine neoplasia type 2; MI = myocardial infarction; MTC = medullary thyroid carcinoma; NYHA = New York Heart Association; OAD = oral antidiabetic drug; RCT = randomized controlled trial; SAE = serious adverse event; SC = subcutaneous; SGLT2 = sodium-glucose co-transporter 2; SU = sulfonylurea.
aAdult patients defined by age ≥ 18 years at the time of signing informed consent; for Japan only: age ≥ 20 years at the time of signing informed consent; for Korea only, ≥ 19 years at the time of signing informed consent.
bPIONEER 7 semaglutide dosage adjustment criteria was based on A1C or tolerability. For A1C, if A1C < 7.0% (53 mmol/mol) the current dose was continued; if A1C ≥ 7.0% (53 mmol/mol), the dose of semaglutide was escalated to the next dose level. For tolerability, if a patient reported moderate to severe nausea or vomiting for ≥ 3 days in the week before a scheduled visit, the dose of semaglutide was maintained or reduced at the discretion of the investigator, irrespective of the level of A1C.
cPermitted OADs included: metformin, SU, glinide, alpha-glucosidase inhibitor, DPP-4 inhibitor, and SGLT2 inhibitor at a half-maximum approved dose or below according to Japanese labelling in addition to diet and exercise.
dAccording to the Chronic Kidney Disease Epidemiology Collaboration formula.42,43
Description of studies
A total of 10 phase IIIa RCTs met the inclusion criteria for the CADTH systematic review: PIONEER 1 through 10.12-20,52 Note that the intervention in the pivotal PIONEER 7 study, semaglutide with flexible dosing, is not aligned with the criteria specified in the CADTH review protocol or the dosing recommended by Health Canada. Therefore, all data for PIONEER 7 are presented in Appendix 3.
Details of the included studies are summarized in Table 9, Table 10, Table 11, and Table 12 and an overview of the trial designs are presented in Appendix 3. PIONEER 1 to 6 and 8 to 10 evaluated the efficacy and safety of semaglutide tablets 3 mg, 7 mg, or 14 mg once daily, alone or in combination with other anti-diabetic medication, compared to placebo (PIONEER 1, 5, 6, and 8) or active comparators (PIONEER 2, 3, 4, 9, and 10) in adults with T2DM and inadequate glycemic control with diet and exercise alone, or with background therapy. Patients included in PIONEER 5 and PIONEER 6 were living with moderate renal impairment, and cardiovascular disease or risk factors, respectively.
The primary objective of PIONEER 1 to 5 and 8 was to evaluate the effect of semaglutide tablets once daily on glycemic control (change from baseline in A1C). The primary objective of PIONEER 6 was to confirm cardiovascular safety by showing that treatment with semaglutide tablets did not result in an unacceptable increase in cardiovascular risk compared with placebo (rule out 80% excess risk) in subjects with T2DM at high risk of cardiovascular events. The primary objective of PIONEER 9 was to assess the dose-response relationship semaglutide tablets compared to placebo on glycemic control. The primary objective of PIONEER 10 was to evaluate the safety and tolerability of semaglutide tablets 3 mg, 7 mg, or 14 mg once daily. Secondary objectives for the PIONEER trials were to evaluate the effect of semaglutide tablets on body weight, and compare safety and tolerability.
All of the included studies were randomized, parallel-group, multi-centre, double-blind trials, except PIONEER 2 and 10, which were open-label. Also, PIONEER 9 was a combination of double-blind for semaglutide tablets and placebo, and open-label liraglutide. PIONEER 2 to 4 and 9 to 10 were active-controlled trials (PIONEER 4 and 9 also compared to placebo), and PIONEER 1, 5, and 8 were placebo-controlled trials. All of the studies assessed the once daily dosing of semaglutide tablets 3 mg, 7 mg, or 14 mg, except PIONEER 2, 4, and 5, which only assessed the 14 mg dose. Background therapy was permitted in each of the trials except PIONEER 1, 6, and 9, as described in Table 13. Briefly, semaglutide was evaluated as monotherapy (PIONEER 1, 6 and 9), as an add-on to metformin (PIONEER 2), as an add-on to 1 to 2 oral antidiabetics (OADs) (PIONEER 3, 4, 10) or insulin with or without metformin (PIONEER 8). The active-controlled trials included comparisons to a SGLT2 inhibitor (empagliflozin, PIONEER 2), DPP-4 inhibitor (sitagliptin, PIONEER 3), and subcutaneous GLP-1 RAs (liraglutide, PIONEER 4 and 9, and dulaglutide, PIONEER 10).
PIONEER 1 to 6 and 8 were conducted globally and PIONEER 6 and 8 included patients from 7 sites (each) in Canada. Between 243 and 1863 patients were included in the full analysis set of each of PIONEER 1 to 5, and 8 to 10, and 3183 patients were included in PIONEER 6. An interactive web/voice response system was used to randomize patients in all studies. A simple randomization scheme (for example, 1:1) was followed for all of the trials except PIONEER 4 and PIONEER 9, where patients were randomized to the active treatment groups and placebo treatment group at a 2:1 ratio. Randomization was stratified by: background therapy in all of the PIONEER trials except 1, 2, and 6; by renal impairment and CV disease classification in PIONEER 5 and 6, respectively; and by country (Japanese and non-Japanese) in PIONEER 1, 3, 4, and 8 (Table 13).
Each trial began with a screening period to assess eligibility and review screening data of patients, which was a duration of 2 weeks in the all of the PIONEER trials except PIONEER 6 that had a 3-week screening period. Additionally, PIONEER 9 included an 8-week screening period that only applied to patients that were receiving an OAD before enrolment to allow for discontinuation and wash-out of the OAD. The treatment period was 52 weeks in all of the included studies except PIONEER 1 and 5 (26 weeks), PIONEER 3 (78 weeks), and the PIONEER 6, which was an event-driven study that continued until at least 122 first EAC-confirmed MACE occurred. The treatment period of all of the trials began with an 8-week dose escalation period for semaglutide tablets (further described under “Interventions”) and were followed by a 5-week follow-up period. Active comparators were escalated according to the treatment’s label (note: liraglutide 0.9 mg follows the Japanese label). Subsequent to the dose escalation period, patients received a maintenance dose of semaglutide tablets for the remainder of the treatment period. A notable difference of PIONEER 8 was that the 52-week treatment period consisted of a 26-week fixed insulin treatment period, where an increase in total daily insulin dose was avoided, followed by a 26-week adjustable insulin treatment period, where the total daily insulin doses could be adjusted by the investigator (further described under “Interventions”).
Table 13: Summary of included studies study designs
Study | Background therapy permitted during trial | Stratification | |
|---|---|---|---|
By background medication | By country and disease classification | ||
PIONEER 1 | None | None | Japanese Non-Japanese |
PIONEER 2 | Met | None | |
PIONEER 3 | Met ± SU | Met Met + SU | Japanese Non-Japanese |
PIONEER 4 | Met ± SGLT2 inhibitor | Met Met + SGLT2 inhibitor | Japanese Non-Japanese |
PIONEER 5 | Met alone SU ± Met Basal insulin ± Met | Met SU ± Met Basal insulin ± Met | eGFR 45-59 mL/min/1.73m2 eGFR 30-44 mL/min/1.73m2 |
PIONEER 6 | None | None | Established CV disease CV-risk factors only |
PIONEER 8 | Met Insulin | Met No Met; and by: Basal insulin Basal-bolus Premix insulin | Japanese Non-Japanese |
PIONEER 9 | None | OAD at screening No OAD at screening | None |
PIONEER 10 | SU Glinide TZD Alpha-glucosidase inhibitor SGLT2 inhibitor | SU Glinide TZD Alpha-glucosidase inhibitor SGLT2 inhibitor | None |
eGFR = estimated glomerular filtration rate; Met = metformin; OAD = oral antidiabetic; SGLT2 = sodium-glucose cotransporter-2; SU = sulfonylurea; TZD = thiazolidinedione.
Populations
Inclusion and exclusion criteria
PIONEER 1 to 5, and 8 to 10 included adult patients, defined as at least 18 years of age (except in Japan, which was at least 20 years of age) with T2DM that was inadequately controlled with current therapy, which ranged from diet and exercise alone to stable treatment with an antidiabetic medication. All patients in PIONEER 2 to 4 were required to have been previously treated with metformin; PIONEER 3 also included patients that were receiving metformin in combination with SU, and PIONEER 4 included patients that were receiving metformin in combination with a SGLT2 inhibitor. Patients included in PIONEER 5 were required to have been receiving metformin and/or SU, basal insulin alone, or metformin in combination with basal insulin. PIONEER 8 included patients that were receiving insulin therapy alone or in combination with metformin. PIONEER 1 and 9 included patients that were treated with diet and exercise alone, or with an OAD that was washed-out before randomization in PIONEER 9. Patients included in PIONEER 10 were receiving an OAD (SU, glinide, TZD, alpha-glucosidase inhibitor, or SGLT2 inhibitor). PIONEER 6 did not have any inclusion criteria for background therapy.
Stable antidiabetic treatment was defined as a stable treatment for at least 90 days before screening in PIONEER 1 to 5, and 8, which varied by treatment as follows:
Metformin: at least 1500 mg or maximum tolerated
SU: at least half of the maximum approved dose according to local labelling or maximum tolerated
Insulin therapies (basal insulin, basal and bolus in any combination, premixed insulin): maximum 20% change in total daily dose
PIONEER 9 and PIONEER 10 required patients to have been on a stable dose of OAD as monotherapy for at least 30 days and 60 days before screening, respectively.
The required A1C level at baseline ranged from 7.0% in most trials (6.5% in PIONEER 9) to between 9.5% and 10.5%, as outlined in Table 9, Table 10, Table 11, and Table 12. Patients were required to have been diagnosed with T2DM for at least 30 days before screening, with the exception of in PIONEER 6 that did not specify a requirement for the duration of diagnosis with T2DM.
PIONEER 6 had a unique set of inclusion criteria aimed at including patients with T2DM at risk of CV outcomes. This included patients that were at least 50 years of age with established cardiovascular disease and/or chronic kidney disease, or patients at least 60 years of age with certain CV risk factors, based on their medical records (Table 11).
Exclusion criteria were similar across the included studies. Patients were excluded if they had a family or personal history of multiple MEN 2 or MTC, history of pancreatitis or major surgical procedures involving the stomach that could affect drug absorption, a recent major cardiovascular event (MACE) or heart failure [New York Heart Association (NYHA) Class IV], or treatment with any medication for the indication of diabetes or obesity other than stated in the inclusion criteria in a period of 90 days before the day of screening with the exception of short-term insulin treatment for acute illness (for a total maximum of 14 days). Patients with moderate renal impairment (eGFR < 60 mL/min/1.73 m2) were excluded from PIONEER 1 to 4 and 8; and PIONEER 6, 9, and 10 excluded patients with severe renal impairment (eGFR < 30 mL/min/1.73 m2). PIONEER 6 also excluded patients on chronic or intermittent hemodialysis or peritoneal dialysis, and PIONEER 5 excluded patients with rapidly progressing renal disease or known nephrotic albuminuria.
Additional details of the inclusion and exclusion criteria for the studies included in this review are summarized in Table 9, Table 10, Table 11, and Table 12.
Baseline characteristics
The baseline characteristics of the included studies are presented in Table 14, Table 15, Table 16, and Table 17. In general, the baseline characteristics were similar between treatment groups within each of the included studies; however, there are a few differences to note. There was an imbalance between treatment groups in terms of sex (% male) in PIONEER 5, 8, 9, and 10, race/ethnicity in PIONEER 1, 5, and 8, particularly due to the proportion of patients that identified as Hispanic or Latino, and by background medication in PIONEER 9. The demographic and disease characteristics of patients in PIONEER 6 were similar between treatment groups.
There were also differences across trials. The mean age of patients ranged from 54 to 61 years of age across all studies except PIONEER 5 and 6, where the mean age was 70 to 71 years and 66 years, respectively. Of note, PIONEER 5 included patients with impaired renal function and PIONEER 6 included patients with or at risk of CV disease. The proportion of male patients per treatment group ranged from 47% to 57% in PIONEER 1 to 5 and 8, but was greater in PIONEER 6, representing 68% to 69% of enrolled patients, as well as in PIONEER 9 and 10, where 68% to 83% of patients were male. The trials also differed in terms of the race/ethnicity of participating patients. PIONEER 9 and 10 were conducted in Japanese patients only, and 94% to 97% of patients included in PIONEER 5 were White. The proportion of patients who were White ranged from 48% to 86%, Black ranged from 3% to 8%, Asian ranged from 7% to 36%, and Hispanic or Latino ranged from 4% to 30% in the rest of the PIONEER trials. The background medications used differed between the patient populations of included studies; however, this was due to the trial designs. The duration of diabetes ranged from 3 to 4 years in PIONEER 1, 14 to 16 years in PIONEER 5, 6, and 8, and ranged from 7 to 10 years in PIONEER 2 to 4, 9 and 10. Body weight was notably lower in PIONEER 9 and 10, which ranged from 68.0 kg to 74.7 kg, compared to the other PIONEER trials where the mean body weight was between 84.6 kg and 95.5 kg. Lastly, the mean eGFR was notably lower in PIONEER 5 and 6, which specifically included patients with impaired renal function.
Table 14: Summary of Baseline Characteristics (Active-Controlled RCTs, add-on to 1 to 2 OADs; FAS)
Characteristic | PIONEER 2 | PIONEER 3 | PIONEER 4 | ||||||
|---|---|---|---|---|---|---|---|---|---|
SEM 14 mg N = 411 | EMPA 25 mg N = 410 | SEM 3 mg N = 466 | SEM 7 mg N = 465 | SEM 14 mg N = 465 | SITA 100 mg N = 467 | SEM 14 mg N = 285 | LIRA 1.8 mg N = 284 | PBO N = 142 | |
Age, years, mean (SD) | 57 (10) | 58 (10) | 58 (10.0) | 58 (10.0) | 57 (10.0) | 58 (10.0) | 56 (10) | 56 (10) | 57 (10) |
Sex, n (%) | |||||||||
Male | 206 (50.1) | 209 (51.0) | 254 (54.5) | 245 (52.7) | 247 (53.1) | 238 (51.0) | 147 (51.6) | 149 (52.5) | 74 (52.1) |
Female | 205 (49.9) | 201 (49.0) | 212 (45.5) | 220 (47.3) | 218 (46.9) | 229 (49.0) | 138 (48.4) | 135 (47.5) | 68 (47.9) |
Race, n (%) | |||||||||
White | 355 (86.4) | 353 (86.1) | 344 (73.8) | 330 (71.0) | 317 (68.2) | 333 (71.3) | 208 (73.0) | 212 (74.6) | 99 (69.7) |
Black or African American | 26 (6.3) | 33 (8.0) | 38 (8.2) | 38 (8.2) | 45 (9.7) | 39 (8.4) | 12 (4.2) | 9 (3.2) | 8 (5.6) |
Asian | 28 (6.8) | 21 (5.1) | 56 (12.0) | 69 (14.8) | 61 (13.1) | 59 (12.6) | 39 (13.7) | 36 (12.7) | 19 (13.4) |
American Indian or Alaska Native | 0 | 0 | 4 (0.9) | 3 (0.6) | 5 (1.1) | 6 (1.3) | 0 | 1 (0.4) | 1 (0.7) |
Native Hawaiian or other Pacific islander | 0 | 0 | 1 (0.2) | 0 | 0 | 0 | 0 | 1 (0.4) | 0 |
Other | 2 (0.5) | 3 (0.7) | 13 (2.8) | 11 (2.4) | 20 (4.3) | 12 (2.6) | 3 (1.1) | 8 (2.8) | 3 (2.1) |
Not applicable | 0 | 0 | 10 (2.1) a | 14 (3.0) a | 17 (3.7) a | 18 (3.9) a | 0 | 0 | 0 |
Not available | 0 | 0 | 0 | 0 | 0 | 0 | 23 (8.1)c | 17 (6.0) c | 12 (8.5) c |
Hispanic or Latino ethnicity | 91 (22.1) | 108 (26.3) | 76 (16.3) | 77 (16.6) | 75 (16.1) | 93 (19.9) | 17 (6.0) | 18 (6.3) | 5 (3.5) |
Background medication, n (%) | |||||||||
Metformin | 411 (100.0) | 410 (100.0) | 466 (100.0) | 465 (100.0) | 465 (100.0) | 467 (100.0) | 285 (100.0) | 284 (100.0) | 142 (100.0) |
Sulfonylurea | N/A | N/A | 220 (47.2) | 218 (46.9) | 220 (47.3) | 219 (46.9) | N/A | N/A | N/A |
SGLT2 inhibitor | N/A | N/A | N/A | N/A | N/A | N/A | 74 (26.0) | 73 (25.7) | 36 (25.4) |
Duration of Diabetes, y, mean (SD) | 7.2 (5.8) | 7.7 (6.3) | 8.4 (6.1) | 8.3 (5.8) | 8.7 (6.1) | 8.8 (6.0) | 7.8 (5.7) | 7.3 (5.3) | 7.8 (5.5) |
Body weight, kg, mean (SD) | 91.9 (20.5) | 91.3 (20.1) | 91.6 (22.0) | 91.3 (20.8) | 91.2 (21.7) | 90.9 (21.0) | 92.9 (20.6) | 95.5 (21.9) | 93.2 (20.0) |
BMIb, mean (SD) | 32.9 (6.3) | 32.8 (5.9) | 32.6 (6.7) | 32.6 (6.4) | 32.3 (6.3) | 32.5 (6.2) | 32.5 (5.9) | 33.4 (6.7) | 32.9 (6.1) |
A1C, %, mean (SD) | 8.1 (0.9) | 8.1 (0.9) | 8.3 (1.0) | 8.4 (1.0) | 8.3 (0.9) | 8.3 (0.9) | 8.0 (0.7) | 8.0 (0.7) | 7.9 (0.7) |
FPG, mg/dL, mean (SD) | 171.5 (41.8) | 174.0 (45.2) | 174.2 (50.5) | 170.3 (42.9) | 167.9 (45.1) | 171.8 (41.9) | 167.1 (40.2) | 167.6 (40.0) | 166.7 (40.9) |
eGFR, mL/min/1.73 m2, mean (SD) | 96 (15) | 95 (15) | 96 (15) | 96 (16) | 95 (16) | 96 (15) | 96 (15) | 96 (15) | 95 (15) |
A1C = glycated hemoglobin; BMI = body mass index; eGFR = estimated glomerular filtration rate; EMPA = empagliflozin; FAS = full analysis set; FPG = fasting plasma glucose; LIRA = liraglutide; PBO = placebo; RCT = randomized controlled trial; SD = standard deviation; SEM = semaglutide; SGLT2 = sodium-glucose co-transporter 2; SITA = sitagliptin.
aNot applicable for Brazil and France.
bCalculated as weight in kilograms divided by height in metres squared.
cFor patients in South Africa, race was not available.
Table 15: Summary of Baseline Characteristics (Placebo-Controlled RCTs; FAS)
Characteristic | PIONEER 1 | PIONEER 5 | PIONEER 8 | |||||||
|---|---|---|---|---|---|---|---|---|---|---|
SEM 3 mg N = 175 | SEM 7 mg N = 175 | SEM 14 mg N = 175 | PBO N = 178 | SEM 14 mg N = 163 | PBO N = 161 | SEM 3 mg N = 184 | SEM 7 mg N = 182 | SEM 14 mg N = 181 | PBO N = 184 | |
Age, years, mean (SD) | 55 (11) | 56 (11) | 54 (11) | 54 (11) | 71 (8) | 70 (8) | 61 (9) | 60 (10) | 61 (10) | 60 (10) |
Sex, n (%) | ||||||||||
Male | 89 (50.9) | 93 (53.1) | 86 (49.1) | 89 (50.0) | 83 (51%) | 73 (45%) | 102 (55.4) | 103 (56.6) | 85 (47.0) | 105 (57.1) |
Female | 86 (49.1) | 82 (46.9) | 89 (50.9) | 89 (50.0) | 80 (49) | 88 (55) | 82 (44.6) | 79 (43.4) | 96 (53.0) | 79 (42.9) |
Race, n (%) | ||||||||||
White | 135 (77.1) | 131 (74.9) | 130 (74.3) | 132 (74.2) | 158 (97) | 152 (94) | 89 (48.4) | 95 (52.2) | 94 (51.9) | 98 (53.3) |
Black or African American | 6 (3.4) | 11 (6.3) | 10 (5.7) | 10 (5.6) | 4 (2) | 9 (6) | 15 (8.2) | 10 (5.5) | 11 (6.1) | 13 (7.1) |
Asian | 31 (17.7) | 30 (17.1) | 29 (16.6) | 31 (17.4) | 1 (1) | 0 | 66 (35.9) | 66 (36.3) | 66 (36.5) | 65 (35.3) |
Other | 3 (1.7) | 3 (1.7) | 6 (3.4) | 5 (2.8) | 0 | 0 | 14 (7.6)a | 11 (6.0)a | 10 (5.5)a | 8 (4.3)a |
Hispanic or Latino ethnicity | 52 (29.7) | 31 (17.7) | 46 (26.3) | 51 (28.7) | 7 (4) | 14 (9) | 18 (9.8) | 24 (13.2) | 30 (16.6) | 25 (13.6) |
Background medication, n (%) | ||||||||||
Metformin | Drug naïve | 39 (23.9) | 38 (23.6) | N/A | N/A | N/A | N/A | |||
MET + insulin | N/A | N/A | 123 (66.8) | 122 (67.0) | 121 (66.9) | 125 (67.9) | ||||
SU +/− MET | 65 (39.9) | 67 (41.6) | N/A | N/A | N/A | N/A | ||||
Insulinb | N/A | N/A | 184 (100) | 182 (100) | 181 (100) | 184 (100) | ||||
Insulin +/− MET | 59 (36.2) | 56 (34.8) | N/A | N/A | N/A | N/A | ||||
Duration of Diabetes, y, mean (SD) | 3.8 (5.3) | 3.6 (5.1) | 3.4 (4.4) | 3.4 (4.6) | 14.1 (8.6) | 13.9 (7.4) | 15.1 (7.9) | 16.2 (8.6) | 14.1 (8.0) | 14.8 (7.9) |
Body weight, kg, mean (SD) | 86.9 (21.0) | 89.0 (21.8) | 88.1 (22.1) | 88.6 (23.4) | 91.3 (17.8) | 90.4 (17.5) | 85.9 (21.5) | 87.1 (23.6) | 84.6 (21.0) | 86.0 (21.4) |
BMIc, mean (SD) | 31.8 (6.3) | 31.6 (6.4) | 31.7 (6.6) | 32.2 (6.9) | 32.2 (5.4) | 32.6 (5.5) | 31.0 (6.8) | 31.1 (7.0) | 30.8 (6.3) | 31.0 (6.5) |
A1C, %, mean (SD) | 7.9 (0.7) | 8.0 (0.6) | 8.0 (0.7) | 7.9 (0.7) | 8.0 (0.7) | 7.9 (0.7) | 8.2 (0.7) | 8.2 (0.7) | 8.2 (0.7) | 8.2 (0.7) |
FPG, mg/dL, mean (SD) | 158.3 (42.3) | 161.9 (42.2) | 158.1 (39.2) | 160.0 (38.9) | 164.0 (48.7) | 164 (504.5) | 158.4 (57.8) | 153.3 (49.2) | 150.1 (46.8) | 149.5 (47.4) |
eGFR, mL/min/1.73 m2, mean (SD) | 99 (14) | 95 (16) | 97 (16) | 100 (15) | 47 (10) | 48 (10) | 92 (16) | 92 (16) | 91 (14) | 91 (15) |
A1C = glycated hemoglobin; BMI = body mass index; eGFR = estimated glomerular filtration rate; FPG = fasting plasma glucose; MET = metformin; NR = not reported; PBO = placebo; SEM = semaglutide; SD = standard deviation; SU = sulfonylurea; TZD = thiazolidinedione
aIncludes American Indian or Alaska Native, Native Hawaiian or other Pacific Islander, Other, and Not Applicable, as race was not recorded for France as per local regulation.
bIncludes the following alone or in combination: basal insulin (40% to 44% of patients), basal and bolus insulin (36% to 39%), premix insulin (15% to 19%), bolus insulin (0.5% to 1.1%), basal and premix insulin (0 to 1.1%), and basal and bolus premix insulin (0 to 1.1%).
cCalculated as weight in kilograms divided by height in metres squared.
Table 16: Summary of Baseline Characteristics (CVOT; FAS)
Characteristic | PIONEER 6 | |
|---|---|---|
SEM 14 mg N = 1591 | PBO N = 1592 | |
Age, years, mean (SD) | 66 (7) | 66 (7) |
Sex, n (%) | ||
Male | 1084 (68.1) | 1092 (68.6) |
Female | 507 (31.9) | 500 (31.4) |
Race, n (%) | ||
White | 1148 (72.2) | 1152 (72.4) |
Black or African American | 89 (5.6) | 103 (6.5) |
Asian | 324 (20.4) | 306 (19.2) |
Other | 30 (1.9) | 31 (1.9) |
Region, n (%) | ||
Europe | 475 (29.9) | 484 (30.4) |
North America | 556 (34.9) | 550 (34.5) |
South America | 196 (12.3) | 205 (12.9) |
Africa | 102 (6.4) | 93 (5.8) |
Asia | 262 (16.5) | 260 (16.3) |
Background medication, n (%) | ||
Metformin | 1221 (76.7) | 1242 (78.0) |
Sulfonylurea | 517 (32.5) | 510 (32.0) |
SGLT2 inhibitors | 165 (10.4) | 140 (8.8) |
TZD | 65 (4.1) | 53 (3.3) |
Alpha-glucosidase inhibitors | 36 (2.3) | 43 (2.7) |
Other | 26 (1.6) | 26 (1.6) |
DPP-4 inhibitorsa | 2 (0.1) | 0 |
GLP-1 RAa | 1 (0.1) | 0 |
Insulin | 968 (60.8) | 962 (60.4) |
Number of concomitant anti-diabetic medications receivedb | ||
0 | 22 (1.4) | 24 (1.5) |
1 | 346 (21.7) | 356 (22.4) |
2 | 696 (43.7) | 705 (44.3) |
≥ 3 | 527 (33.1) | 507 (31.8) |
Duration of Diabetes, year, mean (SD) | 14.7 (8.5) | 15.1 (8.5) |
Body weight, kg, mean (SD) | 91.0 (21.4) | 90.8 (21.0) |
BMI, mean (SD) | 32.3 (6.6) | 32.3 (6.4) |
A1C, %, mean (SD) | 8.2 (1.6) | 8.2 (1.6) |
FPG, mg/dL, mean (SD) | 155.0 (58.1) | 157.3 (60.8) |
eGFR, mL/min/1.73 m2, mean (SD) | 74 (21) | 74 (21) |
Blood pressure, mm Hg | ||
Systolic | 135 (18) | 136 (18) |
Diastolic | 76 (10) | 76 (10) |
LDL cholesterol | ||
Geometric mean, mg/dl | 77 | 79 |
Coefficient of variation, % | 44.9 | 41.2 |
CV risk stratum, n (%) | ||
Age ≥ 50 year and established CVD or CKD | 1350 (84.9) | 1345 (84.5) |
Age ≥ 60 year and CV risk factors only | 241 (15.1) | 247 (15.5) |
CV risk factors | ||
Microalbuminuria or proteinuria | 518 (32.6) | 533 (33.5) |
Hypertension and left ventricular hypertrophy by ECG or imaging | 381 (23.9) | 400 (25.1) |
Left ventricular systolic or diastolic dysfunction by imaging | 337 (21.2) | 335 (21.0) |
Ankle–brachial index < 0.9 | 81 (5.1) | 94 (5.9) |
Patients meeting inclusion criteria for CV disease | ||
Prior myocardial infarction | 561 (35.3) | 589 (37.0) |
Prior stroke or transient ischemic attack | 242 (15.2) | 263 (16.5) |
Prior coronary, carotid, or peripheral arterial revascularization | 733 (46.1) | 768 (48.2) |
> 50% stenosis on angiography/imaging of coronary, carotid/lower extremity arteries | 427 (26.8) | 453 (28.5) |
History of symptomatic coronary heart disease | 356 (22.4) | 375 (23.6) |
Asymptomatic cardiac ischemia | 97 (6.1) | 92 (5.8) |
Chronic heart failure NYHA class 2-3 | 188 (11.8) | 200 (12.6) |
Moderate renal impairment | 463 (29.1) | 435 (27.3) |
A1C = glycated hemoglobin; BMI = body mass index; CKD = chronic kidney disease; CV = cardiovascular; CVD = cardiovascular disease; DPP-4 = dipeptidyl peptidase-4; ECG = electrocardiogram; eGFR = estimated glomerular filtration rate; FPG = fasting plasma glucose; GLP-1 RA = glucagon-like peptide 1 receptor agonist; LDL = low density lipoprotein; NYHA = New York Heart Association; PBO = placebo; SD = standard deviation; SEM = semaglutide; SGLT2 = sodium-glucose co-transporter 2; TZD = thiazolidinediones
aThe 3 patients that reported use of DPP-4 inhibitors and GLP-1 receptor agonists were randomized in error.
bOngoing at randomization.
Source: Clinical Study Report.20
Table 17: Summary of Baseline Characteristics (Population-specific supportive studies)
Characteristic | PIONEER 9 | PIONEER 10 | |||||||
|---|---|---|---|---|---|---|---|---|---|
SEM 3 mg N = 49 | SEM 7 mg N = 49 | SEM 14 mg N = 48 | LIRA N = 48 | PBO N = 49 | SEM 3 mg N = 131 | SEM 7 mg N = 132 | SEM 14 mg N = 130 | DULA 0.75 mg N = 65 | |
Age, years, mean (SD) | 58 (9) | 60 (10) | 61 (9) | 59 (10) | 59 (9) | 59 (10) | 58 (11) | 57 (10) | 61 (9) |
Sex, n (%) | |||||||||
Male | 36 (73) | 36 (73) | 40 (83) | 39 (81) | 40 (82) | 100 (76) | 90 (68) | 100 (77) | 51 (78) |
Female | 13 (27) | 13 (27) | 8 (17) | 9 (19) | 9 (18) | 31 (24) | 42 (32) | 30 (23) | 14 (22) |
Race, n (%) | |||||||||
Japanese | 49 (100) | 49 (100) | 48 (100) | 48 (100) | 49 (100) | 131 (100) | 132 (100) | 130 (100) | 65 (100) |
Background medication, n (%) | |||||||||
Metformin | 7 (14) | 4 (8) | 8 (17) | 8 (17) | 9 (18) | NR | NR | NR | NR |
Sulfonylurea | 1 (2) | 0 | 0 | 1 (2) | 0 | 42 (32) | 42 (32) | 42 (32) | 21 (32) |
TZD | NR | NR | NR | NR | NR | 23 (18) | 23 (17) | 22 (17) | 11 (17) |
SGLT2 inhibitor | 5 (10) | 3 (6) | 1 (2) | 4 (8) | 2 (4) | 22 (17) | 23 (17) | 22 (17) | 11 (17) |
DPP-4 inhibitor | 5 (10) | 10 (20) | 6 (13) | 2 (4) | 7 (14) | NR | NR | NR | NR |
Alpha-glucosidase inhibitor | 1 (2) | 2 (4) | 3 (6) | 3 (6) | 1 (2) | 22 (17) | 22 (17) | 22 (17) | 11 (17) |
Duration of Diabetes, y, mean (SD) | 7.4 (5.5) | 7.4 (5.6) | 7.9 (5.9) | 6.7 (5.2) | 8.4 (6.0) | 9.4 (6.3) | 9.3 (6.3) | 9.1 (6.4) | 9.9 (6.3) |
Body weight, kg, mean (SD) | 71.4 (14.3) | 71.3 (10.8) | 68.0 (13.0) | 74.7 (15.4) | 70.3 (12.4) | 71.5 (16.0) | 72.7 (16.4) | 72.6 (15.2) | 71.2 (14.3) |
BMI, mean (SD) | 26.5 (4.6) | 26.3 (3.5) | 24.7 (4.1) | 26.9 (4.8) | 25.1 (3.9) | 25.8 (4.5) | 26.8 (5.0) | 26.3 (5.2) | 26.0 (4.0) |
A1C, %, mean (SD) | 8.1 (0.8) | 8.3 (1.0) | 8.0 (0.9) | 8.3 (0.8) | 8.3 (1.1) | 8.2 (0.9) | 8.3 (0.9) | 8.4 (1.0) | 8.4 (0.9) |
FPG, mg/dL, mean (SD) | 163.3 (34.4) | 161.0 (30.6) | 160.0 (35.4) | 174.5 (34.9) | 162.1 (34.7) | 161.9 (34.0) | 165.3 (36.7) | 168.5 (37.6) | 171.1 (37.3) |
eGFR, mL/min/1.73 m2, mean (SD) | 99 (12) | 96 (14) | 94 (13) | 99 (9) | 96 (12) | 96 (13) | 97 (14) | 97 (14) | 96 (13) |
A1C = glycated hemoglobin; BMI = body mass index; DPP-4 = dipeptidyl peptidase-4; DULA = dulaglutide; eGFR = estimated glomerular filtration rate; FPG = fasting blood glucose; LIRA = liraglutide; NR = not reported; PBO = placebo; SEM = semaglutide; SD = standard deviation; SGLT2 = sodium-glucose co-transporter 2; TZD = thiazolidinedione.
Interventions
Three doses of semaglutide tablets (3, 7 and 14 mg once daily) were investigated in 5 of the included studies (PIONEER 1, 3 and 8 − 10). Four of the included studies investigated semaglutide tablets 14 mg once daily only (PIONEER 2 and 4 to 6). In all included studies (PIONEER 1 to 6 and 8 to 10) semaglutide tablets were titrated upwards using a fixed schedule to achieve a maintenance dose greater than 3 mg once daily. Titration started with the 3 mg dose once daily for 4 weeks, followed by a dose escalation at 4-week intervals to 7 mg and then to 14 mg, depending on randomized dose. The 7 and 14 mg maintenance doses were achieved after 4 and 8 weeks, respectively. In all studies, patients continued on the maintenance dose of semaglutide tablets for the remainder of the treatment period. Semaglutide tablets were administered once daily in the morning while in a fasting state and up to 30 minutes before the first meal of the day, with up to half a glass or 120 mL of water, swallowed whole. Other oral medications could be taken 30 minutes following administration.
All of the trials that included placebo as the sole comparator (PIONEER 1, 5, 6, and 8) were double-blind. Sitagliptin 100 mg once-daily was the comparator used in PIONEER 3, and both SC liraglutide 1.8 mg and placebo were used as comparators in PIONEER 4, and both studies employed a double-blind, double-dummy study design. In PIONEER 4, liraglutide was administered once daily, and titrated upwards on a weekly basis from 0.6 mg to 1.2 mg, and finally to 1.8 mg over 2 weeks total. PIONEER 9 was both double-blind and open-label; once-daily semaglutide tablets and placebo were double-blind, and liraglutide 0.9 mg was open-label. Liraglutide was administered daily and titrated upwards on a weekly basis from 0.3 mg to 0.6 mg, and finally to 0.9 mg. PIONEER 2 and 10 used once-daily oral empagliflozin 25 mg and once-weekly SC dulaglutide 0.75 mg, respectively, as open-label comparators.
PIONEER 1, 9, and the PIONEER 6 evaluated semaglutide tablets as a monotherapy. Each of the other trials included patients receiving 1 or more of the following treatments in addition to semaglutide tablets: metformin, SU, SGLT2 inhibitor, and insulin (basal, basal-bolus, premix). PIONEER 10 included patients receiving glinide, TZD, or an alpha-glucosidase inhibitor as background therapy. Further details of background therapy used is described in the description of studies tables (Table 9, Table 10, Table 11, and Table 12) and Table 13.
In all of the included trials, rescue medication was permitted for patients with persistent and unacceptable hyperglycemia as judged by the investigator. Criteria for rescue medication are presented in Table 18. In PIONEER 1 to 4 and 9 to 10, rescue criteria based on fasting plasma glucose (FPG) applied from week 8 and onwards, and criteria based on A1C applied from week 26 and onwards in trials of that were greater than 26 weeks duration (all except PIONEER 1 and 5). In PIONEER 5 and 8, rescue criteria applied from week 12 and week 16, respectively, to allow the basal insulin dose to adjust. If an initial FPG value as well as follow-up re-test exceed the limits described below, rescue medication was offered.
Table 18: Criteria for Initiation of Rescue Medication
Criteria | PIONEER 2-4, 10 | PIONEER 1, 9 | PIONEER 5, 8 |
|---|---|---|---|
FPG | |||
From week 8 to the end of week 13 | 14.4 mmol/L | 13.3 mmol/L | N/A |
From week 12 to the end of week 16 | N/A | N/A | 13.3 mmol/L |
From week 14 to the end of week 25 | 13.3 mmol/L | 11.1 mmol/L | N/A |
From week 16/17a to the end of treatment | N/A | N/A | 11.1 mmol/L |
From week 26 to the end of treatment | 11.1 mmol/L | N/A | N/A |
A1C | |||
From week 26 to end of treatment | > 8.5% (69.4 mmol/mol) | PIONEER 9 only > 8.5% (69.4 mmol/mol) | PIONEER 8 only > 8.5% (69.4 mmol/mol) |
aFrom week 16 for PIONEER 8 and from week 17 for PIONEER 5.
Note: Rescue medication was not offered in PIONEER 6.
There were no rescue criteria in PIONEER 6, but antidiabetic medication (excluding GLP-1 RAs, DPP-4 inhibitors and pramlintide) could be adjusted or added, at the investigator’s discretion and in accordance with standard of care and the current local label. This was aligned with standard-of-care treatment for glycemic control, which was permitted for patients during the trial in addition to standard-of-care treatment for management of complications, comorbidities, and CV risk factors. Concomitant medication was used at the investigator’s discretion and aligned with local practice and regulations. Briefly, the use of CV medication initiated after baseline until the end of treatment visit was reported by patients in the semaglutide and placebo treatment groups, respectively, as follows: anti-hypertensive medication by 27.7% and 29.9%; lipid lowering drugs by 16.0% and 16.1%; anti-thrombotic medication by 12.5% and 11.3%; and diuretics by 10.7% and 13.1%. Additional details regarding concomitant CV medication are presented in Appendix 3.
Patients prematurely discontinued from treatment for safety and tolerability concerns, intending to or becoming pregnant, simultaneously participating in another clinical trial, or if a patient’s calcitonin levels were 100 ng/L or greater.
Outcomes
A list of efficacy end points identified in the CADTH review protocol that were assessed in the clinical trials included in this review is provided in Table 19.
These end points are further summarized below. A detailed discussion and critical appraisal of the outcome measures is provided in Appendix 4.
Table 19: Summary of Outcomes of Interest Identified in the CADTH Review Protocol
Outcome measure | PIONEER STUDIES | ||||||||
|---|---|---|---|---|---|---|---|---|---|
PIO 1 | PIO 2 | PIO 3 | PIO 4 | PIO 5 | PIO 8 | PIO 9 | PIO 10a | PIO 6 | |
Glycemic control | Primary | Primary | Primary | Primary | Primary | Primary | Primary | Exploratory | Exploratory |
Mortality | NR | NR | NR | NR | NR | NR | NR | NR | Secondary |
Diabetes-related morbidity | NR | NR | NR | NR | NR | NR | NR | NR | Primary |
HRQoL | Exploratory | Exploratory | Exploratory | Exploratory | Exploratory | Exploratory | Exploratory | Exploratory | NR |
Blood pressure | Safety | Safety | Safety | Safety | Safety | Safety | Safety | Safety | Safety |
Body weight | Secondary | Secondary | Secondary | Secondary | Secondary | Secondary | Exploratory | Exploratory | Exploratory |
BMI | Exploratory | Exploratory | Exploratory | Exploratory | Exploratory | Exploratory | Exploratory | Exploratory | Exploratory |
Lipid profile | Exploratory | Exploratory | Exploratory | Exploratory | Exploratory | Exploratory | Exploratory | Exploratory | Exploratory |
Health care resource utilization | NR | NR | NR | NR | NR | NR | NR | NR | NR |
BMI = body mass index; HRQoL = health-related quality of life; NR = not reported; PIO = PIONEER.
Note: Exploratory outcomes were referred to as supportive secondary end points in the Clinical Study Reports.
aThe primary end point in PIONEER 10 was safety-related.
Glycemic control
Glycemic control was measured using a variety of measures in each of the included studies. For the purposes of this review, change from baseline in A1C (%) was reported. The change from baseline in A1C at week 26 was the primary end point in PIONEER 1 to 5, 8, and 9. A1C was measured at every in-person study visit in the PIONEER trials, which typically occurred at week 0 (randomization), week 4, week 8, week 14, and then every 6 or 7 weeks until end of treatment.
Mortality
Mortality as an efficacy outcome was only assessed in PIONEER 6. Mortality was reported as all-cause deaths and CV-related deaths, which included undetermined cause of death (i.e., undetermined cause of death was assumed to be CV-related) and required adjudication by an EAC. Further, mortality was reported via the time from randomization to first occurrence of CV-death, all-cause death, and time from randomization to all-cause death. Time from randomization to CV-related deaths were incorporated into the expanded composite MACE, which was the secondary outcome used in PIONEER 6.
Diabetes-related morbidity and mortality
Diabetes-related morbidity and mortality was only assessed in PIONEER 6. Measures of morbidity and mortality used the MACE composite end point defined as CV death, non-fatal MI, or non-fatal stroke. An expanded MACE composite outcome was also used, which included the same outcomes as the MACE in addition to unstable angina pectoris requiring hospitalization or heart failure requiring hospitalization. In this review, the time from randomization to first occurrence of a EAC-confirmed MACE and the time from randomization to first occurrence of EAC-confirmed all-cause death, non-fatal stroke, or non-fatal MI were reported. A breakdown of EAC-confirmed expanded MACE was also reported.
HRQoL
Patient’s HRQoL was evaluated using a generic measure of HRQoL, the Short Form-36 version 2 (SF-36v2), 2 diabetes-specific measures, the Diabetes Treatment Satisfaction Questionnaire (DTSQ) and the Diabetes Treatment Related-Quality of Life (DTR-QOL) outcomes, and 2 generic/weight-management outcomes, the control of eating questionnaire (CoEQ) and Impact of Weight on Quality of Life (IWQOL). The HRQoL outcomes were reported as a change from baseline to week 26 and end of study.
SF-36v2
The SF-36v2 is a 36-item, generic health status instrument that has been used extensively in clinical trials in many disease areas.53 It consists of 8 health domains: physical functioning, role physical, bodily pain, general health, vitality, social functioning, role emotional, and mental health. The 8 domains are aggregated to create 2 component summaries: the physical component summary (PCS) and the mental component summary (MCS), with scores ranging from zero to 100 with higher scores indicating better health status. Previous research suggested a lack of improvement in SF-36 scores (deteriorated or remained stable) following interventions demonstrating modest improvement in A1C levels, blood lipid and blood pressure in patients with T2DM.54 There is evidence of validity and reliability in the general population, as well as evidence supporting adequate validity among patients with T2DM; however, the validity and reliability in some dimensions among diabetes patients were not optimal and therefore revalidation of the questionnaire among this patient population has been suggested. The non-disease specific MID for the PCS was 2 points and 3 points for the MCS. A benchmark based on 1-point change was suggested for the MID for patients with T2DM, but the validity of this benchmark is unclear.55 The SF-36v2 was measured in PIONEER 1 to 3, 5, and 8 to 10.
DTSQ
The DTSQ was used to assess patient satisfaction with treatment (6 items) and perception of change in hyperglycemia and hypoglycemia (2 items).56 The DTSQ has 2 versions that have 8 items each: the DTSQ original status version (DTSQs) and the DTSQ change version (DTSQc). The DTSQs was used in the PIONEER trials. Six of the 8 items measure treatment satisfaction (satisfaction with current treatment, convenience, flexibility, satisfaction with own understanding of diabetes, and likelihood of continuing on or recommending current treatment). The item scores range from “very satisfied” ( = a score of 6) to “very unsatisfied” ( = a score of 0), and the sum of these items is taken to generate a DTSQs score, ranging from 0 to 36. Higher DTSQs scores indicate greater satisfaction with treatment. For the 2 items measuring perceived frequency of hyperglycemia and frequency of hypoglycemia, the items are scored on 7‐point response scales ranging from “most of the time” ( = a score of 6) to “none of the time” ( = a score of 0). Lower DTSQs scores indicate more ideal blood glucose levels in this case. No minimal clinically important difference (MID) was identified for the change in DTSQs scores. The psychometric properties of different language versions of the DTSQs were assessed in a study of type 1 and type 2 diabetes patients treated with insulin or poorly controlled on SUs who then started on insulin treatment. The DTSQs was shown to be consistently reliable in all languages studied and significantly sensitive to change in type 1 diabetes patients at weeks 8, 20, 24, and at last available visit. However, it has also been observed that because patients tend to report satisfaction with current treatment in the absence of experience with alternatives for comparison, the DTSQs often exhibits a ceiling effect.56 Change in DTSQs from baseline to end of study was measured in PIONEER 4, 5, and 8.
DTR-QOL
The DTR-QOL was used in PIONEER 9 and 10 and is a Japanese questionnaire which assesses the influence of diabetes treatment on a patient’s HRQoL. Four domains are assessed in this questionnaire using 29 items, including “burden on social activities and daily activities”, “anxiety and dissatisfaction with treatment”, “hypoglycemia” and “satisfaction with treatment ”. The domains for assessment of treatment impact on quality of life in the DTR-QOL were daily activity, social activities, and somatic symptoms. Questionnaire items were adapted from the following questionnaires: Insulin Therapy Related Quality of Life, the Japanese version of the DTSQ, and the Japanese version of the Diabetes Medication Satisfaction Questionnaire. Responses to questionnaire items were captured using a 7-point Likert scale with a score of ‘1’ indicating “strongly agree” and ‘–7’ indicating “strongly disagree”. Item scores are reversed making a score of 7 representative of the highest quality of life. The total score was reported for this review, which is derived from a sum of item scores and converted to a scale that ranges from zero (indicating worse-case scenario) to 100 (indicating best-case scenario).57 Validity and reliability were assessed and considered adequate in Japanese patients in with diabetes.57 An MID was not identified for this outcome. Additional information about the psychometric properties of the DTR-QOL are summarized in Appendix 4.
CoEQ
The CoEQ was reported in PIONEER 2 and 3. The CoEQ questionnaire has its origins in the Food Craving Record. The questionnaire contains 21 items using 6 sections assessing the intensity and type of food cravings, and subjective sensations of appetite and mood, and the individual’s perceived level of control against a craved food item.58 Sections 1 and 2 of the questionnaire pertain to questions of general levels of appetite and overall mood (independent of food craving). Sections 3 and 4 assess the frequency and intensity of food cravings in general. Section 5 assesses cravings for specific foods (e.g., dairy, starch, sweet or non-sweet foods). Section 6, which includes items 20 and 21, assesses the perceived level of control over resisting a nominated, craved food item. Twenty items in the questionnaire are assessed using a visual analogue scale, while 1 item (item 20) allows patients to enter their own nominated food.59 A 19-item version of the CoEQ was used in the PIONEER trials.58 Evidence of validity and reliability was demonstrated for the 21-item version of the CoEQ, but this was not specific to patients with T2DM. Evidence of validity and reliability in the 19-item version, or an associated MID was not identified.
IWQOL-Lite Clinical Version (IWQOL-Lite-CT)
The IWQOL-Lite-CT was designed to evaluate the impact of change in weight on HRQoL. This outcome measure is composed of 22 items that can be summarized by 5 domains including: psychosocial, physical, physical function, pain/discomfort, and IWQOL-Lite-CT Total. Each of the 22 items are answered based on a 5-point scale with the following options: “1=Never”, “Rarely”, “Sometimes”, Usually”, and “5=Always”.12,14,17 Lower-level scores indicate higher levels of functioning. The IWQOL-Lite-CT was assessed in PIONEER 1, 3, and 8 and the total score and domain scores were reported for this review.
The IWQOL-Lite-CT was adapted from the original IWQOL-Lite to address inadequacies related to clinical trials as the original IWQOL-Lite was meant for patients enrolled in residential/day treatment programmes. The original IWQOL-Lite was developed before recommendations for medical product labelling based on patient reported outcomes were developed by the FDA; however, it has since been validated extensively for use in weight-loss trials.60,61 Following a recommendation by the FDA, the use of the IWQOL-Lite-CT in patients with T2DM was evaluted to support broader use of the questionnaire. The evaluation of the psychometric properties of this outcome in patients with T2DM based on non-weight loss trials was limited in terms of responsiveness, but considered satisfactory in terms of validity and reliability.60,61 An MID was not identified for this outcome.
Please note the IWQOL-Lite-CT will be referred to simply as the IWQOL throughout the remainder of the report.
Blood pressure
Blood pressure was reported as a safety end point in all included studies. Systolic blood pressure (SBP) and diastolic blood pressure (DBP) measured in mmHg were reported as a change from baseline to end of study, and have been summarized for this review.
BMI and/or body weight
Change from baseline to end of study in body weight and BMI were secondary and supportive secondary efficacy end points, respectively, in all included trials.
Lipid profile
Fasting blood lipids (e.g., total cholesterol, HDL cholesterol and LDL cholesterol) was secondary efficacy end point in all included trials.
Health care resource utilization
This outcome was not measured in any of the included trials.
Safety
Treatment emergent AEs, SAEs, WDAEs (adverse events leading to premature treatment discontinuation), and deaths were reported as safety outcomes in this review. Of note, TEAE was the primary outcome measure in PIONEER 10.
According to the sponsor, a targeted approach for the collection of safety data was taken for PIONEER 6 as the trial was designed to evaluate CV outcomes. This included reporting: SAEs, AEs leading to discontinuation of treatment, diabetic retinopathy and related complications, episodes of severe hypoglycemia, hepatic events, pregnancies, and medication errors.
Statistical analysis
Estimands
PIONEER 1 to 5, and 8 to 10 implemented 2 estimands to address different aspects of the primary trial objectives, the treatment policy estimand and the hypothetical estimand, which are defined as follows:
the treatment policy estimand evaluated the treatment difference at week 26 for all randomized patients regardless of adherence to randomized treatment and initiation of rescue medication; and
the hypothetical estimand evaluated the treatment difference at week 26 for all randomized patients that adhered to treatment and did not initiate rescue medication.
The treatment policy and hypothetical estimands were the primary and secondary estimands, respectively, in PIONEER 1 to 5, 8, and 10. In PIONEER 9, the hypothetical estimand was the primary estimand and the treatment policy estimand was the secondary estimand. Analyses based on the treatment policy estimand were reported for this review as they align with an intention-to-treat analysis.
PIONEER 6 only used a treatment policy estimand, defined as a comparison of semaglutide tablets and placebo for all randomized patients according to the planned visit schedule regardless of treatment discontinuation.
Observation periods
Three observation periods were defined for the evaluation of efficacy and safety in PIONEER 1 to 5 and 8 to 10:
The in-trial observation period – starts at randomization, includes the time period from when a patient was randomized (includes any period after initiation of rescue medication or premature discontinuation of treatment) until the final scheduled visit
The on-treatment observation period – starts at the date of the first dose of treatment, includes the time period when a patient was on treatment with treatment (includes any period after initiation of rescue medication) until the final scheduled visit (last date on treatment + 38 days or end-date for in-trial observation period)
The on-treatment without rescue medication observation period – starts at the date of the first dose of treatment, includes the time period when a patient was on treatment with treatment, excluding any period after initiation of rescue medication, that is, ending following the last dose of treatment + 3 days or when rescue medication is initiated
Only the in-trial and on-treatment observation periods were used in PIONEER 6.
The analyses of the treatment policy estimand were estimated using measurements from the in-trial observation period in all studies (PIONEER 1 to 6, and 8 to 10). Safety assessments reported in this review were evaluated based on the on-treatment observation period. Of note, PIONEER 6 and 9 reported safety assessments in both the in-trial and on-treatment observation periods; only the latter has been presented in this review. Analyses pertaining to the hypothetical estimand were estimated using measurements from the on-treatment with rescue medication observation period and have not been presented in this review.
Primary Outcomes of the Studies
Power calculation
An overview of the parameters used for power calculations in PIONEER 1 to 6, and 8 to 10 is available in Table 20. The primary outcome in PIONEER 1 to 5, 8, and 9 was the change from baseline in A1C (%) at week 26. Each of these studies was powered at 90% to detect a difference based on this outcome, assuming a withdrawal rate of 10%, and at a 5% significance level. Studies that included change in body weight as a key secondary outcome were also powered to detect a change in this measure.
The primary outcome in PIONEER 6 was time from randomization to first occurrence of a MACE. The study was designed to have at least 90% power to test the primary analysis for non-inferiority. PIONEER 6 was an event-driven trial that planned to collect information until at least 122 first MACEs accumulated within the planned trial duration of 19 months. The estimated sample size was based on first MACEs occurring at a rate of 3 per 100 patient years of observation time in both treatment groups and a lost-to-follow-up rate of 1% per year throughout the trial.
The primary outcome in PIONEER 10 was number of TEAEs during exposure to treatment. Details regarding a power calculation were not reported.
Table 20: Sample Size and Power Calculations
Study | Primary outcome | Power, % | Withdrawal rate, % | Expected mean difference (SD) | Total planned sample size, (per group) | Significance level SEM vs. PBO or control |
|---|---|---|---|---|---|---|
PIONEER 1 | A1C at week 26a | 90 | 10 | 14mg: –1.0 (1.1) 7mg: –0.75 (1.1) 3mg: –0.45 (1.1) | 704 (176) | 5% |
PIONEER 2 | A1C at week 26a | 90 | 10 | –0.3 (1.1) | 816 (408) | 5% NI margin: 0.4% |
PIONEER 3 | A1C at week 26a | 90 | 10 | 14mg: –0.5 (1.1) 7mg: –0.3 (1.1) 3mg: –0.1 (1.1) | 1860 (465) | 5% NI margin: 0.3% |
PIONEER 4 | A1C at week 26a | 90 | 10 | vs PBO: –1.0 (1.1) vs. LIRA: 0 (1.1) | 690 (276 or 138)b | 5% NI margin: 0.4% |
PIONEER 5 | A1C at week 26a | 90 | 10 | –0.5 (1.1) | 324 (162) | 5% |
PIONEER 8 | A1C at week 26a | 90 | 10 | 14mg: –0.8 (1.1) 7mg: –0.6 (1.1) 3mg: –0.45 (1.1) | 720 (180) | 5% |
PIONEER 9 | A1C at week 26a | 90 | 10 | 14mg: –0.8 (1.1) 7mg: –0.6 (1.1) 3mg: –0.45 (1.1) | 240 (48) | NR |
PIONEER 10 | Number of TEAEs during exposure to treatment | NR | 20 | NR | 455 | 5% |
Time to event analyses | ||||||
PIONEER 6 | Time from randomization to first occurrence of a MACE | 90 | LTFU rate of 1% per year throughout trial | Non-inferiority | 3176 (1588) | 5% |
A1C = glycated hemoglobin; LIRA = liraglutide; LTFU = lost to follow-up; MACE = major cardiovascular event; NI = non-inferiority; NR = not reported; PBO = placebo; SEM = semaglutide; TEAE = treatment-emergent adverse event.
aChange from baseline in A1C
b276 for each treatment arm, except placebo (138).
Non-inferiority analyses
PIONEER 2 to 4 and 6 were required to demonstrate non-inferiority for the primary analysis before conducting a test for superiority. PIONEER 2 and 4 used a non-inferiority margin of 0.4%, and PIONEER 3 use a margin of 0.3%. PIONEER 2 and 4 reported that the 0.4% margin was selected based on the effect of comparators on glycemic effect in similar trials. Further, the sponsor reported that for PIONEER 2, 0.4% was selected instead of 0.3% (the accepted standard) because of an anticipated advantage in terms of body weight for comparisons to empagliflozin in PIONEER 2. Further rationale for the use of the broader non-inferiority margin in PIONEER 4 was not provided. Details regarding the methodology for the selection of the non-inferiority margin used in PIONEER 3 were unclear. In PIONEER 6, the non-inferiority margin used was a HR of 1.8; no rationale for the use of this margin was provided.
Statistical test or model
A summary of the statistical testing used for the studies included in this review is provided in Table 21. In PIONEER 1 to 5 and 8, the primary analysis was estimated based on the FAS using week 26 measurements from the in-trial observation period. The primary analysis for the treatment policy estimand was based on a pattern mixture model where baseline A1C was included as a covariate and region and/or stratification factor were included as fixed effects. The model employed a multiple imputation approach to account for missing data which assumed that data was missing at random (MAR). Analysis of the key secondary outcomes (change from baseline in body weight at week 26) and continuous supportive secondary outcomes were conducted using similar methods as the primary analysis. The multiple imputation approach imputed missing data using analysis of covariance (ANCOVA) in PIONEER 1 to 5 and 8.
The primary analysis for the treatment policy estimand in PIONEER 9 evaluated the dose-response in change in A1C (%) using a mixed model for repeated measurements (MMRM), which was estimated based on the FAS using post-baseline measurements up to and including week 26 from the on-treatment without rescue medication period. The model incorporated baseline A1C as a covariate and region and stratification factor as fixed effects. The MMRM method assumes that missing data are MAR. Missing data was not imputed except for patients with no post-baseline assessments for whom the baseline value was carried forward to ensure that all randomized subjects contributed to the statistical analysis. The primary analysis for the treatment policy estimand (the secondary estimand for this study) in PIONEER 9 used similar methods to the analysis of the hypothetical estimand in PIONEER 1 to 5 and 8.
The primary analysis in PIONEER 10 was based on the on-treatment observation period and evaluated using the SAS.
In PIONEER 6 the primary analysis was a time to event analysis for MACE. Patients that did not have a MACE within the observation period were censored at the end of the observation period in the analysis of the primary end point and therefore considered to be still at risk at that end point. Time to event and time to censoring were calculated from randomization for the in-trial observation period. Time to first MACE was measured from randomization to the first occurrence of an event defined as a MACE, regardless of any MACE that follow. If events had the same date of onset, the events are prioritized as follows: CV death > non-fatal MI > non-fatal stroke. Of note, deaths of unknown cause were presumed CV deaths in the statistical analyses. The number of serious adverse events (SAEs) was a secondary end point in the trial. Additional secondary efficacy end points such as A1C, body weight, and lipids were evaluated using descriptive statistics.
Table 21: Statistical Analysis of Efficacy End points
End point | Statistical model | Adjustment factors | Sensitivity analyses | Missing data methods |
|---|---|---|---|---|
PIONEER 1 | ||||
Change from baseline in A1C at week 26 | The treatment policy estimand will be estimated based on the FAS using week 26 measurements from the in-trial observation period. The primary analysis was based on a pattern mixture model. | Covariate: baseline A1C Fixed effects: region | Pattern mixture model using comparator-based multiple imputation Pattern mixture model using AE-determined comparator-based multiple imputation Tipping-point analysis | Multiple imputation with ANCOVA, which assumed data was MAR |
Change from baseline in body weight at week 26 | same as above | Covariate: baseline body weight | same as above | |
PIONEER 2 | ||||
Change from baseline in A1C at week 26 | The treatment policy estimand will be estimated based on the FAS using week 26 measurements from the in-trial observation period. The primary analysis was based on a pattern mixture model. | Covariate: baseline A1C Fixed effects: region | Pattern mixture model using comparator-based multiple imputation Pattern mixture model using AE-determined comparator-based multiple imputation Tipping-point analysis | Multiple imputation with ANCOVA, which assumed data was MAR |
Change from baseline in body weight at week 26 | same as above | Covariate: baseline body weight | same as above | |
PIONEER 3 | ||||
Change from baseline in A1C at week 26 | The treatment policy estimand will be estimated based on the FAS using week 26 measurements from the in-trial observation period. The primary analysis was based on a pattern mixture model. | Covariate: baseline A1C Fixed effects: region and stratification factor | Pattern mixture model using comparator-based multiple imputation Pattern mixture model using AE-determined comparator-based multiple imputation Tipping-point analysis | Multiple imputation with ANCOVA, which assumed data was MAR |
Change from baseline in body weight at week 26 | same as above | Covariate: baseline body weight | same as above | |
PIONEER 4 | ||||
Change from baseline in A1C at week 26 | The treatment policy estimand will be estimated based on the FAS using week 26 measurements from the in-trial observation period. The primary analysis was based on a pattern mixture model. | Covariate: baseline A1C Fixed effects: stratification factor | Pattern mixture model using comparator-based multiple imputation Pattern mixture model using AE-determined comparator-based multiple imputation Tipping-point analysis | Multiple imputation with ANCOVA, which assumed data was MAR |
Change from baseline in body weight at week 26 | same as above | Covariate: baseline body weight | same as above | |
PIONEER 5 | ||||
Change from baseline in A1C at week 26 | The treatment policy estimand will be estimated based on the FAS using week 26 measurements from the in-trial observation period. The primary analysis was based on a pattern mixture model. | Covariate: baseline A1C Fixed effects: stratification factor | Pattern mixture model using comparator-based multiple imputation Pattern mixture model using AE-determined comparator-based multiple imputation Tipping-point analysis | Multiple imputation with ANCOVA, which assumed data was MAR |
Change from baseline in body weight at week 26 | same as above | Covariate: baseline body weight | same as above | |
PIONEER 8 | ||||
Change from baseline in A1C at week 26 | The treatment policy estimand will be estimated based on the FAS using week 26 measurements from the in-trial observation period. The primary statistical analysis will be a pattern mixture model. | Covariate: baseline A1C Fixed effects: region, stratification factor, interaction between stratification factors | Pattern mixture model using comparator-based multiple imputation Pattern mixture model using AE-determined comparator-based multiple imputation Tipping-point analysis | Multiple imputation with ANCOVA, which assumed data was MAR |
Change from baseline in body weight at week 26 | same as above | Covariate: baseline body weight | same as above | |
PIONEER 9 | ||||
Change from baseline in A1C at week 26 | The treatment policy estimand will be estimated based on the FAS using week 26 measurements from the in-trial observation period. The primary statistical analysis will be a pattern mixture model. | Covariate: baseline A1C Fixed effects: stratification factor | None | Multiple imputation with ANCOVA, which assumed data was MAR |
PIONEER 10 | ||||
Number of TEAEs during exposure to treatment | Reported descriptively using the on-treatment observation period and SAS. | N/A | N/A | N/A |
PIONEER 6 | ||||
Time from randomization to first occurrence of a MACE | The primary end point was carried out using data from subjects in the FAS and in-trial observation period and analyzed using a stratified Cox proportional hazards model. | Fixed factor: treatment group (semaglutide tablets, placebo) The model was stratified by evidence of CV disease at screening (established CV disease/CKD or CV risk factors only). | Including additional covariates Ascertainment window of 38 days after last date on treatment Ascertainment window of 7 days after last date on treatment Tipping point analysis | None |
A1C = glycated hemoglobin; AE = adverse event; ANCOVA = analysis of covariance; CKD = chronic kidney disease; CV = cardiovascular; FAS = full analysis set; MACE = major cardiovascular event; MAR = missing at random; MMRM = mixed model for repeated measurements; N/A = not applicable; SAS = safety analysis set; TEAE = treatment-emergent adverse event.
A hierarchical testing strategy was used in PIONEER 5 and 6. PIONEER 1 to 4 and 8 used a pre-specified multi-branched gatekeeping procedure with a weighted Bonferroni-based adjustment to control for inflated risk of type I error. Each of the statistical testing strategies were based on the following principles:
For a specific dose of semaglutide tablets (e.g., SEM 14 mg), demonstration of superiority on A1C was required before testing for superiority based on other outcomes, such as body weight
Establishment of superiority for A1C was required at all higher dosages before continuing testing at lower dosages
Non-inferiority must be demonstrated for comparisons to active treatments (or placebo in the CVOT) before testing for superiority
PIONEER 9 did not report the use of a testing strategy to control for type 1 error and PIONEER 10 did not adjust for multiplicity.
Additional details of the statistical testing procedures are provided in Table 22 and graphical representations of the closed testing procedures used in PIONEER 1 to 4 and 8 are provided in Appendix 3 (Figure 15, Figure 16, Figure 17, Figure 18, and Figure 19).
Briefly, a closed testing procedure that operated based on an overall significance level of alpha = 0.05 was allocated to the initial test, which was either a test of non-inferiority for SEM 14 mg compared to active comparators (empagliflozin in PIONEER 2 and sitagliptin in PIONEER 3) or a test of superiority for SEM 14 mg compared to placebo (PIONEER 1, 4, and 8). The alpha level was reallocated to subsequent tests following a confirmed hypothesis. The details of the reallocation of alpha are described in the figures presented in Appendix 3.
Table 22: Statistical Testing Procedures
Study | Statistical Testing Procedure |
|---|---|
PIONEER 1a | Tested for SEM 14 mg vs. placebo, followed by SEM 7 mg vs. placebo, then SEM 3mg vs. placebo:
|
PIONEER 2a | Non-inferiority on change from baseline in A1C, using a non-inferiority margin of 0.4% Superiority on change from baseline in A1C Superiority on change form baseline in body weight |
PIONEER 3a | Tested for SEM 14 mg vs. SITA, followed by SEM 7 mg vs. SITA, then SEM 3mg vs. SITA:
|
PIONEER 4a | Superiority on change from baseline in A1C vs. placebo Non-inferiority on change from baseline in A1C using a non-inferiority margin of 0.4%-points (only vs. LIRA) Superiority on change from baseline in A1C vs. LIRA Superiority on change from baseline in body weight vs. placebo Superiority on change from baseline in body weight vs. LIRA |
PIONEER 5 | 1. Superiority on change from baseline in A1C 2. Superiority on change from baseline in body weight |
PIONEER 8a | Tested for SEM 14 mg vs. placebo, followed by SEM 7 mg vs. placebo, then SEM 3mg vs. placebo:
|
PIONEER 9 | Not reported |
PIONEER 10 | No adjustment for multiplicity |
PIONEER 6 | 1. Non-inferiority on the 3-component MACE end point, using a non-inferiority margin of 1.8 2. Superiority on 3-component MACE end point |
A1C = glycated hemoglobin; LIRA = liraglutide; MACE = major cardiovascular event; SEM = semaglutide; SITA = sitagliptin.
aRefer to Appendix 3 for a graphical representation of the closed testing procedure used in PIONEER 1 to 4 and 8 (Figure 15, Figure 16, Figure 17, Figure 18, and Figure 19).
Note: All change from baseline end points were measured at week 26.
Subgroup analyses
PIONEER 6 was the only study that included pre-specified subgroup analyses on the primary end point. Subgroup analyses were conducted based on: sex, age (less than 65 years, 65 years or greater), region, race, BMI, A1C (8.5% or less, greater than 8.5%), renal function (less than 60 mL/min/1.73m2, 60 mL/min/1.73m2 or greater), and evidence of CV disease at screening. Subgroup analyses were based on the FAS using the in-trial observation period. A stratified Cox proportional hazards model was used for each subgroup analysis and a forest plot with P values for the interaction effect were presented.
The sponsor submitted subgroup analyses by background therapy for the change from baseline in A1C (%) and body weight (kg) at week 26 in PIONEER 3 (metformin with or without SU) and 4 (metformin with or without a SGLT2 inhibitor). Whether or not the methodology for the subgroup analyses were the same as the primary analysis was not specified.
An integrated summary of efficacy that was conducted according to guidance from regulatory agencies included subgroup analyses for the primary end point by baseline A1C and body weight for PIONEER 1 to 5 and 8. The subgroup analyses were conducted using a similar methodology to the primary analysis in the overall population.
Sensitivity analyses
Three types of pre-specified sensitivity analyses were included in PIONEER 1 to 5 and 8 to evaluate the robustness of the primary analysis results regarding missing data. This included a pattern mixture model that used comparator-based multiple imputation and AE-determined comparator based multiple imputation, as well as a tipping-point analysis (Table 21).
PIONEER 6 included 3 pre-specified analyses on the primary analysis to investigate the robustness of the primary end point. They were analyzed using the same methodology as the primary analysis. The first sensitivity analyses included additional covariates; the second was conducted using the on-treatment observation period (with onset during treatment and until 38 days after the last day on treatment); and the third evaluated the effect while patients were considered to be exposed to treatment but used a shorter observation period, i.e., up to 7 days after the last day on treatment (as opposed to 38).
Sensitivity analyses were not conducted in PIONEER 9 or 10.
Analysis populations
PIONEER 1, 5, and 8 to 10 used 2 analysis populations, the full analysis set (FAS) and safety analysis set (SAS).
The FAS included all randomized patients. Patients contributed to a treatment group based on the treatment they were randomized to receive.
The SAS included all randomized patients who received at least 1 dose of treatment. Patients contributed to a treatment group based on the treatment they actually received for the majority of the on-treatment observation period.
PIONEER 2 to 4 used the same FAS and SAS described above, in addition to a per protocol (PP) analysis set.
The PP analysis set comprised all patients in the FAS who have not violated any inclusion criteria, have not fulfilled any exclusion criteria, have a valid baseline A1C measurement and were exposed to treatment and have at least 1 valid A1C measurement while on treatment without rescue medication at or after week 14. Patients contributed to a treatment group based on the treatment they actually received for the majority of the on-treatment observation period.
PIONEER 6 only used a FAS, which included all randomized patients. Each patient belongs to a treatment group based on the treatment which the subject was randomized to receive.
Results
Patient Disposition
Patient disposition for active-controlled RCTs (PIONEER 2 to 4), placebo-controlled RCTs (PIONEER 1, 5, 8), the CVOT (PIONEER 6), and the population-specific safety studies (PIONEER 9, 10) are presented in Table 23, Table 24, Table 25, and Table 26, respectively.
The proportion of screening failures ranged from 7% to 30% in PIONEER 1 to 4, 6, 8 to 10; in PIONEER 5, 55.1% of patients failed screening. All studies reported 92% or more of patients as trial completers, defined as patients who attended the final scheduled visit. In other words, 8% or less of patients discontinued from study across the PIONEER trials. The most common reasons for discontinuation from study were withdrawal by patient and lost to follow-up. There were no major imbalances in discontinuations between treatment groups within each study; however small differences in patients who discontinued from study due to death were reported. PIONEER 1 to 5 and 8 also reported patients that discontinued from study due to death at a frequency of less than 2% in any treatment group. Further, discontinuation due to death was only reported within the SEM 14 mg treatment group of PIONEER 1 and 8 (none for placebo or SEM 3 mg, 7 mg). In PIONEER 5, 1 and 2 patients in SEM 14 mg and placebo treatment groups, respectively, discontinued due to death.
The proportion of patients that discontinued from treatment varied across studies, ranging from 0% to 20%, and was predominantly due to adverse events. Discontinuation from treatment was greater among the semaglutide tablets treatment groups, particularly with the 7 mg and 14 mg dosage strengths, than comparator treatment groups in the active-controlled RCTs, PIONEER 5, 8, 10, and the CVOT.
Table 23: Patient Disposition (Active-Controlled RCTs, add-on to 1 to 2 OADs)
Patient disposition | PIONEER 2 | PIONEER 3 | PIONEER 4 | ||||||
|---|---|---|---|---|---|---|---|---|---|
SEM 14 mg N = 411 | EMPA 25 mg N = 410 | SEM 3 mg N = 466 | SEM 7 mg N = 465 | SEM 14 mg N = 465 | SITA 14 mg N = 467 | SEM 14 mg N = 285 | LIRA 1.8 mg N = 184 | PBO N = 142 | |
Screened, N | 1122 | 2463 | 950 | ||||||
Randomized total, N (%) | 822 (73) | 1864 (76) | 711 (75) | ||||||
Randomized, N | 412 | 410 | 466 | 466 | 465 | 467 | 285 | 284 | 142 |
Discontinuation from study, N (%) | 12 (2.9) | 23 (5.6) | 33 (7.1) | 30 (6.4) | 27 (5.8) | 16 (3.4) | 8 (2.8) | 10 (3.5) | 8 (5.6) |
Withdrawal by patient | 8 (1.9) | 12 (2.9) | 18 (3.9) | 18 (3.9) | 17 (3.7) | 8 (1.7) | 5 (1.8) | 5 (1.8) | 3 (2.1) |
Lost to follow-up | 4 (1.0) | 10 (2.4) | 9 (1.9) | 7 (1.5) | 7 (1.5) | 5 (1.1) | 0 | 1 (0.4) | 4 (2.8) |
Other | 0 | 1 (0.2) | 6 (1.3) | 5 (1.1) | 3 (0.6) | 3 (0.6) | 3 (1.1) | 4 (1.4) | 1 (0.7) |
Died | 0 | 1 (0.2) | 5 (1.1) | 4 (0.9) | 1 (0.2) | 3 (0.6) | 3 (1.1) | 4 (1.4) | 1 (0.7) |
Discontinued from treatment, N (%) | 73 (17.7) | 45 (11.0) | 78 (16.7) | 70 (15.0) | 89 (19.1) | 61 (13.1) | 44 (15.4) | 36 (12.7) | 17 (12.0) |
Exposed | |||||||||
Adverse events | 45 (10.9) | 20 (4.9) | 26 (5.6) | 28 (6.0) | 54 (11.6) | 25 (5.4) | 33 (11.6) | 27 (9.5) | 6 (4.2) |
Patient withdrawal | 6 (1.5) | 7 (1.7) | 12 (2.6) | 6 (1.3) | 8 (1.7) | 2 (0.4) | 3 (1.1) | 3 (1.1) | 3 (2.1) |
Participation in another clinicala | 3 (0.7) | 0 | 0 | 1 (0.2) | 0 | 1 (0.2) | 0 | 1 (0.4) | 0 |
Violation of inclusion/exclusion criteria | 0 | 2 (0.5) | 5 (1.1) | 5 (1.1) | 3 (0.6) | 3 (0.6) | 1 (0.4) | 0 | 0 |
Calcitonin value > = 100 ng/L | 0 | 0 | 0 | 0 | 1 (0.2) | 0 | 0 | 0 | 0 |
Intention of becoming pregnant | 0 | 0 | 0 | 1 (0.2) | 0 | 0 | 0 | 0 | 0 |
Pregnancy | 0 | 0 | 1 (0.2) | 0 | 0 | 0 | 0 | 0 | 0 |
Other | 18 (4.4) | 15 (3.7) | 34 (7.3) | 27 (5.8) | 23 (4.9) | 29 (6.2) | 7 (2.5) | 5 (1.8) | 8 (5.6) |
Not exposed | |||||||||
Violation of inclusion and/or exclusion criteria | 0 | 1 (0.2) | 0 | 1 (0.2) | 0 | 1 (0.2) | NA | NA | NA |
Other | 1 (0.2) | 0 | 0 | 1 (0.2) | 0 | 0 | NA | NA | NA |
Trial completersb | 400 (97.1) | 387 (94.4) | 433 (92.9) | 436 (93.6) | 438 (94.2) | 451 (96.6) | 277 (97.2) | 274 (96.5) | 134 (94.4) |
Completed treatment | NR | NR | 387 (83.0) | 395 (84.8) | 374 (80.4) | 405 (86.7) | 241 (84.6) | 248 (87.3) | 124 (87.3) |
Discontinued treatment | NR | NR | 46 (9.9) | 41 (8.8) | 64 (13.8) | 46 (9.9) | 36 (12.6) | 26 (9.2) | 10 (7.0) |
Treatment completersc | 339 (82.3) | 365 (89.0) | 388 (83.3) | 396 (85.0) | 376 (80.9) | 406 (86.9) | 241 (84.6) | 248 (87.3) | 125 (88.0) |
Without rescue medication | 310 (75.2) | 322 (78.5) | 243 (52.1) | 301 (64.6) | 335 (72.0) | 283 (60.6) | 223 (78.2) | 231 (81.3) | 83 (58.5) |
With rescue medication | 29 (7.0) | 43 (10.5) | 145 (31.1) | 95 (20.4) | 41 (8.8) | 123 (26.3) | 18 (6.3) | 17 (6.0) | 42 (29.6) |
Analysis Sets | |||||||||
FAS, N | 411d | 410 | 466 | 465 | 465 | 467 | 285 | 284 | 142 |
Safety, N | 410 | 409 | 466 | 464 | 465 | 466 | 285 | 284 | 142 |
PP, N | 362 | 384 | 426 | 430 | 422 | 440 | 259 | 261 | 130 |
DULA = dulaglutide; EMPA = empagliflozin; FAS = full analysis set; LIRA = liraglutide; PBO = placebo; PP = per protocol; SEM = semaglutide; SITA = sitagliptin.
aSimultaneous participation in any other clinical trial receiving an investigational medicinal product
bPatients who attended the final scheduled visit
cPatients who completed treatment with assigned treatment according to the end-of-trial form
d412 patients were randomized and 411 were included in the FAS; a reason for the exclusion of 1 patient in the FAS was not provided.
Note: Rescue medication = use of new anti-diabetic medication as add-on to treatment and used for more than 21 days with the initiation at or after randomization and before last day on treatment.
Table 24: Patient Disposition (Placebo-Controlled RCTs)
Patient disposition | PIONEER 1 | PIONEER 5 | PIONEER 8 | |||||||
|---|---|---|---|---|---|---|---|---|---|---|
SEM 3 mg N = 175 | SEM 7 mg N = 175 | SEM 14 mg N = 175 | PBO N = 178 | SEM 14 mg N = 163 | PBO N = 161 | SEM 3 mg N = 184 | SEM 7 mg N = 182 | SEM 14 mg N = 181 | PBO N = 184 | |
Screened, N | 1006 | 721 | 1038 | |||||||
Randomized total, N (%) | 703 (70) | 324 (45) | 731 (70) | |||||||
Randomized, N | 175 | 175 | 175 | 178 | 163 | 161 | 184 | 182 | 181 | 184 |
Discontinued from study, N (%) | 6 (3.4) | 14 (8.0) | 12 (6.9) | 8 (4.5) | 5 (3.1) | 5 (3.1) | 10 (5.4) | 9 (4.9) | 6 (3.3) | 9 (4.9) |
Withdrawal by patient | 0 | 5 (2.9) | 5 (2.9) | 4 (2.2) | 1 (0.6) | 2 (1.2) | 0 | 6 (3.3) | 2 (1.1) | 5 (2.7) |
Lost to follow-up | 5 (2.9) | 7 (4.0) | 5 (2.9) | 2 (1.1) | 3 (1.8) | 1 (0.6) | 10 (5.4) | 3 (1.6) | 1 (0.6) | 4 (2.2) |
Other | 1 (0.6) | 2 (1.1) | 2 (1.1) | 2 (1.1) | 1 (0.6) | 2 (1.2) | 0 | 0 | 3 (1.7) | 0 |
Died | 0 | 0 | 1 (0.6) | 0 | 1 (0.6) | 2 (1.2) | 0 | 0 | 3 (1.7) | 0 |
Discontinued from treatment, N (%) | 12 (6.9) | 18 (10.3) | 24 (13.7) | 19 (10.7) | 30 (18.4) | 20 (12.4) | 24 (13.0) | 34 (18.7) | 37 (20.4) | 22 (12.0) |
Exposed | ||||||||||
Adverse events | 4 (2.3) | 7 (4.0) | 13 (7.4) | 4 (2.2) | 24 (14.7) | 10 (6.2) | 13 (7.1) | 16 (8.8) | 26 (14.4) | 5 (2.7) |
Patient withdrawal | 0 | 0 | 0 | 0 | 0 | 2 (1.2) | 0 | 2 (1.1) | 2 (1.1) | 3 (1.6) |
Participation in another clinicala | 1 (0.6) | 0 | 1 (0.6) | 0 | 0 | 0 | 0 | 0 | 0 | 0 |
Violation of inclusion/exclusion criteria | 2 (1.1) | 1 (0.6) | 0 | 0 | 1 (0.6) | 3 (1.9) | 2 (1.1) | 4 (2.2) | 2 (1.1) | 2 (1.1) |
Intention of becoming pregnant | 0 | 0 | 0 | 0 | 0 | 0 | 0 | 0 | 0 | 1 (0.5) |
Pregnancy | 0 | 0 | 0 | 0 | 0 | 0 | 0 | 1 (0.5) | 0 | 0 |
Other | 5 (2.9) | 5 (2.9) | 5 (2.9) | 12 (6.7) | 5 (3.1) | 5 (3.1) | 9 (4.9) | 10 (5.5) | 7 (3.9) | 11 (6.0) |
Not exposed | ||||||||||
Violation of inclusion/exclusion criteria | N/A | N/A | 0 | 1 (0.5) | 0 | 0 | ||||
Trial completersb | 169 (96.6) | 161 (92.0) | 163 (93.1) | 170 (95.5) | 158 (96.9) | 156 (96.9) | 174 (94.6) | 173 (95.1) | 175 (96.7) | 175 (95.1) |
Completed treatment | NR | 132 (81.0) | 141 (87.6) | 157 (85.3) | 148 (81.3) | 144 (79.6) | 160 (87.0) | |||
Discontinued treatment | NR | 26 (16.0) | 15 (9.3) | 17 (9.2) | 25 (13.7) | 31 (17.1) | 15 (8.2) | |||
Treatment completersc | 163 (93.1) | 157 (89.7) | 151 (86.3) | 159 (89.3) | 133 (81.6) | 141 (87.6) | 160 (87.0) | 148 (81.3) | 144 (79.6) | 162 (88.0) |
Without rescue medication | 152 (86.9) | 153 (87.4) | 149 (85.1) | 134 (75.3) | 127 (77.9) | 127 (78.9) | 110 (59.8) | 115 (63.2) | 115 (63.5) | 100 (54.3) |
With rescue medication | 11 (6.3) | 4 (2.3) | 2 (1.1) | 25 (14.0) | 6 (3.7) | 14 (8.7) | 50 (27.2) | 33 (18.1) | 29 (16.0) | 62 (33.7) |
Analysis Sets | ||||||||||
FAS, N | 175 | 175 | 175 | 178 | 163 | 161 | 184 | 182 | 181 | 184 |
Safety, N | 175 | 175 | 175 | 178 | 163 | 161 | 184 | 181 | 181 | 184 |
FAS = full analysis set; PBO = placebo; PP = per protocol; SEM = semaglutide.
aSimultaneous participation in any other clinical trial receiving an investigational medicinal product
bPatients who attended the final scheduled visit
cPatients who completed treatment with assigned treatment according to the end-of-trial form
Note: Rescue medication = use of new anti-diabetic medication as add-on to treatment and used for more than 21 days with the initiation at or after randomization and before last day on treatment
Table 25: Patient Disposition (CVOT)
Patient disposition | PIONEER 6 | |
|---|---|---|
SEM 14 mg N = 1591 | PBO N = 1592 | |
Screened, N | 3418 | |
Randomized total, N (%) | 3183 (93) | |
Randomized, N | 1591 | 1592 |
Discontinued from study, N (%) | 5 (0.3) | 6 (0.4) |
Withdrawal by patient | 3 (0.2) | 1 (0.1) |
Lost to follow-up | 2 (0.1) | 5 (0.3) |
Discontinued from treatment, N (%) | 244 (15.3) | 156 (9.8) |
Adverse events | 185 (11.6) | 104 (6.5) |
Lack of effect | 4 (0.3) | 5 (0.3) |
Lost to follow-up | 2 (0.1) | 2 (0.1) |
Other | 53 (3.3) | 45 (2.8) |
Trial completersa | 1586 (99.7) | 1586 (99.6) |
Completed treatment | 1563 (98.2) | 1541 (96.8) |
Discontinued treatment | 23 (1.4) | 45 (2.8) |
Treatment completersb | 1347 (84.7) | 1435 (90.1) |
Analysis Sets | ||
FAS, N | 1591 | 1592 |
CV = cardiovascular; FAS = full analysis set; PBO = placebo; RCT = randomized control trial; SEM = semaglutide.
aPatients who attended the final scheduled visit
bPatients who completed treatment with assigned treatment according to the end-of-trial form
Note: Rescue medication = use of new anti-diabetic medication as add-on to treatment and used for more than 21 days with the initiation at or after randomization and before last day on treatment
Source: Clinical Study Report.20
Table 26: Patient Disposition (Population-specific supportive studies)
Patient disposition | PIONEER 9 | PIONEER 10 | |||||||
|---|---|---|---|---|---|---|---|---|---|
SEM 3 mg N= 49 | SEM 7 mg N = 49 | SEM 14 mg N = 48 | LIRA 0.9 mg N = 48 | PBO N = 49 | SEM 3 mg N= 131 | SEM 7 mg N = 132 | SEM 14 mg N = 130 | DULA 0.75 mg N = 65 | |
Screened, N | 277 | 492 | |||||||
Randomized total, N (%) | 243 (88) | 458 (93) | |||||||
Randomized, N | 49 | 49 | 48 | 49 | 48 | 131 | 132 | 130 | 65 |
Discontinued from study, N (%) | 3 (6.1) | 0 | 1 (2.1) | 2 (4.2) | 0 | 3 (2.3) | 2 (1.5) | 3 (2.3) | 2 (3.1) |
Withdrawal by patient | 3 (6.1) | 0 | 1 (2.1) | 2 (4.2) | 0 | 3 (2.3) | 2 (1.5) | 2 (1.5) | 2 (3.1) |
Lost to follow-up | 0 | 0 | 0 | 0 | 0 | 0 | 0 | 1 (0.8) | 0 |
Discontinued from treatment, N (%) | 4 (8.2) | 1 (2.0) | 3 (6.3) | 4 (8.3) | 0 | 7 (5.3) | 9 (6.8) | 15 (11.5) | 4 (6.2) |
Adverse events | 1 (2.0) | 1 (2.0) | 2 (4.2) | 0 | 0 | 5 (3.8) | 8 (6.1) | 8 (6.2) | 2 (3.1) |
Patient withdrawal | 1 (2.0) | 0 | 0 | 2 (4.2) | 0 | 1 (0.8) | 1 (0.8) | 2 (1.5) | 1 (1.5) |
Participation in another clinical triala | 0 | 0 | 1 (2.1) | 0 | 0 | 0 | 0 | 0 | 0 |
Other | 2 (4.1) | 0 | 0 | 2 (4.2) | 0 | 1 (0.8) | 0 | 5 (3.8) | 1 (1.5) |
Trial completersb | 46 (93.9) | 49 (100) | 47 (97.9) | 46 (95.8) | 49 (100) | 128 (97.7) | 130 (98.5) | 127 (97.7) | 63 (96.9) |
Completed treatment | 45 (91.8) | 48 (98.0) | 45 (93.8) | 44 (91.7) | 49 (100) | 124 (94.7) | 123 (93.2) | 115 (88.5) | 61 (93.8) |
Discontinued treatment | 1 (2.0) | 1 (2.0) | 2 (4.2) | 2 (4.2) | 0 | 4 (3.1) | 7 (5.3) | 12 (9.2) | 2 (3.1) |
Treatment completersc | 45 (91.8) | 48 (98.0) | 45 (93.8) | 44 (91.7) | 49 (100) | 124 (94.7) | 123 (93.2) | 115 (88.5) | 61 (93.8) |
Without rescue medication | 38 (77.6) | 43 (87.8) | 41 (85.4) | 42 (87.5) | 34 (69.4) | 103 (78.6) | 115 (87.1) | 114 (87.7) | 56 (86.2) |
With rescue medication | 7 (14.3) | 5 (10.2) | 4 (8.3) | 2 (4.2) | 15 (30.6) | 21 (16.0) | 8 (6.1) | 1 (0.8) | 5 (7.7) |
Analysis Sets | |||||||||
FAS, N | 49 | 49 | 48 | 48 | 49 | 131 | 132 | 130 | 65 |
Safety, N | 49 | 49 | 48 | 48 | 49 | 131 | 132 | 130 | 65 |
DULA = dulaglutide; ITT = intention to treat; LIRA = liraglutide; PBO = placebo; PP = per protocol; SEM = semaglutide.
aSimultaneous participation in any other clinical trial receiving an investigational medicinal product
bPatients who attended the final scheduled visit
cPatients who completed treatment with treatment according to the end-of-trial form
Note: Rescue medication = use of new anti-diabetic medication as add-on to treatment and used for more than 21 days with the initiation at or after randomization and before last day on treatment
Exposure to study treatments
A detailed breakdown of exposure to study treatments by week in each of the PIONEER trials is available in Appendix 3.
In PIONEER 2 and 4, the majority of patients (83% to 90% and 85% to 88%, respectively) were exposed to treatment for 48 to 56 weeks. In PIONEER 3, 80% to 87% of patients were exposed to treatment for 76 to 80 weeks.
Most patients in PIONEER 1 (85% to 91%) and PIONEER 5 (81% to 87%) had a treatment exposure between 24 and 28 weeks. In PIONEER 8, 80% to 89% were exposed to treatment for between 48 and 56 weeks.
Between 72% and 77% of patients in PIONEER 6 were exposed to treatment for between 53 and 79 weeks, and 18% of patients with a treatment exposure of between 26 and 53 weeks in both treatment groups. The mean number of days in-trial was 482 (SD, 71) for the semaglutide treatment group and 477 (SD, 79) for the placebo treatment group.
In PIONEER 9, most patients (65% to 74%) had a treatment exposure of between 52 and 56 weeks, and approximately 25% of patients with a treatment exposure of between 48 and 52 weeks. In PIONEER 10, 63% to 73% of patients were exposed to treatment for a duration of between 52 and 56 weeks and between 21% to 25% of patients in the semaglutide treatment groups were exposed to treatment between 48 and 52 weeks. Within the dulaglutide group, 85% of patients received treatment between 48 and 52 weeks; few patients (9%) were exposed to treatment with dulaglutide for beyond 52 weeks. The PIONEER 10 trial was designed as a 52-week trial; therefore, the treatment exposures for the treatment groups are expected.
Additional anti-diabetic medication and rescue medication was permitted in each of the included studies, with the exception of PIONEER 6. Additional anti-diabetic medication is defined as other anti-diabetic medication that is initiated (all trials) or intensified by a dose increase of greater than 20% (PIONEER 2 to 5, and 8 only) during the planned treatment period as an add-on to treatment or initiated after premature discontinuation of treatment. Rescue medication refers to a subset of additional anti-diabetic medication, that is used as an add-on to treatment. Short-term use of anti-diabetic medication, defined as use for 21 days or less, was not considered anti-diabetic medication.
The proportion of patients that reported use of additional anti-diabetic medication and rescue medication was greater at later time points in all of the included trials where use was permitted (Table 27, Table 28, and Table 29).
Across the active-controlled RCTs, additional anti-diabetic medication use ranged from 3% to 9% at week 26, and 10% to 32% at week 52. Rescue medication use ranged from 1% to 8% at week 26 and 6% to 30% at week 52. In PIONEER 3, additional anti-diabetic medication use ranged from 16% to 38% and rescue medication use ranged from 10% to 34%. In PIONEER 3, the proportion of patients requiring additional anti-diabetic medication and rescue medication was greater in the semaglutide 3 mg treatment group, followed by the SITA 14 mg treatment group, compared to semaglutide 7 mg and semaglutide 14 mg. In PIONEER 4, additional anti-diabetic medication and rescue medication use was more than double in the placebo treatment group compared to the semaglutide 14 mg and LIRA 1.8 mg treatment groups.
Table 27: Additional anti-diabetic medication and rescue medication use (Active-Controlled RCTs, add-on to 1 to 2 OADs; FAS)
Medication | PIONEER 2 | PIONEER 3 | PIONEER 4 | ||||||
|---|---|---|---|---|---|---|---|---|---|
SEM 14 mg N = 410 | EMPA 25 mg N = 409 | SEM 3 mg N = 466 | SEM 7 mg N = 464 | SEM 14 mg N = 465 | SITA 14 mg N = 466 | SEM 14 mg N = 285 | LIRA 1.8 mg N = 184 | PBO N = 142 | |
Patients that used additional anti-diabetic and rescue medication, n (%) | |||||||||
Week 26 | |||||||||
Additional anti-diabetic medication | 17 (4.1) | 13 (3.2) | 33 (7.1) | 20 (4.3) | 15 (3.2) | 20 (4.3) | 20 (7.0) | 16 (5.6) | 12 (8.5) |
Rescue medication | 8 (1.9) | 5 (1.2) | 25 (5.4) | 11 (2.4) | 5 (1.1) | 13 (2.8) | 10 (3.5) | 9 (3.2) | 11 (7.7) |
Week 52 | |||||||||
Additional anti-diabetic medication | 52 (12.7) | 56 (13.7) | 137 (29.4) | 86 (18.5) | 51 (11.0) | 111 (23.8) | 39 (13.7) | 29 (10.2) | 46 (32.4) |
Rescue medication | 31 (7.5) | 44 (10.7) | 121 (26.1) | 73 (15.7) | 31 (6.7) | 94 (20.1) | 20 (7.0) | 18 (6.3) | 43 (30.3) |
Week 78 | |||||||||
Additional anti-diabetic medication | N/A | N/A | 179 (38.4) | 119 (25.6) | 75 (16.1) | 148 (31.7) | N/A | N/A | N/A |
Rescue medication | N/A | N/A | 160 (34.3) | 103 (22.2) | 47 (10.1) | 129 (27.6) | N/A | N/A | N/A |
EMPA = empagliflozin; LIRA = liraglutide; PBO = placebo; SEM = semaglutide; SITA = sitagliptin.
At week 26, additional anti-diabetic medication use and rescue medication use ranged from 4% to 20% and 1% to 15%, respectively, across the placebo-controlled RCTs (Table 28).
At week 52 in PIONEER 8, additional anti-diabetic medication use and rescue medication use ranged from 24% to 41% and 17% to 36%, respectively. Additional anti-diabetic medication and rescue medication use was greatest in the placebo treatment groups, followed by the semaglutide 3 mg treatment group in PIONEER 1 and 8.
Table 28: Additional anti-diabetic medication and rescue medication use (Placebo-Controlled RCTs; FAS)
Medication | PIONEER 1 | PIONEER 5 | PIONEER 8 | |||||||
|---|---|---|---|---|---|---|---|---|---|---|
SEM 3 mg N = 175 | SEM 7 mg N = 175 | SEM 14 mg N = 175 | PBO N = 178 | SEM 14 mg N = 163 | PBO N = 161 | SEM 3 mg N = 184 | SEM 7 mg N = 181 | SEM 14 mg N = 181 | PBO N = 184 | |
Patients that used additional anti-diabetic and rescue medication, n (%) | ||||||||||
Week 26 | ||||||||||
Additional anti-diabetic medication | 16 (9.1) | 8 (4.6) | 7 (4.0) | 35 (19.7) | 12 (7.4) | 21 (13.0) | 9 (4.9) | 8 (4.4) | 8 (4.4) | 11 (6.0) |
Rescue medication | 13 (7.4) | 4 (2.3) | 2 (1.1) | 27 (15.2) | 7 (4.3) | 16 (9.9) | 5 (2.7) | 2 (1.1) | 4 (2.2) | 9 (4.9) |
Week 52 | ||||||||||
Additional anti-diabetic medication | N/A | N/A | N/A | N/A | N/A | N/A | 61 (33.2) | 45 (24.7) | 44 (24.3) | 75 (40.8) |
Rescue medication | N/A | N/A | N/A | N/A | N/A | N/A | 54 (29.3) | 33 (18.1) | 31 (17.1) | 67 (36.4) |
FAS = full analysis set; N/A = not applicable; PBO = placebo; SEM = semaglutide.
Note: Additional anti-diabetic medication at week 52 in PIONEER 8 was mostly due to intensification of insulin treatment.
Additional anti-diabetic use and rescue medication use reported in PIONEER 9 and 10 is summarized in Table 29. Additional anti-diabetic use and rescue medication use at week 26 ranged from 0 to 14% in PIONEER 9 and 0 to 5% in PIONEER 10. At week 52, additional anti-diabetic use and rescue medication use both ranged from 8% to 31% in PIONEER 9. In PIONEER 9, additional anti-diabetic use and rescue medication use were both reported by 31% of patients in the placebo treatment group compared to 8% to 16% and 8% to 14%, respectively, of patients in the semaglutide treatment groups and 8% and 6%, respectively, of patients treated with liraglutide. At week 52 in PIONEER 10, the use of additional anti-diabetic use and rescue medication use was 6% to 18% and 2% to 17%, respectively, for patients in semaglutide treatment groups and 12% and 9%, respectively in the dulaglutide treatment group.
Table 29: Additional anti-diabetic medication and rescue medication use (Population-specific supportive studies; FAS)
Medication | PIONEER 9 | PIONEER 10 | |||||||
|---|---|---|---|---|---|---|---|---|---|
SEM 3 mg N = 49 | SEM 7 mg N = 49 | SEM 14 mg N = 48 | LIRA 0.9 mg N = 48 | PBO N = 49 | SEM 3 mg N = 131 | SEM 7 mg N = 132 | SEM 14 mg N = 130 | DULA 0.75 mg N = 65 | |
Patients that used additional anti-diabetic and rescue medication, n (%) | |||||||||
Week 26 | |||||||||
Additional anti-diabetic medication | 3 (6.1) | 3 (6.1) | 1 (2.1) | 0 | 7 (14.3) | 1 (0.8) | 3 (2.3) | 6 (4.6) | 1 (1.5) |
Rescue medication | 2 (4.1) | 2 (4.1) | 1 (2.1) | 0 | 7 (14.3) | 0 | 0 | 1 (0.8) | 1 (1.5) |
Week 52 | |||||||||
Additional anti-diabetic medication | 8 (16.3) | 6 (12.2) | 4 (8.3) | 4 (8.3) | 15 (30.6) | 24 (18.3) | 13 (9.8) | 8 (6.2) | 8 (12.3) |
Rescue medication | 7 (14.3) | 5 (10.2) | 4 (8.3) | 3 (6.3) | 15 (30.6) | 22 (16.8) | 8 (6.1) | 2 (1.5) | 6 (9.2) |
DULA = dulaglutide; LIRA = liraglutide; PBO = placebo; SEM = semaglutide.
Efficacy
Only those efficacy outcomes and analyses of subgroups identified in the review protocol are reported below. See Appendix 3 for detailed efficacy data.
Glycemic control
Glycemic control outcomes for the active-controlled RCTs evaluating semaglutide tablets as an add-on to 1 to 2 OADs are summarized in Table 30. At week 26, the change from baseline in A1C ranged from –1.2% to –1.3% for the semaglutide 14 mg treatment groups in PIONEER 2, 3, and 4. In PIONEER 3, the change from baseline in the semaglutide 7 mg and 14 mg treatment groups was –1.0% and –1.3%, respectively. The primary analysis of PIONEER 2 and 3 was non-inferiority of semaglutide compared to empagliflozin and sitagliptin, respectively, in terms of change from baseline in A1C (%) at week 26. Using a non-inferiority margin of 0.4% for PIONEER 2 and 0.3% for PIONEER 3, non-inferiority was demonstrated for all comparisons except semaglutide 3 mg versus sitagliptin 100 mg. A non-inferiority analysis using a margin of 0.4% was performed in PIONEER 4 as well for the comparison of semaglutide 14 mg to liraglutide 1.8 mg where non-inferiority was also demonstrated. The same comparisons were made for superiority of semaglutide treatment groups compared to comparators. A treatment group difference of –0.4% (95% CI, –0.6 to –0.3, P < 0.0001) in favour of semaglutide 14 mg compared to empagliflozin was reported in PIONEER 2. In PIONEER 3, the treatment group differences of semaglutide 7 mg and semaglutide 14 mg compared to sitagliptin [–0.3% (95% CI, –0.4 to –0.1, P < 0.0001) and –0.5% (95% CI, –0.6 to –0.4, P < 0.0001), respectively] were in favour of the semaglutide treatment groups; however, superiority was not assessed for the SEM 3 mg treatment group due to failure of the previous non-inferiority test. In PIONEER 4, the treatment group difference between semaglutide 14 mg and placebo was –1.1% (95% CI, –1.2 to –0.9, P < 0.0001) in favour of semaglutide 14 mg. A treatment group difference was not demonstrated for the comparison of semaglutide 14 mg to liraglutide [–0.1% (95% CI, –0.3 to 0.0, P = 0.0645)].
The changes in A1C (%) from baseline to week 52 were consistent with what was reported at week 26 in PIONEER 2 to 4. The treatment group difference at week 52 for semaglutide versus comparators was also aligned with the results at week 26. PIONEER 3 was a long-term study with results up to week 78. The change from baseline to week 78 was –0.6%, –0.8%, and –1.1% for semaglutide 3 mg, 7 mg, and 14 mg, respectively, and –0.7% for sitagliptin.
Table 30: Change from baseline in A1C (Active-controlled trials, add-on to 1 to 2 OADs; FAS)
Week, change from baseline | PIONEER 2 | PIONEER 3 | PIONEER 4 | ||||||
|---|---|---|---|---|---|---|---|---|---|
SEM 14 mg N = 411 | EMPA 25 mg N = 410 | SEM 3 mg N = 466 | SEM 7 mg N = 465 | SEM 14 mg N = 465 | SIT 100 mg N = 467 | SEM 14 mg N = 285 | LIRA 1.8 mg N = 284 | PBO N = 142 | |
A1C (%)a | |||||||||
Number of patients contributing to the analysis | 411 | 410 | 466 | 465 | 465 | 467 | 285 | 284 | 142 |
Baseline, mean (SD) | 8.1 (0.9) | 8.1 (0.9) | 8.3 (1.0) | 8.4 (1.0) | 8.3 (0.9) | 8.3 (0.9) | 8.0 (0.7) | 8.0 (0.7) | 7.9 (0.7) |
Week 26 | |||||||||
Week 26, mean (SE)b | 6.8 | 7.3 | 7.7 | 7.3 | 7.0 | 7.5 | 6.7 | 6.9 | 7.8 |
Change from baseline, mean (SE)b | –1.3 | –0.9 | –0.6 | –1.0 | –1.3 | –0.8 | –1.2 | –1.1 | –0.2 |
Non-inferiority analysisc | |||||||||
Treatment group difference vs. control (95% CI) | –0.4 (–0.6 to –0.3) | N/A | 0.2 (0.1 to 0.3) | –0.2 (–0.4 to –0.1) | –0.5 (–0.6 to –0.4) | N/A | –0.1 (–0.3 to 0.0) [ vs LIRA] | N/A | N/A |
P value | < 0.0001 | N/A | 0.0856 | < 0.0001 | < 0.0001 | N/A | < 0.0001 [ vs LIRA] | N/A | N/A |
Superiority analysis | |||||||||
Treatment group difference vs. control (95% CI) | –0.4 (–0.6 to –0.3) | N/A | 0.2 (0.0 to 0.3) | –0.3 (–0.4 to –0.1) | –0.5 (–0.6 to –0.4) | N/A | –0.1 (–0.3 to 0.0) [vs LIRA] –1.1 (–1.2 to –0.9) [vs. PBO] | N/A | N/A |
P value | < 0.0001 | N/A | 0.0080d | < 0.0001 | < 0.0001 | N/A | 0.0645 [vs. LIRA] < 0.0001 [vs. PBO] | N/A | N/A |
Week 52 | |||||||||
Week 52, mean (SE)b | 6.8 | 7.2 | 7.7 | 7.3 | 7.1 | 7.6 | 6.8 | 7.1 | 7.8 |
Change from baseline, mean (SE)b | –1.3 | –0.9 | –0.6 | –1.0 | –1.2 | –0.7 | –1.2 | –0.9 | –0.2 |
Treatment group difference vs. control (95% CI) | –0.4 (–0.5 to –0.3) | N/A | 0.0 (–0.1 to 0.2) | –0.3 (–0.4 to –0.1) | –0.5 (–0.6 to –0.3) | N/A | –0.3 (–0.5 to –0.1) [vs. LIRA] –1.0 (−1.2 to –0.8) [vs. PBO] | N/A | N/A |
P valuee | < 0.0001 | N/A | 0.5021 | 0.0002 | < 0.0001 | N/A | 0.0002 [vs. LIRA] < 0.0001 [vs. PBO] | N/A | N/A |
Week 78 | |||||||||
Week 78, mean (SE)b | N/A | N/A | 7.7 | 7.5 | 7.2 | 7.6 | N/A | N/A | N/A |
Change from baseline, mean (SE)b | N/A | N/A | –0.6 | –0.8 | –1.1 | –0.7 | N/A | N/A | N/A |
Treatment group difference vs. control (95% CI) | N/A | N/A | 0.0 (–0.1 to 0.2) | –0.1 (–0.3 to 0.0) | –0.4 (–0.6 to –0.3) | N/A | N/A | N/A | N/A |
P valuee | N/A | N/A | 0.6111 | 0.0575 | < 0.0001 | N/A | N/A | N/A | N/A |
A1C = glycated hemoglobin; CI = confidence interval; FAS = full analysis set; LIRA = liraglutide; N/A = not applicable; PBO = placebo; SD = standard deviation; SE = standard error; SEM = semaglutide; SIT = sitagliptin.
aData presented corresponds to the treatment policy estimand, using the in-trial observation period. Missing post-baseline values were imputed by a pattern mixture model using multiple imputation. Pattern was defined by treatment arm and treatment status (premature treatment discontinuation and/or initiation of rescue medication), and multiple imputations were based on an ANCOVA model. Multiple imputation was from own treatment arm and same treatment status. Change from baseline was analyzed using an ANCOVA model with treatment, strata, and region as categorical fixed effects and baseline value as covariate for each of the 1000 imputed complete datasets and pooled by Rubin's rule to draw inference.
bNon-inferiority margin is 0.3% for analyses in PIONEER 3 and 0.4% for the analyses in PIONEER 2 and PIONEER 4.
cStandard error was not reported.
dP-value cannot be used for inference due to a previously failed test in the statistical testing hierarchy. The P-value should be interpreted as nominal.
eP-value has not been adjusted for multiple testing.
Source: PIONEER 2, PIONEER 3, and PIONEER 4 Clinical Study Reports.13-15
Post-hoc subgroup analyses by background therapy were submitted by the sponsor for PIONEER 3 and 4 (Table 31 and Table 32).
Briefly, v vvvvvvvvvv vv vvvvvvvvv vvvvvv vvvvv vv vvvvvvvvvv vvvvvvv vvv vvv vvvvvvvv vv vvvvvv vvvvv. In PIONEER 3, patients were receiving metformin with or without SU as background therapy. The treatment group differences for semaglutide compared to sitagliptin vvvvv vv vvv vvvvvvvvv vv vvvvvvvvvv vvvvvvv vvvv vvvvvvvvvv vvvv vvv vvvvvvv vvvvvvvvv In PIONEER 4, patients were receiving either metformin or metformin and an SGLT2 inhibitor. vvv vvvvvv vvvv vvvvvvvv vv vvvv vv vvv vv vv vvvv vv vvv vvvvvvvvv vvvvv vvvvvvvvvvv vvvvvvvvvvvv vvv vvvv vvvv vvvv vvvvvvvvvv vvvv vvv vvvvvvv vvvvvvvvv
Additional subgroup analyses on the primary end point by baseline A1C and body weight for PIONEER 1 to 5 and 8 are included in Appendix 3 (Figure 20 and Figure 21).
Table 31: Change from baseline in A1C by background therapy (PIONEER 3, active-controlled trials, add-on to 1 to 2 OADs; FAS)
Week, change from baseline | PIONEER 3 | |||||||
|---|---|---|---|---|---|---|---|---|
SEM 3 mg N = 466 | SEM 7 mg N = 465 | SEM 14 mg N = 465 | SIT 100 mg N = 467 | |||||
MET N = 246 | MET+SU N = 220 | MET N = 247 | MET+SU N = 218 | MET N = 245 | MET+SU N = 220 | MET N = 248 | MET+SU N = 219 | |
A1C (%)a | ||||||||
Number of patients contributing to the analysis |
|
|
|
|
|
|
|
|
Week 26 | ||||||||
Week 26, mean (SE)b |
|
|
|
|
|
|
|
|
Change from baseline, mean (SE)b |
|
|
|
|
|
|
|
|
Treatment group difference vs. control (95% CI) |
|
|
|
|
|
|
|
|
P valuec |
|
|
|
| ||||
Week 52 | ||||||||
Week 52, mean (SE)b |
|
|
|
|
|
|
|
|
Change from baseline, mean (SE)b |
|
|
|
|
|
|
|
|
Treatment group difference vs. control (95% CI) |
|
|
|
|
|
|
|
|
P valuec |
|
|
|
| ||||
Week 78 | ||||||||
Week 78, mean (SE)b |
|
|
|
|
|
|
|
|
Change from baseline, mean (SE)b |
|
|
|
|
|
|
|
|
Treatment group difference vs. control (95% CI) |
|
|
|
|
|
|
|
|
P valuec |
|
|
|
| ||||
A1C = glycated hemoglobin; CI = confidence interval; N/A = not applicable; SD = standard deviation; SE = standard error; SEM = semaglutide; SIT = sitagliptin.
v vvvv vvvvvvvvv vvvvvvvvvvv vv vvv vvvvvvvvv vvvvvv vvvvvvvvv vvvvv vvv vvvvvvvv vvvvvvvvvvv vvvvvvv vvvvvvv vvvvvvvvvvvvv vvvvvv vvvv vvvvvvv vv v vvvvvvv vvvvvvv vvvvv vvvvv vvvvvvvv vvvvvvvvvvv vvvvvvv vvv vvvvvvv vv vvvvvvvvv vvv vvv vvvvvvvvv vvvvvv vvvvvvvvvv vvvvvvvvv vvvvvvvvvvvvvvv vvvvvv vvvvvvvvvv vv vvvvvv vvvvvvvvvvvv vvv vvvvvvvv vvvvvvvvvvv vvvv vvvvv vv vv vvvvvv vvvvvv vvvvvvvv vvvvvvvvvv vvv vvvv vvv vvvvvvvvv vvv vvv vvvv vvvvvvvvv vvvvvvv vvvvvv vvvv vvvvvvvv vvv vvvvvvvv vvvvv vv vvvvvv vvvvv vvvv vvvvvvvvvv vvvvvvv vvv vvvvvv vv
vvvvvvvvvvv vvvvv vvvvvvv vvv vvvvvvvv vvvvv vv vvvvvvvvv vvv vvvv vv vvv vvvv vvvvvvv vvvvvvvv vvvvvvvvv vvv vvvvvv vv vvvvvvv vvvv vv vvvv vvvvvvvvvv
v vvvvvvvv vvvvv v vvv vvv vvvv
v vvvv vvv vvvvvvvvv vv vvvvvvvv vvvvvvvvvvvv vvvvvvv vvv vvv vvvv vvvvvvvv vvv vvvvvvvvvvvvv
Source: PIONEER 3 Clinical Study Report.14
Table 32: Change from baseline in A1C by background therapy (PIONEER 4, active-controlled trials, add-on to 1 to 2 OADs; FAS)
Week, change from baseline | PIONEER 4 | |||||
|---|---|---|---|---|---|---|
SEM 14 mg N = 285 | LIRA 1.8 mg N = 284 | PBO N = 142 | ||||
MET N = 211 | MET+SGLT2 N = 74 | MET N = 211 | MET+SGLT2 N =73 | MET N = 106 | MET+SGLT2 N = 36 | |
A1C (%)a | ||||||
Number of patients contributing to the analysis |
|
|
|
|
|
|
Week 26 | ||||||
Week 26, mean (SE)b |
|
|
|
|
|
|
Change from baseline, mean (SE)b |
|
|
|
|
|
|
Treatment group difference vs. control (95% CI) |
|
|
|
|
|
|
P valuec |
|
|
| |||
Week 52 | ||||||
Week 52, mean (SE)b |
|
|
|
|
|
|
Change from baseline, mean (SE)b |
|
|
|
|
|
|
Treatment group difference vs. control (95% CI) |
|
|
|
|
|
|
P valuec |
|
|
|
|
| |
A1C = glycated hemoglobin; CI = confidence interval; LIRA = liraglutide; N/A = not applicable; PBO = placebo; SD = standard deviation; SE = standard error; SEM = semaglutide; SGLT2 = sodium glucose cotransporter-2; SIT = sitagliptin.
v vvvv vvvvvvvvv vvvvvvvvvvv vv vvv vvvvvvvvv vvvvvv vvvvvvvvv vvvvv vvv vvvvvvvv vvvvvvvvvvv vvvvvvv vvvvvvv vvvvvvvvvvvvv vvvvvv vvvv vvvvvvv vv v vvvvvvv vvvvvvv vvvvv vvvvv vvvvvvvv vvvvvvvvvvv vvvvvvv vvv vvvvvvv vv vvvvvvvvv vvv vvv vvvvvvvvv vvvvvv vvvvvvvvvv vvvvvvvvv vvvvvvvvvvvvvvv vvvvvv vvvvvvvvvv vv vvvvvv vvvvvvvvvvvv vvv vvvvvvvv vvvvvvvvvvv vvvv vvvvv vv vv vvvvvv vvvvvv vvvvvvvv vvvvvvvvvv vvv vvvv vvv vvvvvvvvv vvv vvv vvvv vvvvvvvvv vvvvvvv vvvvvv vvvv vvvvvvvv vvv vvvvvvvv vvvvv vv vvvvvv vvvvv vvvv vvvvvvvvvv vvvvvvv vvvvvvv vvvvvvvv vvv vvvvvvvvvvv vvvvvvv vvvvvvvvv vvv vvvvvvvv vv vvvvvvvvvvv vvvvv vvvvvvv vvv vvvvvvvv vvvvv vv vvvvvvvvv vvv vvvv vv vvv vvvv vvvvvvv vvvvvvvv vvvvvvvvv vvv vvvvvv vv vvvvvvv vvvv vv vvvv vvvvvvvvvv
v vvvvvvvv vvvvv v vvv vvvvvv vvvvvvvvv vvvvvvvvvv
v vvvv vvv vvvvvvvvv vv vvvvvvvv vvvvvvvvvvvv vvvvvvv vvv vvv vvvv vvvvvvvv vvv vvvvvvvvvvvvv
Source: PIONEER 4 Clinical Study Report.15
The results for the change from baseline in A1C in placebo-controlled trials, PIONEER 1, 5, and 8, are presented in Table 33. At week 26 in PIONEER 1, the change from baseline in A1C (%) ranged from –0.9% to –1.4% in the semaglutide treatment groups, and was –0.3% for the placebo group. In PIONEER 5, the change from baseline in A1C at week 26 was –1.0% and –0.2% for semaglutide and placebo treatment groups, respectively. In PIONEER 8, the change from baseline in A1C at week 26 ranged from –0.6% to –1.3% in semaglutide treatment groups, and was –0.1% in the placebo treatment group. The treatment group difference for semaglutide tablets compared to placebo at week 26 was in favour of semaglutide for all doses evaluated and across in all 3 studies (P < 0.0001). In PIONEER 1, this corresponded to a treatment group difference for semaglutide 3 mg, 7 mg, and 14 mg versus placebo of –0.6% (95% CI, –0.8 to –0.4), –0.9% (95% CI, –1.1 to –0.6), and –1.1% (95% CI, –1.3 to –0.9), respectively. In PIONEER 8, the treatment group differences at week 26 were: –0.5% (95% CI, –0.7 to –0.3) for the semaglutide 3 mg treatment group, –0.9% (95% CI, –1.1 to –0.7) for the semaglutide 7 mg treatment group, and –1.2% (95% CI, –1.4 to –1.0) for the semaglutide 14 mg group. The treatment group difference between semaglutide 14 mg and placebo at week 26 in PIONEER 5 was –0.8% (95% CI, –1.0 to –0.6). In PIONEER 8, results up to 52 weeks were reported and the change from baseline in A1C was consistent with results at week 26.
Table 33: Change from baseline in A1C (Placebo-controlled trials; FAS)
Week, change from baseline | PIONEER 1 | PIONEER 5 | PIONEER 8 | |||||||
|---|---|---|---|---|---|---|---|---|---|---|
SEM 3 mg N = 175 | SEM 7 mg N = 175 | SEM 14 mg N = 175 | PBO N = 178 | SEM 14 mg N = 163 | PBO N = 161 | SEM 3 mg N = 184 | SEM 7 mg N = 182 | SEM 14 mg N = 181 | PBO N= 184 | |
A1C (%)a | ||||||||||
Number of patients contributing to the analysis | 175 | 175 | 175 | 178 | 163 | 161 | 184 | 182 | 181 | 184 |
Baseline, mean (SD) | 7.9 (0.7) | 8.0 (0.6) | 8.0 (0.7) | 7.9 (0.7) | 8.0 (0.7) | 7.9 (0.7) | 8.2 (0.7) | 8.2 (0.7) | 8.2 (0.7) | 8.2 (0.7) |
Week 26 | ||||||||||
Week 26, mean (SE)b | 7.1 | 6.8 | 6.6 | 7.7 | 6.9 | 7.8 | 7.6 | 7.2 | 6.9 | 8.1 |
Change from baseline, mean (SE)b | –0.9 | –1.2 | –1.4 | –0.3 | –1.0 | –0.2 | –0.6 | –0.9 | –1.3 | –0.1 |
Treatment group difference vs. control (95% CI) | –0.6 (–0.8 to –0.4) | –0.9 (–1.1 to –0.6) | –1.1 (–1.3 to –0.9) | N/A | –0.8 (–1.0 to –0.6) | N/A | –0.5 (–0.7 to –0.3) | –0.9 (–1.1 to –0.7) | –1.2 (–1.4 to –1.0) | N/A |
P value | < 0.0001 | < 0.0001 | < 0.0001 | N/A | < 0.0001 | N/A | < 0.0001 | < 0.0001 | < 0.0001 | N/A |
Week 52 | ||||||||||
Week 52, mean (SE)b | N/A | N/A | N/A | N/A | N/A | N/A | 7.6 | 7.4 | 7.0 | 8.0 |
Change from baseline, mean (SE)b | N/A | N/A | N/A | N/A | N/A | N/A | –0.6 | –0.8 | –1.2 | –0.2 |
Treatment group difference vs. control (95% CI) | N/A | N/A | N/A | N/A | N/A | N/A | –0.4 (–0.6 to –0.2) | –0.6 (–0.8 to –0.4) | –0.9 (–1.1 to –0.7) | N/A |
P valuec | N/A | N/A | N/A | N/A | N/A | N/A | 0.0004 | < 0.0001 | < 0.0001 | N/A |
A1C = glycated hemoglobin; CI = confidence interval; N/A = not applicable; PBO = placebo; SD = standard deviation; SE = standard error; SEM = semaglutide.
aData presented corresponds to the treatment policy estimand, using the in-trial observation period. Missing post-baseline values were imputed by a pattern mixture model using multiple imputation. Pattern was defined by treatment arm and treatment status (premature treatment discontinuation and/or initiation of rescue medication), and multiple imputations were based on an ANCOVA model. Multiple imputation was from own treatment arm and same treatment status. Change from baseline was analyzed using an ANCOVA model with treatment, strata, and region as categorical fixed effects and baseline value as covariate for each of the 1000 imputed complete datasets, and pooled by Rubin's rule to draw inference.
bStandard error was not reported.
cP-value has not been adjusted for multiple testing.
Source: PIONEER 1, PIONEER 5, and PIONEER 8 Clinical Study Reports.12,16,17
The change from baseline in A1C was reported descriptively in PIONEER 6 (Table 34). The change from baseline to end of treatment was –1.0% (SD, 1.4) for the semaglutide 14 mg treatment group and –0.3% (SD, 1.3) for the placebo treatment group.
Table 34: Change from baseline in A1C (CVOT; FAS)
N, mean, change from baseline | PIONEER 6 | |
|---|---|---|
SEM 14 mg N = 1591 | PBO N = 1592 | |
A1C (%)a | ||
N at baseline | 1581 | 1574 |
Baseline, mean (SD) | 8.2 (1.6) | 8.2 (1.6) |
N at end of treatment time point | 1489 | 1473 |
End of treatment time point, mean (SD) | 7.2 (1.2) | 7.8 (1.3) |
Change from baseline to end of treatment, mean (SD) | –1.0 (1.4) | –0.3 (1.3) |
Min, max | – 8.4 to 4.3 | –7.8 to 7.4 |
A1C = glycated hemoglobin; CI = confidence interval; FAS = full analysis set; PBO = placebo; SD = standard deviation; SEM = semaglutide.
aObserved data presented corresponds to the treatment policy estimand using the in-trial observation period.
Source: PIONEER 6 Clinical Study Report.20
The results for change from baseline in A1C (%) from PIONEER 9 and 10 are presented in Table 35. At week 26, the change from baseline in A1C (%) ranged from –1.1% to –2.0% among the semaglutide treatment groups, –1.4% and –1.5% for active comparators liraglutide (PIONEER 9) and dulaglutide (PIONEER 10), respectively, and –0.4% for placebo (PIONEER 9). In PIONEER 9, the treatment group difference compared to placebo was in favour of semaglutide at all 3 dosage strengths: –0.8% (95% CI, –1.1 to –0.5, P < 0.0001) for semaglutide 3 mg, –1.2% (95% CI, –1.5 to –0.9, P < 0.0001) for semaglutide 7 mg, and –1.4% (95% CI, –1.7 to –1.1, P < 0.0001) for semaglutide 14 mg. The treatment group difference between semaglutide tablets and liraglutide was in favour of semaglutide at the highest dose (14 mg) based on a difference of –0.4% (95% CI, –0.7 to –0.1, P = 0.0077), and no statistically significant difference was observed between semaglutide 3 mg or semaglutide 7 mg and liraglutide (Table 35). Similarly, the treatment group difference of semaglutide 14 mg compared to dulaglutide in PIONEER 10 was in favour of semaglutide 14 mg based on a difference of –0.4% (95% CI, –0.7 to –0.2, P = 0.0006) and no statistically significant difference was observed for semaglutide 7 mg compared to dulaglutide (Table 35). The treatment group difference of semaglutide 3 mg compared to dulaglutide was in favour of dulaglutide (0.4%, 95% CI, 0.1 to 0.7, P = 0.0026).
The change from baseline to week 52 in A1C (%) ranged from –0.9% to –1.5% for the semaglutide tablets treatment groups, –1.2% and –1.4% for liraglutide (PIONEER 9) and dulaglutide (PIONEER 10), respectively, and –0.1% for placebo (PIONEER 9). In PIONEER 9, a treatment group difference in favour of semaglutide 3 mg [–0.8% (95% CI, –1.2 to –0.5, P < 0.0001)], 7 mg [–1.3% (95% CI, –1.6 to –1.0, P < 0.0001)], and 14 mg [–1.4% (95% CI, –1.7 to –1.0, P < 0.0001)] compared to placebo was observed, and no statistically significant difference was observed between semaglutide tablets and liraglutide at any dosage strength. In PIONEER 10, the treatment group difference of semaglutide 14 mg compared to dulaglutide was –0.3% (95% CI, –0.6 to –0.1, P = 0.0170) in favour of semaglutide 14 mg, no statistically significant difference was observed for semaglutide 7 mg, and the difference of semaglutide 3 mg compared to dulaglutide was 0.5% (95% CI, 0.2 to 0.8, P = 0.0005) in favour of dulaglutide.
Table 35: Change from baseline in A1C (Population-specific supportive studies; FAS)
Week, change from baseline | PIONEER 9 | PIONEER 10 | |||||||
|---|---|---|---|---|---|---|---|---|---|
SEM 3 mg N = 49 | SEM 7 mg N = 49 | SEM 14 mg N = 48 | PBO N = 49 | LIRA 0.9 mg N = 48 | SEM 3 mg N = 131 | SEM 7 mg N = 132 | SEM 14 mg N = 130 | DULA 0.75 mg N = 65 | |
A1C (%)a | |||||||||
Number of patients contributing to the analysis | 49 | 49 | 48 | 49 | 48 | 131 | 132 | 130 | 65 |
Baseline, mean (SD) | 8.1 (0.8) | 8.3 (1.0) | 8.0 (0.9) | 8.3 (0.8) | 8.3 (1.1) | 8.2 (0.9) | 8.3 (0.9) | 8.4 (1.0) | 8.4 (0.9) |
Week 26 | |||||||||
Week 26, mean (SE)b | 7.1 | 6.7 | 6.4 | 7.8 | 6.9 | 7.2 | 6.7 | 6.4 | 6.8 |
Change from baseline, mean (SE)b | –1.1 | –1.6 | –1.8 | –0.4 | –1.4 | –1.1 | –1.7 | –2.0 | –1.5 |
Treatment group difference vs. control (95% CI) | –0.8 (–1.1 to –0.5) [vs. PBO] 0.2 (–0.1 to 0.5) [vs. LIRA] | –1.2 (–1.5 to –0.9) [vs. PBO] –0.2 (–0.5 to 0.2) [vs. LIRA] | –1.4 (–1.7 to –1.1) [vs. PBO] –0.4 (–0.7 to –0.1) [vs. LIRA] | N/A | N/A | 0.4 (0.1 to 0.7) | –0.1 (–0.4 to 0.1) | –0.4 (–0.7 to –0.2) | N/A |
P valuec | < 0.0001 [vs. PBO] 0.1958 [vs. LIRA] | < 0.0001 [vs. PBO] 0.1868 [vs. LIRA] | < 0.0001 [vs. PBO] 0.0077 [vs. LIRA] | N/A | N/A | 0.0026 | 0.2710 | 0.0006 | N/A |
End of Study | |||||||||
Week 52, mean (SE)b | 7.3 | 6.8 | 6.7 | 8.1 | 7.0 | 7.5 | 6.9 | 6.7 | 7.0 |
Change from baseline, mean (SE)b | –0.9 | –1.4 | –1.5 | –0.1 | –1.2 | –0.9 | –1.4 | –1.7 | –1.4 |
Treatment group difference vs. control (95% CI) | –0.8 (–1.2 to –0.5) [vs. PBO] 0.3 (–0.1 to 0.6) [vs. LIRA] | –1.3 (–1.6 to –1.0) [vs. PBO] –0.2 (–0.6 to 0.1) [vs. LIRA] | –1.4 (–1.7 to –1.0) [vs. PBO] –0.3 (–0.7 to 0.1) [vs. LIRA] | N/A | N/A | 0.5 (0.2 to 0.8) | –0.1 (–0.3 to 0.2) | –0.3 (–0.6 to –0.1) | N/A |
P valuec | < 0.0001 [vs. PBO] 0.1899 [vs. LIRA] | < 0.0001 [vs. PBO] 0.1949 [vs. LIRA] | < 0.0001 [vs. PBO] 0.1005 [vs. LIRA] | N/A | N/A | 0.0005 | 0.6580 | 0.0170 | N/A |
A1C = glycated hemoglobin; CI = confidence interval; DULA = dulaglutide; FAS = full analysis set; LIRA = liraglutide; SD = standard deviation; SE = standard error; SEM = semaglutide.
aPIONEER 9: Data presented corresponds to the treatment policy estimand, using the in-trial observation period. Missing post-baseline values were imputed by a pattern mixture model using multiple imputation. Pattern was defined by treatment arm and treatment status, and multiple imputations were based on an ANCOVA model. Multiple imputation was done within 6 (6) groups of subjects; 1 (1) group of subjects regardless of randomized treatment arm who at week 26 (or week 52) had discontinued treatment or initiated rescue medication, and 5 (5) groups of subjects defined by randomized treatment arm for subjects that were still on treatment and had not initiated rescue medication. Change from baseline was analyzed using an ANCOVA model with treatment and strata as categorical fixed effects and baseline value as covariate for each of the 1000 imputed complete datasets, and pooled by Rubin's rule to draw inference.
PIONEER 10: Data presented corresponds to the treatment policy estimand, using the in-trial observation period. Missing post-baseline values were imputed by a pattern mixture model using multiple imputation. Pattern was defined by treatment arm and treatment status (premature treatment discontinuation and/or initiation of rescue medication), and imputations were based on an ANCOVA model. Imputation was from own treatment arm and same treatment status. Change from baseline was analyzed using an ANCOVA model with treatment and strata as categorical fixed effects and baseline value as covariate for each of the 1000 imputed complete datasets, and pooled by Rubin's rule to draw inference.
bStandard error not reported.
cP-value has not been adjusted for multiple testing.
Source: PIONEER 9 and PIONEER 10 Clinical Study Reports.18,19
Mortality
Mortality was not assessed in PIONEER 1 to 5, and 8 to 10. In PIONEER 6, EAC-confirmed all-cause deaths were reported for 23 patients (1.4%) in the semaglutide 14 mg treatment group and 45 patients (2.8%) in the placebo treatment group (Table 36). Ten of the 23 deaths in the semaglutide 14 mg treatment group, and 23 of the 45 deaths in the placebo treatment group were caused by CV events.
Table 36: Mortality (CVOT; FAS)
Mortality | PIONEER 6 | |
|---|---|---|
SEM 14 mg N = 1591 | PBO N = 1592 | |
Mortality, all-cause and CV-related | ||
EAC-confirmed all-cause death, n (%) | 23 (1.4) | 45 (2.8) |
CV and undetermined cause of death, n (%) | 15 (0.9) | 30 (1.9) |
CV death, n (%) | 10 (0.6) | 23 (1.4) |
CV = cardiovascular; EAC = event adjudication committee; FAS = full analysis set; SEM = semaglutide; PBO = placebo.
Source: PIONEER 6 Clinical Study Report.20
Diabetes-related morbidity
Diabetes-related morbidity was not assessed in PIONEER 1 to 5, and 8 to 10. The results for PIONEER 6 are presented in Table 37.
The primary analysis in PIONEER 6 was time to first EAC-confirmed MACE, which corresponded to an estimated hazard ratio (HR) of 0.79 (95% CI, 0.57 to 1.11) for semaglutide tablets relative to placebo. This was assessed for non-inferiority followed by superiority. Non-inferiority was met as the upper bound of the CI was less than 1.8 (P < 0.0001); however, superiority was not demonstrated (P = 0.1749). The results for time to first EAC-confirmed all-cause death, non-fatal stroke, and non-fatal MI was similar (HR = 0.77, 95% CI, 0.56 to 1.05, P = 0.0952). Overall, the occurrence of MACE were reported by 5.2% of patients in the semaglutide 14 mg treatment group and 6.4% for the placebo treatment group. Non-fatal MI as part of the expanded MACE were reported in 2.3% and 1.9% for semaglutide 14 mg and placebo treatment groups, respectively. The proportion of patients with heart failure requiring hospitalization, CV and undetermined cause of death, non-fatal stroke, and unstable angina pectoris requiring hospitalization is presented in Table 37.
PIONEER 6 provided subgroup analyses for the primary analysis, time to first EAC-confirmed MACE, are presented in Figure 2 and Figure 3). The treatment effect for patients with a BMI of 30 or less corresponded to a hazard ratio (HR) of 0.61 (95% CI, 0.36 to 1.03); for patients without a history of MI or stroke before randomization the HR was 0.59 (95% CI, 0.34 to 1.03) and for patients exhibiting CV risk factors (only, as opposed to CV disease), the HR was 0.51 (95% CI, 0.15 to 1.68). Subgroup analyses by A1C, renal function or for patients with a BMI greater than 30, prior MI or stroke, and presence of CV disease do not appear to have a differential treatment effect.
Table 37: Diabetes-related morbidity and mortality (CVOT; FAS)
Morbidity and mortality | PIONEER 6 | |
|---|---|---|
SEM 14 mg N = 1591 | PBO N = 1592 | |
EAC-confirmed MACE | ||
Time to first EAC-confirmed MACEa, SEM vs. PBO | ||
Number of events | 61 | 76 |
HR (95% CI) | 0.79 (0.57 to 1.11) | |
Non-inferiority P value | < 0.0001 | |
Superiority P value | 0.1749 | |
First EAC-confirmed MACE, n (%) | 61 (3.8) | 76 (4.8) |
MI, non-fatal | 37 (2.3) | 31 (1.9) |
Stroke, non-fatal | 11 (0.7) | 16 (1.0) |
CV and undetermined cause of death | 13 (0.8) | 29 (1.8) |
Time to first EAC-confirmed all-cause death, non-fatal stroke, non-fatal MIa, SEM vs. PBO | ||
HR (95% CI) | 0.77 (0.56 to 1.05) | |
P value | 0.0952b | |
EAC-confirmed expanded MACE, n (%) | ||
All events | 83 (5.2) | 100 (6.3) |
MI, non-fatal | 37 (2.3) | 31 (1.9) |
Stroke, non-fatal | 12 (0.8) | 16 (1.0) |
CV and undetermined cause of death | 15 (0.9) | 30 (1.9) |
UAP requiring hospitalization | 11 (0.7) | 7 (0.4) |
Heart failure requiring hospitalization | 21 (1.3) | 24 (1.5) |
CV = cardiovascular; EAC = event adjudication committee; FAS = full analysis set; HR = hazard ratio; MACE = major adverse cardiovascular event; MI = myocardial infarction; PBO = placebo; SEM = semaglutide; UAP = unstable angina pectoris.
aData presented corresponds to the treatment policy estimand using the in-trial observation period. Time from randomization to first EAC-confirmed MACE was analyzed using a Cox proportional hazards model with treatment as categorical fixed factor and stratified by evidence of cardiovascular disease at screening. Subjects were censored at the end of their in-trial observation period. 'p-value': unadjusted 2-sided p-value for test of no difference from the non-inferiority margin (non-inferiority) or for test of no difference from 1 (superiority).
bP-value has not been adjusted for multiple testing.
Note: Patients that did not experience a MACE by end of treatment were censored and therefore considered still at risk.
Source: PIONEER 6 Clinical Study Report.20
Figure 2: Time from baseline to first EAC-confirmed MACE by BMI and A1C at baseline (CVOT; FAS)
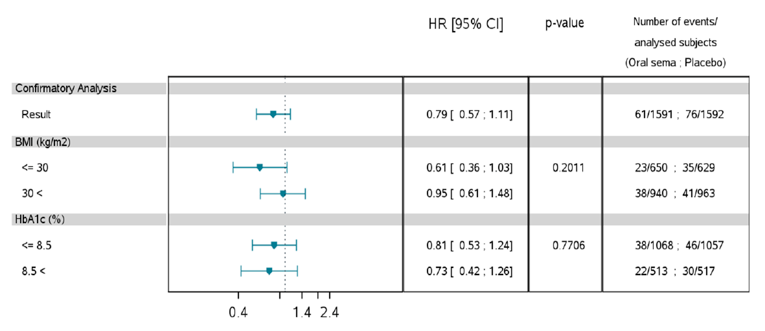
BMI = body mass index; HbA1c = glycated hemoglobin; HR = hazard ratio; SEMA = semaglutide.
Source: Clinical Study Report.20
Figure 3: Time from baseline to first EAC-confirmed MACE by renal function, prior MI or stroke, and CV disease at baseline (CVOT; FAS)
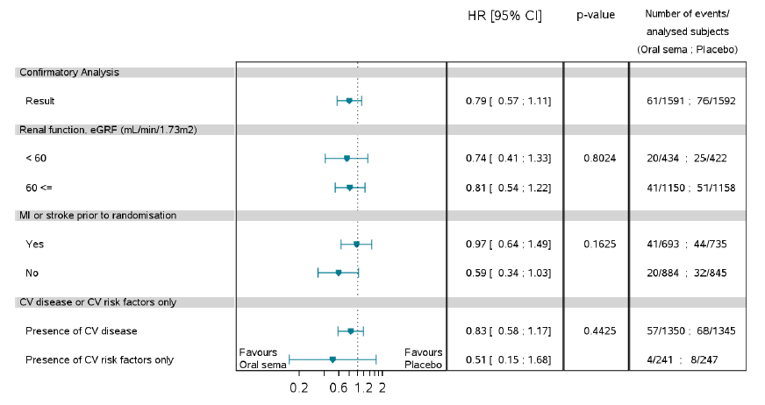
BMI = body mass index; CV = cardiovascular; eGRF = estimated glomerular rate of filtration; HbA1c = glycated hemoglobin; HR = hazard ratio; MI = myocardial infarction; SEMA = semaglutide.
Source: Clinical Study Report.20
Health-related quality of life
HRQoL was not evaluated in PIONEER 6.
Health-related quality of life was evaluated in PIONEER 1 to 5, and 8 to 10 as an exploratory end point. The SF-36v2 was assessed in PIONEER 2 and 3 (Table 38), PIONEER 1, 5, and 8 (Table 40) and PIONEER 9 and 10 (Table 41). The IWQOL was assessed in PIONEER 3 (Table 38), PIONEER 8 (Table 40), and PIONEER 1 (data not shown). The DTSQ was assessed in PIONEER 4 (Table 39), and PIONEER 5 and 8 (Table 40). Lastly, the DTR-QOL was assessed in PIONEER 9 and 10 (Table 41). For this report, assessments of HRQoL at baseline and end of treatment (week 26, 52, or 78) have been presented. Forest plots detailing the domain scores and component summary scores of the SF-36v2 at week 26 for PIONEER 1 to 3, 5, and 8 to 10 are available in Appendix 3.
In PIONEER 1 to 3, 5, and 8 to 10, the change from baseline to end of treatment for the physical component summary score of the SF-36v2 ranged from –1.32 to 1.95 units for semaglutide treatment groups and –0.15 to 1.44 units for active comparator groups, and –0.10 to 0.72 units in placebo groups. The treatment group difference for semaglutide 14 mg compared to empagliflozin on the physical component summary score in PIONEER 2 was –1.00 units (95% CI, –1.88 to – 0.12, P = 0.0263). In PIONEER 5, the treatment group difference for semaglutide 14 mg compared to placebo was 1.98 units (95% CI, 0.57 to 3.39, P = 0.0058). For all other comparison made in PIONEER 1,3, 5, or 8 to 10, between-groups differences at end of treatment were observed to be small. The change from baseline to end of treatment for the mental component summary score of the SF-36v2 ranged from –2.09 to 0.68 units for semaglutide treatment groups and –2.82 to 0.23 units for comparator groups in PIONEER 1 to 3, 5, and 8 to 10. Numerical differences between treatment groups were small for the mental component summary score.
In PIONEER 3, the change from baseline to end of treatment (week 78) in terms of the IWQOL ranged from 3.59 to 4.49 among the semaglutide tablets treatment groups, and was 3.07 for the sitagliptin treatment group. The between-groups differences were observed to be small numerically for comparisons of semaglutide tablets to sitagliptin. In PIONEER 8, the change from baseline to end of treatment (week 52) in terms of the IWQOL ranged from –0.03 to 1.77 among the semaglutide tablets treatment groups, and was –0.23 for the placebo group. The treatment group difference for semaglutide 14 mg compared to placebo was 4.09 units (95% CI, 1.20 to 6.99, P = 0.0056); all other differences between groups were observed to be small. Total scores for the IWQOL were not provided for PIONEER 1; however, the sponsor reported that all individual domain scores of the IWQOL-Lite-CT questionnaire were similar across treatment groups at baseline.12 Further, the sponsor also reported that changes from baseline at week 26 (end of treatment) were modest in all treatment groups and did not markedly differ between any semaglutide tablets treatment group and placebo.12
PIONEER 4, 5, and 8 evaluated HRQoL by the DTSQ up to 52 weeks. In PIONEER 4, the treatment group difference for change from baseline to week 52 on the DTSQ for semaglutide 14 mg compared to placebo was 2.20 units (95% CI, 1.11 to 3.29, P < 0.0001), and –0.05 units (95% CI, –0.94 to 0.84, P = 0.9163) for the comparison of semaglutide 14 mg to liraglutide. For comparisons to placebo, a between-groups difference of 0.36 units (95% CI, –0.86 to 1.58, P = 0.5650 was reported for the semaglutide 14 mg treatment group in PIONEER 5 and 0.78 units (95% CI, –0.41 to 1.98, P = 0.1982 for the semaglutide 3 mg treatment group in PIONEER 8. The between-groups difference for semaglutide 7 mg and semaglutide 14 mg compared to placebo in PIONEER 8 was 1.28 units (95% CI, 0.09 to 2.47; P = 0.0350) and 2.19 units (95% CI, 0.98 to 3.40, P = 0.0004), respectively.
PIONEER 9 and 10 included a Japanese measure of diabetes-related HRQoL, the DTR-QOL. At week 52 in PIONEER 9, the change from baseline ranged from 6.44 to 6.96 units across semaglutide treatment groups, was –0.01 units for placebo, and 6.66 units for liraglutide. The treatment group difference was in favour for all comparisons to placebo and no difference was shown for all comparisons to liraglutide. In PIONEER 10, the change form baseline to week 52 ranged from 3.48 to 8.13 units across semaglutide treatment groups, and was 3.35 units for the dulaglutide treatment group. This corresponded to a between-groups difference of 3.93 units (95% CI, 0.15 to 7.71, P = 0.0415) and 4.78 units (95% CI, 0.99 to 8.58, P = 0.0135) for the comparison between semaglutide 7 mg and semaglutide 14 mg to dulaglutide only, respectively.
The CoEQ was also assessed in PIONEER 2 and 3 and the results at week 26 have been provided in Appendix 3.
Table 38: Health-related quality of life (Active-controlled studies, add-on to 1 to 2 OADs; FAS)
Health-related quality of life | PIONEER 2 | PIONEER 3 | ||||
|---|---|---|---|---|---|---|
SEM 14 mg N = 411 | EMPA 25 mg N = 410 | SEM 3 mg N = 466 | SEM 7 mg N = 465 | SEM 14 mg N = 465 | SIT 100 mg N = 467 | |
SF-36v2 (units)a – Physical Component Summary | ||||||
Number of patients contributing to the analysis | 411 | 410 | 466 | 465 | 464 | 467 |
Baseline, mean (SD) | 50.0 (7.5) | 49.3 (8.0) | 48.8 (8.0) | 49.6 (7.4) | 49.3 (7.8) | 49.1 (7.7) |
End of study | ||||||
Week 52, mean (SE)b | 50.09 | 51.09 | N/A | N/A | N/A | N/A |
Week 78, mean (SE)b | N/A | N/A | 49.37 | 50.04 | 49.82 | 49.76 |
Change from baseline to end of treatment, mean (SE)b | 0.44 | 1.44 | 0.17 | 0.84 | 0.62 | 0.55 |
Treatment group difference vs. control (95% CI) | –1.00 (–1.88 to – 0.12) | –0.39 (–1.20 to 0.43) | 0.28 (–0.52 to 1.09) | 0.06 (–0.74 to 0.87) | ||
P valuec | 0.0263 | 0.3523 | 0.4930 | 0.8752 | ||
SF-36v2 (units)a – Mental Component Summary | ||||||
Number of patients contributing to the analysis | 411 | 410 | 466 | 465 | 464 | 467 |
Baseline, mean (SD) | 49.8 (9.0) | 50.1 (9.8) | 50.7 (9.6) | 50.0 (9.9) | 50.5 (9.5) | 50.1 (9.0) |
End of study | ||||||
Week 52, mean (SE)b | 50.17 | 49.97 | N/A | N/A | N/A | N/A |
Week 78, mean (SE)b | N/A | N/A | 50.73 | 50.79 | 50.44 | 50.56 |
Change from baseline, mean (SE)b | 0.23 | 0.02 | 0.40 | 0.46 | 0.11 | 0.23 |
Treatment group difference vs. control (95% CI) | 0.20 (–0.93 to 1.33) | N/A | 0.17 (–0.91 to 1.25) | 0.23 (–0.86 to 1.32) | –0.12 (–1.22 to 0.97) | N/A |
P valuec | 0.7240 | N/A | 0.7560 | 0.6797 | 0.8239 | N/A |
IWQOLa – Total Score | ||||||
Number of patients contributing to the analysis | NR | NR | 466 | 464 | 464 | 467 |
Baseline, mean (SD) | NR | NR | 72.06 (20.45) | 70.79 (20.62) | 71.64 (20.23) | 72.40 (19.63) |
End of treatment time point (Week 78), mean (SE)b | NR | NR | 75.42 | 76.21 | 75.31 | 74.79 |
Change from baseline, mean (SE)b | NR | NR | 3.70 | 4.49 | 3.59 | 3.07 |
Treatment group difference vs. control (95% CI) | NR | NR | 0.63 (–1.08 to 2.34) | 1.42 (–0.31 to 3.15) | 0.52 (–1.22 to 2.27) | N/A |
P valuec | NR | NR | 0.4705 | 0.1068 | 0.5571 | N/A |
CI = confidence interval; EMPA = empagliflozin; FAS = full analysis set; IWQOL = Impact of Weight on Quality of Life; PBO = placebo; SD = standard deviation; SE = standard error; SEM = semaglutide; SF-36v2 = Short-Form Health Survey version 2; SIT = sitagliptin.
aData presented corresponds to the treatment policy estimand, using the in-trial observation period. Missing post-baseline values were imputed by a pattern mixture model using multiple imputation. Pattern was defined by treatment arm and treatment status (premature treatment discontinuation and/or initiation of rescue medication), and multiple imputations were based on an ANCOVA model. Multiple imputation was from own treatment arm and same treatment status. Change from baseline was analyzed using an ANCOVA model with treatment, strata, and region as categorical fixed effects and baseline value as covariate for each of the 1000 imputed complete datasets, and pooled by Rubin's rule to draw inference.
bStandard error was not reported.
cP-value has not been adjusted for multiple testing.
Source: PIONEER 2 and PIONEER 3 Clinical Study Reports.13,14
Table 39: Health-related quality of life – DTSQ (Active-controlled trials, add-on to 1 to 2 OADs; FAS)
Health-related quality of life | PIONEER 4 | ||
|---|---|---|---|
SEM 14 mg N = 285 | LIRA 1.8 mg N = 284 | PBO N = 142 | |
DTSQ (units)a Total treatment satisfaction | |||
Number of patients contributing to the analysis | 285 | 283 | 142 |
Baseline, mean (SD) | 28.45 (6.28) | 28.76 (6.14) | 28.42 (5.52) |
End of treatment time point (Week 52), mean (SE)b | 31.83 | 31.88 | 29.63 |
Change from baseline, mean (SE)b | 3.26 | 3.31 | 1.06 |
Treatment group difference vs. control (95% CI) | –0.05 (–0.94 to 0.84) [vs. LIRA] 2.20 (1.11 to 3.29) [vs. PBO] | ||
P valuec | 0.9163 [vs. LIRA] < 0.0001 [vs. PBO] | ||
CI = confidence interval; DTSQ = Diabetes Treatment Satisfaction Questionnaire; FAS = full analysis set; LIRA = liraglutide; PBO = placebo; SD = standard deviation; SE = standard error; SEM = semaglutide.
aData presented corresponds to the treatment policy estimand, using the in-trial observation period. Missing post-baseline values were imputed by a pattern mixture model using multiple imputation. Pattern was defined by treatment arm and treatment status (premature treatment discontinuation and/or initiation of rescue medication), and multiple imputations were based on an ANCOVA model. Multiple imputation was from own treatment arm and same treatment status. Change from baseline was analyzed using an ANCOVA model with treatment, strata, and region as categorical fixed effects and baseline value as covariate for each of the 1000 imputed complete datasets, and pooled by Rubin's rule to draw inference.
bStandard error was not reported.
cP-value has not been adjusted for multiple testing.
Source: PIONEER 4 Clinical Study Report.15
Table 40: Health-related quality of life (Placebo-controlled trials; FAS)
Health-related quality of life | PIONEER 1 | PIONEER 5 | PIONEER 8 | |||||||
|---|---|---|---|---|---|---|---|---|---|---|
SEM 3 mg N = 175 | SEM 7 mg N = 175 | SEM 14 mg N = 175 | PBO N = 178 | SEM 14 mg N = 163 | PBO N = 161 | SEM 3 mg N = 184 | SEM 7 mg N = 182 | SEM 14 mg N = 181 | PBO N= 184 | |
SF-36v2 (units)a – Physical Component Summary | ||||||||||
Number of patients contributing to the analysis | 173 | 175 | 174 | 178 | 163 | 161 | 184 | 181 | 181 | 184 |
Baseline, mean (SD) | 51.40 (6.65) | 50.86 (7.65) | 51.28 (7.06) | 51.19 (7.41) | 43.7 (9.0) | 44.4 (8.9) | 46.89 (8.80) | 47.97 (7.96) | 48.27 (8.04) | 48.54 (8.73) |
End of study | ||||||||||
Week 26, mean (SE)b | 51.58 | 51.66 | 52.27 | 51.90 | 45.98 | 44.00 | N/A | N/A | N/A | N/A |
Week 52, mean (SE)b | N/A | N/A | N/A | N/A | N/A | N/A | 47.93 | 48.30 | 47.52 | 47.82 |
Change from baseline, mean (SE)b | 0.40 | 0.48 | 1.09 | 0.72 | 1.95 | –0.03 | 0.02 | 0.38 | –0.40 | –0.10 |
Treatment group difference vs. control (95% CI) | –0.32 (–1.45 to 0.82) | –0.24 (–1.45 to 0.96) | 0.37 (–0.88 to 1.62) | N/A | 1.98 (0.57 to 3.39) | N/A | 0.12 (–1.17 to 1.41) | 0.48 (–0.84 to 1.81) | –0.30 (–1.58 to 0.98) | N/A |
P valuec | 0.5820 | 0.6953 | 0.5601 | N/A | 0.0058 | N/A | 0.8593 | 0.4746 | 0.6484 | N/A |
SF-36v2 (units)a – Mental Component Summary | ||||||||||
Number of patients contributing to the analysis | 173 | 175 | 174 | 178 | 163 | 161 | 184 | 182 | 181 | 184 |
Baseline, mean (SD) | 52.20 (6.35) | 51.23 (7.00) | 51.70 (6.72) | 51.45 (6.88) | 49.7 (10.0) | 49.7 (10.0) | 49.65 (9.56) | 50.45 (9.64) | 48.34 (10.44) | 51.59 (8.53) |
End of study | ||||||||||
Week 26, mean (SE)b | 50.62 | 49.98 | 51.41 | 50.34 | 49.99 | 49.31 | N/A | N/A | N/A | N/A |
Week 52, mean (SE)b | N/A | N/A | N/A | N/A | N/A | N/A | 49.87 | 49.48 | 50.10 | 48.60 |
Change from baseline, mean (SE)b | –0.12 | –0.76 | 0.68 | –0.40 | 0.29 | –0.39 | –0.15 | –0.53 | 0.09 | –1.41 |
Treatment group difference vs. control (95% CI) | 0.28 (–1.47 to 2.03) | –0.36 (–2.89 to 2.17) | 1.08 (–0.69 to 2.85) | N/A | 0.68 (–1.23 to 2.59) | N/A | 1.27 (–0.41 to 2.94) | 0.88 (–0.80 to 2.57) | 1.50 (–0.18 to 3.18) | N/A |
P valuec | 0.7525 | 0.7810 | 0.2325 | N/A | 0.4841 | N/A | 0.1384 | 0.3049 | 0.0793 | N/A |
IWQOLa,d – Total Score | ||||||||||
Number of patients contributing to the analysis | NR | NR | NR | NR | NR | NR | 184 | 181 | 181 | 184 |
Baseline, mean (SD) | NR | NR | NR | NR | NR | NR | 66.68 (20.32) | 69.60 (20.30) | 68.00 (20.30) | 71.15 (18.31) |
End of Study | ||||||||||
End of treatment time point (Week 52), mean (SE)b | NR | NR | NR | NR | NR | NR | 70.63 | 68.83 | 72.72 | 68.62 |
Change from baseline, mean (SE)b | NR | NR | NR | NR | NR | NR | 1.77 | –0.03 | 3.86 | –0.23 |
Treatment group difference vs. control (95% CI) | NR | NR | NR | NR | NR | NR | 2.01 (–0.84 to 4.85) | 0.21 (–2.72 to 3.14) | 4.09 (1.20 to 6.99) | N/A |
P valuec | NR | NR | NR | NR | NR | NR | 0.1672 | 0.8883 | 0.0056 | N/A |
DTSQ (units)a – Total treatment satisfaction | ||||||||||
Number of patients contributing to the analysis | NR | NR | NR | NR | 163 | 160 | 184 | 181 | 181 | 184 |
Baseline, mean (SD) | NR | NR | NR | NR | 27.48 (6.20) | 26.41 (7.09) | 26.63 (6.11) | 26.25 (6.78) | 26.98 (6.55) | 27.52 (6.17) |
End of study | ||||||||||
Week 26, mean (SE)b | NR | NR | NR | NR | 29.94 | 29.58 | N/A | N/A | N/A | N/A |
Week 52, mean (SE)b | NR | NR | NR | NR | N/A | N/A | 28.87 | 29.37 | 30.28 | 28.09 |
Change from baseline, mean (SE)b | NR | NR | NR | NR | 2.99 | 2.63 | 2.02 | 2.52 | 3.43 | 1.24 |
Treatment group difference vs. control (95% CI) | NR | NR | NR | NR | 0.36 (–0.86 to 1.58) | N/A | 0.78 (–0.41 to 1.98) | 1.28 (0.09 to 2.47) | 2.19 (0.98 to 3.40) | N/A |
P valuec | NR | NR | NR | NR | 0.5650 | N/A | 0.1982 | 0.0350 | 0.0004 | N/A |
CI = confidence interval; FAS = full analysis set; PBO = placebo; SD = standard deviation; SE = standard error; SEM = semaglutide; SF-36v2 = Short-Form Health Survey version 2; SIT = sitagliptin.
aData presented corresponds to the treatment policy estimand, using the in-trial observation period. Missing post-baseline values were imputed by a pattern mixture model using multiple imputation. Pattern was defined by treatment arm and treatment status (premature trial product discontinuation and/or initiation of rescue medication), and multiple imputations were based on an ANCOVA model. Multiple imputation was from own treatment arm and same treatment status. Change from baseline was analyzed using an ANCOVA model with treatment, strata, and region as categorical fixed effects and baseline value as covariate for each of the 1000 imputed complete datasets, and pooled by Rubin's rule to draw inference.
bStandard error was not reported.
cP-value has not been adjusted for multiple testing.
dIWQOL was also assessed in PIONEER 1; however, the total score was not reported. The results of the individual domain scores have been summarized in text.
Source: PIONEER 1, PIONEER 5, and PIONEER 8 Clinical Study Reports.12,16,17
Table 41: Health-related quality of life (Population-specific supportive studies; FAS)
Health-related quality of life | PIONEER 9 | PIONEER 10 | |||||||
|---|---|---|---|---|---|---|---|---|---|
SEM 3 mg N = 49 | SEM 7 mg N = 49 | SEM 14 mg N = 48 | PBO N = 49 | LIRA 0.9 mg N = 48 | SEM 3 mg N = 131 | SEM 7 mg N = 132 | SEM 14 mg N = 130 | DULA N = 65 | |
SF-36v2 (units)a,b – Physical Component Summary | |||||||||
Number of patients contributing to the analysis | 49 | 49 | 48 | 49 | 48 | 131 | 132 | 130 | 65 |
Baseline, mean (SD) | 54.33 (3.46) | 54.60 (4.25) | 54.18 (3.76) | 54.47 (3.83) | 54.21 (4.15) | 53.87 (4.00) | 53.22 (4.96) | 53.39 (4.02) | 53.73 (5.17) |
End of study | |||||||||
Week 52, mean (SE)c | 53.03 | 54.19 | 54.03 | 54.52 | 54.77 | 52.83 | 53.53 | 53.41 | 53.37 |
Change from baseline, mean (SE)c | –1.32 | –0.17 | –0.33 | 0.17 | 0.42 | –0.70 | 0.00 | –0.12 | –0.15 |
Treatment group difference vs. control (95% CI) | –1.49 (–3.19 to 0.21) [vs. PBO] –1.74 (–3.49 to 0.01) [vs. LIRA] | –0.33 (–1.98 to 1.32) [vs. PBO] –0.58 (–2.30 to 1.14) [vs. LIRA] | –0.50 (–2.17 to 1.17) [vs. PBO] –0.75 (–2.48 to 0.99) [vs. LIRA] | N/A | N/A | –0.55 (–1.86 to 0.77) | 0.16 (–1.15 to 1.46) | 0.03 (–1.28 to 1.35) | N/A |
P valued | 0.0854[vs. PBO] 0.0514 [vs. LIRA] | 0.6928[vs. PBO] 0.5086 [vs. LIRA] | 0.5593[vs. PBO] 0.4000 [vs. LIRA] | N/A | N/A | 0.4142 | 0.8135 | 0.9594 | N/A |
SF-36v2 (units)a,b – Mental Component Summary | |||||||||
Number of patients contributing to the analysis | 49 | 49 | 48 | 49 | 48 | 131 | 132 | 130 | 65 |
Baseline, mean (SD) | 53.56 (6.49) | 54.58 (5.08) | 53.94 (5.79) | 55.00 (5.20) | 54.60 (5.38) | 52.69 (6.97) | 52.35 (6.99) | 53.33 (6.30) | 52.54 (6.98) |
End of study | |||||||||
Week 52, mean (SE)c | 53.86 | 53.65 | 52.25 | 51.51 | 53.82 | 51.32 | 52.44 | 52.71 | 51.90 |
Change from baseline, mean (SE)c | –0.48 | –0.69 | –2.09 | –2.82 | –0.52 | –1.44 | –0.32 | –0.05 | –0.86 |
Treatment group difference vs. control (95% CI) | 2.34 (–0.16 to 4.85) [vs. PBO] 0.04 (–2.59 to 2.67) [vs. LIRA] | 2.13 (–0.27 to 4.54) [vs. PBO] –0.17 (–2.73 to 2.39) [vs. LIRA] | 0.73 (–1.71 to 3.18) [vs. PBO] –1.57 (–4.17 to 1.03) [vs. LIRA] | N/A | N/A | –0.58 (–2.53 to 1.37) | 0.54 (–1.40 to 2.48) | 0.81 (–1.13 to 2.75) | N/A |
P valued | 0.0667 [vs. PBO] 0.9757 [vs. LIRA] | 0.0819 [vs. PBO] 0.8971 [vs. LIRA] | 0.5569 [vs. PBO] 0.2375 [vs. LIRA] | N/A | N/A | 0.5616 | 0.5853 | 0.4140 | N/A |
DTR-QOL (units)e – Total score | |||||||||
Number of patients contributing to the analysis | 49 | 49 | 48 | 49 | 48 | 131 | 132 | 130 | 65 |
Baseline, mean (SD) | 70.61 (16.66) | 76.10 (14.78) | 70.55 (17.30) | 73.46 (14.01) | 73.21 (15.65) | 71.46 (15.69) | 71.74 (14.75) | 71.16 (14.13) | 71.94 (16.20) |
End of treatment time point (Week 52), mean (SE)c | 79.25 | 79.78 | 79.61 | 72.81 | 79.47 | 75.00 | 78.80 | 79.65 | 74.87 |
Change from baseline, mean (SE)c | 6.44 | 6.96 | 6.79 | –0.01 | 6.66 | 3.48 | 7.28 | 8.13 | 3.35 |
Treatment group difference vs. control (95% CI) | 6.45 (0.78 to 12.11) [vs. PBO] –0.22 (–5.67 to 5.23) [vs. LIRA] | 6.97 (1.41 to 12.53) [vs. PBO] 0.30 (–5.05 to 5.66) [vs. LIRA] | 6.80 (1.20 to 12.41) [vs. PBO] 0.14 (–5.24 to 5.52) [vs. LIRA] | N/A | N/A | 0.13 (–3.67 to 3.93) | 3.93 (0.15 to 7.71) | 4.78 (0.99 to 8.58) | N/A |
P valued | 0.0259 [vs. PBO] 0.9367 [vs. LIRA] | 0.0142 [vs. PBO] 0.9111 [vs. LIRA] | 0.0176 [vs. PBO] 0.9600 [vs. LIRA] | N/A | N/A | 0.9460 | 0.0415 | 0.0135 | N/A |
CI = confidence interval; EMPA = empagliflozin; MET = metformin; SD = standard deviation; SE = standard error; SEM = semaglutide; SF-36v2 = Short Form-36 Health Survey
aPIONEER 9: Data presented corresponds to the treatment policy estimand, using the in-trial observation period. Missing post-baseline values were imputed by a pattern mixture model using multiple imputation. Pattern was defined by treatment arm and treatment status, and multiple imputations were based on an ANCOVA model. Multiple imputation was done within 6 (6) groups of subjects; 1 (1) group of subjects regardless of randomized treatment arm who at week 26 (or week 52) had discontinued treatment or initiated rescue medication, and 5 (5) groups of subjects defined by randomized treatment arm for subjects that were still on treatment and had not initiated rescue medication. Change from baseline was analyzed using an ANCOVA model with treatment and strata as categorical fixed effects and baseline value as covariate for each of the 1000 imputed complete datasets, and pooled by Rubin's rule to draw inference.
bPIONEER 10: Data presented corresponds to the treatment policy estimand, using the in-trial observation period. Missing post-baseline values were imputed by a pattern mixture model using multiple imputation. Pattern was defined by treatment arm and treatment status (premature treatment discontinuation and/or initiation of rescue medication), and multiple imputations were based on an ANCOVA model. Multiple imputation was from own treatment arm and same treatment status. Change from baseline was analyzed using an ANCOVA model with treatment and region as categorical fixed effects and baseline value as covariate for each of the 1000 imputed complete datasets, and pooled by Rubin’s rule to draw inference.
cStandard Error was not reported.
dP-value has not been adjusted for multiple testing.
eData from the on-treatment without rescue medication period. Changes from baseline were analyzed using a mixed model for repeated measurements model with treatment and strata as categorical fixed effects and baseline value as covariate, all nested within visit, and an unstructured residual covariance matrix.
Source: PIONEER 9 and PIONEER 10 Clinical Study Reports.18,19
Blood pressure
Blood pressure was reported as a safety outcome in the included PIONEER trials.
For active-controlled trials, the change from baseline in blood pressure is provided in Table 42. In PIONEER 2, the change from baseline to end of study (week 52) in SBP was –5 mm Hg and –4 mm Hg, for semaglutide and empagliflozin treatment groups respectively; the change in DBP was –3 mm Hg and –3 mm Hg, respectively. In PIONEER 3, the change from baseline to end of study (week 78) in SBP ranged from –2 mm Hg to –3 mm Hg across semaglutide treatment groups and was –0 for the sitagliptin group; DBP reported a difference of –1 mm Hg in all treatment groups at end of study In PIONEER 4, SBP from baseline to end of study (week 52) changed by –3 mm Hg in both the semaglutide and liraglutide treatment groups, and by 0 for placebo; DBP changed by –1 mm Hg for both semaglutide and liraglutide, and by 0 mm Hg for placebo.
Table 42: Blood pressure (Active-controlled trials, add-on to 1 to 2 OADs; SAS)
Blood pressure | PIONEER 2 | PIONEER 3 | PIONEER 4 | ||||||||
|---|---|---|---|---|---|---|---|---|---|---|---|
SEM 14 mg N = 410 | EMPA 25 mg N = 409 | SEM 3 mg N = 466 | SEM 7 mg N = 464 | SEM 14 mg N = 465 | SIT 100 mg N = 466 | SEM 14 mg N = 285 | LIRA 1.8 mg N = 284 | PBO N = 142 | |||
Systolic blood pressure (mmHg)a | |||||||||||
Number of patients contributing to the analysis | 410 | 409 | 466 | 464 | 465 | 466 | 285 | 284 | 142 | ||
Baseline, mean (SD) | 132 (15) | 132 (15) | 134 (15) | 134 (14) | 134 (16) | 134 (16) | 132 (13) | 132 (14) | 132 (13) | ||
End of study | |||||||||||
Week 52, mean (SE)b | 128 | 128 | N/A | N/A | N/A | N/A | 129 | 129 | 132 | ||
Week 78, mean (SE)b | NR | NR | 132 | 130 | 131 | 133 | NR | NR | NR | ||
Change from baseline, mean (SE)b | –5 | –4 | –2 | –3 | –3 | 0 | –3 | –3 | –0 | ||
Treatment group difference vs. control (95% CI) | –1 (–2 to 1) | N/A | –1 (–3 to 0 | –3 (–5 to –1) | –2 (–4 to –0) | N/A | –0 (–3 to 2) [vs. LIRA] –3 (–6 to –1) [vs. PBO] | N/A | N/A | ||
P value | 0.5731c | N/A | 0.1225c | 0.0016c | 0.0122c | N/A | 0.6350c [vs. LIRA] 0.0146c [vs. PBO] | N/A | N/A | ||
Diastolic blood pressure (mmHg) a | |||||||||||
Number of patients contributing to the analysis | 410 | 409 | 466 | 464 | 465 | 466 | 285 | 284 | 142 | ||
Baseline, mean (SD) | 81 (9) | 80 (9) | 80 (10) | 80 (10) | 80 (10) | 80 (10) | 80 (8) | 80 (9) | 80 (9) | ||
End of study | |||||||||||
Week 52, mean (SE)b | 78 | 77 | N/A | N/A | N/A | N/A | 79 | 79 | 81 | ||
Week 78, mean (SE)b | NR | NR | 79 | 79 | 79 | 79 | NR | NR | NR | ||
Change from baseline, mean (SE)b | –3 | –3 | –1 | –1 | –1 | –1 | –1 | –1 | 0 | ||
Treatment group difference vs. control (95% CI) | 0 (–1 to 2) | N/A | –0 (–1 to 1) | 0 (–1 to 1) | 0 (–1 to 1) | N/A | –0 (–1 to 1) [vs. LIRA] –2 (–3 to –0) [vs. PBO] | N/A | N/A | ||
P value | 0.5284c | N/A | 0.6882c | 0.8398c | 0.9578c | N/A | 0.9314c [vs. LIRA] 0.0178c [vs. PBO] | N/A | N/A | ||
CI = confidence interval; LIRA = liraglutide; mmHg = millimetre mercury; PBO = placebo; SD = standard deviation; SE = standard error; SEM = semaglutide; SIT = sitagliptin.
aData from the on-treatment observation period. Changes from baseline were analyzed using a mixed model for repeated measurements model with treatment, strata, and region as categorical fixed effects and baseline value as covariate, all nested within visit, and an unstructured residual covariance matrix.
bStandard error was not reported.
cP-value has not been adjusted for multiple testing.
Source: PIONEER 2, PIONEER 3, and PIONEER 4 Clinical Study Reports.13-15
Blood pressure outcomes reported in placebo-controlled trials are presented in Table 43. At the end of study (week 26) in PIONEER 1, the change in SBP ranged from –3 mm Hg to –5 mm Hg in semaglutide treatment groups and was –3 mm Hg in the placebo treatment group; DBP changed by –1 mm Hg to –2 mm Hg across semaglutide treatment groups and was –1 mm Hg in the placebo treatment group. In PIONEER 5, the change from baseline to end of study (week 26) was –7 mm Hg for SBP and –2 mm Hg for DBP in the semaglutide 14 mg treatment group compared to a change of 0 mm Hg and 1 mm Hg for placebo. In PIONEER 8, the change from baseline to end of study (week 52) in SBP ranged from –1 mm Hg to –6 mm Hg for semaglutide treatments groups and –0 mm Hg for placebo, and the DBP ranged from 0 mm Hg to –2 mm Hg across both semaglutide and placebo treatment groups.
Table 43: Blood pressure (Placebo-controlled trials; SAS)
Blood pressure | PIONEER 1 | PIONEER 5 | PIONEER 8 | ||||||||
|---|---|---|---|---|---|---|---|---|---|---|---|
SEM 3 mg N = 175 | SEM 7 mg N = 175 | SEM 14 mg N = 175 | PBO N = 178 | SEM 14 mg N = 163 | PBO N = 161 | SEM 3 mg N = 184 | SEM 7 mg N = 181 | SEM 14 mg N = 181 | PBO N= 184 | ||
Systolic blood pressure (mmHg)a | |||||||||||
Number of patients contributing to the analysis | 175 | 175 | 175 | 178 | 163 | 161 | 184 | 181 | 181 | 184 | |
Baseline, mean (SD) | 129 (14) | 132 (14) | 129 (14) | 129 (16) | 139 (16) | 137 (15) | 133 (14) | 133 (14) | 134 (15) | 133 (15) | |
End of study | |||||||||||
Week 26, mean (SE)b | 126 | 127 | 125 | 127 | 131 | 137 | N/A | N/A | N/A | N/A | |
Week 52, mean (SE)b | NR | NR | NR | NR | NR | NR | 132 | 131 | 128 | 133 | |
Change from baseline, mean (SE)b | –3 | –5 | –5 | –3 | –7 | –0 | –1 | –3 | –6 | –0 | |
Treatment group difference vs. control (95% CI) | –1 (–4 to 2) | –1 (–4 to 1) | –2 (–5 to 0) | N/A | –7 (–9 to –4) | N/A | –1 (–4 to 2) | –2 (–5 to 1) | –5 (–8 to –2) | N/A | |
P value | 0.4394 | 0.2893 | 0.0704 | N/A | < 0.0001 | N/A | 0.5239 | 0.1296 | 0.0005 | N/A | |
Diastolic blood pressure (mmHg) a | |||||||||||
Number of patients contributing to the analysis | 175 | 175 | 175 | 178 | 163 | 161 | 184 | 181 | 181 | 184 | |
Baseline, mean (SD) | 80 (10) | 81 (9) | 80 (10) | 79 (9) | 77 (10) | 78 (9) | 78 (9) | 78 (10) | 77 (10) | 77 (9) | |
End of study | |||||||||||
Week 26, mean (SE)b | 79 | 79 | 78 | 79 | 76 | 78 | N/A | N/A | N/A | N/A | |
Week 52, mean (SE)b | NR | NR | NR | NR | NR | NR | 77 | 77 | 76 | 77 | |
Change from baseline, mean (SE)b | –1 | –2 | –1 | –1 | –2 | 1 | –1 | –2 | –2 | 0 | |
Treatment group difference vs. control (95% CI) | –0 (–2 to 1) | –1 (–2 to 1) | –1 (–2 to 1) | N/A | –3 (–5 to –1) | N/A | –0 (–2 to 1) | –1 (–3 to 1) | –1 (–3 to 1) | N/A | |
P valuec | 0.8613 | 0.4924 | 0.4931 | N/A | 0.0018 | N/A | 0.6562 | 0.2688 | 0.2321 | N/A | |
CI = confidence interval; LIRA = liraglutide; mmHg = millimetre mercury; PBO = placebo; SD = standard deviation; SE = standard error; SEM = semaglutide.
aData from the on-treatment observation period. Changes from baseline were analyzed using a mixed model for repeated measurements model with treatment, strata, and region as categorical fixed effects and baseline value as covariate, all nested within visit, and an unstructured residual covariance matrix.
bStandard error was not reported.
cP-value has not been adjusted for multiple testing.
Source: PIONEER 1, PIONEER 5, PIONEER 8 Clinical Study Reports.12,16,17
Blood pressure outcomes for PIONEER 6 were reported descriptively (Table 44). The SBP and DBP was 135 mm Hg and 76 mm Hg, respectively, at baseline for the semaglutide 14 mg treatment group. The SBP and DBP was 136 mm Hg and 76 mm Hg, respectively, at baseline for the placebo treatment group. For semaglutide 14 mg, the SBP changed by a mean of –5 mm Hg (SD, 18) from baseline to end of treatment, and the DBP changed by a mean of –1 mm Hg (SD, 11) for the same period. For placebo, the SBP changed by a mean of –2 mm Hg (SD, 18) from baseline to end of treatment, and the DBP changed by a mean of –2 mm Hg (SD, 10) for the same period.
Table 44: Blood pressure (CVOT; FAS)
Blood pressure | PIONEER 6 | |
|---|---|---|
SEM 14 mg N = 1591 | PBO 25 mg N = 1592 | |
Systolic blood pressure (mmHg), mean (SD) | ||
Baseline | 135 (18) | 136 (18) |
End of treatment | 131 (17) | 134 (16) |
Change from baseline | –5 (18) | –2 (18) |
Diastolic blood pressure (mmHg), mean (SD) | ||
Baseline | 76 (10) | 76 (10) |
End of treatment | 75 (10) | 74 (10) |
Change from baseline | –1 (11) | –2 (10) |
mmHg = millimetre of mercury; PBO = placebo; SD = standard deviation; SEM = semaglutide.
Source: PIONEER 6 Clinical Study Report.20
Blood pressure outcomes for PIONEER 9 and 10 are presented in Table 45.
In PIONEER 9, the change from baseline to end of study (week 52) ranged from –1 mm Hg to –2 mm Hg in semaglutide treatment groups, –3 mm Hg in the placebo treatment group, and 1 mm Hg in the liraglutide treatment group. DBP ranged from 0 mm Hg to –1 mm Hg in semaglutide treatment groups, –2 mm Hg and 1 mm Hg for the placebo and liraglutide treatment groups, respectively. In PIONEER 10, the change from baseline in SBP to end of study (week 52) was –2 mm Hg for all semaglutide treatment groups and –1 mm Hg for the dulaglutide group; DBP ranged from 0 mm Hg to –1 mm Hg in semaglutide treatment groups and did not change in the dulaglutide treatment group (difference of 0 mm Hg).
Table 45: Blood pressure (Population-specific supportive studies; SAS)
Blood pressure | PIONEER 9 | PIONEER 10 | |||||||
|---|---|---|---|---|---|---|---|---|---|
SEM 3 mg N = 49 | SEM 7 mg N = 49 | SEM 14 mg N = 48 | PBO N = 49 | LIRA 0.9 mg N = 48 | SEM 3 mg N = 131 | SEM 7 mg N = 132 | SEM 14 mg N = 130 | DULA 0.75 mg N = 65 | |
Systolic blood pressure (mmHg)a | |||||||||
Number of patients contributing to the analysis | 49 | 49 | 48 | 49 | 48 | 131 | 132 | 130 | 65 |
Baseline, mean (SD) | 127 (14) | 129 (12) | 127 (13) | 128 (13) | 128 (13) | 132 (13) | 131 (14) | 130 (15) | 134 (15) |
End of treatment time point (Week 52), mean (SE)b | 127 | 127 | 126 | 125 | 129 | 129 | 129 | 129 | 130 |
Change from baseline, mean (SE)b | –1 | –1 | –2 | –3 | 1 | –2 | –2 | –2 | –1 |
Treatment group difference vs. control (95% CI) | 2 (–2 to 6) [vs. PBO] –1 (–6 to 3) [vs. LIRA] | 2 (–2 to 6) [vs. PBO] –1 (–6 to 3) [vs. LIRA] | 1 (–3 to 5) [vs. PBO] –2 (–7 to 2) [vs. LIRA] | N/A | N/A | –1 (–5 to 2) | –1 (–4 to 3) | –1 (–4 to 2) | N/A |
P valuec | 0.3048 [vs. PBO] 0.5078 [vs. LIRA] | 0.2838 [vs. PBO] 0.5212 [vs. LIRA] | 0.5570 [vs. PBO] 0.2756 [vs. LIRA] | N/A | N/A | 0.5031 | 0.6400 | 0.5772 | N/A |
Diastolic blood pressure (mmHg)a | |||||||||
Number of patients contributing to the analysis | 49 | 49 | 48 | 49 | 48 | 131 | 132 | 130 | 65 |
Baseline, mean (SD) | 76 (8) | 80 (10) | 76 (9) | 78 (12) | 81 (11) | 78 (10) | 79 (10) | 79 (12) | 81 (10) |
End of treatment time point (Week 52), mean (SE)b | 77 | 78 | 77 | 76 | 79 | 78 | 79 | 78 | 79 |
Change from baseline, mean (SE)b | –1 | 0 | –1 | –2 | 1 | –1 | 0 | –1 | 0 |
Treatment group difference vs. control (95% CI) | 1 (–2 to 4) [vs. PBO] –2 (–5 to 1) [vs. LIRA] | 2 (–1 to 5) [vs. PBO] –1 (–4 to 2) [vs. LIRA] | 1 (–2 to 4) [vs. PBO] –2 (–5 to 1) [vs. LIRA] | N/A | N/A | –1 (–4 to 2) | –0 (–3 to 2) | –1 (–4 to 1) | N/A |
P valuec | 0.4869 [vs. PBO] 0.1998 [vs. LIRA] | 0.1716 [vs. PBO] 0.5087 [vs. LIRA] | 0.4851 [vs. PBO] 0.2007 [vs. LIRA] | N/A | N/A | 0.4417 | 0.8837 | 0.3216 | N/A |
A1C = glycated hemoglobin; CI = confidence interval; DULA = dulaglutide; LIRA = liraglutide; mmHg = millimetre mercury; PBO = placebo; SD = standard deviation; SE = standard error; SEM = semaglutide.
aData from the on-treatment observation period. Changes from baseline were analyzed using a mixed model for repeated measurements model with treatment and strata as categorical fixed effects and baseline value as covariate, all nested within visit, and an unstructured residual covariance matrix.
bStandard error not reported.
cP-value has not been adjusted for multiple testing.
Source: PIONEER 9 and PIONEER 10 Clinical Study Report.18,19
Body weight and BMI
The results for change in body weight and BMI in active-controlled trials are summarized in Table 46.
At week 26, the change from baseline in body weight ranged from –1.2 kg to –4.4 kg across the semaglutide treatment groups in PIONEER 2 to 4. At week 26, body weight decreased by 3.8 kg and 3.7 kg for patients in the semaglutide and empagliflozin groups in PIONEER 2, decreased by 1.2 to 3.1 kg and 0.6. kg for patients in the semaglutide treatment groups and sitagliptin group, respectively, in PIONEER 3, and body weight decreased by 4.4 kg, 3.1 kg, and 0.5 kg for semaglutide, liraglutide, and placebo treatment groups in PIONEER 4. In terms of a reduction in body weight from baseline to week 26, semaglutide demonstrated superiority to sitagliptin with a between-groups difference of –1.6 kg (95% CI, –2.0 to –1.1, P < 0.0001) and –2.5 kg (95% CI, –3.0 to –2.0, P < 0.0001) for SEM 14 mg and 7 mg, respectively (PIONEER 3). A between-groups difference of –0.6 kg (95% CI, –1.1 to –0.1) for semaglutide 3 mg compared to sitagliptin was observed in PIONEER 3, and a difference of –1.2 kg (95% CI, –1.9 to –0.6) for semaglutide 14 mg compared to liraglutide was observed in PIONEER 4; however, the P values for these analyses must be interpreted as nominal due to a previously failed test. In PIONEER 2, a between-groups difference of –0.1 kg (95% CI, –0.7 to 0.5, P = 0.7593) was reported for semaglutide 14 mg compared to empagliflozin, which corresponded to no difference in treatment effect.
The results at the end of study (week 52 in PIONEER 2 and 4, week 78 in PIONEER 3) were consistent with those at week 26 in the 3 active-controlled studies.
In terms of change in BMI at end of study, a reduction of vvvv vvvvv vvv vvv vvvvv was reports for semaglutide 14 mg and empagliflozin in PIONEER 2 (week 52); a reduction of vvv vvvvv vv vvv vvvvv for semaglutide groups and vvv vvvvvv for sitagliptin in PIONEER 3 (week 78); and a reduction of vvv vvvvvv vvv vvvvvv vvv vvv vvvvv, for semaglutide, liraglutide, and placebo, respectively, in PIONEER 4 (week 52) was reported. The between-groups difference at end of study (week 52) was vvvv vvvvv for semaglutide 14 mg compared to empagliflozin (PIONEER 2). In PIONEER 3, the between groups difference for semaglutide 3 mg, 7 mg, and 14 mg compared to sitagliptin, was vvvv vvvvvv vvvv vvvvvv vvv vvvv vvvvv, respectively. In PIONEER 4, the between groups difference of semaglutide 14 mg compared to liraglutide and placebo was vvvv vvvvvv vvv vvvv vvvvv, respectively.
Table 46: Change from baseline in body weight and BMI (Active-controlled trials, add-on to 1 to 2 OADs; FAS)
Week, change from baseline | PIONEER 2 | PIONEER 3 | PIONEER 4 | ||||||
|---|---|---|---|---|---|---|---|---|---|
SEM 14 mg N = 411 | EMPA 25 mg N = 410 | SEM 3 mg N = 466 | SEM 7 mg N = 465 | SEM 14 mg N = 465 | SIT 100 mg N = 467 | SEM 14 mg N = 285 | LIRA 1.8 mg N = 284 | PBO N = 142 | |
Body weight (kg)a | |||||||||
Number of patients contributing to the analysis | 411 | 410 | 466 | 465 | 465 | 467 | 285 | 284 | 142 |
Baseline, mean (SD) | 91.9 (20.5) | 91.3 (20.1) | 91.6 (22.0) | 91.3 (20.8) | 91.2 (21.7) | 90.9 (21.0) | 92.9 (20.6) | 95.5 (21.9) | 93.2 (20.0) |
Week 26 | |||||||||
Week 26, mean (SE)b | 87.8 | 87.9 | 90.1 | 89.1 | 88.1 | 90.7 | 89.6 | 90.9 | 93.5 |
Change from baseline, mean (SE)b | –3.8 | –3.7 | –1.2 | –2.2 | –3.1 | –0.6 | –4.4 | –3.1 | –0.5 |
Treatment group difference vs. control (95% CI) | –0.1 (–0.7 to 0.5) | N/A | –0.6 (–1.1 to –0.1) | –1.6 (–2.0 to –1.1) | –2.5 (–3.0 to –2.0) | N/A | –1.2 (–1.9 to –0.6) [vs. LIRA] –3.8 (–4.7 to –3.0) [vs. PBO] | N/A | N/A |
P value | 0.7593 | N/A | 0.0185d | < 0.0001 | < 0.0001 | N/A | 0.0003 [vs. LIRA] < 0.0001 [vs. PBO] | N/A | N/A |
End of Study | |||||||||
Week 52, mean (SE)b | 87.8 | 88.0 | N/A | N/A | N/A | N/A | 89.7 | 91.0 | 93.0 |
Week 78, mean (SE)b | NR | NR | 89.4 | 88.5 | 88.1 | 90.2 | NR | NR | NR |
Change from baseline, mean (SE)b | –3.8 | –3.6 | –1.8 | –2.7 | –3.2 | –1.0 | –4.3 | -–3.0 | –1.0 |
Treatment group difference vs. control (95% CI) | –0.2 (–0.9 to 0.5) | N/A | –0.8 (–1.5 to –0.1) | –1.7 (–2.3 to –1.0) | –2.1 (–2.8 to –1.5) | N/A | –1.3 (–2.1 to –0.5) [vs. LIRA] –3.3 (–4.3 to–2.4) [vs. PBO] | N/A | N/A |
P valuec | 0.6231 | N/A | 0.0201 | < 0.0001 | < 0.0001 | N/A | 0.0019 [vs. LIRA] < 0.0001 [vs. PBO] | N/A | N/A |
BMI (kg/m2)a | |||||||||
Number of patients contributing to the analysis |
|
|
|
|
|
|
|
|
|
Baseline, mean (SD) |
|
|
|
|
|
|
|
|
|
Week 52, mean (SE)b |
|
|
|
|
|
|
|
|
|
Week 78, mean (SE)b |
|
|
|
|
|
|
|
|
|
Change from baseline, mean (SE)b |
|
|
|
|
|
|
|
|
|
Treatment group difference vs. control (95% CI) |
|
|
|
|
|
|
|
|
|
P value |
|
|
|
|
|
|
|
|
|
CI = confidence interval; FAS = full analysis set; LS = least squares; ITT = intention to treat; SD = standard deviation; SE = standard error.
aData presented corresponds to the treatment policy estimand, using the in-trial observation period. Missing post-baseline values were imputed by a pattern mixture model using multiple imputation. Pattern was defined by treatment arm and treatment status (premature treatment discontinuation and/or initiation of rescue medication), and multiple imputations were based on an ANCOVA model. Multiple imputation was from own treatment arm and same treatment status. Change from baseline was analyzed using an ANCOVA model with treatment, strata, and region as categorical fixed effects and baseline value as covariate for each of the 1000 imputed complete datasets, and pooled by Rubin's rule to draw inference.
bStandard error was not reported.
cP-value has not been adjusted for multiple testing.
dP-value cannot be used for inference due to a previously failed test in the statistical testing hierarchy. The P-value should be interpreted as nominal.”
Source: PIONEER 2, PIONEER 3, PIONEER 4 Clinical Study Reports.13-15
Subgroup analyses by background therapy were conducted in PIONEER 3 and 4 (Table 47 and Table 48, respectively). vvv vvvvvvvv vvvvvvvvv vvvvvv vv vvvvvvvvv vv vvvvvvv v vvv vvvvvvv v vvvv vvvvvvvvvv vvvv vvv vvvvvvv vvvvvvvvv
Table 47: Change from baseline in body weight by background therapy (PIONEER 3, active-controlled trials, add-on to 1 to 2 OADs; FAS)
Week, change from baseline | PIONEER 3 | |||||||
|---|---|---|---|---|---|---|---|---|
SEM 3 mg N = 466 | SEM 7 mg N = 465 | SEM 14 mg N = 465 | SIT 100 mg N = 467 | |||||
MET N = vvv | MET+SU N = vvv | MET N = vvv | MET+SU N = vvv | MET N = vvv | MET+SU N = vvv | MET N = vvv | MET+SU N = vvv | |
Body weight (kg)a | ||||||||
Number of patients contributing to the analysis |
|
|
|
|
|
|
|
|
Week 26 | ||||||||
Week 26, mean (SE) |
|
|
|
|
|
|
|
|
Change from baseline, mean (SE) |
|
|
|
|
|
|
|
|
Treatment group difference vs. control (95% CI) |
|
|
|
|
|
|
|
|
P valueb |
|
|
|
| ||||
Week 52 | ||||||||
Week 52, mean (SE)c |
|
|
|
|
|
|
|
|
Change from baseline, mean (SE)c |
|
|
|
|
|
|
|
|
Treatment group difference vs. control (95% CI) |
|
|
|
|
|
|
|
|
P valueb |
|
|
|
| ||||
Week 78 | ||||||||
Week 78, mean (SE) |
|
|
|
|
|
|
|
|
Change from baseline, mean (SE) |
|
|
|
|
|
|
|
|
Treatment group difference vs. control (95% CI) |
|
|
|
|
|
|
|
|
P valueb |
|
|
|
| ||||
A1C = glycated hemoglobin; CI = confidence interval; FAS = full analysis set; MET = metformin; SE = standard error; SEM = semaglutide; SIT = sitagliptin; SU = sulfonylurea.
v vvvv vvvvvvvvv vvvvvvvvvvv vv vvv vvvvvvvvv vvvvvv vvvvvvvvv vvvvv vvv vvvvvvvv vvvvvvvvvvv vvvvvvv vvvvvvv vvvvvvvvvvvvv vvvvvv vvvv vvvvvvv vv v vvvvvvv vvvvvvv vvvvv vvvvv vvvvvvvv vvvvvvvvvvv vvvvvvv vvv vvvvvvv vv vvvvvvvvv vvv vvv vvvvvvvvv vvvvvv vvvvvvvvvv vvvvvvvvv vvvvvvvvvvvvvvv vvvvvv vvvvvvvvvv vv vvvvvv vvvvvvvvvvvv vvv vvvvvvvvvvv vvvv vvvvv vv vv vvvvvv vvvvvv vvvvvvvvvv vvv vvvv vvv vvvvvvvvv vvv vvv vvvv vvvvvvvvv vvvvvvv vvvvvv vvvv vvvvvvvv vvv vvvvvvvv vvvvv vv vvvvvv vvvvv vvvv vvvvvvvvvv vvvvvvv vvvvvvv vvvvvvvvv vvv vvvvvvvvvvv vvvvvvv vvvvvvvvv vvv vvvvvvvv vv vvvvvvvvvvv vvvvv vvvvvvv vvv vvvvvvvv vvvvv vv vvvvvvvvv vvv vvvv vv vvv vvvv vvvvvvv vvvvvvvv vvvvvvvvv vvv vvvvvv vv vvvvvvv vvvv vv vvvv vvvvvvvvvv
v vvvv vvv vvvvvvvvv vv vvvvvvvv vvvvvvvvvvvv vvvvvvv vvv vvv vvvv vvvvvvvv vvv vvvvvvvvvvvvv
v vvvvvvvv vvvvv v vvv vvv vvvv
Source: PIONEER 3 Clinical Study Report.14
Table 48: Change from baseline in body weight by background therapy (PIONEER 4, active-controlled trials, add-on to 1 to 2 OADs; FAS)
Week, change from baseline | PIONEER 4 | |||||
|---|---|---|---|---|---|---|
SEM 14 mg N = 285 | LIRA 1.8 mg N = 284 | PBO N = 142 | ||||
MET N = vvv | MET+SGLT2 N = vv | MET N = vvv | MET+SGLT2 N =vv | MET N = vvv | MET+SGLT2 N = vv | |
Body weight (kg)a | ||||||
Number of patients contributing to the analysis |
|
|
|
|
|
|
Week 26 | ||||||
Week 26, mean (SE) |
|
|
|
|
|
|
Change from baseline, mean (SE) |
|
|
|
|
|
|
Treatment group difference vs. control (95% CI) |
|
|
|
|
|
|
P valueb |
|
|
| |||
Week 52 | ||||||
Week 52, mean (SE) |
|
|
|
|
|
|
Change from baseline, mean (SE) |
|
|
|
|
|
|
Treatment group difference vs. control (95% CI) |
|
|
|
|
|
|
P valueb |
|
|
| |||
A1C = glycated hemoglobin; CI = confidence interval LIRA = liraglutide; MET = metformin; PBO = placebo; SE = standard error; SEM = semaglutide; SGLT2 = sodium-glucose co-transporter-2.
v vvvv vvvvvvvvv vvvvvvvvvvv vv vvv vvvvvvvvv vvvvvv vvvvvvvvv vvvvv vvv vvvvvvvv vvvvvvvvvvv vvvvvvv vvvvvvv vvvvvvvvvvvvv vvvvvv vvvv vvvvvvv vv v vvvvvvv vvvvvvv vvvvv vvvvv vvvvvvvv vvvvvvvvvvv vvvvvvv vvv vvvvvvv vv vvvvvvvvv vvv vvv vvvvvvvvv vvvvvv vvvvvvvvvv vvvvvvvvv vvvvvvvvvvvvvvv vvvvvv vvvvvvvvvv vv vvvvvv vvvvvvvvvvvv vvv vvvvvvvvvvv vvvv vvvvv vv vv vvvvvv vvvvvv vvvvvvvvvv vvv vvvv vvv vvvvvvvvv vvv vvv vvvv vvvvvvvvv vvvvvvv vvvvvv vvvv vvvvvvvv vvv vvvvvvvv vvvvv vv vvvvvv vvvvv vvvv vvvvvvvvvv vvvvvvv vvvvvvv vvvvvvvv vvv vvvvvvvvvvv vvvvvvv vvvvvvvvv vvv vvvvvvvv vv vvvvvvvvvvv vvvvv vvvvvvv vvv vvvvvvvv vvvvv vv vvvvvvvvv vvv vvvv vv vvv vvvv vvvvvvv vvvvvvvv vvvvvvvvv vvv vvvvvv vv vvvvvvv vvvv vv vvvv vvvvvvvvvv
v vvvv vvv vvvvvvvvv vv vvvvvvvv vvvvvvvvvvvv vvvvvvv vvv vvv vvvv vvvvvvvv vvv vvvvvvvvvvvvv
Source: PIONEER 4 Clinical Study Report.15
The results for the change in body weight and BMI for placebo-controlled trials are presented in Table 49.
At week 26 in PIONEER 1, 5, and 8, the change in body weight from baseline ranged from –1.4 kg to –3.7 kg among semaglutide treatment groups and –0.4 kg to –1.4 kg among the placebo treatment groups. At week 26 in PIONEER 1, semaglutide 14 mg demonstrated superiority based on a between-groups difference of –2.3 kg (95% CI, –3.1 to –1.5, P < 0.0001) compared to placebo; however, no statistically significant differences were observed for comparisons made between the 7 mg and 3 mg dosage strengths of semaglutide and placebo [7mg: –0.9 kg (95% CI, –1.9 to 0.1, P = 0.0866), and 3mg: –0.1 kg (95% CI, –0.9 to 0.8, P = 0.8692)]. In PIONEER 5, semaglutide 14 mg demonstrated superiority in patients with renal impairment with a between-groups difference of –2.5 kg (95% CI, –3.2 to –1.8, P < 0.0001) compared to placebo. In PIONEER 8, semaglutide 3 mg, 7 mg, and 14 mg demonstrated superiority as an add-on to insulin with or without MET in patients with a between-groups difference of –0.9 kg (95% CI, –1.8 to –0.0, P = 0.0392), –2.0 kg (95% CI, –3.0 to –1.0, P < 0.0001), and –3.3 kg (95% CI, –4.2 to –2.3, P < 0.0001), respectively.
PIONEER 8 provided results up to 52 weeks, where the change from baseline in body weight ranged from –0.8 kg to –3.7 kg for the semaglutide treatment groups and was 0.5 kg for the placebo treatment group. At week 52, the observed treatment group difference for semaglutide 3 mg, 7 mg, and 14 mg compared to placebo was consistent with the results at week 26.
PIONEER 1, 5, and 8 also evaluated using BMI (kg/m2) and the results are summarized in Table 49.
The change from baseline to end of study (26 weeks for PIONEER 1 and 5; 52 weeks for PIONEER 8) in BMI was as followsvvvvv vvvvv vv vvvv vvvvv for semaglutide treatment groups and vvvv vvvvv for placebo in PIONEER 1; vvvv vvvvv vvvv vvvvv for semaglutide 14 mg and placebo, respectively, in PIONEER 5; and vvvv vvvvv vv vvvv vvvvv vvv vvv vvvvv for semaglutide treatment groups and placebo, respectively, in PIONEER 8. The treatment group difference between semaglutide groups and placebo ranged from vvvv vvvvv vv vvvv vvvvv in PIONEER 1, was vvvv vvvvv in PIONEER 5, and vvvv vvvvv vv vvvv vvvvv in PIONEER 8.
Table 49: Change from baseline in body weight and BMI (Placebo-controlled trials; FAS)
Week, change from baseline | PIONEER 1 | PIONEER 5 | PIONEER 8 | |||||||
|---|---|---|---|---|---|---|---|---|---|---|
SEM 3 mg N = 175 | SEM 7 mg N = 175 | SEM 14 mg N = 175 | PBO N = 178 | SEM 14 mg N = 163 | PBO N = 161 | SEM 3 mg N = 184 | SEM 7 mg N = 182 | SEM 14 mg N = 181 | PBO N = 184 | |
Body weight (kg)a | ||||||||||
Number of patients contributing to the analysis | 175 | 175 | 175 | 178 | 162 | 161 | 184 | 182 | 181 | 184 |
Baseline, mean (SD) | 86.9 (21.0) | 89.0 (21.8) | 88.1 (22.1) | 88.6 (23.4) | 91.3 (17.8) | 90.4 (17.5) | 85.9 (21.5) | 87.1 (23.6) | 84.6 (21.0) | 86.0 (21.4) |
Week 26 | ||||||||||
Week 26, mean (SE)b | 86.7 | 85.9 | 84.4 | 86.7 | 87.4 | 89.9 | 84.5 | 83.5 | 82.2 | 85.5 |
Change from baseline, mean (SE)b | –1.5 | –2.3 | –3.7 | –1.4 | –3.4 | –0.9 | –1.4 | –2.4 | –3.7 | –0.4 |
Treatment group difference vs. control (95% CI) | –0.1 (–0.9 to 0.8) | –0.9 (–1.9 to 0.1) | –2.3 (–3.1 to –1.5) | N/A | –2.5 (–3.2 to –1.8) | N/A | –0.9 (–1.8 to –0.0) | –2.0 (–3.0 to –1.0) | –3.3 (–4.2 to –2.3) | N/A |
P value | 0.8692 | 0.0866 | < 0.0001 | N/A | < 0.0001 | N/A | 0.0392 | 0.0001 | < 0.0001 | N/A |
End of Study | ||||||||||
Week 52, mean (SE)b | NR | NR | NR | NR | NR | NR | 85.1 | 83.9 | 82.2 | 86.4 |
Change from baseline, mean (SE)b | NR | NR | NR | NR | NR | NR | –0.8 | –2.0 | –3.7 | 0.5 |
Treatment group difference vs. control (95% CI) | NR | NR | NR | NR | NR | NR | –1.3 (–2.4 to –0.3) | –2.5 (–3.6 to –1.4) | –4.3 (–5.3 to –3.2) | N/A |
P valuec | NR | NR | NR | NR | NR | NR | 0.0101 | < 0.0001 | < 0.0001 | N/A |
BMI (kg/m2)a | ||||||||||
Number of patients contributing to the analysis |
|
|
|
|
|
|
|
|
|
|
Baseline, mean (SD) |
|
|
|
|
|
|
|
|
|
|
End of study | ||||||||||
Week 26, mean (SE)b |
|
|
|
|
|
|
|
|
|
|
Week 52, mean (SE)b |
|
|
|
|
|
|
|
|
|
|
Change from baseline, mean (SE)b |
|
|
|
|
|
|
|
|
|
|
Treatment group difference vs. control (95% CI) |
|
|
|
|
|
|
|
|
|
|
P valuec |
|
|
|
|
|
|
|
|
|
|
CI = confidence interval; FAS = full analysis set; LS = least squares; ITT = intention to treat; SD = standard deviation; SE = standard error.
v vvvv vvvvvvvvv vvvvvvvvvvv vv vvv vvvvvvvvv vvvvvv vvvvvvvvv vvvvv vvv vvvvvvvv vvvvvvvvvvv vvvvvvv vvvvvvv vvvvvvvvvvvvv vvvvvv vvvv vvvvvvv vv v vvvvvvv vvvvvvv vvvvv vvvvv vvvvvvvv vvvvvvvvvvv vvvvvvv vvv vvvvvvv vv vvvvvvvvv vvv vvv vvvvvvvvv vvvvvv vvvvvvvvvv vvvvvvvvv vvvvvvvvvvvvvvv vvvvvv vvvvvvvvvv vv vvvvvv vvvvvvvvvvvv vvv vvvvvvvvvvv vvvv vvvvv vv vv vvvvvv vvvvvv vvvvvvvvvv vvv vvvv vvv vvvvvvvvv vvv vvv vvvv vvvvvvvvv vvvvvvv vvvvvv vvvv vvvvvvvv vvv vvvvvvvv vvvvv vv vvvvvv vvvvv vvvv vvvvvvvvvv vvvvvvv vvv vvvvvv vv vvvvvvvvvvv vvvvv vvvvvvv vvv vvvvvvvv vvvvv vv vvvvvvvvv vvv vvvv vv vvv vvvv vvvvvvv vvvvvvvv vvvvvvvvv vvv vvvvvv vv vvvvvvv vvvv vv vvvv vvvvvvvvvv
v vvvvvvvv vvvvv vvv vvv vvvvvvvvv
v vvvvvvv vvv vvv vvvv vvvvvvvv vvv vvvvvvvv vvvvvvvv
Source: PIONEER 1, PIONEER 5, PIONEER 8 Clinical Study Reports.12,16,17
The change in body weight was reported descriptively in PIONEER 6. For patients with CV disease or risk factors, the change in body weight from baseline was –4.2 kg (SD, 5.7) and –0.8 kg (SD, 4.5) in the semaglutide treatment group and placebo treatment group, respectively. BMI was not reported in PIONEER 6.
Table 50: Change from baseline in body weight (CVOT; FAS)
Change from baseline | PIONEER 6 | |
|---|---|---|
SEM 14 mg N = 1591 | PBO N = 1592 | |
Body weight (kg)a | ||
Baseline, mean (SD) | 91.0 (21.4) | 90.8 (21.0) |
End of treatment, mean (SD) | 86.6 (20.7) | 89.9 (21.2) |
Change from baseline, n | 1510 | 1493 |
Change from baseline, mean (SD) | –4.2 (5.7) | –0.8 (4.5) |
CVOT = cardiovascular outcome trials; FAS = full analysis set; PBO = placebo; SD = standard deviation; SEM = semaglutide.
aObserved data from the in-trial observation period.
Source: PIONEER 6 Clinical Study Report.20
The results for change in body weight and BMI in PIONEER 9 and 10 are presented in Table 51. In PIONEER 9, the change in weight from baseline to week 26 ranged from –0.6 kg to –2.4 kg in the semaglutide treatment groups, was –1.1 kg for placebo and –0.0 kg for liraglutide. The between groups difference for semaglutide treatment groups compared to placebo ranged from –1.2 kg to 0.6 kg, and for semaglutide groups compared to liraglutide, it ranged from –0.5 kg to –2.3 kg. In PIONEER 10, the change in weight from baseline to week 26 ranged from –0.2 kg to –2.2 kg in the semaglutide treatment groups and was 0.3 kg for dulaglutide. The treatment group difference for semaglutide treatment groups to dulaglutide ranged from –0.5 kg to –2.5 kg. The results at week 52 were generally consistent with the results at week 26, with 2 exceptions: there was no longer a treatment group difference between semaglutide 7 mg and liraglutide in PIONEER 9, but the between-groups difference for semaglutide 3 mg compared to dulaglutide was –0.9 kg (95% CI, –1.9 to –0.0, P = 0.0476) in favour of semaglutide.
PIONEER 9 and 10 also included reported the change in BMI from baseline (Table 51). In PIONEER 9, the treatment group differences for the change in BMI from baseline to end of study (week 52) ranged from vvvv vvvvv vv vvvv vvvvv for semaglutide treatment groups, was vvvv vvvvv for placebo, and vvv vvvvv for liraglutide. The treatment group difference for semaglutide groups compared to placebo ranged from vvvv vvvvv vv vvv vvvvv and the comparison to liraglutide ranged from vvvv vvvvv vv vvvv vvvvv. In PIONEER 10, the change from baseline to week 52 ranged from vvvv vvvvv vv vvvv vvvvv for semaglutide treatment groups and was vvv vvvvv for dulaglutide, which corresponded to a between groups difference ranging from vvvv vvvvv vv vvvv vvvvvv
Table 51: Change from baseline in body weight and BMI (Population-specific supportive studies; FAS)
PIONEER 9 | PIONEER 10 | ||||||||
|---|---|---|---|---|---|---|---|---|---|
Week, change from baseline | SEM 3 mg N = 49 | SEM 7 mg N = 49 | SEM 14 mg N = 48 | PBO N = 49 | LIRA 0.9 mg N = 48 | SEM 3 mg N = 131 | SEM 7 mg N = 132 | SEM 14 mg N = 130 | DULA 0.75 mg N = 65 |
Body weight (kg)a | |||||||||
Number of patients contributing to the analysis | 49 | 49 | 48 | 49 | 48 | 131 | 132 | 130 | 65 |
Baseline, mean (SD) | 71.4 (14.3) | 71.3 (10.8) | 68.0 (13.0) | 70.3 (12.4) | 74.7 (15.4) | 71.5 (16.0) | 72.7 (16.4) | 72.6 (15.2) | 71.2 (14.3) |
Week 26 | |||||||||
Week 26 mean (SE)b | 70.5 | 70.0 | 68.8 | 70.0 | 71.1 | 71.9 | 71.1 | 69.9 | 72.4 |
Change from baseline, mean (SE)b | –0.6 | –1.1 | –2.4 | –1.1 | –0.0 | –0.2 | –1.0 | –2.2 | 0.3 |
Treatment group difference vs. control (95% CI) | 0.6 (–0.3 to 1.5) [vs. PBO] –0.5 (–1.5 to 0.4) [vs. LIRA] | 0.0 (–0.8 to 0.9) [vs. PBO] –1.1 (–2.0 to –0.2) [vs. LIRA] | –1.2 (–2.1 to –0.4) [vs. PBO] –2.3 (–3.2 to –1.4) [vs. LIRA] | N/A | N/A | –0.5 (–1.3 to 0.4) | –1.3 (–2.2 to –0.5) | –2.5 (–3.3 to –1.7) | N/A |
P valuec | 0.2291 [vs. PBO] 0.2434 [vs. LIRA] | 0.9481 [vs. PBO] 0.0190 [vs. LIRA] | 0.0060 [vs. PBO] < 0.0001 [vs. LIRA] | N/A | N/A | 0.2632 | 0.0023 | < 0.0001 | N/A |
Week 52 | |||||||||
Week 52 mean (SE)b | 70.8 | 70.3 | 68.5 | 70.5 | 71.2 | 72.1 | 71.2 | 70.5 | 73.1 |
Change from baseline, mean (SE)b | –0.3 | –0.8 | –2.6 | –0.6 | 0.0 | 0.0 | –0.9 | –1.6 | 1.0 |
Treatment group difference vs. control (95% CI) | 0.3 (–0.8 to 1.4) [vs. PBO] –0.3 (–1.5 to 0.8) [vs. LIRA] | –0.2 (–1.3 to 0.9) [vs. PBO] –0.9 (–2.0 to 0.3) [vs. LIRA] | –2.0 (–3.1 to –0.9) [vs. PBO] –2.7 (–3.8 to –1.5) [vs. LIRA] | N/A | N/A | –0.9 (–1.9 to –0.0) | –1.9 (–2.8 to –0.9) | –2.6 (–3.5 to –1.6) | N/A |
P valuec | 0.5918 [vs. PBO] 0.5636 [vs. LIRA] | 0.7021 [vs. PBO] 0.1401 [vs. LIRA] | 0.0003 [vs. PBO] < 0.0001 [vs. LIRA] | N/A | N/A | 0.0476 | < 0.0001 | < 0.0001 | N/A |
BMI (kg/m2)a | |||||||||
Number of patients contributing to the analysis |
|
|
|
|
|
|
|
|
|
Baseline, mean (SD) |
|
|
|
|
|
|
|
|
|
Week 52 mean (SE)b |
|
|
|
|
|
|
|
|
|
Change from baseline, mean (SE)b |
|
|
|
|
|
|
|
|
|
Treatment group difference vs. control (95% CI) |
|
|
|
|
|
|
|
|
|
P valuec |
|
|
|
|
|
|
|
|
|
A1C = glycated hemoglobin; CI = confidence interval; DULA = dulaglutide; FAS = full analysis set; SD = standard deviation; SE = standard error; SEM = semaglutide.
aPIONEER 9: Data presented corresponds to the treatment policy estimand, using the in-trial observation period. Missing post-baseline values were imputed by a pattern mixture model using multiple imputation. Pattern was defined by treatment arm and treatment status, and multiple imputations were based on an ANCOVA model. Multiple imputation was done within 6 (6) groups of subjects; 1 (1) group of subjects regardless of randomized treatment arm who at week 26 (or week 52) had discontinued treatment or initiated rescue medication, and 5 (5) groups of subjects defined by randomized treatment arm for subjects that were still on treatment and had not initiated rescue medication. Change from baseline was analyzed using an ANCOVA model with treatment and strata as categorical fixed effects and baseline value as covariate for each of the 1000 imputed complete datasets, and pooled by Rubin's rule to draw inference.
PIONEER 10: Data presented corresponds to the treatment policy estimand, using the in-trial observation period. Missing post-baseline values were imputed by a pattern mixture model using multiple imputation. Pattern was defined by treatment arm and treatment status (premature treatment discontinuation and/or initiation of rescue medication), and imputations were based on an ANCOVA model. Imputation was from own treatment arm and same treatment status. Change from baseline was analyzed using an ANCOVA model with treatment and strata as categorical fixed effects and baseline value as covariate for each of the 1000 imputed complete datasets, and pooled by Rubin's rule to draw inference.
bStandard error not reported.
cP-value has not been adjusted for multiple testing.
Source: PIONEER 9 and PIONEER 10 Clinical Study Reports.18,19
Lipid profile
Total cholesterol, HDL cholesterol, and LDL cholesterol were measures of the lipid profile of interest for this review.
The lipid profile for patients in PIONEER 2, 3, and 4 is presented in Table 52. At baseline, the geometric mean for total cholesterol ranged from 4.46 mmol/L to 4.64 mmol/L, HDL cholesterol ranged from 1.14 mmol/L to 1.19 mmol/L, and LDL cholesterol ranged from 2.36 mmol/L to 2.52 mmol/L across all doses of semaglutide in the 3 active-controlled studies. The ratio to baseline at the end of study (week 52 for PIONEER 2 and 4, week 78 for PIONEER 3) ranged from 0.97 to 1.02 for total cholesterol, 0.97 to 1.06 for HDL cholesterol, and 0.96 to 1.06 for LDL cholesterol. The treatment ratio comparing semaglutide 14 mg to empagliflozin was in favour of semaglutide 14 mg for total, HDL, and LDL cholesterol. No notable difference between groups was observed in PIONEER 3. In PIONEER 4, the treatment ratio for semaglutide 14 mg compared to placebo was in favour of semaglutide for total and HDL cholesterol, but differences were small for LDL cholesterol.
Table 52: Lipid profile (Active-controlled trials, add-on to 1 to 2 OADs; FAS)
PIONEER 2 | PIONEER 3 | PIONEER 4 | |||||||
|---|---|---|---|---|---|---|---|---|---|
Week, change from baseline | SEM 14 mg N = 411 | EMPA 25 mg N = 410 | SEM 3 mg N = 466 | SEM 7 mg N = 465 | SEM 14 mg N = 465 | SIT 100 mg N = 467 | SEM 14 mg N = 285 | LIRA 1.8 mg N = 284 | PBO N = 142 |
Total cholesterol (mmol/L)a | |||||||||
Number of patients contributing to the analysis | 407 | 410 | 463 | 462 | 462 | 466 | 284 | 281 | 142 |
Baseline, geometric mean (CV) | 4.52 (23.5) | 4.64 (23.8) | 4.46 (24.2) | 4.53 (23.4) | 4.48 (23.2) | 4.52 (23.5) | 4.54 (25.2) | 4.52 (24.7) | 4.61 (23.6) |
End of study | |||||||||
Week 52, geometric mean (CV)b | 4.42 | 4.66 | N/A | N/A | N/A | N/A | 4.44 | 4.44 | 4.65 |
Week 78, geometric mean (CV)b | NR | NR | 4.48 | 4.45 | 4.44 | 4.50 | NR | NR | NR |
Ratio to baseline, mean (CV)b | 0.97 | 1.02 | 1.00 | 0.99 | 0.99 | 1.00 | 0.98 | 0.98 | 1.02 |
Treatment ratio vs. control (95% CI) | 0.95 (0.93 to 0.97) | N/A | 0.99 (0.97 to 1.02) | 0.99 (0.96 to 1.01) | 0.99 (0.96 to 1.01) | N/A | 1.00 (0.97 to 1.03) [vs. LIRA] 0.96 (0.92 to 0.99) [vs. PBO] | N/A | N/A |
P valuec | < 0.0001 | N/A | 0.6701 | 0.3716 | 0.2782 | N/A | 0.9778 [vs. LIRA] 0.0162 [vs. PBO] | N/A | N/A |
HDL cholesterol (mmol/L)a | |||||||||
Number of patients contributing to the analysis | 407 | 410 | 463 | 462 | 461 | 466 | 284 | 281 | 142 |
Baseline, geometric mean (CV) | 1.14 (22.2) | 1.15 (24.1) | 1.15 (25.1) | 1.14 (26.0) | 1.16 (22.9) | 1.17 (22.8) | 1.14 (25.8) | 1.14 (22.4) | 1.19 (25.9) |
End of study | |||||||||
Week 52, geometric mean (CV)b | 1.15 | 1.22 | N/A | N/A | N/A | N/A | 1.17 | 1.15 | 1.16 |
Week 78, geometric mean (CV)b | NR | NR | 1.12 | 1.14 | 1.16 | 1.14 | NR | NR | NR |
Ratio to baseline, mean (CV)b | 1.01 | 1.06 | 0.97 | 0.99 | 1.00 | 0.99 | 1.02 | 1.00 | 1.01 |
Treatment ratio vs. control (95% CI) | 0.95 (0.93 to 0.97) | N/A | 0.98 (0.96 to 1.00) | 1.00 (0.98 to 1.02) | 1.01 (0.99 to 1.03) | N/A | 1.02 (1.00 to 1.04) [vs. LIRA] 1.01 (0.99 to 1.04) [vs. PBO] | N/A | N/A |
P valuec | < 0.0001 | N/A | 0.0872 | 0.8502 | 0.3206 | N/A | 0.0779 [vs. LIRA] 0.3500 [vs. PBO] | N/A | N/A |
LDL cholesterol (mmol/L)a | |||||||||
Number of patients contributing to the analysis | 407 | 410 | 463 | 462 | 461 | 466 | 285 | 284 | 142 |
Baseline, geometric mean (CV) | 2.41 (44.6) | 2.52 (36.3) | 2.36 (40.8) | 2.43 (36.8) | 2.39 (38.5) | 2.39 (38.8) | 2.41 (39.1) | 2.37 (45.7) | 2.43 (45.4) |
End of study | |||||||||
Week 52, geometric mean (CV)b | 2.38 | 2.54 | NR | NR | NR | NR | 2.38 | 2.39 | 2.53 |
Week 78, geometric mean (CV)b | NR | NR | 2.45 | 2.39 | 2.40 | 2.45 | NR | NR | NR |
Ratio to baseline, mean (CV)b | 0.96 | 1.03 | 1.02 | 1.00 | 1.00 | 1.03 | 0.99 | 1.00 | 1.06 |
Treatment ratio vs. control (95% CI) | 0.94 (0.90 to 0.98) | N/A | 1.00 (0.96 to 1.04) | 0.98 (0.94 to 1.02) | 0.98 (0.94 to 1.02) | N/A | 0.99 (0.95 to 1.05) [vs. LIRA] 0.94 (0.88 to 1.00) [vs. PBO] | N/A | N/A |
P valuec | 0.0015 | N/A | 0.9875 | 0.2272 | 0.3146 | N/A | 0.8413 [vs. LIRA] 0.0430 [vs. PBO] | N/A | N/A |
CI = confidence interval; FAS = full analysis set; LS = least squares; ITT = intention to treat; SD = standard deviation; SE = standard error.
aData presented corresponds to the treatment policy estimand, using the in-trial observation period. Missing post-baseline values were imputed by a pattern mixture model using multiple imputation. Pattern was defined by treatment arm and treatment status (premature treatment discontinuation and/or initiation of rescue medication), and multiple imputations were based on an ANCOVA model. Multiple imputation was from own treatment arm and same treatment status. Ratio to baseline was analyzed using an ANCOVA model with treatment, strata, and region as categorical fixed effects and baseline value as covariate for each of the 1000 imputed complete datasets, and pooled by Rubin's rule to draw inference. The ratio to baseline and the corresponding baseline value were log-transformed before analysis.
bCV was not reported.
cP-value has not been adjusted for multiple testing.
Source: PIONEER 2, PIONEER 3, PIONEER 4 Clinical Study Reports.13-15
The lipid profile for PIONEER 1, 5, and 8 is presented in Table 53. At baseline, total cholesterol ranged from 4.23 mmol/L to 5.09 mmol/L, HDL cholesterol ranged from 1.07 mmol/L to 1.21 mmol/L, and LDL cholesterol ranged from 2.21 mmol/L to 2.93 mmol/L across all treatment groups in the 3 placebo-controlled studies. The ratio to baseline at end of study (week 26 in PIONEER 1 and 5, and week 52 in PIONEER 8) ranged from 0.95 to 1.01 for total cholesterol, 0.98 to 1.05 for HDL cholesterol, and 0.93 to 1.00 for LDL cholesterol. In PIONEER 1, the treatment group difference between semaglutide 14 mg and placebo was in favour of semaglutide for total and LDL cholesterol. In PIONEER 8, the treatment group differences between semaglutide 3 mg, 7 mg, and 14 mg compared to placebo were in favour of semaglutide at all dosage strengths for total cholesterol. None of the other comparisons in the placebo-controlled trials demonstrated a between groups difference.
Table 53: Lipid profile (Placebo-controlled trials; FAS)
PIONEER 1 | PIONEER 5 | PIONEER 8 | ||||||||
|---|---|---|---|---|---|---|---|---|---|---|
Week, change from baseline | SEM 3 mg N = 175 | SEM 7 mg N = 175 | SEM 14 mg N = 175 | PBO N = 178 | SEM 14 mg N = 163 | PBO N = 161 | SEM 3 mg N = 184 | SEM 7 mg N = 182 | SEM 14 mg N = 181 | PBO N = 184 |
Total cholesterol (mmol/L)a | ||||||||||
Number of patients contributing to the analysis | 173 | 175 | 174 | 176 | 159 | 160 | 183 | 180 | 179 | 183 |
Baseline, geometric mean (CV) | 4.96 (21.8) | 5.09 (22.5) | 4.80 (21.9) | 4.75 (22.7) | 4.38 (24.9) | 4.44 (29.6) | 4.23 (27.3) | 4.43 (25.4) | 4.51 (25.1) | 4.39 (24.4) |
End of study | ||||||||||
Week 26, geometric mean (CV)b | 4.81 | 4.86 | 4.65 | 4.88 | 4.25 | 4.41 | N/A | N/A | N/A | N/A |
Week 52, geometric mean (CV)b | NR | NR | NR | NR | NR | NR | 4.26 | 4.26 | 4.18 | 4.42 |
Ratio to baseline, mean (CV)b | 0.98 | 0.99 | 0.95 | 1.00 | 0.96 | 1.00 | 0.97 | 0.97 | 0.95 | 1.01 |
Treatment ratio vs. control (95% CI) | 0.99 (0.95 to 1.02) | 1.00 (0.95 to 1.04) | 0.95 (0.92 to 0.99) | N/A | 0.96 (0.92 to 1.00) | N/A | 0.96 (0.93 to 1.00) | 0.96 (0.93 to 1.00) | 0.95 (0.91 to 0.98) | N/A |
P valuec | 0.4752 | 0.8537 | 0.0167 | N/A | 0.0790 | N/A | 0.0460 | 0.0480 | 0.0034 | N/A |
HDL cholesterol (mmol/L)a | ||||||||||
Number of patients contributing to the analysis | 173 | 175 | 174 | 176 | 159 | 160 | 183 | 180 | 179 | 183 |
Baseline, geometric mean (CV) | 1.16 (26.2) | 1.16 (27.2) | 1.15 (24.8) | 1.11 (25.3) | 1.07 (24.7) | 1.08 (22.2) | 1.20 (26.1) | 1.18 (26.2) | 1.20 (24.9) | 1.21 (26.6) |
End of study | ||||||||||
Week 26, geometric mean (CV)b | 1.18 | 1.20 | 1.17 | 1.17 | 1.10 | 1.09 | N/A | N/A | N/A | N/A |
Week 52, geometric mean (CV)b | NR | NR | NR | NR | NR | NR | 1.21 | 1.17 | 1.21 | 1.20 |
Ratio to baseline, mean (CV)b | 1.03 | 1.05 | 1.02 | 1.03 | 1.02 | 1.02 | 1.01 | 0.98 | 1.01 | 1.00 |
Treatment ratio vs. control (95% CI) | 1.00 (0.97 to 1.03) | 1.03 (0.99 to 1.06) | 1.00 (0.97 to 1.03) | N/A | 1.01 (0.97 to 1.04) | N/A | 1.01 (0.98 to 1.04) | 0.97 (0.94 to 1.01) | 1.00 (0.97 to 1.04) | N/A |
P valuec | 0.8306 | 0.1045 | 0.8794 | N/A | 0.7391 | N/A | 0.5880 | 0.1213 | 0.8091 | N/A |
LDL cholesterol (mmol/L)a | ||||||||||
Number of patients contributing to the analysis | 173 | 175 | 174 | 176 | 159 | 159 | 183 | 180 | 179 | 183 |
Baseline, geometric mean (CV) | 2.88 (33.6) | 2.93 (35.6) | 2.74 (34.1) | 2.75 (34.7) | 2.27 (40.1) | 2.29 (47.2) | 2.21 (44.9) | 2.43 (37.9) | 2.46 (37.2) | 2.35 (37.7) |
End of study | ||||||||||
Week 26, geometric mean (CV)b | 2.70 | 2.76 | 2.63 | 2.79 | 2.21 | 2.26 | N/A | N/A | N/A | N/A |
Week 52, geometric mean (CV)b | NR | NR | NR | NR | NR | NR | 2.26 | 2.30 | 2.26 | 2.37 |
Ratio to baseline, mean (CV)b | 0.95 | 0.98 | 0.93 | 0.99 | 0.97 | 0.99 | 0.96 | 0.97 | 0.96 | 1.00 |
Treatment ratio vs. control (95% CI) | 0.97 (0.91 to 1.03) | 0.99 (0.92 to 1.06) | 0.94 (0.89 to 1.00) | N/A | 0.98 (0.91 to 1.05) | N/A | 0.95 (0.90 to 1.01) | 0.97 (0.91 to 1.03) | 0.96 (0.90 to 1.01) | N/A |
P valuec | 0.2520 | 0.7401 | 0.0454 | N/A | 0.4954 | N/A | 0.1023 | 0.3307 | 0.1404 | N/A |
CI = confidence interval; FAS = full analysis set; LS = least squares; ITT = intention to treat; SD = standard deviation; SE = standard error.
aSpecify model, covariates, analysis population and time point for each outcome.
bSpecify if the P-value has not been adjusted for multiple testing (i.e., the type 1 error rate has not been controlled)
aData presented corresponds to the treatment policy estimand, using the in-trial observation period. Missing post-baseline values were imputed by a pattern mixture model using multiple imputation. Pattern was defined by treatment arm and treatment status (premature treatment discontinuation and/or initiation of rescue medication), and multiple imputations were based on an ANCOVA model. Multiple imputation was from own treatment arm and same treatment status. Ratio to baseline was analyzed using an ANCOVA model with treatment, strata, and region as categorical fixed effects and baseline value as covariate for each of the 1000 imputed complete datasets, and pooled by Rubin's rule to draw inference. The ratio to baseline and the corresponding baseline value were log-transformed before analysis.
bCV was not reported.
cP-value has not been adjusted for multiple testing.
Source: PIONEER 1, PIONEER 5, and PIONEER 8 Clinical Study Reports.12,16,17
The lipid profile was reported as descriptive results for patients in PIONEER 6 (Table 54). Total cholesterol at baseline and the ratio to baseline from end of treatment were similar between the semaglutide 14 mg and placebo treatment groups. At baseline, HDL cholesterol was vvvv vvvvvv vvv vvvv vvvvvv in the semaglutide 14 mg and placebo treatment groups, respectively. The ratio to baseline was vvvv for semaglutide 14 mg and vvvv for placebo. The baseline level of LDL cholesterol was vvvv vvvvvv vvv vvvv vvvvvv for the semaglutide 14 mg and placebo treatment groups, respectively. This corresponded to a ratio to baseline that was similar between the 2 groups: vvvv for semaglutide 14 mg and vvvv for placebo.
Table 54: Lipid profile (CVOT; FAS)
Change from baseline | PIONEER 6 | |
|---|---|---|
SEM 14 mg N = 1591 | PBO N = 1592 | |
Total cholesterol (mmol/L)a | ||
Baseline, geometric mean (CV) |
|
|
End of treatment time point, geometric mean (CV) |
|
|
Ratio to baseline, n |
|
|
Ratio to baseline, mean (CV) |
|
|
HDL cholesterol (mmol/L)a | ||
Baseline, geometric mean (CV) |
|
|
End of treatment time point, geometric mean (CV) |
|
|
Ratio to baseline, n |
|
|
Ratio to baseline, mean (CV) |
|
|
LDL cholesterol (mmol/L)a | ||
Baseline, geometric mean (CV) |
|
|
End of treatment time point, geometric mean (CV) |
|
|
Ratio to baseline, n |
|
|
Ratio to baseline, mean (CV) |
|
|
CI = confidence interval; FAS = full analysis set; LS = least squares; ITT = intention to treat; SD = standard deviation; SE = standard error.
v vvvvvvvv vvvv vvvvvvvvv vvvvvvvvvvv vv vvv vvvvvvvvv vvvvvv vvvvvvvvv vvvvv vvv vvvvvvvv vvvvvvvvvvv vvvvvvv
v vv vvv vvv vvvvvvvvv
v vvvvvvv vvv vvv vvvv vvvvvvvv vvv vvvvvvvv vvvvvvvv
Source: PIONEER 6 Clinical Study Report.20
The lipid profile for PIONEER 9 and 10 is provided in Table 55. At baseline, the geometric mean of total cholesterol ranged from 5.12 mmol/L to 5.42 mmol/L, HDL cholesterol ranged from 1.33 mmol/L to 1.42 mmol/L, and LDL cholesterol ranged from 2.94 mmol/L to 3.30 mmol/L across all treatment groups in both PIONEER 9 and 10. The ratio to baseline at end of treatment (week 52) ranged from 0.93 to 1.00 for total cholesterol, 0.99 to 1.04 for HDL cholesterol, and 0.91 to 1.04 for LDL cholesterol. In PIONEER 9, the treatment group difference between semaglutide 14 mg and placebo for total cholesterol, and between semaglutide 7 mg and 14 mg for LDL cholesterol were in favour of semaglutide. No other treatment differences were observed in PIONEER 9. In PIONEER 10, A treatment group difference for the comparison of semaglutide 3 mg to dulaglutide was in favour of dulaglutide in terms of total cholesterol and LDL cholesterol. No other treatment differences were observed in PIONEER 10.
Table 55: Lipid profile (Population-specific supportive studies; FAS)
Week, change from baseline | PIONEER 9 | PIONEER 10 | |||||||
|---|---|---|---|---|---|---|---|---|---|
SEM 3 mg N = 49 | SEM 7 mg N = 49 | SEM 14 mg N = 48 | PBO N = 49 | LIRA 0.9 mg N = 48 | SEM 3 mg N = 131 | SEM 7 mg N = 132 | SEM 14 mg N = 130 | DULA N = 65 | |
Total cholesterol (mmol/L)a | |||||||||
Number of patients contributing to the analysis | 49 | 49 | 48 | 49 | 48 | 129 | 131 | 130 | 64 |
Baseline, geometric mean (CV) | 5.42 (16.9) | 5.27 (12.8) | 5.37 (16.9) | 5.04 (15.9) | 5.34 (16.9) | 5.12 (16.2) | 5.23 (15.8) | 5.14 (15.3) | 5.24 (15.6) |
End of treatment time point (Week 52), geometric mean (CV)b | 5.25 | 5.08 | 4.94 | 5.29 | 5.01 | 5.07 | 4.94 | 4.88 | 4.80 |
Ratio to baseline, mean (CV)b | 0.99 | 0.96 | 0.93 | 1.00 | 0.95 | 0.98 | 0.95 | 0.94 | 0.93 |
Treatment ratio vs. control (95% CI) | 0.99 (0.94 to 1.04) [vs. PBO] 1.05 (1.00 to 1.10) [vs. LIRA] | 0.96 (0.92 to 1.01) [vs. PBO] 1.01 (0.97 to 1.06) [vs. LIRA] | 0.93 (0.89 to 0.98) [vs. PBO] 0.99 (0.94 to 1.03) [vs. LIRA] | N/A | N/A | 1.06 (1.02 to 1.10) | 1.03 (0.99 to 1.07) | 1.02 (0.98 to 1.05) | N/A |
P valuec | 0.7604 [vs. PBO] 0.0586 [vs. LIRA] | 0.1107 [vs. PBO] 0.5443 [vs. LIRA] | 0.0071 [vs. PBO] 0.5495 [vs. LIRA] | N/A | N/A | 0.0041 | 0.1442 | 0.3986 | N/A |
HDL cholesterol (mmol/L)a | |||||||||
Number of patients contributing to the analysis | 49 | 49 | 48 | 49 | 48 | 129 | 131 | 130 | 64 |
Baseline, geometric mean (CV) | 1.34 (25.9) | 1.33 (21.4) | 1.42 (22.1) | 1.37 (26.9) | 1.36 (24.0) | 1.33 (26.2) | 1.37 (25.2) | 1.34 (22.1) | 1.34 (24.4) |
End of treatment time point (Week 52), geometric mean (CV)b | 1.42 | 1.37 | 1.36 | 1.41 | 1.34 | 1.39 | 1.34 | 1.35 | 1.34 |
Ratio to baseline, mean (CV)b | 1.04 | 1.01 | 1.00 | 1.03 | 0.99 | 1.03 | 1.00 | 1.01 | 1.00 |
Treatment ratio vs. control (95% CI) | 1.01 (0.95 to 1.06) [vs. PBO] 1.05 (1.00 to 1.11) [vs. LIRA] | 0.97 (0.92 to 1.03) [vs. PBO] 1.02 (0.97 to 1.07) [vs. LIRA] | 0.97 (0.92 to 1.02) [vs. PBO] 1.01 (0.96 to 1.07) [vs. LIRA] | N/A | N/A | 1.03 (0.99 to 1.07) | 1.00 (0.96 to 1.04) | 1.01 (0.97 to 1.05) | N/A |
P valuec | 0.8493 [vs. PBO] 0.0520 [vs. LIRA] | 0.3068 [vs. PBO] 0.4648 [vs. LIRA] | 0.2063 [vs. PBO] 0.6434 [vs. LIRA] | N/A | N/A | 0.0895 | 0.9094 | 0.6269 | N/A |
LDL cholesterol (mmol/L)a | |||||||||
Number of patients contributing to the analysis | 49 | 49 | 48 | 49 | 48 | 129 | 131 | 130 | 64 |
Baseline, geometric mean (CV) | 3.24 (25.4) | 3.05 (23.3) | 3.30 (22.9) | 2.94 (21.2) | 3.20 (23.4) | 2.97 (25.4) | 3.06 (23.9) | 3.05 (23.1) | 3.13 (22.0) |
End of treatment time point (Week 52), geometric mean (CV)b | 3.12 | 3.01 | 2.91 | 3.27 | 2.96 | 2.97 | 2.88 | 2.82 | 2.78 |
Ratio to baseline, mean (CV)b | 0.99 | 0.96 | 0.93 | 1.04 | 0.94 | 0.98 | 0.95 | 0.93 | 0.91 |
Treatment ratio vs. control (95% CI) | 0.95 (0.89 to 1.03) [vs. PBO] 1.05 (0.98 to 1.13) [vs. LIRA] | 0.92 (0.86 to 0.99) [vs. PBO] 1.02 (0.95 to 1.09) [vs. LIRA] | 0.89 (0.83 to 0.96) [vs. PBO] 0.98 (0.92 to 1.05) [vs. LIRA] | N/A | N/A | 1.07 (1.01 to 1.13) | 1.04 (0.98 to 1.09) | 1.01 (0.96 to 1.07) | N/A |
P valuec | 0.2165 [vs. PBO] 0.1565 [vs. LIRA] | 0.0244 [vs. PBO] 0.6671 [vs. LIRA] | 0.0020 [vs. PBO] 0.5854 [vs. LIRA] | N/A | N/A | 0.0219 | 0.1873 | 0.6468 | N/A |
CI = confidence interval; FAS = full analysis set; LS = least squares; ITT = intention to treat; SD = standard deviation; SE = standard error.
aPIONEER 10: Data presented corresponds to the treatment policy estimand, using the in-trial observation period. Missing post-baseline values were imputed by a pattern mixture model using multiple imputation. Pattern was defined by treatment arm and treatment status (premature treatment discontinuation and/or initiation of rescue medication), and imputations were based on an ANCOVA model. Multiple imputation was from own treatment arm and same treatment status. Ratio to baseline was analyzed using an ANCOVA model with treatment and region as categorical fixed effects and baseline value as covariate for each of the 1000 imputed complete datasets, and pooled by Rubin's rule to draw inference. The ratio to baseline and the corresponding baseline value were log-transformed before analysis.
PIONEER 9: Data from the on-treatment without rescue medication period. Ratios to baseline were analysed using a mixed model for repeated measurements model with treatment and strata as categorical fixed effects and baseline value as covariate, all nested within visit, and an unstructured residual covariance matrix. The ratio to baseline and the corresponding baseline value were log-transformed before analysis.
bCV was not reported.
cP-value has not been adjusted for multiple testing.
Source: PIONEER 9 and PIONEER 10 Clinical Study Reports.18,19
Health care resource utilization
Health care resource utilization was not assessed in any of the studies.
Harms
Only those harms identified in the review protocol are reported below. See Table 56, Table 57, Table 58, and Table 59 for detailed harms data.
Adverse events
In the active-controlled trials (Table 56), AEs were reported by 71% to 80% of patients treated with semaglutide, 70% to 83% of patients treated with active comparators (empagliflozin, sitagliptin, and liraglutide), and 67% of patients in the placebo group of PIONEER 4. In placebo-controlled trials (Table 57), between 53% and 58% of patients in the semaglutide groups and 56% of patients in the placebo group of PIONEER 1 reported AEs. In PIONEER 5 and 8, between 74% and 83% of patients in semaglutide treatment groups and 65% to 76% of patients in the placebo treatment groups reported AEs. In PIONEER 9 and 10, between 71% and 85% of patients in semaglutide treatment groups, 67% to 82% of patients in the active comparator groups (liraglutide and dulaglutide), and 80% of patients in the placebo treatment group reported AEs. Overall AEs were not reported in PIONEER 6.
Gastrointestinal disorders including nausea, diarrhea, decreased appetite, and vomiting were the most commonly reported AEs in all studies. Across all trials (except PIONEER 6), nausea was reported among 4% to 23% in semaglutide treatment groups, 0% to 18% in active comparator groups (all: empagliflozin, sitagliptin, liraglutide, and dulaglutide), and 2% to 8% of patients in placebo treatment groups. Diarrhea was reported by 2% to 15% of patients in semaglutide treatment groups, 3% to 11% in active comparator groups (all), and 2% to 8% of placebo groups. Decreased appetite was reported by 1% to 13% of patients in the semaglutide treatment groups, 0% to 6% of active comparator groups (all), and 0% to 5% in placebo groups. Vomiting was reported by 0% to 12% of patients in the semaglutide treatment groups, 2% to 5% of patients in active comparator groups (all), and 0% to 4% of placebo groups. In general, GI AEs occurred more frequently in the semaglutide 14 mg treatment groups than in the empagliflozin and sitagliptin groups, and occurred at a similar frequency or higher than other GLP-1 RAs (liraglutide and dulaglutide). Gastrointestinal AEs semaglutide 3 mg and 7 mg occurred at a similar frequency or higher than active comparators (all).
Serious adverse events
In PIONEER 1 to 5, and 8 to 10, SAEs were reported by 0% to 14% of patients across all treatment groups and the frequency of SAEs was similar between treatment groups in all trials (Table 56, Table 57, and Table 59). In PIONEER 5, 2 patients in the semaglutide 14 mg group reported acute MI and unstable angina compared to zero in the placebo treatment group. In PIONEER 8, hypoglycemia unconsciousness, ischemic stroke, unstable angina, nausea, vomiting, and orthostatic hypotension were reported in 1.1% of patients in the semaglutide treatment groups; ischemic stroke was reported in 1.1% of patients in the placebo treatment group. In PIONEER 2 to 4, specific SAEs were reported in less than 1% of patients in any treatment group. No specific SAE were reported in more than 1 patient in PIONEER 9 or 10.
Serious AEs were a key focus of PIONEER 6. 18.9% and 22.5% of patients in the semaglutide 14 mg and placebo treatment groups, respectively, reported a SAE. The most common events (defined by at least 1% of patients in any treatment group) were acute MI, unstable angina, and pneumonia, which were all reported in 1% of patients in both treatment groups.
Withdrawals due to adverse events
In PIONEER 1 to 5, and 8 to 10, WDAEs ranged from 2% to 15% in semaglutide treatment groups, 0% to 9% of active comparator groups (all), and 0% to 5% of placebo groups (Table 56, Table 57, and Table 59). The WDAEs reported for the semaglutide 14 mg treatment groups were approximately twice as frequent than WDAEs reported for empagliflozin (PIONEER 2), sitagliptin (PIONEER 3), liraglutide (PIONEER 9 only) and dulaglutide (PIONEER 10). The WDAEs reported for patients in treatment groups for all dosage strengths of semaglutide were equal to or greater than WDAEs reported for placebo groups. Gastrointestinal disorders were the most commonly reported reasons for WDAEs in all studies.
In PIONEER 6, 27% of patients in the semaglutide 14 mg treatment group and 17% of patients in the placebo treatment group WDAE, with the most common reasons for WDAE attributed to gastrointestinal disorders as well (Table 58).
Mortality
A total of 16 deaths were reported in semaglutide treatment groups across PIONEER 1 to 5 and 8 to 10, 8 deaths were reported in active treatment groups (all), and 3 deaths were reported in placebo groups. No deaths were reported in PIONEER 1, 9, or 10. Deaths for PIONEER 6 were reported in the efficacy section under mortality outcomes. Briefly, 23 and 45 deaths were reported in the semaglutide of which 14 mg and placebo treatment groups, respectively, approximately half of which (10 and 23, respectively) were CV-related.
Notable harms
Gastrointestinal disorders including nausea, vomiting, and diarrhea were frequently reported in the semaglutide treatment groups in PIONEER 1 to 6 and 8 to 10 as previously described. Isolated events of pancreatitis, hypoglycemia, and anaphylaxis were also reported. No cases of medullary thyroid carcinoma were reported in any of the included studies.
Table 56: Summary of Harms (Active-Controlled RCTs, add-on to 1 to 2 OADs; SAS)
Harms | PIONEER 2 | PIONEER 3 | PIONEER 4 | ||||||
|---|---|---|---|---|---|---|---|---|---|
SEM 14 mg N = 410 | EMPA 25 mg N = 409 | SEM 3 mg N = 466 | SEM 7 mg N = 465 | SEM 14 mg N = 465 | SITA 100 mg N = 467 | SEM 14 mg N = 285 | LIRA 1.8 mg N = 284 | PBO N = 142 | |
Patients with ≥ 1 adverse event | |||||||||
n (%) | 289 (70.5) | 283 (69.2) | 370 (79.4) | 363 (78.2) | 370 (79.6) | 388 (83.3) | 229 (80) | 211 (74) | 95 (67) |
Most common eventsa, n (%) | |||||||||
Nausea | 81 (19.8) | 10 (2.4) | 34 (7.3) | 62 (13.4) | 70 (15.1) | 32 (6.9) | 56 (20) | 51 (18) | 5 (4) |
Diarrhea | 38 (9.3) | 13 (3.2) | 45 (9.7) | 53 (11.4) | 57 (12.3) | 37 (7.9) | 43 (15) | 31 (11) | 11 (8) |
Vomiting | 30 (7.3) | 7 (1.7) | 13 (2.8) | 28 (6.0) | 42 (9.0) | 19 (4.1) | 25 (9) | 13 (5) | 3 (2) |
Nasopharyngitis | < 5% | < 5% | 53 (11.4) | 49 (10.6) | 47 (10.1) | 47 (10.1) | 41 (14) | 37 (13) | 15 (11) |
Influenza | 8 (2.0) | 21 (5.1) | 30 (6.4) | 25 (5.4) | 18 (3.9) | 30 (6.4) | < 5% | < 5% | < 5% |
Headache | < 5% | < 5% | 29 (6.2) | 30 (6.5) | 37 (8.0) | 36 (7.7) | 27 (10) | 17 (6) | 9 (6) |
Decreased appetite | 21 (5.1) | 2 (0.5) | 8 (1.7) | 14 (3.0) | 32 (6.9) | 14 (3.0) | 16 (6) | 20 (7) | 0 |
Constipation | < 5% | < 5% | < 5% | < 5% | < 5% | < 5% | 22 (8) | 11 (4) | 4 (3) |
Abdominal pain | < 5% | < 5% | < 5% | < 5% | < 5% | < 5% | 16 (5.6) | 6 (2.1) | 3 (2.1) |
Dyspepsia | < 5% | < 5% | < 5% | < 5% | < 5% | < 5% | 16 (6) | 12 (4) | 0 |
Back pain | < 5% | < 5% | 24 (5.2) | 25 (5.4) | 25 (5.4) | 29 (6.2) | 11 (4) | 18 (6) | 5 (4) |
URTI | < 5% | < 5% | 36 (7.7) | 35 (7.5) | 26 (5.6) | 32 (6.9) | < 5% | < 5% | < 5% |
Abdominal discomfort | < 5% | < 5% | < 5% | < 5% | < 5% | < 5% | 16 (6) | 6 (2) | 3 (2) |
UTI | < 5% | < 5% | 30 (6.4) | 21 (4.5) | 23 (4.9) | 26 (5.6) | < 5% | < 5% | < 5% |
Hypertension | < 5% | < 5% | 30 (6.4) | 24 (5.2) | 26 (5.6) | 29 (6.2) | < 5% | < 5% | < 5% |
Arthralgia | < 5% | < 5% | 22 (4.7) | 14 (3.0) | 21 (4.5) | 30 (6.4) | < 5% | < 5% | < 5% |
Diabetic retinopathy | < 5% | < 5% | 27 (5.8) | 24 (5.2) | 16 (3.4) | 27 (5.8) | < 5% | < 5% | < 5% |
Blood glucose increased | < 5% | < 5% | < 5% | < 5% | < 5% | < 5% | 0 | 2 (1) | 9 (6) |
Patients with ≥ 1 SAEb | |||||||||
n (%) | 27 (6.6) | 37 (9.0) | 64 (13.7) | 47 (10.1) | 44 (9.5) | 58 (12.4) | 31 (11) | 22 (8) | 15 (11) |
Patients who stopped treatment due to adverse events | |||||||||
n (%) | 44 (10.7) | 18 (4.4) | 26 (5.6) | 27 (5.8) | 54 (11.6) | 24 (5.2) | 31 (11) | 26 (9) | 5 (4) |
Most common eventsc, n (%) | |||||||||
Gastrointestinal disorders | 33 (8.0) | 3 (0.7) | 11 (2.4) | 16 (3.4) | 32 (6.9) | 12 (2.6) | 22 (7.7) | 17 (6.0) | 3 (2.1) |
Nausea | 21 (5.1) | 2 (0.5) | < 3% | < 3% | < 3% | < 3% | 13 (4.6) | 8 (2.8) | 0 |
Vomiting | < 3% | < 3% | 0 | < 3% | < 3% | < 3% | 9 (3.2) | 2 (0.7) | 0 |
Deaths, n (%) | |||||||||
All-cause death | 0 | 1 (0.2) | 5 (1.1) | 3 (0.6) | 1 (0.2) | 3 (0.6) | 3 (1.1) | 4 (1.4) | 1 (0.7) |
CV death | 0 | 0 | 2 (0.4) | 0 | 1 (0.2) | 0 | 1 (0.4) | 2 (0.7) | 0 |
Undetermined cause | 0 | 1 (0.2) | 0 | 2 (0.4) | 0 | 1 (0.2) | 1 (0.4) | 0 | 0 |
Non-CV death | 0 | 0 | 3 (0.6) | 1 (0.2) | 0 | 2 (0.4) | 1 (0.4) | 2 (0.7) | 1 (0.7) |
Notable harms, n (%) | |||||||||
Nausea | 73 (17.8) | 4 (1.0) | 29 (6.2) | 53 (11.4) | 58 (12.5) | 28 (6.0) | 49 (17.2) | 43 (15.1) | 2 (1.4) |
Vomiting | 26 (6.3) | 3 (0.7) | 7 (1.5) | 20 (4.3) | 31 (6.7) | 9 (1.9) | 19 (6.7) | 11 (3.9) | 1 (0.7) |
Diarrhea | 23 (5.6) | 2 (0.5) | 25 (5.4) | 31 (6.7) | 43 (9.2) | 22 (4.7) | 29 (10.2) | 22 (7.7) | 5 (3.5) |
Severe hypoglycemia | 0 | 0 | 0 | 0 | 0 | 1 (0.2) | 0 | 0 | 0 |
Anaphylaxis | 1 (0.2) | 0 | 0 | 0 | 0 | 0 | 0 | 0 | 0 |
Pancreatitis | 1 (0.2) | 1 (0.2) | 1 (0.2) | 0 | 1 (0.2) | 1 (0.2) | 0 | 1 (0.4) | 1 (0.7) |
MTC | 0 | 0 | 0 | 0 | 0 | 0 | 0 | 0 | 0 |
Hypoglycemia | 0 | 0 | 0 | 0 | 0 | 0 | 0 | 0 | 0 |
CV = cardiovascular; EMPA = empagliflozin; LIRA = liraglutide; MTC = medullary thyroid carcinoma; PBO = placebo; SAS = safety analysis set; SEM = semaglutide; SIT = sitagliptin; URTI = upper respiratory tract infection; UTI = urinary tract infection.
aFrequency > 5% patients in any group.
bNo specific SAE were reported in ≥ 1% of patients in any treatment group.
cFrequency ≥ 3% in any group.
Note: Data are from the on-treatment period.
Table 57: Summary of Harms (Placebo-Controlled RCTs; SAS)
Harms | PIONEER 1 | PIONEER 5 | PIONEER 8 | |||||||
|---|---|---|---|---|---|---|---|---|---|---|
SEM 3 mg N = 175 | SEM 7 mg N = 175 | SEM 14 mg N=175 | PBO N = 178 | SEM 14 mg N = 163 | PBO N = 161 | SEM 3 mg N = 184 | SEM 7 mg N = 182 | SEM 14 mg N = 181 | PBO N = 184 | |
Patients with ≥ 1 adverse event | ||||||||||
n (%) | 101 (57.7) | 93 (53.1) | 99 (56.6) | 99 (55.6) | 120 (73.6) | 105 (65.2) | 137 (74.5) | 142 (78.5) | 151 (83.4) | 139 (75.5) |
Most common eventsa, n (%) | ||||||||||
Nausea | 14 (8.0) | 9 (5.1) | 28 (16.0) | 10 (5.6) | 31 (19.0) | 12 (7.5) | 21 (11.4) | 30 (16.6) | 42 (23.2) | 13 (7.1) |
Diarrhea | 15 (8.6) | 9 (5.1) | 9 (5.1) | 4 (2.2) | 17 (10.4) | 6 (3.7) | 16 (8.7) | 22 (12.2) | 27 (14.9) | 11 (6.0) |
Vomiting | 5 (2.9) | 8 (4.6) | 12 (6.9) | 4 (2.2) | 19 (11.7) | 2 (1.2) | 11 (6.0) | 14 (7.7) | 18 (9.9) | 7 (3.8) |
Nasopharyngitis | 10 (5.7) | 11 (6.3) | 3 (1.7) | 6 (3.4) | < 5% | < 5% | 27 (14.7) | 21 (11.6) | 18 (9.9) | 27 (14.7) |
Influenza | 9 (5.1) | 5 (2.9) | 4 (2.3) | 2 (1.1) | < 5% | < 5% | < 5% | < 5% | < 5% | < 5% |
Headache | 6 (3.4) | 10 (5.7) | 9 (5.1) | 9 (5.1) | 10 (6.1) | 8 (5.0) | < 5% | < 5% | < 5% | < 5% |
Decreased appetite | 2 (1.1) | 3 (1.7) | 9 (5.1) | 1 (0.6) | 11 (6.7) | 0 | 8 (4.3) | 18 (9.9) | 23 (12.7) | 2 (1.1) |
Constipation | < 5% | < 5% | < 5% | < 5% | 19 (11.7) | 6 (3.7) | 8 (4.3) | 15 (8.3) | 12 (6.6) | 5 (2.7) |
Dyspepsia | < 5% | < 5% | < 5% | < 5% | 16 (9.8) | 2 (1.2) | < 5% | < 5% | < 5% | < 5% |
Back pain | < 5% | < 5% | < 5% | < 5% | 1 (0.6) | 9 (5.6) | < 5% | < 5% | < 5% | < 5% |
URTI | < 5% | < 5% | < 5% | < 5% | 2 (1.2) | 8 (5.0) | 8 (4.3) | 6 (3.3) | 13 (7.2) | 13 (7.1) |
Abdominal discomfort | < 5% | < 5% | < 5% | < 5% | < 5% | < 5% | 7 (3.8) | 11 (6.1) | 10 (5.5) | 3 (1.6) |
UTI | < 5% | < 5% | < 5% | < 5% | 5 (3.1) | 8 (5.0) | 6 (3.3) | 5 (2.8) | 10 (5.5) | 7 (3.8) |
Hypertension | < 5% | < 5% | < 5% | < 5% | < 5% | < 5% | 3 (1.6) | 4 (2.2) | 1 (0.6) | 11 (6.0) |
Patients with ≥ 1 SAE | ||||||||||
n (%) | 5 (2.9) | 3 (1.7) | 2 (1.1) | 8 (4.5) | 17 (10) | 17 (11) | 25 (13.6) | 19 (10.5) | 12 (6.6) | 17 (9.2) |
Most common eventsb, n (%) | ||||||||||
Hypoglycemic unconsciousness | 0 | 0 | 0 | 0 | 0 | 0 | 2 (1.1) | 0 | 0 | 0 |
Ischemic stroke | 0 | 0 | 0 | < 2 | < 2 | 0 | 2 (1.1) | 0 | 0 | 2 (1.1) |
Acute MI | 0 | 0 | < 2 | 0 | 2 (1.2) | 0 | < 2 | < 2 | < 2 | < 2 |
Angina unstable | 0 | 0 | 0 | 0 | 2 (1.2) | 0 | 2 (1.1) | 0 | 0 | 0 |
Nausea | 0 | 0 | 0 | 0 | 0 | 0 | 0 | 0 | 2 (1.1) | 0 |
Vomiting | 0 | 0 | 0 | 0 | 0 | 0 | 0 | 0 | 2 (1.1) | 0 |
Orthostatic hypotension | 0 | 0 | 0 | 0 | 0 | 0 | 0 | 2 (1.1) | 0 | 0 |
Patients who stopped treatment due to adverse events | ||||||||||
n (%) | 4 (2.3) | 7 (4.0) | 13 (7.4) | 4 (2.2) | 24 (14.7) | 8 (5.0) | 13 (7.1) | 16 (8.8) | 24 (13.3) | 5 (2.7) |
Most common eventsc, n (%) | ||||||||||
Gastrointestinal disorders | 3 (1.7) | 4 (2.3) | 9 (5.1) | 1 (0.6) | 19 (11.7) | 3 (1.9) | 9 (4.9) | 12 (6.6) | 19 (10.5) | 1 (0.5) |
Nausea | < 3% | < 3% | < 3% | 0 | 8 (4.9) | 1 (0.6) | 3 (1.6) | 5 (2.8) | 11 (6.1) | 0 |
Deaths | ||||||||||
n (%) | 0 | 0 | 0 | 0 | 1 (0.6) | 2 (1.2) | 0 | 0 | 3 (1.7) | 0 |
CV death, n (%) | 0 | 0 | 0 | 0 | 1 (0.6) | 1 (0.6) | 0 | 0 | 0 | 0 |
Undetermined cause, n (%) | 0 | 0 | 0 | 0 | 0 | 1 (0.6) | 0 | 0 | 2 | 0 |
Notable harms, n (%) | ||||||||||
Nausea | 14 (8.0) | 7 (4.0) | 27 (15.4) | 7 (3.9) | 31 (19.0) | 9 (5.6) | 16 (8.7) | 26 (14.4) | 40 (22.1) | 11 (6.0) |
Vomiting | 4 (2.3) | 6 (3.4) | 10 (5.7) | 2 (1.1) | 15 (9.2) | 1 (0.6) | 4 (2.2) | 13 (7.2) | 16 (8.8) | 4 (2.2) |
Diarrhea | 6 (3.4) | 5 (2.9) | 6 (3.4) | 4 (2.2) | 12 (7.4) | 2 (1.2) | 9 (4.9) | 15 (8.3) | 21 (11.6) | 7 (3.8) |
Hypoglycemia | 1 (0.6) | 1 (0.6) | 0 | 0 | 0 | 0 | 2 (1.1) | 0 | 0 | 1 (0.5) |
Pancreatitis | 1 (0.6) | 0 | 0 | 0 | 0 | 0 | 0 | 0 | 0 | 0 |
MTC | 0 | 0 | 0 | 0 | 0 | 0 | 0 | 0 | 0 | 0 |
Severe hypoglycemia | 0 | 0 | 0 | 0 | 0 | 0 | 0 | 0 | 0 | 0 |
Anaphylaxis | 0 | 0 | 0 | 0 | 0 | 0 | 0 | 0 | 0 | 0 |
AE = adverse event; MTC = medullary thyroid carcinoma; NA = not applicable; PBO = placebo; SAE = serious adverse event; SEM = semaglutide; URTI = upper respiratory tract infection; UTI = urinary tract infection.
aFrequency > 5% in any group.
bFrequency ≥ 2 patients in any group.
cFrequency > 3% in any group.
Note: Data are from the on-treatment period.
Table 58: Summary of Harms (CV Outcome Trial; FAS)
Harms | PIONEER 6 | |
|---|---|---|
SEM 14 mg N = 1591 | PBO N = 1592 | |
Patients with ≥ 1 adverse event | ||
n (%) | NR | NR |
Patients with ≥ 1 SAE | ||
n (%) | 301 (18.9) | 358 (22.5) |
Most common eventsa, n (%) | ||
Acute MI | 21 (1.3) | 22 (1.4) |
Angina unstable | 19 (1.2) | 15 (0.9) |
Pneumonia | 12 (0.8) | 21 (1.3) |
Patients who stopped treatment due to adverse eventsb | ||
n (%) | 426 (26.8) | 268 (16.8) |
Most common eventsc, n (%) | ||
Nausea | 110 (6.9) | 15 (0.9) |
Vomiting | 78 (4.9) | 7 (0.4) |
Diarrhea | 61 (3.8) | 13 (0.8) |
EAC-confirmed deaths, n (%) | ||
All-cause deaths | 23 (1.4) | 45 (2.8) |
Unknown cause of death | 5 (0.3) | 7 (0.4) |
Known cause of death | 18 (1.1) | 38 (2.4) |
CV deaths | 10 (0.6) | 23 (1.4) |
Non-CV deaths | 8 (0.5) | 15 (0.9) |
Notable harms (SAEs only), n (%) | ||
Nausea | 2 (0.1) | 1 (0.1) |
Vomiting | 4 (0.3) | 0 |
Diarrhea | 4 (0.3) | 0 |
Hypoglycemia | 5 (0.3) | 4 (0.3) |
Severed hypoglycemia | 23 (1.4) | 13 (0.8) |
Anaphylaxis | 0 | 1 (0.1) |
Pancreatitis | 1 (0.1) | 1 (0.1) |
MTC | 1 (0.1)e | 0 |
CV = cardiovascular; EAC = event adjudication committee; MI = myocardial infarction; MTC = medullary thyroid carcinoma; PBO = placebo; SAE = serious adverse event; SEM = semaglutide.
aFrequency ≥ 1% patients in any group.
bAdverse events leading to premature treatment discontinuation. Permanent discontinuation of treatment was reported by 184 (11.6%) and 104 (6.5%) of patients in the SEM 14 mg treatment group and placebo treatment group, respectively.
cFrequency ≥ 3% patients in any group.
dADA classification.
eOne case of medullary thyroid cancer (not carcinoma) was reported in the SEM treatment group.
Note: Events reported are based on the on-treatment period, except deaths, which were reported based on the in-trial period.
Source: Clinical Study Report.20
Table 59: Summary of Harms (Population-specific supportive studies; SAS)
Harms | PIONEER 9 | PIONEER 10 | |||||||
|---|---|---|---|---|---|---|---|---|---|
SEM 14 mg N = 410 | SEM 7 mg N = 49 | SEM 14 mg N = 48 | LIRA 0.9 mg N = 48 | PBO N = 49 | SEM 3 mg N = 131 | SEM 7 mg N = 132 | SEM 14 mg N = 130 | DULA 0.75 mg N = 65 | |
Patients with ≥ 1 adverse event | |||||||||
n (%) | 37 (76) | 37 (76) | 34 (71) | 32 (67) | 39 (80) | 101 (77) | 106 (80) | 111 (85) | 53 (82) |
Most common eventsa, n (%) | |||||||||
Nausea | 2 (4) | 5 (10) | 4 (8) | 0 | 1 (2) | 7 (5) | 11 (8) | 12 (9) | 6 (9) |
Diarrhea | 4 (8) | 1 (2) | 3 (6) | 2 (4) | 1 (2) | 2 (2) | 2 (2) | 10 (8) | 4 (6) |
Vomiting | < 5% | < 5% | 0 | < 5% | 0 | 3 (2) | 1 (1) | 9 (7) | 1 (2) |
Nasopharyngitis | 10 (20) | 8 (16) | 9 (19) | 14 (29) | 14 (29) | 34 (26) | 39 (30) | 39 (30) | 19 (29) |
Influenza | 3 (6) | 1 (2) | 1 (2) | 2 (4) | 2 (4) | 9 (7) | 9 (7) | 5 (4) | 2 (3) |
Decreased appetite | 0 | 0 | 6 (13) | 3 (6) | 0 | 0 | 12 (9) | 6 (5) | 3 (5) |
Constipation | 5 (10) | 6 (12) | 6 (13) | 9 (19) | 3 (6) | 12 (9) | 16 (12) | 20 (15) | 6 (9) |
Back pain | 2 (4) | 0 | 3 (6) | 3 (6) | 3 (6) | 4 (3) | 5 (4) | 3 (2) | 4 (6) |
URTI | 3 (6) | 3 (6) | 0 | 0 | 1 (2) | < 5% | < 5% | < 5% | < 5% |
Upper respiratory tract inflammation | 4 (8) | 3 (6) | 2 (4) | 2 (4) | 3 (6) | 4 (3) | 4 (3) | 3 (2) | 5 (8) |
Abdominal discomfort | 1 (2) | 3 (6) | 1 (2) | 2 (4) | 1 (2) | 3 (2) | 6 (5) | 9 (7) | 1 (2) |
Diabetic retinopathy | 0 | < 5% | 0 | 0 | < 5% | 7 (5) | 12 (9) | 5 (4) | 2 (3) |
Dental caries | 1 (2) | 3 (6) | 1 (2) | 0 | 2 (4) | < 5% | < 5% | < 5% | < 5% |
GERD | 4 (8) | 0 | 1 (2) | 1 (2) | 0 | 5 (4) | 2 (2) | 8 (6) | 0 |
Cataract | 1 (2) | 2 (4) | 0 | 1 (2) | 3 (6) | 0 | < 5% | < 5% | < 5% |
Periarthritis | 5 (10) | 0 | 0 | 1 (2) | 2 (4) | 0 | < 5% | < 5% | < 5% |
Patients with ≥ 1 SAE | |||||||||
n (%) | 2 (4) | 3 (6) | 0 | 0 | 3 (6) | 9 (7) | 4 (3) | 7 (5) | 1 (2) |
Patients who stopped treatment due to adverse events | |||||||||
n (%) | 1 (2) | 1 (2) | 2 (4) | 0 | 0 | 4 (3) | 8 (6) | 8 (6) | 2 (3) |
Deaths | |||||||||
n (%) | 0 | 0 | 0 | 0 | 0 | 0 | 0 | 0 | 0 |
Notable harms, n (%) | |||||||||
Nausea | 2 (4.1) | 5 (10.2) | 4 (8.3) | 0 | 1 (2.0) | 7 (5.3) | 11 (8.3) | 12 (9.2) | 6 (9.2) |
Vomiting | 1 (2.0) | 2 (4.1) | 0 | 2 (4.2) | 0 | 3 (2.3) | 1 (0.8) | 9 (6.9) | 1 (1.5) |
Diarrhea | 4 (8.2) | 1 (2.0) | 3 (6.3) | 2 (4.2) | 1 (2.0) | 2 (1.5) | 2 (1.5) | 10 (7.7) | 4 (6.2) |
Hypoglycemia | 0 | 0 | 0 | 0 | 0 | 0 | 0 | 0 | 0 |
Severe hypoglycemia | 0 | 0 | 0 | 0 | 0 | 0 | 0 | 0 | 0 |
Anaphylaxis | 0 | 0 | 0 | 0 | 0 | 0 | 0 | 0 | 0 |
Pancreatitis | 0 | 0 | 0 | 0 | 0 | 0 | 0 | 0 | 0 |
MTC | 0 | 0 | 0 | 0 | 0 | 0 | 0 | 0 | 0 |
DULA = dulaglutide; GERD = gastroesophageal reflux disease; LIRA = liraglutide; MTC = medullary thyroid carcinoma; PBO = placebo; SAE = serious adverse event; SEM = semaglutide; URTI = upper respiratory tract infection.
aFrequency ≥ 5% in any group.
bFrequency ≥ 3% in any group.
Critical Appraisal
Internal validity
All of the included studies used an interactive web/voice response system to randomize patients and maintain allocation concealment. Randomization was stratified by certain patient characteristics, including background therapy in PIONEER 3 to 5 and 8 to 10; renal impairment and CV disease classification in PIONEER 5 and 6, respectively; and country (Japanese and non-Japanese) in PIONEER 1, 3, 4, and 8. Treatment groups were well balanced by baseline characteristics other than by race within studies, and by background medication in PIONEER 9 (semaglutide 7 mg has higher DPP-4 inhibitor use and lower metformin use compared to other treatment groups). It is unclear if these imbalances would have an impact on treatment effect.
Most studies were double-blind, with the exception of PIONEER 2 and 10 (which were open-label studies), and PIONEER 9 was a combination of double-blind for semaglutide tablets and placebo, and open-label liraglutide. Although appropriate measures were implemented to maintain blinding in the remaining PIONEER trials, it is possible that outcomes such as change in A1C and body weight, as well as safety outcomes known to be associated with GLP-1 receptor agonists such as nausea and other gastrointestinal AEs, may allow patients and investigators to infer which treatment was received. This, along with the studies that were open-label may impact patient-reported efficacy (HRQoL outcomes) and safety outcomes.
Trial completion was high in all included studies, but discontinuation from treatment was also high. Differential discontinuation from treatment was generally higher among patients in the semaglutide treatment groups than comparator groups, and were mostly the result of nausea and other GI AEs associated with semaglutide tablets.
The primary and key secondary outcomes in included studies PIONEER 1 to 6, 8 and 9 were based on objective outcomes, such as A1C, body weight, and time to first occurrence of MACE, and therefore would be less impacted by potential bias introduced from the open-label study designs or inferred randomization. The primary outcome in PIONEER 10 was based on the number of treatment-emergent AEs, which would remain subject to the limitations described. Primary and key secondary end points were measured as a change from baseline at 26 weeks, which is a short period of analysis for a chronic disease; however, the clinical expert consulted for this review noted that this is a sufficient amount of time to observe a treatment effect in terms of A1C and body weight. Despite this, evidence for maintenance of effect is limited. Of note, some of the studies included longer time points, up to 52 or 78 weeks, but these assessments were not controlled for multiplicity.
With respect to the statistical analysis of the included studies, efficacy analyses were conducted using the FAS, which followed an intention-to-treat principle. All randomized patients were included and were analyzed based on the treatment groups they were assigned to. Further, the studies employed 2 estimands in their statistical analyses. The treatment policy evaluated the primary outcome regardless of adherence to randomized treatment and initiation of rescue medication, which was the primary source of data used in this review.
The use of additional anti-diabetic medication and rescue medication was notable in all studies, with imbalances between groups within studies. The highest rates of additional anti-diabetic medication use were among semaglutide 3 mg and placebo treatment groups as well as the sitagliptin treatment group in PIONEER 3 at week 52 and later. It is possible that these imbalances may have impacted the treatment effect in the groups with high concomitant medication use. Sensitivity analyses were conducted to investigate the impact of missing data on efficacy outcomes. A pattern mixture model that used comparator-based multiple imputation and AE-determined comparator-based multiple imputation, as well as a tipping-point analysis were 3 sensitivity analyses used in PIONEER 1 to 5 and 8. Primary analyses were confirmed by pre-defined sensitivity analyses.
PIONEER 1 to 5, 8, and 9 were adequately powered to detect a change from baseline in A1C as the primary outcome, as well as change from baseline in body weight as the key secondary outcome (except PIONEER 9). PIONEER 2 to 4 were also powered to assess non-inferiority of semaglutide to active comparators. A pre-defined non-inferiority margin of 0.4% was used in PIONEER 2 and PIONEER 4 for comparisons to empagliflozin and liraglutide, respectively, and a pre-defined non-inferiority margin of 0.3% was used in PIONEER 3 for the comparison to sitagliptin. A non-inferiority margin of 0.3% is generally accepted, although it is subject to changes based on the clinical context. The rationale for a non-inferiority margin of 0.4% provided by the sponsor was to provide assurance that semaglutide had a clinically relevant effect greater than zero. In addition, the anticipated advantage of semaglutide to empagliflozin in terms of body weight, but this was not demonstrated. PIONEER 6 was adequately powered to assess the time from randomization to first occurrence of a MACE. PIONEER 10 was designed to assess safety related outcomes and was therefore not powered for any efficacy evaluations. None of the included studies were powered to assess additional measures of efficacy such as HRQoL or changes in the lipid profile.
A multi-branched gatekeeping testing procedure was used to account for multiple comparisons among the primary and key secondary end points in PIONEER 1 to 4, and 8 and a simple hierarchical testing procedure was used in PIONEER 5 and 6, both of which were appropriate methods of control for multiplicity; however, this was limited to change from baseline to week 26 in A1C and body weight in most of the included studies. Consequently, any outcomes reported outside of the testing procedure in the included studies were subject to increased risk of type I error. PIONEER 9 and 10 did not control for multiplicity. PIONEER 6 controlled for the primary analysis of time to first EAC-confirmed MACE only. There was as high rate of trial completion in the included studies and therefore missing data was not seen as a significant concern in the included studies. Multiple imputation was used to handle missing data for the primary analyses at week 26 and the imputation assumed data was MAR. Missing data was also accounted for using multiple imputation for secondary end points.
Subgroup analyses based on various demographic and disease characteristics at baseline were specified a priori for PIONEER 6 and randomization was stratified by CV disease or risk factors at baseline. PIONEER 3 and 4 offered post-hoc subgroup analyses for the primary and key secondary outcomes, change in A1C and change in body weight, by background therapy. Exploratory subgroup analyses were also conducted for change from baseline in A1C and body weight in the remainder of the studies. PIONEER 3 to 5, and 8 to 10 were stratified by baseline therapy to account for any imbalances between treatment groups that may impact the reported treatment effect.
Safety analyses were primarily reported based on the on-treatment observation period, or the time when a patient was on treatment with treatment, including any period after initiation of rescue medication. Any AEs that followed discontinuation of treatment would not have been captured.
Lastly, the primary end point in PIONEER 6 (the CVOT) was a time to event analysis. Patients were censored at the end of the observation period if they did not experience a MACE; censored patients were considered still at risk and accounted for in assessments. The primary analysis assessed semaglutide 14 mg compared to placebo for non-inferiority followed by superiority. The non-inferiority margin used was a HR of 1.8, which was considered inappropriate by Health Canada11 as 1.3 is the recommended.21 Of note, the results would have met the 1.3 margin threshold as well, although this analysis was not pre-specified.
External validity
Included studies provided evidence for a heterogenous population of patients with T2DM in terms of disease background, treatment experience, background therapies, and comorbid conditions (renal impairment and CV disease). The clinical expert consulted for this review supported that the trials overall were fairly generalizable to Canadian patients living with T2DM; however, there are some issues to note. The demographic characteristics of patients are not reflective of the diversity of Canadian patients in terms of race or ethnicity. For example, 86% or more of patients included in PIONEER 2 and 5 were White, and Asian patients were generally underrepresented across trials. PIONEER 6 and 8 were the only studies that included patients from study sites located in Canada. PIONEER 9 and 10 only included patients from Japan that had a lower average body weight, were mostly male (68% to 83% of patients) and were on a combination of background therapies that is atypical for patients living in Canada (high use of TZD and Alpha-glucosidase inhibitor in PIONEER 10). Patients in PIONEER 5 and 8 were older (mean age of 70 to 71 and 60 to 61, respectively). The inclusion/exclusion criteria for PIONEER 5, which was specific to patients with renal impairment, and PIONEER 8, the insulin add-on study, may have contributed to the recruitment of older patients in these studies.
None of the trials included patients that were specifically contraindicated or intolerant of metformin. In PIONEER 1 and 9 where semaglutide was used as monotherapy, patients were previously treated with diet and exercise, or an OAD (in PIONEER 9) that required a wash-out period. The clinical expert consulted for this review relayed that although the PIONEER 1 population is not representative of patients contraindicated to or intolerant of metformin, it is unlikely to impact the treatment effect for patients with a contraindication to metformin; however, they were unsure if the results were applicable to patients with intolerance to metformin, making this a limitation of the study.
Empagliflozin 25 mg, sitagliptin 100 mg, liraglutide 0.9 mg and 1.8 mg, and dulaglutide 0.75 mg were included as comparators in the included studies. The range of comparators selected were representative of the range of available treatments in Canadian clinical practice, and the dosages/administration schedule of the comparators used in the PIONEER trials were aligned with the Health Canada–approved dosing (with the exception of liraglutide 0.9 mg in PIONEER 9, which was administered according to the Japanese label). Additionally, semaglutide tablets was evaluated as a second-line and third-line therapy across the included studies as an add-on to: metformin alone, SU alone, metformin and SU, metformin and an SGLT2 inhibitor, basal insulin with or without metformin, glinide, TZD, and alpha-glucosidase inhibitors.
Most of the outcomes assessed in the included studies were relevant to clinical practice and based on clinical outcomes such as change in A1C, body weight, lipid profile, blood pressure, mortality, and diabetes-related morbidity. According to the clinical expert consulted for this review, the HRQoL outcomes or formal HRQoL outcomes in general are not typically used in clinical practice as far as routine management of patients with diabetes goes. The clinical expert also noted that the definition of MACE used in PIONEER 6, which included CV death, non-fatal MI or non-fatal stroke, was relevant to clinical practice. The trial duration of the trials ranged from 26 weeks to 78 weeks, which may be suitable for the assessment of outcomes, but is limited in the applicability to long-term outcomes or sustainability of treatment effect for a chronic disease.
Indirect Evidence
The objective of this section is to critically appraise the sponsor-submitted ITC that assessed the comparative efficacy of semaglutide tablets as a second- or third-line treatment.
The sponsor-submitted ITC was reviewed, summarized, and critically appraised.
Description and methods of sponsor-submitted ITC
The objective of this section is to critically appraise the sponsor-submitted ITC that assessed the comparative efficacy of semaglutide tablets as a second- or third-line treatment.
The sponsor-submitted ITC was reviewed, summarized, and critically appraised.
Methods of the sponsor-submitted ITC
Objectives
The primary aim of the sponsor’s ITC was to evaluate the efficacy and safety of semaglutide tablets compared with other anti-diabetic therapies in patients with T2DM as a second-line treatment added to metformin and as a third-line treatment added to metformin and SU.
Study Selection Methods
Literature Search
Relevant studies were identified by searches of EMBASE, MEDLINE, and Cochrane Central Register of Controlled. The search was up to November 21, 2018, and was limited to studies published in English. In addition, abstracts from conference proceedings published from 2016 to 2018 at either the European Association for the study of Diabetes, American Diabetes Association or International Diabetes federation were included. Lastly, HTA websites and databases for CADTH, PBAC, NICE, AWMSG, and SMC were searched.
Table 60: Study Selection Criteria and Methods for ITCs
Criteria | Inclusion | Exclusion |
|---|---|---|
Population | Adult patients with diagnosed T2DM either: Inadequately controlled with metformin Inadequately controlled with 1–3 OADs | Treatment naïve patients Healthy volunteers Children (< 18 years) |
Intervention | Metformin GLP-1 RAs: Semaglutide, Exenatide, Liraglutide, Lixisenatide, Dulaglutide, Albiglutide, Taspoglutide SGLT2 inhibitors: empagliflozin, Canagliflozin, Dapagliflozin, Ertugliflozin, Ipragliflozin (ASP-1941),Remogliflozin etabonate (BHV091009), Sergliflozin etabonate, Sotagliflozin, Tofogliflozin DPP-4 inhibitors: Sitagliptin, Vildagliptin, Saxagliptin, Linagliptin, Gemigliptin, Anagliptin, Teneligliptin, Alogliptin, Trelagliptin, Omarigliptin, Evogliptin, Gosogliptin, Dutogliptin Thiazolidinediones: Rosiglitazone, Pioglitazone, Lobeglitazone SU derivatives: Acetohexamide, Tolbutamide, Chlorpropamide Tolazamide Glibenclamide, Glimepiride, Glipizide, Gliclazide Gliquidone, Carbutamide, Glycyclamide (tolhexamide) Metahexamide, Glibornuride, Glisoxepide, Glyclopyramide Note: RCTs assessing these interventions (either as monotherapy or combination therapy) were included irrespective of dosing regimen | Non-pharmacological interventions (such as lifestyle management) |
Comparator | Placebo Any other pharmacological treatments | Non-pharmacological interventions (such as lifestyle management) |
Outcome | Efficacy:
| |
• Incidence/rate of nocturnal hypoglycaemia | ||
Study design and factors | RCTs with treatment duration ≥ 20 weeks | |
Language | English | |
Search Period | Up to November 21, 2018 | |
Source: Sponsor-submitted ITC.62
Eligibility Criteria: Studies were eligible for inclusion that: (1) were any RCTs, irrespective of blinding status; (2) enrolled adults (at least 18 years of age) with any diagnosis of T2DM and (3) were over 20 weeks in duration.
Study Selection: It is unclear how screening and study selection was conducted and the number of reviewers involved. The protocol followed a predefined search strategy and full text published articles were selected based on predefined eligibility criteria.
Data extraction: One reviewer extracted data and a second reviewer conducted the quality check of the data extraction, which was compared for accuracy. If multiple publications were identified for the same patient population, location and setting, intervention details, baseline data and study data, such studies were linked and extracted as a single reference. Data from figures in publications were extracted using digital extraction tools.
Comparators
Comparators of interest were placebo and other pharmacological treatments, including (specific drug listed in Table 10):
Metformin
Other GLP-1 RAs
SGLT2 inhibitors
DPP-4 inhibitors
Thiazolidinediones
SUs
Note: All dose categories comparators were analyzed together.
Outcomes
The efficacy outcomes analyzed for the ITC were:
Change from baseline in A1C at 24 ± 4 weeks (%, continuous outcome)
Change from baseline in body weight at 24 ± 4 weeks (kg, continuous outcome).
A time point of 24 ± 4 weeks was chosen for the analysis of each outcome as it represents approximately 6 months of treatment and the level of response to treatment is assumed not to vary considerably within 4 weeks of target week. Both A1C and weight are continuous outcomes and were modelled in terms of the mean change from baseline. For a small number of trials, the complete set of data values (change and uncertainty) for each outcome was not reported and was back-calculated using established methods.
Quality assessment of included studies
For all the included studies, study quality was assessed using the standard NICE checklist, which evaluates 7 domains relating to randomization, blinding, imbalances between treatment groups, outcomes measured and reported, and handling of missing data. No sensitivity analysis was conducted applying the quality assessment results to exclude studies.
ITC analysis
Populations and Comparators
All studies that met the inclusion for the SLR were eligible for inclusion in the ITC. The populations of interest were patients with T2D who received a second line treatment (and had MET as background therapy) and, separately, patients who received a third line treatment (and had metformin + SU as background therapy). Second-line therapy was defined as patients who had previously been treated with single MET background therapy and third-line therapy was defined as patients who had previously been treated with MET + SU. The comparators used in the network were based on studies that met the inclusion criteria and included other second and third line drug classes (Table 61).
Table 61: Comparators included in the network meta-analysis
Drug Class | Included in Second-Line Network | Included in Third-Line Network |
|---|---|---|
|
|
|
|
|
|
|
|
|
|
|
|
|
|
|
vvvvvvv vvvvvvvvvv vvvvvvvvvvv vvvvvvvvvv vvvvv vvv vvvvvvvvvvvvv vvvvvvv vvvvvvvv vvvvvvvv vvvvvvvv vvvvvvvvvvvvvvvvvvvvvvvvvvvvvvv vvvvvvvvvv vvv vvvvvvvvvvvvv vvvv vvvvvvvvvvvvvvvvvv
Analysis: The submitted ITC used a Bayesian-based framework to conduct multiple network meta-analyses. Both fixed and random-effects models were conducted with all models reporting the change from baseline for both outcomes. Analyses were conducted using a Markov Chain Monte Carlo (MCMC) method using WINBUGS software package. Three Markov Monte-Carlo chains were used, starting from different initial values of selected unknown parameters with a burn-in of 50,000 iterations. All models used non-informative priors. The analysis was conducted using WinBUGS software package with the selection on models based on suggestions per the NICE Decision Support Unit. The normal likelihood, identity link model was used as it is assumed that the mean changes from baseline in the included trials follow a normal distribution. The methodology also followed guidance from the ISPOR Task Force on Indirect Treatment Comparisons. The results are presented as both mean (SD) and median (95% CrI) of the relative treatment differences. Credible intervals (CrI) were reported. No sensitivity or subgroup analyses were reported.
Model fit was assessed using the deviance information criterion (DIC). The choice of the model was based on model convergence as well as DIC and the average posterior residual deviance. The model was selected if it has a lower DIC (> 3 points are considered important) and the average posterior residual deviance is close to 1; however, if no important differences were observed, the FE model is preferred. Convergence for all models was assessed by analyzing history and density plots, and Brooks-Gelman-Rubin diagnostic plots. In addition, autocorrelation plots were assessed to detect the presence of auto-correlation in the chains. Lastly, inconsistency was assessed using node-splitting models by comparing direct and indirect comparisons.
Results of sponsor-submitted ITC
Summary of included studies
vvv vvvvvvvvvv vvvvvv vvvvvvvvvv vvvvvv vvvvvvvvvvvv vvvvvvvvvv vvvvvvv vvvvvvv vvvvvvvv vvv vvvvvvvv vvvvvvv vvvvvvvv vv vvvvvvvvvv vvvvvv vvvvv vvvvvvvvvvv vvvvvvvvvvv vvvvvv vvvvvvvvvv vvvvvvvvv vvvv vvvvvvvvvv vvvvvvv vv vvv vvvvvvvv vvvvvvv vvvvvvvv vvv vvvvvv vvv vvv vvvvvvvv vvv vvvvvvvvvv vvv vv vvv vvvvvvvv vvvvvv vvvv vvvvvvvvv vvvvvvvvvvvvv vvvvvvvvvvv vvvvvvvv vvvvvvv vvvv vvv vvvvvvvv vv vvv vvvvvvv vvvv vv vvvvvvv vvvv vvvvvvvv vvv vvv vvvvvvvvvvv vvv v vvv vvv vvvvv vvvv vvvvv vvv vvvvvvvv vv vvvvvv vvvv vvvvvvv vv vvvvvvvvv vvvvv vvvvvvvv vv vv vvvvvvv vvv v vvvvvvvvv vvvvvvvv vvvvvvv vvvvvvv vvv vvvvvvvv vvv vvvv vvvvvvvv vvvvv vvvvvv
vvv vvvvvvv vvvvvvvvvv vvvvvvvvv vvvvv vvv vvvvvvv vvvvvvvv vv vvv vvvv vvvvv vvvv vvv vvvvvvv vvvv vv vvvv vvvvvvvv vvv vvvvvv vvvv vvvvvvvvvvv vvvvvvv vvv vvv vv vvvv vvvvvv vvv vvvvvvvvvvvvv vvv vvvvvvvv vv vvv vvvvvvvvvv vvv vvvvvvvvvv vvv vvvvvvv vvvv vv vvvv vvv vvvvv vvvv vvvvvvvv vvvv vvv vv vvv vvvvvvvv vvvvvvvv vvv vvvvvvv vvvv vvvvvvvvv vvvvvvvvvvvvv vvv vv vvvvvvvvv vv vvvvvvvv vvvvvvv vvvv vvv vvvvvv vvvv vvv vvv vvvvvvv vvv vvvvvvvvvvvvv vvvvv vvvvvvv vvv vvv vvvv vvvv vvv vvv vvvvvvvv vv vvv vvv vvvvvvv vvvv vvvvvvv vvvvvvvvv
vvvvvvvvvvv
vvvvvvvv vvvvvvvv
vvv vvvvvv vvvv vvv vvv vvvvvvvv vv vvvvvvv vv vvv vvvvvvv vvvv vv vv vvv vvvvvv vvvvvvvv vv vvvvvvvv vvv vvvvvv vvvvvvvv v vvvvv vv vvv vvv vvvvvvvv vvvv vv vvvvvvv vvv vvvv vv vvv vvvvvvvvv vvvvvvv vvvv vv vv vvvv vvv vvvvvvvv vvv vvvvvvv vvv vvvvvvvvv vvvvvvv vvvvvv vvvv vvv vv vvvv vvv vvvvvvv vvvvvvvv vvv vvv vvvvvvv vvv vvvvvvvv vvvvvv vvv vv vvvvvvv vv vvvv vv vvvvvvv vvvv vvvv vv vvvvv vvv vvv vvvvvvv vvvv vvvvv vvvv vvv vvvvvvv vvvv vvv vvvvvvv vvvv vvvv vv vvvvv
Table 62: Summary of included studies and baseline characteristics
Characteristics | |
|---|---|
|
|
|
|
|
|
|
|
Baseline Characteristics (mean (range) per arm) | |
|
|
|
|
*Adapted from sponsor-submitted ITC report.
Figure 4: Network of trials for NMA for second-line therapy

Figure 4 has been redacted at the sponsor’s request.
vvvvvvvv vvvv vvvvvvvvvvvvvvvvv vvv vvvvvvv
Source: Adopted from sponsor’s submitted ITC.
vvv vvvvvvvv
vvvvvvvv vvvvvvv vvvvvvvvv vvvv vvvv vvvvvvvvvvv vvv vvvv vvvvvvvvvvv vvv vvvvvvvv vvv vvvvvv vvv vv vvvvv vvvvvvvvvvv vvvvvvvvvv vvvvvv vvvv vvvv vvvvvvvvvvv vv vv vvv vvvvvvvvvv vvvv v vvvvvvvvvvvvvvvvv vvvvvvvvvvv vvvvvvvvvv vv vvvvv vvv vvvvvvvvvv vvvvvvvvvvv vvvv vv vvv vvv vv vvvv vvvvvvvvvvv vvv vv vvv vvv vvvvvvvvvvv vvv vv vvv vvvv vvvvvvvvvvv vvv vvvvvvvvvv vvvv v vvvvvvvvvvvvv vvvvvvvvvvv vvvvvvvvv vv vvvvv vvv vvv vvvvv vvvvvvvvvvv vvvvvv vvvvvvvv vvv vvvvvvv vvv vvvvv vv vv vvvvvvv vvvvvvvvvv vvvv vvvv v vvvvvvvvvvv vv vvvvv vvvvv vv vv vvvvvvvvvvvv vvvvvvvvvvvvvvvvvvvvvvvvvvvvvvvvvvvvvv vvvvvvvvvv vvvvvvvv vvv vvvvvv vvv vvvvvvv vvvvvvvv
vvvvvv vvvv vvvvvvvvvv vvvvvvvvvv vv vvvvvvv
vvv vvvvvvvvv vvvvvvvvvv vv vvvvvv vvvvvvvv vvv vvvvvvv vv vv vvvvvvvv vvvv vvvvvvvvvvv vv vv vvv vvvvvvvvvv vvvv v vvvvvvvvvvvvvvvvv vvvvvvvvvvv vvvvvvvvv vv vvvvvv vvv vvvvvvvvvvvvv vvv vv vvv vvvvvvvvvvvvv vv vv vvv vvv vvvvvvvvvvv vvv vv vvv vv vvvvvvvvvv vvvv vvvvvvvvvvv vvv vv vvv vvvv vvvvvvvvvvv vv vv vvvvvv v vvvvvvvvvvvvv vvvvvvvvvvvvv vvvvv vvvvvvvvv vv vvvvvvv vvvv vvvvvvvvvvv vv vv vvv vvvvvvvvvv vvvv vvvvvvvvvvvvv vvvvvvvvvvvvv vvvvvvv vvvvvvvvv vv vvvvvv vvv vvv vvvvv vvvvvvvvvvvv vvv vvvvvvv vvv vvvvv vv vv vvvvvvvvvv vvvvvvvvvvv
Table 63: Random effects results for treatment difference in A1C (%)
Drug Class | Comparator | Relative treatment difference HbA1c, % Oral semaglutide 14 mg vs comparator | |
|---|---|---|---|
Median (95% CrI) | Mean (SD) | ||
|
|
|
|
|
|
| |
|
|
| |
|
|
| |
|
|
| |
|
|
| |
|
|
| |
|
|
| |
|
|
| |
|
|
| |
|
|
|
|
|
|
| |
|
|
| |
|
|
| |
|
|
| |
|
|
| |
|
|
| |
|
|
| |
|
|
|
|
|
|
| |
|
|
| |
|
|
| |
|
|
| |
|
|
|
|
|
|
|
|
|
|
| |
CrI, credible interval; FE, fixed effects; HbA1c, glycated hemoglobin; MET, metformin; QD, once-daily; SD, standard deviation; TZD, thiazolidinedione.
*Adapted from sponsor submitted ITC report.62
Table 64: Random effects results for treatment difference in weight (kg)
Drug Class | Comparator | RE results: relative treatment difference weight (kg) Oral semaglutide 14 mg vs comparator | |
|---|---|---|---|
Median (95% CrI) | Mean (SD) | ||
|
|
|
|
|
|
| |
|
|
| |
|
|
| |
|
|
| |
|
|
| |
|
|
| |
|
|
| |
|
|
| |
|
|
| |
|
|
|
|
|
|
| |
|
|
| |
|
|
| |
|
|
| |
|
|
| |
|
|
| |
|
|
| |
|
|
|
|
|
|
| |
|
|
| |
|
|
| |
|
|
|
|
|
|
|
|
|
|
| |
CFB, change from baseline; CrI, credible interval; MET, metformin; NMA, network meta-analysis; QD, once-daily; QW, once-weekly; RE, random effects; SD, standard deviation; vvv vvvvvvvvvvvvv vvvv vvvvvvvvvvvvvvvvvv
Source: Adapted from sponsor submitted ITC report.62
vvvvv vvvv
vvvvvvvv vvvvvvv
vvv vvv vvv vvvvvvvvvv vvvvvvvvv vvvvvvvv v vvvvvvv vv vvv vvvvvvv vvvv vvv vv vvv vvvvvv vvvvvvvv vv vvvvvvvv vvv vvvvvv vvvvvvvv v vvvvv vv vvvvv vvvvvvvv vvvv vv vvvvvvv vv vvv vvvvvvvv vvv vvvvvvvvv vvvvvv vvvvvvv vvvv vv vv vvvv vvv vvvvvvvv vvv vvvvvvv vvv vvvvvvvvv vvvvvvv vvvvvv vvvv vv vv vvv vvv vvvvvvv vvvvvvvv vvv vvv vvvvvvv vvv vvvvvvvv vvvvvv vvv vv vvvvvvv vv vv vv vvvvvvv vvvv vv vv vv vv vvv vvv vvvv vvv vvvvvvv vvv vvv vvvvvv v vvvvvvvv vvvvvvv vvv vvvvvvv vvvv vvvvvvvvv vvvv vvvv vv vvvvv
Table 65: Summary of included studies and baseline characteristics
Characteristics | |
|---|---|
|
|
|
|
|
|
|
|
Baseline Characteristics (mean (range) per arm) | |
|
|
|
|
*Adopted from sponsor-submitted ITC report.62
Figure 5: Network of trials for NMA for third line

Figure 5 has been redacted at the sponsor’s request.
Source: Adopted from sponsor’s submitted ITC.62
Results
vvv vvvvvvvv
vvvvvvvv vvvvvvv vvvvvvv vvvv vvvv vvvvvvvvvvv vvv vvv vvvv vvvvvvvvvvv vvv vvvvvvvv vvv vvvvvv vvv vvvvv vvvvv vvvv vvvvvvvvvvv vv vvv vvvvv vv vv vvvv vvvvvvvvvvv vvvv vvvvvvv vvvvvvvvvvvvv vvvvvvv vvv vvvvvvv vvv vvvvv vv vv vvvvvvvvvv vvvvvvvvvvv
Table 66: Fixed effects results for treatment difference in A1C (%)
Drug Class | Comparator | FE results: relative treatment difference HbA1c, % Oral semaglutide 14 mg vs comparator | |
|---|---|---|---|
Median (95% CrI) | Mean (SD) | ||
|
|
|
|
|
|
|
|
|
|
|
|
|
|
| |
|
|
| |
|
|
| |
|
|
| |
|
|
|
|
|
|
| |
CrI, credible interval; DPP-4 = dipeptidyl peptidase 4; GLP-1 RA = glucagon-like peptide 1 receptor agonist; FE = fixed effects; QD, once-daily; SD, standard deviation; SGLT-2i = sodium-glucose cotransporter-2 inhibitor; vvvv vvvvvvvvvvvvvvvvvv
Source: Adapted from sponsor submitted ITC report.62
Weight Loss (treatment difference in weight)
vvv vvvvvvvvv vvvvvvvvvv vv vvvvvv vvvvvvvv vvv vvvvvvv vv v vvvvvvv vvv vvvvvvvv vvvvvvv vvvvvvvvv vvvv vvvv vvvvvvvvvvv vvv vvv vvvv vvvvvvvvvvv vvv vvvvvvvvv vvvvvvvvvv vv vvvvvv vvvvvv vvv vvvvv vvvvv vvvv vvvvvvvvvvv vv vvv vvv vvvvv vv vv vvvv vvvvvvvvvvv vvvv vvvvvvv vvvvvv vvvvvvv vvvvv vvv vvvv vvvv vvvvv vvvvv vvvvvv vvv vvvvv vvvvv vv vvvvvvvvvvvv vvv vvvvvvv vvv vvvvv vv vv vvvvvvvvvv vvvvvvvvvv.
Table 67: Random effects results for treatment difference in weight (kg)
Drug Class | Comparator | RE results: relative treatment difference weight (kg) Oral semaglutide 14 mg vs comparator | |
|---|---|---|---|
Median (95% CrI) | Mean (SD) | ||
|
|
|
|
|
|
| |
|
|
| |
|
|
| |
|
|
| |
|
|
|
|
|
|
|
|
|
|
|
|
|
|
| |
CrI, credible interval; vvvvv v vvvvvvvvvv vvvvvvvvv vv vvvvv vv v vvvvvvvvvvvvv vvvvvvv v vvvvvvvv vvvvvvvv MET, metformin; NMA, network meta-analysis; QD, once-daily; RE, random effects; SD, standard deviation; vvvvvvv v vvvvvvvvvvvvvv vvvvvvvvvvvvvvv vvvvvvvvvv vvvv vvvvvvvvvvvvvvvvv.
Source: Adopted from sponsor’s submitted ITC.62
Safety
No Safety analysis was completed.
Critical Appraisal of sponsor-submitted ITC
The sponsor-submitted ITCs were a transparent but limited synthesis of the current evidence concentrating on only 2 outcomes, A1C and weight loss. The evidence presented in the 2 ITCs (second- and third-line) overall does not refute the conclusion that semaglutide is more efficacious than placebo but suggests the conclusion that semaglutide may be superior to other diabetes treatments in terms of efficacy. Importantly, these submitted analyses have limitations that hinder their generalizability and applicability.
The major concerns with the submitted ITCs are limited analysis and the limited evidence base used in terms of outcomes. Both of these concerns greatly limit the utility of the results in evaluating the comparative efficacy and safety of the agent both within class and within indication. Other outcomes and changes could have been used to align with other published ITCs in the literature.
The ITCs presented a comprehensive search of multiple databases over a reasonable period that allowed the inclusion of a large number of studies. Overall, the methodology presented is in line with current methodological standards for systematic reviews. Screening of studies for eligibility occurred over multiple phases (titles/abstracts, and full-texts) by 2 reviewers working independently. There is concern that conducting quality assessment by only 1 reviewer would limit the reliability of those results. Importantly, the search was limited to studies that would likely only be of high quality. Additionally, the information was not used in any way to inform the analysis such as a sensitivity analysis.
The methodology used for the ITC was in-line with current NMA standards. Although their selection of models (random or fixed) was supported by reasonable methodological justification it would have been more robust if the analysis included both to allow for comparison or presented at minimum the random effects model for all analysis. A key limitation is that the analysis was limited in controlling for factors that differ between studies. They had a large evidence base for the 2nd-line analysis to allow for the exploration of how baseline differences between trials differed. There was insufficient assessment of potential sources of heterogeneity between studies. There are notable differences between studies that may introduce a potential bias due to the inclusion of different populations that may respond different to drugs. For example, more recent studies, and those with semaglutide, tend to have slightly higher baseline weights and A1C and thus an increased likelihood of a greater absolute reduction for newer treatments- which was the primary outcome in this ITC. Additionally, no other information such as years of treatment, BMI, ethnicity, or sex were explored.
Lastly, any assessment of safety was not conducted. This is a missed opportunity to explore differences in safety as well as better understanding potential differences in discontinuation due to adverse events. This would have allowed for alignment with other ITCs in the literature. Given the high rate of nausea and discontinuation that occurs with this class of medications this understanding is important in contextualizing any results seen and have some strong overlaps with the efficacy outcomes.
Summary
The applicability of sponsor’s ITC is impacted of the limited scope of the analysis and minimalistic analysis conducted. As described above, the sponsor ITC did include an extensive systematic review but was limited to only 2 outcomes. This restriction significantly limited the utility and the robustness of the results. Importantly, no exploration of baseline differences between studies was included. Overall, the results of the submitted ITC indicate semaglutide is likely better than placebo both as second- and third-line therapy and the results suggest potential superiority to other treatment classes, specifically SGLT-2 inhibitors, DPP-4 inhibitors, TZD, and SUs. However, all of the results should be interpreted with consideration for the previously described limitations. No conclusions can be made for efficacy or safety outcomes beyond glycemic reduction and weight loss since these outcomes were not evaluated.
Other Relevant Evidence
No other evidence was included in the sponsor’s submission to CADTH that was considered to address important gaps in the evidence included in the systematic review.
Discussion
Summary of Available Evidence
A total of 10 RCTs met the inclusion criteria for the systematic review. PIONEER 1 to 6 and 8 to 10 have been summarized in detail for this report. Note that the intervention in the pivotal PIONEER 7 study, semaglutide with flexible dosing, is not aligned with the criteria specified in the CADTH review protocol or the dosing recommended by Health Canada. Therefore, all data for PIONEER 7 are presented in Appendix 3. The trials evaluated the efficacy and safety of semaglutide tablets (3 mg, 7 mg, and 14 mg once daily) in adults with T2DM over 26 to 78 weeks of therapy. Although semaglutide 3 mg was evaluated as a maintenance dose in the trials and summarized as such, it is intended for use as a starting dose (for up to 30 days) as indicated in the product monograph.10 At baseline, patients had lived with T2DM for 3 to 16 years, had A1C levels that ranged from 7.9% to 8.4%, and were receiving treatment that ranged from diet and exercise alone to stable treatment with at least 1 antidiabetic medication. Patients included in PIONEER 5 and PIONEER 6 were living with moderate renal impairment, and cardiovascular disease, respectively.
The trials were designed to assess semaglutide in comparison to a SGLT2 inhibitor (empagliflozin, PIONEER 2), a DPP-4 inhibitor (sitagliptin, PIONEER 3), and subcutaneous GLP-1 RAs (liraglutide, PIONEER 4 and 9, and dulaglutide, PIONEER 10), as well as placebo (PIONEER 1, 4 to 6, 8, and 9). Of note, PIONEER 4 and 9 were both active- and placebo-controlled trials. Semaglutide was evaluated as monotherapy (PIONEER 1, 6 and 9), as an add-on to metformin (PIONEER 2), as an add-on to 1 to 2 OADs (PIONEER 3, 4, 10) or insulin with or without metformin (PIONEER 8). The primary and key secondary outcomes in most of the trials was change from baseline to week 26 in A1C (%) (PIONEER 1 to 5, 8 to 9) and change from baseline to week 26 in body weight (kg) (PIONEER 1 to 5, 8), respectively. PIONEER 6 was an event-driven CVOT that used time from randomization to first occurrence of a MACE as the primary outcome. Additionally, PIONEER 6 was the only trial to report diabetes-related morbidity and mortality outcomes. The number of TEAEs during exposure to treatment was the primary outcome in the Japanese safety study, PIONEER 10. Other outcomes reported include HRQoL outcomes, blood pressure, and lipid profiles.
A hierarchical testing procedure was implemented in PIONEER 1 to 8, but only included outcomes for change in A1C and body weight at week 26, and time to first confirmed MACE in PIONEER 6. Outcomes such as change in HRQoL, blood pressure, or lipids should be interpreted with consideration for type I error. The disproportionate occurrence of GI AEs may have lead to unblinding and contributed bias to patient-reported outcomes such as HRQoL and safety outcomes. The high rate of additional anti-diabetic medication use may have lead to an over-estimation of treatment effect in some of the treatment groups, such as semaglutide 3 mg.
One sponsor-submitted ITC was included in this review. The ITC was designed to evaluate the efficacy and safety of semaglutide compared with other anti-diabetic therapies in patients with T2DM as a second-line therapy in patients previously treated with metformin and as a third-line therapy in patients previously treated with metformin and SUs.
Interpretation of Results
Efficacy
For active-controlled studies PIONEER 2, 3, and 4, which evaluated semaglutide as second- or third-line therapy, non-inferiority of semaglutide to active comparators needed to be demonstrated before analyses of superiority. Semaglutide 14 mg demonstrated that it was not unacceptably worse (non-inferior) when compared to empagliflozin (PIONEER 2) and liraglutide (PIONEER 4) in terms of A1C (%) reduction at week 26. In PIONEER 3, comparisons of semaglutide to sitagliptin demonstrated non-inferiority in A1C (%) reduction at week 26 for the 7 mg and 14 mg dosage strengths. A non-inferiority margin of 0.4% was used in PIONEER 2 and 4, and 0.3% was used in PIONEER 3. According to guidance from the European Medicines Agency, a margin of 0.3% is generally considered acceptable, although it is subject to change based on the clinical context. The rationale provided for the use of a wider non-inferiority margin in PIONEER 2 and 4 was weak and noted as limitation for associated assessments. Nonetheless, following tests for non-inferiority superiority was assessed and semaglutide 14 mg demonstrated a greater reduction in A1C (%) when compared to empagliflozin (PIONEER 2), as did semaglutide 7 mg and 14 mg when compared to sitagliptin (PIONEER 3). Of note, the confidence intervals for glycemic reduction in PIONEER 2 and 4 excluded the value of 0.3% which suggests that the choice of the non-inferiority margin likely would not have impacted conclusions for these comparisons. The treatment difference for semaglutide 14 mg did not demonstrate a superior reduction in A1C (%) compared to liraglutide 1.8 mg at week 26 (PIONEER 4). PIONEER 9 and 10 also assessed semaglutide compared to other GLP-1 RAs; however, the results of these trials should be considered supportive due to issues with generalizability. In these trials, treatment differences in A1C were in favour of semaglutide 14 mg, with mixed results for semaglutide 7 mg and 3 mg, when compared to liraglutide 0.9 mg and dulaglutide (at week 26).
In placebo-controlled studies, semaglutide demonstrated superiority in terms of a greater reduction in A1C (%) at week 26 from baseline at all dosage strengths (once-daily 3 mg, 7 mg, and 14 mg). This difference was observed in patients on different background therapies as placebo-controlled studies (PIONEER 1, 5, and 8) were conducted in patients receiving semaglutide in addition to diet and exercise, patients with moderate renal impairment using metformin, SU with or without metformin, or basal insulin with or without metformin, and in patients on stable treatment with insulin therapies with or without metformin.
The clinical expert consulted for this review indicated that a reduction of at least 0.5% in A1C, or achievement of A1C between 8 and 8.5% would be meaningful in clinical practice. This was achieved at week 26 by patients in all treatment groups in the PIONEER studies. In general, the reduction in A1C was appears to be sustained up to 52 to 78 weeks in PIONEER 2 to 4 and 8 (PIONEER 1 and 5 were 26 weeks in duration). At week 52 in PIONEER 2 and 4, and up to week 78 in PIONEER 3, the results for change from baseline in A1C (%) were consistent with the results at week 26, although the use of additional anti-diabetic medication and rescue medication was notably more prevalent after week 26, which may have impacted the treatment effect over time. In PIONEER 3 for example, between 10% and 34% of patients in all treatment groups required rescue medication at week 78. Similarly, the results for the change in A1C were consistent at week 52 in placebo-controlled PIONEER 8, but rescue medication use ranged from 17% to 36% at in all treatment groups at this time point. Further, none of the assessments beyond 26 weeks were controlled for multiplicity, which creates further uncertainty around these findings.
Change in body weight (kg) was a key secondary outcome included in the statistical testing hierarchy in most of the included studies (all except PIONEER 6, 9, and 10). At 26 weeks from baseline, patients treated with semaglutide 14 mg exhibited greater reductions in body weight compared to patients treated with placebo in all studies. The effect of semaglutide 7 and semaglutide 3 mg on body weight were inconsistent when compared to placebo. In PIONEER 1 where semaglutide was evaluated as monotherapy, the lower dosage strengths did not demonstrate a benefit compared to placebo. This result was also observed in PIONEER 9, although body weight at baseline was lower than in PIONEER 1 and the analysis was not controlled for multiplicity. As an add-on to background therapy, semaglutide demonstrated superiority to placebo in PIONEER 8 (semaglutide 3 mg, 7 mg, and 14 mg), PIONEER 4 (14 mg only), and in patients with renal impairment in PIONEER 5 (14 mg only).
In the active-controlled trials, semaglutide 14 mg demonstrated greater reductions in body weight compared to sitagliptin and liraglutide at 26 weeks, with the exception empagliflozin in PIONEER 2 where no statistically significant difference was observed. The results for the change from baseline to week 52 were consistent with those at week 26; however, the same limitations introduced by additional anti-diabetic medication use and lack of control for multiplicity as comparisons for glycemic control apply to analyses of body weight as well. The change from baseline in BMI was also reported in the included studies, and the results were consistent with the change in body weight. Further, comparisons of semaglutide to dulaglutide in PIONEER 10 were in support of the summarized evidence as well.
The clinical expert consulted for this review suggested a change in weight of at least 2 kg over 26 weeks would be a meaningful change in clinical practice. This was achieved by patients treated with semaglutide 7 mg and 14 mg in PIONEER 1 to 8, but not with semaglutide 3 mg or in PIONEER 9 and 10. As noted under baseline characteristics, patients included in PIONEER 9 and 10 weighed less at baseline compared to patients in PIONEER 1 to 6 and 8.
Subgroup analyses were available for PIONEER 3 and 4, which generally showed consistent treatment effects by background therapy for A1C or body weight (metformin with or without SU in PIONEER 3, metformin with or without SGLT2 inhibitor in PIONEER 4). The methodology for these subgroup analyses were limited and it is unclear whether they were pre-specified. Further, the studies were not powered to detect a difference based on the subgroup analyses.
PIONEER 6 was the only trial that evaluated mortality or diabetes-related morbidity as efficacy outcomes. This trial included patients that were at least 50 years of age with CV disease, and patients of at least 60 years of age with CV risk factors as identified by the sponsor. The clinical expert consulted for this review supported that the population included in PIONEER 6 adequately described patients with CV disease. The review by Health Canada noted that the “specific factors are considered sub-clinical cardiovascular disease and are indicative of the early stages of CV disease”, which is suggestive of a population that is more severe in terms of CV disease than the sponsor may have anticipated. This view was also shared by the clinical expert. As an event-driven study, PIONEER 6 was 74 weeks in duration, which may not allow sufficient time to properly evaluate CV outcomes. The time to first EAC-confirmed MACE corresponded to a HR of 0.79 (95% CI, 0.57 to 1.11) or an absolute risk reduction of 21% for patients treated with semaglutide compared to placebo. Non-inferiority for the comparison of semaglutide 14 mg to placebo based on a pre-specified non-inferiority margin of 1.8 was demonstrated, which suggests that there was no increased risk in the occurrence of MACE with semaglutide compared to placebo. As described in the HCRR, “the sponsor designed this study to exclude an 80% excess risk by using the value of 1.8 for the upper limit of the 2-sided confidence interval for the HR. Strictly speaking, this value was not appropriate…”.11 Further, the FDA guidance recommends that if an approved product is able to demonstrate non-inferiority based on a margin between 1.3 and 1.8, then a post-marketing trial is required to definitely demonstrate an estimated risk ratio that is less than 1.3.21 Based on results of the PIONEER 6 study alone, no conclusion as to whether semaglutide tablets offer any CV benefit can be made. Further, superiority of semaglutide 14 mg compared to placebo was not demonstrated based on the primary outcome in the trial. The expanded MACE, which included the events contributing to MACE in addition to unstable angina pectoris requiring hospitalization and heart failure requiring hospitalization, was also similar between treatment groups in PIONEER 6. Cumulatively, all of the expanded MACE events occurred in 5% and 6% of patients in the semaglutide 14 mg and placebo treatment groups, respectively.
Pre-specified subgroup analyses on the primary end point were also conducted in PIONEER 6. The reported treatment effect for patients with a BMI of 30 or less, patients without a history of MI or stroke before randomization, and patients exhibiting CV risk factors (only, as opposed to CV disease) may suggest a lower risk of time to first MACE in these subgroup populations; however, these subgroups describe generally healthier patients where a lower risk in the occurrence of MACE would be expected. Further, the results of the CV risk factor subgroup is limited by a wide confidence interval, and patients were not stratified by BMI or history of MI or stroke at randomization. Subgroup analyses by A1C, renal function or for patients with a BMI greater than 30, prior MI or stroke, and presence of CV disease were consistent with the primary analysis.
In addition to glycemic control and body weight, the included studies evaluated HRQoL, blood pressure (as a safety end point), and the lipid profile in patients. The trials were not designed to detect a difference in terms of these outcomes, and none of the analyses were controlled for multiplicity. A variety of tools were used to assess HRQoL in the studies, such as the SF-36v2, diabetes-specific measures including the DTSQ and DTR-QOL, and measures related to diet and weight such as the CoEQ and IWQOL. Overall, results were mixed regarding any potential benefit on HRQoL with semaglutide compared to placebo or active comparators. Of all the HRQoL outcomes, evidence of a validated MID was only identified for the SF-36v2, which was a change of 2 points for the PCS or 3 points for the MCS in the general population. The studies did not demonstrate a clinically meaningful difference based on the MID.
Measures of SBP and DBP at baseline were not high enough to raise clinical concern according to the clinical expert, who reported that the average SBP/DBP observed in practice was approximately 140 to 160 mm Hg/80 to 100 mm Hg for untreated patients. The target after treatment is 130 mm Hg/80 mm Hg or less, but often this is unattainable for patients. In the PIONEER trials, blood pressure ranged from 127 to 139/76 to 81 at baseline and changed by between + 1 mm Hg and – 7 mm Hg across the studies. Similarly, the lipid profile, which consisted of total cholesterol, LDL cholesterol, and HDL cholesterol, was not of concern clinically at baseline and further, between-groups differences were infrequently reported. The clinical expert consulted for this review stated that changes in lipid profile were not expected for treatment with semaglutide tablets. They also noted that measures of LDL and non-HDL cholesterol (total cholesterol – LDL cholesterol) are more clinically meaningful than other measures of lipids, which was supported by the Canadian Clinical Practice Guidelines.5
In addition to the evidence that has been discussed, a sponsor-submitted ITC was reviewed for this report. The primary aim was to evaluate the efficacy and safety of semaglutide compared with other anti-diabetic therapies in patients with T2DM as second-line in patients treated with metformin and as third-line in patients with metformin and SU. Based on the results of the submitted ITC oral semaglutide both as second- and third-line therapy is likely better than placebo and the results suggest potential superiority to other treatment classes, specifically SGLT-2, DPP-4 inhibitors, TZD, and SUs. No conclusions can be made for other efficacy or safety outcomes since these outcomes were not evaluated.
There are a few notable gaps in the evidence that was available for this review of semaglutide tablets. Semaglutide tablets are the first oral GLP-1 RA to be approved in Canada; however, semaglutide for injection has been available since 201863 and is reimbursed as a restricted benefit or full benefit in most public drug plans across the country (all except BC). No direct evidence comparing semaglutide tablets to semaglutide injection was identified, which was noted as being of interest to both clinicians and policy makers. The clinical expert described semaglutide tablets as an option for patients who are averse to injections; however, they could not describe a daily oral medication such as semaglutide tablets as having a definitive benefit compared to SC semaglutide otherwise based on their experience in clinical practice. It was noted that some patients prefer a treatment that only requires administration once a week as opposed to daily, making the choice of semaglutide tablets or injection dependent on individual patient preferences. The clinical expert also viewed the absence of strong evidence for CV risk reduction at this point with semaglutide tablets as a limitation of this treatment option, considering that there are other treatments available (empagliflozin, canagliflozin, and liraglutide) that address this need. Of note, a phase III trial (NCT03914326) designed to provide a more robust assessment of CV outcomes with semaglutide tablets is currently under way. Further, the plans also expressed an interest in comparative evidence to an SGLT2 inhibitor or semaglutide for injection in the CVOT (PIONEER 6). Lastly, although none of the PIONEER trials were specifically designed to assess semaglutide tablets in patients who were intolerant to metformin or in whom metformin is contraindicated, Health Canada semaglutide tablets considered PIONEER 1 to be of sufficient evidence and noted that this is aligned with the indication granted by other regulatory agencies.11
Harms
In the active-controlled trials that evaluated semaglutide as an add-on to 1 to 2 OADs (PIONEER 2 to 4), the proportion of patients that experienced at least 1 AE was ranged from 67% to 83% across treatment groups over 52 to 78 weeks. PIONEER 6 did not report overall AEs. Overall adverse events in placebo-controlled trials were similar between groups but variable between studies, although each study was unique in terms of patient population and background therapy use. In the 26-week PIONEER 1 where semaglutide was used as monotherapy, AEs ranged from 21% to 27% across semaglutide treatment groups compared to 15% with placebo. In contrast, PIONEER 5, which assessed semaglutide 14 mg over 26-weeks in patients with moderate renal impairment and receiving background therapy reported adverse events in 74% of patients with semaglutide 14 mg and 65% of patients with placebo. PIONEER 8, which was a 52-week study with patients using insulin with or without metformin as background therapy reported AEs in 41% to 56% of patients in semaglutide treatment groups and 40% of patients in the placebo treatment group. Overall adverse events in PIONEER 9 and 10 were consistent with the other PIONEER studies with 67% to 85% of patients reporting AEs over 52 weeks. Of note, the number of TEAE during time exposed to treatment was the primary end point in PIONEER 10, which compared semaglutide 3 mg, 7 mg, and 14 mg to dulaglutide 0.75 mg. In all studies, AEs were largely driven by GI disorders; nausea, vomiting, and diarrhea in particular. In general, GI-related AEs were higher in patients treated with semaglutide compared to placebo, as well as active comparators with the exception of other GLP-1 RAs. Health Canada’s review of the safety data concluded that the safety profile of semaglutide tablets, including the frequency of GI AEs, was comparable to the other previously authorized GLP-1 RAs, including semaglutide injection.11
Serious AEs were reported infrequently in PIONEER 1 to 5, and 8 to 10, occurring in 0% to 14% of patients across all treatment groups at a similar frequency between treatment groups in each of the trials. Serious AEs were a key focus of PIONEER 6. Serious AEs were more frequent in the PIONEER 6 than the other PIONEER studies, having occurred in 18.9% to 22.5% of patients in the semaglutide 14 mg and placebo treatment groups, respectively. Specific SAEs were also reported infrequently in all trials, but were most commonly due to GI and CV events.
The proportion of patients who WDAE was generally higher among patients treated with semaglutide than comparator groups. In PIONEER 1 to 5, and 8 to 10, WDAEs ranged from 2% to 15% in semaglutide treatment groups, 0% to 9% of active comparator groups, and 0% to 5% of placebo groups. In PIONEER 6, WDAE were higher, with 27% of patients in the semaglutide 14 mg treatment group and 17% of patients in the placebo treatment group WDAE. Gastrointestinal disorders were the most commonly reported reasons for WDAEs in all studies.
Regarding mortality, a total of 16 deaths were reported in semaglutide treatment groups, 8 deaths were reported in active comparator groups (empagliflozin, sitagliptin, liraglutide, and dulaglutide), and 3 deaths were reported in placebo groups. This does not included deaths that were reported in PIONEER 6, where 23 and 45 deaths were reported in the semaglutide of which 14 mg and placebo treatment groups, respectively, approximately half of which (10 and 23, respectively) were CV-related.
Notable harms other than nausea, vomiting, and diarrhea were infrequently reported. Of note, hypoglycemia was reported in 4 patients treated with semaglutide in all of the included studies other than PIONEER 6, where severe hypoglycemia was reported by 23 and 13 patients in the semaglutide 14 mg and placebo treatment groups, respectively. Health Canada and the FDA also reviewed safety focus areas that addressed issues such as hypoglycemia that were not included in this review. Both Health Canada and the FDA reported a risk of hypoglycemia that was greater for patients receiving semaglutide tablets in combination with SU or insulin.
Conclusions
The safety and efficacy of semaglutide tablets was evaluated in a total of 9 studies in patients on a variety of background therapies. In terms of glycemic control, once daily treatment with semaglutide tablets demonstrated superiority compared to placebo as monotherapy and as add-on therapy, and as add-on therapy in patients with moderate renal impairment (semaglutide 14 mg). When compared to active treatments as an add-on therapy, semaglutide 14 mg demonstrated superiority to empagliflozin and sitagliptin, and was non-inferior to liraglutide. Semaglutide 7 mg was superior to sitagliptin as well; semaglutide 3 mg failed to demonstrate non-inferiority. In terms of a reduction in body weight, semaglutide demonstrated mixed results. In general, superiority was demonstrated with semaglutide 14 mg with all comparators, but semaglutide 7 mg and 3 mg did not consistently show benefit. Of note, semaglutide 7 mg and 3 mg as monotherapy did not demonstrate superiority in terms of a reduction in body weight when compared to placebo. Regarding CV safety, semaglutide 14 mg was non-inferior to placebo based on time from randomization to first EAC-confirmed MACE, thereby demonstrating the absence of additional CV risk with semaglutide tablets; superiority was not demonstrated. Based on currently available evidence, CV benefit with semaglutide tablets cannot be claimed. Other outcomes such as HRQoL, blood pressure, and lipid profile were also included in the PIONEER studies as supportive outcomes; however, none of these outcomes were controlled for multiplicity.
The safety profile of semaglutide tablets is comparable to other GLP-1 RAs, with GI disorders such as nausea frequently reported. A clear benefit in HRQoL was not demonstrated based on the included studies, and with a lack of additional evidence regarding outcomes such as diabetes-related morbidity beyond the CVOT, or a direct comparison to semaglutide injection.
References
1.Public Health Agency of Canada. Diabetes in Canada: fact and figures from the public health perspective. 2011; https://www.canada.ca/en/public-health/services/chronic-diseases/reports-publications/diabetes/diabetes-canada-facts-figures-a-public-health-perspective.html. Accessed 2021 Mar 5.
2.Canadian Diabetes Association. An economic tsunami: the cost of diabetes in Canada. Toronto (ON): Canadian Diabetes Association; 2009 Dec: https://www.canadianjournalofdiabetes.com/article/S1499-2671(10)41005-9/abstract. Accessed 2019 Mar 21.
3.World Health Organization. Global report on diabetes. Geneva (CH): World Health Organization; 2016: https://apps.who.int/iris/bitstream/handle/10665/204871/9789241565257_eng.pdf;jsessionid=8466867C7E5D5DB6BC42761C3B9CEB8F?sequence=1. Accessed 2021 Mar 21.
4.Diabetes in Canada. Backgrounder. Ottawa: Diabetes Canada; 2020 Feb: https://diabetes.ca/DiabetesCanadaWebsite/media/Advocacy-and-Policy/Backgrounder/2020_Backgrounder_Canada_English_FINAL.pdf. Accessed 2021 Mar 26.
5.Diabetes Canada Clinical Practice Guidelines Expert Committee. Diabetes Canada 2018 clinical practice guidelines for the prevention and management of diabetes in Canada. Can J Diabetes. 2018;42(suppl 1):S1-S325.
6.Sharma R, Wilkinson L, Vrazic H, et al. Comparative efficacy of once-weekly semaglutide and SGLT-2 inhibitors in type 2 diabetic patients inadequately controlled with metformin monotherapy: a systematic literature review and network meta-analysis. Curr Med Res Opin. 2018;34(9):1595-1603. PubMed
7.Aldossari KK. Cardiovascular outcomes and safety with antidiabetic drugs. Int J Health Sci (Qassim). 2018;12(5):70-83. PubMed
8.Del Olmo-Garcia MI, Merino-Torres JF. GLP-1 receptor agonists and cardiovascular disease in patients with type 2 diabetes. J Diabetes Res. 2018;2018:4020492. PubMed
9.Wexler DJ. Management of persistent hyperglycemia in type 2 diabetes mellitus. In: Post TW, ed. UpToDate. Watham (MA): UpToDate; 2020 Nov: www.uptodate.com. Accessed 2021 Dec 12.
10.Rybelsus (semaglutide tablets): 3 mg, 7 mg and 14 mg tablets [product monograph]. Mississauga (ON): Novo Nordisk Canada Inc.; 2020 Mar 30.
11.Health Canada reviewer's report: Rybelsus® (oral semaglutide) [CONFIDENTIAL sponsor's report]. Mississauga (ON): Novo Nordisk Canada Inc; 2020 Mar 27.
12.Clinical Study Report: Trial ID: NN9924-4233. PIONEER 1 – Monotherapy. A 26-week, randomised, double blind, placebo-controlled trial to investigate the efficacy and safety of oral semaglutide vs placebo in subjects with type 2 diabetes mellitus treated with diet and exercise only [CONFIDENTIAL sponsor's report]. Bagsværd (DK): Novo Nordisk; 2018 Jun 20.
13.Clinical Study Report: Trial ID: NN9924-4223. PIONEER 2 – vs. SGLT-2 Inhibitor. A 52-week randomised, open label, active-controlled trial to investigate the efficacy and safety of oral semaglutide versus empagliflozin in subjects with type 2 diabetes mellitus [CONFIDENTIAL sponsor's report]. Bagsværd (DK): Novo Nordisk; 2018 Oct 3.
14.Clinical Study Report: Trial ID: NN9924-4222. PIONEER 3 vs DPP-4 inhibitor. Efficacy and long-term safety of oral semaglutide versus sitagliptin in subjects with type 2 diabetes [CONFIDENTIAL sponsor's report]. Bagsværd (DK): Novo Nordisk; 2018 Nov 29.
15.Clinical Study Report: Trial ID: NN9924-4224. PIONEER 4 – vs. GLP-1 RA. Efficacy and safety of oral semaglutide versus liraglutide and versus placebo in subjects with type 2 diabetes mellitus. [CONFIDENTIAL sponsor's report]. Bagsværd (DK): Novo Nordisk; 2018 Nov 7.
16.Clinical Study Report: Trial ID: NN9924-4234. PIONEER 5 – Renal Impairment. Efficacy and Safety of Oral Semaglutide Versus Placebo in Subjects with Type 2 Diabetes and Moderate Renal Impairment. [CONFIDENTIAL sponsor's report]. Bagsværd (DK): Novo Nordisk; 2018 Dec 13.
17.Clinical Study Report: NN9924-4280. PIONEER 8 – Insulin add-on. Efficacy and Safety of Oral Semaglutide versus Placebo in Subjects with Type 2 Diabetes Mellitus treated with insulin. A 52-week, randomised, double-blind, placebo-controlled trial. [CONFIDENTIAL sponsor's report]. Bagsværd (DK): Novo Nordisk; 2019 Feb 12.
18.Clinical Study Report: Trial ID: NN9924-4281. PIONEER 9 – Japan Monotherapy Dose-response, Safety and Efficacy of Oral Semaglutide versus Placebo and versus Liraglutide, All as Monotherapy in Japanese Subjects with Type 2 Diabetes A 52-week Randomised, Double-blind Placebo-controlled and Open-label Active-controlled Trial. [CONFIDENTIAL sponsor's report]. Bagsværd (DK): Novo Nordisk; 2019 Mar 1.
19.Clinical Study Report: PIONEER 10 – Japan OAD combination Safety and efficacy of oral semaglutide versus dulaglutide both in combination with one OAD in Japanese subjects with type 2 diabetes A 52-week, randomised, open-label, active-controlled trial [CONFIDENTIAL sponsor's report]. Bagsværd (DK): Novo Nordisk; 2019 Jan 17.
20.Clinical Study Report: Trial ID: NN9924-4221. PIONEER 6 – Cardiovascular outcomes trial. A trial investigating the cardiovascular safety of oral semaglutide in subjects with type 2 diabetes. [CONFIDENTIAL sponsor's report]. Bagsværd (DK): Novo Nordisk; 2019 Feb 15.
21.Guidance for industry diabetes mellitus — evaluating cardiovascular risk in new antidiabetic therapies to treat type 2 diabetes. Silver Spring (MD): U.S. Food and Drug Administration (FDA); 2008: https://www.fda.gov/media/71297/download. Accessed 2021 Mar 2.
22.International Diabetes Federation. IDF diabetes atlas - 8th edition. 2017; https://www.diabetesatlas.org/upload/resources/previous/files/8/IDF_DA_8e-EN-final.pdf. Accessed 2021 Mar 21.
23.DeFronzo RA. From the triumvirate to the ominous octet: a new paradigm for the treatment of type 2 diabetes mellitus. Diabetes. 2009;58(4):773-795. PubMed
24.Palanisamy S, Yien ELH, Shi LW, et al. Systematic review of efficacy and safety of newer antidiabetic drugs approved from 2013 to 2017 in controlling HbA1c in diabetes patients. Pharmacy (Basel). 2018;6(3):57. PubMed
25.Dungan K. Glucagon-like peptide 1 receptor agonists for the treatment of type 2 diabetes mellitus. In: Post TW, ed. UpToDate. Watham (MA): UpToDate; 2020: www.uptodate.com. Accessed 2021 Mar 26.
26.Reimbursement Review CADTH. semaglutide (Ozempic). 2019 Jun 18; https://cadth.ca/semaglutide. Accessed 2021 Mar 26.
27.Byetta® exenatide injection 250 µg/mL [product monograph]. Mississauga (ON): AstraZeneca Canada Inc; 2019 Dec 18: https://www.astrazeneca.ca/content/dam/az-ca/downloads/productinformation/byetta-product-monograph-en.pdf. Accessed 2021 Mar 26.
28.Adlyxine™ lixisenatide injection 0.05 mg per mL (10 μg/dose) 0.1 mg per mL (20 μg/dose) [product monograph]. Laval (QC): Sanofi-Aventis Canada Inc.; 2017 May 23: https://products.sanofi.ca/en/adlyxine.pdf. Accessed 2021 Mar 26.
29.KOMBOGLYZE® saxagliptin and metformin hydrochloride tablets (as saxagliptin hydrochloride and metformin hydrochloride) 2.5mg/500mg, 2.5mg/850mg, 2.5mg/1000mg [product monograph]. Mississauga (ON): AstraZeneca Canada Inc; 2018 Mar 20: https://pdf.hres.ca/dpd_pm/00044409.PDF. Accessed 2021 Mar 26.
30.Januvia sitagliptin tablets 25, 50 and 100 mg [product monograph]. Kirkland (QC): Merck Canada Inc.; 2018 Nov 1: https://www.merck.ca/static/pdf/JANUVIA-PM_E.pdf. Accessed 2021 Mar 26.
31.Nesina® alogliptin (as alogliptin benzoate) 6.25 mg, 12.5 mg and 25 mg tablets [product monograph]. Oakville (ON): Takeda Canada Inc; 2018 Oct 24 https://pdf.hres.ca/dpd_pm/00047953.PDF. Accessed 2021 Mar 26.
32.Invokamet® canagliflozin and metformin hydrochloride tablets (canagliflozin (as anhydrous canagliflozin) and metformin hydrochloride) 50 mg/500 mg, 50 mg/850 mg, 50 mg/1000 mg, 150 mg/500 mg, 150 mg/850 mg and 150 mg/1000 mg [product monograph]. Toronto (ON): Janssen Inc; 2020 Aug 18 https://pdf.hres.ca/dpd_pm/00057727.PDF. Accessed 2021 Mar 26.
33.Forxiga® dapagliflozin tablets (as dapagliflozin propanediol monohydrate) 5 mg and 10 mg [product monograph]. Mississauga (ON): AstraZeneca Canada Inc.; 2020 Jun 29: https://pdf.hres.ca/dpd_pm/00056688.PDF. Accessed 2021 Mar 26.
34.Steglatro™ ertugliflozin tablets 5 mg and 15 mg ertugliflozin, tablets, oral [product monograph]. Kirkland (QC): Merck Canada Inc; 2018 May 8: https://pdf.hres.ca/dpd_pm/00045583.PDF. Accessed 2021 Mar 26.
35.Act Metformin Metformin Hydrochloride Tablets BP. 500 mg, 850 mg [product monograph]. Toronto (ON): Teva Canada Limited; 2019 Feb 15: https://pdf.hres.ca/dpd_pm/00049683.PDF. Accessed 2021 Mar 26.
36.Drug Reimbursement Review sponsor submission: Rybelsus, semaglutide tablets, 3 mg, 7 mg and 14 mg. Mississauga (ON): Novo Nordisk Canada Inc.; 2020 Nov 26.
37.McGowan J, Sampson M, Salzwedel DM, Cogo E, Foerster V, Lefebvre C. PRESS Peer Review of Electronic Search Strategies: 2015 guideline statement. J Clin Epidemiol. 2016;75:40-46. PubMed
38.Grey matters: a practical tool for searching health-related grey literature. Ottawa (ON): CADTH; 2019: https://www.cadth.ca/grey-matters. Accessed 2021 Mar 26.
39.Rodbard HW, Rosenstock J, Canani LH, et al. Oral Semaglutide Versus Empagliflozin in Patients With Type 2 Diabetes Uncontrolled on Metformin: The PIONEER 2 Trial. Diabetes Care. 2019;42(12):2272-2281. PubMed
40.Rosenstock J, Allison D, Birkenfeld AL, et al. Effect of Additional Oral Semaglutide vs Sitagliptin on Glycated Hemoglobin in Adults With Type 2 Diabetes Uncontrolled With Metformin Alone or With Sulfonylurea: The PIONEER 3 Randomized Clinical Trial. JAMA. 2019;321(15):1466-1480. PubMed
41.Pratley R, Amod A, Hoff ST, et al. Oral semaglutide versus subcutaneous liraglutide and placebo in type 2 diabetes (PIONEER 4): a randomised, double-blind, phase 3a trial. Lancet. 2019;394(10192):39-50. PubMed
42.Levey AS, Bosch JP, Lewis JB, et al. A more accurate method to estimate glomerular filtration rate from serum creatinine: A new prediction equation. Modification of Diet in Renal Disease Study Group. Ann Intern Med. 1999;130:461-470. PubMed
43.Levey AS, Stevens LA, Schmid CH, et al. A new equation to estimate glomerular filtration rate. Ann Intern Med. 2009;150:604-612. PubMed
44.Center for Drug Evaluation R. Medical review(s). Rybelsus. Company: Novo Nordisk Inc. Application Number: 213051 Approval Date: 09/20/2019 (FDA approval package). Silver Spring (MD): U.S. Food and Drug Administration (FDA); 2019 Mar 20: https://www.accessdata.fda.gov/drugsatfda_docs/nda/2019/213051Orig1s000MedR.pdf Accessed 2020 Dec 22.
45.Aroda VR, Rosenstock J, Terauchi Y, et al. PIONEER 1: Randomized Clinical Trial of the Efficacy and Safety of Oral Semaglutide Monotherapy in Comparison With Placebo in Patients With Type 2 Diabetes. Diabetes Care. 2019;42(9):1724-1732. PubMed
46.Mosenzon O, Blicher TM, Rosenlund S, et al. Efficacy and safety of oral semaglutide in patients with type 2 diabetes and moderate renal impairment (PIONEER 5): a placebo-controlled, randomised, phase 3a trial. Lancet Diabetes Endocrinol. 2019;7(7):515-527. PubMed
47.Zinman B, Aroda VR, Buse JB, et al. Efficacy, Safety, and Tolerability of Oral Semaglutide Versus Placebo Added to Insulin With or Without Metformin in Patients With Type 2 Diabetes: The PIONEER 8 Trial. Diabetes Care. 2019;42(12):2262-2271. PubMed
48.Husain M, Birkenfeld AL, Donsmark M, et al. Oral Semaglutide and Cardiovascular Outcomes in Patients with Type 2 Diabetes. N Engl J Med. 2019;381(9):841-851. PubMed
49.Bain SC, Mosenzon O, Arechavaleta R, et al. Cardiovascular safety of oral semaglutide in patients with type 2 diabetes: Rationale, design and patient baseline characteristics for the PIONEER 6 trial. Diabetes Obes Metab. 2019;21(3):499-508. PubMed
50.Yamada Y, Katagiri H, Hamamoto Y, et al. Dose-response, efficacy, and safety of oral semaglutide monotherapy in Japanese patients with type 2 diabetes (PIONEER 9): a 52-week, phase 2/3a, randomised, controlled trial. Lancet Diabetes Endocrinol. 2020;8(5):377-391. PubMed
51.Yabe D, Nakamura J, Kaneto H, et al. Safety and efficacy of oral semaglutide versus dulaglutide in Japanese patients with type 2 diabetes (PIONEER 10): an open-label, randomised, active-controlled, phase 3a trial. Lancet Diabetes Endocrinol. 2020;8(5):392-406. PubMed
52.Clinical Study Report: Trial ID: NN9924-4257. PIONEER 7 – Flexible Dose Adjustment. Efficacy and Safety of Oral Semaglutide Using a Flexible Dose Adjustment Based on Clinical Evaluation versus Sitagliptin in Subjects with Type 2 Diabetes Mellitus. [CONFIDENTIAL sponsor's report]. Bagsværd (DK): Novo Nordisk; 2018 Oct 25.
53.Hays RD, Morales LS. The RAND-36 measure of health-related quality of life. Ann Med. 2001;33(5):350-357. PubMed
54.Hill-Briggs F, Gary TL, Baptiste-Roberts K, Brancati FL. Thirty-six–item short-form outcomes following a randomized controlled trial in type 2 diabetes. Diabetes Care. 2005;28(2):443-444. PubMed
55.Bjorner JB, Lyng Wolden M, Gundgaard J, Miller KA. Benchmarks for interpretation of score differences on the SF-36 health survey for patients with diabetes. Value Health. 2013;16(6):993-1000. PubMed
56.Bradley C, Plowright R, Stewart J, Valentine J, Witthaus E. The Diabetes Treatment Satisfaction Questionnaire change version (DTSQc) evaluated in insulin glargine trials shows greater responsiveness to improvements than the original DTSQ. Health Qual Life Outcomes. 2007;5:57. PubMed
57.Ishii H. Development and psychometric validation of the Diabetes Therapy-Related QOL (DTR-QOL) questionnaire. J Med Econ. 2012;15(3):556-563. PubMed
58.Schneider D, Taddei-Allen P, Dougherty T. The importance of patient-reported outcomes in type 2 diabetes: insight from the PIONEER program with oral semaglutide. Am J Manag Care. 2020;26(16)(suppl):S356-S367. PubMed
59.Dalton M, Finlayson G, Hill A, Blundell J. Preliminary validation and principal components analysis of the Control of Eating Questionnaire (CoEQ) for the experience of food craving. Eur J Clin Nutr. 2015;69(12):1313-1317. PubMed
60.Kolotkin RL, Ervin CM, Meincke HH, Hojbjerre L, Fehnel SE. Development of a clinical trials version of the Impact of Weight on Quality of Life-Lite questionnaire (IWQOL-Lite Clinical Trials Version): results from two qualitative studies. Clin Obes. 2017;7(5):290-299. PubMed
61.Kolotkin RL, Williams VSL, Ervin CM, et al. Validation of a new measure of quality of life in obesity trials: Impact of Weight on Quality of Life-Lite Clinical Trials Version. Clin Obes. 2019;9(3):e12310. PubMed
62.Systematic literature review and network meta-analysis to assess the relative efficacy of oral semaglutide 14 mg compared with relevant comparators, in T2D patients inadequately controlled with metformin or metformin + sulfonylureas: analysis at 24 ± 4 weeks [CONFIDENTIAL sponsor's report]. In: Drug Reimbursement Review sponsor's submission: Drug name, doses and administration. Mississauga (ON): Novo Nordisk Canada Inc.; 2020 Nov.
63.Ozempic® semaglutide injection 2 mg/pen (1.34 mg/mL) 4 mg/pen (1.34 mg/mL) [product monograph]. Mississauga (ON): Novo Nordisk Canada; 2020 Aug 21: https://www.novonordisk.ca/content/dam/nncorp/ca/en/products/ozempic-product-monograph.pdf. Accessed 2021 Mar 26.
64.Pieber TR, Bode B, Mertens A, et al. Efficacy and safety of oral semaglutide with flexible dose adjustment versus sitagliptin in type 2 diabetes (PIONEER 7): a multicentre, open-label, randomised, phase 3a trial. Lancet Diabetes Endocrinol. 2019;7(7):528-539. PubMed
65.Maruish ME. User’s manual for the SF-36v2 survey. 3rd ed. Lincoln (RD): Quality Metric Incorporated; 2011.
66.McHorney CA, Ware JE Jr, Lu JF, Sherbourne CD. The MOS 36-item Short-Form Health Survey (SF-36): III. Tests of data quality, scaling assumptions, and reliability across diverse patient groups. Med Care. 1994;32(1):40-66. PubMed
67.Nerenz DR, Repasky DP, Whitehouse FW, Kahkonen DM. Ongoing assessment of health status in patients with diabetes mellitus. Med Care. 1992;30(5)(suppl):MS112-MS124. PubMed
68.Ohsawa I, Ishida T, Oshida Y, Yamanouchi K, Sato Y. Subjective health values of individuals with diabetes in Japan: comparison of utility values with the SF-36 scores. Diabetes Res Clin Pract. 2003;62(1):9-16. PubMed
69.Huang IC, Hwang CC, Wu MY, Lin W, Leite W, Wu AW. Diabetes-specific or generic measures for health-related quality of life? Evidence from psychometric validation of the D-39 and SF-36. Value Health. 2008;11(3):450-461. PubMed
70.Hirsch A, Bartholomae C, Volmer T. Dimensions of quality of life in people with non-insulin-dependent diabetes. Qual Life Res. 2000;9(2):207-218. PubMed
71.Woodcock AJ, Julious SA, Kinmonth AL, Campbell MJ, Diabetes Care From Diagnosis G. Problems with the performance of the SF-36 among people with type 2 diabetes in general practice. Qual Life Res. 2001;10(8):661-670. PubMed
72.Johnson JA, Nowatzki TE, Coons SJ. Health-related quality of life of diabetic Pima Indians. Med Care. 1996;34(2):97-102. PubMed
73.Hu J, Gruber KJ, Hsueh KH. Psychometric properties of the Chinese version of the SF-36 in older adults with diabetes in Beijing, China. Diabetes Res Clin Pract. 2010;88(3):273-281. PubMed
74.Ahroni JH, Boyko EJ. Responsiveness of the SF-36 among veterans with diabetes mellitus. J Diabetes Complications. 2000;14(1):31-39. PubMed
75.Weinberger M, Kirkman MS, Samsa GP, et al. The relationship between glycemic control and health-related quality of life in patients with non-insulin-dependent diabetes mellitus. Med Care. 1994;32(12):1173-1181. PubMed
76.Bradley C, Gamsu DS. Guidelines for encouraging psychological well-being: report of a Working Group of the World Health Organization Regional Office for Europe and International Diabetes Federation European Region St Vincent Declaration Action Programme for Diabetes. Diabet Med. 1994;11(5):510-516. PubMed
77.Bradley C, Plowright R, Stewart J, Valentine J, Witthaus E. The Diabetes Treatment Satisfaction Questionnaire change version (DTSQc) evaluated in insulin glargine trials shows greater responsiveness to improvements than the original DTSQ. Health Qual Life Outcomes. 2007;5:57. PubMed
78.Plowright R, Witthaus E, Bradley C. Psychometric evaluation of Diabetes Treatment Satisfaction Questionnaire in 8 languages. Proceedings Brit Psychol Soc. 2000;8(2):43.
Appendix 1: Literature Search Strategy
Note that this appendix has not been copy-edited.
Clinical Literature Search
Overview
Interface: Ovid
Databases:
MEDLINE All (1946-present)
Embase (1974-present)
Note: Subject headings and search fields have been customized for each database. Duplicates between databases were removed in Ovid.
Date of Search: December 23, 2020
Alerts: Bi-weekly search updates until project completion
Study types: No filters were applied to limit the retrieval by study type.
Limits:
Humans
Conference abstracts: excluded
Syntax | Description |
|---|---|
/ | At the end of a phrase, searches the phrase as a subject heading |
MeSH | Medical Subject Heading |
.fs | Floating subheading |
exp | Explode a subject heading |
* | Before a word, indicates that the marked subject heading is a primary topic; or, after a word, a truncation symbol (wildcard) to retrieve plurals or varying endings |
# | Truncation symbol for 1 character |
? | Truncation symbol for 1 or no characters only |
adj# | Requires terms to be adjacent to each other within # number of words (in any order) |
.ti | Title |
.ot | Original title |
.ab | Abstract |
.hw | Heading word; usually includes subject headings and controlled vocabulary |
.kf | Author keyword heading word (MEDLINE) |
.kw | Author keyword (Embase); |
.dq | Candidate term word (Embase) |
.pt | Publication type |
.mp | Mapped term |
.rn | Registry number |
.nm | Name of substance word (MEDLINE) |
.yr | Publication year |
.jw | Journal title word (MEDLINE) |
.jx | Journal title word (Embase) |
freq = # | Requires terms to occur # number of times in the specified fields |
medall | Ovid database code: MEDLINE All, 1946 to present, updated daily |
oemezd | Ovid database code; Embase, 1974 to present, updated daily |
cctr | Ovid database code; Cochrane Central Register of Controlled Trials |
Multi-Database Strategy
Search Strategy:
1. (Rybelsus* or semaglutid* or NN9535 or NN 9535 or NNC 0113-0217 or NNC0113-0217 or 53AXN4NNHX).ti,ab,kf,ot,hw,rn,nm.
2. 1 use medall
3. *Semaglutide/
4. (Rybelsus* or semaglutid* or NN9535 or NN 9535 or NNC 0113-0217 or NNC0113-0217).ti,ab,kw,dq.
5. 3 or 4
6. 5 use oemezd
7. 2 or 6
8. exp animals/
9. exp animal experimentation/ or exp animal experiment/
10. exp models animal/ 11 nonhuman/
12. exp vertebrate/ or exp vertebrates/
13. or/8-12
14. exp humans/
15. exp human experimentation/ or exp human experiment/
16. or/14-15
17. 13 not 16
18. 7 not 17
19. 18 not (conference abstract or conference review).pt.
20. remove duplicates from 19
Clinical Trials Registries
ClinicalTrials.gov
Produced by the U.S. National Library of Medicine. Targeted search used to capture registered clinical trials.
[Search rybelsus OR ((semaglutide OR NN9535 OR NN 9535 OR NNC 0113-0217) AND (oral OR mouth OR orally)) | diabetes
Health Canada’s Clinical Trials Database
Produced by Health Canada. Targeted search used to capture registered clinical trials.
[Search terms -- rybelsus OR ((semaglutide OR NN9535 OR NN 9535 OR NNC 0113-0217) AND (oral OR mouth OR orally)) | diabetes
EU Clinical Trials
Register European Union Clinical Trials Register, produced by the European Union. Targeted search used to capture registered clinical trials.
[Search terms -- rybelsus OR ((semaglutide OR NN9535 OR NN 9535 OR NNC 0113-0217) AND (oral OR mouth OR orally)) | diabetes
Grey Literature
Search dates: December 14, 2020 – December 18, 2020
Keywords: rybelsus OR ((semaglutide OR NN9535 OR NN 9535 OR NNC 0113-0217) AND (oral OR mouth OR orally
Limits: Humans
Updated: Search updated before the CADTH Canadian Drug Expert Committee (CDEC) meeting
Relevant websites from the following sections of the CADTH grey literature checklist Grey Matters: A Practical Tool For Searching Health-Related Grey Literature (https://www.cadth.ca/grey-matters) were searched:
Health Technology Assessment Agencies
Health Economics
Clinical Practice Guidelines
Drug and Device Regulatory Approvals
Advisories and Warnings
Drug Class Reviews
Clinical Trials Registries
Databases (free)
Health Statistics
Internet Search
Appendix 2: Excluded Studies
Note that this appendix has not been copy-edited.
Reference | Reason for Exclusion |
|---|---|
Anonymous. Correction to Efficacy and safety of oral semaglutide in patients with type 2 diabetes and moderate renal impairment (PIONEER 5): a placebo-controlled, randomized, phase 3a trial (The Lancet Diabetes and Endocrinology (2019) 7(7) (515-527), (S2213858719301925), (10.1016/S2213-8587(19)30192-5)). The Lancet Diabetes and Endocrinology. 2019 September;7(9):e21. | Publication type: correction |
Anonymous. Correction to Efficacy and safety of oral semaglutide with flexible dose adjustment vs. sitagliptin in type 2 diabetes (PIONEER 7): a multicentre, open-label, randomized, phase 3a trial (The Lancet Diabetes and Endocrinology (2019) 7(7) (528-539), (S2213858719301949), (10.1016/S2213-8587(19)30194-9)). The Lancet Diabetes and Endocrinology. 2019 September;7(9):e21. | Publication type: correction |
Anonymous. Erratum: Department of Error (The Lancet (2019) 394(10192) (39-50), (S0140673619312711), (10.1016/S0140-6736(19)31271-1)). The Lancet. 2019 6 - 12 July;394(10192):e1. | Publication type: correction |
Gibbons C, Blundell J, Tetens Hoff S, Dahl K, Bauer R, Baekdal T. Effects of oral semaglutide on energy intake, food preference, appetite, control of eating and body weight in subjects with type 2 diabetes. Diabetes, Obesity and Metabolism. 2020 Nov 12;12:12. | Study design: phase I |
Zweck E, Westenfeld R, Szendroedi J. Oral Semaglutide and Cardiovascular Outcomes in type 2 Diabetes. New England Journal of Medicine. 2019 11 21;381(21):2075-2076. | Publication type: correspondence |
Davies M, Pieber TR, Hartoft-Nielsen ML, Hansen OKH, Jabbour S, Rosenstock J. Effect of Oral Semaglutide Compared With Placebo and Subcutaneous Semaglutide on Glycemic Control in Patients With type 2 Diabetes: A Randomized Clinical Trial. JAMA. 2017 10 17;318(15):1460-1470. | Study design: phase II |
Appendix 3: Detailed Outcome Data
Note that this appendix has not been copy-edited.
Description of Studies
Active-controlled RCTs (add-on to 1 to 2 OADs)
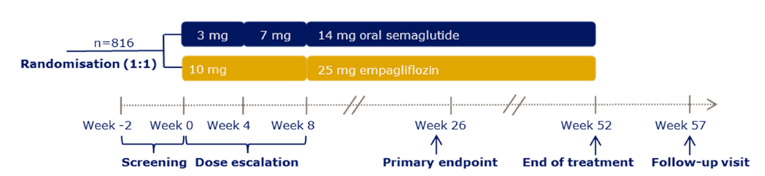
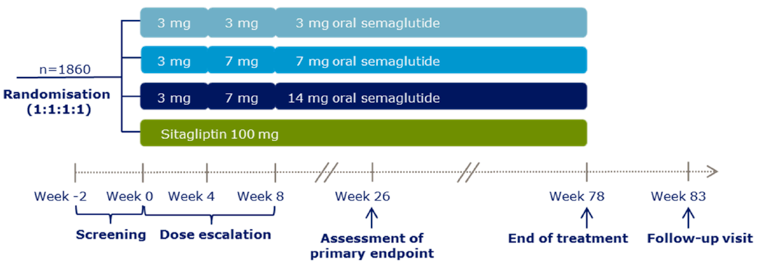
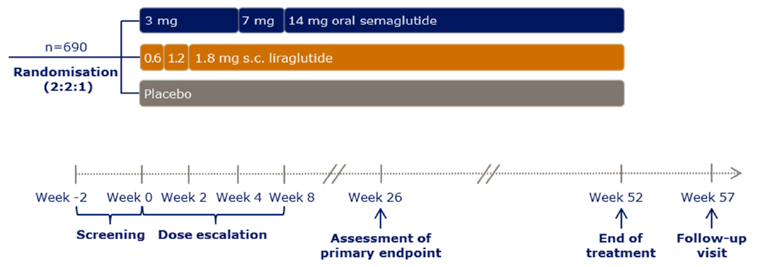
Placebo-controlled RCTs
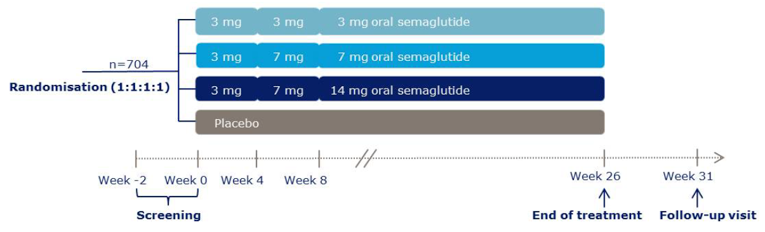
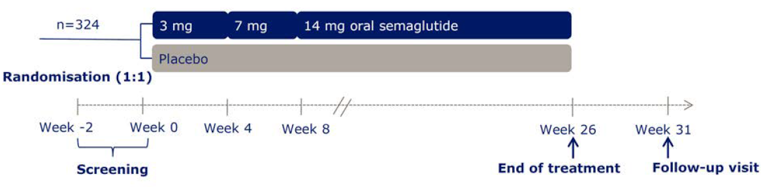
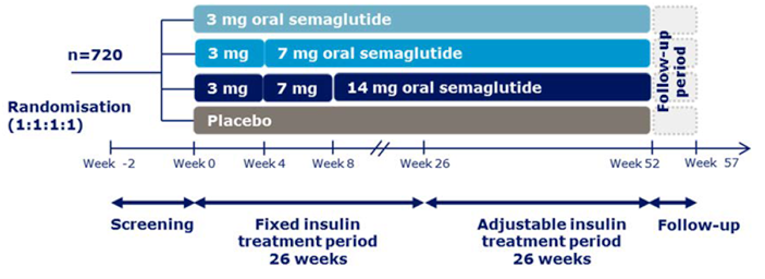
CVOT
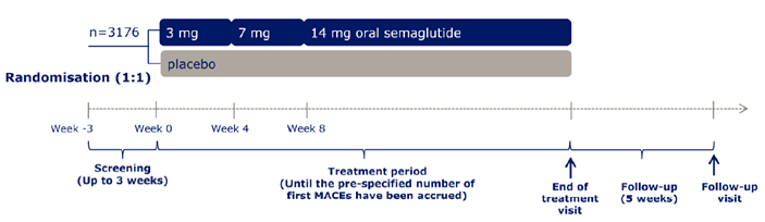
Population-specific Supportive Studies
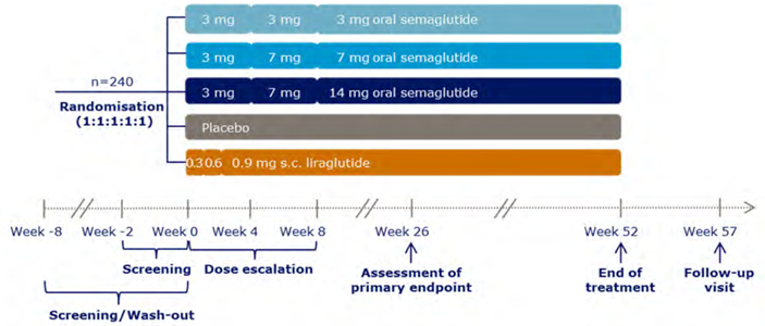
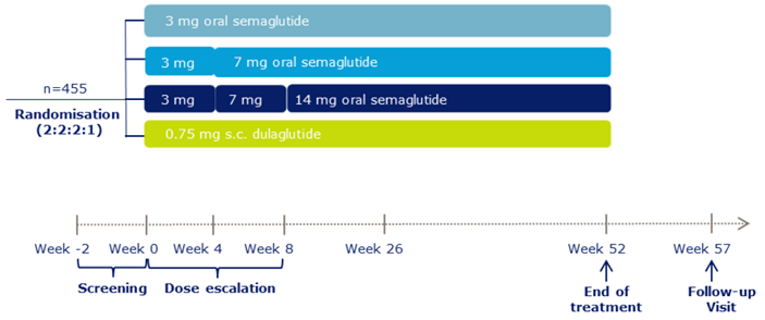
Interventions
Table 70: Concomitant CV medication use from baseline to end-of-treatment visit (CVOT)
PIONEER 6 | ||
|---|---|---|
SEM 14 mg N = 1591 | PBO N = 1592 | |
| ||
|
|
|
|
|
|
|
|
|
|
|
|
|
|
|
|
|
|
|
|
|
|
|
|
|
|
|
|
|
|
|
|
|
|
|
|
|
|
|
|
|
|
|
|
|
|
|
|
|
|
|
|
|
|
|
|
|
|
|
|
|
|
|
|
|
|
|
|
|
|
|
|
vvv v vvvvvvvvvvvvvvvvvvvvvv vvvvvvv vvv v vvvvvvvvvvvvvvvvvvvvvv vvv v vvvvvvvvvvvvvvv vvvvv PBO = placebo; SEM = semaglutide.
Source: PIONEER 6 Clinical Study Report.20
Exposure to study treatments
Table 71: Exposure (Active-Controlled RCTs, add-on to 1 to 2 OADs)
Duration of Exposure by weeks | PIONEER 2 | PIONEER 3 | PIONEER 4 | ||||||
|---|---|---|---|---|---|---|---|---|---|
SEM 14 mg N = 410 | EMPA 25 mg N = 409 | SEM 3 mg N = 466 | SEM 7 mg N = 464 | SEM 14 mg N = 465 | SITA 14 mg N = 466 | SEM 14 mg N = 285 | LIRA 1.8 mg N = 184 | PBO N = 142 | |
vvvvvv vv vvvvvvvv vvvvvvvv v vvv | |||||||||
|
|
|
|
|
|
|
|
|
|
|
|
|
|
|
|
|
|
|
|
|
|
|
|
|
|
|
|
|
|
|
|
|
|
|
|
|
|
|
|
|
|
|
|
|
|
|
|
|
|
|
|
|
|
|
|
|
|
|
|
|
|
|
|
|
|
|
|
|
|
|
|
|
|
|
|
|
|
|
|
|
|
|
|
|
|
|
|
|
|
|
|
|
|
|
|
|
|
|
|
|
|
|
|
|
|
|
|
|
|
|
|
|
|
|
|
|
|
|
|
|
|
|
|
|
|
|
|
|
|
|
|
|
|
|
|
|
|
|
|
|
|
|
|
|
|
|
|
|
|
|
|
|
|
|
|
|
|
|
|
|
|
|
|
|
|
|
|
|
|
|
|
|
|
|
|
|
|
|
|
|
|
|
|
|
|
|
|
|
|
|
|
|
|
|
|
|
|
|
|
|
|
|
|
|
|
|
|
|
|
|
|
|
|
|
|
|
|
|
|
EMPA = empagliflozin; LIRA = liraglutide; N/A = not applicable; PBO = placebo; SEM = semaglutide; SITA = sitagliptin.
Source: Clinical Study Reports.13-15
Table 72: Exposure (Placebo-Controlled RCTs)
Duration of Exposure by weeks | PIONEER 1 | PIONEER 5 | PIONEER 8 | |||||||
|---|---|---|---|---|---|---|---|---|---|---|
SEM 3 mg N = 175 | SEM 7 mg N = 175 | SEM 14 mg N = 175 | PBO N = 178 | SEM N = 163 | PBO N = 161 | SEM 3 mg N = 184 | SEM 7 mg N = 181 | SEM 14 mg N = 181 | PBO N = 184 | |
vvvvvv vv vvvvvvvv vvvvvvvv v vvv | ||||||||||
|
|
|
|
|
|
|
|
|
|
|
|
|
|
|
|
|
|
|
|
|
|
|
|
|
|
|
|
|
|
|
|
|
|
|
|
|
|
|
|
|
|
|
|
|
|
|
|
|
|
|
|
|
|
|
|
|
|
|
|
|
|
|
|
|
|
|
|
|
|
|
|
|
|
|
|
|
|
|
|
|
|
|
|
|
|
|
|
|
|
|
|
|
|
|
|
|
|
|
|
|
|
|
|
|
|
|
|
|
|
|
|
|
|
|
|
|
|
|
|
|
|
|
|
|
|
|
|
|
|
|
|
|
|
|
|
|
|
|
|
|
|
|
|
|
|
|
|
|
|
|
|
|
|
N/A = not applicable; PBO = placebo; SEM = semaglutide
Source: Clinical Study Reports.12,16,17
Duration of Exposure byweeks | PIONEER 6 | |
|---|---|---|
SEM 14 mg N = 1591 | PBO N = 1592 | |
| ||
|
|
|
|
|
|
|
|
|
|
|
|
|
|
|
|
|
|
|
|
|
|
|
|
PBO = placebo; SEM = semaglutide.
Source: PIONEER 6 Clinical Study Report.20
Table 74: Exposure (Population-specific supportive studies)
Duration of Exposure, week | PIONEER 9 | PIONEER 10 | |||||||
|---|---|---|---|---|---|---|---|---|---|
SEM 3 mg N = 49 | SEM 7 mg N = 49 | SEM 14 mg N = 48 | LIRA N = 48 | PBO N = 49 | SEM 3 mg N = 131 | SEM 7 mg N = 132 | SEM 14 mg N = 130 | DULA 0.75 mg N = 65 | |
| |||||||||
|
|
|
|
|
|
|
|
|
|
|
|
|
|
|
|
|
|
|
|
|
|
|
|
|
|
|
|
|
|
|
|
|
|
|
|
|
|
|
|
|
|
|
|
|
|
|
|
|
|
|
|
|
|
|
|
|
|
|
|
|
|
|
|
|
|
|
|
|
|
|
|
|
|
|
|
|
|
|
|
|
|
|
|
|
|
|
|
|
|
|
|
|
|
|
|
|
|
|
|
|
|
|
|
|
|
|
|
|
|
|
|
|
|
|
|
|
|
|
|
|
|
|
|
|
|
|
|
|
|
|
|
|
|
|
|
|
|
|
|
DULA = dulaglutide; LIRA = liraglutide; PBO = placebo; SEM = semaglutide.
Source: PIONEER 9 and PIONEER 10 Clinical Study Reports.18,19
Statistical Analysis
For each of the closed testing procedures presented for PIONEER 1 to 4 and 8: if a hypothesis was confirmed, the local significance level (alpha-local) was reallocated to the other hypotheses in the testing strategy according to the indicated weight (1/3, ½ or 1) of the arrows. Each hypothesis was tested at its updated local significance level (alpha-local) until all hypotheses had been confirmed or until no hypothesis could be confirmed.
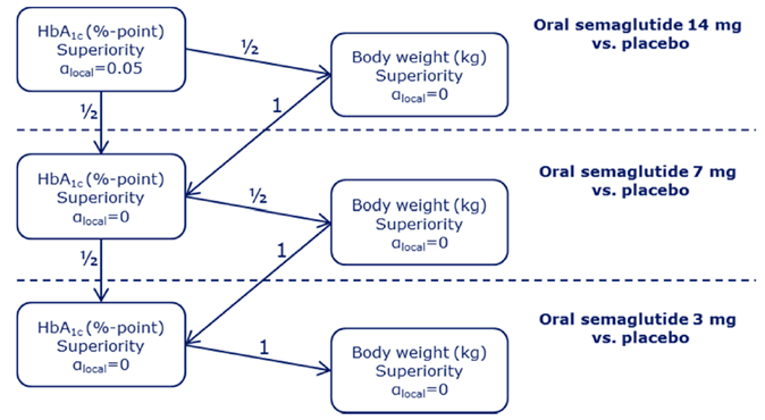
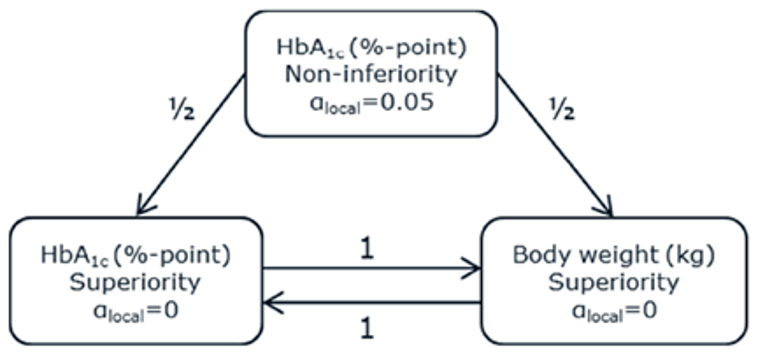
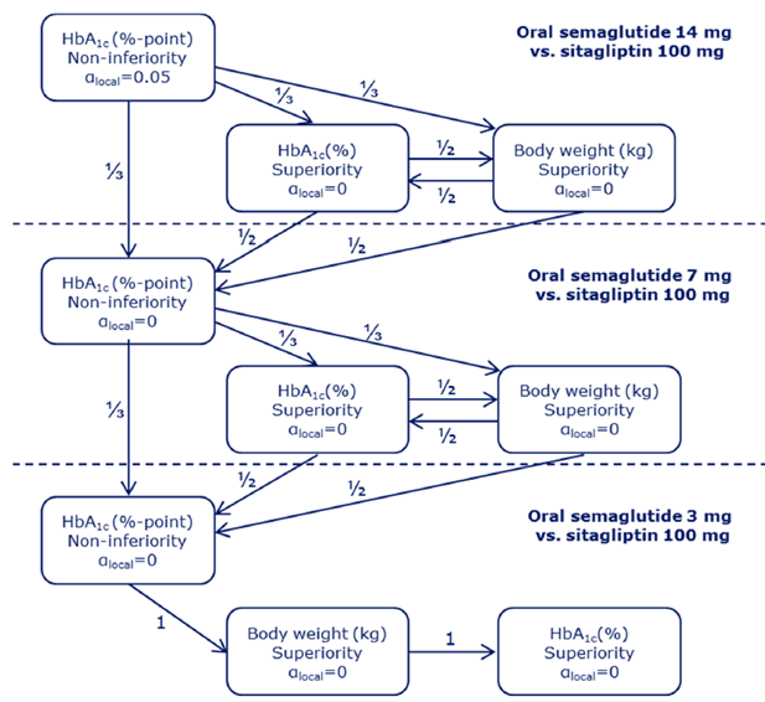
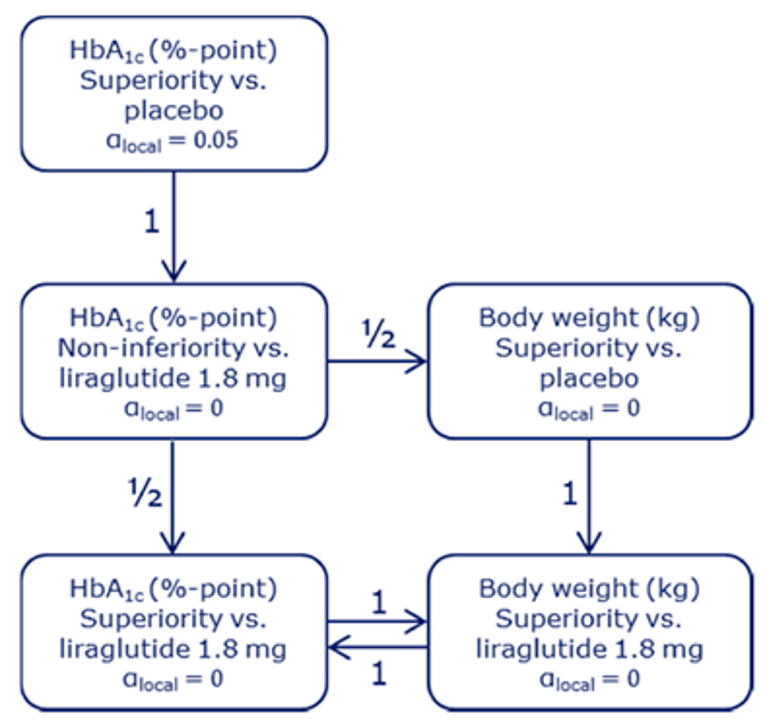
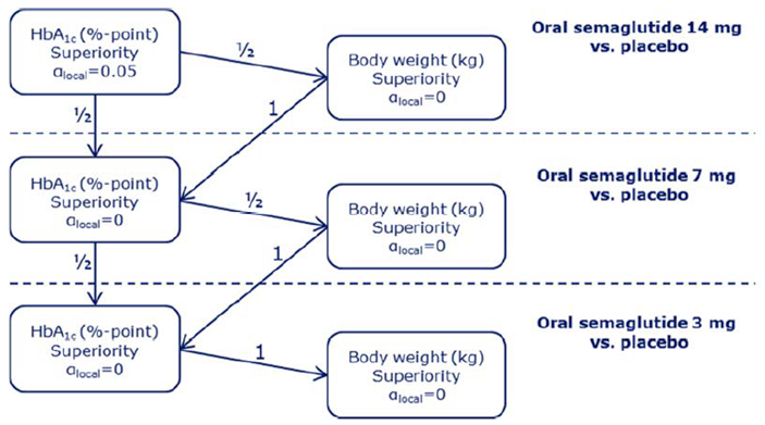
Subgroup Analyses
Figure 20: Subgroup analyses for PIONEER 1 to 5, 7 to 8: A1C (%) estimated change from baseline, by baseline A1C

vvvv vvvv vvv vvvvvvvv vvvvvvvvvvv vvvvvvv vvvvvvvvv vvvvvv vvvvvvvvv vvvvvv vvvvv vvvv vvvvvvvvvvvvvv vv vvvvvvvvv vvvvvvvvv vvvvvvvvvvvvvvv vv vvvvvvvvvv vv vvvvvv vvvvvvvvvvv vvvvvvv vvvvvv vvvv vvvvvvv vv v vvvvvvv vvvvvvv vvvvv vvvvv vvvvvvvv vvvvvvvvvvv vvvvvvv vvv vvvvvvv vv vvvvvvvvv vvv vvv vvvvvvvvv vvvvvvv
Figure 20 was redacted at the sponsor’s request.
Source: Sponsor submission.36
Figure 21: Subgroup analyses for PIONEER 1 to 5, 7 to 8: A1C (%) by body weight (kg)

vvvv v vvvvvvvvvvvvvv vvv v vvvv vvvvvvvv vvvv vvvvv v vvvvvvvv vvvvvvvvvvv vvvv v vvvvvvvvvvvv vvvv v vvvvvvvvvvvv vvvv v vvvvvvvvvvvv
vvvv vvvv vvv vvvvvvvv vvvvvvvvvvv vvvvvvv vvvvvvvv vvvvvvvvv vvv vvvvvvvvv vvvvvv vvvvvvvvv vvvvvv vvvvv vvvv vvvvvvvvvvvvvv vv vvvvvvvvv vvvvvvvvvvvvvvv vv vvvvvvvvv vvv vvvvvvvvvv vv vvvvvv vvvvvvvvvvv vvvvvvv vvvvvv vvvv vvvvvvv vv v vvvvvvv vvvvvvv vvvvv vvvvv vvvvvvvv vvvvvvvvvvv vvvvvvv vvv vvvvvvv vv vvvvvvvvvv vvvvvvvvv vvv vvvvvvvvv vvvvvvv
Figure 21 was redacted at the sponsor’s request.
Source: Sponsor submission.36
HRQoL Outcomes
Figure 22: SF-36v2 change from baseline at week 26, PIONEER 1 (FAS)

Figure 22 was redacted at the sponsor’s request.
vv v vvvvvvvvvv vvvvvvvvv vvv v vvvvvvvvv vvvvvvvvv vvvvvvvvvvv vvvv v vvvvvvvvvvvv
vvvv vvvv vvv vvvvvvvv vvvvvvvvvvv vvvvvvv vvvvvvvv vvvvvvvvv vv vvv vvvvvvvvv vvvvvv vvvvvvvvv
Source: Clinical Study Report.12
Figure 23: SF-36v2 change from baseline at week 26, PIONEER 2 (FAS)
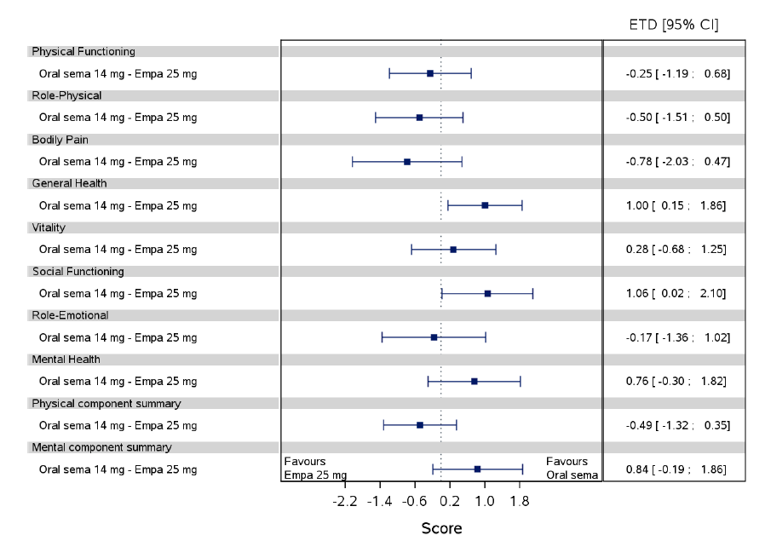
CI = confidence interval; EMPA = empagliflozin; ETD = estimated treatment difference; SEMA = semaglutide.
Data from the in-trial observation period, analyzed according to the treatment policy estimand.
Source: Clinical Study Report.13
Figure 24: CoEQ change from baseline at week 26, PIONEER 2 (FAS)
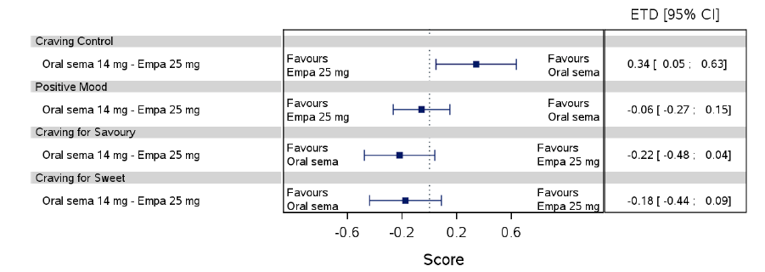
CI = confidence interval; EMPA = empagliflozin; ETD = estimated treatment difference; SEMA = semaglutide.
Data from the in-trial observation period, analyzed according to the treatment policy estimand.
Source: Clinical Study Report.13
Figure 25: SF-36v2 change from baseline at week 26, PIONEER 3 (FAS)
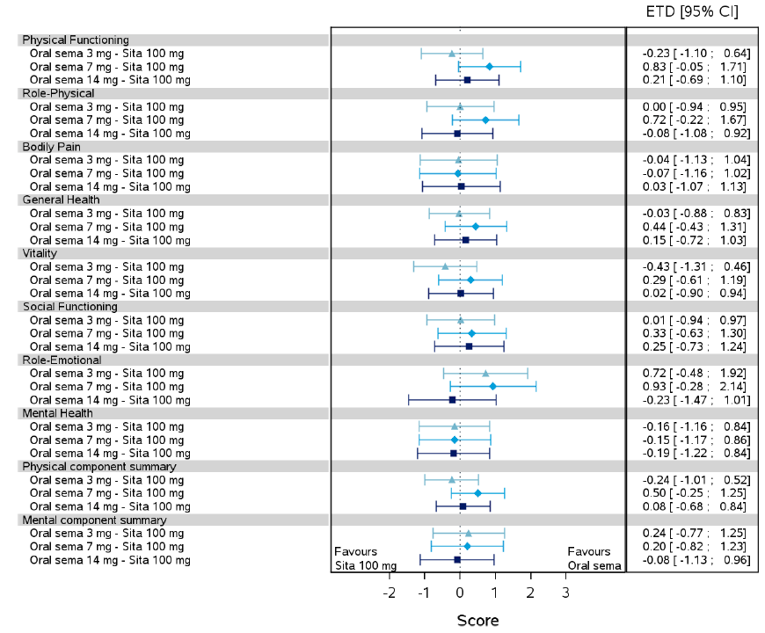
CI = confidence interval; ETD = estimated treatment difference; SEMA = semaglutide; SITA = sitagliptin.
Data from the in-trial observation period, analyzed according to the treatment policy estimand.
Source: Clinical Study Report.13
Figure 26: IWQOL change from baseline at week 26, PIONEER 3 (FAS)
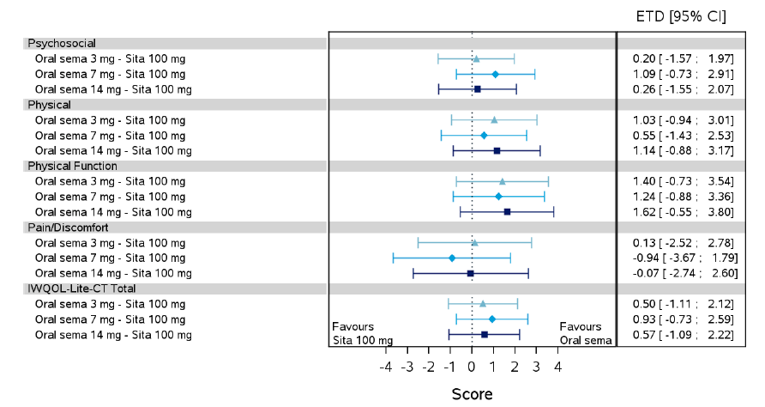
CI = confidence interval; ETD = estimated treatment difference; SEMA = semaglutide; SITA = sitagliptin.
Data from the in-trial observation period, analyzed according to the treatment policy estimand.
Source: Clinical Study Report.14
Figure 27: CoEQ change from baseline at week 26, PIONEER 3 (FAS)
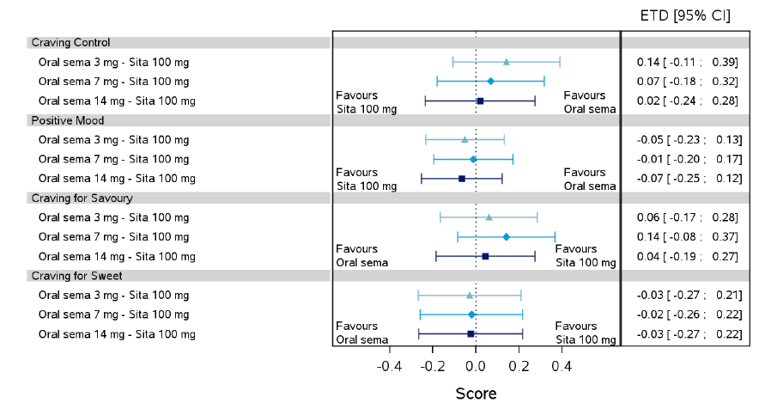
CI = confidence interval; ETD = estimated treatment difference; SEMA = semaglutide; SITA = sitagliptin.
Data from the in-trial observation period, analyzed according to the treatment policy estimand.
Source: Clinical Study Report.14
Figure 28: DTSQ change from baseline at week 52, PIONEER 4 (FAS)
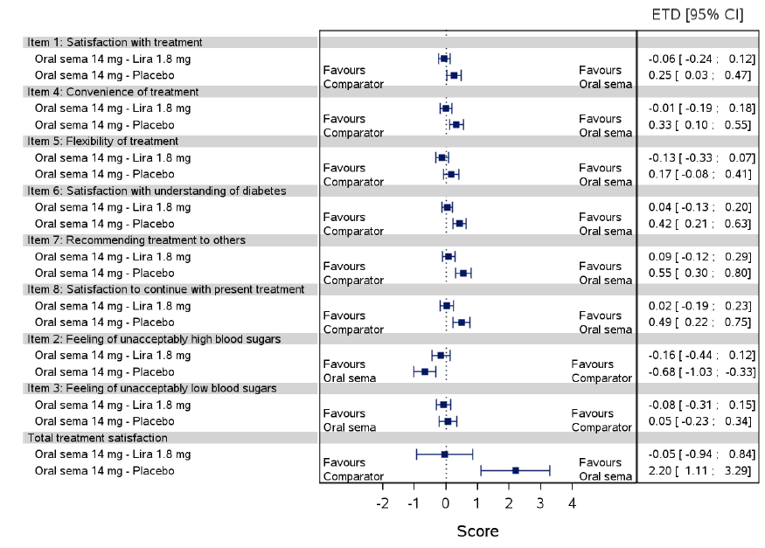
CI = confidence interval; ETD = estimated treatment difference; LIRA = liraglutide; SEMA = semaglutide.
Data from the in-trial observation period, analyzed according to the treatment policy estimand.
Source: Clinical Study Report.15
Figure 29: SF-36v2 change from baseline at week 26, PIONEER 5 (FAS)
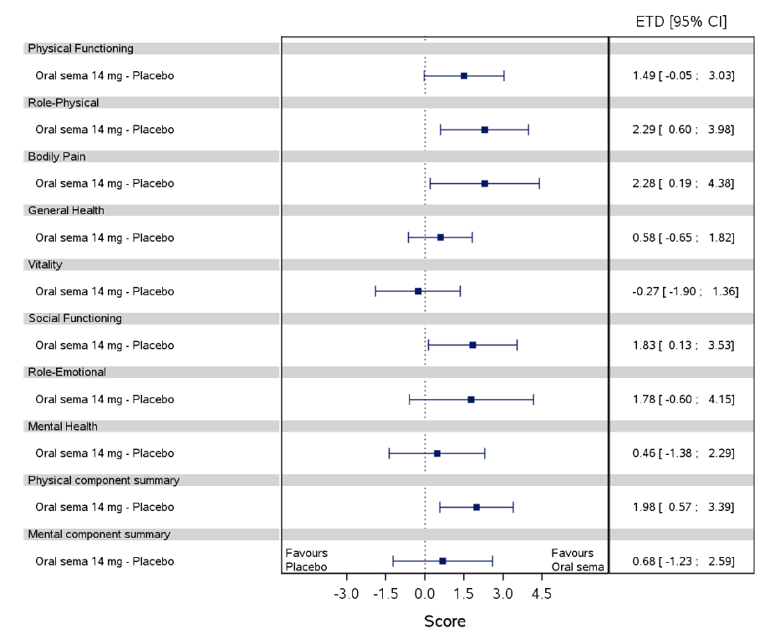
CI = confidence interval; ETD = estimated treatment difference; SEMA = semaglutide.
Data from the in-trial observation period, analyzed according to the treatment policy estimand.
Source: Clinical Study Report.16
Figure 30: DTSQ change from baseline at week 26, PIONEER 5 (FAS)
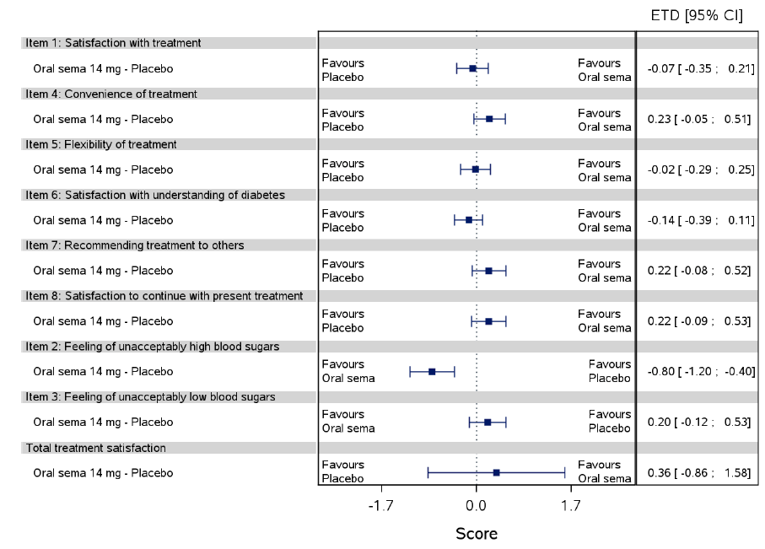
CI = confidence interval; ETD = estimated treatment difference; SEMA = semaglutide.
Data from the in-trial observation period, analyzed according to the treatment policy estimand.
Source: Clinical Study Report.16
Figure 31: SF-36v2 change from baseline at week 26, PIONEER 8 (FAS)
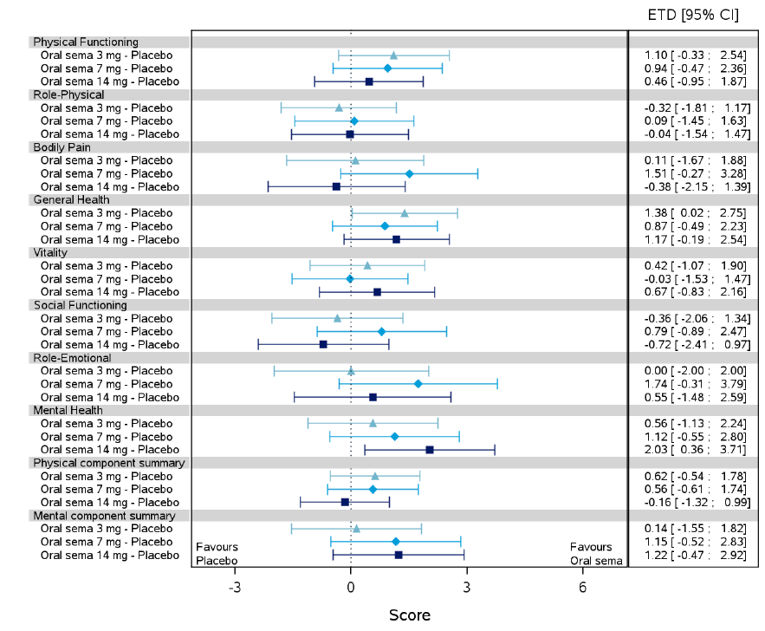
CI = confidence interval; ETD = estimated treatment difference; SEMA = semaglutide.
Data from the in-trial observation period, analyzed according to the treatment policy estimand.
Source: Clinical Study Report.17
Figure 32: IWQOL change from baseline at week26, PIONEER 8 (FAS)
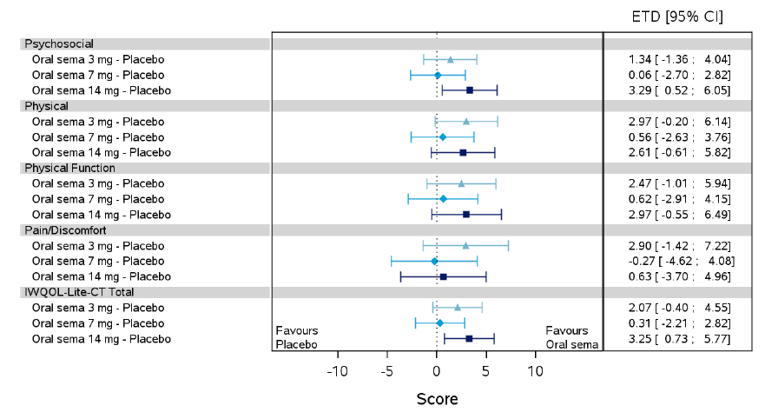
CI = confidence interval; ETD = estimated treatment difference; IWQOL = impact of weight on quality life; SEMA = semaglutide.
Data from the in-trial observation period, analyzed according to the treatment policy estimand.
Source: Clinical Study Report.17
Figure 33: SF-36v2 change from baseline at week 26, PIONEER 9 (FAS)
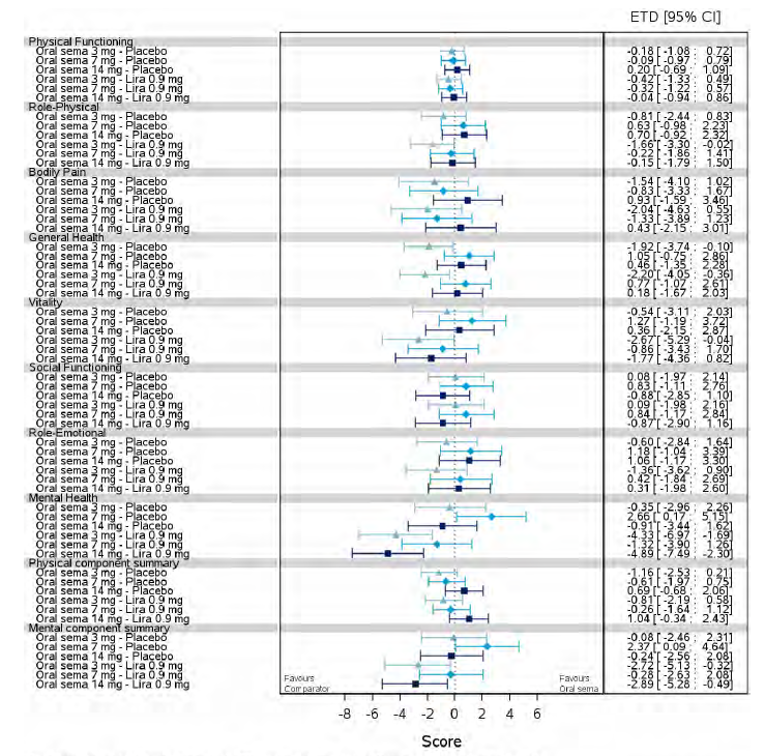
CI = confidence interval; ETD = estimated treatment difference; LIRA = liraglutide; SEMA = semaglutide.
Data from the in-trial observation period, analyzed according to the treatment policy estimand.
Source: Clinical Study Report.18
Figure 34: DTR-QOL change from baseline at week 26, PIONEER 9 (FAS)
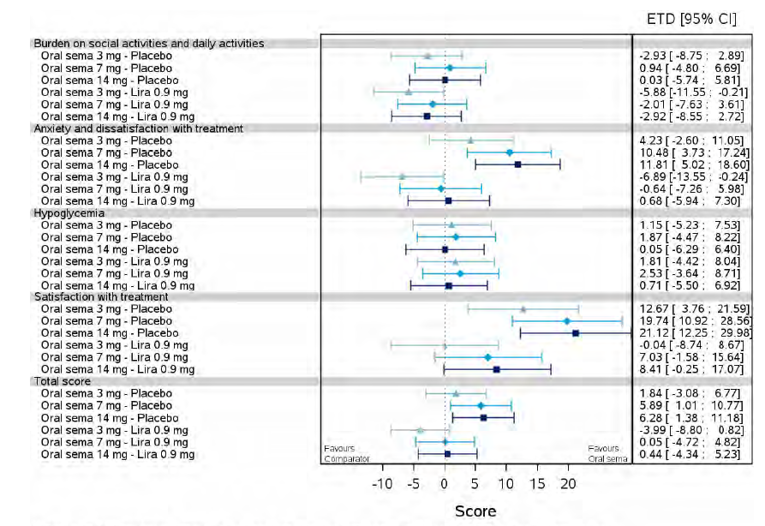
CI = confidence interval; ETD = estimated treatment difference; LIRA = liraglutide; SEMA = semaglutide.
Data from the in-trial observation period, analyzed according to the treatment policy estimand.
Source: Clinical Study Report.18
Figure 35: SF-36v2 change from baseline at week 26, PIONEER 10 (FAS)
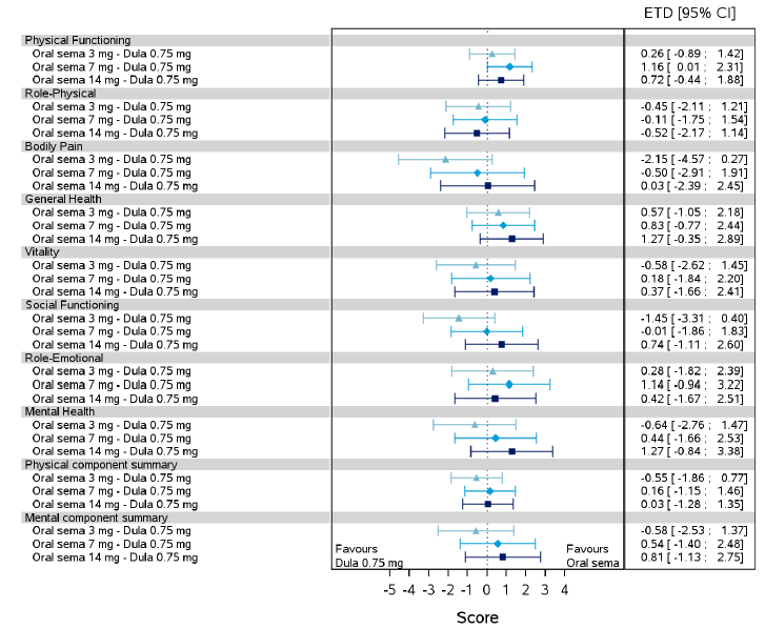
CI = confidence interval; DULA = dulaglutide; ETD = estimated treatment difference; SEMA = semaglutide.
Data from the in-trial observation period, analyzed according to the treatment policy estimand.
Source: Clinical Study Report.19
Figure 36: DTR-QOL change from baseline at week 26, PIONEER 10 (FAS)
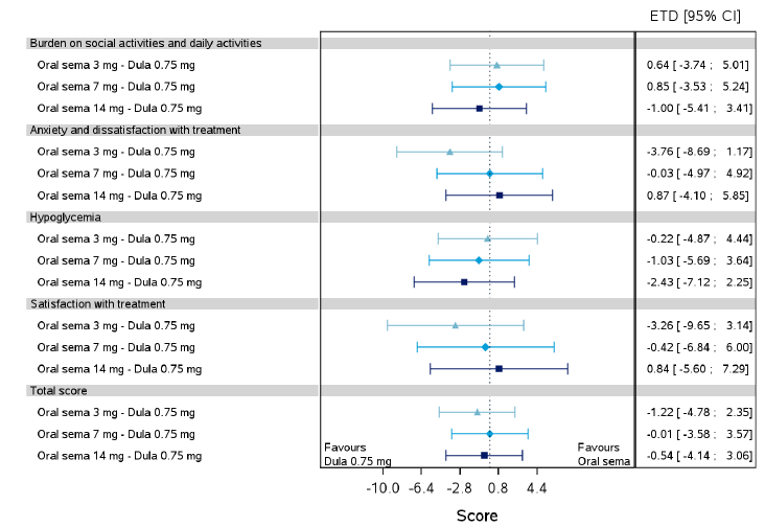
CI = confidence interval; DULA = dulaglutide; ETD = estimated treatment difference; SEMA = semaglutide.
Data from the in-trial observation period, analyzed according to the treatment policy estimand.
Source: Clinical Study Report.19
Indirect Treatment Comparison
Table 75: Summary of included studies in the NMA for second-line therapies
Study | Year | Treatment | Number of patients analyzed | Mean baseline A1C* | Mean Baseline Weight, Kg |
|---|---|---|---|---|---|
|
|
|
|
|
|
|
|
|
A1C = glycated hemoglobin; NR = not reported.
This table has been redacted.
Source: Sponsor-submitted ITC.62
Table 76: for the of third-line therapies
Study | Year | Treatment | Number of patients analyzed | Mean baseline A1C | Mean Baseline Weight, Kg |
|---|---|---|---|---|---|
|
|
|
|
|
|
|
| ||||
|
|
|
|
|
|
|
| ||||
|
| ||||
|
|
|
|
|
|
|
|
|
| ||
|
|
|
| ||
|
|
|
|
|
|
|
| ||||
|
|
|
|
|
|
|
|
|
| ||
|
|
|
|
|
|
|
| ||||
|
|
|
|
|
|
|
| ||||
|
|
|
|
|
|
|
|
|
| ||
|
|
|
| ||
|
|
|
|
|
|
|
|
A1C = glycated hemoglobin; NR = not reported.
Source: Sponsor-submitted ITC.62
PIONEER 7
PIONEER 7 is a phase III, open-label, active-controlled RCT that was included in the systematic review as a pivotal study; however, data from this trial is presented in Appendix 3. The reason for this is that PIONEER 7 evaluated semaglutide tablets with flexible dosing following adjustment criteria based on A1C or tolerability. For A1C, if A1C < 7.0% (53 mmol/mol) the current dose was continued; if A1C ≥ 7.0% (53 mmol/mol), the dose of semaglutide was escalated to the next dose level. For tolerability, if a patient reported moderate to severe nausea or vomiting for ≥ 3 days in the week before a scheduled visit, the dose of semaglutide was maintained or reduced at the discretion of the investigator, irrespective of the level of A1C. The dosing was evaluated every 8 weeks and adjusted according to the criteria described. As this is not aligned with the indication, this was not considered relevant to the review. Additionally, the clinical expert stated that treatment with semaglutide tablets is unlikely to be used following a flexible dosing schedule in clinical practice.
Table 77: Details of Included Studies (Active-Controlled RCTs, add-on to 1 to 2 OADs)
Detail | PIONEER 7 |
|---|---|
Designs and Populations | |
Study Design | Phase IIIa, OL, active-controlled, RCT |
Locations | 81 sites in 10 countries (US, South America, Europe, Egypt, South Korea, Turkey) |
Patient Enrolment Dates: | 2016 to 2017 |
Randomized (N) | 504 |
Inclusion Criteria | Adulta patients with T2DM, A1C of 7.5 to 9.5% (58 to 80 mmol/mol) inclusive, a treatment target of A1C < 7.0% (53 mmol/mol), and stable daily dose(s) of 1-2 of the following within 90 days before screening:
|
Exclusion Criteria | hypersensitivity to treatment(s) or related products Previous participation in this trial Female who is pregnant, breast-feeding or intends to become pregnant Receipt of any investigational product within 90 days before screening Any disorder that might jeopardize subject safety or protocol compliance Family or personal history with MEN 2 or MTC History of pancreatitis (acute or chronic) History of major surgical procedures involving the stomach affecting absorption of treatment MI, stroke or hospitalization for unstable angina or transient ischemic attack within past 180 days prior of screening NYHA Class IV Planned revascularization on day of screening ALT > 2.5 x ULN Proliferative retinopathy or maculopathy requiring acute treatment, verified within 90 days of randomization History or presence of malignant neoplasms within the past 5 years |
Additional exclusion criteria | Renal impairment (eGFR < 30 mL/min/1.73 m2)d Treatment with once-weekly GLP-1 receptor agonist, or once-weekly DPP-4 inhibitor or TZD in a period of 90 days before screening Treatment with any medication for the indication of diabetes or obesity other than stated in the incl. criteria within 60 days of screening except insulin for acute illness (≤ 14 days) Initiation of anti-diabetic medication between screening and randomization |
Drugs | |
Intervention | semaglutide 3, 7, or 14 mg (flexible dosingb) once daily, oral |
Comparator(s) | sitagliptin 100 mg once daily, oral |
Duration | |
Phase | |
Run-in (screening) | 2 weeks |
Double-blind/treatment period | 52 weeks |
Follow-up | 5 weeks |
Outcomes | |
Primary End Point | Patient achieved A1C < 7.0% (53 mmol/mol) after week 52 |
Secondary End Points | Secondary: change from baseline to week 52 in body weight (kg) |
Supportive secondary/ Exploratory End Points | Supportive secondary Change from baseline to week 52 in:
Binary end points (achieved after week 52):
Time to event:
PROs Change from baseline to week 52 in:
|
Notes | |
Publications | Pieber 201964 |
A1C = glycated hemoglobin; AACE = American Association of Clinical Endocrinology; ALT = alanine aminotransferase; DTSQ = Diabetes Treatment Satisfaction Questionnaire; MEN 2 = multiple endocrine neoplasia type 2; MTC = medullary thyroid carcinoma; NYHA = New York Heart Association; OL = open-label; RCT = randomized controlled trial; SF-36v2 = Short-Form Health Survey version 2; SGLT2 = sodium-glucose co-transporter 2; SU = sulfonylurea; T2DM = type 2 diabetes mellitus; TZD = thiazolidinedione; ULN = upper limit of normal.
aAdult patients defined by age ≥ 18 years at the time of signing informed consent; for Japan only: age ≥ 20 years at the time of signing informed consent; for Korea only, ≥ 19 years at the time of signing informed consent.
bPIONEER 7 semaglutide dosage adjustment criteria was based on A1C or tolerability. For A1C, if A1C < 7.0% (53 mmol/mol) the current dose was continued; if A1C ≥ 7.0% (53 mmol/mol), the dose of semaglutide was escalated to the next dose level. For tolerability, if a patient reported moderate to severe nausea or vomiting for ≥ 3 days in the week before a scheduled visit, the dose of semaglutide was maintained or reduced at the discretion of the investigator, irrespective of the level of A1C.
cPermitted OADs included: metformin, SU, glinide, alpha-glucosidase inhibitor, DPP-4 inhibitor, and SGLT2 inhibitor at a half-maximum approved dose or below according to Japanese labelling in addition to diet and exercise.
dAccording to the Chronic Kidney Disease Epidemiology Collaboration formula.42,43
Note: 3 additional reports were included.11,44,64
Source: Clinical Study Report.52
Table 78: Summary of Baseline Characteristics (Active-Controlled RCTs, add-on to 1 to 2 OADs; FAS)
Characteristic | PIONEER 7 | |
|---|---|---|
SEM flex N = 253 | SITA 100 mg N = 251 | |
Age, years, mean (SD) | 56.9 (9.7) | 57.9 (10.1) |
Sex, n (%) | ||
Male | 145 (57) | 140 (56) |
Female | 108 (43) | 111 (44) |
Race, n (%) | ||
White | 195 (77) | 186 (74) |
Black or African American | 22 (9) | 25 (10) |
Asian | 34 (13) | 38 (15) |
American Indian or Alaska Native | 0 | 0 |
Native Hawaiian or other Pacific islander | 0 | 0 |
Other | 2 (1) | 2 (1) |
Not applicable | 0 | 0 |
Not available | 0 | 0 |
Hispanic or Latino ethnicity | 48 (19) | 57 (23) |
Background medication, n (%) | ||
Metformin | 102 (40) | 87 (35) |
Sulfonylurea | 3 (1) | 6 (2) |
TZD | 0 | 1 (< 1) |
Insulin | NR | NR |
Duration of Diabetes, y, mean (SD) | 8.6 (6.3) | 9.0 (6.2) |
Body weight, kg, mean (SD) | 88.9 (19.6) | 88.4 (20.1) |
BMIb, mean (SD) | 31.5 (6.5) | 31.5 (6.1) |
A1C, %, mean (SD) | 8.3 (0.6) | 8.3 (0.6) |
Fasting plasma glucose, mg/dL, mean (SD) | 9.8 (2.4) | 9.8 (2.6) |
eCFR, mL/min/1.73 m2c, mean (SD) | 97.0 (14.4) | 95.3 (15.6) |
FAS = full analysis set; RCT = randomized controlled trial; SD = standard deviation; SEM = semaglutide
aNot applicable for Brazil and France.
bCalculated as weight in kilograms divided by height in metres squared.
cFor patients in South Africa, race was not available.
Source: PIONEER 7 Clinical Study Report.52
Table 79: Patient Disposition (Active-Controlled RCTs, add-on to 1 to 2 OADs)
Patient Disposition | PIONEER 7 | |
|---|---|---|
SEM flex N = 253 | SITA 100 mg N = 251 | |
Screened, N | 804 | |
Randomized, N (%) | 253 | 251 |
Exposed | 253 (100) | 250 (99.6) |
Completed trial | 241 (95.3) | 244 (97.2) |
Withdrawal from trial | 12 (4.7) | 7 (2.8) |
Withdrawal by patient | 5 (2.0) | 1 (0.4) |
Lost to follow-up | 7 (2.8) | 4 (1.6) |
Died | 0 | 2 (0.8) |
Discontinued from treatment, N (%) | 42 (16.6) | 23 (9.2) |
Exposed | ||
Adverse events | 22 (8.7) | 10 (4.0) |
Patient withdrawal | 3 (1.2) | 1 (0.4) |
Participation in another clinical | 0 | 0 |
Violation of inclusion/exclusion criteria | 5 (2.0) | 1 (0.4) |
Calcitonin value > = 100 ng/L | 0 | 0 |
Intention of becoming pregnant | 0 | 0 |
Pregnancy | 0 | 1 (0.4) |
Other | 12 (4.7) | 9 (3.6) |
Not exposed | ||
Violation of inclusion and/or exclusion criteria | 0 | 1 (0.4) |
Other | 0 | 0 |
Analysis Sets | ||
ITT, N | 253 (100) | 251 (100) |
Safety, N | 253 (100) | 250 (99.6) |
ITT = intention to treat; SEM = semaglutide; SITA = sitagliptin.
treatmentNote: Rescue medication was defined as the use of new anti-diabetic medication as add-on to treatment and used for more than 21 days with the initiation at or after randomization and before last day on treatment.
Source: PIONEER 7 Clinical Study Report.52
Exposure
vvvv vvvvvvvv vvvv vv vvvv had a treatment exposure of between 48 and 56 weeks; vvvvvvvvvvvvv vvv of patients had a treatment exposure of between 52 and 56 weeks, with vvv of patients between 48 and 52 weeks. This is in line with the trial design which was prespecified to be 52 weeks.
Table 80: Exposure (Active-Controlled RCTs, add-on to 1 to 2 OADs)
PIONEER 7 | ||
|---|---|---|
Duration of Exposure, week | SEM flex N = 253 | SITA 100 mg N = 250 |
|
|
|
|
|
|
|
|
|
|
|
|
|
|
|
|
|
|
|
|
|
|
|
|
|
|
|
|
|
|
|
|
|
|
|
|
|
|
|
|
|
|
|
|
|
SEM = semaglutide; SITA = sitagliptin.
Source: PIONEER 7 Clinical Study Report.52
Statistical Analysis
Study | Primary outcome | Power, % | Withdrawal rate, % | Expected mean difference (SD) | Total planned sample size, (per group) | Significance level SEM vs. control |
|---|---|---|---|---|---|---|
PIONEER 7 | achieving A1C < 7.0% (53 mmol/mol) at Week 52 | 90 | 15 | 15% difference | 500 (250) | 5% |
A1C = glycated hemoglobin; SEM = semaglutide.
Source: PIONEER 7 Clinical Study Report.52
Efficacy
The primary end point in PIONEER 7 was achievement of A1C < 7.0% (53 mmol/mol) after week 52. The secondary end point was change from baseline to week 52 in body weight (kg).
Table 81: Glycemic Control Outcomes (PIONEER 7; FAS)
Week, change from baseline | PIONEER 7 | |
|---|---|---|
SEM flex (3, 7, or 14 mg) N = 253 | SITA 100 mg N = 251 | |
Proportion of patients achieving A1C < 7.0% at week 52a | ||
Number of patients contributing to the analysis | 253 | 251 |
Estimated odds at week 52 | 1.31 | 0.30 |
Estimated odds ratio at week 52 (95% CI), SEM vs. SITA | 4.40 (2.89 to 6.70) | |
P value | < 0.0001 | |
A1C (%)b | ||
End of Study/Week 52 | ||
Number of patients contributing to the analysis | 253 | 251 |
Baseline, mean (SD) | 8.3 (0.6) | 8.3 (0.6) |
Week 52, mean (SE)c | 7.0 | 7.5 |
Change from baseline, mean (SE)c | –1.3 | –0.8 |
Treatment group difference vs. control (95% CI) | –0.5 (–0.7 to –0.4) | |
P valued | < 0.0001 | |
A1C = glycated hemoglobin; CI = confidence interval; FAS = full analysis set; SD = standard deviation; SE = standard error; SEM = semaglutide; SITA = sitagliptin.
aData from the in-trial observation period. The binary end point was analyzed using a logistic regression model with treatment, strata, and region as categorical fixed effects and baseline value as covariate for each of the 1000 imputed complete datasets, and pooled by Rubin's rule to draw inference. Missing values for continuous end points that enter the binary end point were assigned their corresponding imputed values from respective primary analyses.
bData from the in-trial observation period. Missing post-baseline values were imputed by a pattern mixture model using multiple imputation. Pattern was defined by treatment arm and treatment status (premature treatment discontinuation and/or initiation of rescue medication), and imputations were based on an ANCOVA model. Imputation was from own treatment arm and same treatment status. Change from baseline was analyzed using an ANCOVA model with treatment, strata, and region as categorical fixed effects and baseline value as covariate for each of the 1000 imputed complete datasets, and pooled by Rubin's rule to draw inference.
cStandard error was not reported.
dP-value has not been adjusted for multiple testing.
Source: PIONEER 7 Clinical Study Report.52
Table 82: Body weight (PIONEER 7; FAS)
Week, change from baseline | PIONEER 7 | |
|---|---|---|
SEM flex (3, 7, or 14 mg) N = 253 | SITA 100 mg N = 251 | |
Body weight (kg)a | ||
End of Study/Week 52 | ||
Number of patients contributing to the analysis | 253 | 251 |
Baseline, mean (SD) | 88.9 (19.6) | 88.4 (20.1) |
Week 52, mean (SE)b | 86.0 | 87.9 |
Change from baseline, mean (SE)b | –2.6 | –0.7 |
Treatment group difference vs. control (95% CI) | –1.9 (–2.6 to –1.2) | |
P value | < 0.0001 | |
CI = confidence interval; FAS = full analysis set; SD = standard deviation; SE = standard error; SEM = semaglutide; SITA = sitagliptin.
aData from the in-trial observation period. Missing post-baseline values were imputed by a pattern mixture model using multiple imputation. Pattern was defined by treatment arm and treatment status (premature treatment discontinuation and/or initiation of rescue medication), and imputations were based on an ANCOVA model. Imputation was from own treatment arm and same treatment status. Change from baseline was analyzed using an ANCOVA model with treatment, strata, and region as categorical fixed effects and baseline value as covariate for each of the 1000 imputed complete datasets, and pooled by Rubin's rule to draw inference.
bStandard error was not reported.
Source: PIONEER 7 Clinical Study Report.52
Table 83: Summary of Harms (Active-Controlled RCTs, add-on to 1 to 2 OADs)
Harms | PIONEER 7 | |
|---|---|---|
SEM flex (3, 7, or 14 mg) N = 253 | SITA 100 mg N = 250 | |
Patients with ≥ 1 adverse event | ||
n (%) | 197 (78) | 172 (69) |
Most common eventsa, n (%) | ||
Nausea | 53 (21) | 6 (2) |
Diarrhea | 22 (9) | 8 (3) |
Vomiting | 14 (6) | 2 (1) |
Nasopharyngitis | 26 (10) | 13 (5) |
Influenza | < 5% | < 5% |
Headache | 25 (10) | 15 (6) |
Decreased appetite | < 5% | < 5% |
Constipation | < 5% | < 5% |
Dyspepsia | 13 (5) | 2 (1) |
Back pain | < 5% | < 5% |
Upper respiratory tract infection | 9 (4) | 15 (6) |
Abdominal discomfort | 16 (6)b | 3 (1)b |
Urinary tract infection | < 5% | < 5% |
Hypertension | < 5% | < 5% |
Arthralgia | < 5% | < 5% |
Diabetic retinopathy | < 5% | < 5% |
Blood glucose increased | < 5% | < 5% |
Patients with ≥ 1 SAE | ||
n (%) | 24 (9) | 24 (10) |
Most common eventsc, n (%) | ||
Neoplasms benign, malignant and unspecified (including cysts and polyps) | 9 (3.6) | 3 (1.2) |
Nervous system disorders | n < 2 | n < 2 |
Cardiac disorders | 2 (0.8) | 4 (1.6) |
Injury, poisoning and procedural complications | 2 (0.8) | 1 (0.4) |
Musculoskeletal and connective tissue disorders | 0 | 2 (0.8) |
Infections and infestations | 2 (0.8) | 2 (0.8) |
Renal and urinary disorders | 3 (1.2) | 2 (0.8) |
Gastrointestinal disorders | 1 (0.4) | 4 (1.6) |
General disorders and administration | 2 (0.8) | 2 (0.8) |
Respiratory, thoracic and mediastinal disorders | n < 2 | n < 2 |
Surgical and medical procedures | n < 2 | n < 2 |
Blood and lymphatic system disorders | n < 2 | n < 2 |
Eye disorders | n < 2 | n < 2 |
Hepatobiliary disorders | n < 2 | n < 2 |
Vascular disorders | n < 2 | n < 2 |
Reproductive system and breast disorders | 0 | 2 (0.8) |
Investigations | n < 2 | n < 2 |
Metabolism and nutrition disorders | n < 2 | n < 2 |
Ear and labyrinth disorders | n < 2 | n < 2 |
Patients who stopped treatment due to adverse events | ||
n (%) | 22 (9) | 8 (3) |
Gastrointestinal disorders | 14 (6) | 2 (1) |
Deaths | ||
n (%) | 0 | 1 (< 1) |
CV death, n (%) | 0 | 1 |
Renal causes | 0 | 0 |
Malignancy | 0 | 0 |
Pancreatic causes | 0 | 0 |
Neurologic | 0 | 0 |
Infection | 0 | 0 |
Hepatobiliary causes | 0 | 0 |
Accidental overdose | 0 | 0 |
Undetermined cause, n (%) | 0 | 0 |
Notable harms | ||
Nausea | 50 (19.8) | 2 (0.8) |
Vomiting | 11 (4.3) | 1 (0.4) |
Diarrhea | 16 (6.3) | 4 (1.6) |
Hypoglycemia | 1 (0.4) | 1 (0.4) |
Severe hypoglycemia | 0 | 0 |
Anaphylaxis | 0 | 0 |
Pancreatitis | 0 | 0 |
MTC | 0 | 0 |
aFrequency > 5% in any group.
bClassified as ‘abdominal pain upper’
cFrequency ≥ 2 patients in any group.
dFrequency > 3% in any group.
Source: PIONEER 7 Clinical Study Report.52
Appendix 4: Description and Appraisal of Outcome Measures
Note that this appendix has not been copy-edited.
Aim
To describe the following outcome measures and review their measurement properties (validity, reliability, responsiveness to change, and MID):
Short form (36) health survey (SF-36)
Control of Eating Questionnaire (CoEQ)
Diabetes Treatment-Related Quality of Life (DTR-QOL)
Impact of Weight on Quality of Life-Lite clinical trials version (IWQoL-Lite-CT)
Diabetes Treatment Satisfaction Questionnaire (DTSQ)
Findings
A focused literature search was conducted to identify the psychometric properties and minimally important difference (MID) of each of the stated outcome measures. Table 83 summarizes the findings.
Table 84: Summary of outcome measures and their measurement properties
Outcome Measure | Type | Conclusions about Measurement Properties | MID |
|---|---|---|---|
SF-36v2 | Generic questionnaire measuring multidimensional health concepts and to capture a full-range of health states. | Validity and Reliability: Evidence of validity and reliability in general populations, with evidence supporting adequate validity among patients with T1D and T2D. However, validity and reliability in some dimensions among diabetes patients were not optimal, suggesting revalidation of the questionnaire among this patient population. | General (non-disease specific) MID:
Patients with T2D: A benchmark based on 1-point change was suggested.55 However, the validity of this benchmark is unclear. |
CoEQ | Questionnaire aimed at weight loss clinical trials assessing intensity and type of food cravings, and subjective sensations of appetite and mood, and the individual’s perceived level of control against a craved food item. | Validity and Reliability: Validity and reliability were assessed in patients in weight loss trials. Evidence suggested the questionnaire may be useful for assessing impact of eating and weight and quality of life. No literature was identified that assessed validity and reliability in diabetes patients. | No literature pertaining to MIDs was retrieved. |
DTR-QOL | Japanese specific questionnaire assessing the influence of diabetes treatment on a patient’s HRQoL. | Validity and Reliability: Validity and reliability were assessed and considered adequate in Japanese patients in with diabetes. | No literature pertaining to MIDs was retrieved. |
IWQoL-Lite-CT | Questionnaire originally developed for assessment of HRQoL in obesity trials and expanded to apply to diabetes trials per FDA guidance. | Validity and Reliability: Validity and reliability were assessed in patients in weight loss trials and diabetes trials. Evidence suggested higher validity and reliability among weight loss trials compared to diabetes trials. However, validity and reliability were adequate for use among diabetes patients with further examination of the questionnaire in future diabetes trials. | No literature pertaining to MIDs was retrieved |
DTSQs | Diabetes-specific questionnaire assessing patient satisfaction to treatment. | Validity and Reliability: Validity and reliability were not assessed in diabetes patients. | No literature pertaining to MIDs was retrieved. |
CoEQ = Control of Eating Questionnaire; CT = clinical trials version; DTR-QOL = Diabetes Treatment-Related Quality of Life; DTSQ = Diabetes Treatment satisfaction Questionnaire; HRQoL = health related quality of life; IWQoL = Impact of Weight on Quality of Life-Lite; MID = minimal important difference; SF-36 = Short Form (36) Health Survey; T1D = type 1 diabetes; T2D = type 2 diabetes; VAS = visual analogue scale.
SF-36v2
Description
The SF-36v2 is a generic health assessment questionnaire that has been used in clinical trials to study the impact of chronic disease on HRQoL. Item response options are presented on a 3- to 6-point, Likert-like scale. Each item is scored on a 0 to 100 range and item scores are averaged together to create the 8 domain scores. The SF-36v2 also provides 2 component summaries, the physical component summaries (PCS) and the mental component summary (MCS), which are created by aggregating the 8 domains according to a scoring algorithm. Therefore, the PCS and MCS and 8 dimensions are each measured on a scale of 0 to 100, which are T-scores (mean of 50 and standard deviation of 10) that have been standardized to the US general population.65 Thus, a score of 50 on any scale would be at the average or norm of the general US population and a score 10 points lower (i.e., 40) would be 1 standard deviation below the norm.65 On any of the scales, an increase in score indicates improvement in health status.
The questionnaire consists of items representing 8 dimensions: physical functioning (PF), role-physical (RP), bodily pain (BP), general health (GH), vitality (VT), social functioning (SF), role-emotional (RE), and mental health (MH). A recall period of approximately 1 week is expected for the acute version of this questionnaire.
Validity
Validation of the SF-36 has been performed in a number of studies in T1D /T2D combined populations66-69; and in T2D: general populations in Germany (N = 144)70 and in the UK (N = 131),71 Pima Indian adults (N = 54), 72 older Chinese adults (N = 182),73 and US veterans (N = 331; 98% male).74 All validation studies were performed in male and female adults. Previous studies have revealed that dimensions of the SF-36 showed appropriate loading onto either the PCS or MCS65,66,69,73 Inter-dimension correlations of the SF-36 in a T1D/T2D patient population, ranged from 0.179 (mental health correlation with physical functioning) to 0.637 (role physical with pain),67 suggesting that different dimensions are measuring somewhat different constructs.
One challenge when validating a pre-established, generic HRQoL instrument for use in a specific disease population is in the identification of appropriate measures against which to test the instrument (construct validity), when no gold standard is available (criterion validity). A number of studies have assessed the association between HbA1c, a known surrogate marker in both forms of diabetes, and SF-36 dimensions, and have reported unexpected, poor or negligible correlations establishing that there is no clear relationship between dimensions of the SF-36 and HbA1c levels.72,75 An initial study comparing physician assessment of patient health to the patient reported SF-36 dimension scores reported unsatisfactory correlations (0.39 to 0.64).69 Construct validity testing was based on exploratory and a priori hypotheses. The SF-36 showed evidence of measuring effects of diabetic complications, 71 treatment type and changes following diabetes interventions, 70,72 but it was also influenced by non-diabetic comorbidity 71,72and other non-diabetes-specific factors.71,72
Validity of the SF-36 dimensions was also evaluated using diabetes-specific HRQoL measures, including the Audit of Diabetes Dependent Quality of Life (ADDQoL)71 and the Diabetes-39 (D-39)69. SF-36 correlated better with the ADDQoL in patients without any other disease or comorbidity than in those with comorbidities (Spearman’s rank coefficients: 0.30 to 0.44) across 5 domains: SF, RP, MH, VT, GH (P < 0.05). 71 The SF-36 and the D-39 were superior to each other in different aspects; for example the SF-36 performed better on some dimensions and in the PCS for CVD and cerebrovascular complications (Cohen’s effect sizes highest in the physical dimensions) and for the diabetic all-complication summary known group comparison (effect sizes of SF-36 = 0.38 versus D-39 summary score = 0.15). However, the D-39 showed improved discriminative power over the SF-36 (based on C-statistic) for assessing 2-hour post-prandial glucose (0.7 vs 0.63; P < 0.05). In general, the SF-36 performed better than the D-39 for complication known groups.
For the PIONEER 9 and 10 trials, the SF-36v2 acute version questionnaire was translated to Japanese and linguistically validated before being handed out to patients in the trial.
Reliability
Alpha coefficients varied according to study and population with some ranges reporting internal reliability ≥ 0.7 to 0.94 for all dimensions,66,71 while others found some dimensions to have lower reliability: SF,69,72 RE,RP,VT,70 GH.68,70,73 Internal reliability discrepancies (dimensions with alpha lower than 0.7) may relate the specific characteristics, health states, socioeconomic or cultural traits of the population used to validate the instrument. No dimensions were found to have alpha coefficients ≥ 0.95, though some exceeded 0.9 (higher alpha coefficients may suggest redundancy). One US study among adults between 18 and 60 years of age and including both T1D (64%) and T2D (31%) measured test-retest reliability by comparing baseline to 6-month surveys. All correlations were positive, but a range of coefficients were reported for the different dimensions (0.411 to 0.902).67 While the generalizability of the results to T2D patients may be acceptable, studies focusing on T2D patients specifically may help to better address the responsiveness of the questionnaire to the specific needs of this patient group. Test-retest reliability was also measured in a German population with T2D within 1 to 3 days of the original test. Measures of internal consistency at both time points were captured but no correlations were calculated. Internal consistency ranged from 0.67 to 0.96 at baseline and from 0.61 to 0.89 at retest. Upon retest, some dimensions were more affected than others including: RE and RP (lower), GE (higher).70 One study of 331 US veterans including mostly (98%) males with T2D (921%) with a mean age of 63.5 years assessed responsiveness.74 Six of the SF-36 dimensions (GH, PF,SF,RP,BP, VT) were found to be responsive when patients who developed ≥ 2 complications were compared with those who were stable/improved, and an increase of > 1 complication was associated with a loss of 4.1 to 23.6 points on these 6 scales. Statistically significant changes in SF-36 dimension scores were related to any renal complication in 5 (GH,PF,RP,VT) of these 6 dimensions or to any neuropathy complication in 4 (GH,PF,RP,VT).74
The SF-36 was developed as a generic questionnaire; as such, revalidation may be necessary when applied to diabetes population due to the lack of optimization in validity and reliability scores observed in some dimensions of the SF-36.69,73 When used in combination with other diabetes-specific HRQoL instruments, the SF-36 may help to provide insight in the impact of diabetes and treatments on patients quality of life
MCID
In general use of the SF-36v2, the User’s Manual65 proposed the following minimally important differences (MID): a change of 2 points on the PCS, and 3 points on the MCS. The manual also proposes the following minimal mean group differences, in terms of T-score points, for SF-36v2 individual dimension scores: PF, 3; RP, 3; BP, 3; GH, 2; VT, 2; SF, 3; RE, 4; and MH, 3. It should be noted that these MID values were determined as appropriate for groups with mean T-score ranges of 30 to 40; for higher T-score ranges, values may be higher.65 MID values do not represent patient- derived scores. The MIDs for the SF-36v2 are based on clinical and other non-patient-reported anchors.65 One study investigated benchmarks for MIDs for 1-point lower SF-36 scores in populations with diabetes, by using data from 3 datasets: the Medical Outcomes Study (MOS), the Medicare Health Outcomes Study (MHOS), and the QualityMetric Patient Reported Outcome Norming Survey (QM Norms).55 The MOS and MHOS were observational studies and administered version 1 of the SF-36, while the QM Norms was cross-sectional and administered the SF-36v2. It was noted that the 3 studies involved samples which were not comparable, but which aided in the robustness of their analysis across different populations. The study suggested that a 1-point lower scores on the PCS, and the PF and GH scales was associated with a 5% to 9% increase in mortality risk. Further a 1-point lower score on the PCS and PF, RP, BP, GH, VT, and SF scales were associated with a 2% to 4% increase in risk of hospitalization over the following 6 months, a 7% to 12% increase in being unable to work, and a 4% to 7% increase in losing the ability to work over the following 6 months. The magnitude of the increased risk were found to be statistically significant; however, this may be difficult for interpretation from both a clinical and patient perspective. It is uncertain whether a 1-point change leading to a small increase in risk is clinically meaningful. Further, the study did not adjust for potentially important confounding variables related to diabetes, including disease type (T1D versus T2D), disease duration, treatment type, glycemic control, lifestyle factors (such as smoking), and socioeconomic factors (such as income level).55 As such, the validity of these 1-point score difference benchmarks remains unclear.
CoEQ
Description
The CoEQ questionnaire has its origins in the Food Craving Record. The questionnaire contains 21 items using 6 sections assessing the intensity and type of food cravings, and subjective sensations of appetite and mood, and the individual’s perceived level of control against a craved food item.58 Sections 1 and 2 of the questionnaire pertain to questions of general levels of appetite and overall mood (independent of food craving). Sections 3 and 4 assess the frequency and intensity of food cravings in general. Section 5 assesses cravings for specific foods (e.g., dairy, starch, sweet or non-sweet foods). Section 6, which includes items 20 and 21, assesses the perceived level of control over resisting a nominated, craved food item. Twenty items in the questionnaire are assessed using a 100-mm VAS, while 1 item (item 20) allows patients to enter their own nominated food.59 The version of this questionnaire used in the PIONEER 2 and 3 trials included only 19 items.58 Validity and reliability of the CoEQ described below are based on the complete version of the CoEQ which contains 21 items. It is unclear whether using the full questionnaire or select items may have impacted overall assessments pertaining to the CoEW between treatment groups in the PIONEER trials.
Validity
The literature search did not reveal any results pertaining to the validity or reliability of the tool with T2D patients. However, 1 study validating the CoEQ was identified by the CADTH reviewers; the study by Dalton et al., 201559 aimed to provide a preliminary examination of the components of the CoEQ, assess the construct validity with comparisons to body composition measures and psychometric measures of eating of eating behaviour traits, and assess predictive validity of intake and selection of palatable snack foods. The study reported that the CoEQ was used on an item-by-item basis in previous pharmaceutical weight loss trials.59 The items of the CoEQ were reported to be sensitive to anti-obesity agents by detecting differences in the ability to resist food cravings, control of eating, frequency of cravings, and incidences of cravings leading to eating. Items of the CoEQ were also stated to discern positive mood, craving for palatable sweet foods, craving intensity, and differences between overweight and obese females with and without binge eating tendencies.59
The study was involved a pooled analysis from 4 studies (N = 215) conducted at the University of Leeds which included samples of staff, students and local residents of the surrounding Leeds area. The selection bias of the sample may impact the overall assessment of validity as the behaviours of individuals who are practiced in healthy behaviours, such as staff or students from a University institution, may not be reflective of an average population. Baseline characteristics of the 4 studies were varied in gender ratio with most participants (80%) across studies being female, age (mean = 29.6 years; range: 18 to 55 years), and BMI (range: 25.0 to 29.9 km/m2). Sample sizes ranged from 55 to 80 participants. In general, the sample consisted largely of women with limited social and ethnic diversity affecting the overall generalizability of results. Measures assessed in the studies also varied, although waist circumference, body composition and Binge Eating Scale were completed in all 4 studies; additional measures included in the studies included the Three Factor Eating Questionnaire and Ad libitum energy intake.59 Four subscales were identified and included in the analysis for the CoEQ, including Craving control, Positive Mood, Craving for Savoury and Craving for Sweet. The study assessed the criterion and construct validity of the CoEQ subscales through their associations with psychometric eating behaviour trait variables, including the Binge Eating Scale, Three Factor Eating Questionnaire, an ad libtum eating task, as well as arthrometric measurements. The study demonstrated that CoEQ subscales had convergent validity with existing psychometric trait measures, and that subscales were also associated anthropometric and body composition variables, such as body weight, waist circumference, and fat mass; there were no associations observed between the subscales of the CoEQ and anthropometric and body composition variables of fat free mass, height, age or gender. 59 Overall, the results were supportive of CoEQ subscales associations with appetite control and adiposity of patients.
The predictive validity of CoEQ subscales through the associations of the Crave Control and Positive Mood subscales with snack food intake59. Lower scores on the Craving Control and Positive Mood subscales were associated with increased total energy intake and selection of sweet foods. Greater scores on the Craving for Sweet subscale were associated with selection and intake of sweet foods. No associations between Craving for Savoury subscale and savoury snack food selection and intake; a possible explanation was that meal-based cravings were more likely to be captured than snack based cravings through the Craving for Savoury subscale, which is not captured in the ad libtum snack intake task.
Reliability
The internal consistency for CoEQ subscales for Craving control, Positive Mood, Craving for Savoury and Craving for Sweet were 0.88, 0.74, 0.66, and 0.67, respectively.59 The test-retest reliability of the CoEQ was unable to be determined since the questionnaire was administered to participants at only 1 time point. In addition, reproducibility of the questionnaire is not known.
In general, the assessment of validity and reliability of the CoEQ is preliminary, and no data was retrieved regarding the use of the questionnaire among diabetes patients specifically. The CoEQ has not been used widely in clinical trials; therefore, familiarity with this questionnaire among clinicians is likely uncommon. However, the CoEQ may be useful for determining potential associations with perceptions of eating and impact of weight on quality of life changes. The current data suggested that the questionnaire may be useful in clinical trials to assess cravings and craving control.
MID
No studies which assessed the MID of the CoEQ were identified through the CADTH literature search.
DTR-QOL
Description
The DTR-QOL was used in PIONEER 9 and 10 and is a Japanese questionnaire which assesses the influence of diabetes treatment on a patient’s HRQoL. Four domains are assessed in this questionnaire using 29 items, including “burden on social activities and daily activities”, “anxiety and dissatisfaction with treatment”, “hypoglycemia” and “satisfaction with treatment”. The domains for assessment treatment impact on quality of life in the DTR-QOL were daily activity, social activities, and somatic symptoms. Questionnaire items were adapted from the following questionnaires: Insulin Therapy Related Quality of Life, the Japanese version of the DTSQ, and the Japanese version of the Diabetes Medication Satisfaction Questionnaire. Responses to questionnaire items were captured using a 7-point Likert scale with a score of ‘1’ indicating Strongly Agree and ‘-7’ indicating Strongly disagree. Item scores are reversed making a score of 7 representative of the highest quality of life. A total score is summed and converted onto a scale between zero (indicating worse case scenario) and 100 (indicating best case scenario).57
One article by Ishii et al., 201257 was identified which reported the validity and reliability of the DTR-QOL. A summary of the key results are reported below.
Validity
The sample of 284 outpatients from Tenri Hospital in Japan were recruited to evaluate the psychometric properties of the questionnaire. The sample characteristics included the following: a mean age of 64 years (SD: 11.6), slightly more males (59.9%), with mostly T2D (92.2%), and treated with oral antidiabetic drugs alone (41.2%) or insulin alone (37.7%).57 The patient sample used to determine the validity and reliability of the DTR-QOL was enrolled from a hospital; therefore, selection bias related to enrollment of patients directly from a medical institution may have affected the results. This questionnaire was administered to only Japanese patients; while the purpose of this questionnaire was to address quality of life needs of diabetes patients in Japan, the generalizability of use for this questionnaire to other ethnicities is unclear. However, as this questionnaire was only used in the PIONEER 9 and 10 trials, the validity within those populations is acceptable.
Floor or ceiling effects in response distributions were not detected. Extreme responses for an answer of ‘1’ were between 23.2% and 66.2%, and 0.4% and 11.6% for answers of ‘7’. A correlation coefficient of ≥ 0.8 for item pairs was examined and was detected for 3 items; these items were kept within the questionnaire as they were important for measuring the influence of hypoglycemia on patients.57 The 4 factors of the DTR-QOL, “burden on social activities and daily activities”, “anxiety and dissatisfaction with treatment”, “hypoglycemia” and “satisfaction with treatment”, were associated with contribution rates of 0.62, 0.14, 0.11 and 0.05, respectively, resulting in a cumulative contribution rate of 0.92.
Correlations between the DTR-QOL and other validated questionnaires, including the Japanese versions of the DTSQ and SF-8 were assessed to determine predative validity based on prespecified criteria (Pearson product-moment correlation coefficient was interpreted as: 0.1, weak correlation; 0.3, moderate correlation; and 0.5, strong correlation). The Pearson product-moment correlation coefficients were 0.35, 0.34 and 0.44 between the DTR-QOL and the DTSQ, SF-8 (PCS), and SF-8 (MCS), respectively (all P values < 0.05); a moderate correlation was observed between the DTR-QOL and the DTSQ and SF-8, indicating higher quality of life for patients with better treatment satisfaction and general health status. Assessment of known-group validity determined that the DTR-QOL was observed to have good discriminant ability for factors related to glycemic control, hypoglycemia, weight gain, overall health status and communication with physicians as these are factors affecting patient’s satisfaction with diabetes medications.57 Scores from the DTR-QOL were found to be highest for patients being treated with diet alone, followed by OADs alone, OADs plus insulin, and insulin alone, indicating the negative impact insulin treatment has on patient’s observed treatment satisfaction.
Reliability
Internal consistency of each domain of the DTR-QOL was examined using Cronbach’s alpha coefficient. Patients with stable symptoms and with a stable treatment course were asked to complete the DTR-QOL again after a period of 1 day to assess its reproducibility; intraclass correlation coefficient was used a s a measure to determine the reproducibility of patients’ responses. In addition, the entire questionnaire had an alpha coefficient of 0.94 and an intraclass correlation coefficient of 0.92.57 The reproducibility of the DTR-QOL was suggested to be acceptable based on an internal consistency for all factors of the questionnaire (Cronbach’s alpha ≥ 0.81). While responsiveness to change was not assessed in the study, the authors assumed that it would be sufficient based on the high reliability and validity of the questionnaire.
MID
No studies which assessed the MID of the CoEQ were identified through the CADTH literature search.
IWQoL-Lite Clinical Trial Version
Description
The Clinical Trial version of this questionnaire (IWQOL-Lite-CT) was adapted from the IWQOL-Lite. The IWQOL-Lite-CT measures HRQoL using 22 items. Responses for items in the questionnaire are based on a 5-point scale with the following options: “1=Never”, “Rarely”, “Sometimes”, Usually”, and “5=Always”. Lower-level scores indicate higher levels of functioning. The IWQOL-Lite-CT was created to address inadequacies of the IWQOL-Lite related to clinical trials, as the original IWQOL-Lite was meant for patients enrolled in residential/day treatment programmes. In addition, the original IWQOL-Lite was developed before recommendations for medical product labelling based on patient reported outcomes were developed by the FDA. It should be noted that studies validating the IWQOL-Lite-CT were initially aimed at trials within the context of obesity and not diabetes. However, at the recommendation of the FDA, patients with diabetes were included to support broader context of use for this questionnaire; results of the study by Kolotkin et al., 2017 which validate the psychometric properties of the IQWOL-Lite-CT are summarized below and focus mainly and data pertaining to T2D.60
Validity
Two randomized trials were used to validate psychometric properties of the IWQOL-Lite-CT: Study 1, 1 multinational, randomized, double blind, placebo-controlled phase 2 trial of patients with obesity and without diabetes who were treated with subcutaneous semaglutide (N = 329); and, Study 2, 1 multinational, randomized, double blind, placebo-controlled phase 3a trial of patients with T2D who received oral semaglutide (N = 145). A 23-item version was administered to Study 1 and a 22-item version to Study 2. The baseline characteristics of both studies were similar in terms of age, height, weight, BMI, and race. Study 1 had a greater proportion of female patients (64.7%) versus study 2 which had slightly more male patients (53.1%).61
Response distributions were generally supportive of the appropriateness of response categories. However, ceiling effects were observed at baseline for the following items in Study 2: “self-conscious eating in social settings”, “down or repressed about weight”, “avoid social gatherings”, “less productive”, “decreased self-esteem”, “self conscious about weight”, and “frustrated or upset about weight”. Response distributions were also assessed over time from baseline to week 26. The mean change of composite scores (positive change in composite scores indicating improvement) was greater than 20 points from baseline to week 26 and exceeded 1 standard deviation of the change scores. In Study 2, composite scores changed slightly from baseline to week 26.61
The inter-item correlations were high for several items between both Study 1 and Study 2. Based on results of the study, 3 items form the 23-item questionnaire were removed to reduce patient burden without sacrificing content validity. The structure of the IWQOL-Lite-CT was considered appropriate based on loading of items using exploratory factor analyses in Study 1 and confirmatory factor analyses in Study 2.
Construct validity was assessed cross-sectionally for the IWQOL-Life-CT composite scores through correlations with the SF-36 and PGI-C and PGI-S items. There were moderate to strong correlations observed between the IWQOL-Life-CT and SF-36 in both Study 1 and Study 2. Longitudinal analyses were also conducted and provided support for the construct validity of the composite scores; moderate to strong correlations between the IWQOL-Life-CT and SF-36 were observed in Study 1, compared to smaller correlations observed in Study 2.61 Responsiveness was evaluated through effect sizes, standardizes response means and Cohen’s d statistic. The responsiveness based on 5% change in body weight from baseline till week 52 in Study 1 and week 26 in Study 2; effect sizes were smaller in the diabetes study (Study 2) which was expected due to the minor changes observed in BMI in this trial. Based on the study by Kolotkin et al., 201961, the IWQOL-Lite-CT may be more sensitive to patients in weight loss trials; this is expected as the questionnaire was designed to address concerns specific to obesity clinical trials. Statistics were also lower for questionnaire items which demonstrated ceiling effects, including “unable to stand comfortably”, “self-conscious eating in social settings”, “avoid social gatherings”, “less important/worthy of respect”, “less interested in sexual activity” and “less productive”.61 Changes in patients’ HRQoL were not as great from baseline till end of trial in Study 2 which included diabetes patients, which resulted in lower construct validity compared to Study 1 which enrolled patients with the goal of weight loss.61 The diabetes trial (Study 2) was shorter in length (i.e., 26 weeks), and patients yielded modest average change in weight which resulted in modest change in IWQOL-Lite-CT scores; it is possible this may have affected the capabilities of authors to completely evaluate the psychometric properties of this questionnaire. Further examination of the IWQOL-Lite-CT in diabetes trials may be necessary for determining whether the questionnaire is sensitive to addressing HRQoL concerns of diabetes patients.
Reliability
The internal consistency and reproducibility of the IWQOL-Lite-CT were assessed using Cronbach’s coefficient alpha, and weighted kappa statistics and intraclass correlation coefficients, respectively. Reproducibility was assessed among patients with stable body weight (< 5%) between week 0 and week 8 and who rated themselves the same on the corresponding PGI-S questionnaire of Study 2. Assessment of internal consistency reliability revealed a Cronbach’s alpha of ≥ 0.77 at each assessment time point in both studies. The intraclass correlation coefficients were ≥ 0.80 for all composite scores at each time point in both studies. Alphas in Study 2 were ≥ 0.77 at baseline and at week 26 for the physical composite, physical function composite, and psychosocial composite. Alphas for the total score of the questionnaire were ≥ 0.90 at baseline and at the end of the study for both Study 1 and Study 2. . Intraclass correlation coefficients were ≥ 0.80 for all composite scores at each time point in both Studies 1 and 2. Test-retest reliabilities were also stated to be satisfactory.61
MID
No studies which assessed the MID of the IWQOL-Lite-CT were identified through the CADTH literature search.
DTSQ-status version
Description
The DTSQs questionnaire was used to assess patient’s satisfaction to treatment using 8 items which cover convenience, flexibility and general feelings regarding treatment. Six of the items are scored on a 7-point scale, with scores ranging from zero (“very satisfied”) to 6 (“very unsatisfied”), which are then summed to provide a total response between zero (“very dissatisfied”) and 36 (“very satisfied”). Two of the items assess patients’ perceived frequency of hyperglycemia/hypoglycemia, with responses scored on a 7 point scale from zero (“none of the time”) to 6 (“most of the time”); lower scores on these 2 items indicate greater perceived blood glucose control.76,77 The limited number of questionnaire items makes the questionnaire convenient for use by patients during clinical trials. However, the limited number of items also limits the range of impact that can be assessed for patient’s satisfaction of treatment on their quality of life.
The DTSQ is globally accepted as an instrument to evaluate treatment satisfaction in patients with T2DM and has been recommended by the WHO and the International Diabetes Federation as useful in assessing outcomes of diabetes care.58,76 The psychometric properties of different language versions of the DTSQs were assessed in a study of patients with T1DM and patients with T2DM treated with insulin or poorly controlled on sulfonylureas who then started on insulin treatment.78
Validity
Ceiling effects have been frequently reported in diabetes trials using the DTSQs questionnaire; this is mainly due to high levels of treatment satisfaction from patients with pre-trial treatments, leaving little room for improvement in treatment satisfaction. Adjustment of scales statistically to fit the majority scoring pattern is a possible suggestion for handling skewed satisfaction scores; however, this process would reduce the validity of the scale. The change version of the questionnaire (DTSQc) was established to overcome this phenomenon.77 It has been suggested that use of both the DTSQs and DTSQc may better capture changes in treatment satisfaction among patients over the course of a clinical trial.77
Reliability
A study by Bradley et al., 200777 assessed the reliability of the 6 items from the Treatment Satisfaction Scale in the DTSQc. A Cronbach’s alpha coefficient of 0.92 was determined for the English version of the DTSQc demonstrating good reliability. No studies pertaining to the reliability of the DTSQs were identified through the CADTH literature search. However, as the DTSQc was created in response to limitations of the DTSQs, it may be reasonable to suggest that the DTSQs stands as a reliable HRQoL questionnaire.
Literature pertaining to the validation of the DTSQ occurred over 2 decades ago76,77; while the questionnaire has been accepted by established health agencies including WHO and the International Diabetes Federation, revalidation may be revealing of either confirmation of the questionnaires ability to assess diabetes patient’s satisfaction, or revealing of inadequacies which could be addressed. As treatment satisfaction is a leading indicator for treatment adherence, updated evidence for the DTSQ may be valuable in confirming the standard of HRQoL assessment among diabetes patients.
MID
No studies which assessed the MID of the DTSQs were identified through the CADTH literature search.
Pharmacoeconomic Review
Abbreviations
BIA
budget impact analysis
BMI
body-mass index
GLP-1
glucagon-like peptide-1
ICER
incremental cost-effectiveness ratio
QALY
quality-adjusted life-year
T2DM
type 2 diabetes mellitus
Executive Summary
The executive summary comprises 2 tables (Table 1 and Table 2) and a conclusion.
Item | Description |
|---|---|
Drug product | Semaglutide (Rybelsus), 3 mg, 7 mg, and 14 mg tablets |
Submitted price | Semaglutide, 3 mg, 7 mg, 14 mg tablets: $6.97 per tablet |
Indication | As an adjunct to diet and exercise to improve glycemic control in adults with type 2 diabetes mellitus:
|
Health Canada approval status | Notice of Compliance |
Health Canada review pathway | Standard review |
Notice of Compliance date | March 30, 2020 |
Reimbursement request | For the treatment of adult patients with type 2 diabetes mellitus in combination with metformin, and in combination with metformin plus sulfonylurea |
Sponsor | Novo Nordisk Canada Inc. |
Submission history | Previously reviewed: Yes Form: Subcutaneous semaglutide (Ozempic) Indication: Patients with type 2 diabetes mellitus to improve glycemic control, in combination with metformin (second-line treatment) and in combination with metformin and sulfonylurea (third-line treatment). Recommendation date: May 15, 2019 Recommendation: recommended with a price reduction, in combination with metformin alone, when diet and exercise plus a maximal tolerated dose of metformin does not achieve adequate glycemic control; subcutaneous semaglutide should not be reimbursed for use as add-on therapy to metformin and another antihyperglycemic drug |
Table 2: Summary of Economic Evaluation
Component | Description |
|---|---|
Type of economic evaluation | Cost-utility analysis Markov model |
Target populations |
|
Treatments | Semaglutide tablets (7 mg and 14 mg): in combination with metformin for second-line treatment, or in combination with metformin and sulfonylureas for third-line treatment |
Comparators | Second-line treatment
Third-line treatment
|
Perspective | Canadian publicly funded health care payer |
Outcomes | QALYs, disease-related complications |
Time horizon | 40 years |
Key data source | Sponsor-commissioned NMA, which included PIONEER 2, 3, and 4 trials assessing the efficacy and safety of oral semaglutide |
Submitted results for the base case | Second-line treatment: the ICER of semaglutide 14 mg was $29,919 per QALY gained vs. canagliflozin 300 mg; semaglutide 7 mg was dominated by semaglutide 14 mg, i.e., the former was more effective (associated with more QALYs) and less costly Third-line treatment: the ICER of semaglutide 14 mg was $25,161 per QALY gained vs. canagliflozin 300 mg; semaglutide 7 mg was extendedly dominateda through canagliflozin 300 mg and semaglutide 14 mg |
Key limitations |
|
Key limitations (continued) |
|
CADTH reanalysis results | Due to the identified limitations with the sponsor’s economic evaluation, CADTH considered the output of the model to have uncertain validity given the available clinical data. CADTH conducted an exploratory analysis for second-line treatment that set the disutility from treatment mode administration for once-daily tablets and once-weekly injections to be equal. This analysis resulted in oral semaglutide 7 mg being dominated by canagliflozin, and oral semaglutide 14 mg being dominated by semaglutide 1.0 mg. |
BMI = body-mass index; DPP-4 = dipeptidyl peptidase-4; GLP-1 = glucagon-like peptide-1; ICER = incremental cost-effectiveness ratio; NMA = network meta-analysis; QALY = quality-adjusted life-year; SGLT2 = sodium-glucose cotransporter-2; SU = sulfonylurea.
a“Extendedly dominated” denotes a treatment with a higher ICER when compared to the previous cost-effective treatment and the next more-effective treatment.
Conclusions
The CADTH clinical review suggests that oral semaglutide demonstrated superior efficacy to sitagliptin and empagliflozin (glycemic control only) and comparable efficacy to other antidiabetic treatments for glycemic control and weight reduction. The safety profile of semaglutide is comparable to other glucagon-like peptide-1 (GLP-1) receptor agonists, with gastrointestinal disorders frequently reported. A clear benefit in health-related quality of life was not demonstrated by the included studies, and there is a lack of additional evidence regarding outcomes such as diabetes-related morbidity beyond the cardiovascular outcome trial, or a direct comparison to semaglutide injection. While the sponsor-submitted network meta-analysis (NMA) suggests that oral semaglutide showed superior reduction in hemoglobin A1C and weight in some comparisons, the CADTH clinical review identified limitations with the NMA relating to the evaluation of heterogeneity, which increases uncertainty with the results. Furthermore, CADTH noted that the NMA was limited as it did not assess other key efficacy outcomes such as diabetes-related morbidity, mortality outcomes, and gastrointestinal adverse events.
The sponsor’s economic submission relied on predictive modelling equations based on surrogate outcome data that suggested oral semaglutide had improved cardiovascular benefits compared with treatments that have better evidence for cardioprotective effects (e.g., canagliflozin, empagliflozin, and liraglutide). These findings as well as an incremental benefit for daily oral treatments compared with weekly injections led to oral semaglutide being considered cost-effective at a willingness-to-pay threshold of $50,000 per quality-adjusted life-year (QALY). The CADTH clinical review concluded that, based on the currently available evidence, there was no strong evidence to suggest a quality-of-life benefit for oral semaglutide compared to other antidiabetic treatments. An exploratory analysis highlighted that the model results are highly sensitive to an assumed utility benefit associated with the form of administration. When this benefit is removed, oral semaglutide is more costly and no more effective than other second-line treatments available for patients with type 2 diabetes mellitus (T2DM). Due to the limitations with the submitted model and modelled comparative effectiveness data, CADTH cannot comment on the cost-effectiveness of oral semaglutide in the full Health Canada–indicated population.
If oral semaglutide is considered to be similarly safe and effective relative to currently available treatments T2DM, at a submitted price of $6.97 per tablet (daily cost of $6.97), oral semaglutide is more costly than all sodium-glucose cotransporter-2-based products ($2.45 to $3.24), dipeptidyl peptidase-4-based products ($2.20 to $3.47), and, depending on dose, some GLP-1 receptor agonist-based products ($3.55 to $9.34).
Stakeholder Input Relevant to the Economic Review
This section is a summary of the feedback received from the patient groups, registered clinicians, and drug plans that participated in the CADTH review process.
Patient group input was provided by Diabetes Canada and the type 2 Diabetes Experience Exchange (T2DXX) for this review of oral semaglutide (Rybelsus) for T2DM. Diabetes Canada used online surveys conducted between 2019 and 2020. T2DXX obtained data for its input from personal interviews and facilitated group discussions in “Experience Exchange” forums and through social media conversation threads. Respondents from T2DXX and Diabetes Canada highlighted the difficulty some respondents have using exercise to help manage variations in blood sugar, particularly when faced with other health complications or comorbidities and financial barriers. The goal of managing diabetes through healthy behaviour interventions is meant to keep glucose levels within a target range to minimize side effects of the disease and prevent or delay potentially irreversible complications (i.e., blindness, heart disease, kidney problems, and lower-limb amputations). The management of blood glucose levels and the frequent visits to health care providers were highlighted as being constant and burdensome.
Some respondents form Diabetes Canada expressed concern with the affordability of medications. Concerns with treatment cost were also highlighted by T2DXX, as choice of treatment may be made based on affordability for the patient in addition to what is most effective.
Limited response was received from patients with experience with oral semaglutide, with only 3 responses received by Diabetes Canada. Patients reported oral semaglutide to have “about the same” effectiveness as previously received medications in terms of meeting target blood sugar or hemoglobin A1C levels, managing gastrointestinal side effects (i.e., diarrhea, nausea, vomiting, and abdominal pain), and the incidence or severity of yeast or urinary tract infections. Respondents currently receiving oral semaglutide reported that treatment was helping them lose weight, or that it had the potential to help them lose weight, and they indicated that its oral administration was preferable to an injection. One respondent reported that oral semaglutide was better able than their previous treatments at achieving target hemoglobin A1C levels. Two respondents reported oral semaglutide was much better at helping them meet target fasting blood glucose levels. One respondent reported oral semaglutide was better at helping avoid hypoglycemia and gastrointestinal side effects, while another indicated it was worse.
Drug plans noted that, while the oral route of administration may be favourable for some patients, it is unclear whether this form of semaglutide has the same cardiovascular benefits as demonstrated by subcutaneous semaglutide.
No registered clinician input was received for this review
Several of these concerns were addressed in the sponsor’s model:
The sponsor considered a broad range of potential treatment-emergent adverse events in the model and their respective impact on quality of life. Microvascular complications such as eye disease, lower extremity disease, and kidney disease, as well as macrovascular complications such as ischemic heart disease, myocardial infarction, stroke, and heart failure, were all accounted for, with impacts on quality of life dependent on the type of adverse event.
The sponsor’s model considered changes in hemoglobin A1c levels, body-mass index (BMI), triglyceride levels, and hyperglycemic events over time.
The route of administration was noted to affect quality of life as was frequency of dosing, although the magnitude of impact in the economic evaluation was considered large based on clinical expert opinion.
Due to restrictions and limitations within the sponsor’s submitted model, CADTH was unable to address other stakeholder feedback received through reanalysis. However, CADTH noted the implications of some of the sponsor’s model structure for the results, particularly the cardiovascular outcomes, which currently have yet to be elucidated in the trials.
Economic Review
The current review is for oral semaglutide (Rybelsus) for adults with T2DM.
Economic Evaluation
Summary of Sponsor’s Economic Evaluation
Overview
Oral semaglutide is indicated as an adjunct to diet and exercise to improve glycemic control in adults T2DM as monotherapy when metformin is considered inappropriate due to intolerance or contraindications. It is to be used in combination with other medicinal products for the treatment of diabetes. This differs from the sponsor’s reimbursement request, in which oral semaglutide is to be used in combination with metformin, and in combination with metformin plus a sulfonylurea, in adult patients with T2DM.
The sponsor submitted 2 cost-utility models to assess the cost-effectiveness of oral semaglutide 7 mg and 14 mg: as second-line treatment in combination with metformin, and as third-line treatment in combination with metformin plus a sulfonylurea. This population aligns with the sponsor’s reimbursement request, but is narrower than the Health Canada–approved patient population. Comparators for second-line treatment consisted of canagliflozin 300 mg, empagliflozin 25 mg, dapagliflozin 10 mg, liraglutide 1.8 mg, lixisenatide 20 mcg, dulaglutide 1.5 mg, semaglutide (injectable) 1.0 mg, sulfonylurea, saxagliptin 5 mg, sitagliptin 100 mg, and linagliptin 5 mg. Comparators for third-line treatment consisted of canagliflozin 300 mg, empagliflozin 25 mg, dapagliflozin 10 mg, and sitagliptin 100 mg. All treatment options could be accompanied by basal and bolus insulin intensification treatment.
Semaglutide is available as 3 mg, 7 mg, and 14 mg tablets at a submitted price of $6.97 per tablet. The starting dosage of oral semaglutide is 3 mg once daily. After 30 days, the dose should be increased to a maintenance dosage of 7 mg once daily. If additional glycemic control is needed after at least 30 days on the 7 mg dose, the dosage can be increased to a maintenance dosage of 14 mg once daily,1,2 resulting in an annual cost of $2,543 per year. The clinical outcomes of interest were QALYs and life-years. The economic evaluation was undertaken from the perspective of the publicly funded health care payer over a 40-year (lifetime) time horizon.
Model Structure
The sponsor’s models were based on the Swedish Institute of Health Economics Diabetes Cohort Model, a published and validated Microsoft Excel-based non–product-specific model. The sponsor stated that the model uses Markov health states to capture the important micro- and macrovascular complications associated with diabetes, the incidence of hypoglycemic events, and the associated impact of complications and events on mortality. Specifically, the model uses 2 parallel Markov chains; 1 with 120 microvascular complications, including retinopathy (e.g., background diabetic retinopathy, macular edema, proliferative diabetic retinopathy, and severe visual loss), neuropathy (e.g., symptomatic neuropathy, peripheral vascular disease, and lower extremity amputation), and nephropathy (e.g., microalbuminuria, macroalbuminuria, and end-stage renal disease); and 1 with 100 macrovascular complications, including ischemic heart disease, myocardial infarction (first and subsequent), stroke (first and subsequent) and congestive heart failure (Figure 1).1
Model Inputs
Within the model, the annual probability of major diabetes-related macrovascular complications is derived from risk equations based on the UK Prospective Diabetes Studies 68 and 82, Swedish National Diabetes Registry, and Australian Fremantle Diabetes Study, providing more choice than previous CADTH reports.3,4 The risk of each complication is therefore a function of a range of predictors, including biomarkers such as hemoglobin A1C, BMI, systolic blood pressure, low-density lipoprotein, high-density lipoprotein, and glomerular filtration rate, and as a function of other complications. The risk equations provide estimates of the probability of developing ischemic heart disease and chronic heart failure, and the probability of first and subsequent myocardial infarctions and strokes. Microvascular complications are modelled based on previously published studies.5,6 Probabilities relating to progression of retinopathy and nephropathy are derived from the Eastman model of diabetes and are primarily a function of duration of diabetes and hemoglobin A1C.5 Probabilities relating to progression of neuropathy are derived from both the Eastman and Bagust models of diabetes, and are primarily a function of duration of diabetes, sex, and A1C.5,6
For second-line treatment with oral semaglutide, baseline risk profiles were sourced from the PIONEER 3 trial, while treatment efficacy, rates of adverse events, and baseline patient characteristics were sourced from the PIONEER 2 trial. For third-line treatment with oral semaglutide, treatment efficacy, rates of adverse events, baseline patient characteristics, and risk profiles were sourced from the PIONEER 3 trial. The PIONEER 2 and PIONEER 3 trials each explored a variety of comparators.7-12 Treatment effects from intensification therapies (basil insulin and basal-bolus insulin) were sourced from the literature.13
Changes in A1C and BMI over time for each treatment in second-line and third-line therapies were identified by NMAs that included 3 of the oral semaglutide trials (PIONEER 2, 3, and 4).14 The treatment effects for oral semaglutide 7 mg and 14 mg and the comparators (applied in the first year of the cohort model) were extracted from the NMA,14 while the efficacy values and hypoglycemia rates for insulin intensification were derived using equations presented by Willis et al.13 Because no indirect comparison data were available to inform hypoglycemia event rates for oral semaglutide 7 and 14 mg and comparators, it is assumed that all initial treatments were associated with no hypoglycemia and subsequent treatments were assumed to have the same risk of hypoglycemia regardless of initial regimen. This assumption was applied across both modelled populations.
Baseline utility and disutility from adverse events were sourced from the NMA conducted by the sponsor and sponsor assumptions.1,14 Utility decrements associated with the frequency and mode of administration (i.e., oral versus injection) were assigned on a treatment-specific basis following the approach and data used by Abramson et al.,15 while utility decrements due to hypoglycemia were based on data from Currie et al.16
Costs for oral semaglutide, semaglutide 1.0 mg injections, and liraglutide were provided by the sponsor. Costs for all other therapies were obtained from the Ontario Drug Benefits Formulary.17 Dosing used in the model is consistent with product monographs for each treatment; however, the model does not include a 1-month loading dose that clinical experts have confirmed is part of treatment with oral semaglutide. Costs of basal and basal-bolus insulin used for treatment intensification include the costs of needles and self-monitoring blood glucose.
Summary of Sponsor’s Economic Evaluation Results
The sponsor’s model reported the mean of the cohort that entered the model: 1,000 simulated patients. No deterministic results were provided by the sponsor.
Base-Case Results
The sponsor’s base-case results for oral semaglutide are summarized below.
For second-line treatment, the lowest cost comparator was sulfonylurea. Canagliflozin 300 mg resulted in an incremental cost-effectiveness ratio (ICER) of $9,188 per QALY gained compared to sulfonylurea. The next costly and more effective comparator, oral semaglutide 14 mg, resulted in an ICER of $29,919 per QALY gained versus canagliflozin 300 mg. All other comparators (including oral semaglutide 7 mg) were dominated.
For third-line treatment, the lowest cost comparator was canagliflozin 300 mg. The next costly and more effective comparator, oral semaglutide 14 mg, resulted in an ICER of $25,161 per QALY gained versus canagliflozin 300 mg. All other comparators (including oral semaglutide 7 mg) were dominated.
A summary of the sponsor’s economic evaluation results for second-line treatment (Table 8) and third-line treatment (Table 9) are presented in Appendix 3, as is a breakdown of where the benefits are observed relative to comparator treatments (Table 10 and Table 11). Semaglutide (oral and injection) was considered to be associated with a greater number of life-years than all other treatments, which is considered highly uncertain, and oral semaglutide was always considered to have the lowest utility decrement associated with treatment.
Sensitivity and Scenario Analysis Results
The sponsor conducted several scenario analyses on each modelled population, including taking a taking a societal perspective, omitting discounting, increasing the discount rate to 3%, using a 20-year time horizon, changing the threshold for intensification treatment to 8.5% from 8%, and using the number of years associated with the initial treatment as opposed to using hemoglobin A1C as a threshold for intensification (i.e., the intensification trigger threshold was 4 years for second-line treatment and 5 years for third-line treatment). For second-line treatment, the ICER for oral semaglutide 14 mg remained below $50,000 per QALY in most scenarios. However, when the trigger for the intensification threshold was set at 8.5% instead of 8% and the intensification trigger was set to 4 years, the ICER increased to $70,581 and $65,235 per QALY respectively. Oral semaglutide 7 mg remained dominated in each of these scenarios. The results were similar for third-line treatment, with the ICER for oral semaglutide 14 mg remaining below $50,000 per QALY in all scenarios except when the trigger for intensification threshold was set at 8.5% instead of 8% ($61,848 per QALY), and the intensification trigger was set to 5 years ($107,040 per QALY). Again, oral semaglutide 7 mg was dominated in all scenarios.
CADTH Appraisal of the Sponsor’s Economic Evaluation
CADTH identified several key limitations to the sponsor’s analysis that have notable implications for the economic analysis:
Model-predicted outcomes do not align with observed clinical data. The sponsor’s model is based on predictive risk equations that use data from surrogate outcomes (hemoglobin A1C and BMI) to predict treatment outcomes such as stroke, myocardial infarction, and heart disease. The predicted outcomes derived from the model suggest small mortality and cardiovascular benefits associated with oral semaglutide compared with treatments such as liraglutide, canagliflozin, and empagliflozin (the latter has a Health Canada indication to reduce the incidence of cardiovascular death in patients with T2DM).18,19
Although the sponsor-submitted NMA suggests that oral semaglutide showed superior reduction in hemoglobin A1C and weight in certain comparisons, the CADTH clinical review identified limitations with the NMA relating to the evaluation of heterogeneity, which increases uncertainty with the results. Furthermore, CADTH noted that the NMA was limited as it did not assess other key efficacy outcomes such as diabetes-related morbidity, mortality outcomes, and gastrointestinal adverse events.
The CADTH clinical review concluded that oral semaglutide demonstrated efficacy comparable to other antidiabetic treatments for glycemic control and weight reduction, but could not comment on the comparative efficacy in terms of cardiovascular outcomes. The results of the economic model may therefore overestimate the benefit of oral semaglutide.
The modelled population did not align with the Health Canada indication. The proposed indication allows for treatment of adult patients with T2DM as monotherapy when metformin is considered inappropriate, or in combination with diabetes treatments beyond metformin and a sulfonylurea. However, the sponsor’s analyses investigated oral semaglutide only in combination with metformin for second-line treatment, or in combination with metformin plus sulfonylurea for third-line treatment. There is a gap in the submitted cost-effectiveness evidence regarding oral semaglutide as monotherapy, and for use in combination with other treatments as second- or third-line treatment. While data are available for use of semaglutide under these conditions, they were not explored in the submitted NMA or in the sponsor’s model. Clinical experts consulted by CADTH stated that oral semaglutide is likely to be prescribed to patients as part of treatment options not explored in the sponsor’s model.
This issue could not be addressed by CADTH reanalysis due to the lack of available comparative clinical evidence for use in combination with treatments other than metformin with or without a sulfonylurea, or as monotherapy in patients intolerant to metformin.
Utility decrements associated with mode of treatment administration overestimate the benefits associated with oral treatments. The sponsor associated utility decrements with the frequency and mode of administration of treatment (i.e., pill versus injection) that were dependent and assigned on a treatment-specific basis following the approach and data used by Abramson et al., and QALY decrements based on data from the study by Currie et al. The sponsor assumed that patients would experience a larger disutility from daily injectable treatments (0.061) and weekly injectable treatments (0.037) compared with daily oral treatments (0.007). Further, the sponsor’s results suggested that oral semaglutide was associated with fewer disutilities due to treatment compared with all other antidiabetic treatments. Clinical experts consulted by CADTH confirmed that patients may experience a slight disutility from daily injections compared to oral treatment. However, they stated there may be no difference in utility between daily oral treatments and weekly injections, and no difference between any forms of oral treatments. The CADTH clinical review concluded that there was no strong evidence of a quality-of-life benefit associated with oral semaglutide.
CADTH undertook an exploratory analysis to assess the impact of assuming equal utility impacts of daily oral and weekly injectable treatments. CADTH could not account for differences between oral semaglutide and other oral treatments in terms of a treatment benefit. This is a key driver of the model results.
The frequency of hyperglycemic events does not reflect clinical trials. The sponsor’s model predicts differences in hyperglycemia events between treatments to be minimal, and non-existent after 12 cycles. This does not reflect hyperglycemia data in PIONEER 2, which found substantial differences in the frequency of hyperglycemic events between treatments. It is uncertain how this affects the sponsor’s model. As noted, comparative safety was not assessed within the NMA, and any assumed difference in adverse events is therefore associated with uncertainty.
This issue could not be addressed by CADTH reanalysis.
The model lacks transparency. Data within the Excel model are hard-coded, with results generated by a series of 131 Visual Basic macros within 13 modules, exceeding 10,000 lines of code for each of 2 workbooks. Given the complexity of the model, it was not possible within the review time frame to verify all the code and assess how the data inputs generated the model outcomes.
This issue could not be addressed by CADTH reanalysis due to the nature of the model.
Drug pricing in the model was not consistent. Some T2DM treatments in Canada are available as combination treatments with metformin within a single tablet (e.g., canagliflozin, empagliflozin, and saxagliptin). The sponsor inconsistently applied costs for treatments that included metformin and those that did not. Furthermore, CADTH identified small differences in the annual costs of treatments assumed in the model (e.g., dulaglutide). However, given the total cost difference, this pricing error does not notably alter the results.
CADTH could not reasonably alter the pricing assumptions given the way cost information was modelled. The inconsistency in application of metformin costs may slightly benefit oral semaglutide.
Additionally, the following key assumptions were made by the sponsor and have been appraised by CADTH (See Table 3).
Table 3: Key Assumptions of the Submitted Economic Evaluation (Not Noted as Limitations to the Submission)
Sponsor’s key assumption | CADTH comment |
|---|---|
The sponsor assumed a 40-year time horizon was representative of a patient lifetime, noting that average patient ages at baseline in the PIONNER 2 and 3 trials were 58 and 59 years, respectively,7 and that approximately 97% of patients were deceased by the end of the 40-year time horizon. | Uncertain. According to clinical experts consulted by CADTH, as oral semaglutide is indicated for all eligible adult patients — even some young-adult patients — the model does not reflect the full indicated population. The impact this has on the submitted model is unclear. |
The sponsor was not able to find Canadian-specific inputs for all parameters (e.g., utilities, cost of complications, productivity loss estimates). The distribution of patient race and the patient average BMI in the PIONEER trials used to inform the sponsor’s model do not reflect the Canadian patient population. | Uncertain. The PIONEER trials recruited patients across multiple countries. Clinical experts consulted by CADTH have stated that minorities were underrepresented in the PIONEER trials compared to the Canadian population. Clinical experts have also stated that patients of Asian descent may experience more severe disease. The results of the PIONEER trials may not be generalizable to the Canadian context. |
The model does not permit any variance in clinical surrogate outcomes such as hemoglobin A1C or LDL across patients — rather each patient in the cohort is assumed to enter the model with the same characteristics and remain aligned with their cohort. Changes in hemoglobin A1C, LDL, blood pressure, and other biomarkers are determined by treatment only and no individual differences are accounted for. | Uncertain. How the lack of heterogeneity across patients impacts the model is unknown; however, this modelling approach does not capture heterogeneity in the patient population. |
The starting dosage of oral semaglutide is 3 mg once daily. After 30 days, the dosage should be increased to a maintenance dosage of 7 mg once daily. | The sponsor did not consider the loading dose in the model. As the doses are flat-priced, this is unlikely to affect the model results. |
BMI = body-mass index; LDL = low-density lipoprotein.
CADTH Reanalyses of the Economic Evaluation
Base-Case Results
Given the concerns identified by CADTH with the submitted analysis in relation to both the data used and the nature of the model provided, it was not possible to conduct a reanalysis. Due to the limitations with the submitted clinical evidence and model, CADTH was unable to determine a base-case estimate for the cost-effectiveness of oral semaglutide for patients with T2DM. While the issues with model validity, model transparency, and the predictive parameters of the model resulted in high uncertainty in the model’s results, CADTH undertook an exploratory analysis to assess the impact of a small change in the impact of treatment administration on the cost-effectiveness of semaglutide.
Exploratory Analysis Results
CADTH conducted an exploratory analysis to assess the impact of a change in the disutility due to treatment administration on the sponsor’s results (i.e., disutility associated with weekly injections of semaglutide and dulaglutide was assumed equal to the disutility of daily oral treatments; Table 12). After equalizing the treatment disutility due to daily oral treatment administration with that of weekly injection, oral semaglutide 7 mg and 14 mg became dominated by canagliflozin 300 mg and injectable semaglutide 1.0 mg, respectively.
Issues for Consideration
Previous CADTH submissions using the Institute of Health Economics cohort model have identified issues for the face validity of the model that do not appear to have been fully addressed in the current submission.
Clinical experts consulted by CADTH stated that sulfonylureas have limited relevance to the Canadian clinical setting as this class of drug is rarely used due to potential side effects. However, clinical experts stated that some patients still regularly use a sulfonylurea.
While CADTH noted that the recommended maintenance dose is 7 mg or 14 mg, Clinical experts consulted by CADTH stated that some patients may receive a dose of semaglutide somewhere between 7 mg and 14 mg, depending on their glycemic control and adverse events experienced.
Clinical experts consulted by CADTH stated that some patients may prefer the mode of administration offered by oral semaglutide compared to injectable treatments.
Overall Conclusions
The CADTH clinical review suggests that oral semaglutide demonstrated superior efficacy to sitagliptin and empagliflozin (glycemic control only) and comparable efficacy to other antidiabetic treatments for glycemic control and weight reduction. The safety profile of semaglutide is comparable to that of other GLP-1 receptor agonists, with gastrointestinal disorders frequently reported. A clear benefit in health-related quality of life was not demonstrated by the included studies; furthermore, there was a lack of additional evidence regarding outcomes such as diabetes-related morbidity beyond the cardiovascular outcome trial, or a direct comparison to semaglutide injection. While the sponsor-submitted NMA suggests that oral semaglutide showed superior reduction in hemoglobin A1C and weight in some comparisons, the CADTH clinical review identified limitations with the NMA relating to the evaluation of heterogeneity, which increases uncertainty with the results. Furthermore, CADTH noted that the NMA was limited as it did not assess other key efficacy outcomes such as diabetes-related morbidity, mortality outcomes, and gastrointestinal adverse events.
The cost-effectiveness of oral semaglutide in the Health Canada–approved population is uncertain due to the limitations identified with the modelling approach undertaken by the sponsor and the difference in the modelled population and the Health Canada–approved population. As such, CADTH was unable to provide an estimate of the cost-effectiveness of oral semaglutide in the Health Canada population.
In the reimbursement requested population, the CADTH clinical review suggested that oral semaglutide was associated with superior efficacy to sitagliptin and empagliflozin (glycemic control only) and comparable efficacy to other antidiabetic treatments in terms of glycemic control and weight reduction. However, due to a lack of comparative data, CADTH could not comment on the impact on cardiovascular outcomes. As a result, the submitted model may overestimate the benefits associated with oral semaglutide. The CADTH clinical review also concluded that there was no strong evidence of a quality-of-life benefit associated with oral semaglutide. CADTH conducted an exploratory analysis, removing the additional disutility ascribed to weekly injectable treatments (e.g., semaglutide injection) due to their mode of administration. Assuming no difference in utility decrement due to mode of treatment administration, the modelled results found that oral semaglutide was more costly and no more effective than other antidiabetic treatments in second-line treatment.
If oral semaglutide is considered to be similarly safe and effective relative to currently available treatments for T2DM at a submitted price of $6.97 per tablet (daily cost of $6.97), oral semaglutide is more costly than all sodium-glucose cotransporter-2-based products ($2.45 to $3.24), dipeptidyl peptidase-4-based products ($2.20 to $3.47), and, depending on dose, some GLP-1 receptor agonist-based products, ($3.55 to $9.34).
References
1.Pharmacoeconomic evaluation. In: Drug Reimbursement Review sponsor submission: Semaglutide (Rybelsus), 7 mg and 14 mg tablets. Mississauga (ON): Novo Nordisk Canada Inc.; 2020.
2.Rybelsus® semaglutide tablets 3 mg, 7 mg and 14 mg tablets [product monograph]. Mississauga (ON): Novo Nordisk Canada Inc.; 2020 Mar 30: https://www.novonordisk.ca/content/dam/Canada/AFFILIATE/www-novonordisk-ca/OurProducts/PDF/Rybelsus-PM-EN-monograph.pdf. Accessed 2021 Mar 25.
3.Hayes AJ, Leal J, Gray AM, Holman RR, Clarke PM. UKPDS outcomes model 2: a new version of a model to simulate lifetime health outcomes of patients with type 2 diabetes mellitus using data from the 30 year United Kingdom Prospective Diabetes Study: UKPDS 82. Diabetologia. 2013;56(9):1925-1933. PubMed
4.New Drugs for Type 2 Diabetes : Second-Line Therapy – Science Report. (CADTH therapeutic review; vol.4, no.1b). Ottawa: CADTH; 2017 Sep: https://cadth.ca/sites/default/files/pdf/TR0012_T2D_Science_Report.pdf. Accessed 2021 Mar 25.
5.Eastman RC, Javitt JC, Herman WH, et al. Model of Complications of NIDDM: I. Model construction and assumptions. Diabetes Care. 1997;20(5):725-734. PubMed
6.Bagust A, Hopkinson PK, Maier W, Currie CJ. An economic model of the long-term health care burden of Type II diabetes. Diabetologia. 2001;44(12):2140−2155. PubMed
7.Bain SC, Hansen BB, Malkin SJP, et al. Oral Semaglutide Versus Empagliflozin, Sitagliptin and Liraglutide in the UK: Long-Term Cost-Effectiveness Analyses Based on the PIONEER Clinical Trial Programme. Diabetes Ther. 2020;11(1):259−277. PubMed
8.Hansen BB, Nuhoho S, Ali SN, et al. Oral semaglutide versus injectable glucagon-like peptide-1 receptor agonists: a cost of control analysis. J Med Econ. 2020;23(6):650-658. PubMed
9.Hunt B, Hansen BB, Ericsson A, et al. Evaluation of the Cost Per Patient Achieving Treatment Targets with Oral Semaglutide: A Short-Term Cost-Effectiveness Analysis in the United States. Adv Ther. 2019;36(12):3483-3493. PubMed
10.Liu A, Bech P, Fridhammar A, Nilsson A, Willis M, Nuhoho S. 38 - Cost Effectiveness of Oral Semaglutide 14 mg Vs Empagliflozin 25 mg in Canada. Canadian Journal of Diabetes. 2020;44 (7 Supplement):S18.
11.Liu AR, Bech PG, Fridhammar A, Nilsson A, Willis M, Nuhoho S. Cost effectiveness of oral semaglutide 14mg vs. Empagliflozin 25mg in Canada. Diabetes Conference: 80th Scientific Sessions of the American Diabetes Association, ADA. 2020;69(Supplement 1).
12.Ramos M, Cummings MH, Ustyugova A, Raza SI, de Silva SU, Lamotte M. Long-Term Cost-Effectiveness Analyses of Empagliflozin Versus Oral Semaglutide, in Addition to Metformin, for the Treatment of Type 2 Diabetes in the UK. Diabetes Ther. 2020;11(9):2041−2055. PubMed
13.Willis M, Asseburg C, Nilsson A, Johnsson K, Kartman B. Multivariate Prediction Equations for HbA(1c) Lowering, Weight Change, and Hypoglycemic Events Associated with Insulin Rescue Medication in Type 2 Diabetes Mellitus: Informing Economic Modeling. Value Health. 2017;20(3):357-371. PubMed
14.Sponsor's NMA report title [CONFIDENTIAL sponsor's report]. In: Drug Reimbursement Review sponsor submission: Rybelsus (oral semaglutide), 7 mg and 14 mg tablets. Mississauga (ON): Novo Nordisk Canada Inc.
15.Abramson A, Halperin F, Kim J, Traverso G. Quantifying the Value of Orally Delivered Biologic Therapies: A Cost-Effectiveness Analysis of Oral Semaglutide. J Pharm Sci. 2019;108(9):3138-3145. PubMed
16.Currie CJ, Morgan CL, Poole CD, Sharplin P, Lammert M, McEwan P. Multivariate models of health-related utility and the fear of hypoglycaemia in people with diabetes. Curr Med Res Opin. 2006;22(8):1523-1534. PubMed
17.Ontario Ministry of Health, Ontario Ministry of Long-Term Care. Ontario drug benefit formulary/comparative drug index. 2020; https://www.formulary.health.gov.on.ca/formulary/. Accessed 2021 Jan 07.
18.Victoza liraglutide injection 6mg/mL solution for Injection in a pre-filled pen [product monograph]. Mississauga (ON): Novo Nordisk Canada Inc.; 2020 Apr 17: https://www.novonordisk.ca/content/dam/Canada/AFFILIATE/www-novonordisk-ca/OurProducts/PDF/victoza-product-monograph.pdf. Accessed 2021 Mar 25.
19.Jardiance® empagliflozin tablets 10 mg and 25 mg [product monograph] Burlington (ON): Boehringer Ingelheim (Canada) Ltd; 2020 Apr 15: https://www.boehringer-ingelheim.ca/sites/ca/files/documents/jardiancepmen.pdf. Accessed 2021 Mar 25.
20.Budget Impact Analysis [CONFIDENTIAL sponsor's report]. In: Drug Reimbursement Review sponsor submission: Rybelsus (oral semglutide), 7 mg and 14 mg tablets. Mississauga (ON): Novo Nordisk Canada Inc.
21.DeltaPA. [Ottawa (ON)]: IQVIA; 2020: https://www.iqvia.com/. Accessed 2021 Jan 07.
22.Novo Nordisk A/S. A Heart Disease Study of Semaglutide in Patients With Type 2 Diabetes (SOUL). Clinicaltrials.gov; 2019 Apr 16 last updated 2021 Mar 25: https://clinicaltrials.gov/ct2/show/NCT03914326. Accessed 2021 Mar 25.
Appendix 1: Cost Comparison Table
Note that this appendix has not been copy-edited.
The comparators presented in the following table have been deemed to be appropriate based on feedback from clinical experts and CADTH-participating drug plans. Comparators may be recommended (appropriate) practice or actual practice. Existing Product Listing Agreements are not reflected in the table and as such, the table may not represent the actual costs to public drug plans.
Table 4: Cost Comparison Table for Non-Insulin Antidiabetic Agents
Treatment | Strength/ concentration | Forma | Price ($)b | Recommended dosage | Daily cost ($) | Annual cost ($) |
|---|---|---|---|---|---|---|
Semaglutide (Rybelsus) | 3mg 7mg 14mg | Tablet | 6.9700c 6.9700c 6.9700c | Loading dose of 3 mg daily for 30 days. Maintenance dose of 7mg or 14mg per day depending on glycemic control needs. | 6.97 | 2,544 |
Glucagon-like peptide-1 (GLP-1) receptor analogue | ||||||
Dulaglutide (Trulicity) | 0.75 mg/0.5 mL 1.5 mg/0.5 mL | Single use pre-filled pen 4 × 0.5 mL | 203.7400d | 0.75 mg to 1.5 mg once weekly | 7.28 | 2,658 |
Semaglutide (Ozempic) | 1.34mg/mL | Pre-filled pen 1.5 mL (4 to 8 doses) 3 mL (4 doses) | 132.5067 198.7600 | 0.5 to 1.0 mg once weekly | 3.55 to 7.10 | 1,295 to 2,591 |
Exenatide (Byetta) | 250 mcg/mL | Pre-filled pen 1.2 mL (60 doses) 2.4 mL (60 doses) | 143.6700 143.6700 | 5 mcg to 10 mcg twice daily | 4.79 | 1,749 |
Liraglutide (Victoza) | 6mg/mL | Pre-filled pen (10 to 30 doses) 2 × 3 mL 3 × 3 mL | 186.8898d 280.3347d | 1.2 mg to 1.8 mg daily | 6.23 to 9.34 | 2,275 to 3,413 |
Lixisenatide (Adlyxine) | 0.05 mg/mL 1 mg/mL | Pre-filled pen 3 mL (14 doses) | 56.9800 | Starting dose of 10 mcg once daily for 14 days, after which the dose should be increased to 20 mcg once daily | 4.07 | 1,486 |
Subtype 2 sodium-glucose transport protein (SGLT2) inhibitors | ||||||
Canagliflozin (Invokana) | 100 mg 300 mg | Tablet | 2.8910 | 100 or 300 mg daily | 2.89 | 1,055 |
Dapagliflozin (Forxiga) | 5 mg 10 mg | Tablet | 2.7300 | 5 or 10 mg daily | 2.73 | 996 |
Empagliflozin (Jardiance) | 10 mg 25 mg | Tablet | 2.7368 | 10 or 25 mg daily | 2.74 | 1,000 |
SGLT2 inhibitors plus metformin fixed dose combinations | ||||||
Canagliflozin /metformin (Invokamet) | 500/50 mg 850/50 mg 1000/50 mg 500/150 mg 850/150 mg 1000/150 mg | Tablet | 1.6190d | Two tablets daily | 3.24 | 1,182 |
Dapagliflozin /metformin (Xigduo) | 5 mg/850 mg 5 mg/1000 mg | Tablet | 1.2250 | Two tablets daily | 2.45 | 894 |
Empagliflozin /metformin (Synjardy) | 5 mg/500 mg 5 mg/850 mg 5 mg/1000 mg 12.5 mg/500 mg 12.5 mg/850 mg 12.5 mg/1000 mg | Tablet | 1.3783 | Two tablets daily | 2.76 | 1,006 |
Dipeptidyl peptidase-4 (DPP-4) inhibitors | ||||||
Alogliptin (Nesina) | 6.25 mg 12.5 mg 25 mg | Tablet | 2.2000 | 25 mg dailye | 2.20 | 804 |
Linagliptin (Trajenta) | 5 mg | Tablet | 2.6661 | 5 mg dailye | 2.67 | 975 |
Saxagliptin (Onglyza) | 2.5 mg 5.0 mg | Tablet | 2.5300 3.0390 | 5 mg dailye | 3.04 | 1,110 |
Sitagliptin (Januvia) | 25 mg 50 mg 100 mg | Tablet | 3.1956 | 100 mg dailye | 3.20 | 1,168 |
Dipeptidyl peptidase-4 (DPP-4) inhibitors | ||||||
Alogliptin/ metformin (Kazano) | 12.5/500 mg 12.5/850 mg 12.5/1000 mg | Tablet | 1.1950b | Two tablets daily | 2.39 | 873 |
Linagliptin/ metformin (Jentadueto) | 2.5 mg/500 mg 2.5 mg/850 mg 2.5 mg/1000 mg | Tablet | 1.3979 | Two tablets daily | 2.80 | 1,020 |
Saxagliptin/ metformin (Komboglyze) | 2.5 mg/500 mg 2.5 mg/850 mg 2.5 mg/1000 mg | Tablet | 1.2700 | Two tablets daily | 2.54 | 927 |
Sitagliptin/ metformin (Janumet) | 50 mg/500 mg 50 mg/850 mg 50 mg/1000 mg | Tablet | 1.7334 | Two tablets daily | 3.47 | 1,265 |
Other first-line treatment: Biguanides | ||||||
Metformin | 500 mg 850 mg | Tablet | 0.0247 0.2090 | 500 mg 3 to 4 times daily | 0.07 to 0.36 | 27 to 130 |
Other first-line treatment: Sulfonylureas | ||||||
Gliclazide (generics) | 80 mg | Tablet | 0.0931 | 80 to 320 mg daily (in divided doses if > 160 mg daily) | 0.09 to 0.37 | 34 to 136 |
Gliclazide long-acting (Diamicron MR) | 30 mg 60 mg | SR Tablet ER Tablet | 0.0632 0.0931 | 30 mg to 120 mg daily | 0.06 to 0.19 | 22 to 68 |
Glimepiride (generics) | 1 mg 2 mg 4 mg | Tablet | 0.4900 | 1 mg to 4 mg daily | 0.49 | 179 |
Glyburide (generics) | 2.5 mg 5.0 mg | Tablet | 0.0321 0.0574 | 2.5 mg to 20 mg daily (in divided doses if > 10 mg daily) | 0.03 to 0.23 | 12 to 84 |
ER = extended release; tab = tablet; SR = sustained release
Source: Ontario Drug Benefit (Accessed February 2021)17 prices unless otherwise indicated.17
aIf supplied in a form other than a tablet, the size of the product is noted. If the pen is part of a pack, the quantity in the pack has been noted. If the pen has a set number of doses, these have been stated.
bThe price listed is the price per tablet, pen or pack. If the “form” column states the size only (e.g., 3 mL) then the price is per form (e.g., tablet or pen). If the “form” column states size and a quantity (e.g., 2 × 3 mL) then price is per pack.
cSponsor’s submission price.
dIQVIA database (Accessed February and March 2021).
eIf patients have moderate or severe renal impairment or end-stage renal disease requiring dialysis, a lower dose should be used.
Table 5: Cost Comparison Table of Insulin Combination Products
Treatment | Strength/ concentration | Forma | Price ($)b | Recommended dosage | Daily cost ($) | Annual cost ($) |
|---|---|---|---|---|---|---|
Glucagon-like peptide-1 (GLP-1) receptor analogue combinations | ||||||
Insulin degludec/ liraglutide (Xultophy, iDegLira) | 100 U/mL / 3.6 mg/mL | Pre-filled pen 5 × 3 mL | 308.8605 | 16 to 50 U insulin degludec and 0.58 to 1.8 mg liraglutide once a day. Max daily dose: 50 U | 3.29 (16 U) to 10.30 (50 U) | 1,203 (16 U) to 3,760 (50 U) |
Insulin glargine/ lixisenatide (Soliqua) | 100 U/mL / 33 mcg/mL | Injectable Pen 5 × 3mL | 189.8000 | 15 to 60 U insulin glargine and 5 to 20 mcg lixisenatide once a day. Starting dose not greater than 10 mcg lixisenatide. Max daily dose: 60 U | 1.90 (15 U) to 7.59 (60 U) | 694 (15 U) to 2,770 (60 U) |
aIf supplied in a form other than a tablet, the size of the product is noted. If the pen is part of a pack, the quantity in the pack has been noted. If the pen has a set number of doses, these have been stated.
bThe price listed is the price per pack.
Source: Ontario Drug Benefit (Accessed February 2021)17 prices unless otherwise indicated.
Table 6: Cost Comparison of Insulin Agents
Treatment | Strength/ concentration | Forma | Price ($)b | Cost per mL ($) |
|---|---|---|---|---|
Glucagon-like peptide-1 (GLP-1) receptor analogue combinations | ||||
Insulin aspart (NovoRapid) | 100 U/mL | Cartridge (5 × 3 mL) Disposable pen (5 × 3 mL) 10 mL vial | 61.2300 63.7500 30.1900 | 4.08 4.25 3.02 |
Insulin glulisine (Apidra) | 100 U/mL | Cartridge (5 × 3 mL) Disposable pen (5 × 3 mL) 10 mL vial | 52.6500 53.1500 26.5800 | 3.51 3.54 2.67 |
Insulin lispro (Humalog) | 100 U/mL | Disposable pen (5 × 3 mL) 10 mL vial | 59.6300 30.2300 | 3.98 3.02 |
Regular human insulin (Humulin R) | 100 U/mL | Cartridge (5 × 3 mL) 10 mL vial | 48.8100 24.8800 | 3.25 2.48 |
Regular human insulin | 100 U/mL | Cartridge (5 × 3 mL) 10 mL vial | 47.6800 24.2800 | 3.18 2.43 |
Long-acting insulin analogues | ||||
Insulin glargine (Basaglar) | 100 U/mL | Cartridge (5 × 3 mL) Disposable pen (5 × 3 mL) | 69.6400 69.6400 | 4.64 4.64 |
Insulin glargine (Lantus) | 100 U/mL | Cartridge (5 × 3 mL) Disposable pen (5 × 3 mL) 10 mL vial | 92.8500 92.8500 61.6900 | 6.19 6.19 6.17 |
Insulin detemir (Levemir) | 100 U/mL | Cartridge (5 × 3 mL) Disposable pen (5 × 3 mL) | 110.4100 111.5000 | 7.36 7.43 |
Insulin NPH (Neutral Protamine Hagedorn) | ||||
Humulin N | 100 U/mL | Cartridge (5 × 3 mL) 10 mL vial | 48.8100 24.8800 | 3.25 2.49 |
Novolin ge NPH | 100 U/mL | Cartridge (5 × 3 mL) Disposable pen (5 × 3 mL) 10 mL vial | 48.8200 111.5000 24.8300 | 3.25 7.43 2.48 |
Pre-mixed Insulins | ||||
Biphasic insulin aspart 30/70 (NovoMix 30) | 100 U/mL | Cartridge (5 × 3 mL) | 56.14 | 3.74 |
Lispro/lispro protamine 25/75 (Humalog Mix 25) | 100 U/mL | Cartridge (5 × 3 mL) Disposable pen (5 × 3 mL) | 60.7700 60.3200 | 4.05 4.02 |
Lispro/lispro protamine 50/50 (Humalog Mix 50) | 100 U/mL | Cartridge (5 × 3 mL) Disposable pen (5 × 3 mL) | 59.8500 59.3200 | 3.99 3.95 |
Novolin ge 30/70 | 100 U/mL | Cartridge (5 × 3 mL) 10 mL vial | 47.1800 24.9700 | 3.15 2.50 |
Novolin ge 40/60 | 100 U/mL | Cartridge (5 × 3 mL) | 47.52 | 3.17 |
Novolin ge 50/50 | 100 U/mL | Cartridge (5 × 3 mL) | 47.52 | 3.17 |
Source: Ontario Drug Benefit (Accessed February 2021) prices unless otherwise indicated.17
aIf supplied in a form other than a tablet, the size of the product is noted. If the pen or cartridge is part of a pack, the quantity in the pack has been noted.
bThe price listed is the price per pack or vial.
Appendix 2: Submission Quality
Note that this appendix has not been copy-edited.
Description | Yes/No | Comments |
|---|---|---|
Population is relevant, with no critical intervention missing, and no relevant outcome missing | No | This treatment is indicated for patients as young as 18. The sponsor’s model only included patients 59 and older. |
Model has been adequately programmed and has sufficient face validity | Unclear | See CADTH appraisal section. |
Model structure is adequate for decision problem | No | See CADTH appraisal section. |
Data incorporation into the model has been done adequately (e.g., parameters for probabilistic analysis) | Yes | |
Parameter and structural uncertainty were adequately assessed; analyses were adequate to inform the decision problem | No | The sponsor did not justify their methods regarding the initial absolute treatment effects on BMI nor event rates for hypoglycemia. Parameter uncertainty in many biomarkers and outcome data was not captured in the sponsor’s model. |
The submission was well organized and complete; the information was easy to locate (clear and transparent reporting; technical documentation available in enough details) | No | See CADTH appraisal section. |
Appendix 3: Additional Information on the Submitted Economic Evaluation
Note that this appendix has not been copy-edited.
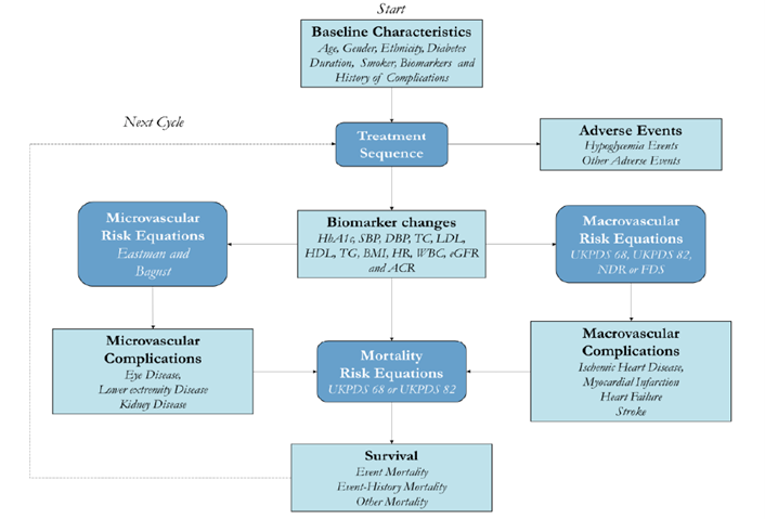
Detailed Results of the Sponsor’s Base Case
Table 8: Summary of the Sponsor’s Economic Evaluation Results for Second-Line Treatment
Drug | Total costs ($) | Total QALYs | Sequential ICER ($ per QALY) |
|---|---|---|---|
Sulfonylurea | 104,593 | 9.441 | Reference |
Canagliflozin 300 mg | 106,579 | 9.657 | $9,188 |
Oral Semaglutide 14 mg | 110,952 | 9.803 | $29,919 |
Empagliflozin 25 mg | 106,754 | 9.612 | Dominated by Canagliflozin 300 mg |
Linagliptin 5 mg | 106,878 | 9.523 | Dominated by Canagliflozin 300 mg |
Dapagliflozin 10 mg | 107,085 | 9.554 | Dominated by Canagliflozin 300 mg |
Saxagliptin 5 mg | 107,407 | 9.466 | Dominated by Canagliflozin 300 mg |
Sitagliptin 100 mg | 107,574 | 9.514 | Dominated by Canagliflozin 300 mg |
Lixisenatide 20 mcg | 108,442 | 9.370 | Dominated by Canagliflozin 300 mg |
Semaglutide 1.0 mg | 110,988 | 9.767 | Dominated by oral semaglutide 14 mg |
Oral semaglutide 7 mg | 111,041 | 9.665 | Dominated by oral semaglutide 14 mg |
Dulaglutide 1.5 mg | 111,448 | 9.598 | Dominated by oral semaglutide 14 mg |
Liraglutide 1.8 mg | 114,532 | 9.535 | Dominated by oral semaglutide 14 mg |
ICER = incremental cost-effectiveness ratio; QALY = quality-adjusted life-year; [add as required].
Note: Only treatments that are on the efficiency frontier are reported in the main body. Full results can be reported in Appendix 3.
Source: Sponsor’s pharmacoeconomic submission1
Table 9: Summary of the Sponsor’s Economic Evaluation Results for Third-Line Treatment
Drug | Total costs ($) | Total QALYs | Sequential ICER ($ per QALY) |
|---|---|---|---|
Canagliflozin 300 mg | 124,759 | 8.341 | Reference |
Oral Semaglutide 14 mg | 127,786 | 8.461 | $25,161/QALY vs canagliflozin 300 mg |
Dapagliflozin 10 mg | 125,390 | 8.260 | Dominated by canagliflozin 300 mg |
Sitagliptin 100 mg | 125,785 | 8.189 | Dominated by canagliflozin 300 mg |
Empagliflozin 25 mg | 125,802 | 8.228 | Dominated by canagliflozin 300 mg |
Oral semaglutide 7 mg | 127,679 | 8.342 | Extended dominance through canagliflozin 300 mg and oral semaglutide 14 mg |
ICER = incremental cost-effectiveness ratio; QALY = quality-adjusted life-year.
Note: Only treatments that are on the efficiency frontier are reported in the main body. Full results can be reported in Appendix 3.
Source: Sponsor’s pharmacoeconomic submission1
Table 10 and Table 11 provide a breakdown of QALY results in the sponsor’s base case to highlight how the sponsor’s estimates were derived. As noted in the main body, oral semaglutide 14 mg was associated with the lowest diabetes treatment disutility and highest overall life-years in both the second- and third-line cohorts.
Table 10: Sponsor’s Breakdown of QALYs for Second-Line Therapy (sample)
Source of QALYs | Oral semaglutide | Semaglutide | Oral semaglutide | Canagliflozin | Liraglutide |
|---|---|---|---|---|---|
Baseline | 17.01 | 17.03 | 16.97 | 16.96 | 16.99 |
Diabetes Treatment | −0.81 | −0.92 | −0.84 | −0.86 | −1.02 |
Hypoglycemia | −0.38 | −0.37 | −0.40 | −0.40 | −0.43 |
Eye Disease | −0.20 | −0.20 | −0.21 | −0.21 | −0.21 |
Lower Extremity Disease | −0.66 | −0.66 | −0.66 | −0.67 | −0.67 |
Kidney Disease | −0.07 | −0.07 | −0.07 | −0.07 | −0.07 |
Ischemic Heart Disease | −0.14 | −0.14 | −0.14 | −0.14 | −0.14 |
Myocardial Infarction | −0.09 | −0.09 | −0.09 | −0.09 | −0.09 |
Stroke | −0.05 | −0.05 | −0.05 | −0.05 | −0.05 |
Heart Failure | −0.10 | −0.10 | −0.10 | −0.10 | −0.10 |
Age | −2.66 | −2.67 | −2.66 | −2.66 | −2.66 |
Gender | −0.77 | −0.76 | −0.76 | −0.76 | −0.76 |
Diabetes Duration | −0.49 | −0.49 | −0.49 | −0.49 | −0.49 |
Overweight | −0.79 | −0.74 | −0.84 | −0.81 | −0.88 |
Total QALYs | 9.80 | 9.77 | 9.67 | 9.66 | 9.54 |
Note: this is a sample of the comparators as 14 treatments were compared. Numbers have been rounded to 2 decimals, though further differences are observed with a larger number of decimal places.
Source: Sponsor’s pharmacoeconomic submission.1
Table 11: Sponsor's Breakdown of QALYs for Third-Line Therapy
Source of QALYs | Oral semaglutide | Oral semaglutide | Empagliflozin | Canagliflozin |
|---|---|---|---|---|
Baseline | 15.75 | 15.72 | 15.69 | 15.71 |
Diabetes Treatment | −0.79 | −0.83 | −0.89 | −0.83 |
Hypoglycemia | −0.37 | −0.39 | −0.42 | −0.40 |
Eye Disease | −0.26 | −0.26 | −0.27 | −0.26 |
Lower Extremity Disease | −0.93 | −0.93 | −0.93 | −0.93 |
Kidney Disease | −0.08 | −0.08 | −0.08 | −0.08 |
Ischemic Heart Disease | −0.17 | −0.17 | −0.17 | −0.17 |
Myocardial Infarction | −0.09 | −0.09 | −0.09 | −0.09 |
Stroke | −0.06 | −0.06 | −0.06 | −0.06 |
Heart Failure | −0.13 | −0.13 | −0.13 | −0.14 |
Age | −2.49 | −2.48 | −2.48 | −2.48 |
Gender | −0.70 | −0.69 | −0.69 | −0.69 |
Diabetes Duration | −0.50 | −0.50 | −0.50 | −0.50 |
Overweight | −0.74 | −0.77 | −0.76 | −0.76 |
Total QALYs | 8.46 | 8.34 | 8.23 | 8.34 |
Note: This is a sample of the comparators as 14 treatments were compared.
Source: Sponsor’s pharmacoeconomic submission.1
Appendix 4: Additional Details on the CADTH Reanalyses and Sensitivity Analyses of the Economic Evaluation
Note that this appendix has not been copy-edited.
Detailed Results of CADTH Exploratory Analyses
CADTH conducted an exploratory analysis to explore the impact that disutility from the model of treatment administration has on the sponsor’s results for second-line therapies. Disutility associated with the mode administration of injectable semaglutide and dulaglutide was set equal to the disutility with the administration of oral semaglutide (Table 12). Both doses of oral semaglutide were found to be dominated, when the assumed benefit associated with the mode of administration is removed for once weekly injectables versus oral. These results suggest that oral semaglutide is no longer more cost-effective than injectable semaglutide. However, CADTH acknowledges the limitations previously highlighted are still present in these revised results.
Table 12: Summary of the Exploratory Scenario Results for Second-Line Treatment
Drug | Total costs ($) | Total QALYs | Sequential ICER ($ per QALY) |
|---|---|---|---|
Sulfonylurea | 101,286 | 9.980 | – |
Canagliflozin 300 mg | 103,484 | 10.198 | 10,090 |
Semaglutide 1.0 mg | 107,618 | 10.414 | 19,165 |
Empagliflozin 25 mg | 103,473 | 10.172 | Extendedly dominated through sulfonylurea and canagliflozin 300 mg |
Linagliptin 5 mg | 103,545 | 10.078 | Dominated by empagliflozin 25 mg |
Sitagliptin 100 mg | 104,173 | 10.082 | Dominated by empagliflozin 25 mg |
Dapagliflozin 10 mg | 104,337 | 10.063 | Dominated by empagliflozin 25 mg |
Saxagliptin 5 mg | 104,587 | 9.973 | Dominated by sulfonylurea |
Lixisenatide 20 mcg | 105,467 | 9.901 | Dominated by sulfonylurea |
Oral semaglutide 7 mg | 107,670 | 10.180 | Dominated by canagliflozin 300 mg. |
Oral semaglutide 14 mg | 107,711 | 10.349 | Dominated by semaglutide 1.0 mg |
Dulaglutide 1.5 mg | 108,430 | 10.270 | Dominated by semaglutide 1.0 mg |
Liraglutide 1.8 mg | 111,821 | 10.088 | Dominated by empagliflozin 25 mg |
ICER = incremental cost-effectiveness ratio; QALY = quality-adjusted life-year.
Appendix 5: Submitted Business Impact Assessment and CADTH Appraisal
Note that this appendix has been formatted but not been copy-edited.
Table 13: Key Take-Aways of the Business Impact Analysis
Key take-aways of the business impact analysis |
|---|
|
Summary of Sponsor’s Business Impact Analysis
The sponsor submitted a claims-based budget impact assessment to estimate the number of patients expected to be eligible for oral semaglutide based upon historical drug-purchasing behaviour. The sponsor took a 3-year time horizon (2021 − 2024) using 2020 as a base year. The claims-based approach derived the number of active beneficiaries using IQVIA drug database over a 3-year time horizon based upon the number of claims filed for Ozempic (injectable semaglutide) from 2016 − 2020.20,21 The sponsor could not use Saskatchewan and the Nova Scotia Drug Formularies, because Ozempic was only recently listed in these provinces; the sponsor used the provinces Alberta, and New Brunswick as proxies. Population and data from the Non-Insured Health Benefits was also incorporated for the relevant patients.1 The percentage of market share of oral semaglutide was based on projections by the Institut national d’excellence en santé et en services sociaux for Quebec and on Novo Nordisk Canada Inc. internal estimates.1 Best-fit trends were applied on a product-by-product basis to project claims into the time horizon for each drug plan considered. The sponsor took a public payer perspective and excluded markup and dispensing fees. Key inputs to the BIA are documented in Table 14. The key driver of this analysis was found to be the market share of oral semaglutide and which drugs it absorbs market share from.
Table 14: Summary of Key Model Parameters
Parameter | Sponsor’s estimate (reported as year 1 / year 2 / year 3 if appropriate) |
|---|---|
Target population | |
Adults with type 2 diabetes mellitus as monotherapy when metformin is considered inappropriate due to intolerance or contraindications or in combination with other medicinal products. | The sponsor took a claims-based approach based on the number of patients currently taking injectable semaglutide. |
Number of claims for drug under review (excluding Quebec) |
|
Market Uptake (3 years) | |
Uptake (reference scenario) GLP-1s (pan-Cdn) DPP-4s (pan-Cdn) SGLT2s (pan-Cdn) SUs (pan-Cdn) |
|
Uptake (new drug scenario) Oral semaglutide GLP-1s (pan-Cdn) DPP-4s (pan-Cdn) SGLT − 2s (pan-Cdn) SUs (pan-Cdn) |
|
Cost of treatment (per patient) | |
Cost of treatment over 28-day cyclea Oral semaglutide Semaglutide (injectable) Lixisenatide Sitagliptin Saxagliptin Linagliptin Canagliflozin Dapagliflozin Empagliflozin SUs | $195.06 $198.76 $113.96 $93.68 $79.49 $75.10 $80.95 $74.94 $76.67 $5.21 |
GLP-1 = glucagon-like peptide 1; DPP-4 = dipeptidyl peptidase-4; SGLT2 = sodium-glucose cotransporter-2; SU = sulfonylurea
aOntario prices presented
Source: Sponsor’s pharmacoeconomic submission1
Summary of the Sponsor’s BIA Results
Results of the sponsor’s base case suggested an incremental cost of $3,355,258 in Year 1, $10,231,784 in Year 2, and $21,706,463 in Year 3, for a total incremental cost of $35,293,505 over the 3-year time horizon, when oral semaglutide is reimbursed as an adjunct to diet and exercise to improve glycemic control in adults with T2DM as monotherapy when metformin is considered inappropriate due to intolerance or contraindications or in combination with other medicinal products.
CADTH Appraisal of the Sponsor’s BIA
CADTH identified several areas of uncertainty to the sponsor’s analysis that have notable implications on the results of the BIA:
Market share assumptions were considered uncertain: Due to limited data, the sponsor made assumptions regarding the future market share of oral semaglutide, including assuming
|% market share would be taken from |, and |% will come from|||. Due to data limitations regarding the current market share of SLGT − 2 drugs in certain provinces, the sponsor made assumptions using data from other provinces as proxies. Since many market share assumptions in this model are based on the sponsor’s best estimates, the results are associated with substantial uncertainty.Market share assumptions may not hold in the future. Although market share assumptions made by the sponsor were deemed reasonable by clinical experts consulted by CADTH, these experts stated that market share may grow to become substantially greater in the near future pending the cardiovascular results of the SOUL trial set to release data in 2024.22
Target population did not align with the Health Canada indication. The proposed indication allows for treatment of adult patients with type 2 diabetes mellitus as monotherapy when metformin is considered inappropriate, or in combination with diabetes treatments beyond metformin and a SU. However, the sponsor’s budget impact considered oral semaglutide only in combination with metformin or metformin and sulfonylurea. If oral semaglutide is recommended for use in line with its Health Canada–approved indication, the estimated incremental budget impact for oral semaglutide may be higher than currently estimated.
CADTH Reanalyses of the Business Impact Analysis
Table 15: CADTH Revisions to the Submitted Budget Impact Analysis
Stepped analysis | Sponsor’s value or assumption | CADTH value or assumption |
|---|---|---|
Changes to derive the CADTH base case | ||
1. Inclusion of dispensing and markup fees | No dispensing and markup fees | Dispensing and markup fees included |
The results of the CADTH stepwise reanalysis are presented in summary format in Table 16.
Table 16: Summary of the CADTH Reanalyses of the BIA
Stepped analysis | Three-year total |
|---|---|
Submitted base case | $35,293,505 |
CADTH base case | $38,112,796 |
BIA = budget impact analysis.
CADTH conducted several scenario analyses to assess the impact of different market share assumptions regarding the uptake of oral semaglutide, and the treatments that oral semaglutide may displace in practice (Table 17). These analyses suggest that the budget impact is substantially impact by expected market uptake and the treatment(s) being displaced.
Table 17: Detailed Breakdown of the CADTH Reanalyses of the BIA
Stepped analysis | Scenario | Year 0 (current situation) | Year 1 | Year 2 | Year 3 | Three-year total |
|---|---|---|---|---|---|---|
Submitted base case | Reference | $746,043,133 | $878,666,639 | $991,274,266 | $1,089,045,143 | $2,958,986,047 |
New drug | $746,043,133 | $882,021,896 | $1,001,506,050 | $1,110,751,606 | $2,994,279,552 | |
Budget impact | $0 | $3,355,258 | $10,231,784 | $21,706,463 | $35,293,505 | |
CADTH base case | Reference | $906,114,982 | $1,059,339,353 | $1,189,437,848 | $1,302,394,972 | $3,551,172,172 |
New drug | $906,114,982 | $1,062,962,715 | $1,200,487,049 | $1,325,835,204 | $3,589,284,968 | |
Budget impact | $0 | $3,623,362 | $11,049,201 | $23,440,232 | $38,112,796 | |
CADTH scenario analysis: double market share of oral semaglutide | Reference | $906,114,982 | $1,059,339,353 | $1,189,437,848 | $1,302,394,972 | $3,551,172,172 |
New drug | $906,114,982 | $1,066,586,077 | $1,211,536,250 | $1,349,275,437 | $3,627,397,764 | |
Budget impact | $0 | $7,246,725 | $22,098,402 | $46,880,465 | $76,225,591 | |
CADTH scenario analysis: oral semaglutide absorbs market share strictly from GLP-1’s | Reference | $906,114,982 | $1,059,339,353 | $1,189,437,848 | $1,302,394,972 | $3,551,172,172 |
New drug | $906,114,9812 | $1,060,138,490 | $1,191,859,383 | $1,307,511,146 | $3,559,509,019 | |
Budget impact | $0 | $799,137 | $2,421,536 | $5,116,174 | $8,336,847 | |
CADTH scenario analysis: oral semaglutide absorbs market share strictly from SGLT − 2’s | Reference | $906,114,982 | $1,059,339,353 | $1,189,437,848 | $1,302,394,972 | $3,551,172,172 |
New drug | $906,114,982 | $1,068,180,593 | $1,216,411,900 | $1,359,683,316 | $3,644,275,808 | |
Budget impact | $0 | $8,841,240 | $26,974,052 | $57,288,344 | $93,103,636 |
BIA = budget impact analysis; GLP-1 = glucagon-like peptide 1 receptor agonists; DPP-4 = dipeptidyl peptidase-4; SGLT2 = sodium-glucose cotransporter-2; SU = sulfonylurea.
ISSN: 2563-6596
Disclaimer: The information in this document is intended to help Canadian health care decision-makers, health care professionals, health systems leaders, and policy-makers make well-informed decisions and thereby improve the quality of health care services. While patients and others may access this document, the document is made available for informational purposes only and no representations or warranties are made with respect to its fitness for any particular purpose. The information in this document should not be used as a substitute for professional medical advice or as a substitute for the application of clinical judgment in respect of the care of a particular patient or other professional judgment in any decision-making process. The Canadian Agency for Drugs and Technologies in Health (CADTH) does not endorse any information, drugs, therapies, treatments, products, processes, or services.
While care has been taken to ensure that the information prepared by CADTH in this document is accurate, complete, and up-to-date as at the applicable date the material was first published by CADTH, CADTH does not make any guarantees to that effect. CADTH does not guarantee and is not responsible for the quality, currency, propriety, accuracy, or reasonableness of any statements, information, or conclusions contained in any third-party materials used in preparing this document. The views and opinions of third parties published in this document do not necessarily state or reflect those of CADTH.
CADTH is not responsible for any errors, omissions, injury, loss, or damage arising from or relating to the use (or misuse) of any information, statements, or conclusions contained in or implied by the contents of this document or any of the source materials.
This document may contain links to third-party websites. CADTH does not have control over the content of such sites. Use of third-party sites is governed by the third-party website owners’ own terms and conditions set out for such sites. CADTH does not make any guarantee with respect to any information contained on such third-party sites and CADTH is not responsible for any injury, loss, or damage suffered as a result of using such third-party sites. CADTH has no responsibility for the collection, use, and disclosure of personal information by third-party sites.
Subject to the aforementioned limitations, the views expressed herein are those of CADTH and do not necessarily represent the views of Canada’s federal, provincial, or territorial governments or any third party supplier of information.
This document is prepared and intended for use in the context of the Canadian health care system. The use of this document outside of Canada is done so at the user’s own risk.
This disclaimer and any questions or matters of any nature arising from or relating to the content or use (or misuse) of this document will be governed by and interpreted in accordance with the laws of the Province of Ontario and the laws of Canada applicable therein, and all proceedings shall be subject to the exclusive jurisdiction of the courts of the Province of Ontario, Canada.
The copyright and other intellectual property rights in this document are owned by CADTH and its licensors. These rights are protected by the Canadian Copyright Act and other national and international laws and agreements. Users are permitted to make copies of this document for non-commercial purposes only, provided it is not modified when reproduced and appropriate credit is given to CADTH and its licensors.
About CADTH: CADTH is an independent, not-for-profit organization responsible for providing Canada’s health care decision-makers with objective evidence to help make informed decisions about the optimal use of drugs, medical devices, diagnostics, and procedures in our health care system.
Funding: CADTH receives funding from Canada’s federal, provincial, and territorial governments, with the exception of Quebec.